Franklin County, NE Map & Demographics
Franklin County Map
Franklin County Overview
$34,650
PER CAPITA INCOME
$73,000
AVG FAMILY INCOME
$55,625
AVG HOUSEHOLD INCOME
38.7%
WAGE / INCOME GAP [ % ]
61.3¢/ $1
WAGE / INCOME GAP [ $ ]
0.48
INEQUALITY / GINI INDEX
2,901
TOTAL POPULATION
1,456
MALE POPULATION
1,445
FEMALE POPULATION
100.76
MALES / 100 FEMALES
99.24
FEMALES / 100 MALES
49.8
MEDIAN AGE
2.8
AVG FAMILY SIZE
2.2
AVG HOUSEHOLD SIZE
1,414
LABOR FORCE [ PEOPLE ]
58.8%
PERCENT IN LABOR FORCE
2.5%
UNEMPLOYMENT RATE
Franklin County Area Codes
Income in Franklin County
Income Overview in Franklin County
Per Capita Income in Franklin County is $34,650, while median incomes of families and households are $73,000 and $55,625 respectively.
| Characteristic | Number | Measure |
| Per Capita Income | 2,901 | $34,650 |
| Median Family Income | 810 | $73,000 |
| Mean Family Income | 810 | $98,812 |
| Median Household Income | 1,255 | $55,625 |
| Mean Household Income | 1,255 | $79,497 |
| Income Deficit | 810 | $0 |
| Wage / Income Gap (%) | 2,901 | 38.74% |
| Wage / Income Gap ($) | 2,901 | 61.26¢ per $1 |
| Gini / Inequality Index | 2,901 | 0.48 |
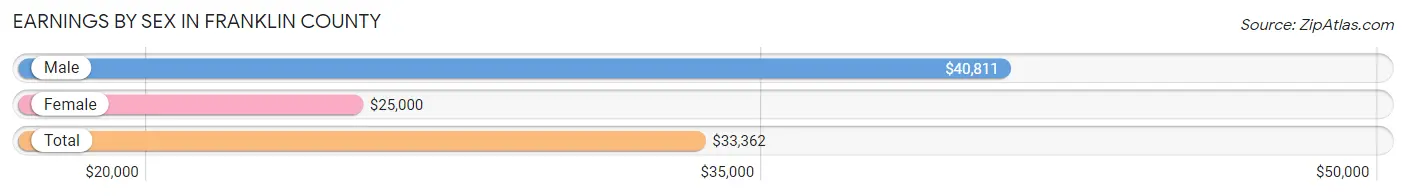
Earnings by Sex in Franklin County
Average Earnings in Franklin County are $33,362, $40,811 for men and $25,000 for women, a difference of 38.7%.
| Sex | Number | Average Earnings |
| Male | 822 (52.5%) | $40,811 |
| Female | 744 (47.5%) | $25,000 |
| Total | 1,566 (100.0%) | $33,362 |
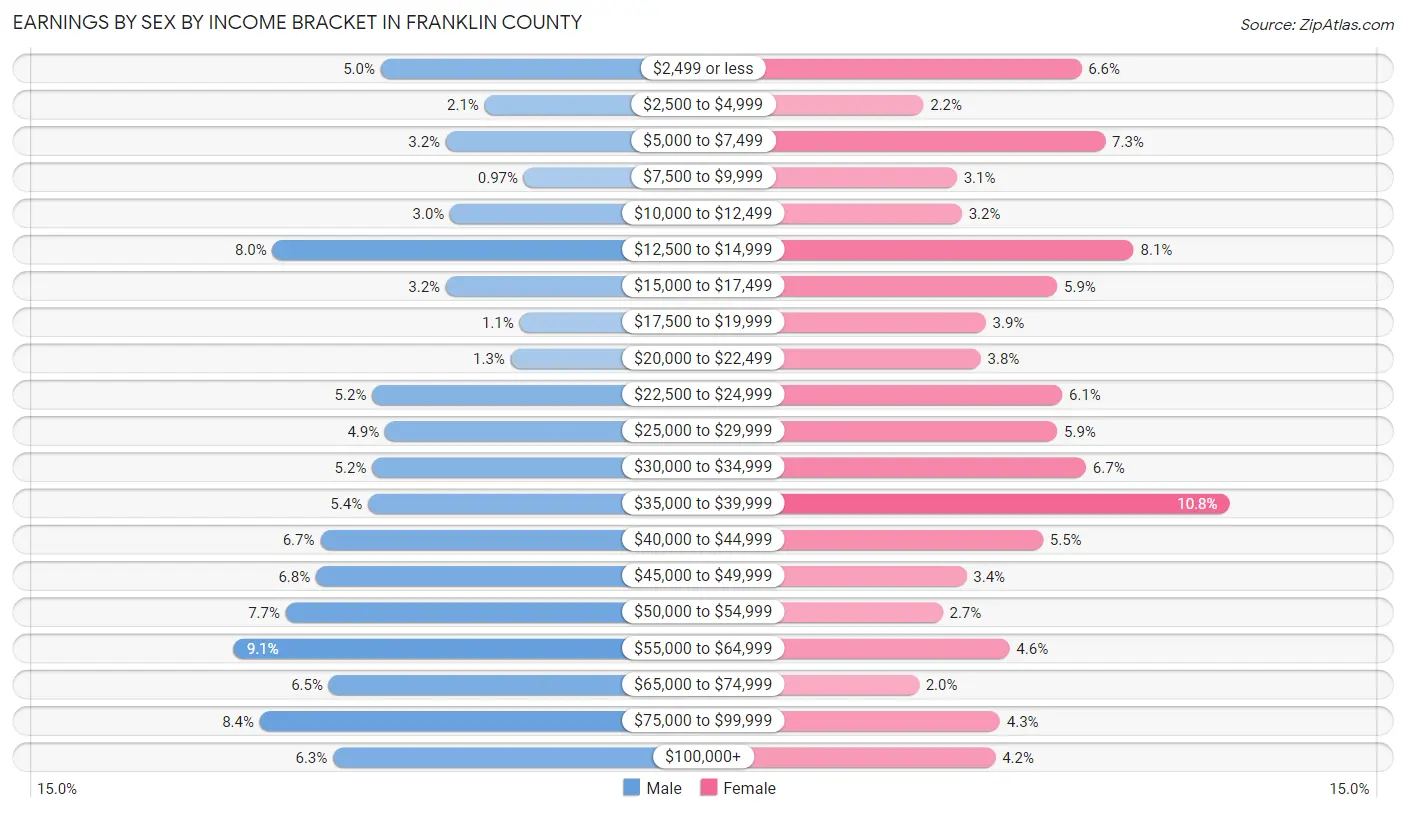
Earnings by Sex by Income Bracket in Franklin County
The most common earnings brackets in Franklin County are $55,000 to $64,999 for men (75 | 9.1%) and $35,000 to $39,999 for women (80 | 10.7%).
| Income | Male | Female |
| $2,499 or less | 41 (5.0%) | 49 (6.6%) |
| $2,500 to $4,999 | 17 (2.1%) | 16 (2.1%) |
| $5,000 to $7,499 | 26 (3.2%) | 54 (7.3%) |
| $7,500 to $9,999 | 8 (1.0%) | 23 (3.1%) |
| $10,000 to $12,499 | 25 (3.0%) | 24 (3.2%) |
| $12,500 to $14,999 | 66 (8.0%) | 60 (8.1%) |
| $15,000 to $17,499 | 26 (3.2%) | 44 (5.9%) |
| $17,500 to $19,999 | 9 (1.1%) | 29 (3.9%) |
| $20,000 to $22,499 | 11 (1.3%) | 28 (3.8%) |
| $22,500 to $24,999 | 43 (5.2%) | 45 (6.0%) |
| $25,000 to $29,999 | 40 (4.9%) | 44 (5.9%) |
| $30,000 to $34,999 | 43 (5.2%) | 50 (6.7%) |
| $35,000 to $39,999 | 44 (5.3%) | 80 (10.7%) |
| $40,000 to $44,999 | 55 (6.7%) | 41 (5.5%) |
| $45,000 to $49,999 | 56 (6.8%) | 25 (3.4%) |
| $50,000 to $54,999 | 63 (7.7%) | 20 (2.7%) |
| $55,000 to $64,999 | 75 (9.1%) | 34 (4.6%) |
| $65,000 to $74,999 | 53 (6.5%) | 15 (2.0%) |
| $75,000 to $99,999 | 69 (8.4%) | 32 (4.3%) |
| $100,000+ | 52 (6.3%) | 31 (4.2%) |
| Total | 822 (100.0%) | 744 (100.0%) |
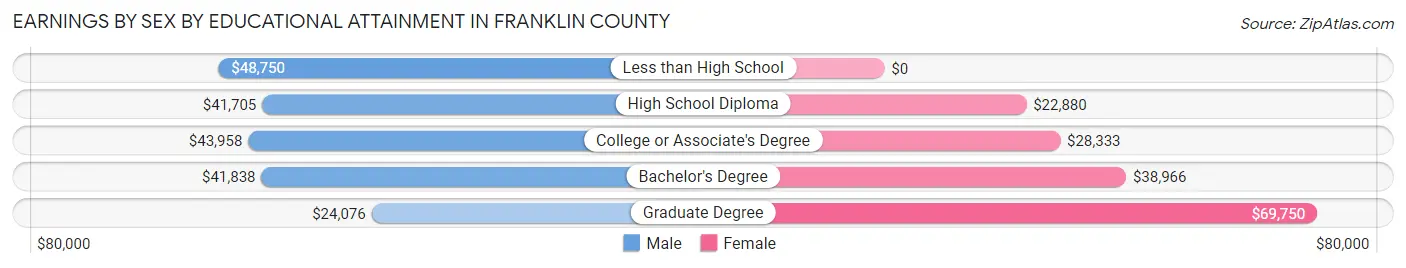
Earnings by Sex by Educational Attainment in Franklin County
Average earnings in Franklin County are $41,926 for men and $30,481 for women, a difference of 27.3%. Men with an educational attainment of less than high school enjoy the highest average annual earnings of $48,750, while those with graduate degree education earn the least with $24,076. Women with an educational attainment of graduate degree earn the most with the average annual earnings of $69,750, while those with high school diploma education have the smallest earnings of $22,880.
| Educational Attainment | Male Income | Female Income |
| Less than High School | $48,750 | $0 |
| High School Diploma | $41,705 | $22,880 |
| College or Associate's Degree | $43,958 | $28,333 |
| Bachelor's Degree | $41,838 | $38,966 |
| Graduate Degree | $24,076 | $69,750 |
| Total | $41,926 | $30,481 |
Family Income in Franklin County
Family Income Brackets in Franklin County
According to the Franklin County family income data, there are 188 families falling into the $50,000 to $74,999 income range, which is the most common income bracket and makes up 23.2% of all families. Conversely, the $15,000 to $24,999 income bracket is the least frequent group with only 17 families (2.1%) belonging to this category.
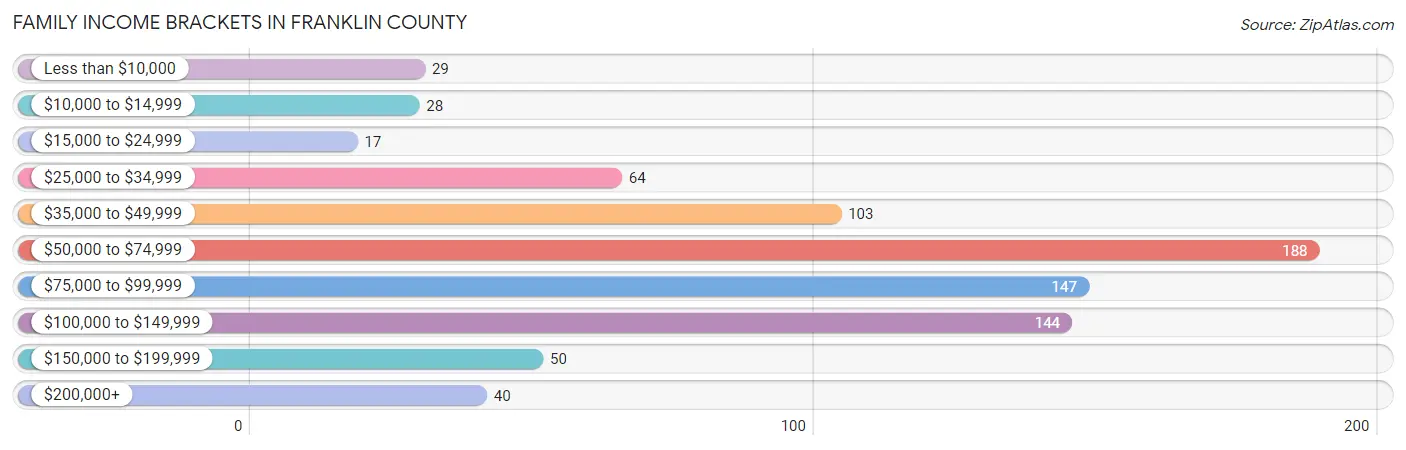
| Income Bracket | # Families | % Families |
| Less than $10,000 | 29 | 3.6% |
| $10,000 to $14,999 | 28 | 3.5% |
| $15,000 to $24,999 | 17 | 2.1% |
| $25,000 to $34,999 | 64 | 7.9% |
| $35,000 to $49,999 | 103 | 12.7% |
| $50,000 to $74,999 | 188 | 23.2% |
| $75,000 to $99,999 | 147 | 18.1% |
| $100,000 to $149,999 | 144 | 17.8% |
| $150,000 to $199,999 | 50 | 6.2% |
| $200,000+ | 40 | 4.9% |
Family Income by Famaliy Size in Franklin County
3-person families (118 | 14.6%) account for the highest median family income in Franklin County with $86,705 per family, while 2-person families (522 | 64.4%) have the highest median income of $31,212 per family member.
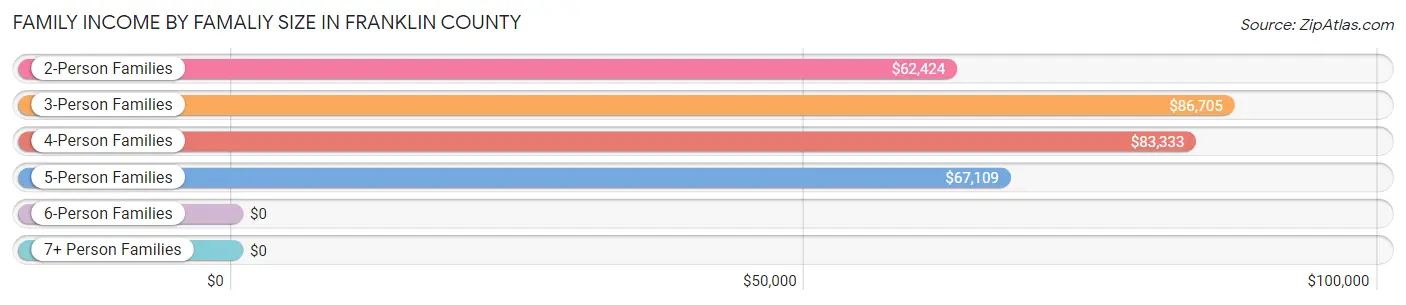
| Income Bracket | # Families | Median Income |
| 2-Person Families | 522 (64.4%) | $62,424 |
| 3-Person Families | 118 (14.6%) | $86,705 |
| 4-Person Families | 82 (10.1%) | $83,333 |
| 5-Person Families | 67 (8.3%) | $67,109 |
| 6-Person Families | 16 (2.0%) | $0 |
| 7+ Person Families | 5 (0.6%) | $0 |
| Total | 810 (100.0%) | $73,000 |
Family Income by Number of Earners in Franklin County
The median family income in Franklin County is $73,000, with families comprising 3+ earners (88) having the highest median family income of $107,000, while families with no earners (160) have the lowest median family income of $48,452, accounting for 10.9% and 19.8% of families, respectively.
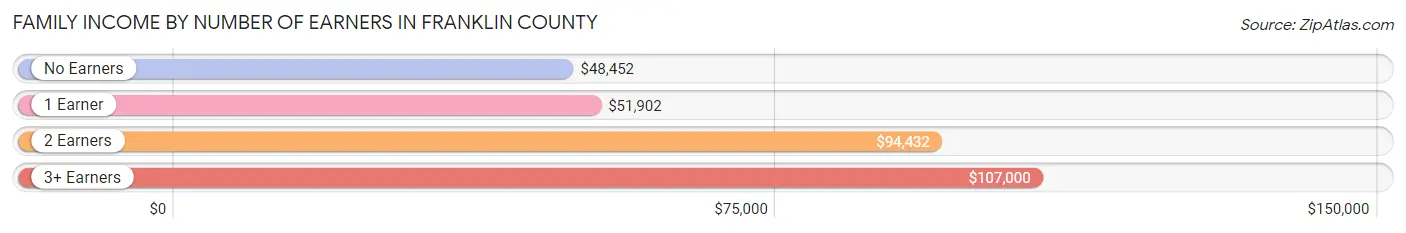
| Number of Earners | # Families | Median Income |
| No Earners | 160 (19.8%) | $48,452 |
| 1 Earner | 253 (31.2%) | $51,902 |
| 2 Earners | 309 (38.2%) | $94,432 |
| 3+ Earners | 88 (10.9%) | $107,000 |
| Total | 810 (100.0%) | $73,000 |
Household Income in Franklin County
Household Income Brackets in Franklin County
With 274 households falling in the category, the $50,000 to $74,999 income range is the most frequent in Franklin County, accounting for 21.8% of all households. In contrast, only 41 households (3.3%) fall into the $200,000+ income bracket, making it the least populous group.
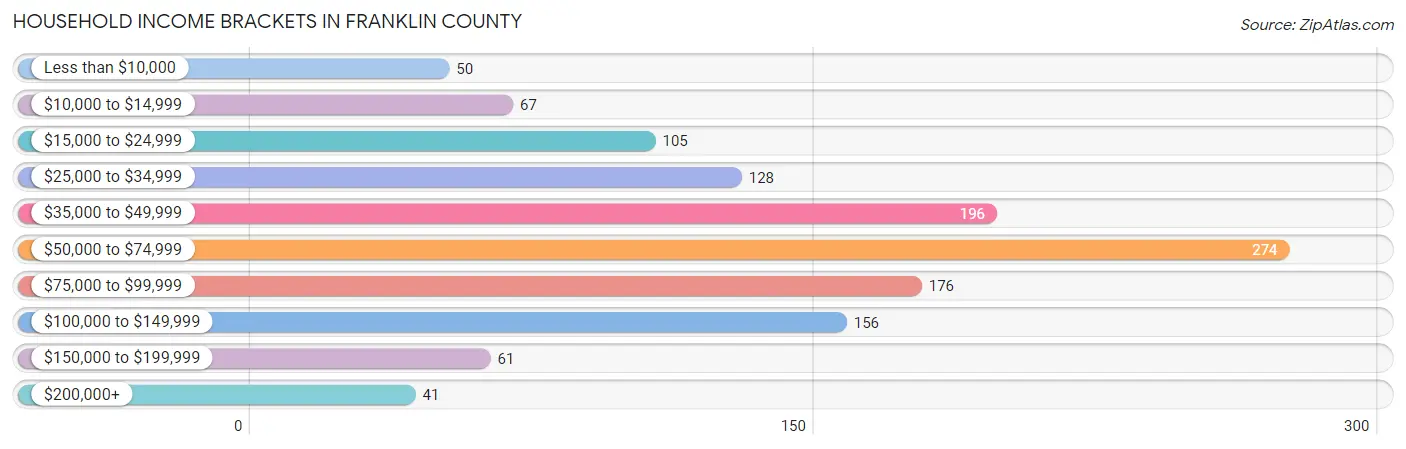
| Income Bracket | # Households | % Households |
| Less than $10,000 | 50 | 4.0% |
| $10,000 to $14,999 | 67 | 5.3% |
| $15,000 to $24,999 | 105 | 8.4% |
| $25,000 to $34,999 | 128 | 10.2% |
| $35,000 to $49,999 | 196 | 15.6% |
| $50,000 to $74,999 | 274 | 21.8% |
| $75,000 to $99,999 | 176 | 14.0% |
| $100,000 to $149,999 | 156 | 12.4% |
| $150,000 to $199,999 | 61 | 4.9% |
| $200,000+ | 41 | 3.3% |
Household Income by Householder Age in Franklin County
The median household income in Franklin County is $55,625, with the highest median household income of $76,563 found in the 45 to 64 years age bracket for the primary householder. A total of 433 households (34.5%) fall into this category. Meanwhile, the 15 to 24 years age bracket for the primary householder has the lowest median household income of $48,194, with 51 households (4.1%) in this group.
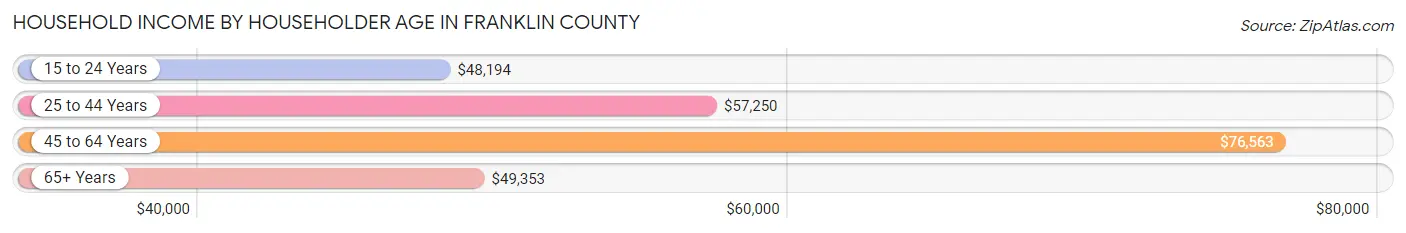
| Income Bracket | # Households | Median Income |
| 15 to 24 Years | 51 (4.1%) | $48,194 |
| 25 to 44 Years | 294 (23.4%) | $57,250 |
| 45 to 64 Years | 433 (34.5%) | $76,563 |
| 65+ Years | 477 (38.0%) | $49,353 |
| Total | 1,255 (100.0%) | $55,625 |
Poverty in Franklin County
Income Below Poverty by Sex and Age in Franklin County
With 14.4% poverty level for males and 15.4% for females among the residents of Franklin County, 15 year old males and under 5 year old females are the most vulnerable to poverty, with 9 males (56.2%) and 34 females (47.2%) in their respective age groups living below the poverty level.
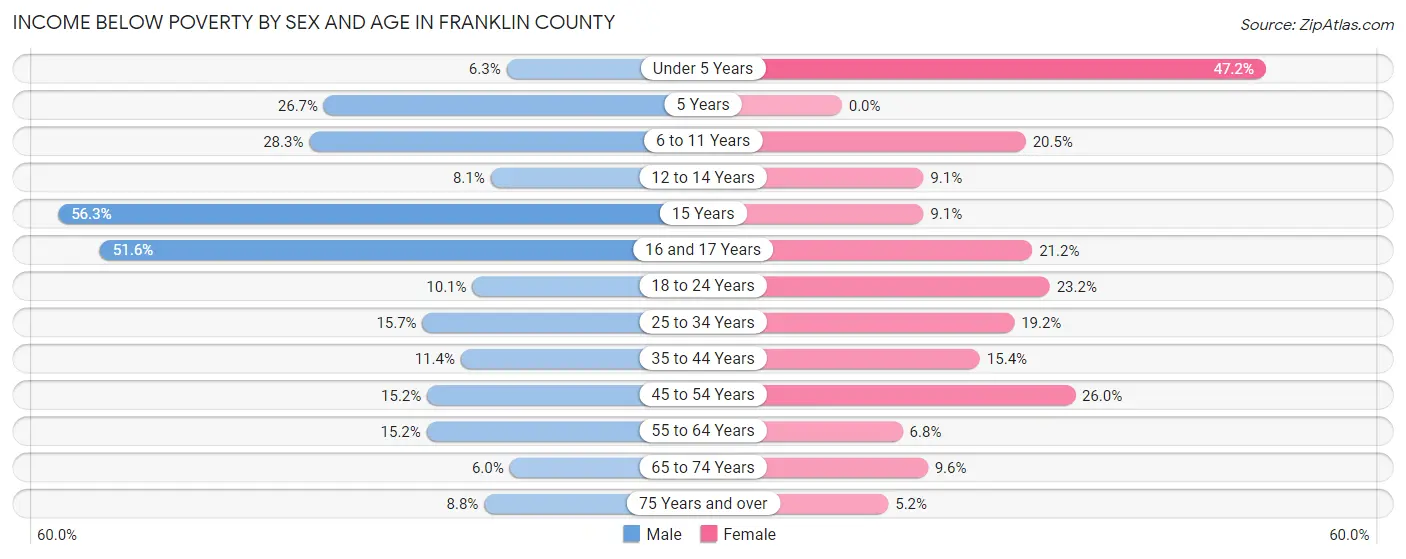
| Age Bracket | Male | Female |
| Under 5 Years | 5 (6.3%) | 34 (47.2%) |
| 5 Years | 8 (26.7%) | 0 (0.0%) |
| 6 to 11 Years | 30 (28.3%) | 17 (20.5%) |
| 12 to 14 Years | 3 (8.1%) | 3 (9.1%) |
| 15 Years | 9 (56.2%) | 1 (9.1%) |
| 16 and 17 Years | 16 (51.6%) | 7 (21.2%) |
| 18 to 24 Years | 8 (10.1%) | 22 (23.2%) |
| 25 to 34 Years | 24 (15.7%) | 24 (19.2%) |
| 35 to 44 Years | 16 (11.4%) | 24 (15.4%) |
| 45 to 54 Years | 22 (15.2%) | 40 (26.0%) |
| 55 to 64 Years | 37 (15.2%) | 16 (6.8%) |
| 65 to 74 Years | 13 (6.0%) | 20 (9.6%) |
| 75 Years and over | 12 (8.8%) | 10 (5.2%) |
| Total | 203 (14.4%) | 218 (15.4%) |
Income Above Poverty by Sex and Age in Franklin County
According to the poverty statistics in Franklin County, males aged 65 to 74 years and females aged 5 years are the age groups that are most secure financially, with 94.0% of males and 100.0% of females in these age groups living above the poverty line.
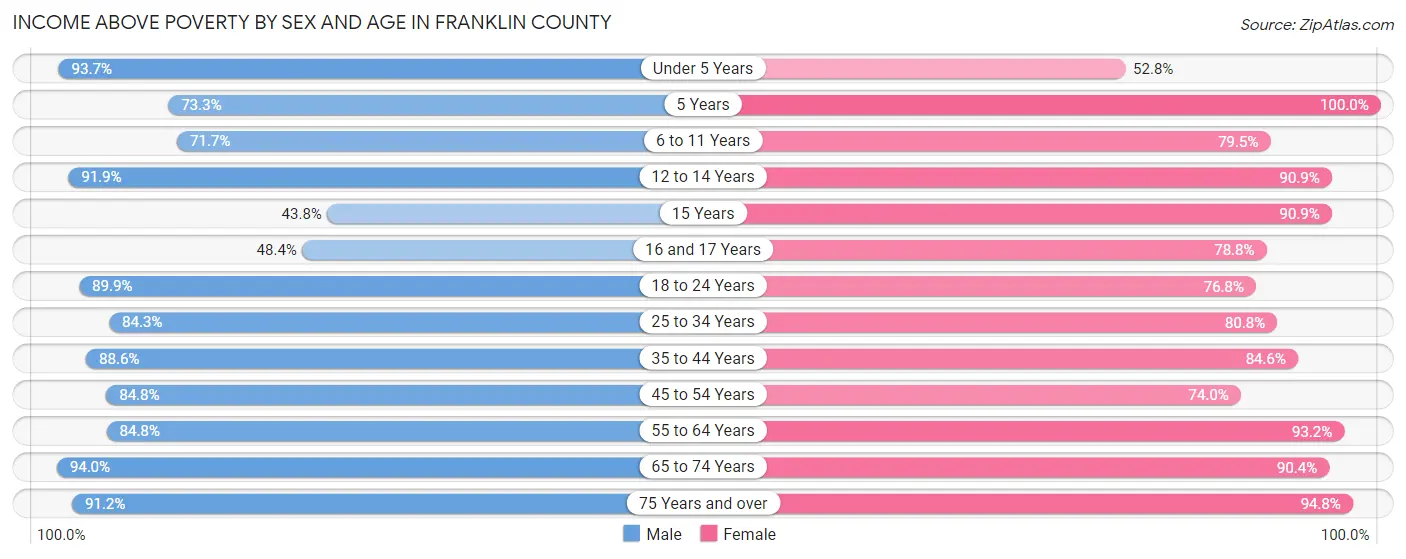
| Age Bracket | Male | Female |
| Under 5 Years | 74 (93.7%) | 38 (52.8%) |
| 5 Years | 22 (73.3%) | 13 (100.0%) |
| 6 to 11 Years | 76 (71.7%) | 66 (79.5%) |
| 12 to 14 Years | 34 (91.9%) | 30 (90.9%) |
| 15 Years | 7 (43.8%) | 10 (90.9%) |
| 16 and 17 Years | 15 (48.4%) | 26 (78.8%) |
| 18 to 24 Years | 71 (89.9%) | 73 (76.8%) |
| 25 to 34 Years | 129 (84.3%) | 101 (80.8%) |
| 35 to 44 Years | 124 (88.6%) | 132 (84.6%) |
| 45 to 54 Years | 123 (84.8%) | 114 (74.0%) |
| 55 to 64 Years | 206 (84.8%) | 220 (93.2%) |
| 65 to 74 Years | 204 (94.0%) | 189 (90.4%) |
| 75 Years and over | 124 (91.2%) | 183 (94.8%) |
| Total | 1,209 (85.6%) | 1,195 (84.6%) |
Income Below Poverty Among Married-Couple Families in Franklin County
The poverty statistics for married-couple families in Franklin County show that 7.6% or 53 of the total 697 families live below the poverty line. Families with 3 or 4 children have the highest poverty rate of 32.7%, comprising of 17 families. On the other hand, families with no children have the lowest poverty rate of 5.3%, which includes 27 families.
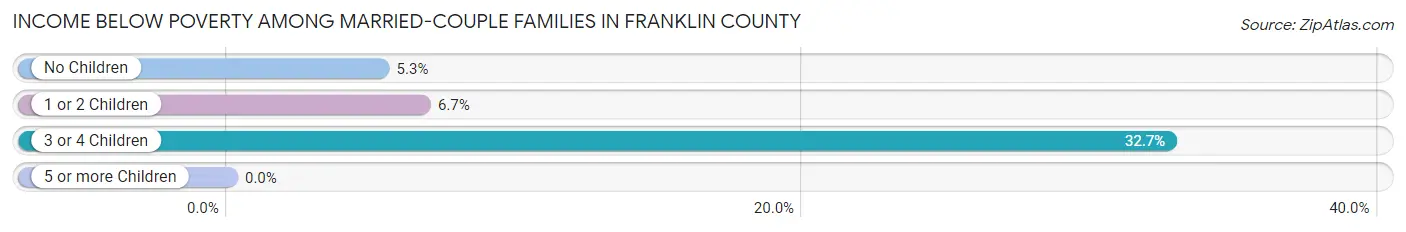
| Children | Above Poverty | Below Poverty |
| No Children | 484 (94.7%) | 27 (5.3%) |
| 1 or 2 Children | 125 (93.3%) | 9 (6.7%) |
| 3 or 4 Children | 35 (67.3%) | 17 (32.7%) |
| 5 or more Children | 0 (0.0%) | 0 (0.0%) |
| Total | 644 (92.4%) | 53 (7.6%) |
Income Below Poverty Among Single-Parent Households in Franklin County
According to the poverty data in Franklin County, 18.9% or 10 single-father households and 30.0% or 18 single-mother households are living below the poverty line. Among single-father households, those with 1 or 2 children have the highest poverty rate, with 10 households (47.6%) experiencing poverty. Likewise, among single-mother households, those with 3 or 4 children have the highest poverty rate, with 10 households (100.0%) falling below the poverty line.
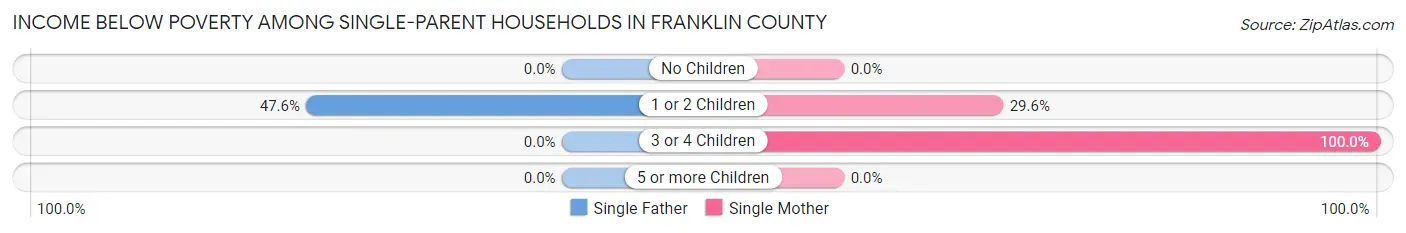
| Children | Single Father | Single Mother |
| No Children | 0 (0.0%) | 0 (0.0%) |
| 1 or 2 Children | 10 (47.6%) | 8 (29.6%) |
| 3 or 4 Children | 0 (0.0%) | 10 (100.0%) |
| 5 or more Children | 0 (0.0%) | 0 (0.0%) |
| Total | 10 (18.9%) | 18 (30.0%) |
Income Below Poverty Among Married-Couple vs Single-Parent Households in Franklin County
The poverty data for Franklin County shows that 53 of the married-couple family households (7.6%) and 28 of the single-parent households (24.8%) are living below the poverty level. Within the married-couple family households, those with 3 or 4 children have the highest poverty rate, with 17 households (32.7%) falling below the poverty line. Among the single-parent households, those with 3 or 4 children have the highest poverty rate, with 10 household (76.9%) living below poverty.
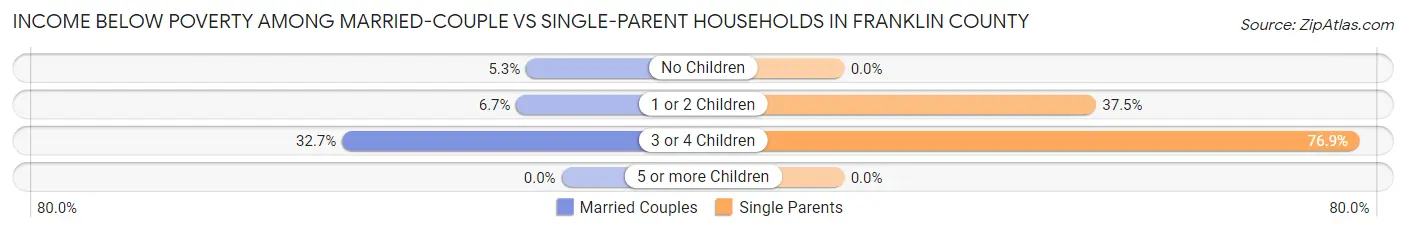
| Children | Married-Couple Families | Single-Parent Households |
| No Children | 27 (5.3%) | 0 (0.0%) |
| 1 or 2 Children | 9 (6.7%) | 18 (37.5%) |
| 3 or 4 Children | 17 (32.7%) | 10 (76.9%) |
| 5 or more Children | 0 (0.0%) | 0 (0.0%) |
| Total | 53 (7.6%) | 28 (24.8%) |
Race in Franklin County
The most populous races in Franklin County are White / Caucasian (2,761 | 95.2%), Hispanic or Latino (82 | 2.8%), and Two or more Races (71 | 2.5%).
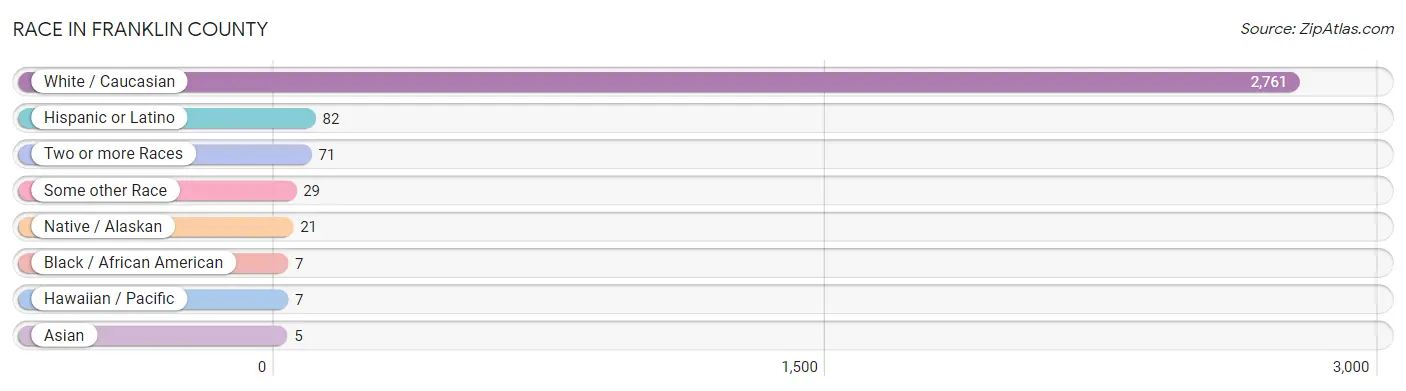
| Race | # Population | % Population |
| Asian | 5 | 0.2% |
| Black / African American | 7 | 0.2% |
| Hawaiian / Pacific | 7 | 0.2% |
| Hispanic or Latino | 82 | 2.8% |
| Native / Alaskan | 21 | 0.7% |
| White / Caucasian | 2,761 | 95.2% |
| Two or more Races | 71 | 2.5% |
| Some other Race | 29 | 1.0% |
| Total | 2,901 | 100.0% |
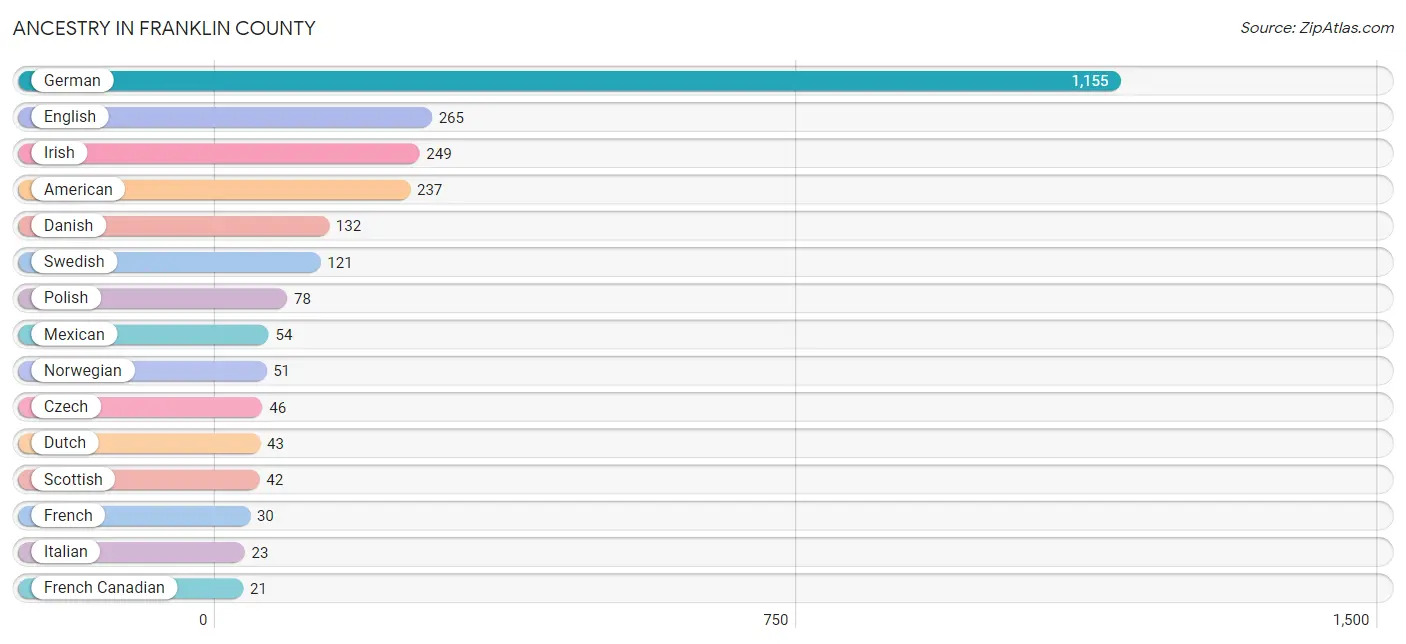
Ancestry in Franklin County
The most populous ancestries reported in Franklin County are German (1,155 | 39.8%), English (265 | 9.1%), Irish (249 | 8.6%), American (237 | 8.2%), and Danish (132 | 4.5%), together accounting for 70.2% of all Franklin County residents.
| Ancestry | # Population | % Population |
| American | 237 | 8.2% |
| Apache | 2 | 0.1% |
| Austrian | 7 | 0.2% |
| Belizean | 1 | 0.0% |
| Blackfeet | 2 | 0.1% |
| British | 8 | 0.3% |
| Burmese | 1 | 0.0% |
| Canadian | 1 | 0.0% |
| Central American Indian | 6 | 0.2% |
| Cherokee | 2 | 0.1% |
| Choctaw | 1 | 0.0% |
| Czech | 46 | 1.6% |
| Czechoslovakian | 3 | 0.1% |
| Danish | 132 | 4.5% |
| Dominican | 1 | 0.0% |
| Dutch | 43 | 1.5% |
| Eastern European | 2 | 0.1% |
| English | 265 | 9.1% |
| European | 18 | 0.6% |
| French | 30 | 1.0% |
| French Canadian | 21 | 0.7% |
| German | 1,155 | 39.8% |
| Greek | 3 | 0.1% |
| Hungarian | 2 | 0.1% |
| Irish | 249 | 8.6% |
| Italian | 23 | 0.8% |
| Latvian | 3 | 0.1% |
| Mexican | 54 | 1.9% |
| Norwegian | 51 | 1.8% |
| Pakistani | 7 | 0.2% |
| Pennsylvania German | 5 | 0.2% |
| Polish | 78 | 2.7% |
| Puerto Rican | 19 | 0.6% |
| Russian | 7 | 0.2% |
| Scandinavian | 21 | 0.7% |
| Scotch-Irish | 12 | 0.4% |
| Scottish | 42 | 1.5% |
| Slovak | 3 | 0.1% |
| Spaniard | 3 | 0.1% |
| Sri Lankan | 2 | 0.1% |
| Swedish | 121 | 4.2% |
| Swiss | 14 | 0.5% |
| Thai | 6 | 0.2% |
| Ukrainian | 2 | 0.1% |
| Welsh | 15 | 0.5% | View All 45 Rows |
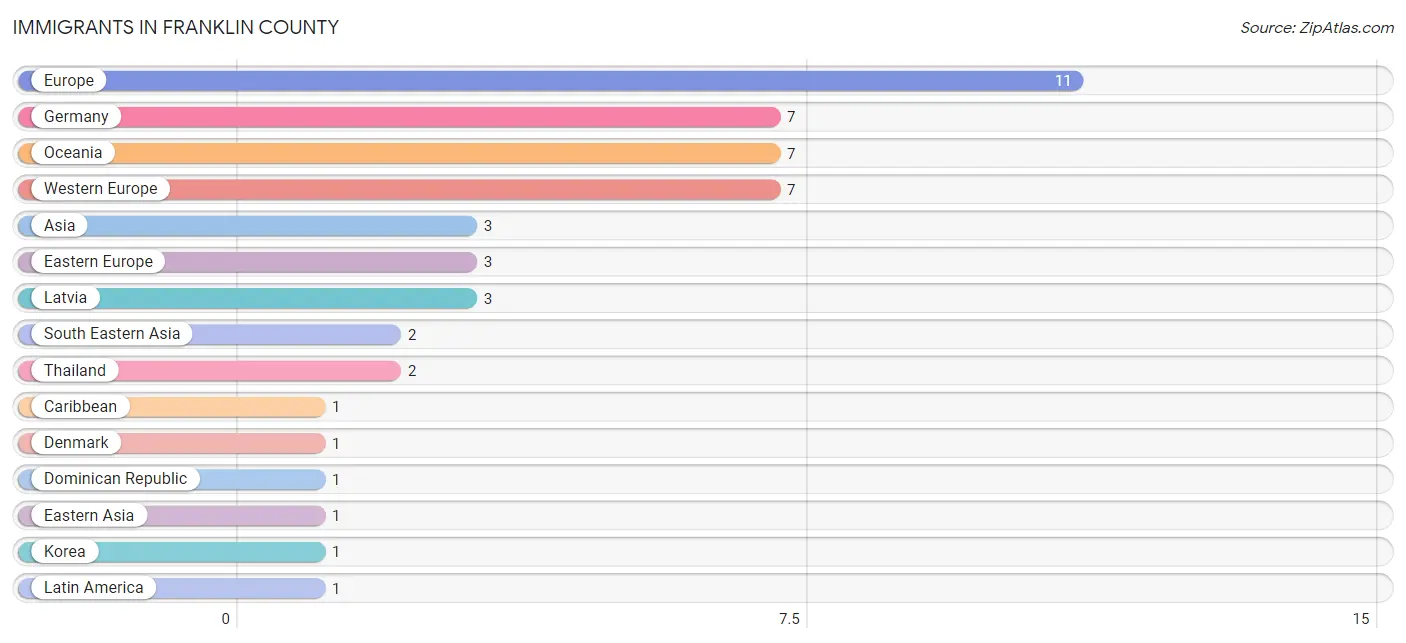
Immigrants in Franklin County
The most numerous immigrant groups reported in Franklin County came from Europe (11 | 0.4%), Germany (7 | 0.2%), Oceania (7 | 0.2%), Western Europe (7 | 0.2%), and Asia (3 | 0.1%), together accounting for 1.2% of all Franklin County residents.
| Immigration Origin | # Population | % Population |
| Asia | 3 | 0.1% |
| Caribbean | 1 | 0.0% |
| Denmark | 1 | 0.0% |
| Dominican Republic | 1 | 0.0% |
| Eastern Asia | 1 | 0.0% |
| Eastern Europe | 3 | 0.1% |
| Europe | 11 | 0.4% |
| Germany | 7 | 0.2% |
| Korea | 1 | 0.0% |
| Latin America | 1 | 0.0% |
| Latvia | 3 | 0.1% |
| Northern Europe | 1 | 0.0% |
| Oceania | 7 | 0.2% |
| South Eastern Asia | 2 | 0.1% |
| Thailand | 2 | 0.1% |
| Western Europe | 7 | 0.2% | View All 16 Rows |
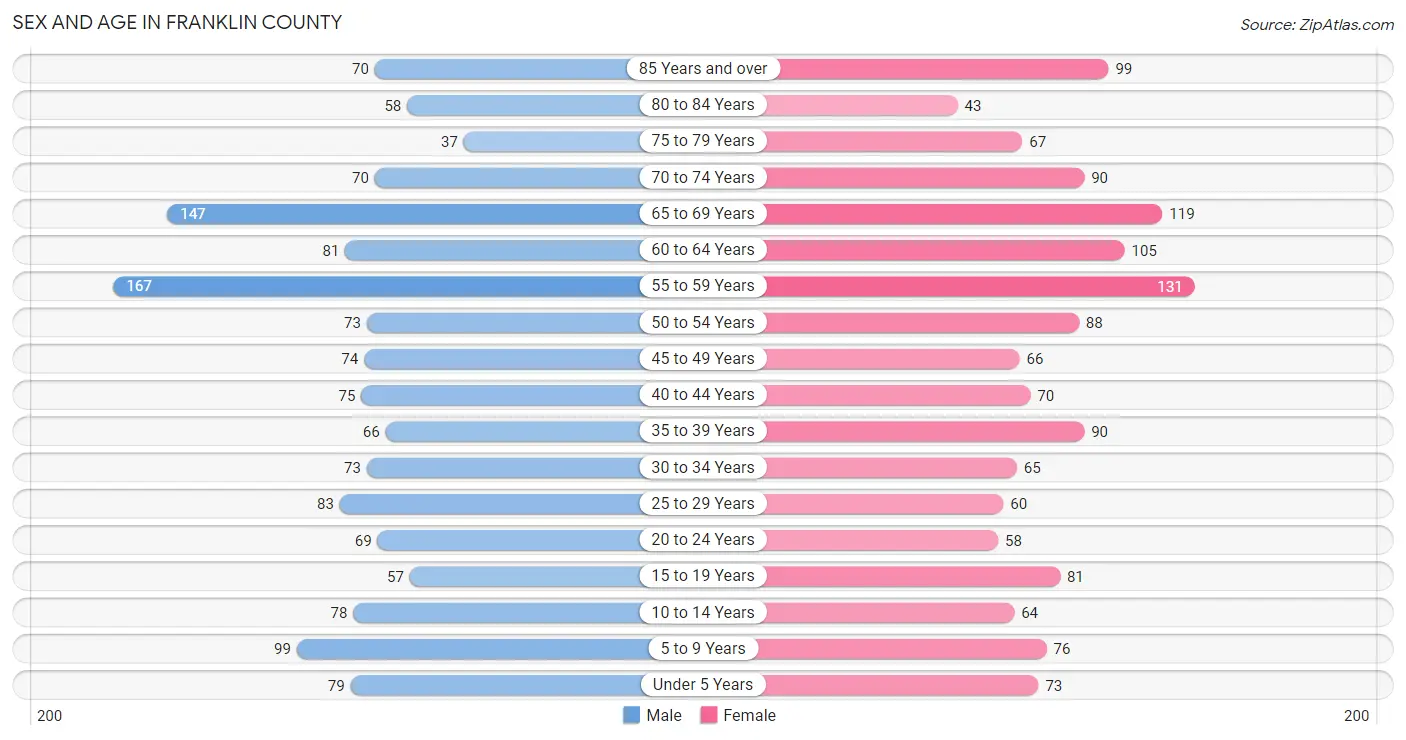
Sex and Age in Franklin County
Sex and Age in Franklin County
The most populous age groups in Franklin County are 55 to 59 Years (167 | 11.5%) for men and 55 to 59 Years (131 | 9.1%) for women.
| Age Bracket | Male | Female |
| Under 5 Years | 79 (5.4%) | 73 (5.1%) |
| 5 to 9 Years | 99 (6.8%) | 76 (5.3%) |
| 10 to 14 Years | 78 (5.4%) | 64 (4.4%) |
| 15 to 19 Years | 57 (3.9%) | 81 (5.6%) |
| 20 to 24 Years | 69 (4.7%) | 58 (4.0%) |
| 25 to 29 Years | 83 (5.7%) | 60 (4.2%) |
| 30 to 34 Years | 73 (5.0%) | 65 (4.5%) |
| 35 to 39 Years | 66 (4.5%) | 90 (6.2%) |
| 40 to 44 Years | 75 (5.1%) | 70 (4.8%) |
| 45 to 49 Years | 74 (5.1%) | 66 (4.6%) |
| 50 to 54 Years | 73 (5.0%) | 88 (6.1%) |
| 55 to 59 Years | 167 (11.5%) | 131 (9.1%) |
| 60 to 64 Years | 81 (5.6%) | 105 (7.3%) |
| 65 to 69 Years | 147 (10.1%) | 119 (8.2%) |
| 70 to 74 Years | 70 (4.8%) | 90 (6.2%) |
| 75 to 79 Years | 37 (2.5%) | 67 (4.6%) |
| 80 to 84 Years | 58 (4.0%) | 43 (3.0%) |
| 85 Years and over | 70 (4.8%) | 99 (6.9%) |
| Total | 1,456 (100.0%) | 1,445 (100.0%) |
Families and Households in Franklin County
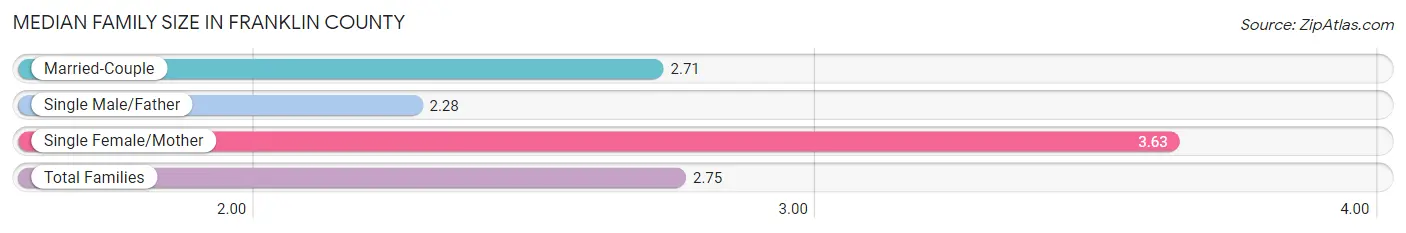
Median Family Size in Franklin County
The median family size in Franklin County is 2.75 persons per family, with single female/mother families (60 | 7.4%) accounting for the largest median family size of 3.63 persons per family. On the other hand, single male/father families (53 | 6.5%) represent the smallest median family size with 2.28 persons per family.
| Family Type | # Families | Family Size |
| Married-Couple | 697 (86.1%) | 2.71 |
| Single Male/Father | 53 (6.5%) | 2.28 |
| Single Female/Mother | 60 (7.4%) | 3.63 |
| Total Families | 810 (100.0%) | 2.75 |
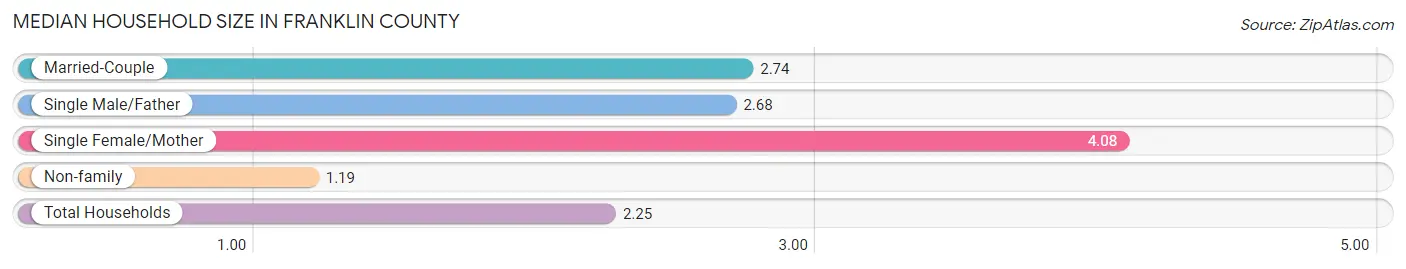
Median Household Size in Franklin County
The median household size in Franklin County is 2.25 persons per household, with single female/mother households (60 | 4.8%) accounting for the largest median household size of 4.08 persons per household. non-family households (445 | 35.5%) represent the smallest median household size with 1.19 persons per household.
| Household Type | # Households | Household Size |
| Married-Couple | 697 (55.5%) | 2.74 |
| Single Male/Father | 53 (4.2%) | 2.68 |
| Single Female/Mother | 60 (4.8%) | 4.08 |
| Non-family | 445 (35.5%) | 1.19 |
| Total Households | 1,255 (100.0%) | 2.25 |
Household Size by Marriage Status in Franklin County
Out of a total of 1,255 households in Franklin County, 810 (64.5%) are family households, while 445 (35.5%) are nonfamily households. The most numerous type of family households are 2-person households, comprising 495, and the most common type of nonfamily households are 1-person households, comprising 338.
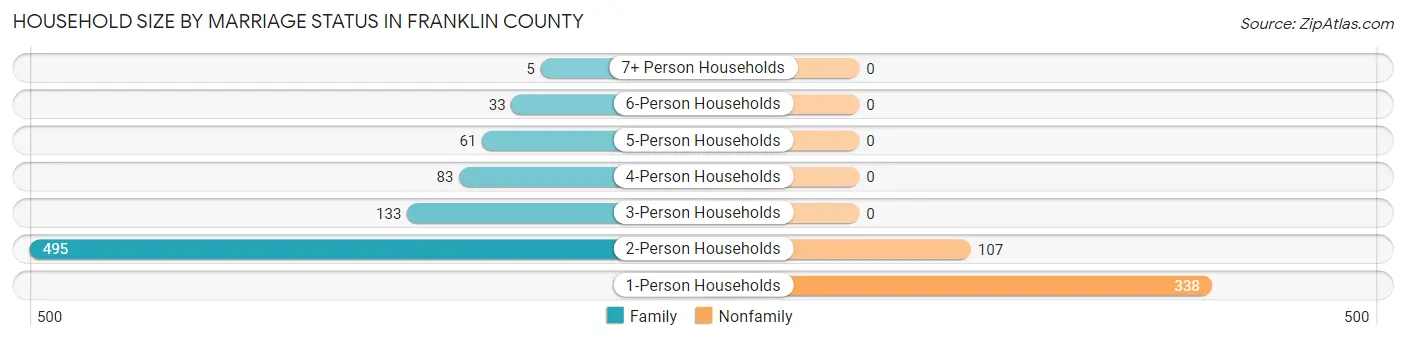
| Household Size | Family Households | Nonfamily Households |
| 1-Person Households | - | 338 (26.9%) |
| 2-Person Households | 495 (39.4%) | 107 (8.5%) |
| 3-Person Households | 133 (10.6%) | 0 (0.0%) |
| 4-Person Households | 83 (6.6%) | 0 (0.0%) |
| 5-Person Households | 61 (4.9%) | 0 (0.0%) |
| 6-Person Households | 33 (2.6%) | 0 (0.0%) |
| 7+ Person Households | 5 (0.4%) | 0 (0.0%) |
| Total | 810 (64.5%) | 445 (35.5%) |
Female Fertility in Franklin County
Fertility by Age in Franklin County
Average fertility rate in Franklin County is 22.0 births per 1,000 women. Women in the age bracket of 20 to 34 years have the highest fertility rate with 27.0 births per 1,000 women. Women in the age bracket of 35 to 50 years acount for 54.5% of all women with births.
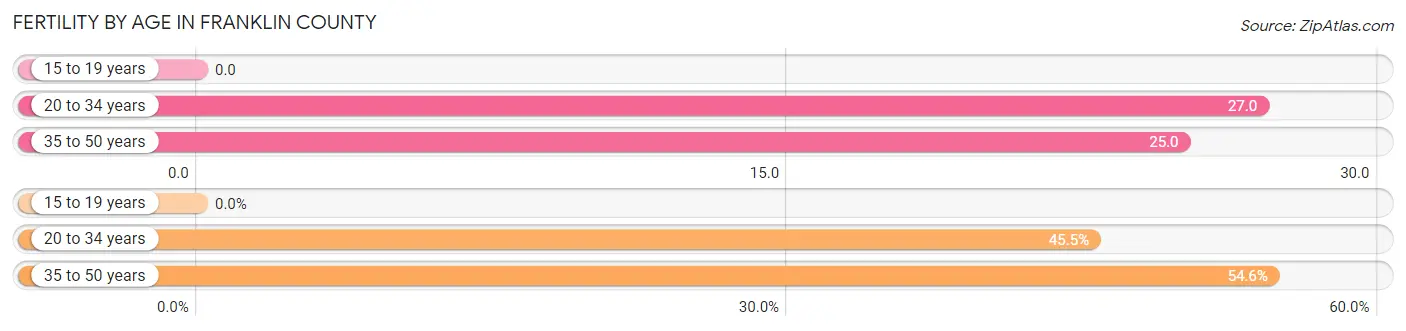
| Age Bracket | Women with Births | Births / 1,000 Women |
| 15 to 19 years | 0 (0.0%) | 0.0 |
| 20 to 34 years | 5 (45.5%) | 27.0 |
| 35 to 50 years | 6 (54.5%) | 25.0 |
| Total | 11 (100.0%) | 22.0 |
Fertility by Age by Marriage Status in Franklin County
81.8% of women with births (11) in Franklin County are married. The highest percentage of unmarried women with births falls into 35 to 50 years age bracket with 33.3% of them unmarried at the time of birth, while the lowest percentage of unmarried women with births belong to 20 to 34 years age bracket with 0.0% of them unmarried.
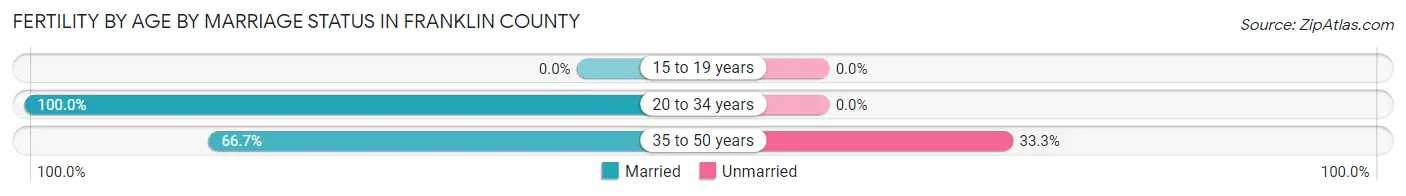
| Age Bracket | Married | Unmarried |
| 15 to 19 years | 0 (0.0%) | 0 (0.0%) |
| 20 to 34 years | 5 (100.0%) | 0 (0.0%) |
| 35 to 50 years | 4 (66.7%) | 2 (33.3%) |
| Total | 9 (81.8%) | 2 (18.2%) |
Fertility by Education in Franklin County
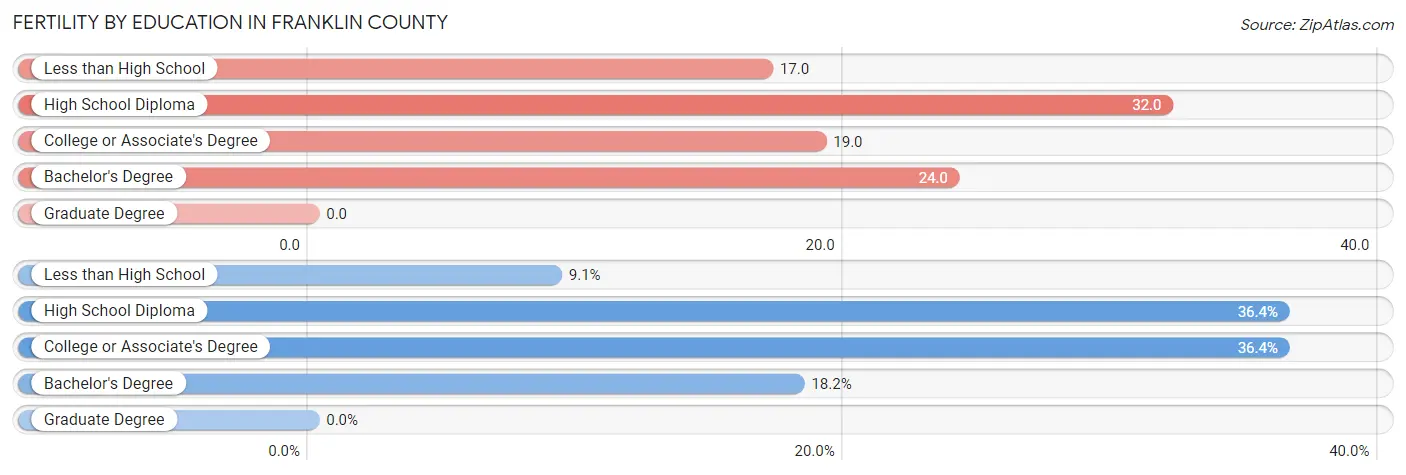
| Educational Attainment | Women with Births | Births / 1,000 Women |
| Less than High School | 1 (9.1%) | 17.0 |
| High School Diploma | 4 (36.4%) | 32.0 |
| College or Associate's Degree | 4 (36.4%) | 19.0 |
| Bachelor's Degree | 2 (18.2%) | 24.0 |
| Graduate Degree | 0 (0.0%) | 0.0 |
| Total | 11 (100.0%) | 22.0 |
Fertility by Education by Marriage Status in Franklin County
18.2% of women with births in Franklin County are unmarried. Women with the educational attainment of less than high school are most likely to be married with 100.0% of them married at childbirth, while women with the educational attainment of college or associate's degree are least likely to be married with 50.0% of them unmarried at childbirth.
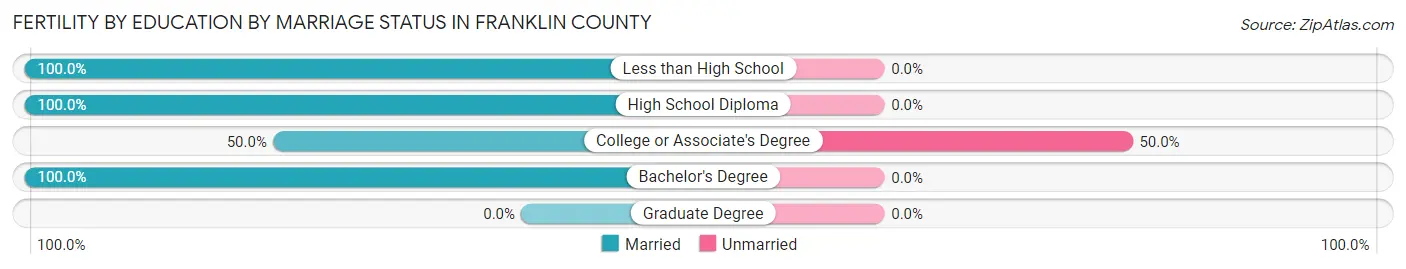
| Educational Attainment | Married | Unmarried |
| Less than High School | 1 (100.0%) | 0 (0.0%) |
| High School Diploma | 4 (100.0%) | 0 (0.0%) |
| College or Associate's Degree | 2 (50.0%) | 2 (50.0%) |
| Bachelor's Degree | 2 (100.0%) | 0 (0.0%) |
| Graduate Degree | 0 (0.0%) | 0 (0.0%) |
| Total | 9 (81.8%) | 2 (18.2%) |
Employment Characteristics in Franklin County
Employment by Class of Employer in Franklin County
Among the 1,347 employed individuals in Franklin County, private company employees (724 | 53.7%), self-employed (not incorporated) (203 | 15.1%), and local government employees (175 | 13.0%) make up the most common classes of employment.
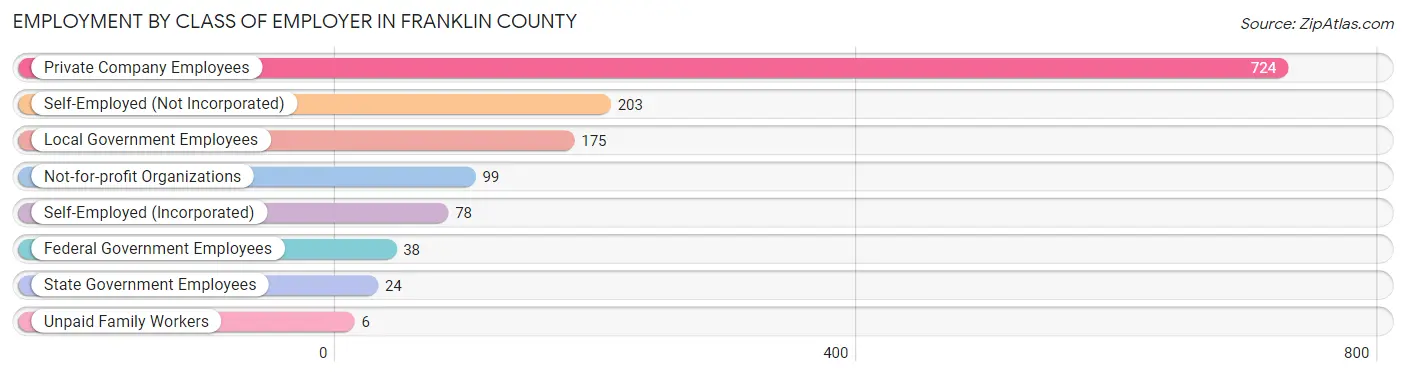
| Employer Class | # Employees | % Employees |
| Private Company Employees | 724 | 53.7% |
| Self-Employed (Incorporated) | 78 | 5.8% |
| Self-Employed (Not Incorporated) | 203 | 15.1% |
| Not-for-profit Organizations | 99 | 7.3% |
| Local Government Employees | 175 | 13.0% |
| State Government Employees | 24 | 1.8% |
| Federal Government Employees | 38 | 2.8% |
| Unpaid Family Workers | 6 | 0.4% |
| Total | 1,347 | 100.0% |
Employment Status by Age in Franklin County
According to the labor force statistics for Franklin County, out of the total population over 16 years of age (2,405), 58.8% or 1,414 individuals are in the labor force, with 2.5% or 35 of them unemployed. The age group with the highest labor force participation rate is 25 to 29 years, with 91.6% or 131 individuals in the labor force. Within the labor force, the 35 to 44 years age range has the highest percentage of unemployed individuals, with 9.1% or 23 of them being unemployed.
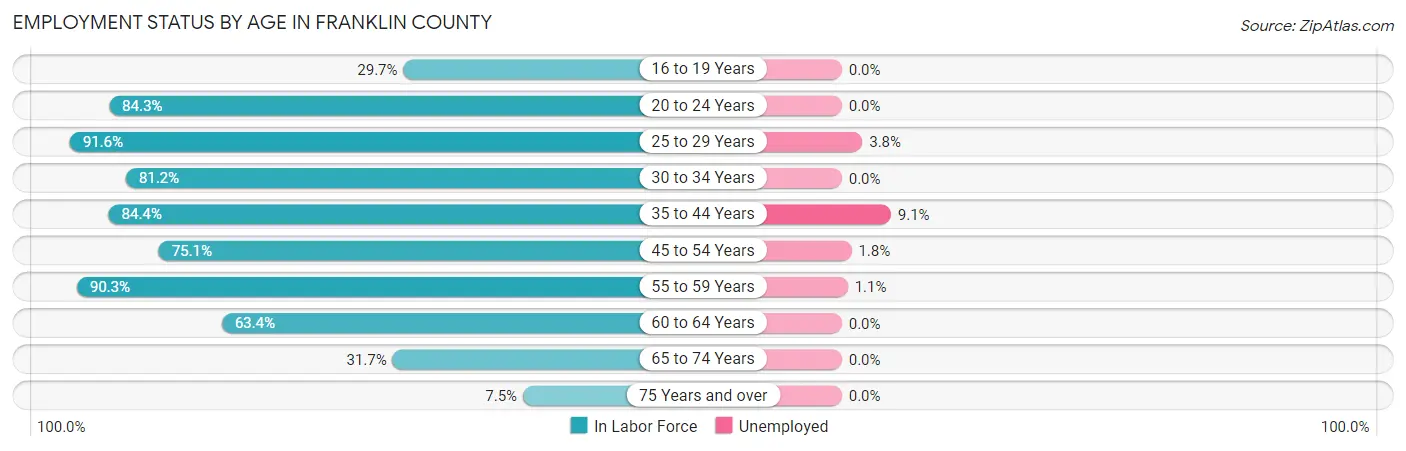
| Age Bracket | In Labor Force | Unemployed |
| 16 to 19 Years | 33 (29.7%) | 0 (0.0%) |
| 20 to 24 Years | 107 (84.3%) | 0 (0.0%) |
| 25 to 29 Years | 131 (91.6%) | 5 (3.8%) |
| 30 to 34 Years | 112 (81.2%) | 0 (0.0%) |
| 35 to 44 Years | 254 (84.4%) | 23 (9.1%) |
| 45 to 54 Years | 226 (75.1%) | 4 (1.8%) |
| 55 to 59 Years | 269 (90.3%) | 3 (1.1%) |
| 60 to 64 Years | 118 (63.4%) | 0 (0.0%) |
| 65 to 74 Years | 135 (31.7%) | 0 (0.0%) |
| 75 Years and over | 28 (7.5%) | 0 (0.0%) |
| Total | 1,414 (58.8%) | 35 (2.5%) |
Employment Status by Educational Attainment in Franklin County
According to labor force statistics for Franklin County, 81.2% of individuals (1,110) out of the total population between 25 and 64 years of age (1,367) are in the labor force, with 3.2% or 36 of them being unemployed. The group with the highest labor force participation rate are those with the educational attainment of bachelor's degree or higher, with 90.0% or 251 individuals in the labor force. Within the labor force, individuals with bachelor's degree or higher education have the highest percentage of unemployment, with 10.4% or 26 of them being unemployed.
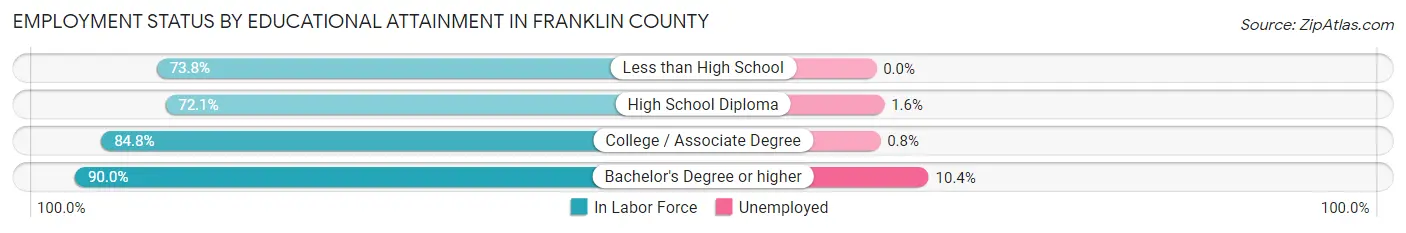
| Educational Attainment | In Labor Force | Unemployed |
| Less than High School | 48 (73.8%) | 0 (0.0%) |
| High School Diploma | 320 (72.1%) | 7 (1.6%) |
| College / Associate Degree | 491 (84.8%) | 5 (0.8%) |
| Bachelor's Degree or higher | 251 (90.0%) | 29 (10.4%) |
| Total | 1,110 (81.2%) | 44 (3.2%) |
Employment Occupations by Sex in Franklin County
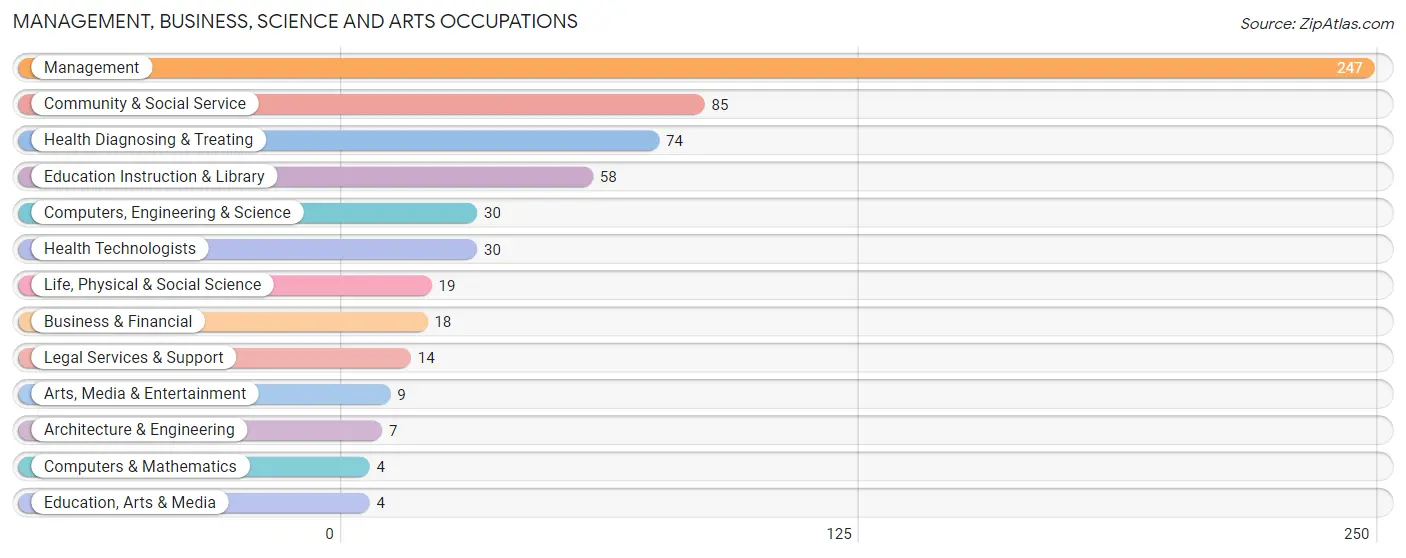
Management, Business, Science and Arts Occupations
The most common Management, Business, Science and Arts occupations in Franklin County are Management (247 | 17.9%), Community & Social Service (85 | 6.2%), Health Diagnosing & Treating (74 | 5.4%), Education Instruction & Library (58 | 4.2%), and Computers, Engineering & Science (30 | 2.2%).
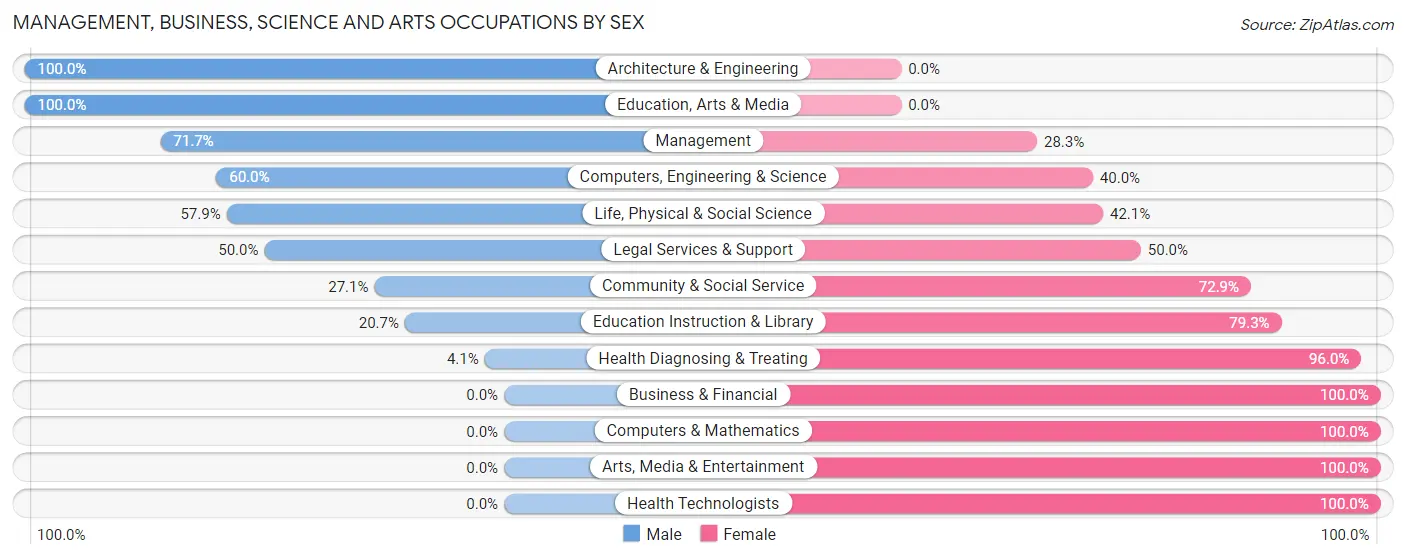
Management, Business, Science and Arts Occupations by Sex
Within the Management, Business, Science and Arts occupations in Franklin County, the most male-oriented occupations are Architecture & Engineering (100.0%), Education, Arts & Media (100.0%), and Management (71.7%), while the most female-oriented occupations are Business & Financial (100.0%), Computers & Mathematics (100.0%), and Arts, Media & Entertainment (100.0%).
| Occupation | Male | Female |
| Management | 177 (71.7%) | 70 (28.3%) |
| Business & Financial | 0 (0.0%) | 18 (100.0%) |
| Computers, Engineering & Science | 18 (60.0%) | 12 (40.0%) |
| Computers & Mathematics | 0 (0.0%) | 4 (100.0%) |
| Architecture & Engineering | 7 (100.0%) | 0 (0.0%) |
| Life, Physical & Social Science | 11 (57.9%) | 8 (42.1%) |
| Community & Social Service | 23 (27.1%) | 62 (72.9%) |
| Education, Arts & Media | 4 (100.0%) | 0 (0.0%) |
| Legal Services & Support | 7 (50.0%) | 7 (50.0%) |
| Education Instruction & Library | 12 (20.7%) | 46 (79.3%) |
| Arts, Media & Entertainment | 0 (0.0%) | 9 (100.0%) |
| Health Diagnosing & Treating | 3 (4.1%) | 71 (96.0%) |
| Health Technologists | 0 (0.0%) | 30 (100.0%) |
| Total (Category) | 221 (48.7%) | 233 (51.3%) |
| Total (Overall) | 709 (51.4%) | 669 (48.5%) |
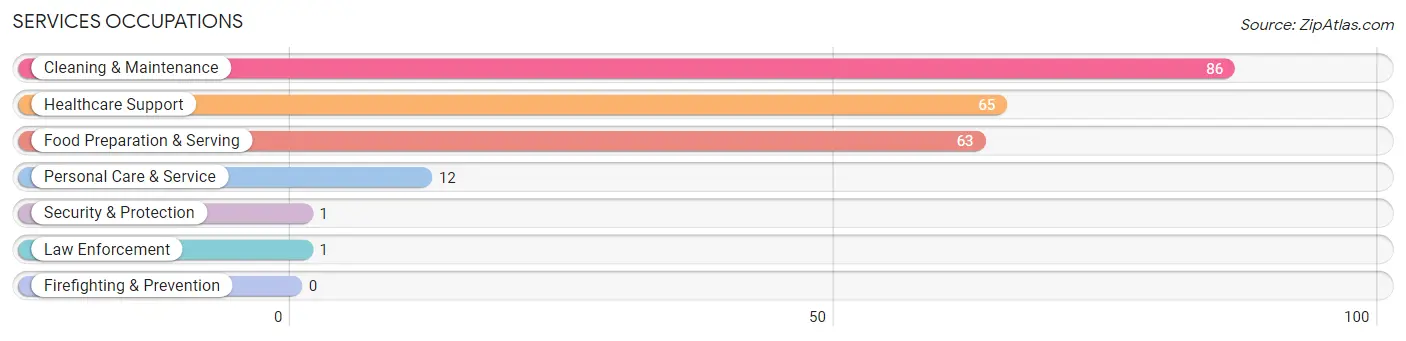
Services Occupations
The most common Services occupations in Franklin County are Cleaning & Maintenance (86 | 6.2%), Healthcare Support (65 | 4.7%), Food Preparation & Serving (63 | 4.6%), Personal Care & Service (12 | 0.9%), and Security & Protection (1 | 0.1%).
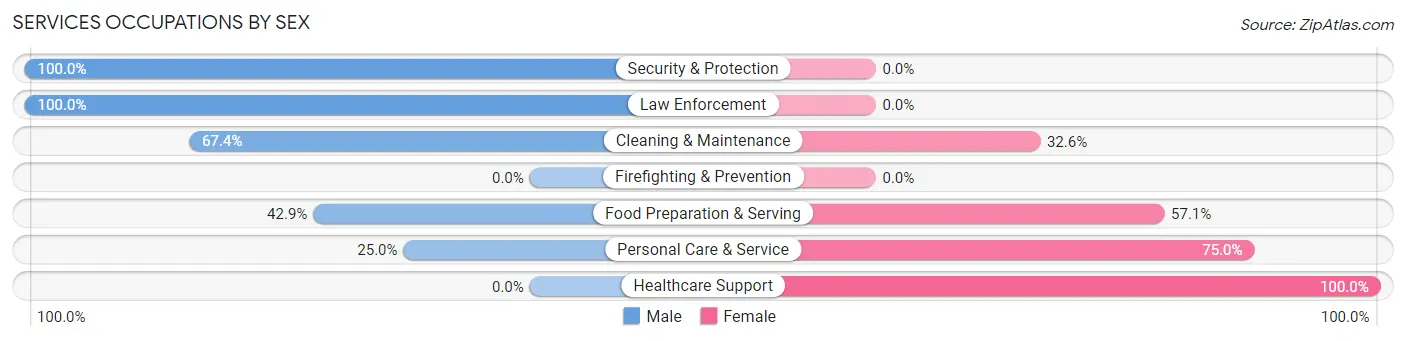
Services Occupations by Sex
Within the Services occupations in Franklin County, the most male-oriented occupations are Security & Protection (100.0%), Law Enforcement (100.0%), and Cleaning & Maintenance (67.4%), while the most female-oriented occupations are Healthcare Support (100.0%), Personal Care & Service (75.0%), and Food Preparation & Serving (57.1%).
| Occupation | Male | Female |
| Healthcare Support | 0 (0.0%) | 65 (100.0%) |
| Security & Protection | 1 (100.0%) | 0 (0.0%) |
| Firefighting & Prevention | 0 (0.0%) | 0 (0.0%) |
| Law Enforcement | 1 (100.0%) | 0 (0.0%) |
| Food Preparation & Serving | 27 (42.9%) | 36 (57.1%) |
| Cleaning & Maintenance | 58 (67.4%) | 28 (32.6%) |
| Personal Care & Service | 3 (25.0%) | 9 (75.0%) |
| Total (Category) | 89 (39.2%) | 138 (60.8%) |
| Total (Overall) | 709 (51.4%) | 669 (48.5%) |
Sales and Office Occupations
The most common Sales and Office occupations in Franklin County are Office & Administration (175 | 12.7%), and Sales & Related (110 | 8.0%).
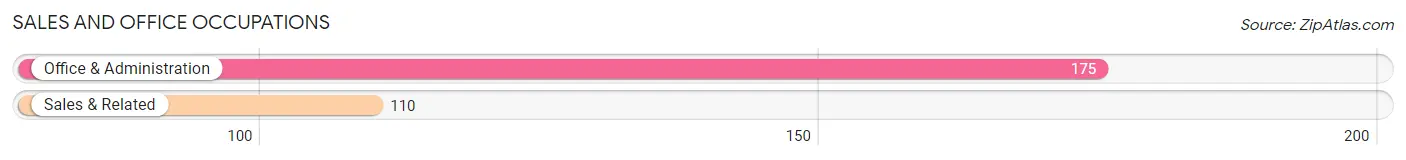
Sales and Office Occupations by Sex
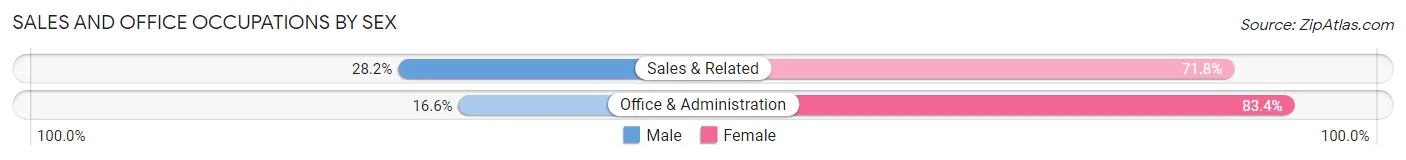
| Occupation | Male | Female |
| Sales & Related | 31 (28.2%) | 79 (71.8%) |
| Office & Administration | 29 (16.6%) | 146 (83.4%) |
| Total (Category) | 60 (21.0%) | 225 (78.9%) |
| Total (Overall) | 709 (51.4%) | 669 (48.5%) |
Natural Resources, Construction and Maintenance Occupations
The most common Natural Resources, Construction and Maintenance occupations in Franklin County are Farming, Fishing & Forestry (92 | 6.7%), Construction & Extraction (72 | 5.2%), and Installation, Maintenance & Repair (67 | 4.9%).
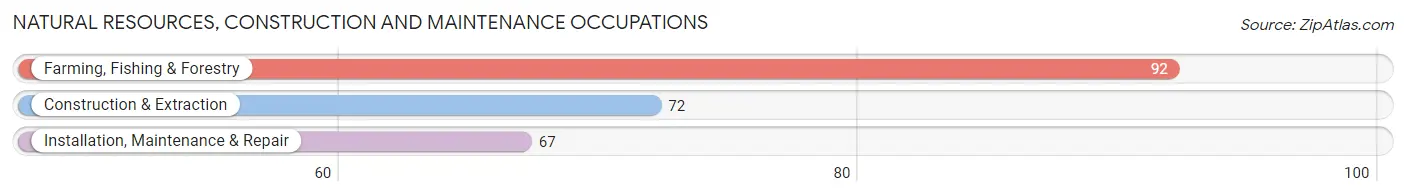
Natural Resources, Construction and Maintenance Occupations by Sex
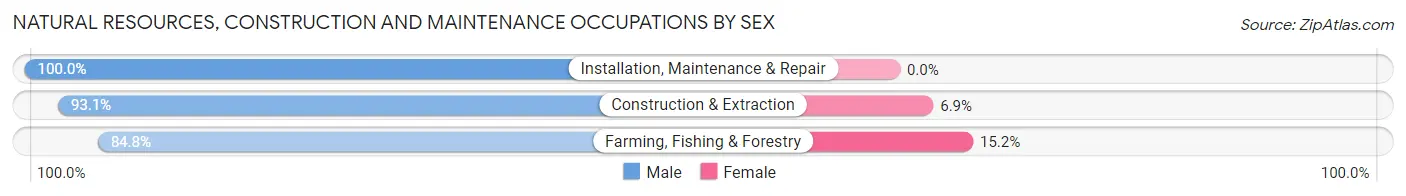
| Occupation | Male | Female |
| Farming, Fishing & Forestry | 78 (84.8%) | 14 (15.2%) |
| Construction & Extraction | 67 (93.1%) | 5 (6.9%) |
| Installation, Maintenance & Repair | 67 (100.0%) | 0 (0.0%) |
| Total (Category) | 212 (91.8%) | 19 (8.2%) |
| Total (Overall) | 709 (51.4%) | 669 (48.5%) |
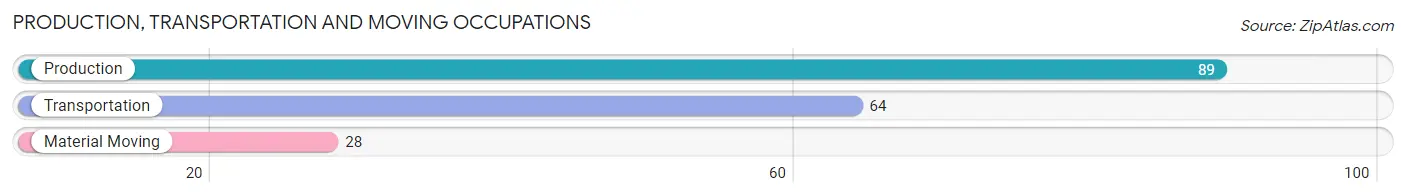
Production, Transportation and Moving Occupations
The most common Production, Transportation and Moving occupations in Franklin County are Production (89 | 6.5%), Transportation (64 | 4.6%), and Material Moving (28 | 2.0%).
Production, Transportation and Moving Occupations by Sex
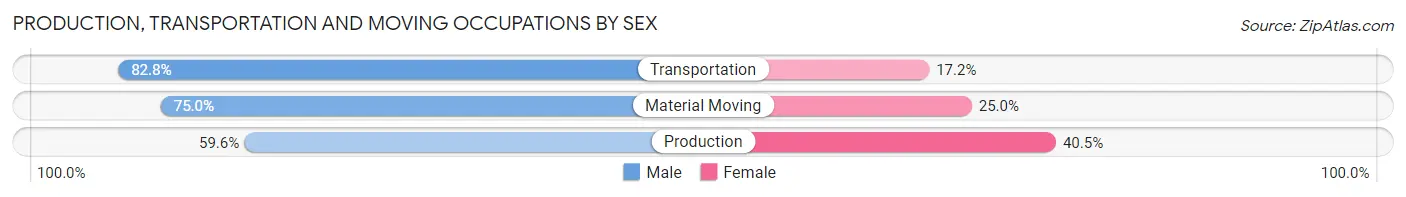
| Occupation | Male | Female |
| Production | 53 (59.6%) | 36 (40.5%) |
| Transportation | 53 (82.8%) | 11 (17.2%) |
| Material Moving | 21 (75.0%) | 7 (25.0%) |
| Total (Category) | 127 (70.2%) | 54 (29.8%) |
| Total (Overall) | 709 (51.4%) | 669 (48.5%) |
Employment Industries by Sex in Franklin County
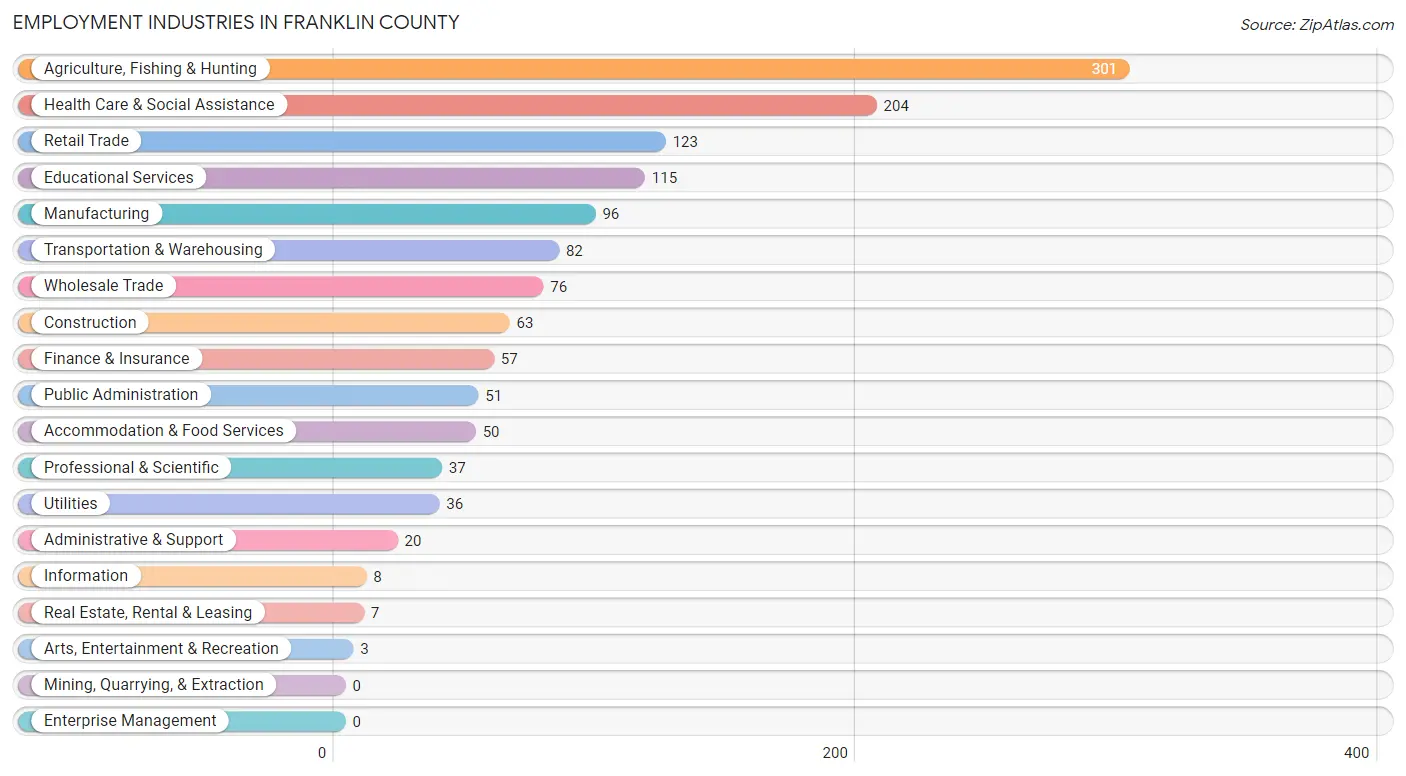
Employment Industries in Franklin County
The major employment industries in Franklin County include Agriculture, Fishing & Hunting (301 | 21.8%), Health Care & Social Assistance (204 | 14.8%), Retail Trade (123 | 8.9%), Educational Services (115 | 8.4%), and Manufacturing (96 | 7.0%).
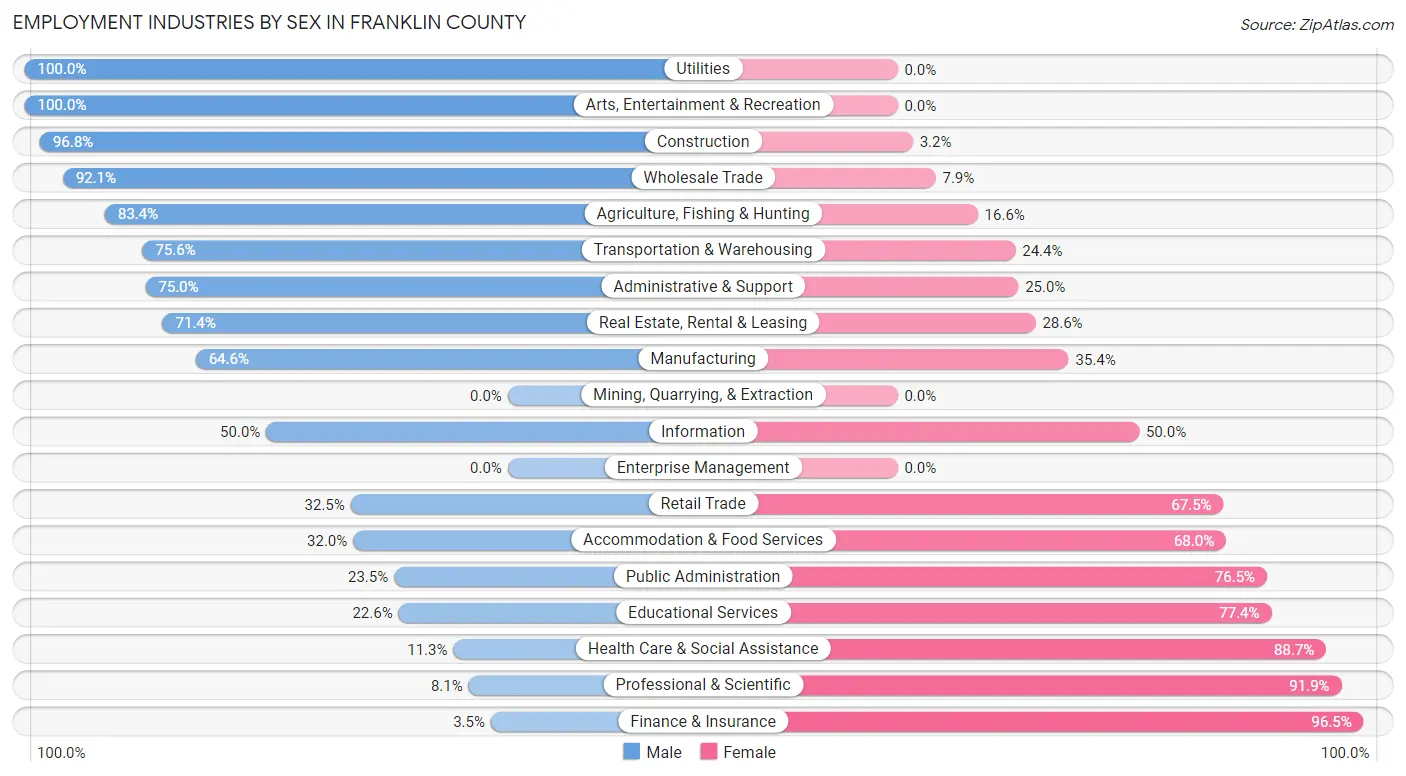
Employment Industries by Sex in Franklin County
The Franklin County industries that see more men than women are Utilities (100.0%), Arts, Entertainment & Recreation (100.0%), and Construction (96.8%), whereas the industries that tend to have a higher number of women are Finance & Insurance (96.5%), Professional & Scientific (91.9%), and Health Care & Social Assistance (88.7%).
| Industry | Male | Female |
| Agriculture, Fishing & Hunting | 251 (83.4%) | 50 (16.6%) |
| Mining, Quarrying, & Extraction | 0 (0.0%) | 0 (0.0%) |
| Construction | 61 (96.8%) | 2 (3.2%) |
| Manufacturing | 62 (64.6%) | 34 (35.4%) |
| Wholesale Trade | 70 (92.1%) | 6 (7.9%) |
| Retail Trade | 40 (32.5%) | 83 (67.5%) |
| Transportation & Warehousing | 62 (75.6%) | 20 (24.4%) |
| Utilities | 36 (100.0%) | 0 (0.0%) |
| Information | 4 (50.0%) | 4 (50.0%) |
| Finance & Insurance | 2 (3.5%) | 55 (96.5%) |
| Real Estate, Rental & Leasing | 5 (71.4%) | 2 (28.6%) |
| Professional & Scientific | 3 (8.1%) | 34 (91.9%) |
| Enterprise Management | 0 (0.0%) | 0 (0.0%) |
| Administrative & Support | 15 (75.0%) | 5 (25.0%) |
| Educational Services | 26 (22.6%) | 89 (77.4%) |
| Health Care & Social Assistance | 23 (11.3%) | 181 (88.7%) |
| Arts, Entertainment & Recreation | 3 (100.0%) | 0 (0.0%) |
| Accommodation & Food Services | 16 (32.0%) | 34 (68.0%) |
| Public Administration | 12 (23.5%) | 39 (76.5%) |
| Total | 709 (51.4%) | 669 (48.5%) |
Education in Franklin County
School Enrollment in Franklin County
The most common levels of schooling among the 514 students in Franklin County are high school (119 | 23.2%), middle school (112 | 21.8%), and elementary school (108 | 21.0%).
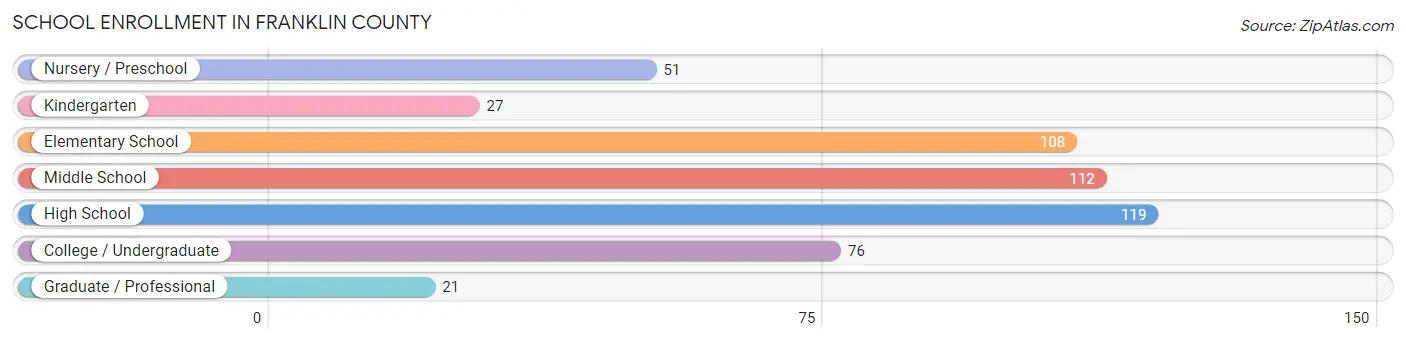
| School Level | # Students | % Students |
| Nursery / Preschool | 51 | 9.9% |
| Kindergarten | 27 | 5.2% |
| Elementary School | 108 | 21.0% |
| Middle School | 112 | 21.8% |
| High School | 119 | 23.2% |
| College / Undergraduate | 76 | 14.8% |
| Graduate / Professional | 21 | 4.1% |
| Total | 514 | 100.0% |
School Enrollment by Age by Funding Source in Franklin County
Out of a total of 514 students who are enrolled in schools in Franklin County, 35 (6.8%) attend a private institution, while the remaining 479 (93.2%) are enrolled in public schools. The age group of 18 to 19 year olds has the highest likelihood of being enrolled in private schools, with 8 (20.0% in the age bracket) enrolled. Conversely, the age group of 3 to 4 year olds has the lowest likelihood of being enrolled in a private school, with 29 (100.0% in the age bracket) attending a public institution.
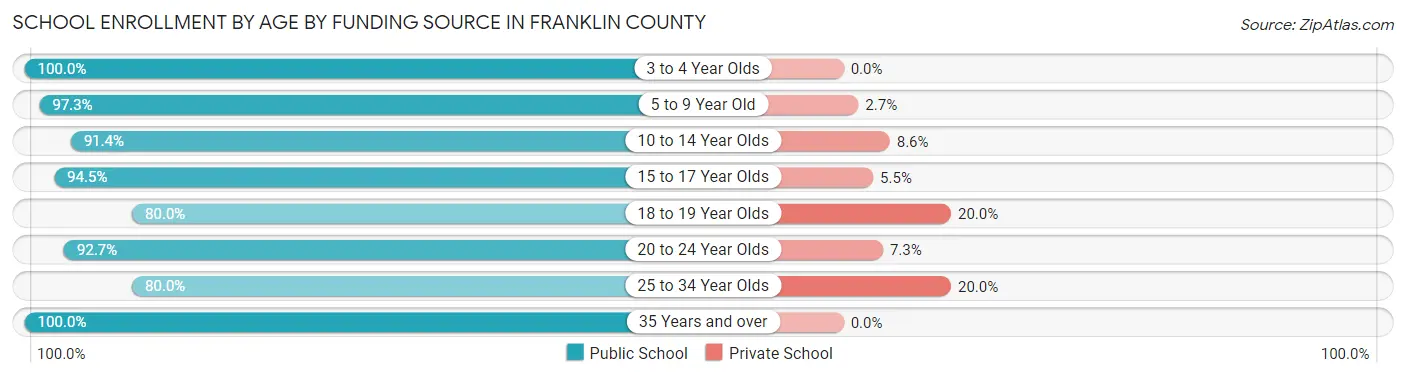
| Age Bracket | Public School | Private School |
| 3 to 4 Year Olds | 29 (100.0%) | 0 (0.0%) |
| 5 to 9 Year Old | 142 (97.3%) | 4 (2.7%) |
| 10 to 14 Year Olds | 117 (91.4%) | 11 (8.6%) |
| 15 to 17 Year Olds | 86 (94.5%) | 5 (5.5%) |
| 18 to 19 Year Olds | 32 (80.0%) | 8 (20.0%) |
| 20 to 24 Year Olds | 38 (92.7%) | 3 (7.3%) |
| 25 to 34 Year Olds | 16 (80.0%) | 4 (20.0%) |
| 35 Years and over | 19 (100.0%) | 0 (0.0%) |
| Total | 479 (93.2%) | 35 (6.8%) |
Educational Attainment by Field of Study in Franklin County
Education (144 | 32.7%), science & technology (86 | 19.5%), arts & humanities (66 | 15.0%), business (59 | 13.4%), and bio, nature & agricultural (33 | 7.5%) are the most common fields of study among 441 individuals in Franklin County who have obtained a bachelor's degree or higher.
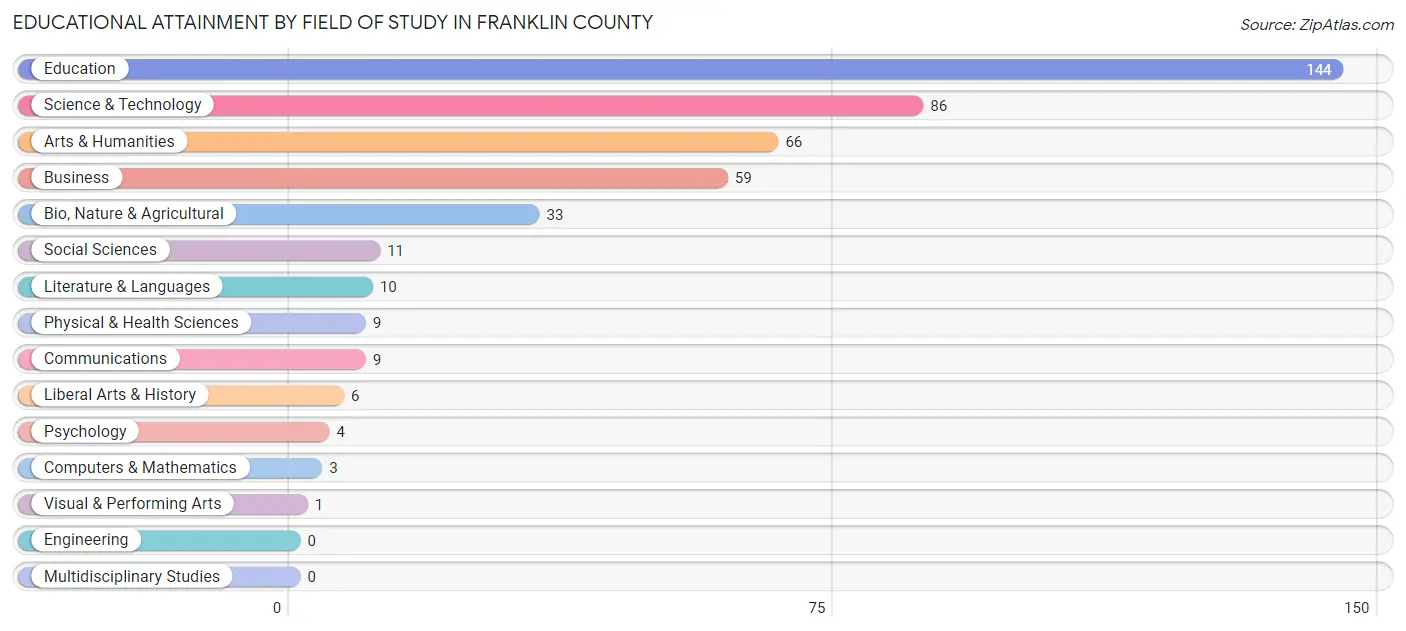
| Field of Study | # Graduates | % Graduates |
| Computers & Mathematics | 3 | 0.7% |
| Bio, Nature & Agricultural | 33 | 7.5% |
| Physical & Health Sciences | 9 | 2.0% |
| Psychology | 4 | 0.9% |
| Social Sciences | 11 | 2.5% |
| Engineering | 0 | 0.0% |
| Multidisciplinary Studies | 0 | 0.0% |
| Science & Technology | 86 | 19.5% |
| Business | 59 | 13.4% |
| Education | 144 | 32.7% |
| Literature & Languages | 10 | 2.3% |
| Liberal Arts & History | 6 | 1.4% |
| Visual & Performing Arts | 1 | 0.2% |
| Communications | 9 | 2.0% |
| Arts & Humanities | 66 | 15.0% |
| Total | 441 | 100.0% |
Transportation & Commute in Franklin County
Vehicle Availability by Sex in Franklin County
The most prevalent vehicle ownership categories in Franklin County are males with 2 vehicles (234, accounting for 33.5%) and females with 2 vehicles (222, making up 36.1%).
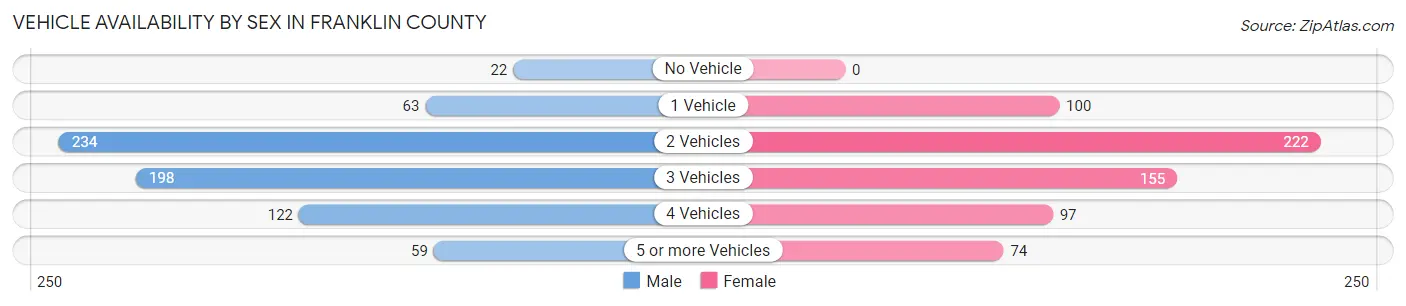
| Vehicles Available | Male | Female |
| No Vehicle | 22 (3.2%) | 0 (0.0%) |
| 1 Vehicle | 63 (9.0%) | 100 (15.4%) |
| 2 Vehicles | 234 (33.5%) | 222 (34.3%) |
| 3 Vehicles | 198 (28.4%) | 155 (23.9%) |
| 4 Vehicles | 122 (17.5%) | 97 (15.0%) |
| 5 or more Vehicles | 59 (8.5%) | 74 (11.4%) |
| Total | 698 (100.0%) | 648 (100.0%) |
Commute Time in Franklin County
The most frequently occuring commute durations in Franklin County are less than 5 minutes (297 commuters, 23.8%), 30 to 34 minutes (172 commuters, 13.8%), and 5 to 9 minutes (160 commuters, 12.8%).
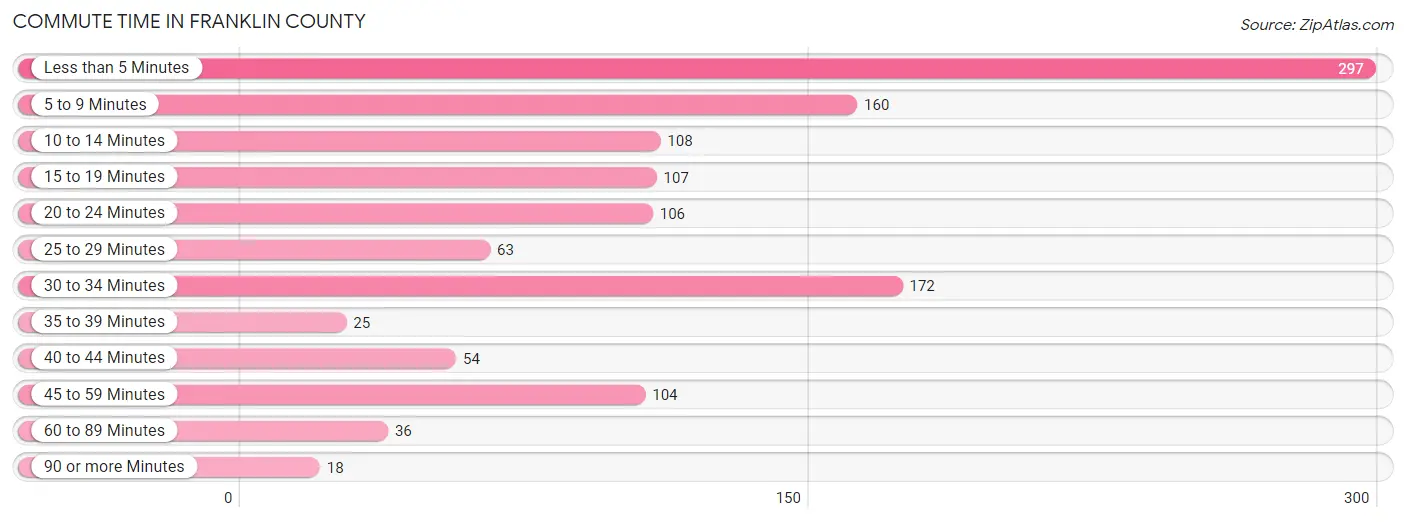
| Commute Time | # Commuters | % Commuters |
| Less than 5 Minutes | 297 | 23.8% |
| 5 to 9 Minutes | 160 | 12.8% |
| 10 to 14 Minutes | 108 | 8.6% |
| 15 to 19 Minutes | 107 | 8.6% |
| 20 to 24 Minutes | 106 | 8.5% |
| 25 to 29 Minutes | 63 | 5.0% |
| 30 to 34 Minutes | 172 | 13.8% |
| 35 to 39 Minutes | 25 | 2.0% |
| 40 to 44 Minutes | 54 | 4.3% |
| 45 to 59 Minutes | 104 | 8.3% |
| 60 to 89 Minutes | 36 | 2.9% |
| 90 or more Minutes | 18 | 1.4% |
Commute Time by Sex in Franklin County
The most common commute times in Franklin County are less than 5 minutes (166 commuters, 25.3%) for males and less than 5 minutes (131 commuters, 22.1%) for females.
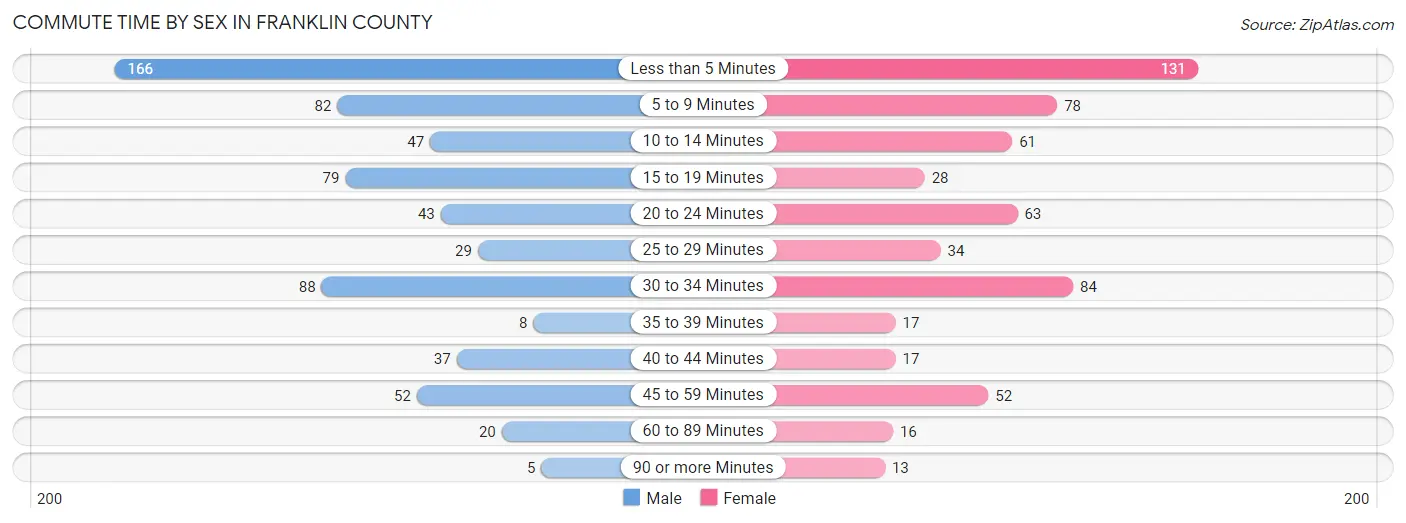
| Commute Time | Male | Female |
| Less than 5 Minutes | 166 (25.3%) | 131 (22.1%) |
| 5 to 9 Minutes | 82 (12.5%) | 78 (13.1%) |
| 10 to 14 Minutes | 47 (7.2%) | 61 (10.3%) |
| 15 to 19 Minutes | 79 (12.0%) | 28 (4.7%) |
| 20 to 24 Minutes | 43 (6.6%) | 63 (10.6%) |
| 25 to 29 Minutes | 29 (4.4%) | 34 (5.7%) |
| 30 to 34 Minutes | 88 (13.4%) | 84 (14.1%) |
| 35 to 39 Minutes | 8 (1.2%) | 17 (2.9%) |
| 40 to 44 Minutes | 37 (5.6%) | 17 (2.9%) |
| 45 to 59 Minutes | 52 (7.9%) | 52 (8.7%) |
| 60 to 89 Minutes | 20 (3.0%) | 16 (2.7%) |
| 90 or more Minutes | 5 (0.8%) | 13 (2.2%) |
Time of Departure to Work by Sex in Franklin County
The most frequent times of departure to work in Franklin County are 7:30 AM to 7:59 AM (128, 19.5%) for males and 7:00 AM to 7:29 AM (143, 24.1%) for females.
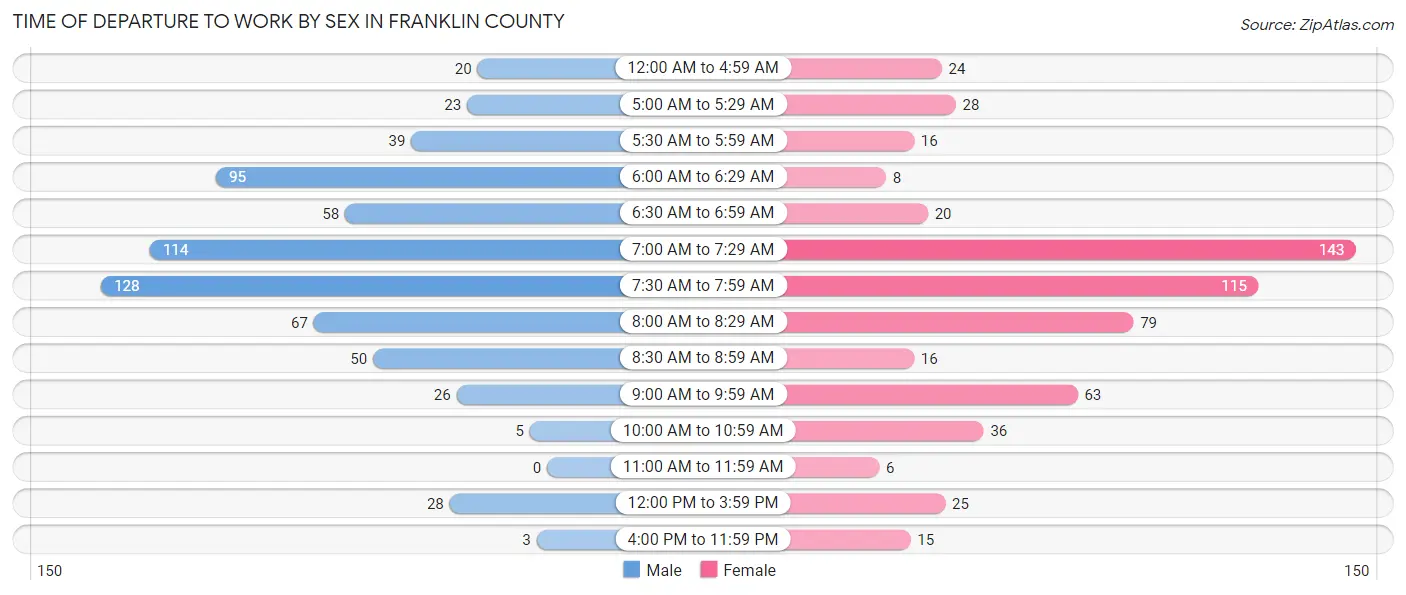
| Time of Departure | Male | Female |
| 12:00 AM to 4:59 AM | 20 (3.0%) | 24 (4.0%) |
| 5:00 AM to 5:29 AM | 23 (3.5%) | 28 (4.7%) |
| 5:30 AM to 5:59 AM | 39 (5.9%) | 16 (2.7%) |
| 6:00 AM to 6:29 AM | 95 (14.5%) | 8 (1.3%) |
| 6:30 AM to 6:59 AM | 58 (8.8%) | 20 (3.4%) |
| 7:00 AM to 7:29 AM | 114 (17.4%) | 143 (24.1%) |
| 7:30 AM to 7:59 AM | 128 (19.5%) | 115 (19.4%) |
| 8:00 AM to 8:29 AM | 67 (10.2%) | 79 (13.3%) |
| 8:30 AM to 8:59 AM | 50 (7.6%) | 16 (2.7%) |
| 9:00 AM to 9:59 AM | 26 (4.0%) | 63 (10.6%) |
| 10:00 AM to 10:59 AM | 5 (0.8%) | 36 (6.1%) |
| 11:00 AM to 11:59 AM | 0 (0.0%) | 6 (1.0%) |
| 12:00 PM to 3:59 PM | 28 (4.3%) | 25 (4.2%) |
| 4:00 PM to 11:59 PM | 3 (0.5%) | 15 (2.5%) |
| Total | 656 (100.0%) | 594 (100.0%) |
Housing Occupancy in Franklin County
Occupancy by Ownership in Franklin County
Of the total 1,255 dwellings in Franklin County, owner-occupied units account for 1,047 (83.4%), while renter-occupied units make up 208 (16.6%).
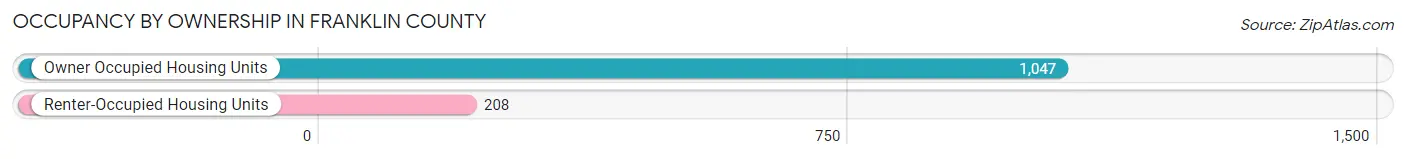
| Occupancy | # Housing Units | % Housing Units |
| Owner Occupied Housing Units | 1,047 | 83.4% |
| Renter-Occupied Housing Units | 208 | 16.6% |
| Total Occupied Housing Units | 1,255 | 100.0% |
Occupancy by Household Size in Franklin County
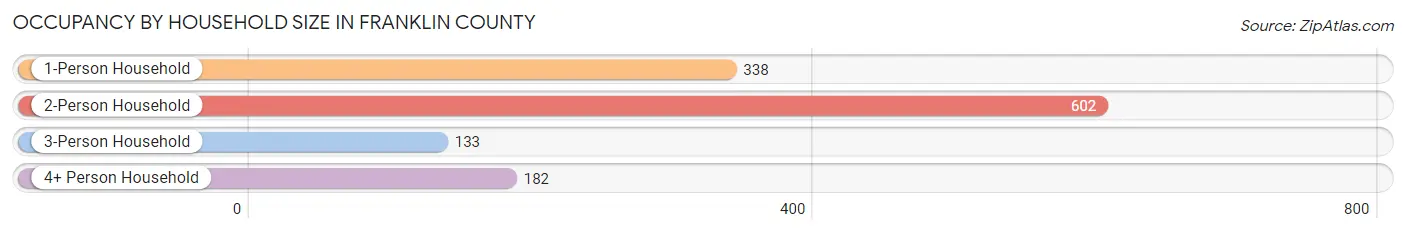
| Household Size | # Housing Units | % Housing Units |
| 1-Person Household | 338 | 26.9% |
| 2-Person Household | 602 | 48.0% |
| 3-Person Household | 133 | 10.6% |
| 4+ Person Household | 182 | 14.5% |
| Total Housing Units | 1,255 | 100.0% |
Occupancy by Ownership by Household Size in Franklin County
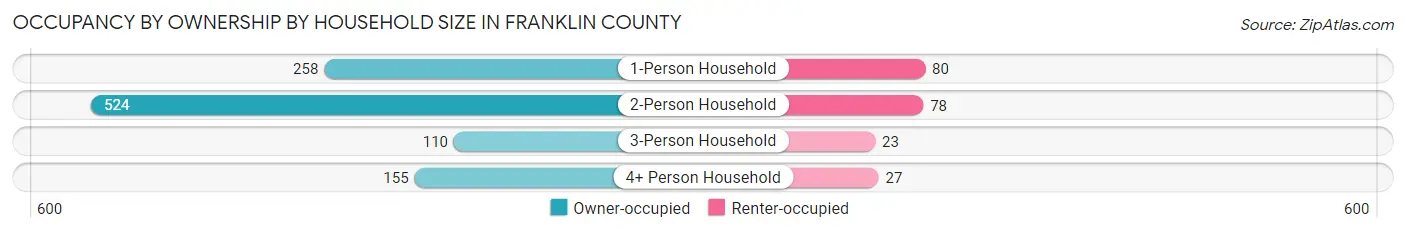
| Household Size | Owner-occupied | Renter-occupied |
| 1-Person Household | 258 (76.3%) | 80 (23.7%) |
| 2-Person Household | 524 (87.0%) | 78 (13.0%) |
| 3-Person Household | 110 (82.7%) | 23 (17.3%) |
| 4+ Person Household | 155 (85.2%) | 27 (14.8%) |
| Total Housing Units | 1,047 (83.4%) | 208 (16.6%) |
Occupancy by Educational Attainment in Franklin County
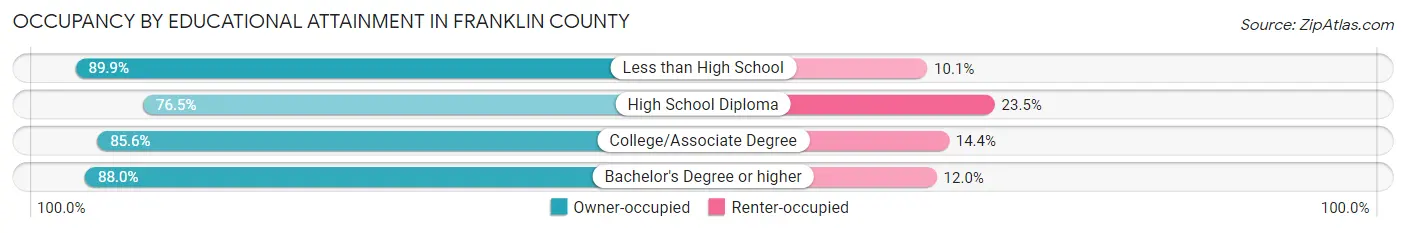
| Household Size | Owner-occupied | Renter-occupied |
| Less than High School | 80 (89.9%) | 9 (10.1%) |
| High School Diploma | 316 (76.5%) | 97 (23.5%) |
| College/Associate Degree | 416 (85.6%) | 70 (14.4%) |
| Bachelor's Degree or higher | 235 (88.0%) | 32 (12.0%) |
Occupancy by Age of Householder in Franklin County
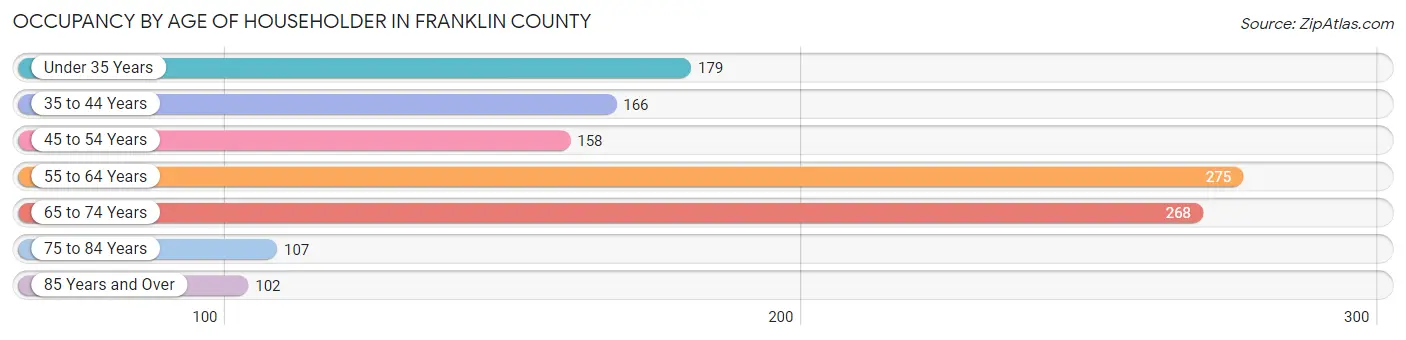
| Age Bracket | # Households | % Households |
| Under 35 Years | 179 | 14.3% |
| 35 to 44 Years | 166 | 13.2% |
| 45 to 54 Years | 158 | 12.6% |
| 55 to 64 Years | 275 | 21.9% |
| 65 to 74 Years | 268 | 21.3% |
| 75 to 84 Years | 107 | 8.5% |
| 85 Years and Over | 102 | 8.1% |
| Total | 1,255 | 100.0% |
Housing Finances in Franklin County
Median Income by Occupancy in Franklin County
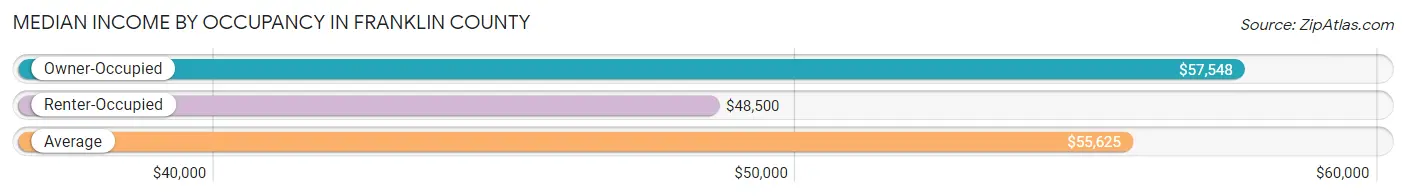
| Occupancy Type | # Households | Median Income |
| Owner-Occupied | 1,047 (83.4%) | $57,548 |
| Renter-Occupied | 208 (16.6%) | $48,500 |
| Average | 1,255 (100.0%) | $55,625 |
Occupancy by Householder Income Bracket in Franklin County
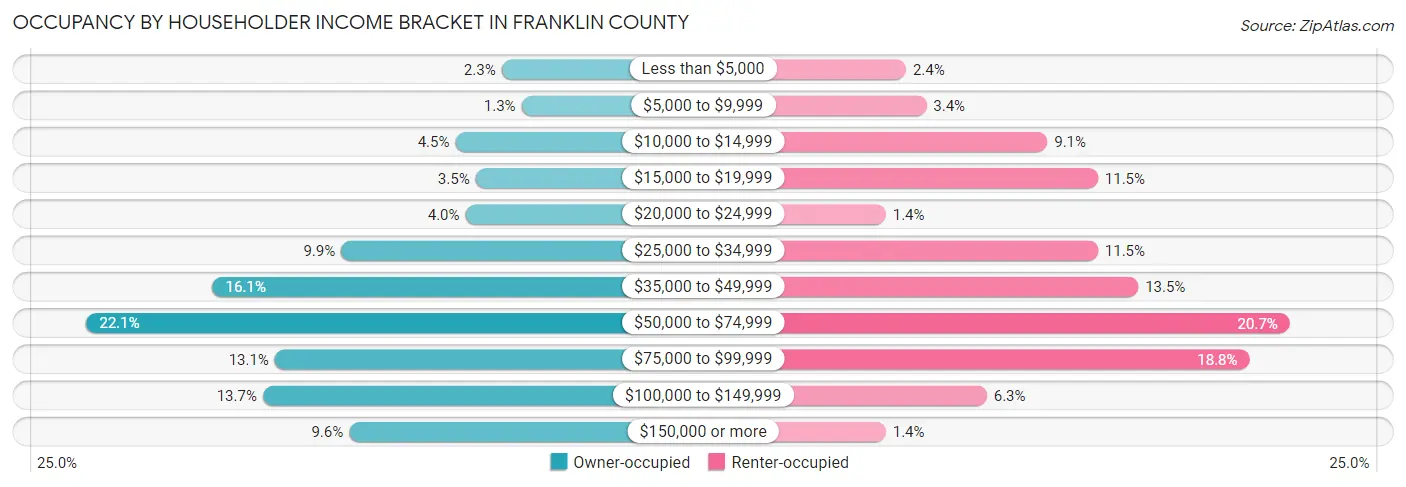
| Income Bracket | Owner-occupied | Renter-occupied |
| Less than $5,000 | 24 (2.3%) | 5 (2.4%) |
| $5,000 to $9,999 | 14 (1.3%) | 7 (3.4%) |
| $10,000 to $14,999 | 47 (4.5%) | 19 (9.1%) |
| $15,000 to $19,999 | 37 (3.5%) | 24 (11.5%) |
| $20,000 to $24,999 | 42 (4.0%) | 3 (1.4%) |
| $25,000 to $34,999 | 104 (9.9%) | 24 (11.5%) |
| $35,000 to $49,999 | 168 (16.1%) | 28 (13.5%) |
| $50,000 to $74,999 | 231 (22.1%) | 43 (20.7%) |
| $75,000 to $99,999 | 137 (13.1%) | 39 (18.8%) |
| $100,000 to $149,999 | 143 (13.7%) | 13 (6.2%) |
| $150,000 or more | 100 (9.6%) | 3 (1.4%) |
| Total | 1,047 (100.0%) | 208 (100.0%) |
Monthly Housing Cost Tiers in Franklin County
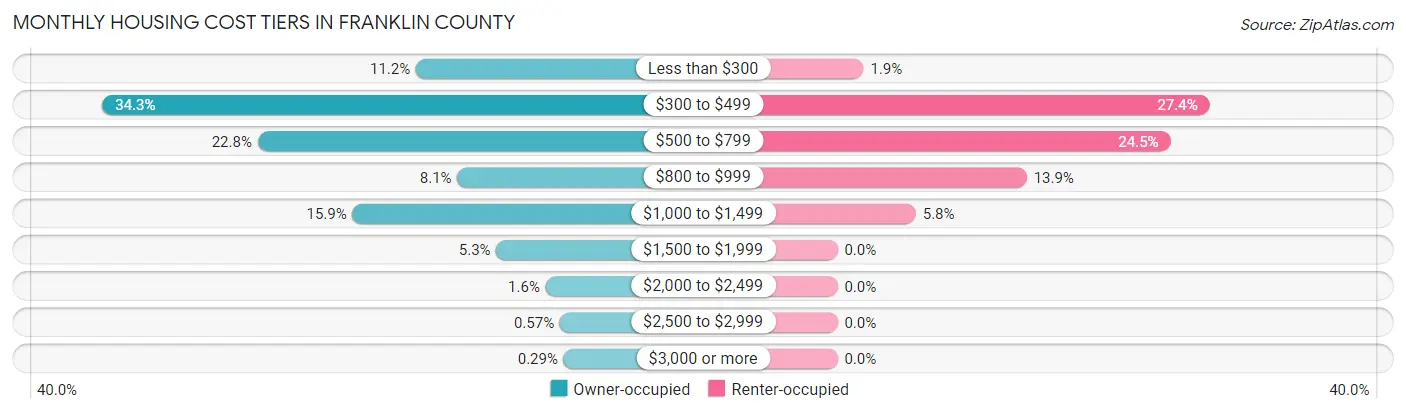
| Monthly Cost | Owner-occupied | Renter-occupied |
| Less than $300 | 117 (11.2%) | 4 (1.9%) |
| $300 to $499 | 359 (34.3%) | 57 (27.4%) |
| $500 to $799 | 239 (22.8%) | 51 (24.5%) |
| $800 to $999 | 85 (8.1%) | 29 (13.9%) |
| $1,000 to $1,499 | 166 (15.9%) | 12 (5.8%) |
| $1,500 to $1,999 | 55 (5.2%) | 0 (0.0%) |
| $2,000 to $2,499 | 17 (1.6%) | 0 (0.0%) |
| $2,500 to $2,999 | 6 (0.6%) | 0 (0.0%) |
| $3,000 or more | 3 (0.3%) | 0 (0.0%) |
| Total | 1,047 (100.0%) | 208 (100.0%) |
Physical Housing Characteristics in Franklin County
Housing Structures in Franklin County
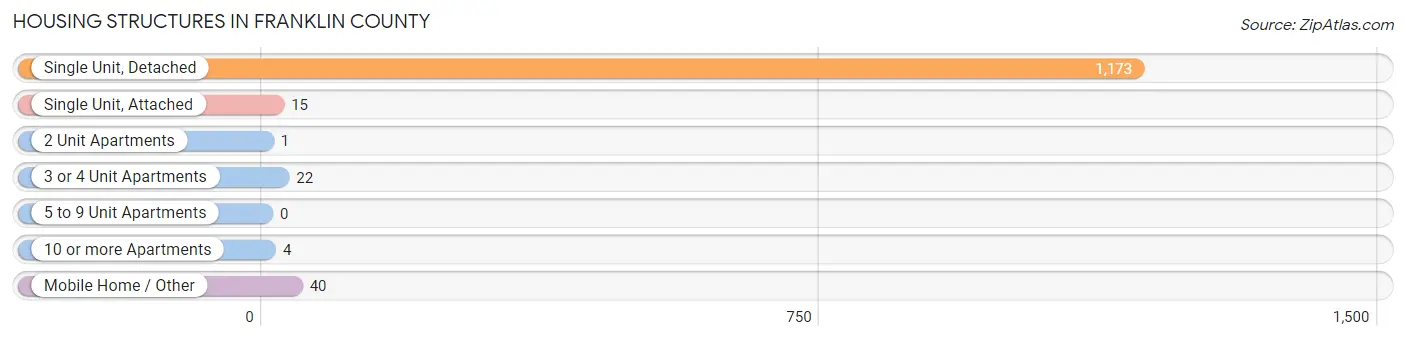
| Structure Type | # Housing Units | % Housing Units |
| Single Unit, Detached | 1,173 | 93.5% |
| Single Unit, Attached | 15 | 1.2% |
| 2 Unit Apartments | 1 | 0.1% |
| 3 or 4 Unit Apartments | 22 | 1.8% |
| 5 to 9 Unit Apartments | 0 | 0.0% |
| 10 or more Apartments | 4 | 0.3% |
| Mobile Home / Other | 40 | 3.2% |
| Total | 1,255 | 100.0% |
Housing Structures by Occupancy in Franklin County
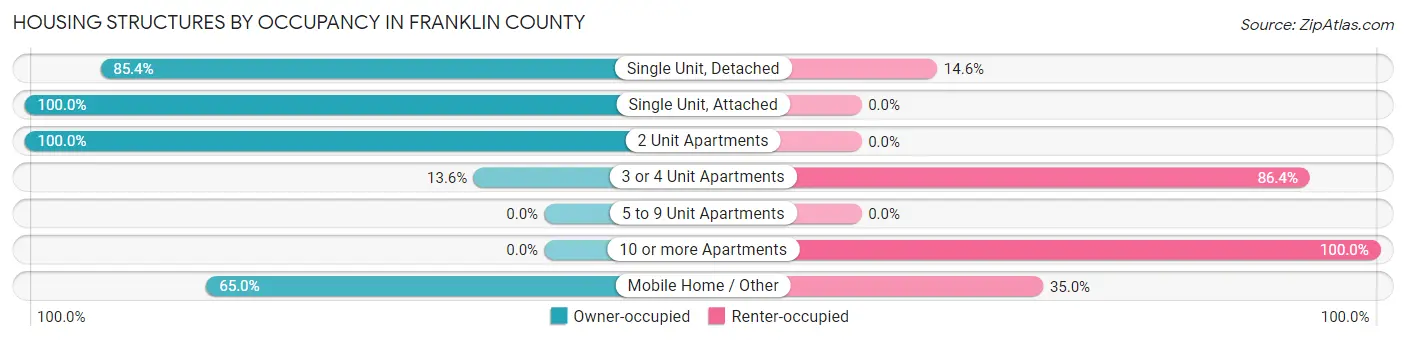
| Structure Type | Owner-occupied | Renter-occupied |
| Single Unit, Detached | 1,002 (85.4%) | 171 (14.6%) |
| Single Unit, Attached | 15 (100.0%) | 0 (0.0%) |
| 2 Unit Apartments | 1 (100.0%) | 0 (0.0%) |
| 3 or 4 Unit Apartments | 3 (13.6%) | 19 (86.4%) |
| 5 to 9 Unit Apartments | 0 (0.0%) | 0 (0.0%) |
| 10 or more Apartments | 0 (0.0%) | 4 (100.0%) |
| Mobile Home / Other | 26 (65.0%) | 14 (35.0%) |
| Total | 1,047 (83.4%) | 208 (16.6%) |
Housing Structures by Number of Rooms in Franklin County
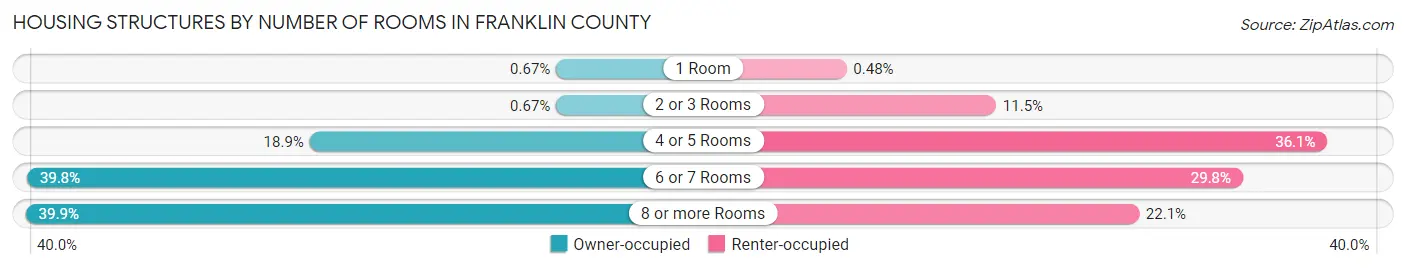
| Number of Rooms | Owner-occupied | Renter-occupied |
| 1 Room | 7 (0.7%) | 1 (0.5%) |
| 2 or 3 Rooms | 7 (0.7%) | 24 (11.5%) |
| 4 or 5 Rooms | 198 (18.9%) | 75 (36.1%) |
| 6 or 7 Rooms | 417 (39.8%) | 62 (29.8%) |
| 8 or more Rooms | 418 (39.9%) | 46 (22.1%) |
| Total | 1,047 (100.0%) | 208 (100.0%) |
Housing Structure by Heating Type in Franklin County
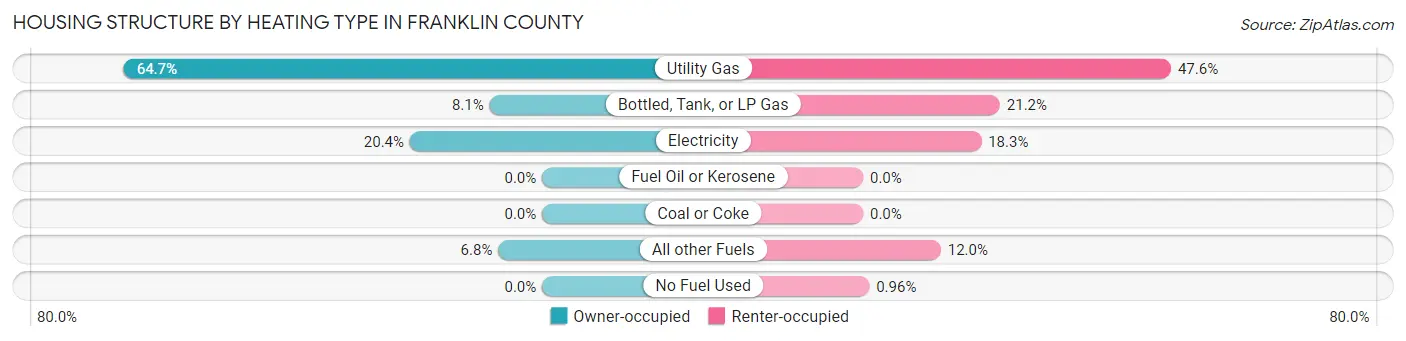
| Heating Type | Owner-occupied | Renter-occupied |
| Utility Gas | 677 (64.7%) | 99 (47.6%) |
| Bottled, Tank, or LP Gas | 85 (8.1%) | 44 (21.1%) |
| Electricity | 214 (20.4%) | 38 (18.3%) |
| Fuel Oil or Kerosene | 0 (0.0%) | 0 (0.0%) |
| Coal or Coke | 0 (0.0%) | 0 (0.0%) |
| All other Fuels | 71 (6.8%) | 25 (12.0%) |
| No Fuel Used | 0 (0.0%) | 2 (1.0%) |
| Total | 1,047 (100.0%) | 208 (100.0%) |
Household Vehicle Usage in Franklin County
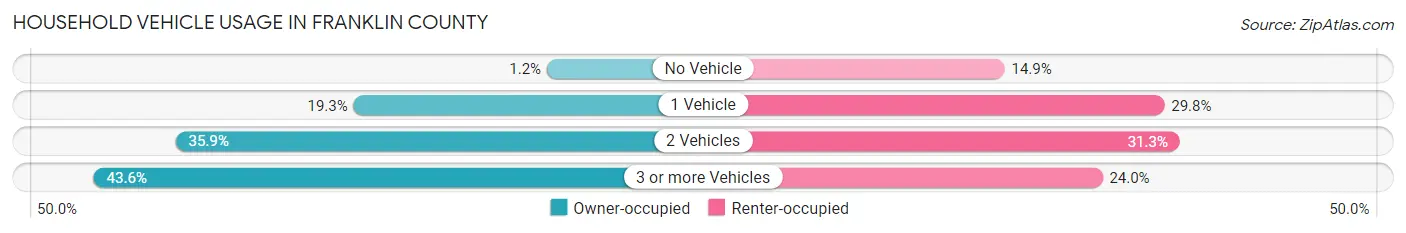
| Vehicles per Household | Owner-occupied | Renter-occupied |
| No Vehicle | 13 (1.2%) | 31 (14.9%) |
| 1 Vehicle | 202 (19.3%) | 62 (29.8%) |
| 2 Vehicles | 376 (35.9%) | 65 (31.2%) |
| 3 or more Vehicles | 456 (43.5%) | 50 (24.0%) |
| Total | 1,047 (100.0%) | 208 (100.0%) |
Real Estate & Mortgages in Franklin County
Real Estate and Mortgage Overview in Franklin County
| Characteristic | Without Mortgage | With Mortgage |
| Housing Units | 708 | 339 |
| Median Property Value | $84,300 | $120,800 |
| Median Household Income | $53,000 | $25 |
| Monthly Housing Costs | $425 | $3 |
| Real Estate Taxes | $976 | $5 |
Property Value by Mortgage Status in Franklin County
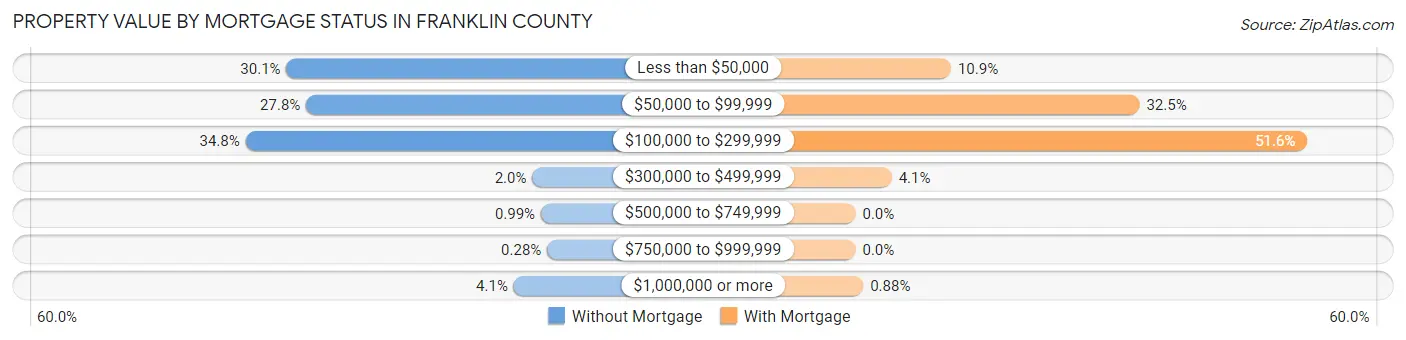
| Property Value | Without Mortgage | With Mortgage |
| Less than $50,000 | 213 (30.1%) | 37 (10.9%) |
| $50,000 to $99,999 | 197 (27.8%) | 110 (32.5%) |
| $100,000 to $299,999 | 246 (34.7%) | 175 (51.6%) |
| $300,000 to $499,999 | 14 (2.0%) | 14 (4.1%) |
| $500,000 to $749,999 | 7 (1.0%) | 0 (0.0%) |
| $750,000 to $999,999 | 2 (0.3%) | 0 (0.0%) |
| $1,000,000 or more | 29 (4.1%) | 3 (0.9%) |
| Total | 708 (100.0%) | 339 (100.0%) |
Household Income by Mortgage Status in Franklin County
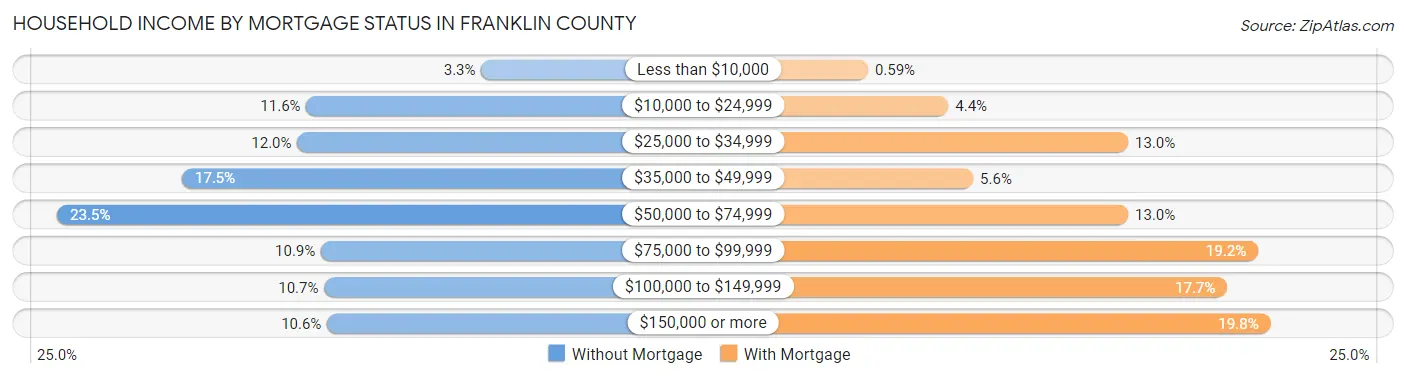
| Household Income | Without Mortgage | With Mortgage |
| Less than $10,000 | 23 (3.3%) | 2 (0.6%) |
| $10,000 to $24,999 | 82 (11.6%) | 15 (4.4%) |
| $25,000 to $34,999 | 85 (12.0%) | 44 (13.0%) |
| $35,000 to $49,999 | 124 (17.5%) | 19 (5.6%) |
| $50,000 to $74,999 | 166 (23.4%) | 44 (13.0%) |
| $75,000 to $99,999 | 77 (10.9%) | 65 (19.2%) |
| $100,000 to $149,999 | 76 (10.7%) | 60 (17.7%) |
| $150,000 or more | 75 (10.6%) | 67 (19.8%) |
| Total | 708 (100.0%) | 339 (100.0%) |
Property Value to Household Income Ratio in Franklin County
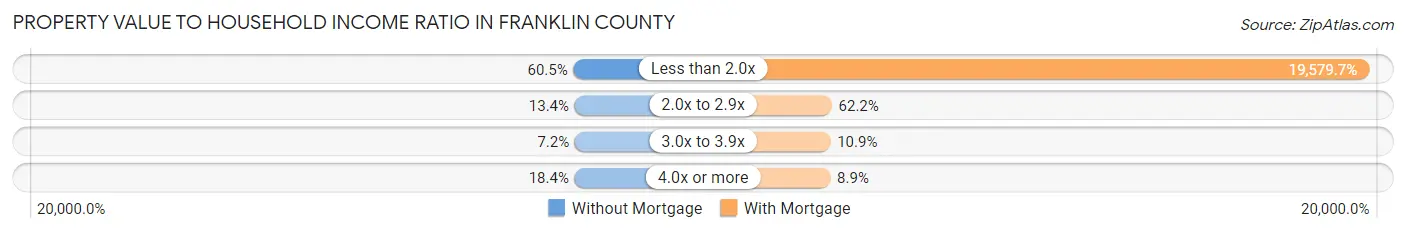
| Value-to-Income Ratio | Without Mortgage | With Mortgage |
| Less than 2.0x | 428 (60.5%) | 66,375 (19,579.7%) |
| 2.0x to 2.9x | 95 (13.4%) | 211 (62.2%) |
| 3.0x to 3.9x | 51 (7.2%) | 37 (10.9%) |
| 4.0x or more | 130 (18.4%) | 30 (8.8%) |
| Total | 708 (100.0%) | 339 (100.0%) |
Real Estate Taxes by Mortgage Status in Franklin County
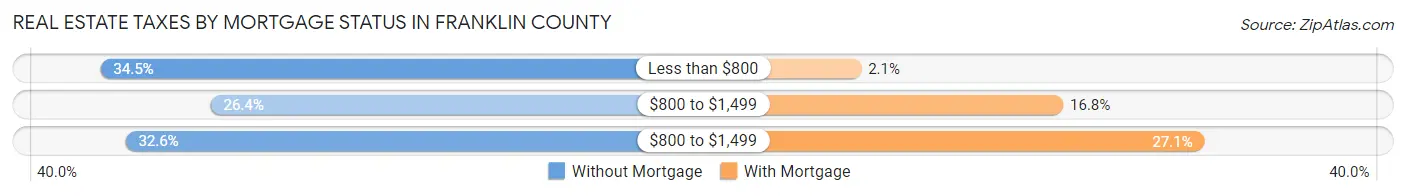
| Property Taxes | Without Mortgage | With Mortgage |
| Less than $800 | 244 (34.5%) | 7 (2.1%) |
| $800 to $1,499 | 187 (26.4%) | 57 (16.8%) |
| $800 to $1,499 | 231 (32.6%) | 92 (27.1%) |
| Total | 708 (100.0%) | 339 (100.0%) |
Health & Disability in Franklin County
Health Insurance Coverage by Age in Franklin County
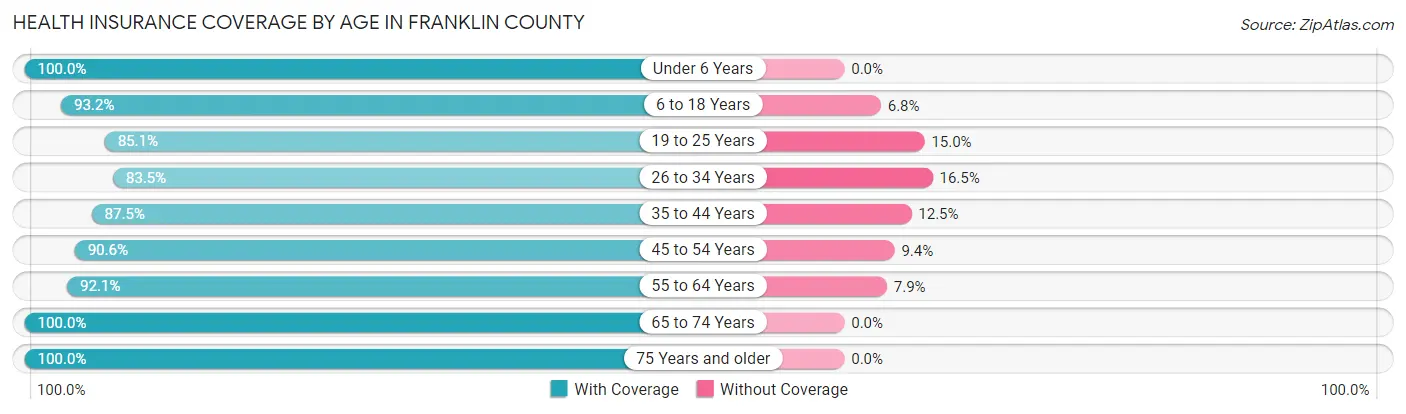
| Age Bracket | With Coverage | Without Coverage |
| Under 6 Years | 199 (100.0%) | 0 (0.0%) |
| 6 to 18 Years | 356 (93.2%) | 26 (6.8%) |
| 19 to 25 Years | 165 (85.1%) | 29 (14.9%) |
| 26 to 34 Years | 198 (83.5%) | 39 (16.5%) |
| 35 to 44 Years | 259 (87.5%) | 37 (12.5%) |
| 45 to 54 Years | 271 (90.6%) | 28 (9.4%) |
| 55 to 64 Years | 441 (92.1%) | 38 (7.9%) |
| 65 to 74 Years | 426 (100.0%) | 0 (0.0%) |
| 75 Years and older | 329 (100.0%) | 0 (0.0%) |
| Total | 2,644 (93.1%) | 197 (6.9%) |
Health Insurance Coverage by Citizenship Status in Franklin County
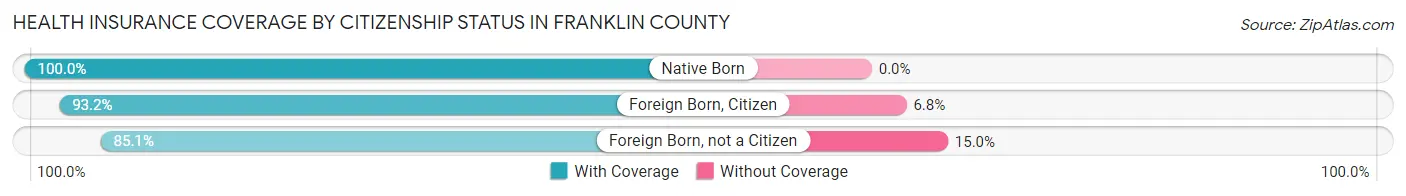
| Citizenship Status | With Coverage | Without Coverage |
| Native Born | 199 (100.0%) | 0 (0.0%) |
| Foreign Born, Citizen | 356 (93.2%) | 26 (6.8%) |
| Foreign Born, not a Citizen | 165 (85.1%) | 29 (14.9%) |
Health Insurance Coverage by Household Income in Franklin County
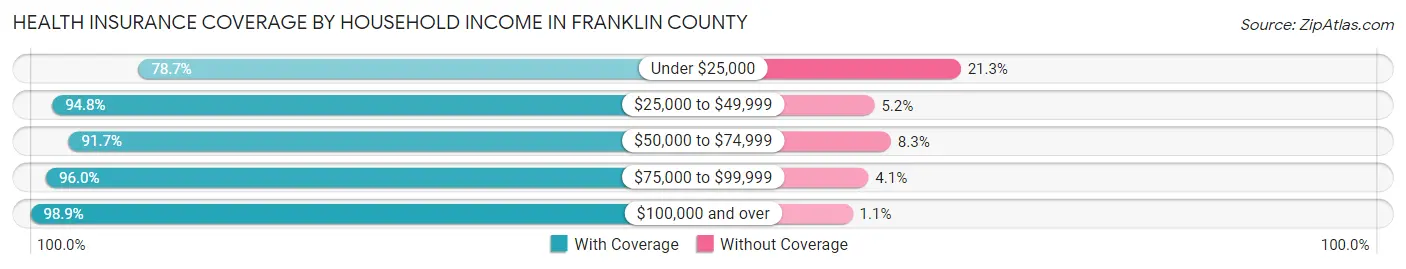
| Household Income | With Coverage | Without Coverage |
| Under $25,000 | 306 (78.7%) | 83 (21.3%) |
| $25,000 to $49,999 | 567 (94.8%) | 31 (5.2%) |
| $50,000 to $74,999 | 522 (91.7%) | 47 (8.3%) |
| $75,000 to $99,999 | 521 (96.0%) | 22 (4.1%) |
| $100,000 and over | 721 (98.9%) | 8 (1.1%) |
Public vs Private Health Insurance Coverage by Age in Franklin County
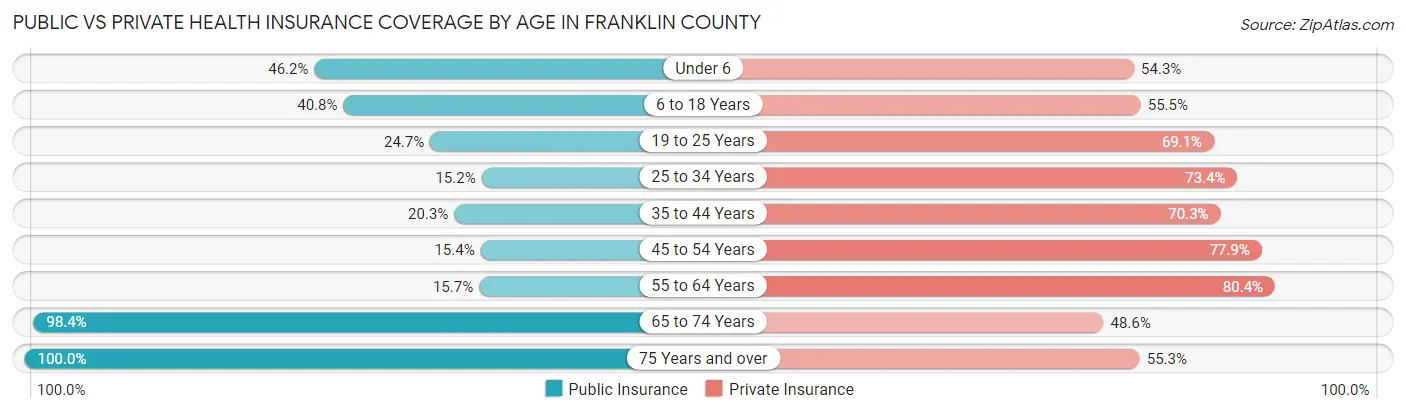
| Age Bracket | Public Insurance | Private Insurance |
| Under 6 | 92 (46.2%) | 108 (54.3%) |
| 6 to 18 Years | 156 (40.8%) | 212 (55.5%) |
| 19 to 25 Years | 48 (24.7%) | 134 (69.1%) |
| 25 to 34 Years | 36 (15.2%) | 174 (73.4%) |
| 35 to 44 Years | 60 (20.3%) | 208 (70.3%) |
| 45 to 54 Years | 46 (15.4%) | 233 (77.9%) |
| 55 to 64 Years | 75 (15.7%) | 385 (80.4%) |
| 65 to 74 Years | 419 (98.4%) | 207 (48.6%) |
| 75 Years and over | 329 (100.0%) | 182 (55.3%) |
| Total | 1,261 (44.4%) | 1,843 (64.9%) |
Disability Status by Sex by Age in Franklin County
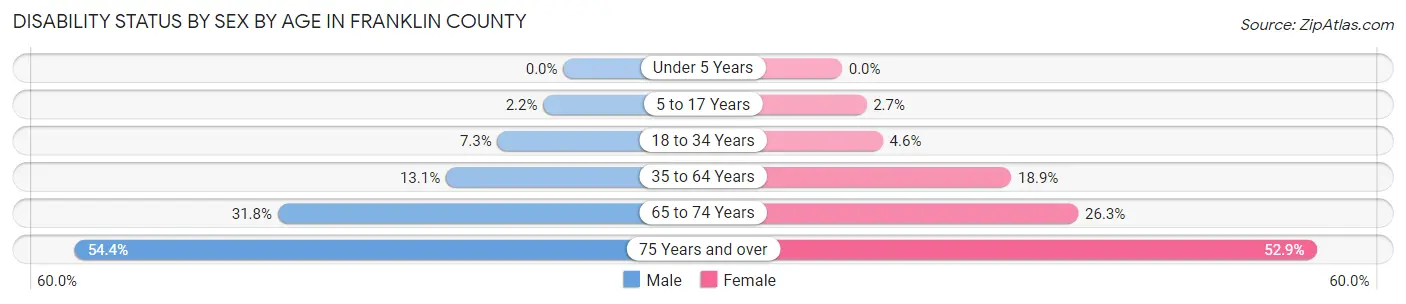
| Age Bracket | Male | Female |
| Under 5 Years | 0 (0.0%) | 0 (0.0%) |
| 5 to 17 Years | 5 (2.2%) | 5 (2.7%) |
| 18 to 34 Years | 17 (7.3%) | 10 (4.5%) |
| 35 to 64 Years | 69 (13.1%) | 103 (18.9%) |
| 65 to 74 Years | 69 (31.8%) | 55 (26.3%) |
| 75 Years and over | 74 (54.4%) | 102 (52.8%) |
Disability Class by Sex by Age in Franklin County
Disability Class: Hearing Difficulty
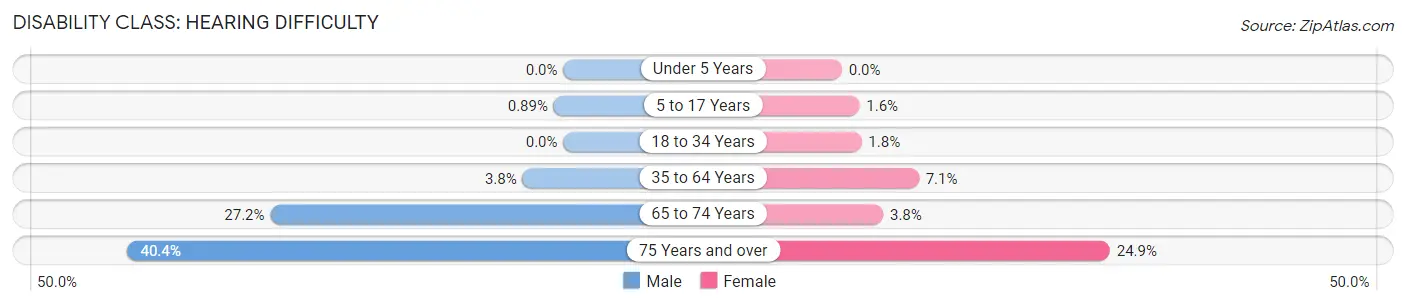
| Age Bracket | Male | Female |
| Under 5 Years | 0 (0.0%) | 0 (0.0%) |
| 5 to 17 Years | 2 (0.9%) | 3 (1.6%) |
| 18 to 34 Years | 0 (0.0%) | 4 (1.8%) |
| 35 to 64 Years | 20 (3.8%) | 39 (7.1%) |
| 65 to 74 Years | 59 (27.2%) | 8 (3.8%) |
| 75 Years and over | 55 (40.4%) | 48 (24.9%) |
Disability Class: Vision Difficulty
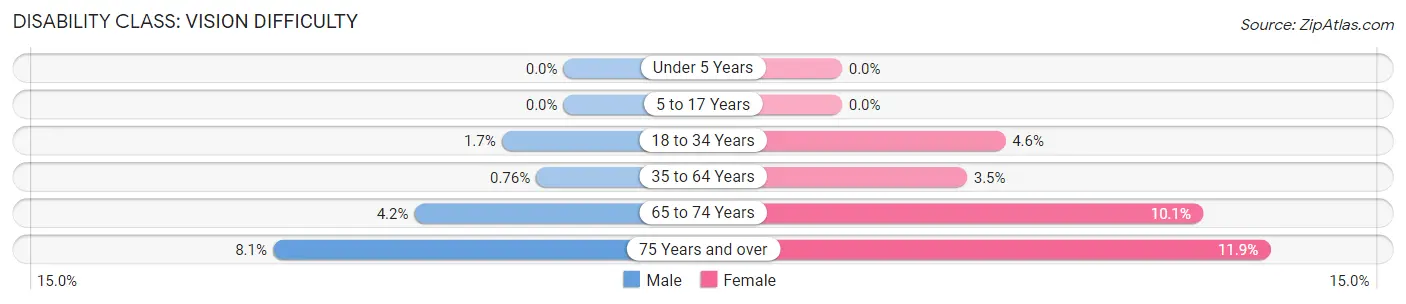
| Age Bracket | Male | Female |
| Under 5 Years | 0 (0.0%) | 0 (0.0%) |
| 5 to 17 Years | 0 (0.0%) | 0 (0.0%) |
| 18 to 34 Years | 4 (1.7%) | 10 (4.5%) |
| 35 to 64 Years | 4 (0.8%) | 19 (3.5%) |
| 65 to 74 Years | 9 (4.2%) | 21 (10.1%) |
| 75 Years and over | 11 (8.1%) | 23 (11.9%) |
Disability Class: Cognitive Difficulty
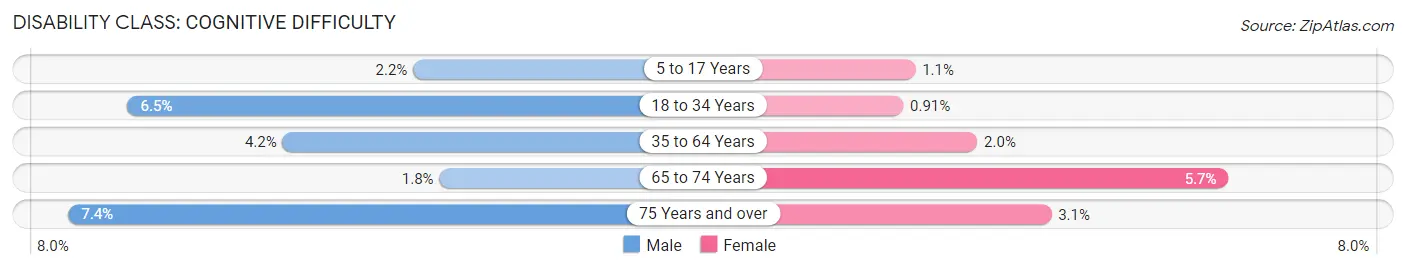
| Age Bracket | Male | Female |
| 5 to 17 Years | 5 (2.2%) | 2 (1.1%) |
| 18 to 34 Years | 15 (6.5%) | 2 (0.9%) |
| 35 to 64 Years | 22 (4.2%) | 11 (2.0%) |
| 65 to 74 Years | 4 (1.8%) | 12 (5.7%) |
| 75 Years and over | 10 (7.3%) | 6 (3.1%) |
Disability Class: Ambulatory Difficulty
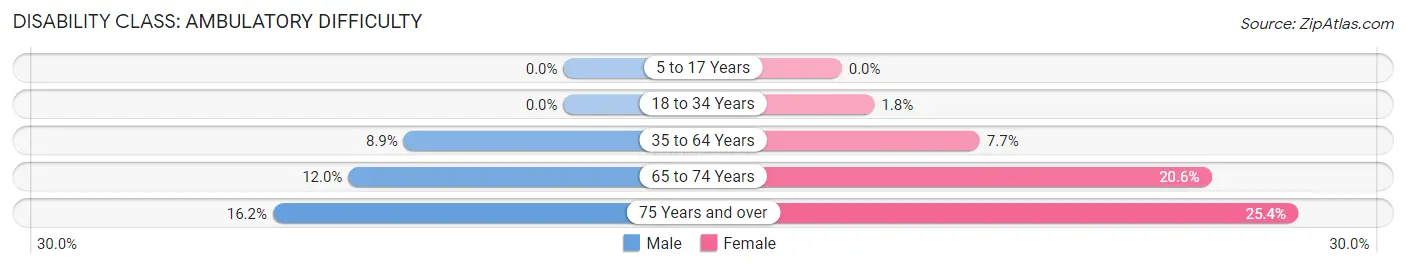
| Age Bracket | Male | Female |
| 5 to 17 Years | 0 (0.0%) | 0 (0.0%) |
| 18 to 34 Years | 0 (0.0%) | 4 (1.8%) |
| 35 to 64 Years | 47 (8.9%) | 42 (7.7%) |
| 65 to 74 Years | 26 (12.0%) | 43 (20.6%) |
| 75 Years and over | 22 (16.2%) | 49 (25.4%) |
Disability Class: Self-Care Difficulty
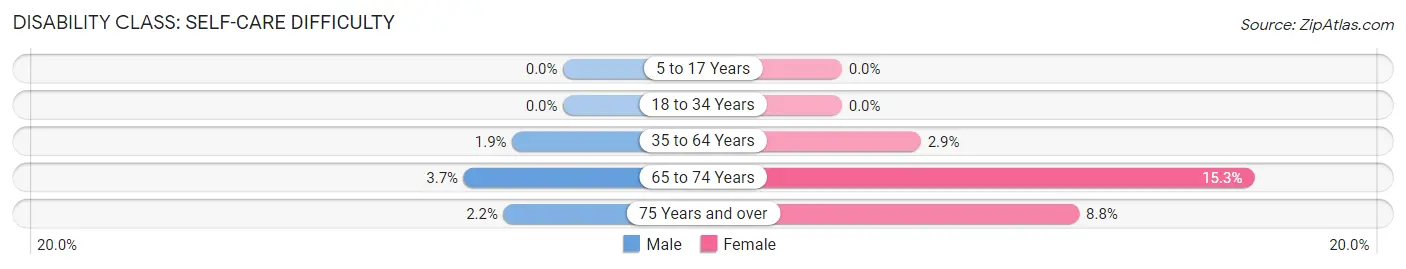
| Age Bracket | Male | Female |
| 5 to 17 Years | 0 (0.0%) | 0 (0.0%) |
| 18 to 34 Years | 0 (0.0%) | 0 (0.0%) |
| 35 to 64 Years | 10 (1.9%) | 16 (2.9%) |
| 65 to 74 Years | 8 (3.7%) | 32 (15.3%) |
| 75 Years and over | 3 (2.2%) | 17 (8.8%) |
Technology Access in Franklin County
Computing Device Access in Franklin County
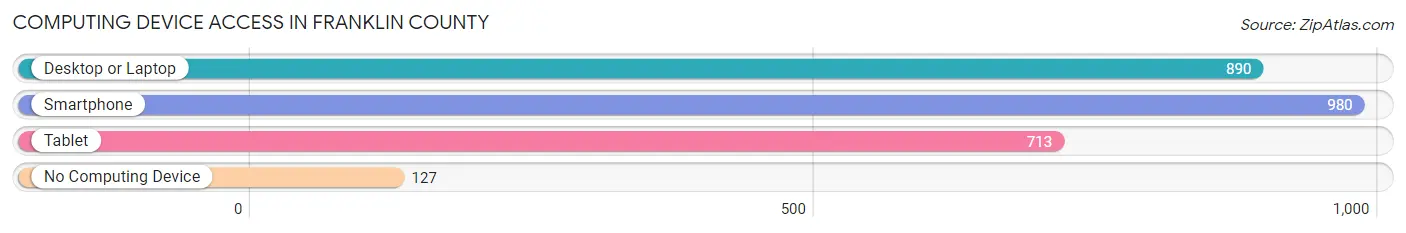
| Device Type | # Households | % Households |
| Desktop or Laptop | 890 | 70.9% |
| Smartphone | 980 | 78.1% |
| Tablet | 713 | 56.8% |
| No Computing Device | 127 | 10.1% |
| Total | 1,255 | 100.0% |
Internet Access in Franklin County
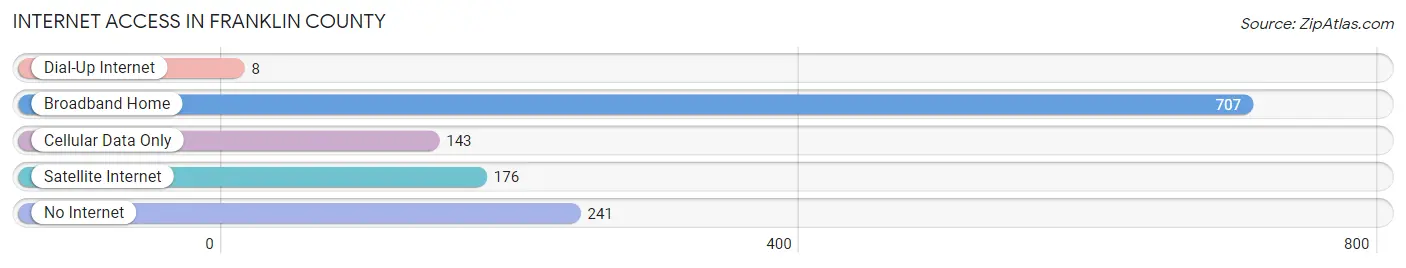
| Internet Type | # Households | % Households |
| Dial-Up Internet | 8 | 0.6% |
| Broadband Home | 707 | 56.3% |
| Cellular Data Only | 143 | 11.4% |
| Satellite Internet | 176 | 14.0% |
| No Internet | 241 | 19.2% |
| Total | 1,255 | 100.0% |
Franklin County Summary
Franklin County, Nebraska is located in the southeastern corner of the state and is bordered by the states of Kansas and Missouri. It is the second smallest county in Nebraska, with an area of only 545 square miles. The county seat is Franklin, and the largest city is Franklin. The population of Franklin County was estimated to be 5,945 in 2019.
Franklin County was established in 1867 and was named after Benjamin Franklin. The county was originally part of the Nebraska Territory, and was one of the original nine counties created when Nebraska became a state in 1867.
Geography
Franklin County is located in the southeastern corner of Nebraska, and is bordered by the states of Kansas and Missouri. It is the second smallest county in Nebraska, with an area of only 545 square miles. The county is mostly flat, with rolling hills in the western part of the county. The county is drained by the Republican River, which flows through the county from north to south.
The climate of Franklin County is generally mild, with hot summers and cold winters. The average annual temperature is around 50 degrees Fahrenheit, and the average annual precipitation is around 25 inches.
Economy
The economy of Franklin County is largely based on agriculture. The county is home to a variety of crops, including corn, soybeans, wheat, and hay. Livestock production is also important to the economy, with cattle, hogs, and sheep being raised in the county.
Franklin County is also home to a variety of manufacturing and service industries. The county is home to several food processing plants, as well as a variety of other manufacturing businesses. The county is also home to a variety of retail businesses, including grocery stores, clothing stores, and restaurants.
Demographics
As of the 2010 census, the population of Franklin County was 5,945. The population is predominantly white, with 92.3% of the population identifying as white. The remaining population is made up of African Americans (2.2%), Native Americans (1.2%), Asians (0.7%), and other races (3.6%).
The median household income in Franklin County is $45,813, and the median family income is $51,945. The per capita income is $20,945. The unemployment rate in Franklin County is 3.7%, which is lower than the national average of 3.9%.
History
Franklin County was established in 1867 and was named after Benjamin Franklin. The county was originally part of the Nebraska Territory, and was one of the original nine counties created when Nebraska became a state in 1867.
The county was originally populated by Native Americans, and the first white settlers arrived in the area in the late 1860s. The county was largely agricultural, and the population grew steadily throughout the late 19th and early 20th centuries.
In the late 20th century, the county began to diversify its economy, with the development of manufacturing and service industries. The population of the county has remained relatively stable since the 2000 census, and the county continues to be a largely agricultural area.
Common Questions
What is Per Capita Income in Franklin County?
Per Capita income in Franklin County is $34,650.
What is the Median Family Income in Franklin County?
Median Family Income in Franklin County is $73,000.
What is the Median Household income in Franklin County?
Median Household Income in Franklin County is $55,625.
What is Income or Wage Gap in Franklin County?
Income or Wage Gap in Franklin County is 38.7%.
Women in Franklin County earn 61.3 cents for every dollar earned by a man.
What is Inequality or Gini Index in Franklin County?
Inequality or Gini Index in Franklin County is 0.48.
What is the Total Population of Franklin County?
Total Population of Franklin County is 2,901.
What is the Total Male Population of Franklin County?
Total Male Population of Franklin County is 1,456.
What is the Total Female Population of Franklin County?
Total Female Population of Franklin County is 1,445.
What is the Ratio of Males per 100 Females in Franklin County?
There are 100.76 Males per 100 Females in Franklin County.
What is the Ratio of Females per 100 Males in Franklin County?
There are 99.24 Females per 100 Males in Franklin County.
What is the Median Population Age in Franklin County?
Median Population Age in Franklin County is 49.8 Years.
What is the Average Family Size in Franklin County
Average Family Size in Franklin County is 2.8 People.
What is the Average Household Size in Franklin County
Average Household Size in Franklin County is 2.2 People.
How Large is the Labor Force in Franklin County?
There are 1,414 People in the Labor Forcein in Franklin County.
What is the Percentage of People in the Labor Force in Franklin County?
58.8% of People are in the Labor Force in Franklin County.
What is the Unemployment Rate in Franklin County?
Unemployment Rate in Franklin County is 2.5%.