Dundy County, NE Map & Demographics
Dundy County Map
Dundy County Overview
$36,436
PER CAPITA INCOME
$91,667
AVG FAMILY INCOME
$58,977
AVG HOUSEHOLD INCOME
37.1%
WAGE / INCOME GAP [ % ]
62.9¢/ $1
WAGE / INCOME GAP [ $ ]
$9,171
FAMILY INCOME DEFICIT
0.46
INEQUALITY / GINI INDEX
1,825
TOTAL POPULATION
943
MALE POPULATION
882
FEMALE POPULATION
106.92
MALES / 100 FEMALES
93.53
FEMALES / 100 MALES
42.4
MEDIAN AGE
3.2
AVG FAMILY SIZE
2.3
AVG HOUSEHOLD SIZE
977
LABOR FORCE [ PEOPLE ]
66.9%
PERCENT IN LABOR FORCE
0.2%
UNEMPLOYMENT RATE
Dundy County Area Codes
Income in Dundy County
Income Overview in Dundy County
Per Capita Income in Dundy County is $36,436, while median incomes of families and households are $91,667 and $58,977 respectively.
| Characteristic | Number | Measure |
| Per Capita Income | 1,825 | $36,436 |
| Median Family Income | 436 | $91,667 |
| Mean Family Income | 436 | $110,925 |
| Median Household Income | 788 | $58,977 |
| Mean Household Income | 788 | $82,194 |
| Income Deficit | 436 | $9,171 |
| Wage / Income Gap (%) | 1,825 | 37.08% |
| Wage / Income Gap ($) | 1,825 | 62.92¢ per $1 |
| Gini / Inequality Index | 1,825 | 0.46 |
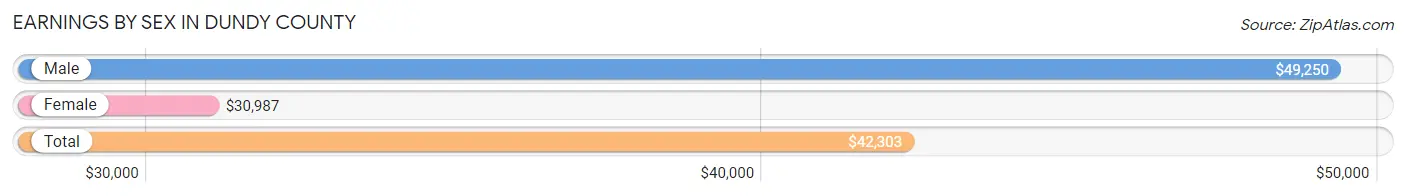
Earnings by Sex in Dundy County
Average Earnings in Dundy County are $42,303, $49,250 for men and $30,987 for women, a difference of 37.1%.
| Sex | Number | Average Earnings |
| Male | 562 (54.4%) | $49,250 |
| Female | 471 (45.6%) | $30,987 |
| Total | 1,033 (100.0%) | $42,303 |
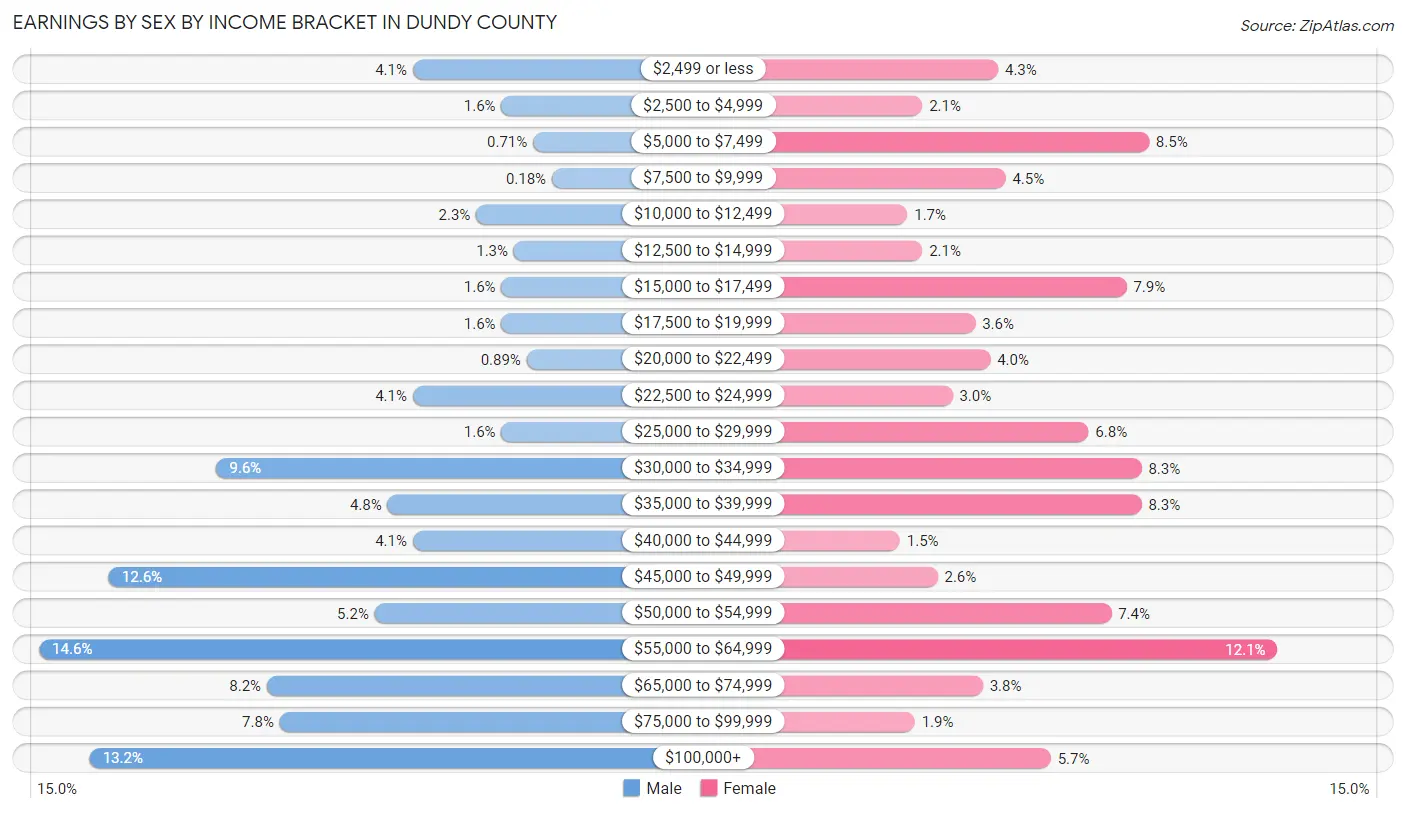
Earnings by Sex by Income Bracket in Dundy County
The most common earnings brackets in Dundy County are $55,000 to $64,999 for men (82 | 14.6%) and $55,000 to $64,999 for women (57 | 12.1%).
| Income | Male | Female |
| $2,499 or less | 23 (4.1%) | 20 (4.3%) |
| $2,500 to $4,999 | 9 (1.6%) | 10 (2.1%) |
| $5,000 to $7,499 | 4 (0.7%) | 40 (8.5%) |
| $7,500 to $9,999 | 1 (0.2%) | 21 (4.5%) |
| $10,000 to $12,499 | 13 (2.3%) | 8 (1.7%) |
| $12,500 to $14,999 | 7 (1.3%) | 10 (2.1%) |
| $15,000 to $17,499 | 9 (1.6%) | 37 (7.9%) |
| $17,500 to $19,999 | 9 (1.6%) | 17 (3.6%) |
| $20,000 to $22,499 | 5 (0.9%) | 19 (4.0%) |
| $22,500 to $24,999 | 23 (4.1%) | 14 (3.0%) |
| $25,000 to $29,999 | 9 (1.6%) | 32 (6.8%) |
| $30,000 to $34,999 | 54 (9.6%) | 39 (8.3%) |
| $35,000 to $39,999 | 27 (4.8%) | 39 (8.3%) |
| $40,000 to $44,999 | 23 (4.1%) | 7 (1.5%) |
| $45,000 to $49,999 | 71 (12.6%) | 12 (2.5%) |
| $50,000 to $54,999 | 29 (5.2%) | 35 (7.4%) |
| $55,000 to $64,999 | 82 (14.6%) | 57 (12.1%) |
| $65,000 to $74,999 | 46 (8.2%) | 18 (3.8%) |
| $75,000 to $99,999 | 44 (7.8%) | 9 (1.9%) |
| $100,000+ | 74 (13.2%) | 27 (5.7%) |
| Total | 562 (100.0%) | 471 (100.0%) |
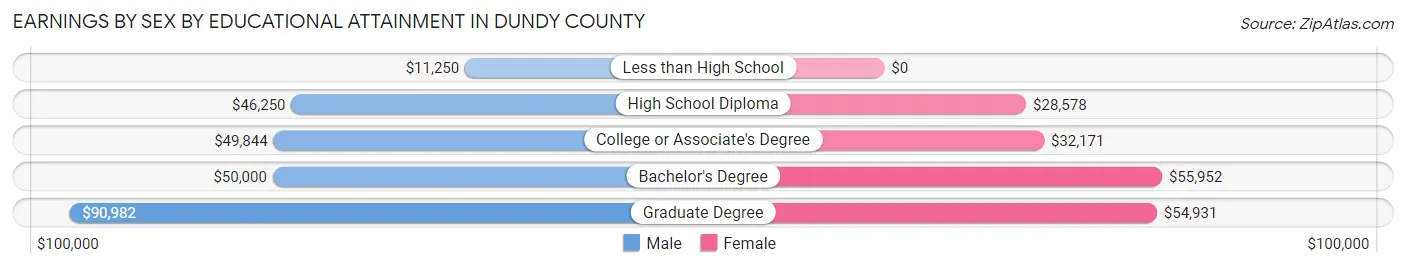
Earnings by Sex by Educational Attainment in Dundy County
Average earnings in Dundy County are $53,828 for men and $36,042 for women, a difference of 33.0%. Men with an educational attainment of graduate degree enjoy the highest average annual earnings of $90,982, while those with less than high school education earn the least with $11,250. Women with an educational attainment of bachelor's degree earn the most with the average annual earnings of $55,952, while those with high school diploma education have the smallest earnings of $28,578.
| Educational Attainment | Male Income | Female Income |
| Less than High School | $11,250 | $0 |
| High School Diploma | $46,250 | $28,578 |
| College or Associate's Degree | $49,844 | $32,171 |
| Bachelor's Degree | $50,000 | $55,952 |
| Graduate Degree | $90,982 | $54,931 |
| Total | $53,828 | $36,042 |
Family Income in Dundy County
Family Income Brackets in Dundy County
According to the Dundy County family income data, there are 130 families falling into the $100,000 to $149,999 income range, which is the most common income bracket and makes up 29.8% of all families. Conversely, the less than $10,000 income bracket is the least frequent group with only 6 families (1.4%) belonging to this category.
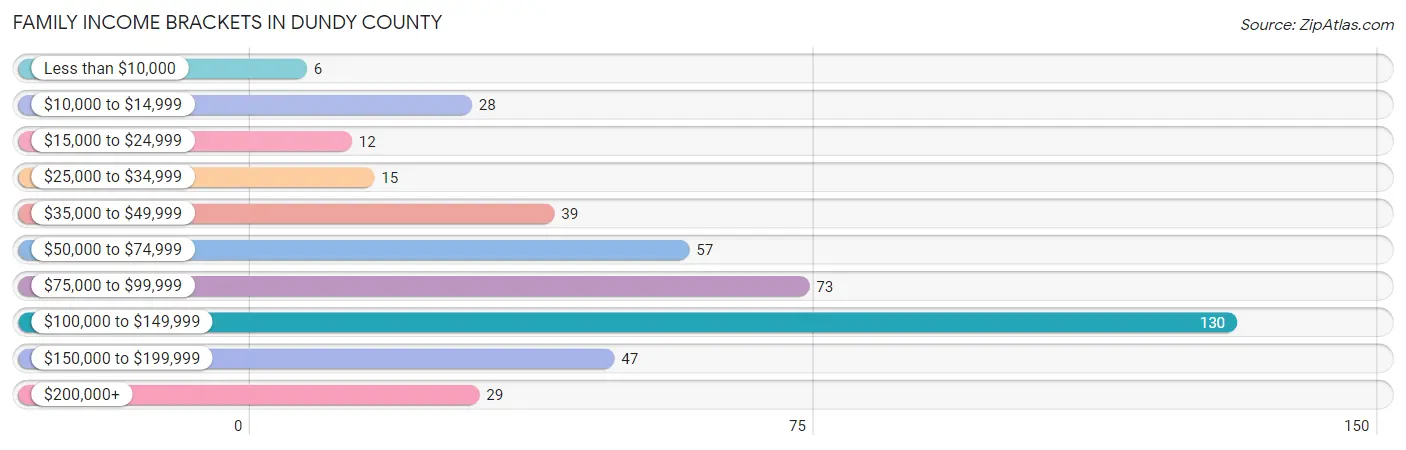
| Income Bracket | # Families | % Families |
| Less than $10,000 | 6 | 1.4% |
| $10,000 to $14,999 | 28 | 6.4% |
| $15,000 to $24,999 | 12 | 2.8% |
| $25,000 to $34,999 | 15 | 3.4% |
| $35,000 to $49,999 | 39 | 8.9% |
| $50,000 to $74,999 | 57 | 13.1% |
| $75,000 to $99,999 | 73 | 16.7% |
| $100,000 to $149,999 | 130 | 29.8% |
| $150,000 to $199,999 | 47 | 10.8% |
| $200,000+ | 29 | 6.7% |
Family Income by Famaliy Size in Dundy County
3-person families (79 | 18.1%) account for the highest median family income in Dundy County with $135,774 per family, while 3-person families (79 | 18.1%) have the highest median income of $45,258 per family member.
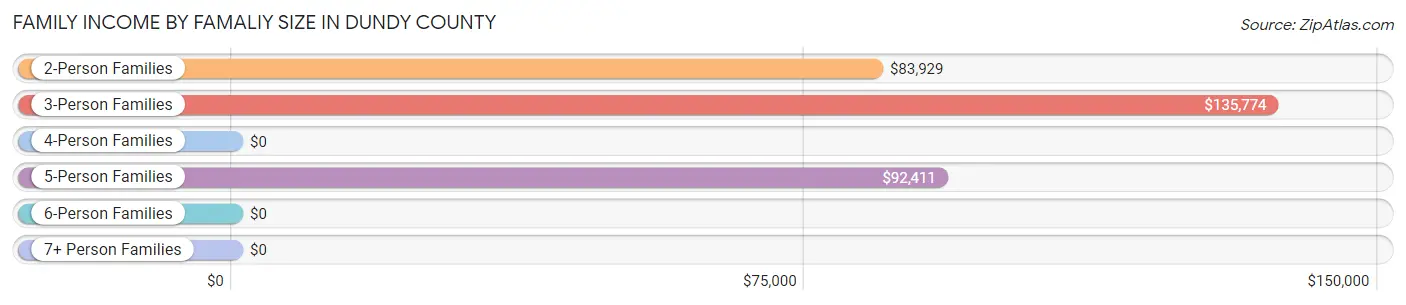
| Income Bracket | # Families | Median Income |
| 2-Person Families | 244 (56.0%) | $83,929 |
| 3-Person Families | 79 (18.1%) | $135,774 |
| 4-Person Families | 28 (6.4%) | $0 |
| 5-Person Families | 61 (14.0%) | $92,411 |
| 6-Person Families | 20 (4.6%) | $0 |
| 7+ Person Families | 4 (0.9%) | $0 |
| Total | 436 (100.0%) | $91,667 |
Family Income by Number of Earners in Dundy County
The median family income in Dundy County is $91,667, with families comprising 3+ earners (69) having the highest median family income of $136,726, while families with no earners (54) have the lowest median family income of $40,833, accounting for 15.8% and 12.4% of families, respectively.
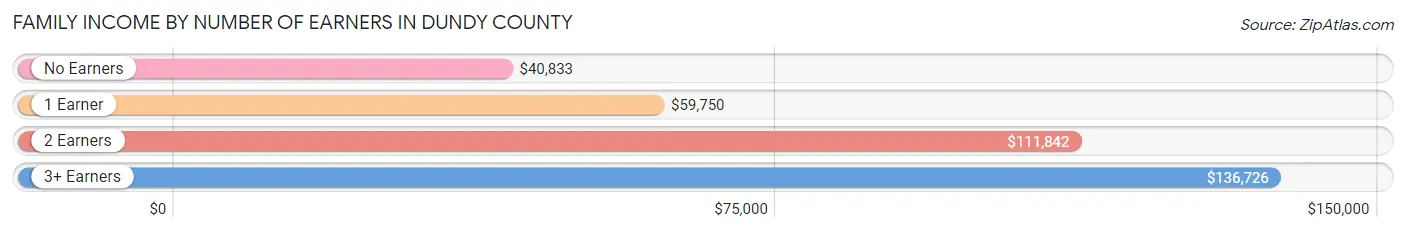
| Number of Earners | # Families | Median Income |
| No Earners | 54 (12.4%) | $40,833 |
| 1 Earner | 133 (30.5%) | $59,750 |
| 2 Earners | 180 (41.3%) | $111,842 |
| 3+ Earners | 69 (15.8%) | $136,726 |
| Total | 436 (100.0%) | $91,667 |
Household Income in Dundy County
Household Income Brackets in Dundy County
With 141 households falling in the category, the $100,000 to $149,999 income range is the most frequent in Dundy County, accounting for 17.9% of all households. In contrast, only 28 households (3.5%) fall into the less than $10,000 income bracket, making it the least populous group.
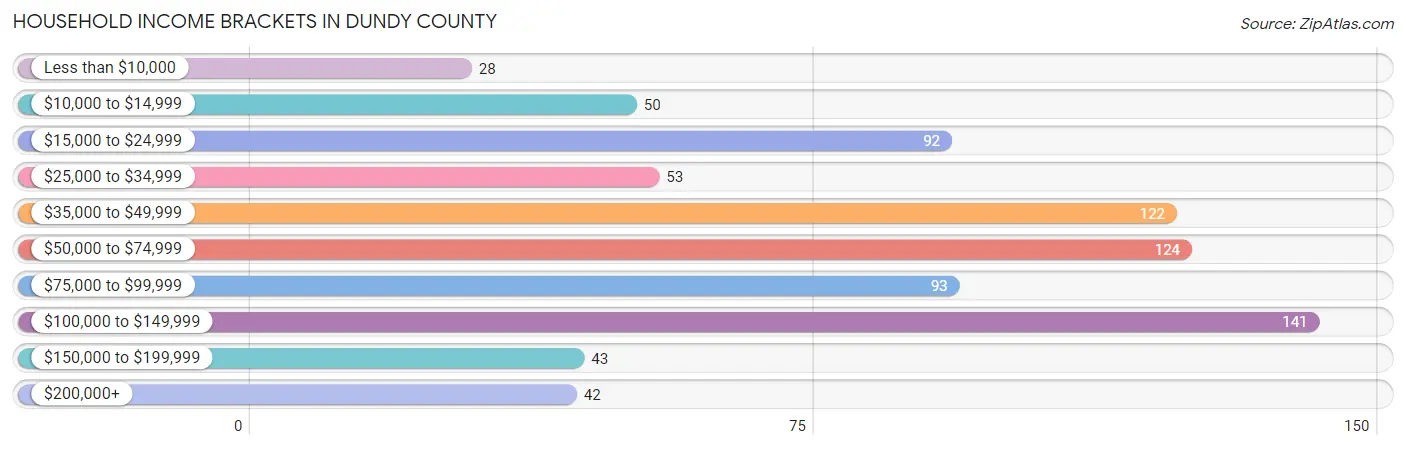
| Income Bracket | # Households | % Households |
| Less than $10,000 | 28 | 3.6% |
| $10,000 to $14,999 | 50 | 6.3% |
| $15,000 to $24,999 | 92 | 11.7% |
| $25,000 to $34,999 | 53 | 6.7% |
| $35,000 to $49,999 | 122 | 15.5% |
| $50,000 to $74,999 | 124 | 15.7% |
| $75,000 to $99,999 | 93 | 11.8% |
| $100,000 to $149,999 | 141 | 17.9% |
| $150,000 to $199,999 | 43 | 5.5% |
| $200,000+ | 42 | 5.3% |
Household Income by Householder Age in Dundy County
The median household income in Dundy County is $58,977, with the highest median household income of $83,472 found in the 45 to 64 years age bracket for the primary householder. A total of 305 households (38.7%) fall into this category. Meanwhile, the 15 to 24 years age bracket for the primary householder has the lowest median household income of $0, with 30 households (3.8%) in this group.
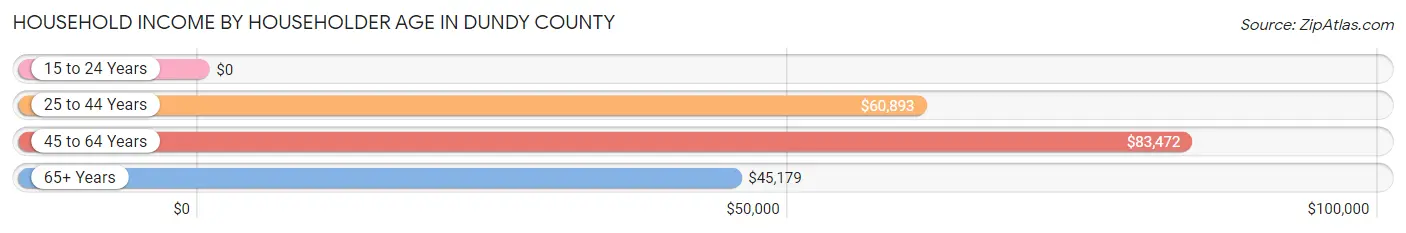
| Income Bracket | # Households | Median Income |
| 15 to 24 Years | 30 (3.8%) | $0 |
| 25 to 44 Years | 207 (26.3%) | $60,893 |
| 45 to 64 Years | 305 (38.7%) | $83,472 |
| 65+ Years | 246 (31.2%) | $45,179 |
| Total | 788 (100.0%) | $58,977 |
Poverty in Dundy County
Income Below Poverty by Sex and Age in Dundy County
With 11.3% poverty level for males and 13.7% for females among the residents of Dundy County, 15 year old males and 6 to 11 year old females are the most vulnerable to poverty, with 6 males (66.7%) and 22 females (41.5%) in their respective age groups living below the poverty level.
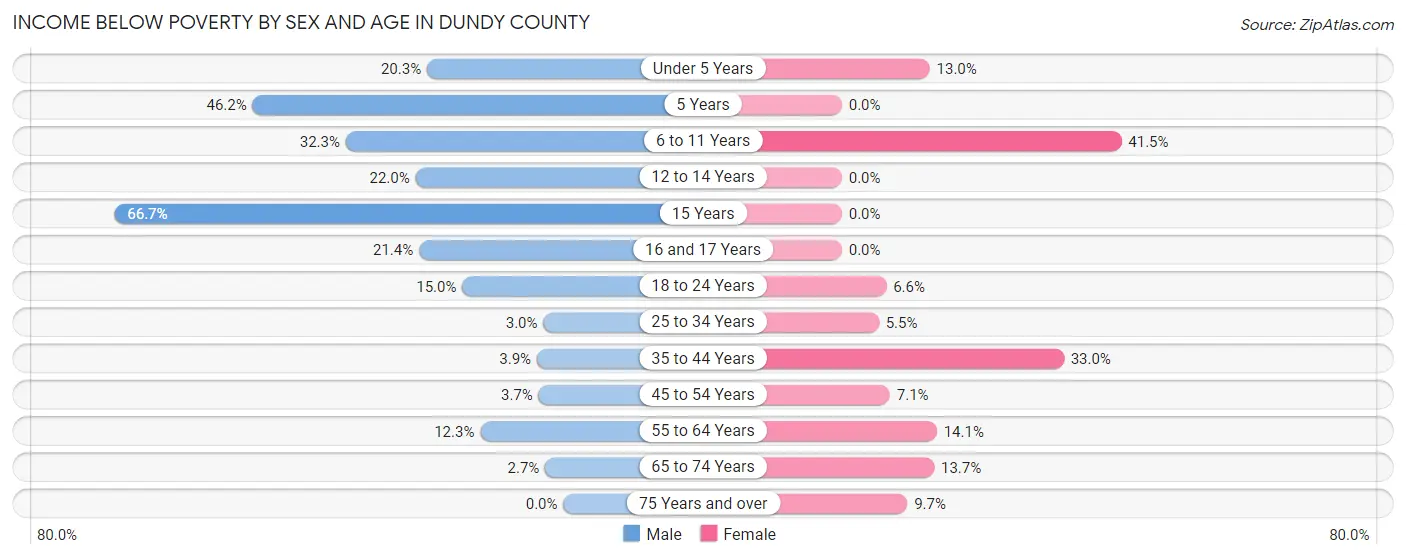
| Age Bracket | Male | Female |
| Under 5 Years | 16 (20.3%) | 9 (13.0%) |
| 5 Years | 6 (46.2%) | 0 (0.0%) |
| 6 to 11 Years | 21 (32.3%) | 22 (41.5%) |
| 12 to 14 Years | 9 (22.0%) | 0 (0.0%) |
| 15 Years | 6 (66.7%) | 0 (0.0%) |
| 16 and 17 Years | 9 (21.4%) | 0 (0.0%) |
| 18 to 24 Years | 6 (15.0%) | 7 (6.6%) |
| 25 to 34 Years | 3 (3.0%) | 4 (5.5%) |
| 35 to 44 Years | 4 (3.9%) | 29 (33.0%) |
| 45 to 54 Years | 3 (3.7%) | 8 (7.1%) |
| 55 to 64 Years | 19 (12.3%) | 22 (14.1%) |
| 65 to 74 Years | 4 (2.7%) | 10 (13.7%) |
| 75 Years and over | 0 (0.0%) | 7 (9.7%) |
| Total | 106 (11.3%) | 118 (13.7%) |
Income Above Poverty by Sex and Age in Dundy County
According to the poverty statistics in Dundy County, males aged 75 years and over and females aged 5 years are the age groups that are most secure financially, with 100.0% of males and 100.0% of females in these age groups living above the poverty line.
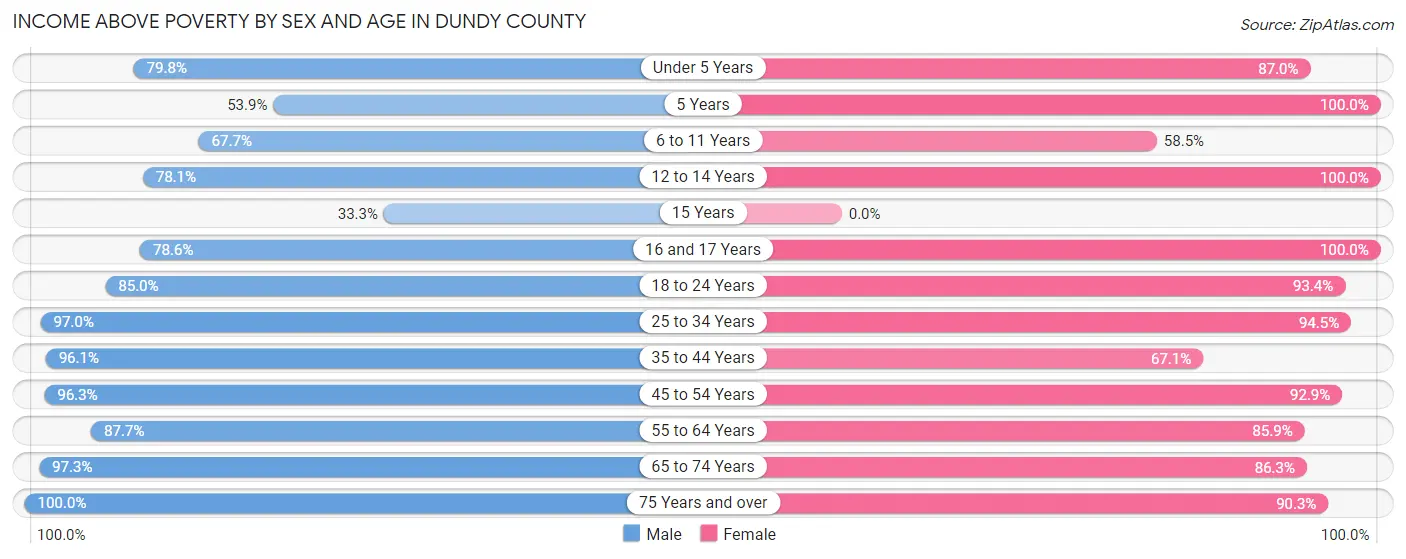
| Age Bracket | Male | Female |
| Under 5 Years | 63 (79.7%) | 60 (87.0%) |
| 5 Years | 7 (53.8%) | 7 (100.0%) |
| 6 to 11 Years | 44 (67.7%) | 31 (58.5%) |
| 12 to 14 Years | 32 (78.0%) | 28 (100.0%) |
| 15 Years | 3 (33.3%) | 0 (0.0%) |
| 16 and 17 Years | 33 (78.6%) | 24 (100.0%) |
| 18 to 24 Years | 34 (85.0%) | 99 (93.4%) |
| 25 to 34 Years | 98 (97.0%) | 69 (94.5%) |
| 35 to 44 Years | 98 (96.1%) | 59 (67.0%) |
| 45 to 54 Years | 79 (96.3%) | 104 (92.9%) |
| 55 to 64 Years | 135 (87.7%) | 134 (85.9%) |
| 65 to 74 Years | 144 (97.3%) | 63 (86.3%) |
| 75 Years and over | 60 (100.0%) | 65 (90.3%) |
| Total | 830 (88.7%) | 743 (86.3%) |
Income Below Poverty Among Married-Couple Families in Dundy County
The poverty statistics for married-couple families in Dundy County show that 5.3% or 20 of the total 380 families live below the poverty line. Families with 1 or 2 children have the highest poverty rate of 14.4%, comprising of 13 families. On the other hand, families with 5 or more children have the lowest poverty rate of 0.0%, which includes 0 families.
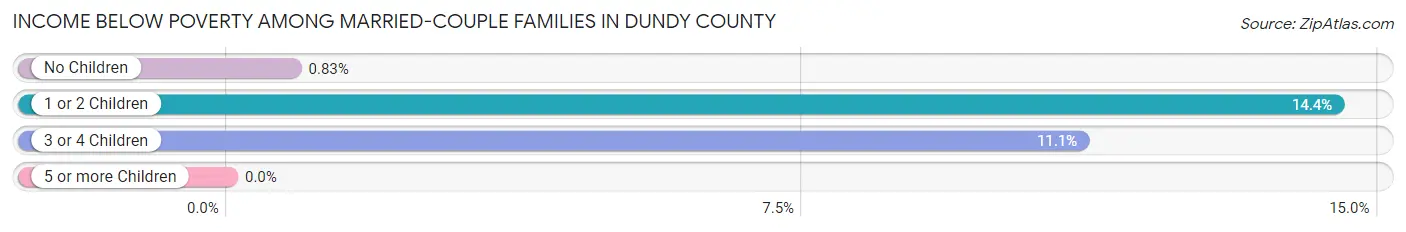
| Children | Above Poverty | Below Poverty |
| No Children | 239 (99.2%) | 2 (0.8%) |
| 1 or 2 Children | 77 (85.6%) | 13 (14.4%) |
| 3 or 4 Children | 40 (88.9%) | 5 (11.1%) |
| 5 or more Children | 4 (100.0%) | 0 (0.0%) |
| Total | 360 (94.7%) | 20 (5.3%) |
Income Below Poverty Among Single-Parent Households in Dundy County
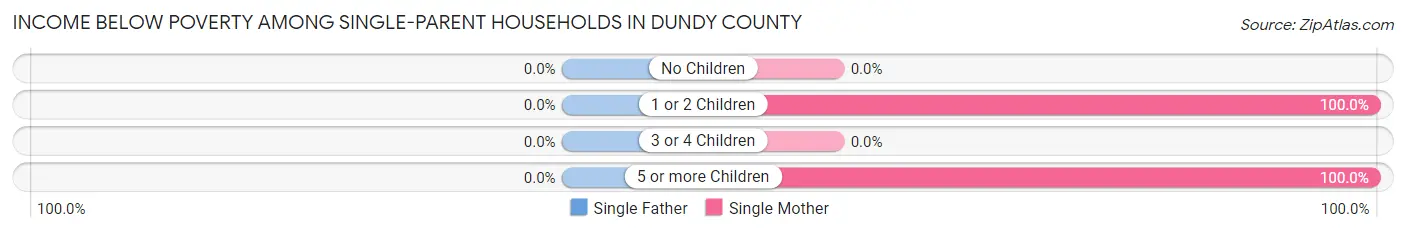
| Children | Single Father | Single Mother |
| No Children | 0 (0.0%) | 0 (0.0%) |
| 1 or 2 Children | 0 (0.0%) | 20 (100.0%) |
| 3 or 4 Children | 0 (0.0%) | 0 (0.0%) |
| 5 or more Children | 0 (0.0%) | 8 (100.0%) |
| Total | 0 (0.0%) | 28 (58.3%) |
Income Below Poverty Among Married-Couple vs Single-Parent Households in Dundy County
The poverty data for Dundy County shows that 20 of the married-couple family households (5.3%) and 28 of the single-parent households (50.0%) are living below the poverty level. Within the married-couple family households, those with 1 or 2 children have the highest poverty rate, with 13 households (14.4%) falling below the poverty line. Among the single-parent households, those with 5 or more children have the highest poverty rate, with 8 household (100.0%) living below poverty.
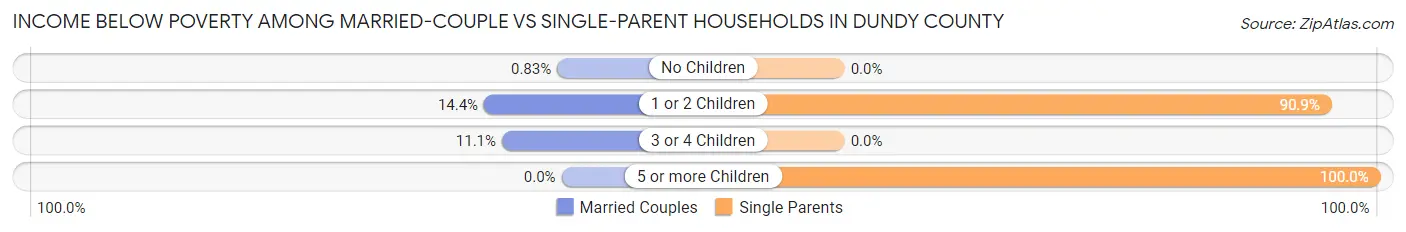
| Children | Married-Couple Families | Single-Parent Households |
| No Children | 2 (0.8%) | 0 (0.0%) |
| 1 or 2 Children | 13 (14.4%) | 20 (90.9%) |
| 3 or 4 Children | 5 (11.1%) | 0 (0.0%) |
| 5 or more Children | 0 (0.0%) | 8 (100.0%) |
| Total | 20 (5.3%) | 28 (50.0%) |
Race in Dundy County
The most populous races in Dundy County are White / Caucasian (1,775 | 97.3%), Hispanic or Latino (27 | 1.5%), and Some other Race (23 | 1.3%).
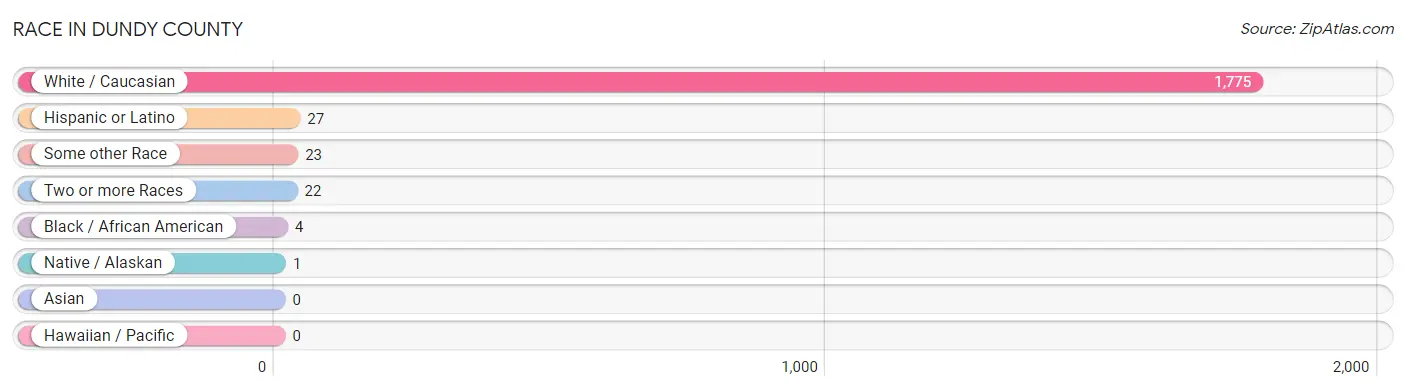
| Race | # Population | % Population |
| Asian | 0 | 0.0% |
| Black / African American | 4 | 0.2% |
| Hawaiian / Pacific | 0 | 0.0% |
| Hispanic or Latino | 27 | 1.5% |
| Native / Alaskan | 1 | 0.1% |
| White / Caucasian | 1,775 | 97.3% |
| Two or more Races | 22 | 1.2% |
| Some other Race | 23 | 1.3% |
| Total | 1,825 | 100.0% |
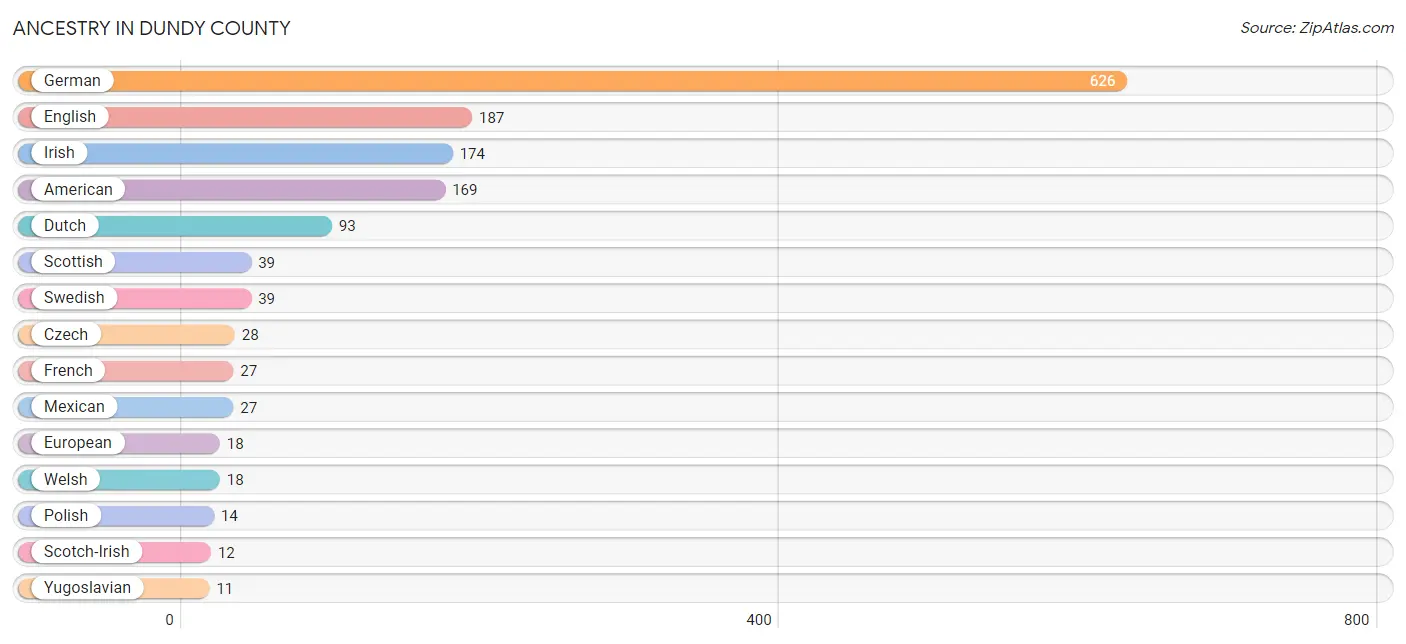
Ancestry in Dundy County
The most populous ancestries reported in Dundy County are German (626 | 34.3%), English (187 | 10.2%), Irish (174 | 9.5%), American (169 | 9.3%), and Dutch (93 | 5.1%), together accounting for 68.4% of all Dundy County residents.
| Ancestry | # Population | % Population |
| American | 169 | 9.3% |
| Apache | 1 | 0.1% |
| Arab | 4 | 0.2% |
| Austrian | 1 | 0.1% |
| British | 10 | 0.5% |
| Cherokee | 6 | 0.3% |
| Czech | 28 | 1.5% |
| Czechoslovakian | 4 | 0.2% |
| Dutch | 93 | 5.1% |
| English | 187 | 10.2% |
| European | 18 | 1.0% |
| French | 27 | 1.5% |
| French Canadian | 4 | 0.2% |
| German | 626 | 34.3% |
| Irish | 174 | 9.5% |
| Italian | 10 | 0.5% |
| Mexican | 27 | 1.5% |
| Norwegian | 6 | 0.3% |
| Polish | 14 | 0.8% |
| Russian | 2 | 0.1% |
| Scandinavian | 4 | 0.2% |
| Scotch-Irish | 12 | 0.7% |
| Scottish | 39 | 2.1% |
| Sioux | 5 | 0.3% |
| Subsaharan African | 1 | 0.1% |
| Sudanese | 1 | 0.1% |
| Swedish | 39 | 2.1% |
| Syrian | 4 | 0.2% |
| Welsh | 18 | 1.0% |
| Yugoslavian | 11 | 0.6% | View All 30 Rows |
Immigrants in Dundy County
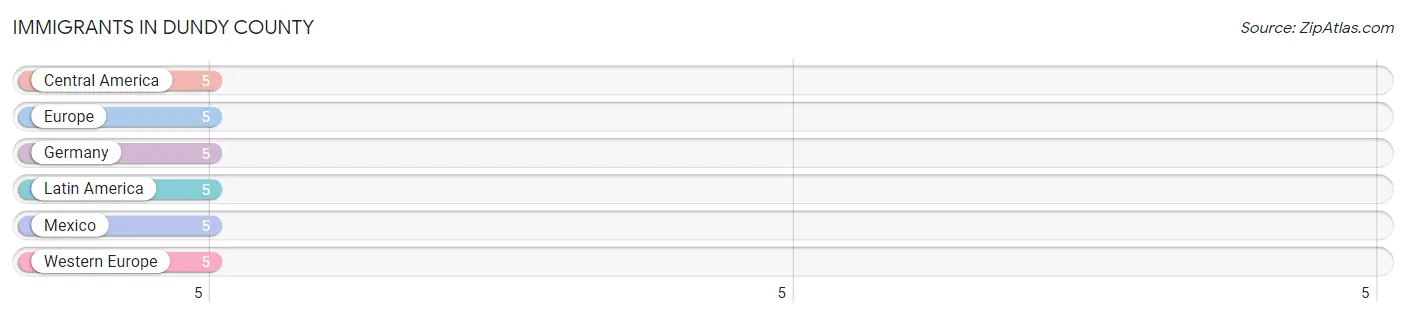
The most numerous immigrant groups reported in Dundy County came from Central America (5 | 0.3%), Europe (5 | 0.3%), Germany (5 | 0.3%), Latin America (5 | 0.3%), and Mexico (5 | 0.3%), together accounting for 1.4% of all Dundy County residents.
| Immigration Origin | # Population | % Population |
| Central America | 5 | 0.3% |
| Europe | 5 | 0.3% |
| Germany | 5 | 0.3% |
| Latin America | 5 | 0.3% |
| Mexico | 5 | 0.3% |
| Western Europe | 5 | 0.3% | View All 6 Rows |
Sex and Age in Dundy County
Sex and Age in Dundy County
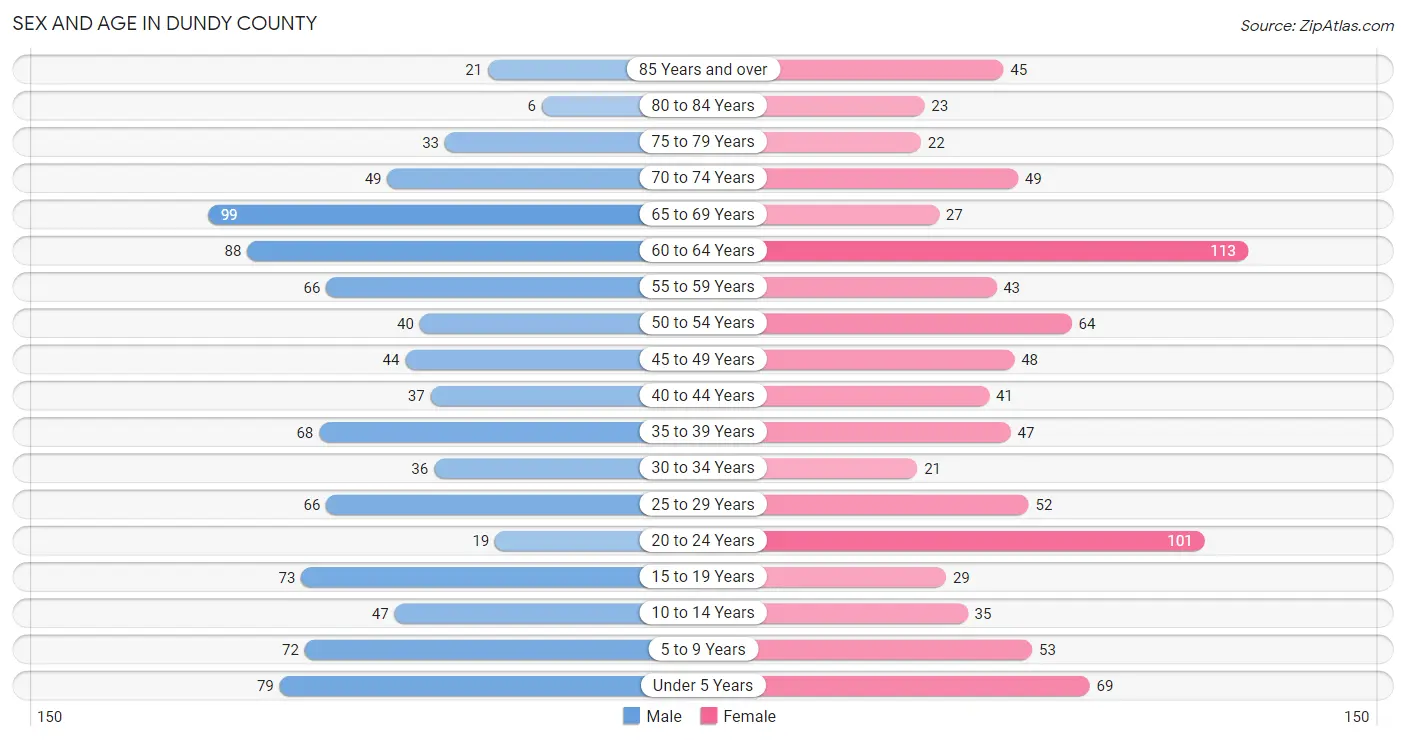
The most populous age groups in Dundy County are 65 to 69 Years (99 | 10.5%) for men and 60 to 64 Years (113 | 12.8%) for women.
| Age Bracket | Male | Female |
| Under 5 Years | 79 (8.4%) | 69 (7.8%) |
| 5 to 9 Years | 72 (7.6%) | 53 (6.0%) |
| 10 to 14 Years | 47 (5.0%) | 35 (4.0%) |
| 15 to 19 Years | 73 (7.7%) | 29 (3.3%) |
| 20 to 24 Years | 19 (2.0%) | 101 (11.5%) |
| 25 to 29 Years | 66 (7.0%) | 52 (5.9%) |
| 30 to 34 Years | 36 (3.8%) | 21 (2.4%) |
| 35 to 39 Years | 68 (7.2%) | 47 (5.3%) |
| 40 to 44 Years | 37 (3.9%) | 41 (4.6%) |
| 45 to 49 Years | 44 (4.7%) | 48 (5.4%) |
| 50 to 54 Years | 40 (4.2%) | 64 (7.3%) |
| 55 to 59 Years | 66 (7.0%) | 43 (4.9%) |
| 60 to 64 Years | 88 (9.3%) | 113 (12.8%) |
| 65 to 69 Years | 99 (10.5%) | 27 (3.1%) |
| 70 to 74 Years | 49 (5.2%) | 49 (5.6%) |
| 75 to 79 Years | 33 (3.5%) | 22 (2.5%) |
| 80 to 84 Years | 6 (0.6%) | 23 (2.6%) |
| 85 Years and over | 21 (2.2%) | 45 (5.1%) |
| Total | 943 (100.0%) | 882 (100.0%) |
Families and Households in Dundy County
Median Family Size in Dundy County
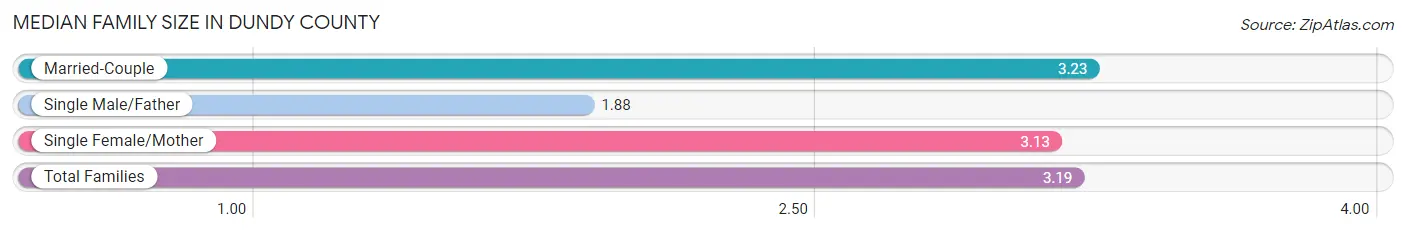
The median family size in Dundy County is 3.19 persons per family, with married-couple families (380 | 87.2%) accounting for the largest median family size of 3.23 persons per family. On the other hand, single male/father families (8 | 1.8%) represent the smallest median family size with 1.88 persons per family.
| Family Type | # Families | Family Size |
| Married-Couple | 380 (87.2%) | 3.23 |
| Single Male/Father | 8 (1.8%) | 1.88 |
| Single Female/Mother | 48 (11.0%) | 3.13 |
| Total Families | 436 (100.0%) | 3.19 |
Median Household Size in Dundy County
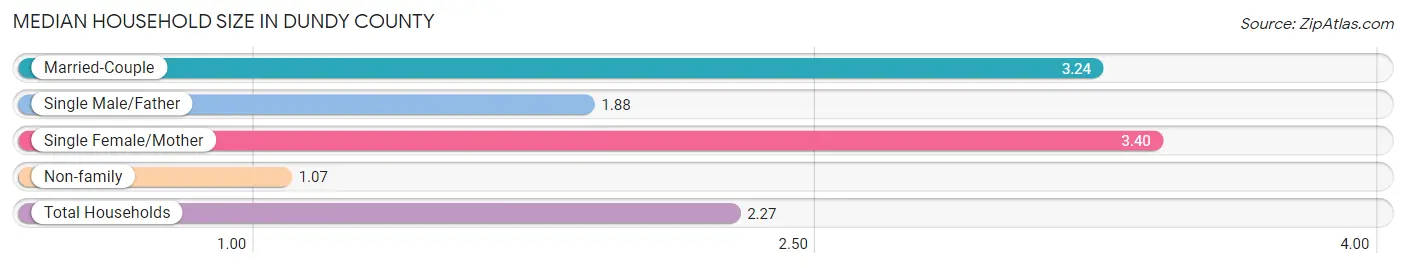
The median household size in Dundy County is 2.27 persons per household, with single female/mother households (48 | 6.1%) accounting for the largest median household size of 3.4 persons per household. non-family households (352 | 44.7%) represent the smallest median household size with 1.07 persons per household.
| Household Type | # Households | Household Size |
| Married-Couple | 380 (48.2%) | 3.24 |
| Single Male/Father | 8 (1.0%) | 1.88 |
| Single Female/Mother | 48 (6.1%) | 3.40 |
| Non-family | 352 (44.7%) | 1.07 |
| Total Households | 788 (100.0%) | 2.27 |
Household Size by Marriage Status in Dundy County
Out of a total of 788 households in Dundy County, 436 (55.3%) are family households, while 352 (44.7%) are nonfamily households. The most numerous type of family households are 2-person households, comprising 240, and the most common type of nonfamily households are 1-person households, comprising 331.
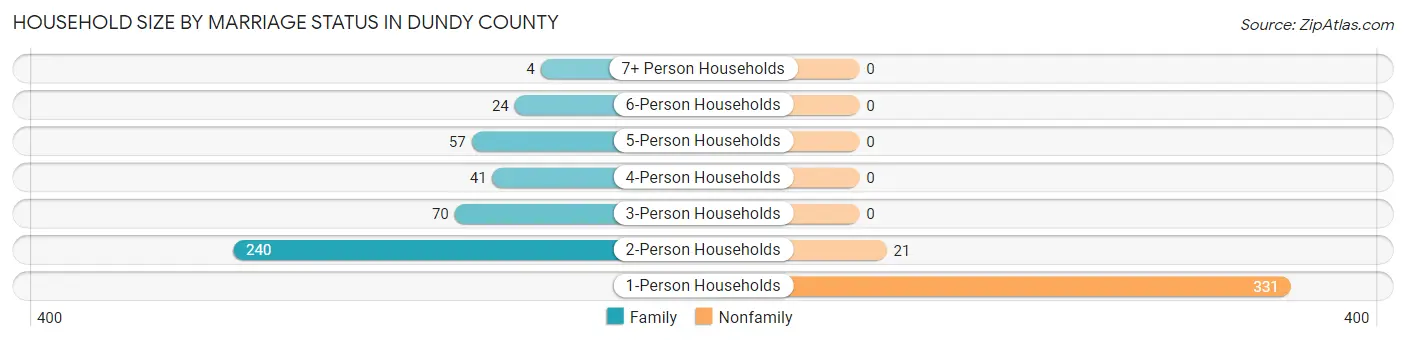
| Household Size | Family Households | Nonfamily Households |
| 1-Person Households | - | 331 (42.0%) |
| 2-Person Households | 240 (30.5%) | 21 (2.7%) |
| 3-Person Households | 70 (8.9%) | 0 (0.0%) |
| 4-Person Households | 41 (5.2%) | 0 (0.0%) |
| 5-Person Households | 57 (7.2%) | 0 (0.0%) |
| 6-Person Households | 24 (3.0%) | 0 (0.0%) |
| 7+ Person Households | 4 (0.5%) | 0 (0.0%) |
| Total | 436 (55.3%) | 352 (44.7%) |
Female Fertility in Dundy County
Fertility by Age in Dundy County
Average fertility rate in Dundy County is 74.0 births per 1,000 women. Women in the age bracket of 20 to 34 years have the highest fertility rate with 98.0 births per 1,000 women. Women in the age bracket of 20 to 34 years acount for 65.4% of all women with births.
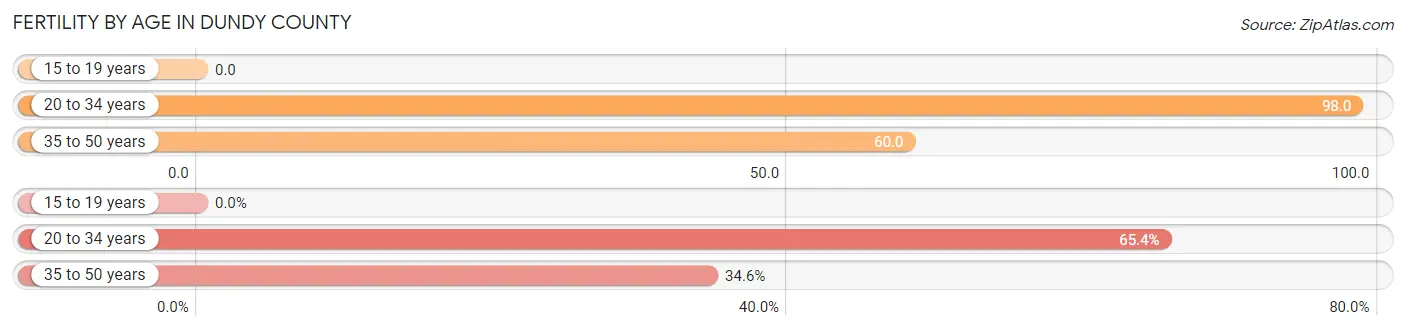
| Age Bracket | Women with Births | Births / 1,000 Women |
| 15 to 19 years | 0 (0.0%) | 0.0 |
| 20 to 34 years | 17 (65.4%) | 98.0 |
| 35 to 50 years | 9 (34.6%) | 60.0 |
| Total | 26 (100.0%) | 74.0 |
Fertility by Age by Marriage Status in Dundy County
84.6% of women with births (26) in Dundy County are married. The highest percentage of unmarried women with births falls into 20 to 34 years age bracket with 23.5% of them unmarried at the time of birth, while the lowest percentage of unmarried women with births belong to 35 to 50 years age bracket with 0.0% of them unmarried.
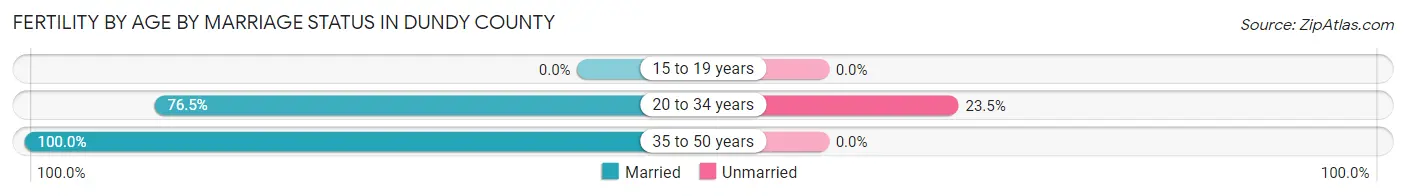
| Age Bracket | Married | Unmarried |
| 15 to 19 years | 0 (0.0%) | 0 (0.0%) |
| 20 to 34 years | 13 (76.5%) | 4 (23.5%) |
| 35 to 50 years | 9 (100.0%) | 0 (0.0%) |
| Total | 22 (84.6%) | 4 (15.4%) |
Fertility by Education in Dundy County
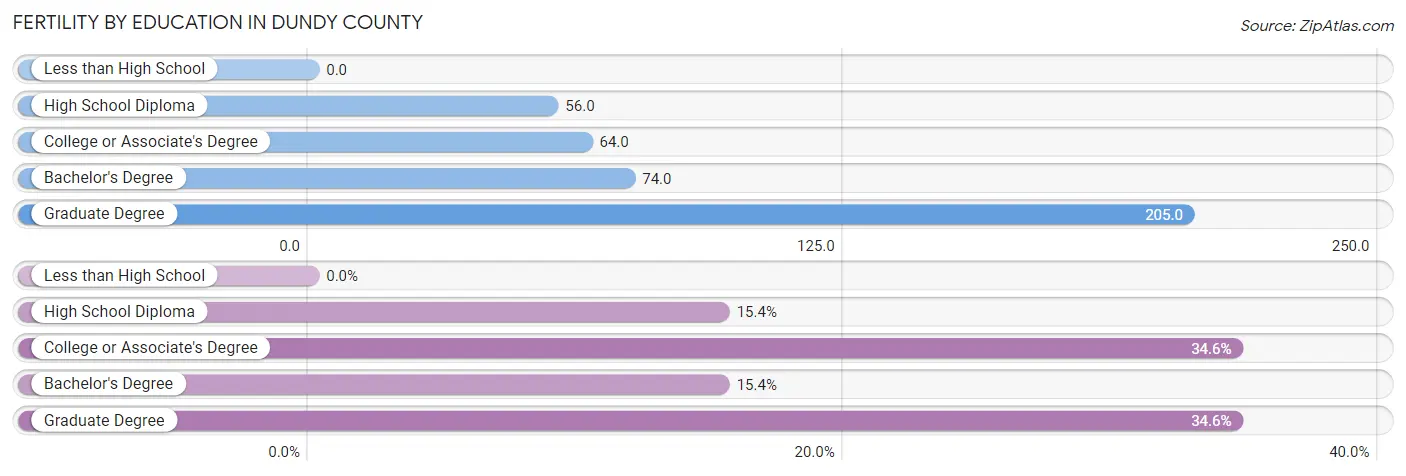
| Educational Attainment | Women with Births | Births / 1,000 Women |
| Less than High School | 0 (0.0%) | 0.0 |
| High School Diploma | 4 (15.4%) | 56.0 |
| College or Associate's Degree | 9 (34.6%) | 64.0 |
| Bachelor's Degree | 4 (15.4%) | 74.0 |
| Graduate Degree | 9 (34.6%) | 205.0 |
| Total | 26 (100.0%) | 74.0 |
Fertility by Education by Marriage Status in Dundy County
15.4% of women with births in Dundy County are unmarried. Women with the educational attainment of college or associate's degree are most likely to be married with 100.0% of them married at childbirth, while women with the educational attainment of high school diploma are least likely to be married with 100.0% of them unmarried at childbirth.
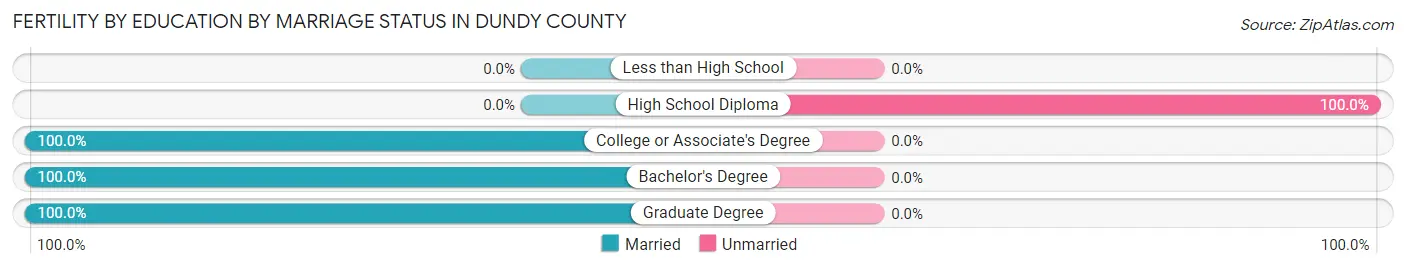
| Educational Attainment | Married | Unmarried |
| Less than High School | 0 (0.0%) | 0 (0.0%) |
| High School Diploma | 0 (0.0%) | 4 (100.0%) |
| College or Associate's Degree | 9 (100.0%) | 0 (0.0%) |
| Bachelor's Degree | 4 (100.0%) | 0 (0.0%) |
| Graduate Degree | 9 (100.0%) | 0 (0.0%) |
| Total | 22 (84.6%) | 4 (15.4%) |
Employment Characteristics in Dundy County
Employment by Class of Employer in Dundy County
Among the 945 employed individuals in Dundy County, private company employees (421 | 44.6%), self-employed (not incorporated) (167 | 17.7%), and local government employees (130 | 13.8%) make up the most common classes of employment.
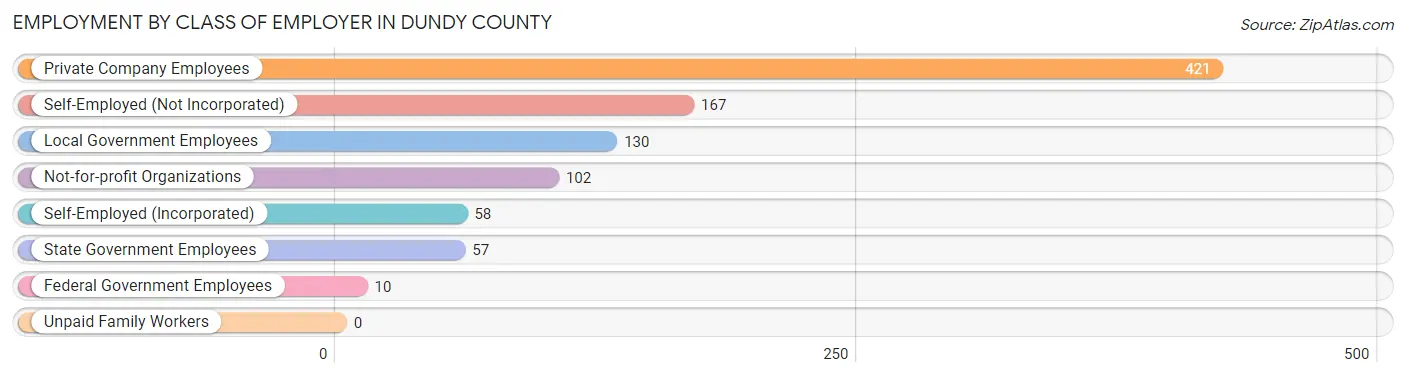
| Employer Class | # Employees | % Employees |
| Private Company Employees | 421 | 44.6% |
| Self-Employed (Incorporated) | 58 | 6.1% |
| Self-Employed (Not Incorporated) | 167 | 17.7% |
| Not-for-profit Organizations | 102 | 10.8% |
| Local Government Employees | 130 | 13.8% |
| State Government Employees | 57 | 6.0% |
| Federal Government Employees | 10 | 1.1% |
| Unpaid Family Workers | 0 | 0.0% |
| Total | 945 | 100.0% |
Employment Status by Age in Dundy County
According to the labor force statistics for Dundy County, out of the total population over 16 years of age (1,461), 66.9% or 977 individuals are in the labor force, with 0.2% or 2 of them unemployed. The age group with the highest labor force participation rate is 30 to 34 years, with 100.0% or 57 individuals in the labor force. Within the labor force, the 25 to 29 years age range has the highest percentage of unemployed individuals, with 1.8% or 2 of them being unemployed.
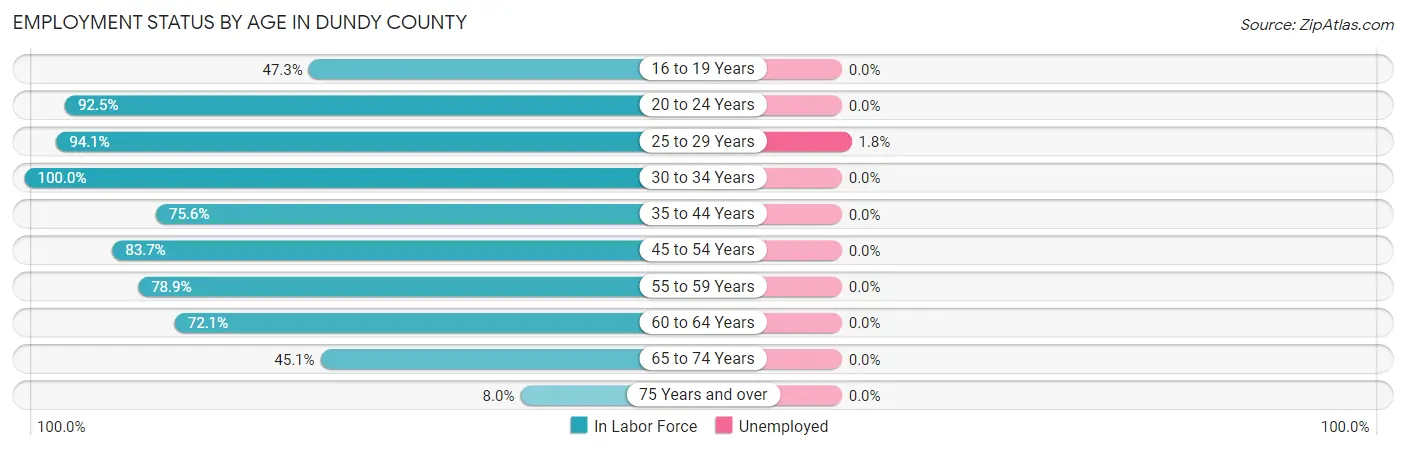
| Age Bracket | In Labor Force | Unemployed |
| 16 to 19 Years | 44 (47.3%) | 0 (0.0%) |
| 20 to 24 Years | 111 (92.5%) | 0 (0.0%) |
| 25 to 29 Years | 111 (94.1%) | 2 (1.8%) |
| 30 to 34 Years | 57 (100.0%) | 0 (0.0%) |
| 35 to 44 Years | 146 (75.6%) | 0 (0.0%) |
| 45 to 54 Years | 164 (83.7%) | 0 (0.0%) |
| 55 to 59 Years | 86 (78.9%) | 0 (0.0%) |
| 60 to 64 Years | 145 (72.1%) | 0 (0.0%) |
| 65 to 74 Years | 101 (45.1%) | 0 (0.0%) |
| 75 Years and over | 12 (8.0%) | 0 (0.0%) |
| Total | 977 (66.9%) | 2 (0.2%) |
Employment Status by Educational Attainment in Dundy County
According to labor force statistics for Dundy County, 81.1% of individuals (709) out of the total population between 25 and 64 years of age (874) are in the labor force, with 0.3% or 2 of them being unemployed. The group with the highest labor force participation rate are those with the educational attainment of college / associate degree, with 91.6% or 326 individuals in the labor force. Within the labor force, individuals with less than high school education have the highest percentage of unemployment, with 20.0% or 2 of them being unemployed.
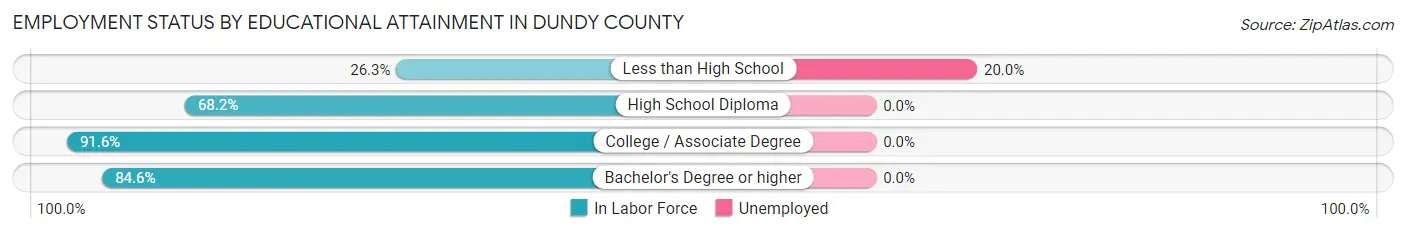
| Educational Attainment | In Labor Force | Unemployed |
| Less than High School | 10 (26.3%) | 8 (20.0%) |
| High School Diploma | 137 (68.2%) | 0 (0.0%) |
| College / Associate Degree | 326 (91.6%) | 0 (0.0%) |
| Bachelor's Degree or higher | 236 (84.6%) | 0 (0.0%) |
| Total | 709 (81.1%) | 3 (0.3%) |
Employment Occupations by Sex in Dundy County
Management, Business, Science and Arts Occupations
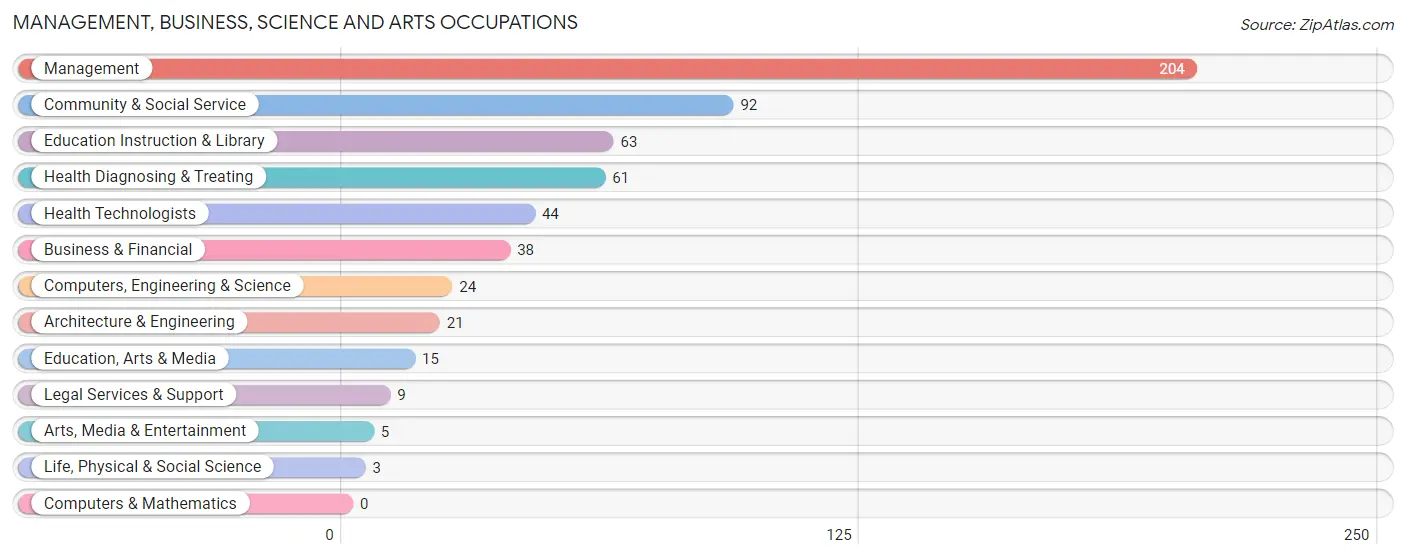
The most common Management, Business, Science and Arts occupations in Dundy County are Management (204 | 20.9%), Community & Social Service (92 | 9.4%), Education Instruction & Library (63 | 6.5%), Health Diagnosing & Treating (61 | 6.3%), and Health Technologists (44 | 4.5%).
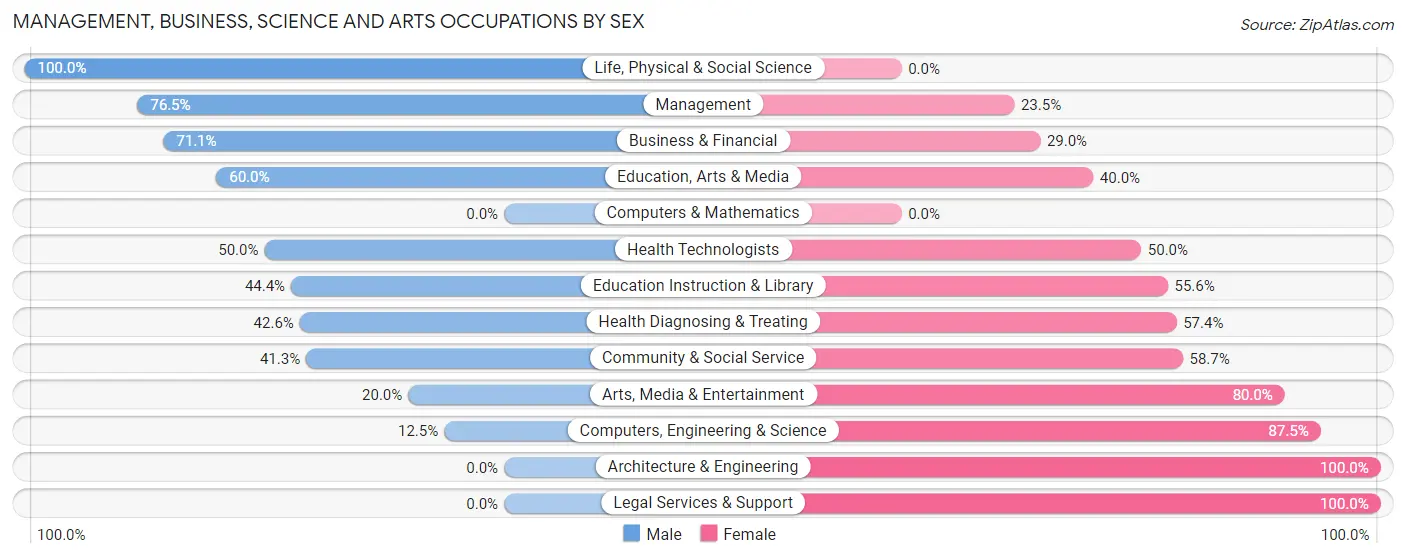
Management, Business, Science and Arts Occupations by Sex
Within the Management, Business, Science and Arts occupations in Dundy County, the most male-oriented occupations are Life, Physical & Social Science (100.0%), Management (76.5%), and Business & Financial (71.1%), while the most female-oriented occupations are Architecture & Engineering (100.0%), Legal Services & Support (100.0%), and Computers, Engineering & Science (87.5%).
| Occupation | Male | Female |
| Management | 156 (76.5%) | 48 (23.5%) |
| Business & Financial | 27 (71.1%) | 11 (28.9%) |
| Computers, Engineering & Science | 3 (12.5%) | 21 (87.5%) |
| Computers & Mathematics | 0 (0.0%) | 0 (0.0%) |
| Architecture & Engineering | 0 (0.0%) | 21 (100.0%) |
| Life, Physical & Social Science | 3 (100.0%) | 0 (0.0%) |
| Community & Social Service | 38 (41.3%) | 54 (58.7%) |
| Education, Arts & Media | 9 (60.0%) | 6 (40.0%) |
| Legal Services & Support | 0 (0.0%) | 9 (100.0%) |
| Education Instruction & Library | 28 (44.4%) | 35 (55.6%) |
| Arts, Media & Entertainment | 1 (20.0%) | 4 (80.0%) |
| Health Diagnosing & Treating | 26 (42.6%) | 35 (57.4%) |
| Health Technologists | 22 (50.0%) | 22 (50.0%) |
| Total (Category) | 250 (59.7%) | 169 (40.3%) |
| Total (Overall) | 544 (55.8%) | 431 (44.2%) |
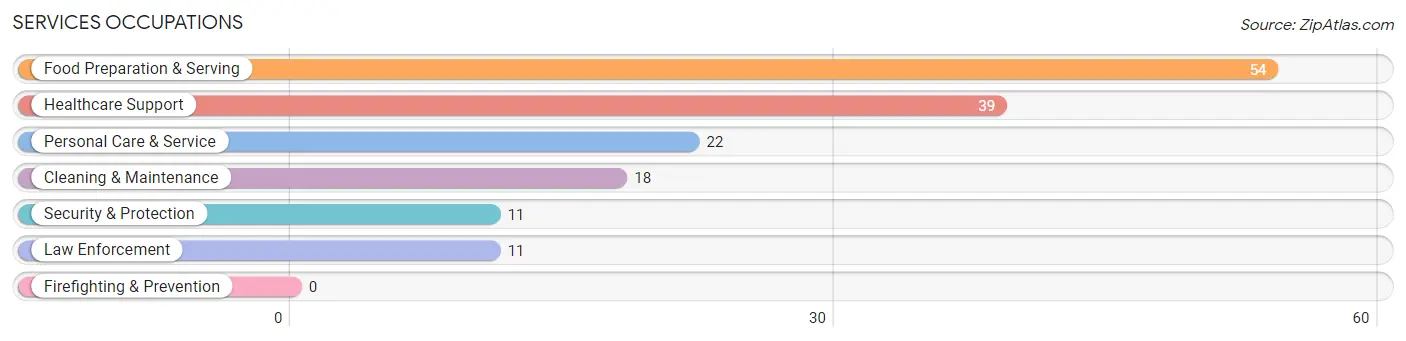
Services Occupations
The most common Services occupations in Dundy County are Food Preparation & Serving (54 | 5.5%), Healthcare Support (39 | 4.0%), Personal Care & Service (22 | 2.3%), Cleaning & Maintenance (18 | 1.8%), and Security & Protection (11 | 1.1%).
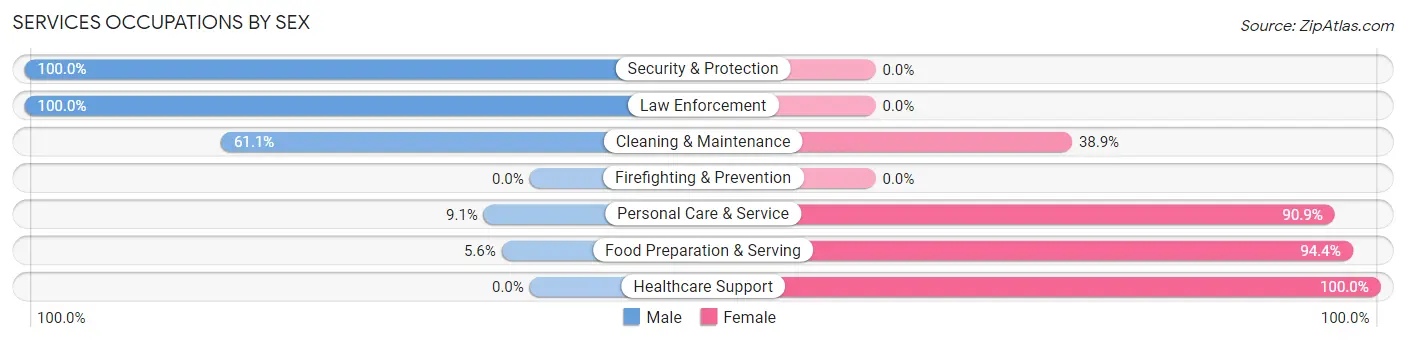
Services Occupations by Sex
Within the Services occupations in Dundy County, the most male-oriented occupations are Security & Protection (100.0%), Law Enforcement (100.0%), and Cleaning & Maintenance (61.1%), while the most female-oriented occupations are Healthcare Support (100.0%), Food Preparation & Serving (94.4%), and Personal Care & Service (90.9%).
| Occupation | Male | Female |
| Healthcare Support | 0 (0.0%) | 39 (100.0%) |
| Security & Protection | 11 (100.0%) | 0 (0.0%) |
| Firefighting & Prevention | 0 (0.0%) | 0 (0.0%) |
| Law Enforcement | 11 (100.0%) | 0 (0.0%) |
| Food Preparation & Serving | 3 (5.6%) | 51 (94.4%) |
| Cleaning & Maintenance | 11 (61.1%) | 7 (38.9%) |
| Personal Care & Service | 2 (9.1%) | 20 (90.9%) |
| Total (Category) | 27 (18.8%) | 117 (81.2%) |
| Total (Overall) | 544 (55.8%) | 431 (44.2%) |
Sales and Office Occupations
The most common Sales and Office occupations in Dundy County are Office & Administration (159 | 16.3%), and Sales & Related (49 | 5.0%).
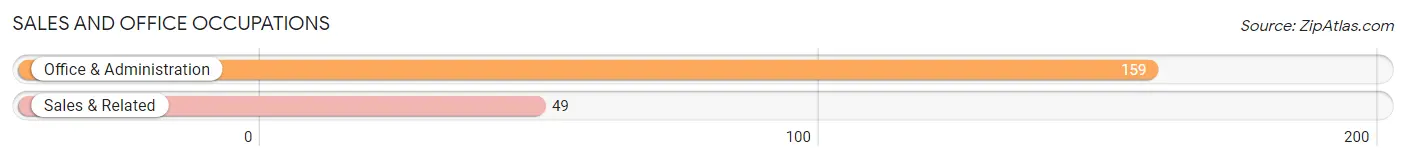
Sales and Office Occupations by Sex

| Occupation | Male | Female |
| Sales & Related | 37 (75.5%) | 12 (24.5%) |
| Office & Administration | 28 (17.6%) | 131 (82.4%) |
| Total (Category) | 65 (31.2%) | 143 (68.8%) |
| Total (Overall) | 544 (55.8%) | 431 (44.2%) |
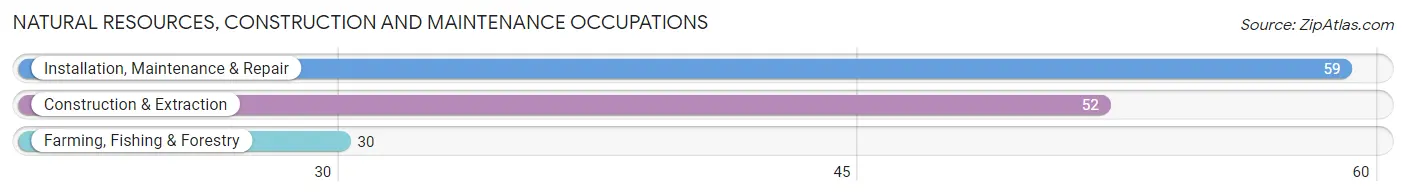
Natural Resources, Construction and Maintenance Occupations
The most common Natural Resources, Construction and Maintenance occupations in Dundy County are Installation, Maintenance & Repair (59 | 6.0%), Construction & Extraction (52 | 5.3%), and Farming, Fishing & Forestry (30 | 3.1%).
Natural Resources, Construction and Maintenance Occupations by Sex
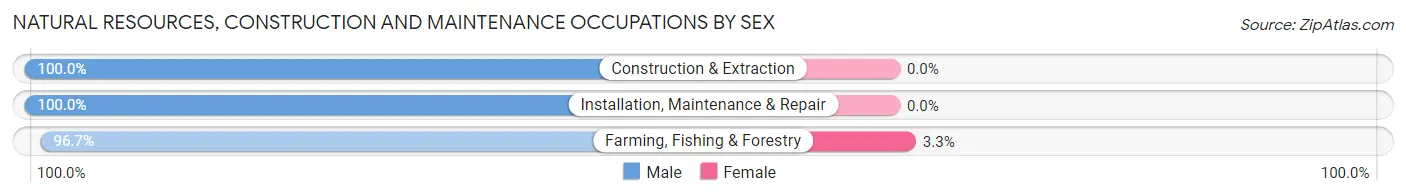
| Occupation | Male | Female |
| Farming, Fishing & Forestry | 29 (96.7%) | 1 (3.3%) |
| Construction & Extraction | 52 (100.0%) | 0 (0.0%) |
| Installation, Maintenance & Repair | 59 (100.0%) | 0 (0.0%) |
| Total (Category) | 140 (99.3%) | 1 (0.7%) |
| Total (Overall) | 544 (55.8%) | 431 (44.2%) |
Production, Transportation and Moving Occupations
The most common Production, Transportation and Moving occupations in Dundy County are Transportation (48 | 4.9%), Production (12 | 1.2%), and Material Moving (3 | 0.3%).
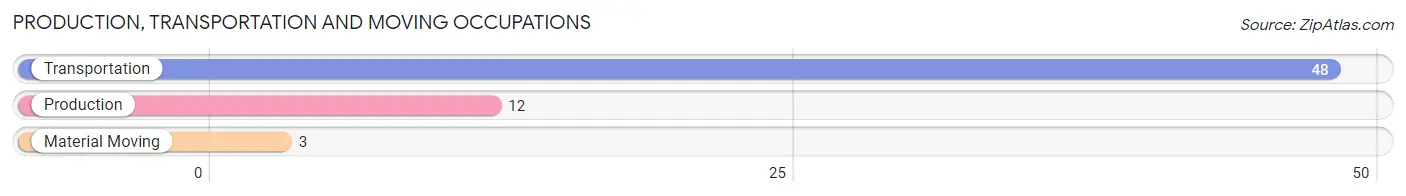
Production, Transportation and Moving Occupations by Sex
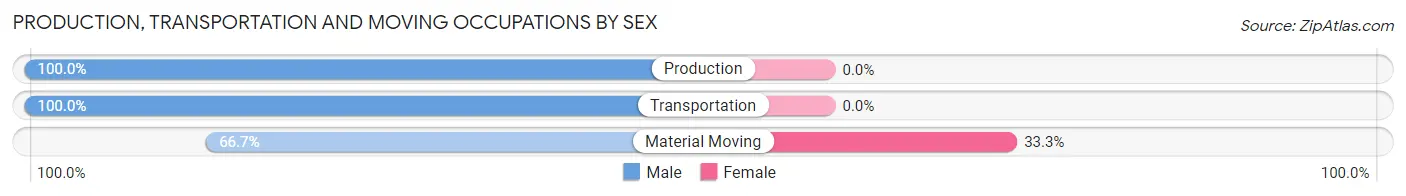
| Occupation | Male | Female |
| Production | 12 (100.0%) | 0 (0.0%) |
| Transportation | 48 (100.0%) | 0 (0.0%) |
| Material Moving | 2 (66.7%) | 1 (33.3%) |
| Total (Category) | 62 (98.4%) | 1 (1.6%) |
| Total (Overall) | 544 (55.8%) | 431 (44.2%) |
Employment Industries by Sex in Dundy County
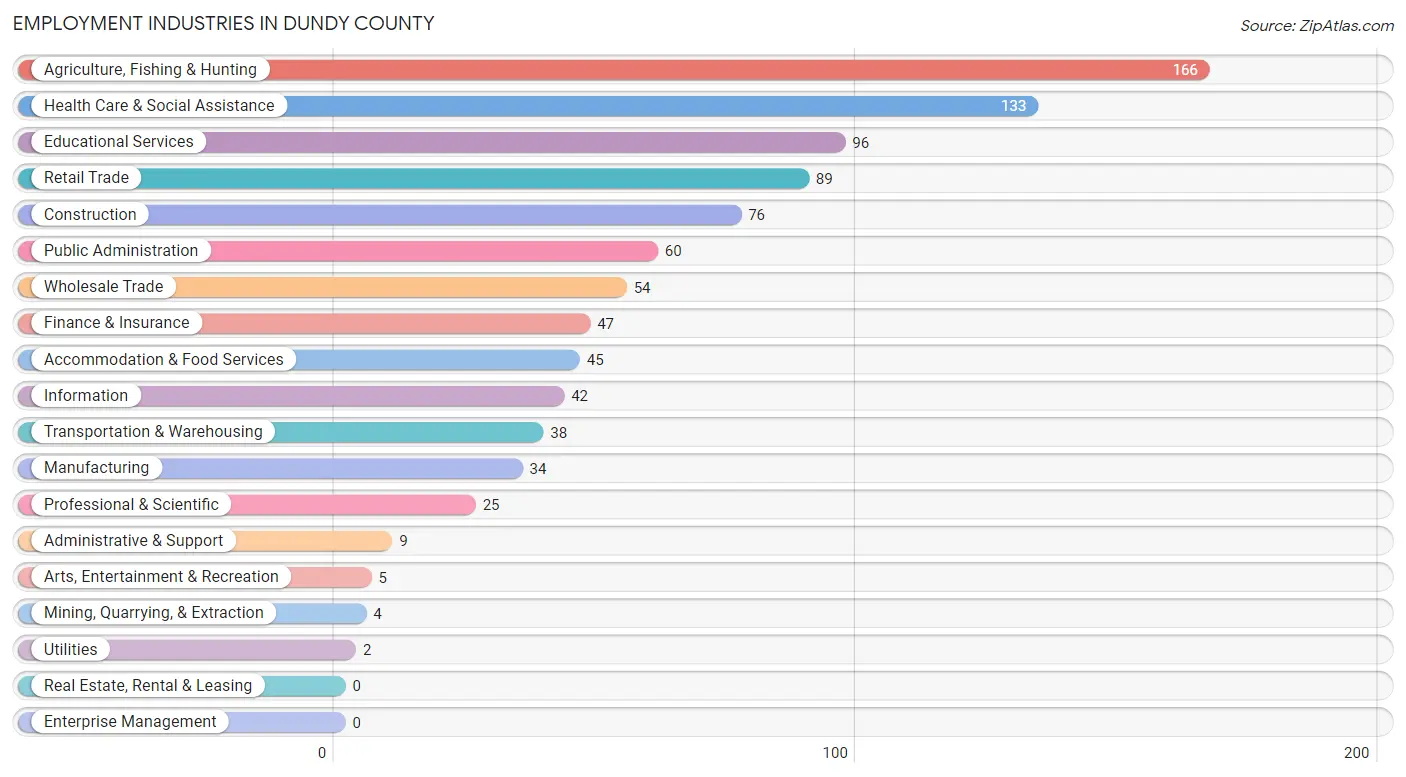
Employment Industries in Dundy County
The major employment industries in Dundy County include Agriculture, Fishing & Hunting (166 | 17.0%), Health Care & Social Assistance (133 | 13.6%), Educational Services (96 | 9.9%), Retail Trade (89 | 9.1%), and Construction (76 | 7.8%).
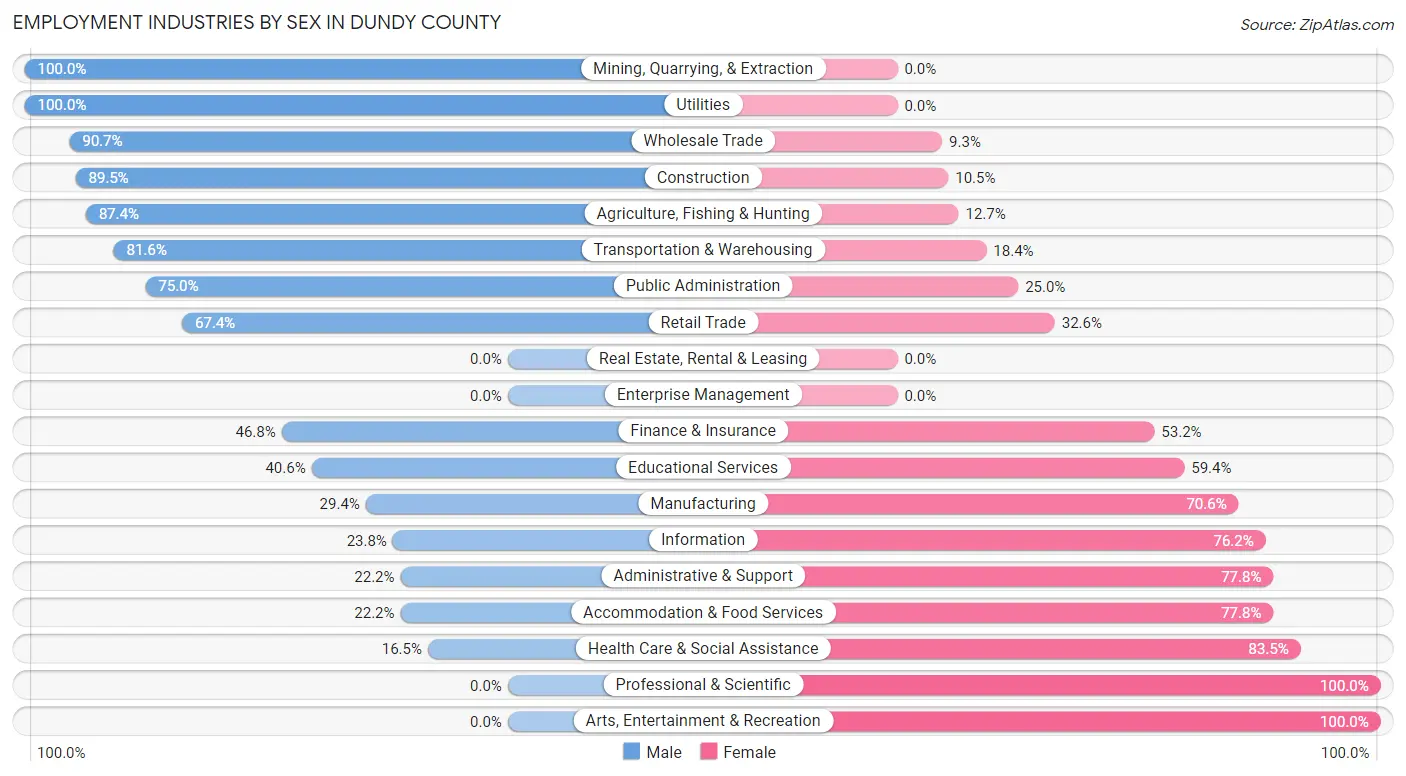
Employment Industries by Sex in Dundy County
The Dundy County industries that see more men than women are Mining, Quarrying, & Extraction (100.0%), Utilities (100.0%), and Wholesale Trade (90.7%), whereas the industries that tend to have a higher number of women are Professional & Scientific (100.0%), Arts, Entertainment & Recreation (100.0%), and Health Care & Social Assistance (83.5%).
| Industry | Male | Female |
| Agriculture, Fishing & Hunting | 145 (87.4%) | 21 (12.7%) |
| Mining, Quarrying, & Extraction | 4 (100.0%) | 0 (0.0%) |
| Construction | 68 (89.5%) | 8 (10.5%) |
| Manufacturing | 10 (29.4%) | 24 (70.6%) |
| Wholesale Trade | 49 (90.7%) | 5 (9.3%) |
| Retail Trade | 60 (67.4%) | 29 (32.6%) |
| Transportation & Warehousing | 31 (81.6%) | 7 (18.4%) |
| Utilities | 2 (100.0%) | 0 (0.0%) |
| Information | 10 (23.8%) | 32 (76.2%) |
| Finance & Insurance | 22 (46.8%) | 25 (53.2%) |
| Real Estate, Rental & Leasing | 0 (0.0%) | 0 (0.0%) |
| Professional & Scientific | 0 (0.0%) | 25 (100.0%) |
| Enterprise Management | 0 (0.0%) | 0 (0.0%) |
| Administrative & Support | 2 (22.2%) | 7 (77.8%) |
| Educational Services | 39 (40.6%) | 57 (59.4%) |
| Health Care & Social Assistance | 22 (16.5%) | 111 (83.5%) |
| Arts, Entertainment & Recreation | 0 (0.0%) | 5 (100.0%) |
| Accommodation & Food Services | 10 (22.2%) | 35 (77.8%) |
| Public Administration | 45 (75.0%) | 15 (25.0%) |
| Total | 544 (55.8%) | 431 (44.2%) |
Education in Dundy County
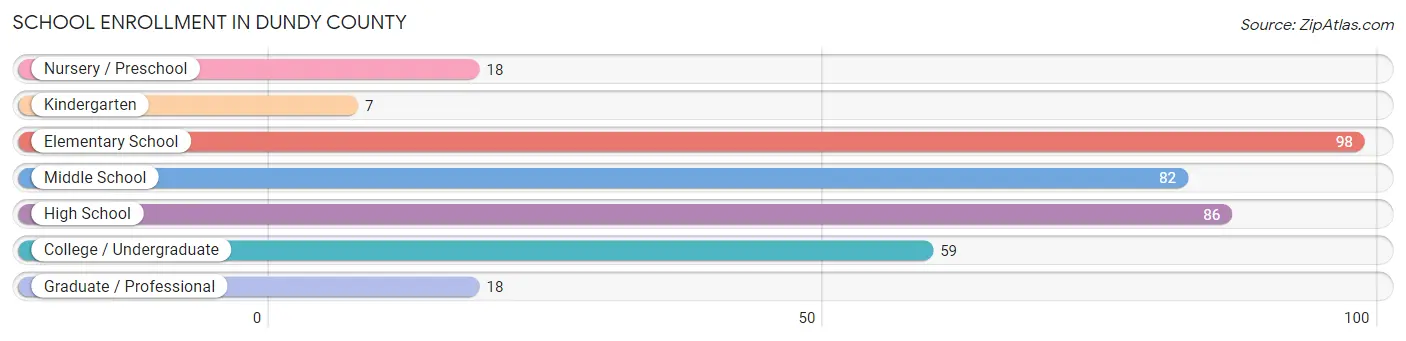
School Enrollment in Dundy County
The most common levels of schooling among the 368 students in Dundy County are elementary school (98 | 26.6%), high school (86 | 23.4%), and middle school (82 | 22.3%).
| School Level | # Students | % Students |
| Nursery / Preschool | 18 | 4.9% |
| Kindergarten | 7 | 1.9% |
| Elementary School | 98 | 26.6% |
| Middle School | 82 | 22.3% |
| High School | 86 | 23.4% |
| College / Undergraduate | 59 | 16.0% |
| Graduate / Professional | 18 | 4.9% |
| Total | 368 | 100.0% |
School Enrollment by Age by Funding Source in Dundy County
Out of a total of 368 students who are enrolled in schools in Dundy County, 51 (13.9%) attend a private institution, while the remaining 317 (86.1%) are enrolled in public schools. The age group of 3 to 4 year olds has the highest likelihood of being enrolled in private schools, with 11 (100.0% in the age bracket) enrolled. Conversely, the age group of 10 to 14 year olds has the lowest likelihood of being enrolled in a private school, with 82 (100.0% in the age bracket) attending a public institution.
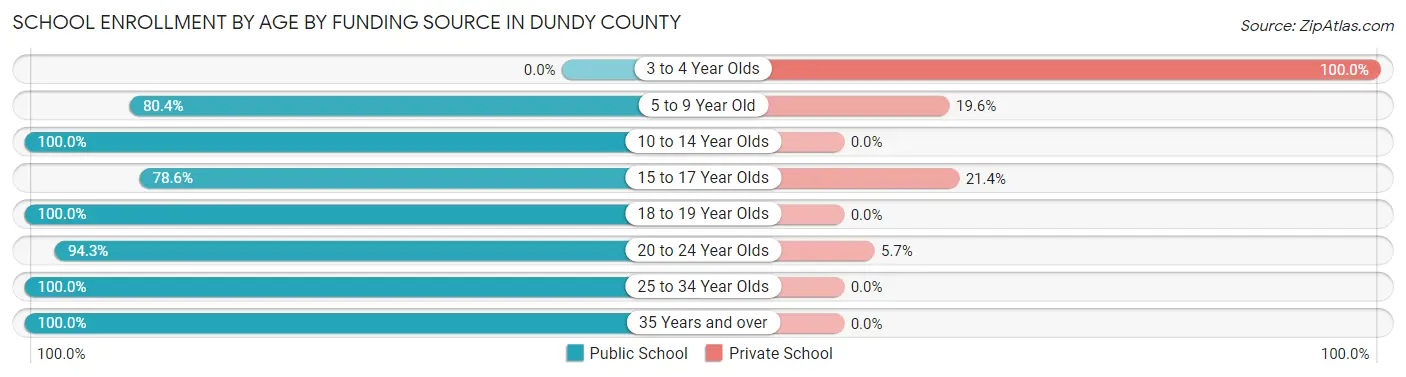
| Age Bracket | Public School | Private School |
| 3 to 4 Year Olds | 0 (0.0%) | 11 (100.0%) |
| 5 to 9 Year Old | 90 (80.4%) | 22 (19.6%) |
| 10 to 14 Year Olds | 82 (100.0%) | 0 (0.0%) |
| 15 to 17 Year Olds | 55 (78.6%) | 15 (21.4%) |
| 18 to 19 Year Olds | 16 (100.0%) | 0 (0.0%) |
| 20 to 24 Year Olds | 50 (94.3%) | 3 (5.7%) |
| 25 to 34 Year Olds | 15 (100.0%) | 0 (0.0%) |
| 35 Years and over | 9 (100.0%) | 0 (0.0%) |
| Total | 317 (86.1%) | 51 (13.9%) |
Educational Attainment by Field of Study in Dundy County
Education (95 | 25.5%), bio, nature & agricultural (87 | 23.3%), business (56 | 15.0%), communications (25 | 6.7%), and science & technology (22 | 5.9%) are the most common fields of study among 373 individuals in Dundy County who have obtained a bachelor's degree or higher.
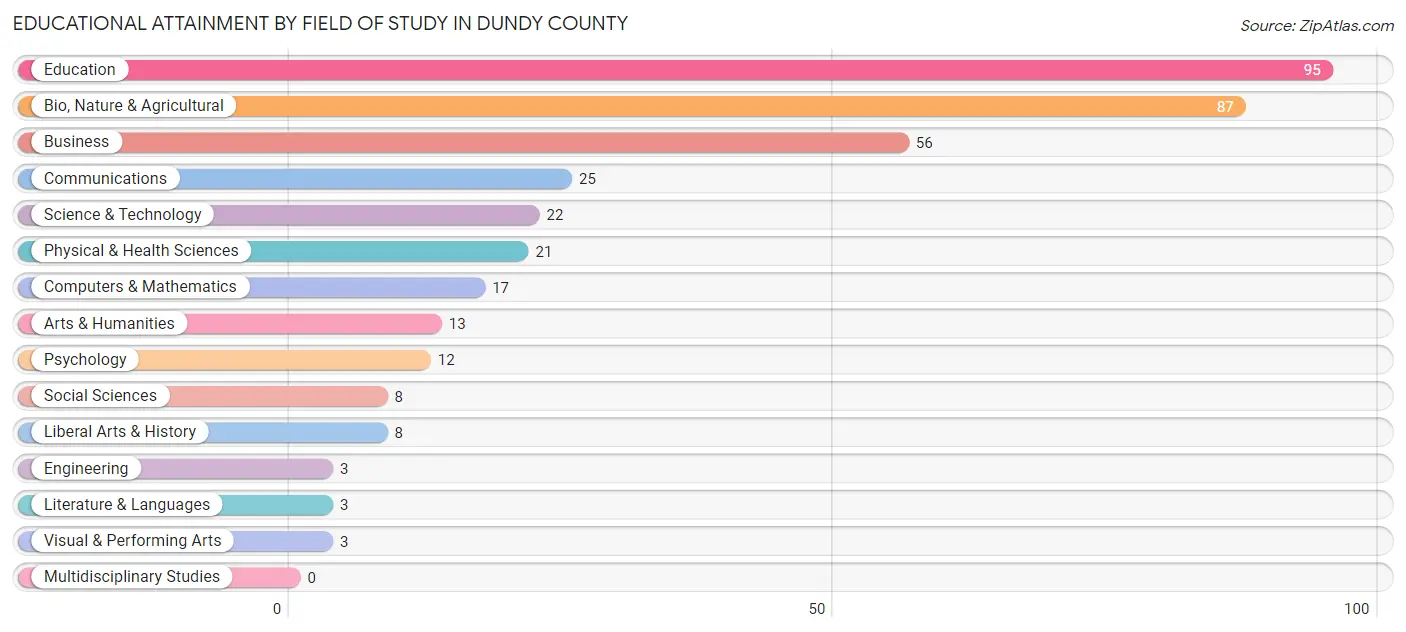
| Field of Study | # Graduates | % Graduates |
| Computers & Mathematics | 17 | 4.6% |
| Bio, Nature & Agricultural | 87 | 23.3% |
| Physical & Health Sciences | 21 | 5.6% |
| Psychology | 12 | 3.2% |
| Social Sciences | 8 | 2.1% |
| Engineering | 3 | 0.8% |
| Multidisciplinary Studies | 0 | 0.0% |
| Science & Technology | 22 | 5.9% |
| Business | 56 | 15.0% |
| Education | 95 | 25.5% |
| Literature & Languages | 3 | 0.8% |
| Liberal Arts & History | 8 | 2.1% |
| Visual & Performing Arts | 3 | 0.8% |
| Communications | 25 | 6.7% |
| Arts & Humanities | 13 | 3.5% |
| Total | 373 | 100.0% |
Transportation & Commute in Dundy County
Vehicle Availability by Sex in Dundy County
The most prevalent vehicle ownership categories in Dundy County are males with 2 vehicles (147, accounting for 27.7%) and females with 2 vehicles (96, making up 36.0%).
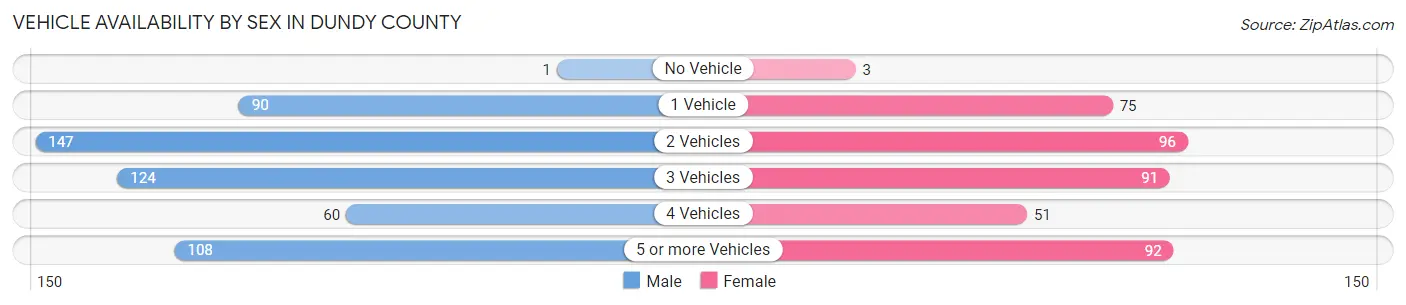
| Vehicles Available | Male | Female |
| No Vehicle | 1 (0.2%) | 3 (0.7%) |
| 1 Vehicle | 90 (17.0%) | 75 (18.4%) |
| 2 Vehicles | 147 (27.7%) | 96 (23.5%) |
| 3 Vehicles | 124 (23.4%) | 91 (22.3%) |
| 4 Vehicles | 60 (11.3%) | 51 (12.5%) |
| 5 or more Vehicles | 108 (20.4%) | 92 (22.6%) |
| Total | 530 (100.0%) | 408 (100.0%) |
Commute Time in Dundy County
The most frequently occuring commute durations in Dundy County are 5 to 9 minutes (224 commuters, 25.9%), less than 5 minutes (203 commuters, 23.4%), and 15 to 19 minutes (119 commuters, 13.7%).
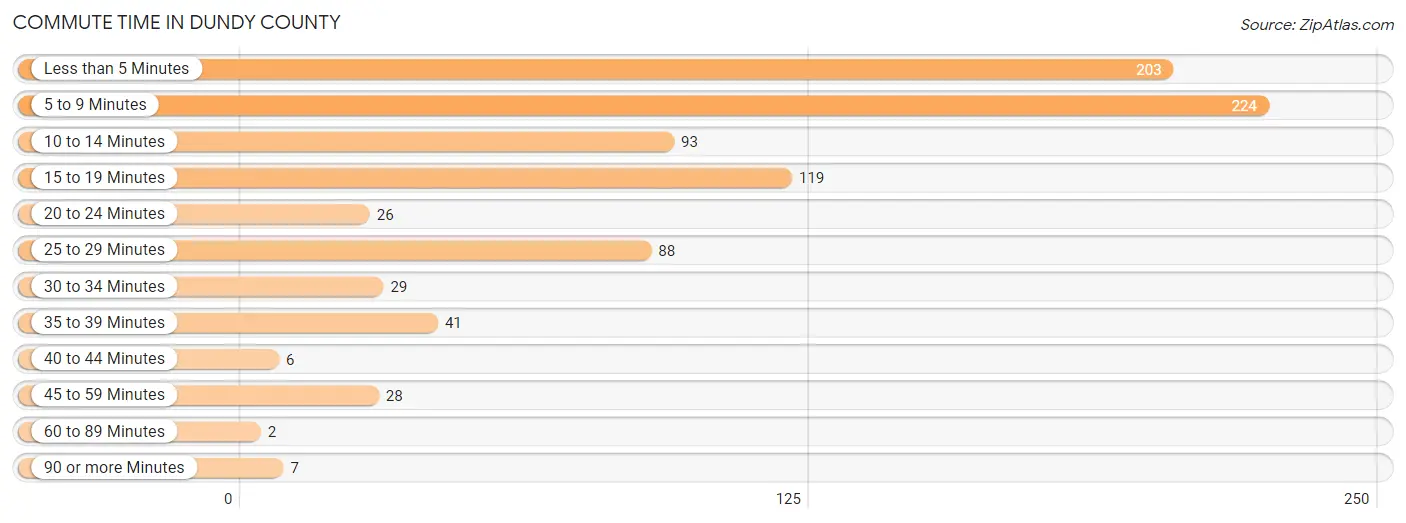
| Commute Time | # Commuters | % Commuters |
| Less than 5 Minutes | 203 | 23.4% |
| 5 to 9 Minutes | 224 | 25.9% |
| 10 to 14 Minutes | 93 | 10.7% |
| 15 to 19 Minutes | 119 | 13.7% |
| 20 to 24 Minutes | 26 | 3.0% |
| 25 to 29 Minutes | 88 | 10.2% |
| 30 to 34 Minutes | 29 | 3.4% |
| 35 to 39 Minutes | 41 | 4.7% |
| 40 to 44 Minutes | 6 | 0.7% |
| 45 to 59 Minutes | 28 | 3.2% |
| 60 to 89 Minutes | 2 | 0.2% |
| 90 or more Minutes | 7 | 0.8% |
Commute Time by Sex in Dundy County
The most common commute times in Dundy County are 5 to 9 minutes (133 commuters, 26.3%) for males and less than 5 minutes (94 commuters, 26.0%) for females.
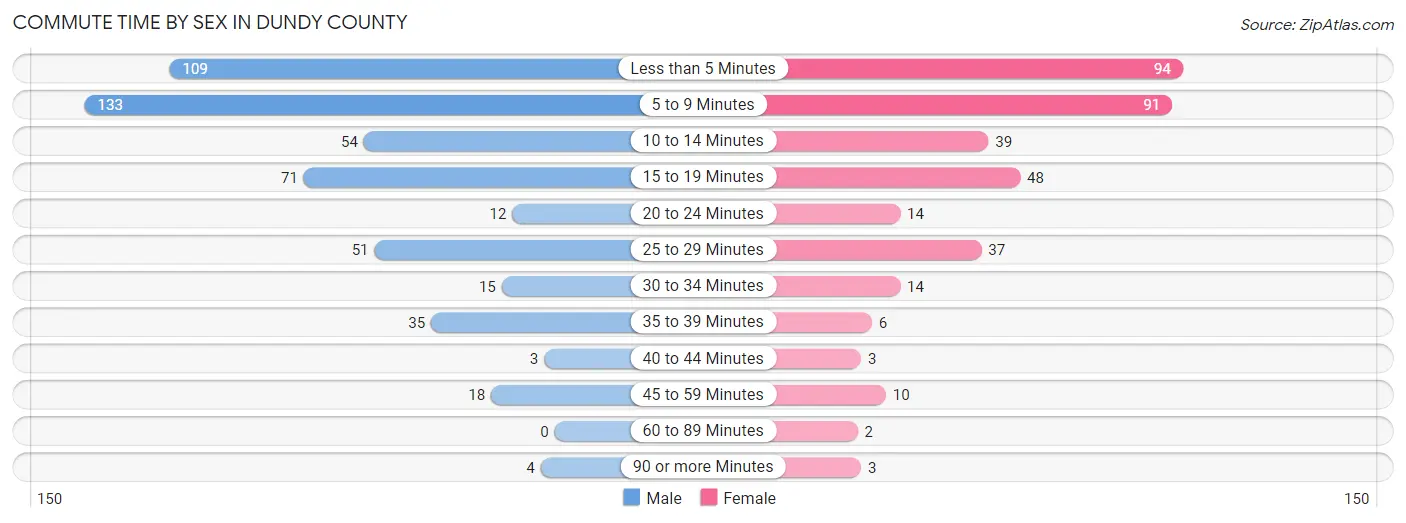
| Commute Time | Male | Female |
| Less than 5 Minutes | 109 (21.6%) | 94 (26.0%) |
| 5 to 9 Minutes | 133 (26.3%) | 91 (25.2%) |
| 10 to 14 Minutes | 54 (10.7%) | 39 (10.8%) |
| 15 to 19 Minutes | 71 (14.1%) | 48 (13.3%) |
| 20 to 24 Minutes | 12 (2.4%) | 14 (3.9%) |
| 25 to 29 Minutes | 51 (10.1%) | 37 (10.2%) |
| 30 to 34 Minutes | 15 (3.0%) | 14 (3.9%) |
| 35 to 39 Minutes | 35 (6.9%) | 6 (1.7%) |
| 40 to 44 Minutes | 3 (0.6%) | 3 (0.8%) |
| 45 to 59 Minutes | 18 (3.6%) | 10 (2.8%) |
| 60 to 89 Minutes | 0 (0.0%) | 2 (0.5%) |
| 90 or more Minutes | 4 (0.8%) | 3 (0.8%) |
Time of Departure to Work by Sex in Dundy County
The most frequent times of departure to work in Dundy County are 6:30 AM to 6:59 AM (118, 23.4%) for males and 7:00 AM to 7:29 AM (67, 18.6%) for females.
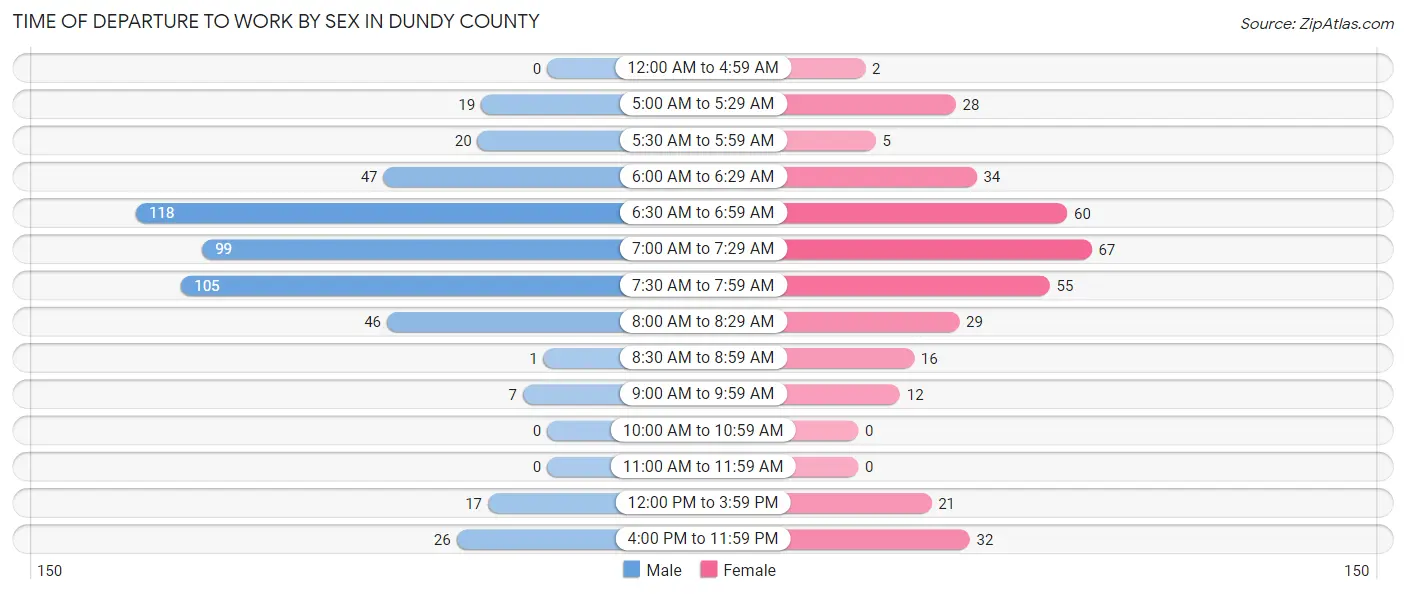
| Time of Departure | Male | Female |
| 12:00 AM to 4:59 AM | 0 (0.0%) | 2 (0.5%) |
| 5:00 AM to 5:29 AM | 19 (3.8%) | 28 (7.8%) |
| 5:30 AM to 5:59 AM | 20 (4.0%) | 5 (1.4%) |
| 6:00 AM to 6:29 AM | 47 (9.3%) | 34 (9.4%) |
| 6:30 AM to 6:59 AM | 118 (23.4%) | 60 (16.6%) |
| 7:00 AM to 7:29 AM | 99 (19.6%) | 67 (18.6%) |
| 7:30 AM to 7:59 AM | 105 (20.8%) | 55 (15.2%) |
| 8:00 AM to 8:29 AM | 46 (9.1%) | 29 (8.0%) |
| 8:30 AM to 8:59 AM | 1 (0.2%) | 16 (4.4%) |
| 9:00 AM to 9:59 AM | 7 (1.4%) | 12 (3.3%) |
| 10:00 AM to 10:59 AM | 0 (0.0%) | 0 (0.0%) |
| 11:00 AM to 11:59 AM | 0 (0.0%) | 0 (0.0%) |
| 12:00 PM to 3:59 PM | 17 (3.4%) | 21 (5.8%) |
| 4:00 PM to 11:59 PM | 26 (5.1%) | 32 (8.9%) |
| Total | 505 (100.0%) | 361 (100.0%) |
Housing Occupancy in Dundy County
Occupancy by Ownership in Dundy County
Of the total 788 dwellings in Dundy County, owner-occupied units account for 614 (77.9%), while renter-occupied units make up 174 (22.1%).
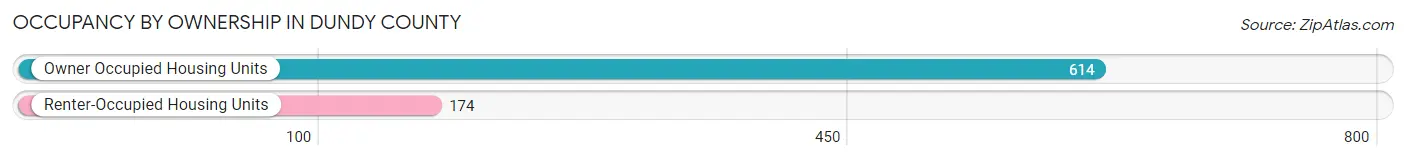
| Occupancy | # Housing Units | % Housing Units |
| Owner Occupied Housing Units | 614 | 77.9% |
| Renter-Occupied Housing Units | 174 | 22.1% |
| Total Occupied Housing Units | 788 | 100.0% |
Occupancy by Household Size in Dundy County
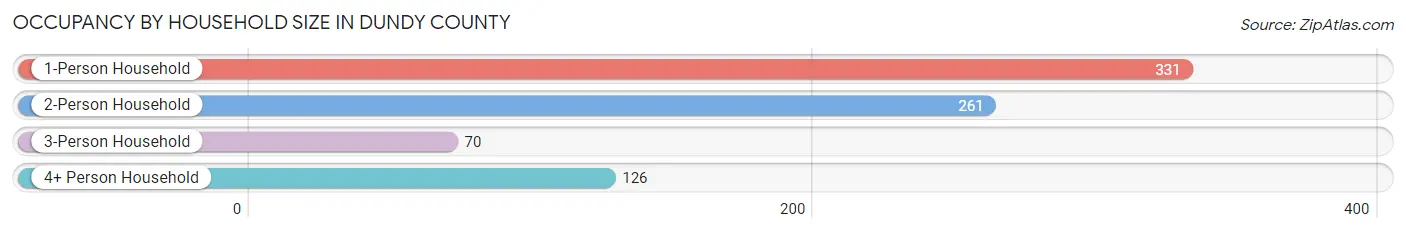
| Household Size | # Housing Units | % Housing Units |
| 1-Person Household | 331 | 42.0% |
| 2-Person Household | 261 | 33.1% |
| 3-Person Household | 70 | 8.9% |
| 4+ Person Household | 126 | 16.0% |
| Total Housing Units | 788 | 100.0% |
Occupancy by Ownership by Household Size in Dundy County
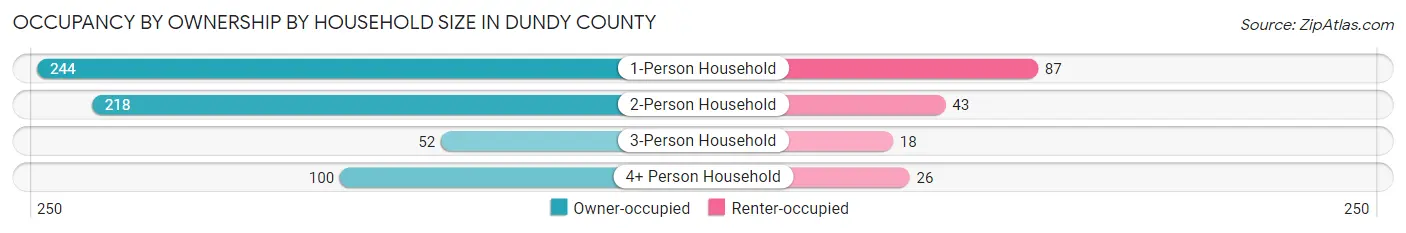
| Household Size | Owner-occupied | Renter-occupied |
| 1-Person Household | 244 (73.7%) | 87 (26.3%) |
| 2-Person Household | 218 (83.5%) | 43 (16.5%) |
| 3-Person Household | 52 (74.3%) | 18 (25.7%) |
| 4+ Person Household | 100 (79.4%) | 26 (20.6%) |
| Total Housing Units | 614 (77.9%) | 174 (22.1%) |
Occupancy by Educational Attainment in Dundy County
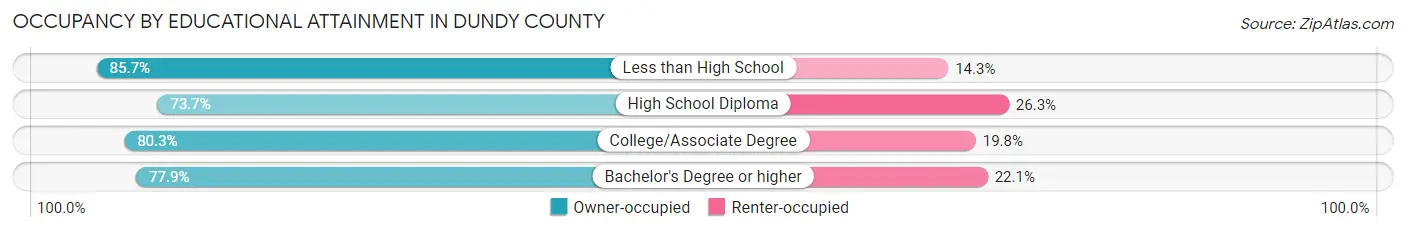
| Household Size | Owner-occupied | Renter-occupied |
| Less than High School | 24 (85.7%) | 4 (14.3%) |
| High School Diploma | 168 (73.7%) | 60 (26.3%) |
| College/Associate Degree | 260 (80.2%) | 64 (19.8%) |
| Bachelor's Degree or higher | 162 (77.9%) | 46 (22.1%) |
Occupancy by Age of Householder in Dundy County
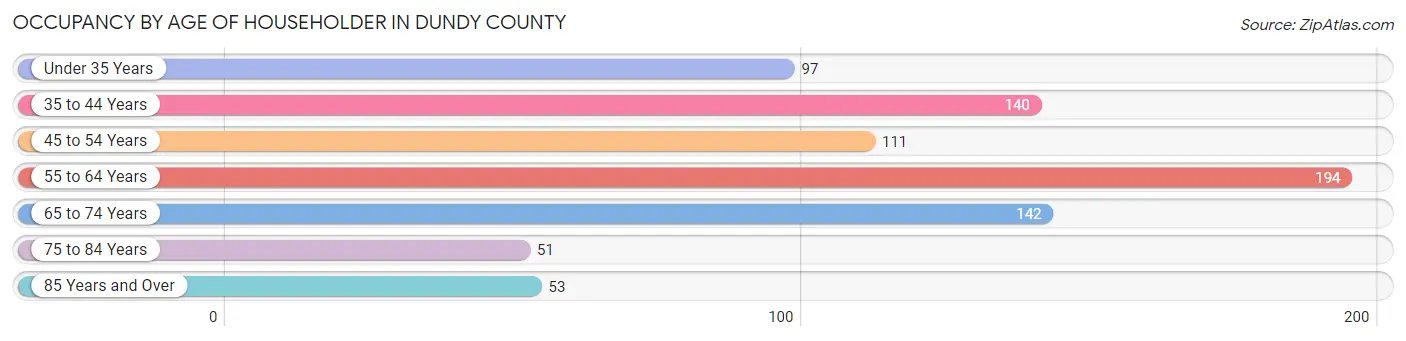
| Age Bracket | # Households | % Households |
| Under 35 Years | 97 | 12.3% |
| 35 to 44 Years | 140 | 17.8% |
| 45 to 54 Years | 111 | 14.1% |
| 55 to 64 Years | 194 | 24.6% |
| 65 to 74 Years | 142 | 18.0% |
| 75 to 84 Years | 51 | 6.5% |
| 85 Years and Over | 53 | 6.7% |
| Total | 788 | 100.0% |
Housing Finances in Dundy County
Median Income by Occupancy in Dundy County
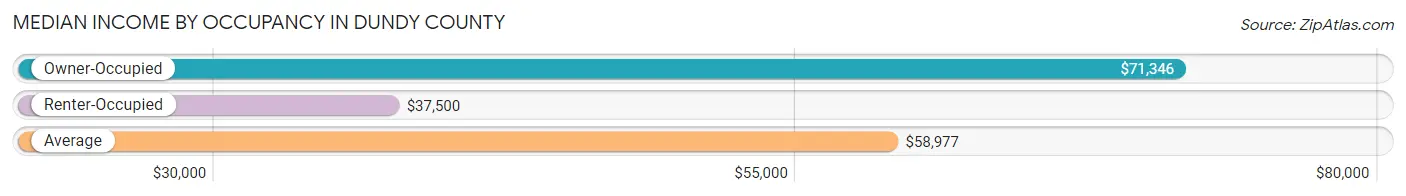
| Occupancy Type | # Households | Median Income |
| Owner-Occupied | 614 (77.9%) | $71,346 |
| Renter-Occupied | 174 (22.1%) | $37,500 |
| Average | 788 (100.0%) | $58,977 |
Occupancy by Householder Income Bracket in Dundy County
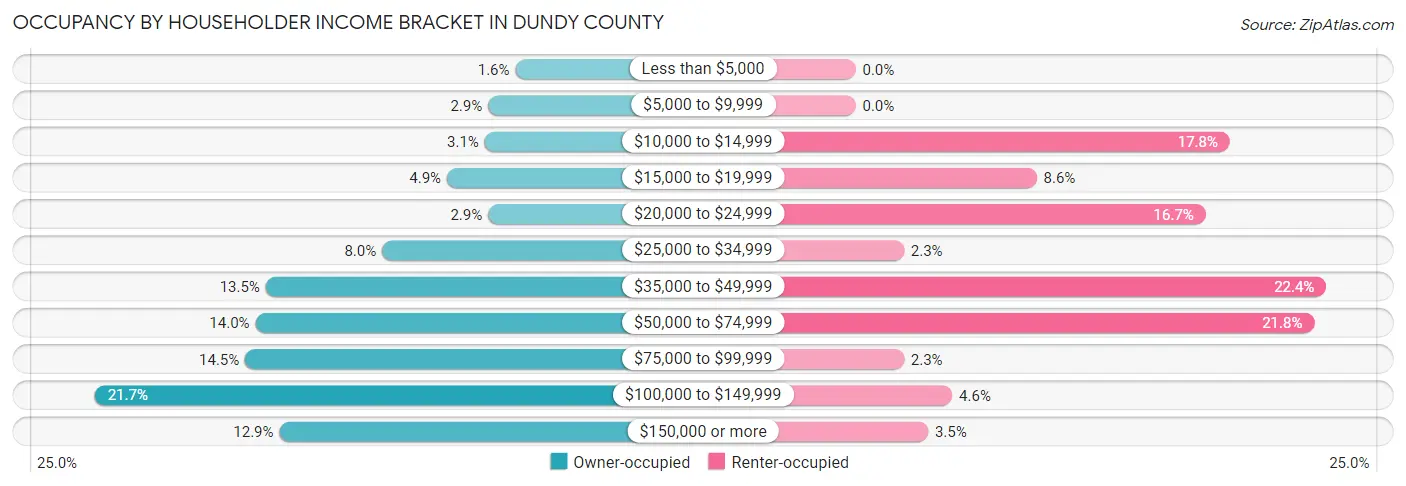
| Income Bracket | Owner-occupied | Renter-occupied |
| Less than $5,000 | 10 (1.6%) | 0 (0.0%) |
| $5,000 to $9,999 | 18 (2.9%) | 0 (0.0%) |
| $10,000 to $14,999 | 19 (3.1%) | 31 (17.8%) |
| $15,000 to $19,999 | 30 (4.9%) | 15 (8.6%) |
| $20,000 to $24,999 | 18 (2.9%) | 29 (16.7%) |
| $25,000 to $34,999 | 49 (8.0%) | 4 (2.3%) |
| $35,000 to $49,999 | 83 (13.5%) | 39 (22.4%) |
| $50,000 to $74,999 | 86 (14.0%) | 38 (21.8%) |
| $75,000 to $99,999 | 89 (14.5%) | 4 (2.3%) |
| $100,000 to $149,999 | 133 (21.7%) | 8 (4.6%) |
| $150,000 or more | 79 (12.9%) | 6 (3.5%) |
| Total | 614 (100.0%) | 174 (100.0%) |
Monthly Housing Cost Tiers in Dundy County
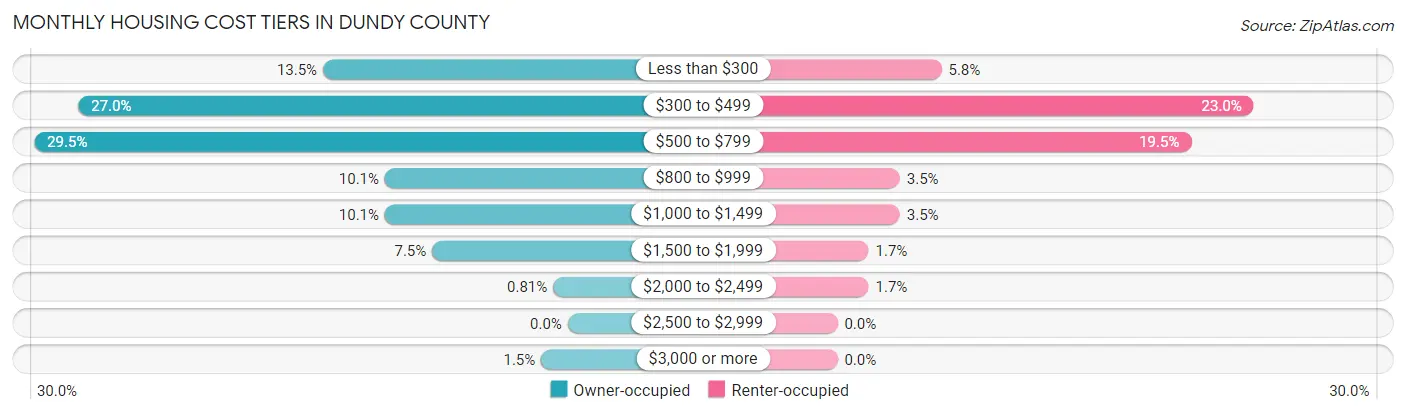
| Monthly Cost | Owner-occupied | Renter-occupied |
| Less than $300 | 83 (13.5%) | 10 (5.8%) |
| $300 to $499 | 166 (27.0%) | 40 (23.0%) |
| $500 to $799 | 181 (29.5%) | 34 (19.5%) |
| $800 to $999 | 62 (10.1%) | 6 (3.5%) |
| $1,000 to $1,499 | 62 (10.1%) | 6 (3.5%) |
| $1,500 to $1,999 | 46 (7.5%) | 3 (1.7%) |
| $2,000 to $2,499 | 5 (0.8%) | 3 (1.7%) |
| $2,500 to $2,999 | 0 (0.0%) | 0 (0.0%) |
| $3,000 or more | 9 (1.5%) | 0 (0.0%) |
| Total | 614 (100.0%) | 174 (100.0%) |
Physical Housing Characteristics in Dundy County
Housing Structures in Dundy County
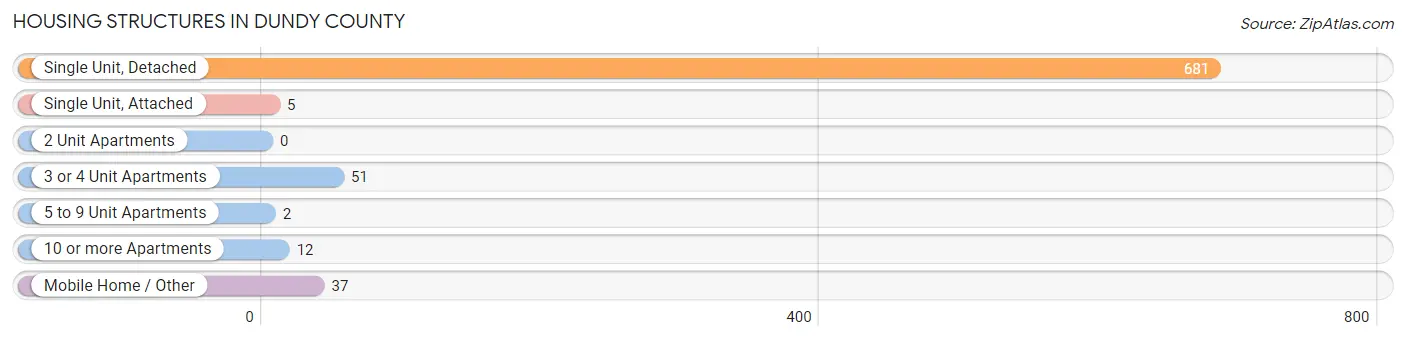
| Structure Type | # Housing Units | % Housing Units |
| Single Unit, Detached | 681 | 86.4% |
| Single Unit, Attached | 5 | 0.6% |
| 2 Unit Apartments | 0 | 0.0% |
| 3 or 4 Unit Apartments | 51 | 6.5% |
| 5 to 9 Unit Apartments | 2 | 0.3% |
| 10 or more Apartments | 12 | 1.5% |
| Mobile Home / Other | 37 | 4.7% |
| Total | 788 | 100.0% |
Housing Structures by Occupancy in Dundy County
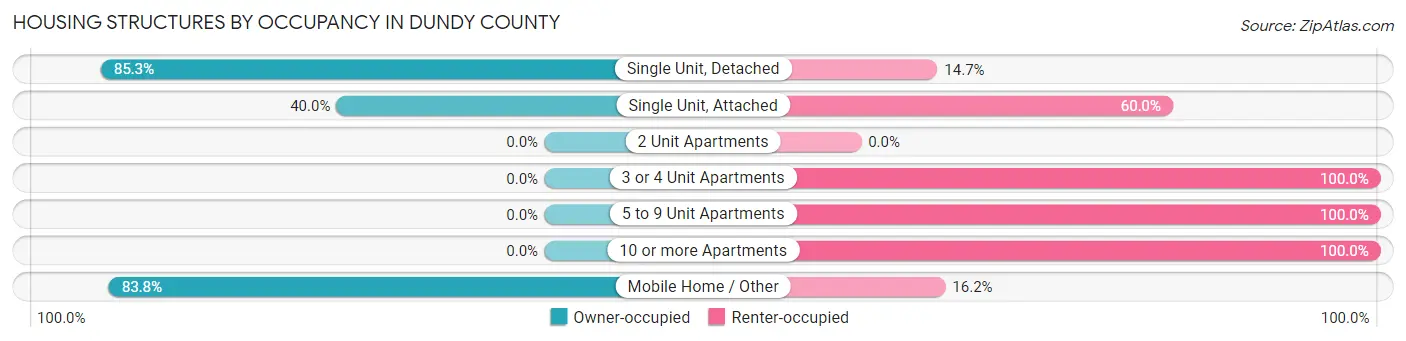
| Structure Type | Owner-occupied | Renter-occupied |
| Single Unit, Detached | 581 (85.3%) | 100 (14.7%) |
| Single Unit, Attached | 2 (40.0%) | 3 (60.0%) |
| 2 Unit Apartments | 0 (0.0%) | 0 (0.0%) |
| 3 or 4 Unit Apartments | 0 (0.0%) | 51 (100.0%) |
| 5 to 9 Unit Apartments | 0 (0.0%) | 2 (100.0%) |
| 10 or more Apartments | 0 (0.0%) | 12 (100.0%) |
| Mobile Home / Other | 31 (83.8%) | 6 (16.2%) |
| Total | 614 (77.9%) | 174 (22.1%) |
Housing Structures by Number of Rooms in Dundy County
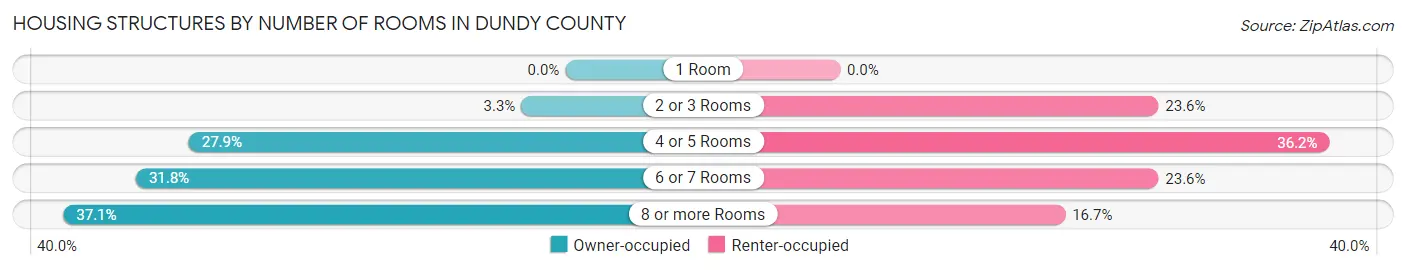
| Number of Rooms | Owner-occupied | Renter-occupied |
| 1 Room | 0 (0.0%) | 0 (0.0%) |
| 2 or 3 Rooms | 20 (3.3%) | 41 (23.6%) |
| 4 or 5 Rooms | 171 (27.9%) | 63 (36.2%) |
| 6 or 7 Rooms | 195 (31.8%) | 41 (23.6%) |
| 8 or more Rooms | 228 (37.1%) | 29 (16.7%) |
| Total | 614 (100.0%) | 174 (100.0%) |
Housing Structure by Heating Type in Dundy County
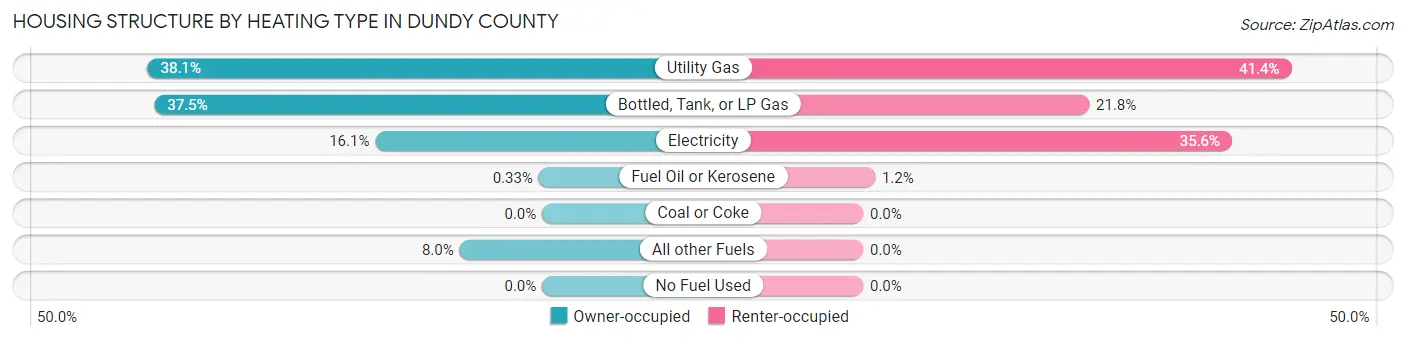
| Heating Type | Owner-occupied | Renter-occupied |
| Utility Gas | 234 (38.1%) | 72 (41.4%) |
| Bottled, Tank, or LP Gas | 230 (37.5%) | 38 (21.8%) |
| Electricity | 99 (16.1%) | 62 (35.6%) |
| Fuel Oil or Kerosene | 2 (0.3%) | 2 (1.1%) |
| Coal or Coke | 0 (0.0%) | 0 (0.0%) |
| All other Fuels | 49 (8.0%) | 0 (0.0%) |
| No Fuel Used | 0 (0.0%) | 0 (0.0%) |
| Total | 614 (100.0%) | 174 (100.0%) |
Household Vehicle Usage in Dundy County
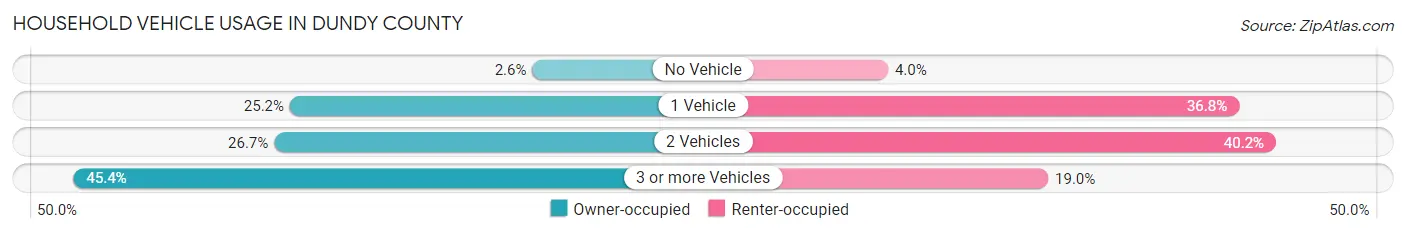
| Vehicles per Household | Owner-occupied | Renter-occupied |
| No Vehicle | 16 (2.6%) | 7 (4.0%) |
| 1 Vehicle | 155 (25.2%) | 64 (36.8%) |
| 2 Vehicles | 164 (26.7%) | 70 (40.2%) |
| 3 or more Vehicles | 279 (45.4%) | 33 (19.0%) |
| Total | 614 (100.0%) | 174 (100.0%) |
Real Estate & Mortgages in Dundy County
Real Estate and Mortgage Overview in Dundy County
| Characteristic | Without Mortgage | With Mortgage |
| Housing Units | 425 | 189 |
| Median Property Value | $103,400 | $120,400 |
| Median Household Income | $67,708 | $34 |
| Monthly Housing Costs | $473 | $9 |
| Real Estate Taxes | $832 | $0 |
Property Value by Mortgage Status in Dundy County
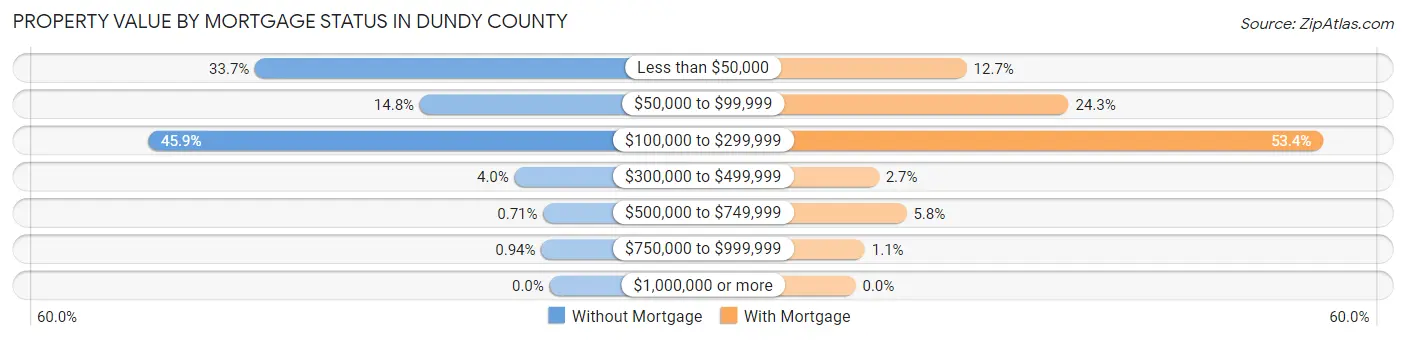
| Property Value | Without Mortgage | With Mortgage |
| Less than $50,000 | 143 (33.7%) | 24 (12.7%) |
| $50,000 to $99,999 | 63 (14.8%) | 46 (24.3%) |
| $100,000 to $299,999 | 195 (45.9%) | 101 (53.4%) |
| $300,000 to $499,999 | 17 (4.0%) | 5 (2.6%) |
| $500,000 to $749,999 | 3 (0.7%) | 11 (5.8%) |
| $750,000 to $999,999 | 4 (0.9%) | 2 (1.1%) |
| $1,000,000 or more | 0 (0.0%) | 0 (0.0%) |
| Total | 425 (100.0%) | 189 (100.0%) |
Household Income by Mortgage Status in Dundy County
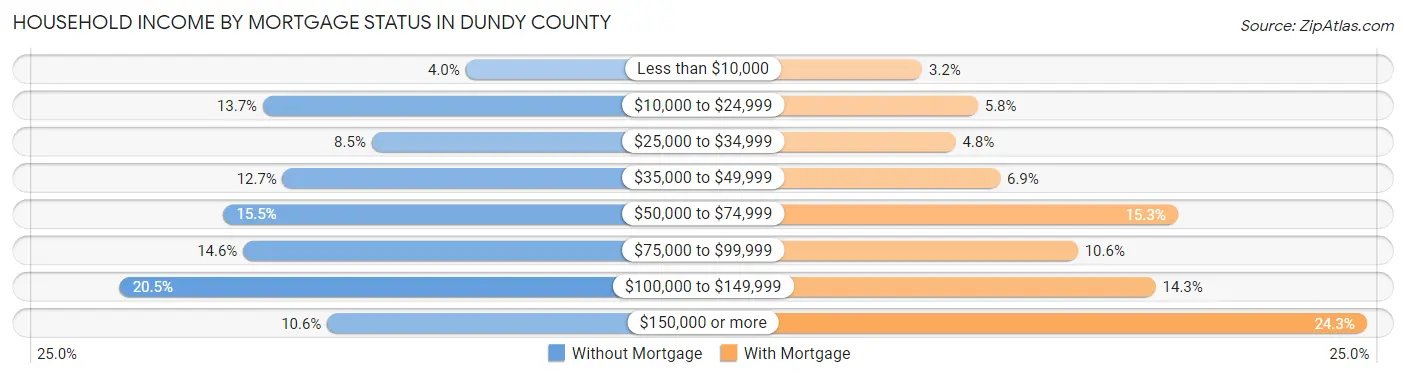
| Household Income | Without Mortgage | With Mortgage |
| Less than $10,000 | 17 (4.0%) | 6 (3.2%) |
| $10,000 to $24,999 | 58 (13.7%) | 11 (5.8%) |
| $25,000 to $34,999 | 36 (8.5%) | 9 (4.8%) |
| $35,000 to $49,999 | 54 (12.7%) | 13 (6.9%) |
| $50,000 to $74,999 | 66 (15.5%) | 29 (15.3%) |
| $75,000 to $99,999 | 62 (14.6%) | 20 (10.6%) |
| $100,000 to $149,999 | 87 (20.5%) | 27 (14.3%) |
| $150,000 or more | 45 (10.6%) | 46 (24.3%) |
| Total | 425 (100.0%) | 189 (100.0%) |
Property Value to Household Income Ratio in Dundy County
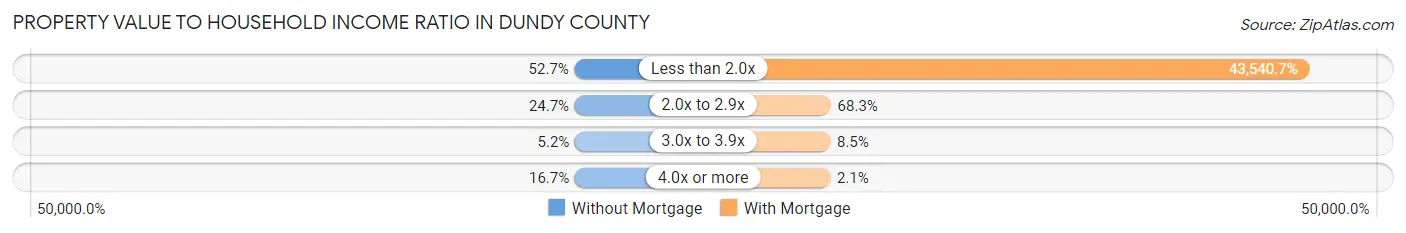
| Value-to-Income Ratio | Without Mortgage | With Mortgage |
| Less than 2.0x | 224 (52.7%) | 82,292 (43,540.7%) |
| 2.0x to 2.9x | 105 (24.7%) | 129 (68.2%) |
| 3.0x to 3.9x | 22 (5.2%) | 16 (8.5%) |
| 4.0x or more | 71 (16.7%) | 4 (2.1%) |
| Total | 425 (100.0%) | 189 (100.0%) |
Real Estate Taxes by Mortgage Status in Dundy County
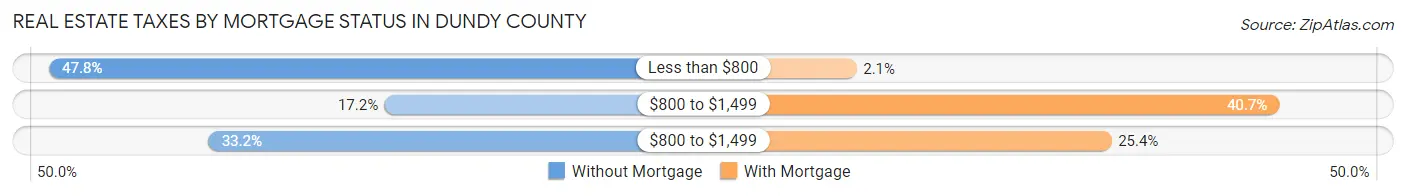
| Property Taxes | Without Mortgage | With Mortgage |
| Less than $800 | 203 (47.8%) | 4 (2.1%) |
| $800 to $1,499 | 73 (17.2%) | 77 (40.7%) |
| $800 to $1,499 | 141 (33.2%) | 48 (25.4%) |
| Total | 425 (100.0%) | 189 (100.0%) |
Health & Disability in Dundy County
Health Insurance Coverage by Age in Dundy County
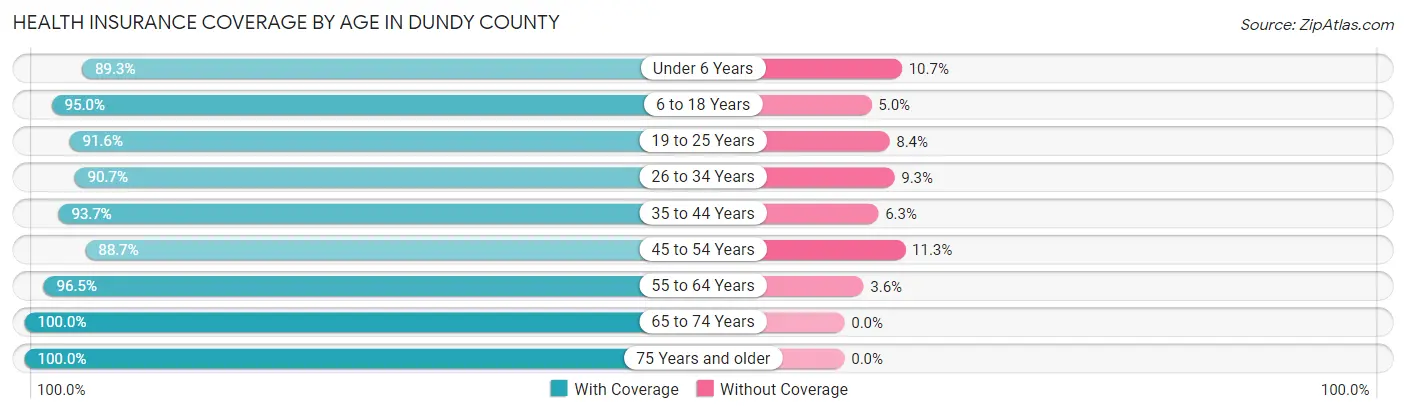
| Age Bracket | With Coverage | Without Coverage |
| Under 6 Years | 150 (89.3%) | 18 (10.7%) |
| 6 to 18 Years | 264 (95.0%) | 14 (5.0%) |
| 19 to 25 Years | 131 (91.6%) | 12 (8.4%) |
| 26 to 34 Years | 146 (90.7%) | 15 (9.3%) |
| 35 to 44 Years | 178 (93.7%) | 12 (6.3%) |
| 45 to 54 Years | 172 (88.7%) | 22 (11.3%) |
| 55 to 64 Years | 299 (96.5%) | 11 (3.5%) |
| 65 to 74 Years | 221 (100.0%) | 0 (0.0%) |
| 75 Years and older | 132 (100.0%) | 0 (0.0%) |
| Total | 1,693 (94.2%) | 104 (5.8%) |
Health Insurance Coverage by Citizenship Status in Dundy County
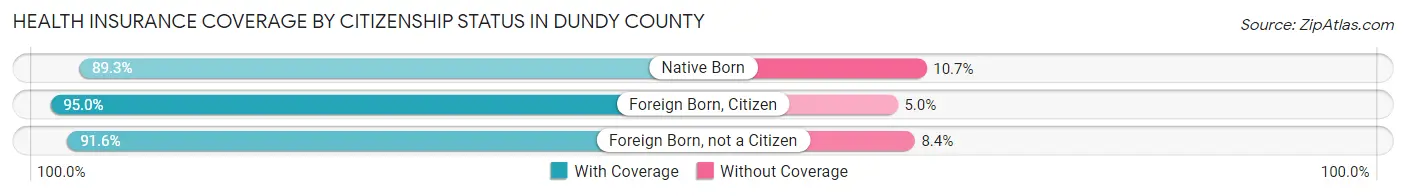
| Citizenship Status | With Coverage | Without Coverage |
| Native Born | 150 (89.3%) | 18 (10.7%) |
| Foreign Born, Citizen | 264 (95.0%) | 14 (5.0%) |
| Foreign Born, not a Citizen | 131 (91.6%) | 12 (8.4%) |
Health Insurance Coverage by Household Income in Dundy County
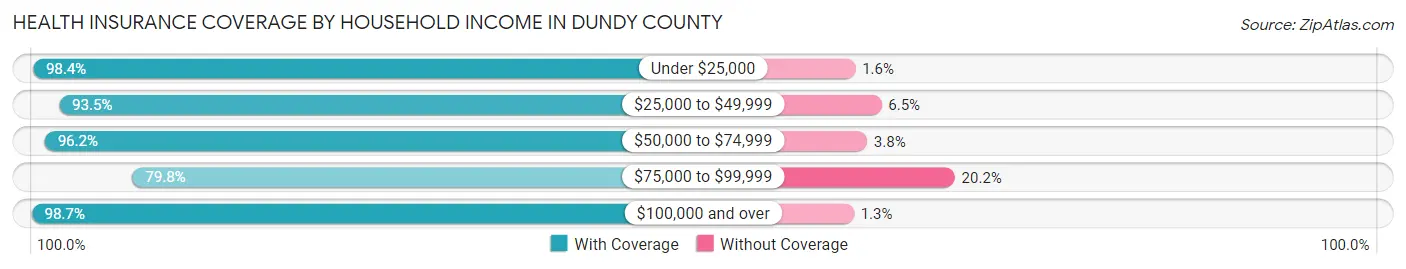
| Household Income | With Coverage | Without Coverage |
| Under $25,000 | 251 (98.4%) | 4 (1.6%) |
| $25,000 to $49,999 | 274 (93.5%) | 19 (6.5%) |
| $50,000 to $74,999 | 255 (96.2%) | 10 (3.8%) |
| $75,000 to $99,999 | 225 (79.8%) | 57 (20.2%) |
| $100,000 and over | 681 (98.7%) | 9 (1.3%) |
Public vs Private Health Insurance Coverage by Age in Dundy County
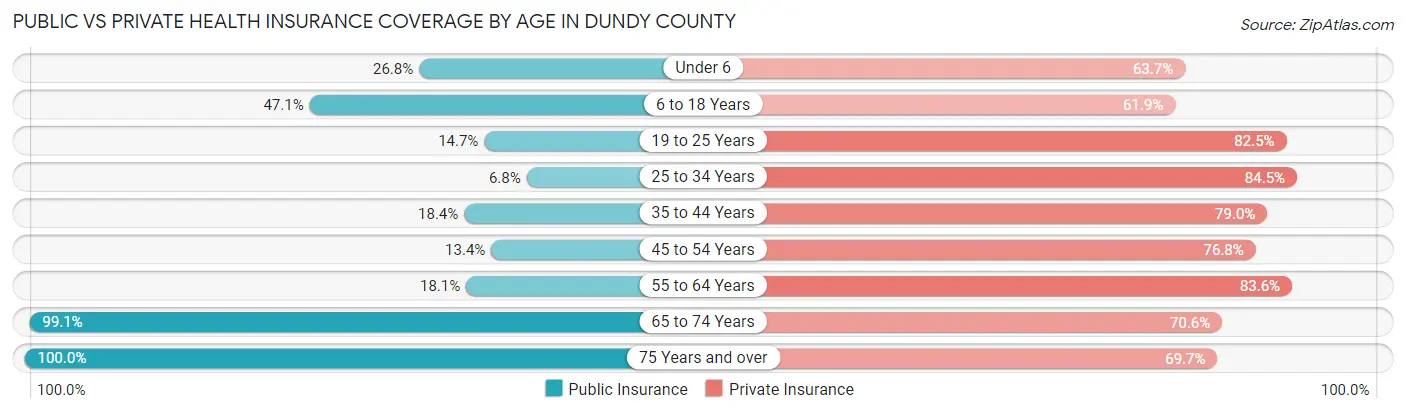
| Age Bracket | Public Insurance | Private Insurance |
| Under 6 | 45 (26.8%) | 107 (63.7%) |
| 6 to 18 Years | 131 (47.1%) | 172 (61.9%) |
| 19 to 25 Years | 21 (14.7%) | 118 (82.5%) |
| 25 to 34 Years | 11 (6.8%) | 136 (84.5%) |
| 35 to 44 Years | 35 (18.4%) | 150 (78.9%) |
| 45 to 54 Years | 26 (13.4%) | 149 (76.8%) |
| 55 to 64 Years | 56 (18.1%) | 259 (83.6%) |
| 65 to 74 Years | 219 (99.1%) | 156 (70.6%) |
| 75 Years and over | 132 (100.0%) | 92 (69.7%) |
| Total | 676 (37.6%) | 1,339 (74.5%) |
Disability Status by Sex by Age in Dundy County
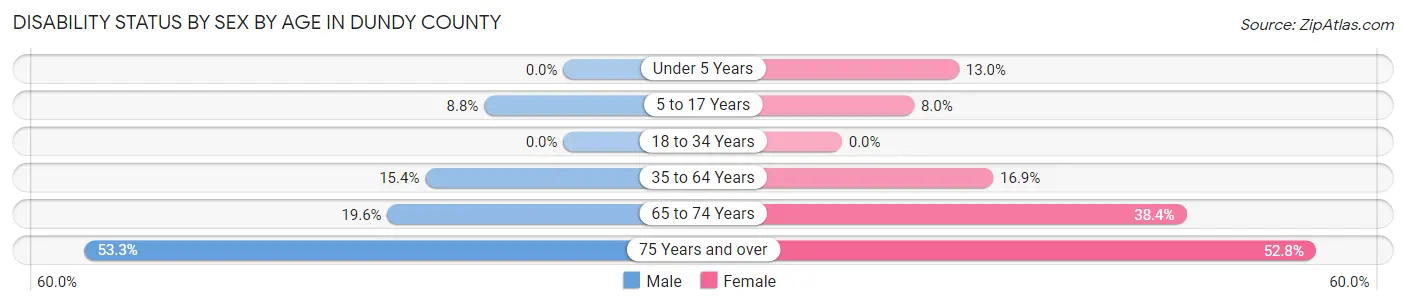
| Age Bracket | Male | Female |
| Under 5 Years | 0 (0.0%) | 9 (13.0%) |
| 5 to 17 Years | 15 (8.8%) | 9 (8.0%) |
| 18 to 34 Years | 0 (0.0%) | 0 (0.0%) |
| 35 to 64 Years | 52 (15.4%) | 60 (16.9%) |
| 65 to 74 Years | 29 (19.6%) | 28 (38.4%) |
| 75 Years and over | 32 (53.3%) | 38 (52.8%) |
Disability Class by Sex by Age in Dundy County
Disability Class: Hearing Difficulty
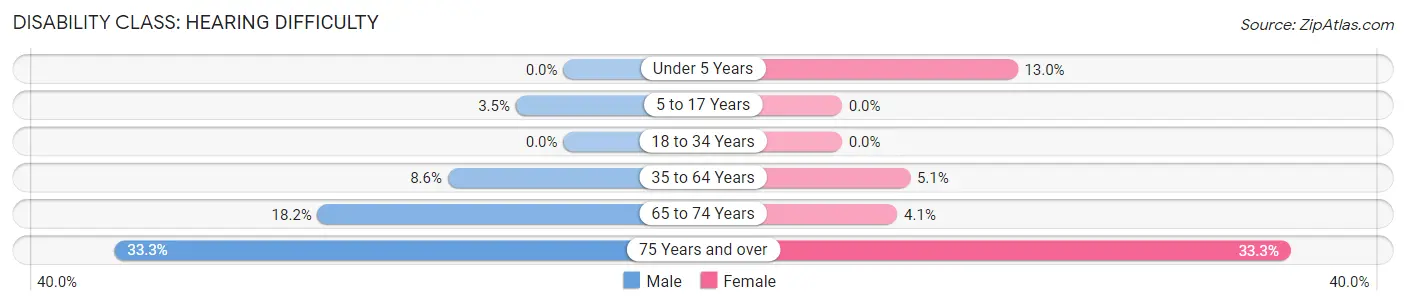
| Age Bracket | Male | Female |
| Under 5 Years | 0 (0.0%) | 9 (13.0%) |
| 5 to 17 Years | 6 (3.5%) | 0 (0.0%) |
| 18 to 34 Years | 0 (0.0%) | 0 (0.0%) |
| 35 to 64 Years | 29 (8.6%) | 18 (5.1%) |
| 65 to 74 Years | 27 (18.2%) | 3 (4.1%) |
| 75 Years and over | 20 (33.3%) | 24 (33.3%) |
Disability Class: Vision Difficulty
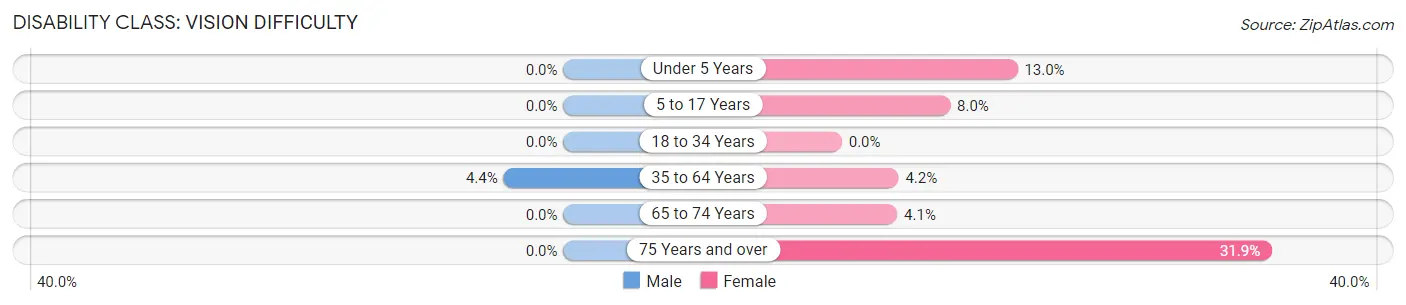
| Age Bracket | Male | Female |
| Under 5 Years | 0 (0.0%) | 9 (13.0%) |
| 5 to 17 Years | 0 (0.0%) | 9 (8.0%) |
| 18 to 34 Years | 0 (0.0%) | 0 (0.0%) |
| 35 to 64 Years | 15 (4.4%) | 15 (4.2%) |
| 65 to 74 Years | 0 (0.0%) | 3 (4.1%) |
| 75 Years and over | 0 (0.0%) | 23 (31.9%) |
Disability Class: Cognitive Difficulty
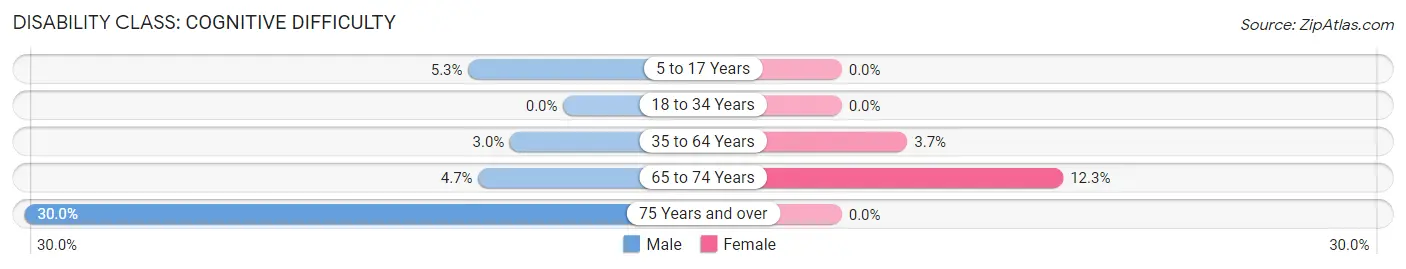
| Age Bracket | Male | Female |
| 5 to 17 Years | 9 (5.3%) | 0 (0.0%) |
| 18 to 34 Years | 0 (0.0%) | 0 (0.0%) |
| 35 to 64 Years | 10 (3.0%) | 13 (3.6%) |
| 65 to 74 Years | 7 (4.7%) | 9 (12.3%) |
| 75 Years and over | 18 (30.0%) | 0 (0.0%) |
Disability Class: Ambulatory Difficulty
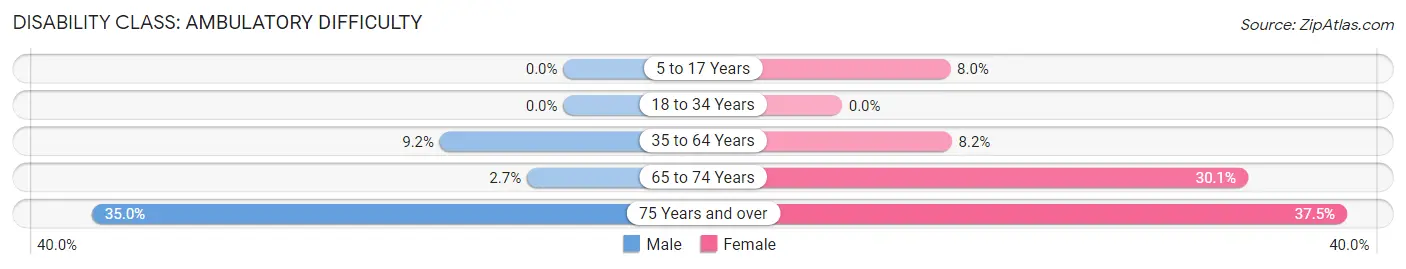
| Age Bracket | Male | Female |
| 5 to 17 Years | 0 (0.0%) | 9 (8.0%) |
| 18 to 34 Years | 0 (0.0%) | 0 (0.0%) |
| 35 to 64 Years | 31 (9.2%) | 29 (8.2%) |
| 65 to 74 Years | 4 (2.7%) | 22 (30.1%) |
| 75 Years and over | 21 (35.0%) | 27 (37.5%) |
Disability Class: Self-Care Difficulty
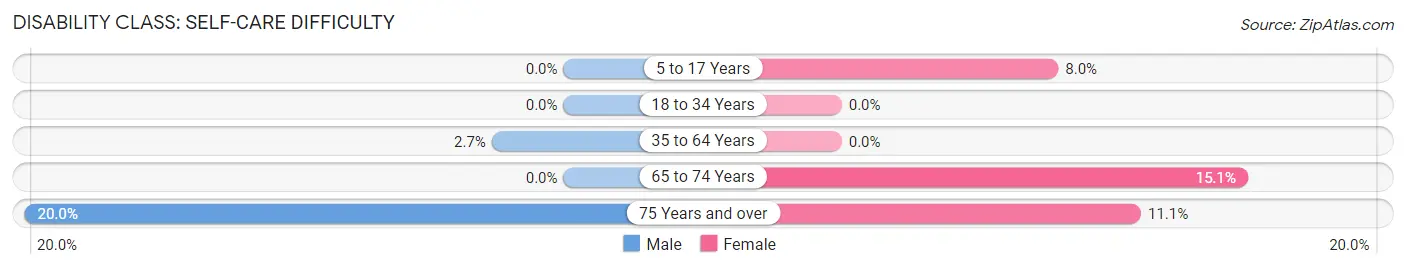
| Age Bracket | Male | Female |
| 5 to 17 Years | 0 (0.0%) | 9 (8.0%) |
| 18 to 34 Years | 0 (0.0%) | 0 (0.0%) |
| 35 to 64 Years | 9 (2.7%) | 0 (0.0%) |
| 65 to 74 Years | 0 (0.0%) | 11 (15.1%) |
| 75 Years and over | 12 (20.0%) | 8 (11.1%) |
Technology Access in Dundy County
Computing Device Access in Dundy County
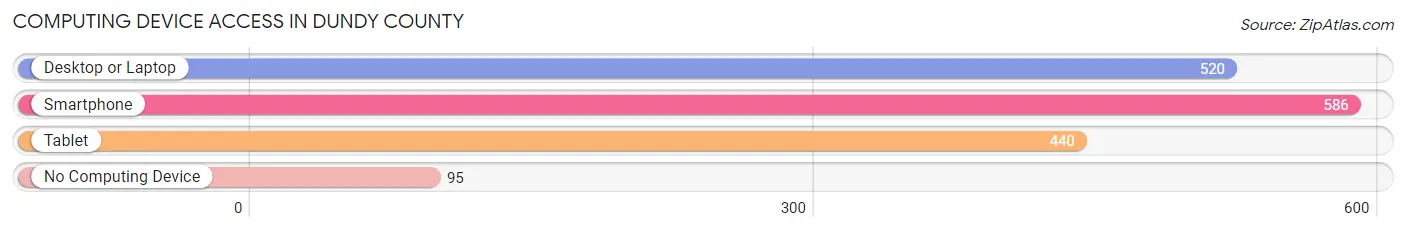
| Device Type | # Households | % Households |
| Desktop or Laptop | 520 | 66.0% |
| Smartphone | 586 | 74.4% |
| Tablet | 440 | 55.8% |
| No Computing Device | 95 | 12.1% |
| Total | 788 | 100.0% |
Internet Access in Dundy County
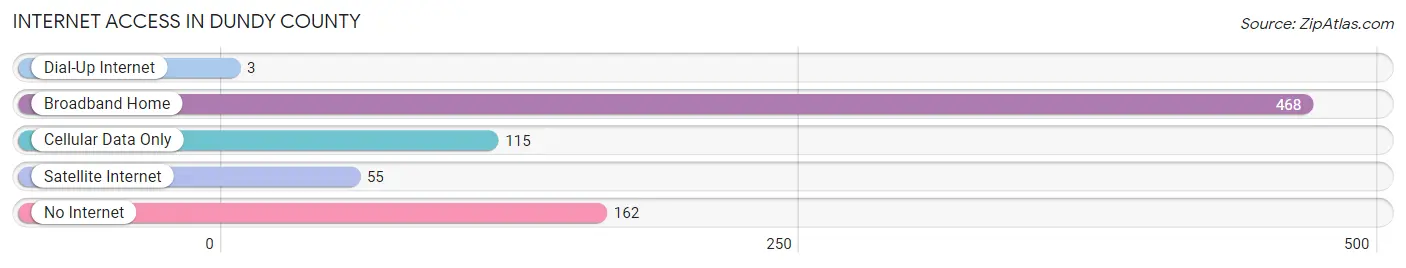
| Internet Type | # Households | % Households |
| Dial-Up Internet | 3 | 0.4% |
| Broadband Home | 468 | 59.4% |
| Cellular Data Only | 115 | 14.6% |
| Satellite Internet | 55 | 7.0% |
| No Internet | 162 | 20.6% |
| Total | 788 | 100.0% |
Dundy County Summary
Dundy County is located in the southwestern corner of Nebraska, and is bordered by Chase County to the north, Perkins County to the east, and Hitchcock County to the south. The county seat is Benkelman, and the county was named after James Dundy, a former territorial judge. The county has a total area of 845 square miles, and a population of 2,845 as of the 2010 census.
Geography
Dundy County is located in the High Plains region of the Great Plains, and is characterized by flat to rolling terrain. The county is drained by the Republican River, which flows through the county from north to south. The county is mostly covered in grassland, with some areas of cropland and wooded areas. The county is also home to several small lakes, including Lake McConaughy, which is located in the northern part of the county.
Climate
Dundy County has a semi-arid climate, with hot summers and cold winters. The average annual temperature is around 54°F, and the average annual precipitation is around 18 inches.
History
Dundy County was established in 1873, and was named after James Dundy, a former territorial judge. The county was originally populated by Native American tribes, including the Pawnee, Omaha, and Sioux. The first settlers arrived in the area in the late 1800s, and the county was officially organized in 1883.
The county was largely agricultural in its early years, with the main crops being wheat, corn, and hay. The county also had a thriving cattle industry, and the town of Benkelman was established in 1887. The county experienced a population boom in the early 1900s, and the town of Wauneta was established in 1906.
Economy
Dundy County’s economy is largely based on agriculture, with the main crops being corn, wheat, and hay. The county also has a thriving cattle industry, and is home to several large feedlots. The county is also home to several manufacturing companies, including a wind turbine manufacturer and a plastics manufacturer.
Demographics
As of the 2010 census, there were 2,845 people, 1,093 households, and 745 families living in the county. The population density was 3.4 people per square mile. The racial makeup of the county was 95.2% White, 0.3% African American, 0.7% Native American, 0.2% Asian, 0.1% Pacific Islander, 2.2% from other races, and 1.3% from two or more races. Hispanic or Latino of any race were 4.2% of the population.
The median income for a household in the county was $37,917, and the median income for a family was $45,938. The per capita income for the county was $17,845. About 11.2% of families and 14.2% of the population were below the poverty line, including 17.2% of those under age 18 and 11.2% of those age 65 or over.
Common Questions
What is Per Capita Income in Dundy County?
Per Capita income in Dundy County is $36,436.
What is the Median Family Income in Dundy County?
Median Family Income in Dundy County is $91,667.
What is the Median Household income in Dundy County?
Median Household Income in Dundy County is $58,977.
What is Income or Wage Gap in Dundy County?
Income or Wage Gap in Dundy County is 37.1%.
Women in Dundy County earn 62.9 cents for every dollar earned by a man.
What is Family Income Deficit in Dundy County?
Family Income Deficit in Dundy County is $9,171.
Families that are below poverty line in Dundy County earn $9,171 less on average than the poverty threshold level.
What is Inequality or Gini Index in Dundy County?
Inequality or Gini Index in Dundy County is 0.46.
What is the Total Population of Dundy County?
Total Population of Dundy County is 1,825.
What is the Total Male Population of Dundy County?
Total Male Population of Dundy County is 943.
What is the Total Female Population of Dundy County?
Total Female Population of Dundy County is 882.
What is the Ratio of Males per 100 Females in Dundy County?
There are 106.92 Males per 100 Females in Dundy County.
What is the Ratio of Females per 100 Males in Dundy County?
There are 93.53 Females per 100 Males in Dundy County.
What is the Median Population Age in Dundy County?
Median Population Age in Dundy County is 42.4 Years.
What is the Average Family Size in Dundy County
Average Family Size in Dundy County is 3.2 People.
What is the Average Household Size in Dundy County
Average Household Size in Dundy County is 2.3 People.
How Large is the Labor Force in Dundy County?
There are 977 People in the Labor Forcein in Dundy County.
What is the Percentage of People in the Labor Force in Dundy County?
66.9% of People are in the Labor Force in Dundy County.
What is the Unemployment Rate in Dundy County?
Unemployment Rate in Dundy County is 0.2%.