Deuel County, NE Map & Demographics
Deuel County Map
Deuel County Overview
$38,667
PER CAPITA INCOME
$71,953
AVG FAMILY INCOME
$58,875
AVG HOUSEHOLD INCOME
39.3%
WAGE / INCOME GAP [ % ]
60.7¢/ $1
WAGE / INCOME GAP [ $ ]
0.48
INEQUALITY / GINI INDEX
1,858
TOTAL POPULATION
918
MALE POPULATION
940
FEMALE POPULATION
97.66
MALES / 100 FEMALES
102.40
FEMALES / 100 MALES
51.0
MEDIAN AGE
2.6
AVG FAMILY SIZE
2.1
AVG HOUSEHOLD SIZE
917
LABOR FORCE [ PEOPLE ]
58.2%
PERCENT IN LABOR FORCE
3.8%
UNEMPLOYMENT RATE
Deuel County Area Codes
Income in Deuel County
Income Overview in Deuel County
Per Capita Income in Deuel County is $38,667, while median incomes of families and households are $71,953 and $58,875 respectively.
| Characteristic | Number | Measure |
| Per Capita Income | 1,858 | $38,667 |
| Median Family Income | 560 | $71,953 |
| Mean Family Income | 560 | $99,483 |
| Median Household Income | 861 | $58,875 |
| Mean Household Income | 861 | $85,270 |
| Income Deficit | 560 | $0 |
| Wage / Income Gap (%) | 1,858 | 39.26% |
| Wage / Income Gap ($) | 1,858 | 60.74¢ per $1 |
| Gini / Inequality Index | 1,858 | 0.48 |
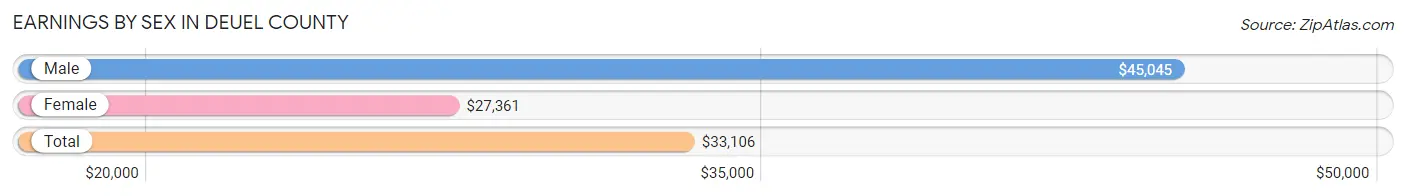
Earnings by Sex in Deuel County
Average Earnings in Deuel County are $33,106, $45,045 for men and $27,361 for women, a difference of 39.3%.
| Sex | Number | Average Earnings |
| Male | 521 (50.5%) | $45,045 |
| Female | 511 (49.5%) | $27,361 |
| Total | 1,032 (100.0%) | $33,106 |
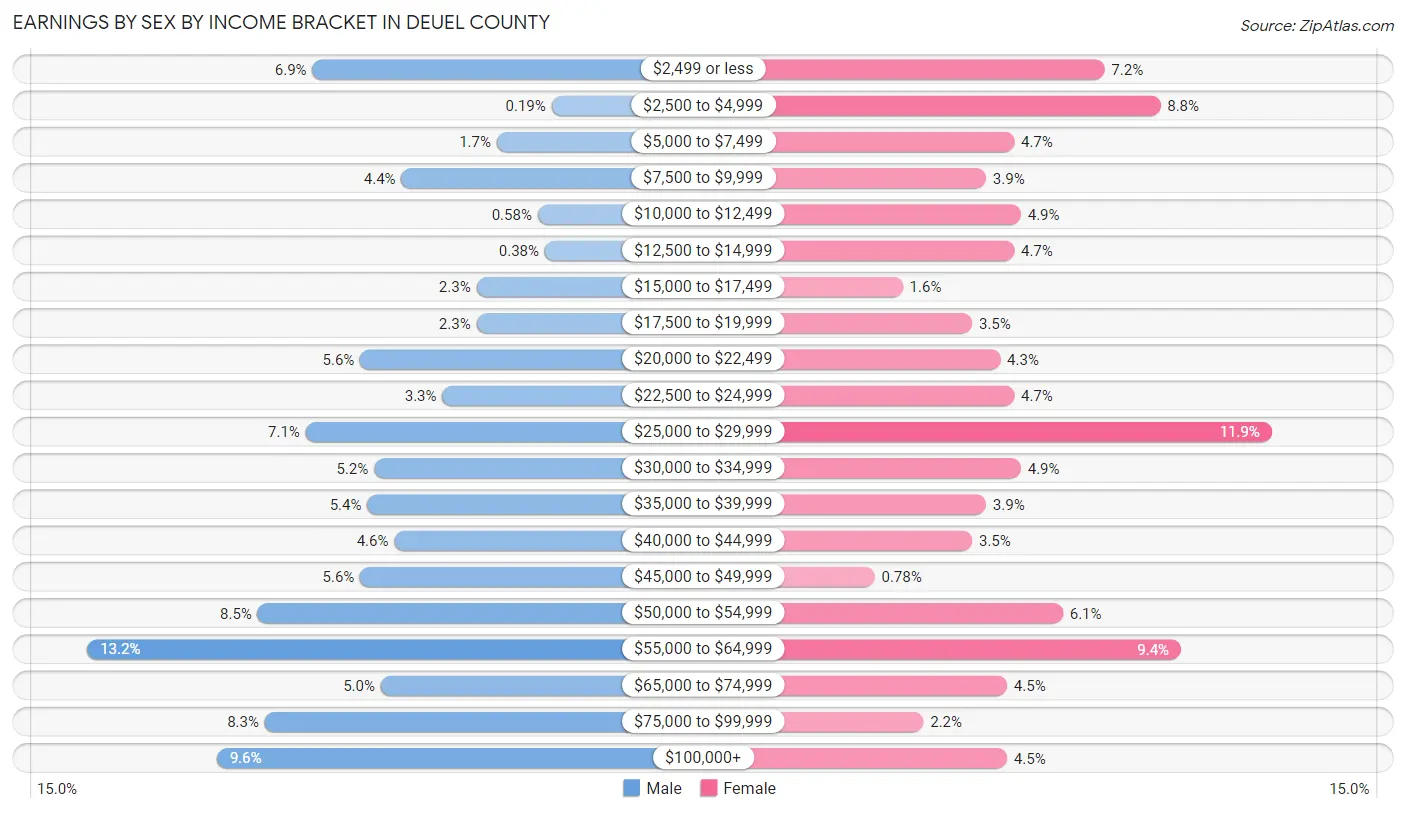
Earnings by Sex by Income Bracket in Deuel County
The most common earnings brackets in Deuel County are $55,000 to $64,999 for men (69 | 13.2%) and $25,000 to $29,999 for women (61 | 11.9%).
| Income | Male | Female |
| $2,499 or less | 36 (6.9%) | 37 (7.2%) |
| $2,500 to $4,999 | 1 (0.2%) | 45 (8.8%) |
| $5,000 to $7,499 | 9 (1.7%) | 24 (4.7%) |
| $7,500 to $9,999 | 23 (4.4%) | 20 (3.9%) |
| $10,000 to $12,499 | 3 (0.6%) | 25 (4.9%) |
| $12,500 to $14,999 | 2 (0.4%) | 24 (4.7%) |
| $15,000 to $17,499 | 12 (2.3%) | 8 (1.6%) |
| $17,500 to $19,999 | 12 (2.3%) | 18 (3.5%) |
| $20,000 to $22,499 | 29 (5.6%) | 22 (4.3%) |
| $22,500 to $24,999 | 17 (3.3%) | 24 (4.7%) |
| $25,000 to $29,999 | 37 (7.1%) | 61 (11.9%) |
| $30,000 to $34,999 | 27 (5.2%) | 25 (4.9%) |
| $35,000 to $39,999 | 28 (5.4%) | 20 (3.9%) |
| $40,000 to $44,999 | 24 (4.6%) | 18 (3.5%) |
| $45,000 to $49,999 | 29 (5.6%) | 4 (0.8%) |
| $50,000 to $54,999 | 44 (8.5%) | 31 (6.1%) |
| $55,000 to $64,999 | 69 (13.2%) | 48 (9.4%) |
| $65,000 to $74,999 | 26 (5.0%) | 23 (4.5%) |
| $75,000 to $99,999 | 43 (8.3%) | 11 (2.1%) |
| $100,000+ | 50 (9.6%) | 23 (4.5%) |
| Total | 521 (100.0%) | 511 (100.0%) |
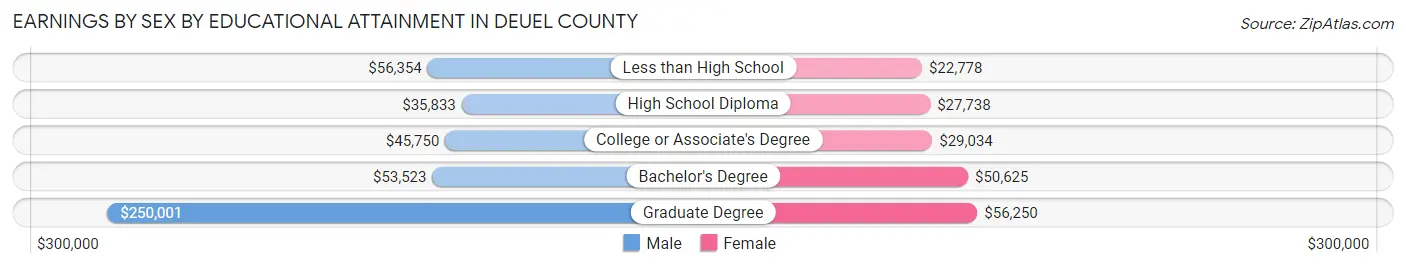
Earnings by Sex by Educational Attainment in Deuel County
Average earnings in Deuel County are $50,000 for men and $29,327 for women, a difference of 41.3%. Men with an educational attainment of graduate degree enjoy the highest average annual earnings of $250,001, while those with high school diploma education earn the least with $35,833. Women with an educational attainment of graduate degree earn the most with the average annual earnings of $56,250, while those with less than high school education have the smallest earnings of $22,778.
| Educational Attainment | Male Income | Female Income |
| Less than High School | $56,354 | $22,778 |
| High School Diploma | $35,833 | $27,738 |
| College or Associate's Degree | $45,750 | $29,034 |
| Bachelor's Degree | $53,523 | $50,625 |
| Graduate Degree | $250,001 | $56,250 |
| Total | $50,000 | $29,327 |
Family Income in Deuel County
Family Income Brackets in Deuel County
According to the Deuel County family income data, there are 151 families falling into the $50,000 to $74,999 income range, which is the most common income bracket and makes up 27.0% of all families. Conversely, the less than $10,000 income bracket is the least frequent group with only 8 families (1.4%) belonging to this category.
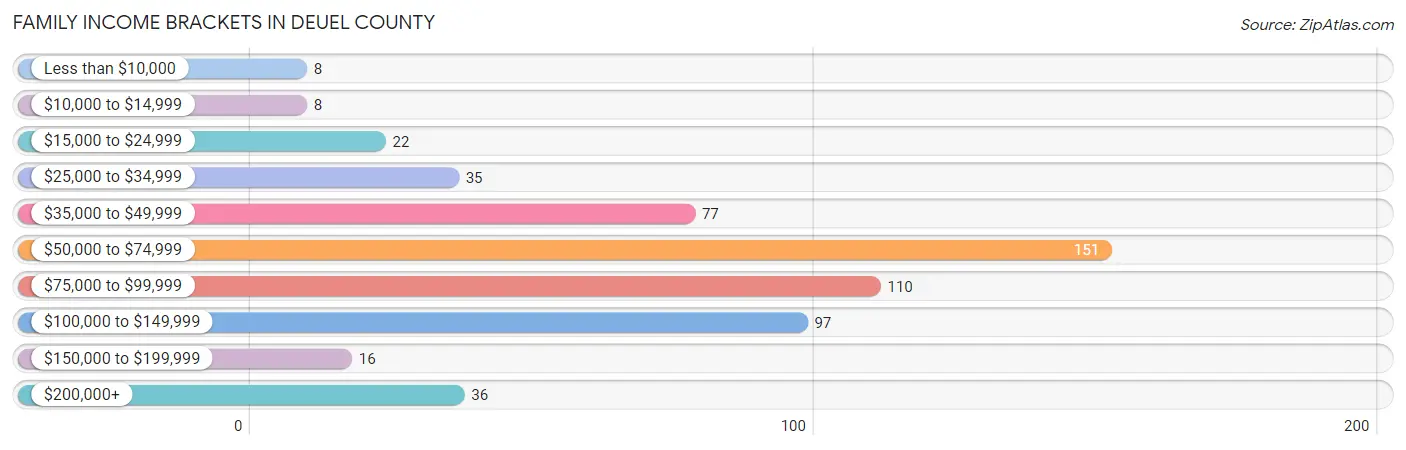
| Income Bracket | # Families | % Families |
| Less than $10,000 | 8 | 1.4% |
| $10,000 to $14,999 | 8 | 1.4% |
| $15,000 to $24,999 | 22 | 3.9% |
| $25,000 to $34,999 | 35 | 6.3% |
| $35,000 to $49,999 | 77 | 13.8% |
| $50,000 to $74,999 | 151 | 27.0% |
| $75,000 to $99,999 | 110 | 19.6% |
| $100,000 to $149,999 | 97 | 17.3% |
| $150,000 to $199,999 | 16 | 2.9% |
| $200,000+ | 36 | 6.4% |
Family Income by Famaliy Size in Deuel County
4-person families (45 | 8.0%) account for the highest median family income in Deuel County with $88,125 per family, while 2-person families (332 | 59.3%) have the highest median income of $33,125 per family member.
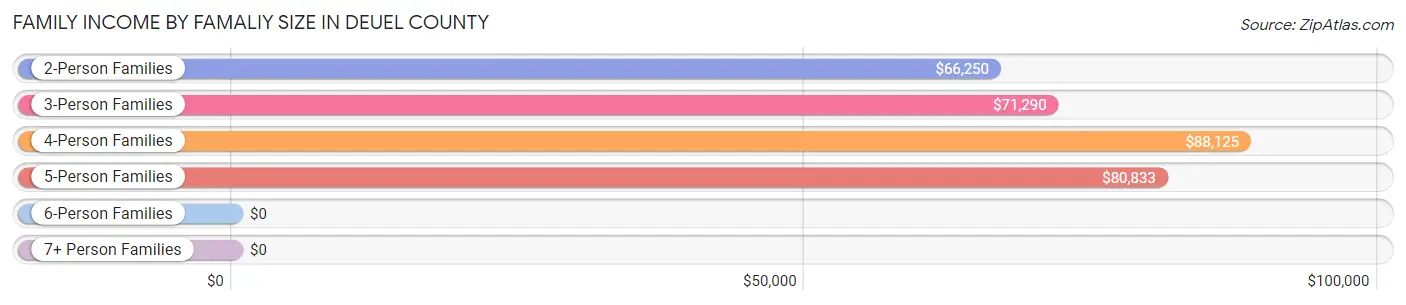
| Income Bracket | # Families | Median Income |
| 2-Person Families | 332 (59.3%) | $66,250 |
| 3-Person Families | 132 (23.6%) | $71,290 |
| 4-Person Families | 45 (8.0%) | $88,125 |
| 5-Person Families | 36 (6.4%) | $80,833 |
| 6-Person Families | 15 (2.7%) | $0 |
| 7+ Person Families | 0 (0.0%) | $0 |
| Total | 560 (100.0%) | $71,953 |
Family Income by Number of Earners in Deuel County
The median family income in Deuel County is $71,953, with families comprising 2 earners (241) having the highest median family income of $94,792, while families with no earners (79) have the lowest median family income of $37,250, accounting for 43.0% and 14.1% of families, respectively.
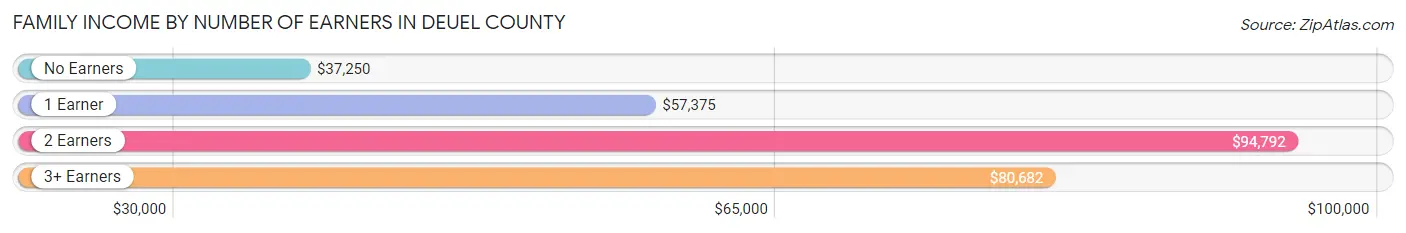
| Number of Earners | # Families | Median Income |
| No Earners | 79 (14.1%) | $37,250 |
| 1 Earner | 182 (32.5%) | $57,375 |
| 2 Earners | 241 (43.0%) | $94,792 |
| 3+ Earners | 58 (10.4%) | $80,682 |
| Total | 560 (100.0%) | $71,953 |
Household Income in Deuel County
Household Income Brackets in Deuel County
With 239 households falling in the category, the $50,000 to $74,999 income range is the most frequent in Deuel County, accounting for 27.8% of all households. In contrast, only 16 households (1.9%) fall into the $150,000 to $199,999 income bracket, making it the least populous group.
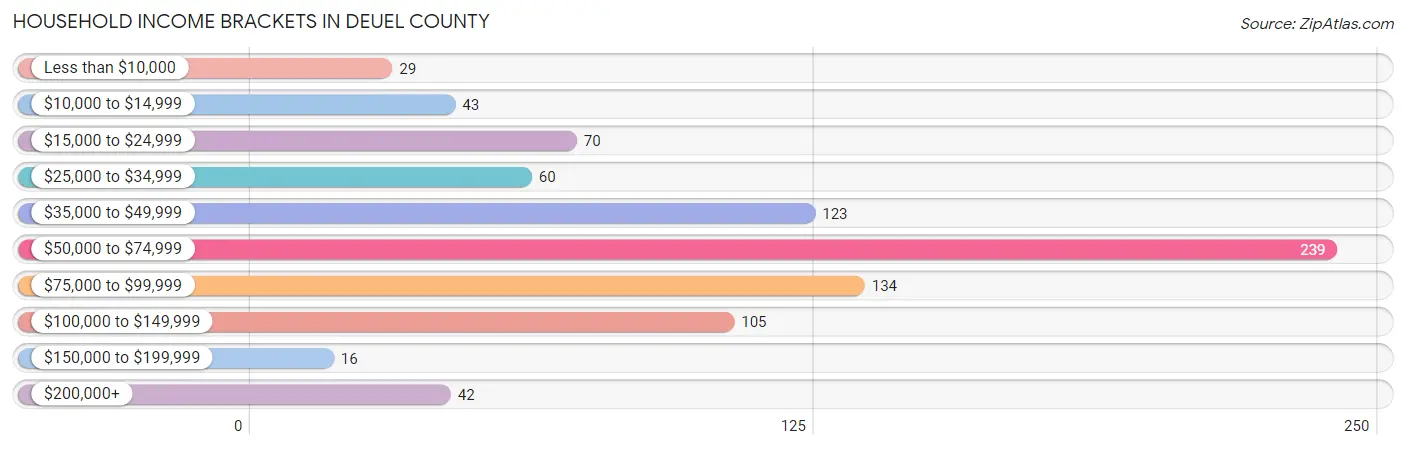
| Income Bracket | # Households | % Households |
| Less than $10,000 | 29 | 3.4% |
| $10,000 to $14,999 | 43 | 5.0% |
| $15,000 to $24,999 | 70 | 8.1% |
| $25,000 to $34,999 | 60 | 7.0% |
| $35,000 to $49,999 | 123 | 14.3% |
| $50,000 to $74,999 | 239 | 27.8% |
| $75,000 to $99,999 | 134 | 15.6% |
| $100,000 to $149,999 | 105 | 12.2% |
| $150,000 to $199,999 | 16 | 1.9% |
| $200,000+ | 42 | 4.9% |
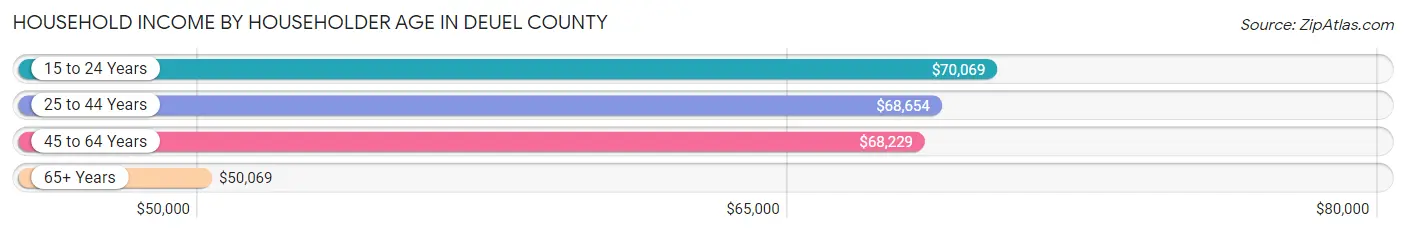
Household Income by Householder Age in Deuel County
The median household income in Deuel County is $58,875, with the highest median household income of $70,069 found in the 15 to 24 years age bracket for the primary householder. A total of 35 households (4.1%) fall into this category. Meanwhile, the 65+ years age bracket for the primary householder has the lowest median household income of $50,069, with 333 households (38.7%) in this group.
| Income Bracket | # Households | Median Income |
| 15 to 24 Years | 35 (4.1%) | $70,069 |
| 25 to 44 Years | 170 (19.7%) | $68,654 |
| 45 to 64 Years | 323 (37.5%) | $68,229 |
| 65+ Years | 333 (38.7%) | $50,069 |
| Total | 861 (100.0%) | $58,875 |
Poverty in Deuel County
Income Below Poverty by Sex and Age in Deuel County
With 5.7% poverty level for males and 8.6% for females among the residents of Deuel County, 16 and 17 year old males and 75 year old and over females are the most vulnerable to poverty, with 2 males (15.4%) and 26 females (24.5%) in their respective age groups living below the poverty level.
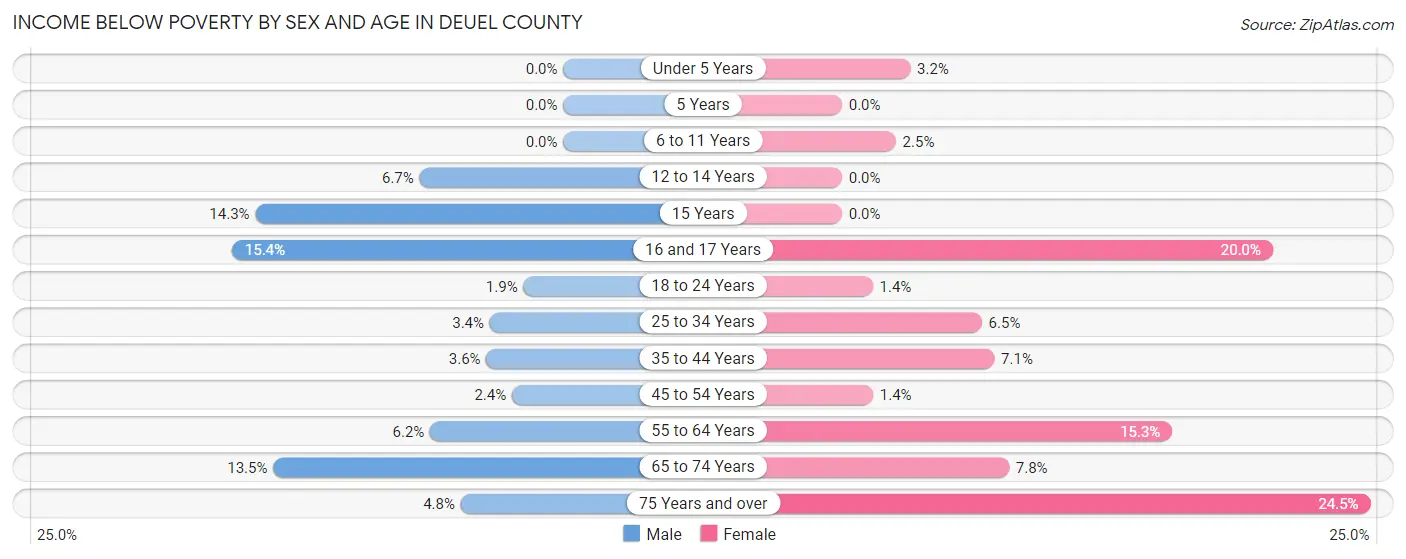
| Age Bracket | Male | Female |
| Under 5 Years | 0 (0.0%) | 2 (3.2%) |
| 5 Years | 0 (0.0%) | 0 (0.0%) |
| 6 to 11 Years | 0 (0.0%) | 1 (2.5%) |
| 12 to 14 Years | 2 (6.7%) | 0 (0.0%) |
| 15 Years | 2 (14.3%) | 0 (0.0%) |
| 16 and 17 Years | 2 (15.4%) | 3 (20.0%) |
| 18 to 24 Years | 1 (1.8%) | 1 (1.4%) |
| 25 to 34 Years | 3 (3.4%) | 5 (6.5%) |
| 35 to 44 Years | 3 (3.6%) | 7 (7.1%) |
| 45 to 54 Years | 3 (2.4%) | 2 (1.4%) |
| 55 to 64 Years | 11 (6.2%) | 23 (15.3%) |
| 65 to 74 Years | 21 (13.5%) | 10 (7.7%) |
| 75 Years and over | 4 (4.8%) | 26 (24.5%) |
| Total | 52 (5.7%) | 80 (8.6%) |
Income Above Poverty by Sex and Age in Deuel County
According to the poverty statistics in Deuel County, males aged under 5 years and females aged 5 years are the age groups that are most secure financially, with 100.0% of males and 100.0% of females in these age groups living above the poverty line.
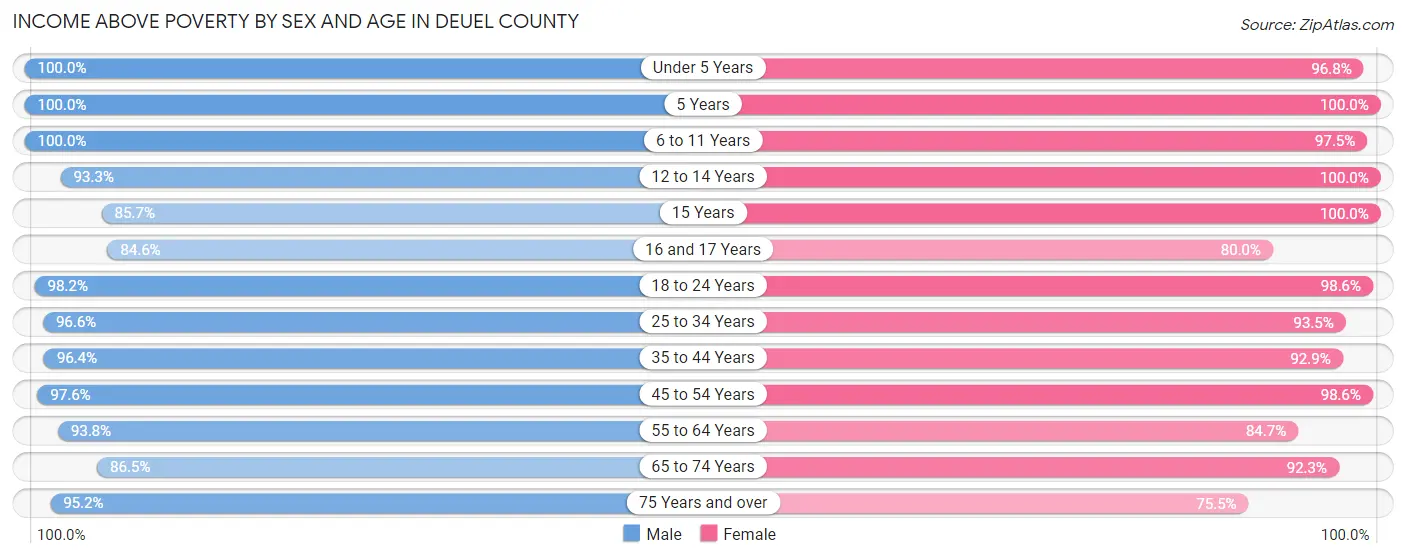
| Age Bracket | Male | Female |
| Under 5 Years | 50 (100.0%) | 61 (96.8%) |
| 5 Years | 2 (100.0%) | 7 (100.0%) |
| 6 to 11 Years | 37 (100.0%) | 39 (97.5%) |
| 12 to 14 Years | 28 (93.3%) | 31 (100.0%) |
| 15 Years | 12 (85.7%) | 5 (100.0%) |
| 16 and 17 Years | 11 (84.6%) | 12 (80.0%) |
| 18 to 24 Years | 53 (98.2%) | 69 (98.6%) |
| 25 to 34 Years | 85 (96.6%) | 72 (93.5%) |
| 35 to 44 Years | 81 (96.4%) | 92 (92.9%) |
| 45 to 54 Years | 123 (97.6%) | 137 (98.6%) |
| 55 to 64 Years | 167 (93.8%) | 127 (84.7%) |
| 65 to 74 Years | 135 (86.5%) | 119 (92.2%) |
| 75 Years and over | 80 (95.2%) | 80 (75.5%) |
| Total | 864 (94.3%) | 851 (91.4%) |
Income Below Poverty Among Married-Couple Families in Deuel County
The poverty statistics for married-couple families in Deuel County show that 3.2% or 14 of the total 437 families live below the poverty line. Families with 1 or 2 children have the highest poverty rate of 3.7%, comprising of 4 families. On the other hand, families with 3 or 4 children have the lowest poverty rate of 0.0%, which includes 0 families.
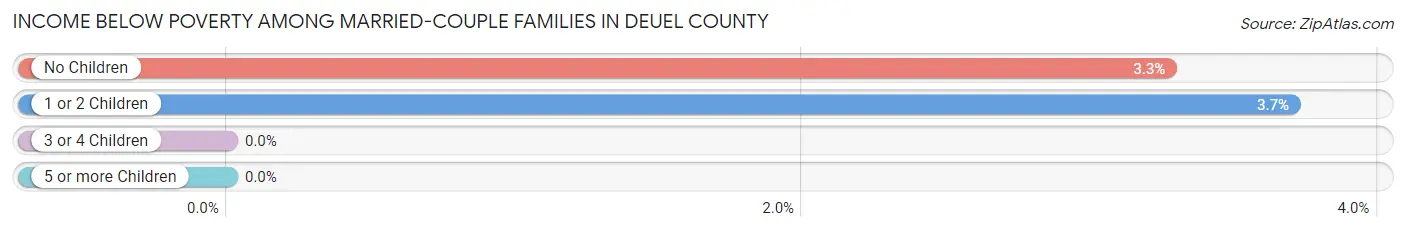
| Children | Above Poverty | Below Poverty |
| No Children | 296 (96.7%) | 10 (3.3%) |
| 1 or 2 Children | 104 (96.3%) | 4 (3.7%) |
| 3 or 4 Children | 23 (100.0%) | 0 (0.0%) |
| 5 or more Children | 0 (0.0%) | 0 (0.0%) |
| Total | 423 (96.8%) | 14 (3.2%) |
Income Below Poverty Among Single-Parent Households in Deuel County
According to the poverty data in Deuel County, 15.0% or 6 single-father households and 1.2% or 1 single-mother households are living below the poverty line. Among single-father households, those with no children have the highest poverty rate, with 6 households (33.3%) experiencing poverty. Likewise, among single-mother households, those with 3 or 4 children have the highest poverty rate, with 1 households (7.1%) falling below the poverty line.
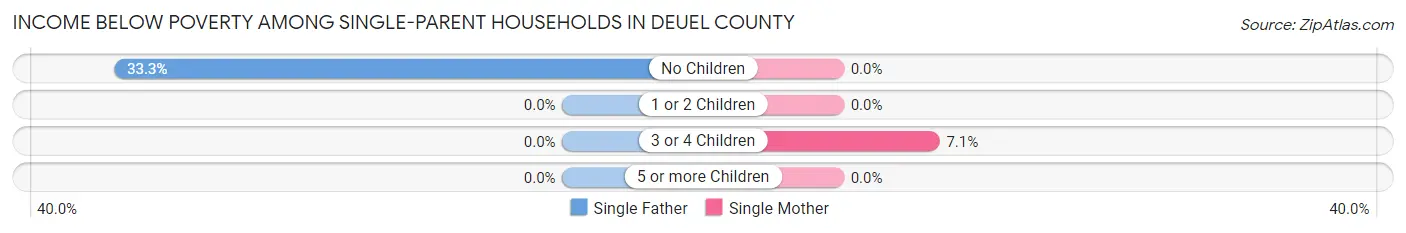
| Children | Single Father | Single Mother |
| No Children | 6 (33.3%) | 0 (0.0%) |
| 1 or 2 Children | 0 (0.0%) | 0 (0.0%) |
| 3 or 4 Children | 0 (0.0%) | 1 (7.1%) |
| 5 or more Children | 0 (0.0%) | 0 (0.0%) |
| Total | 6 (15.0%) | 1 (1.2%) |
Income Below Poverty Among Married-Couple vs Single-Parent Households in Deuel County
The poverty data for Deuel County shows that 14 of the married-couple family households (3.2%) and 7 of the single-parent households (5.7%) are living below the poverty level. Within the married-couple family households, those with 1 or 2 children have the highest poverty rate, with 4 households (3.7%) falling below the poverty line. Among the single-parent households, those with no children have the highest poverty rate, with 6 household (10.3%) living below poverty.
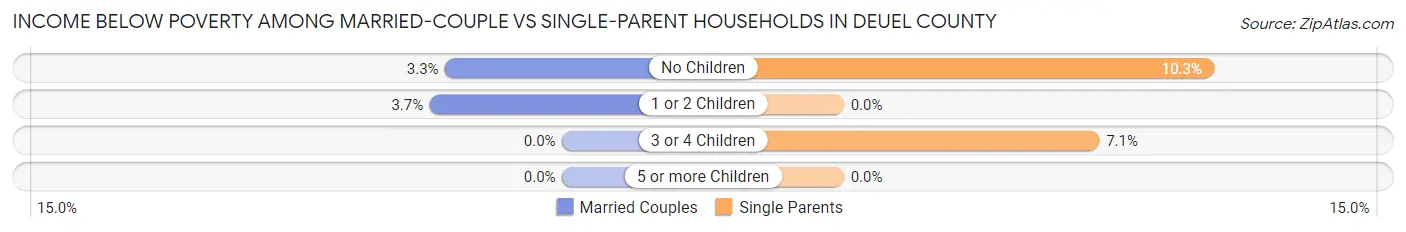
| Children | Married-Couple Families | Single-Parent Households |
| No Children | 10 (3.3%) | 6 (10.3%) |
| 1 or 2 Children | 4 (3.7%) | 0 (0.0%) |
| 3 or 4 Children | 0 (0.0%) | 1 (7.1%) |
| 5 or more Children | 0 (0.0%) | 0 (0.0%) |
| Total | 14 (3.2%) | 7 (5.7%) |
Race in Deuel County
The most populous races in Deuel County are White / Caucasian (1,676 | 90.2%), Hispanic or Latino (216 | 11.6%), and Two or more Races (124 | 6.7%).
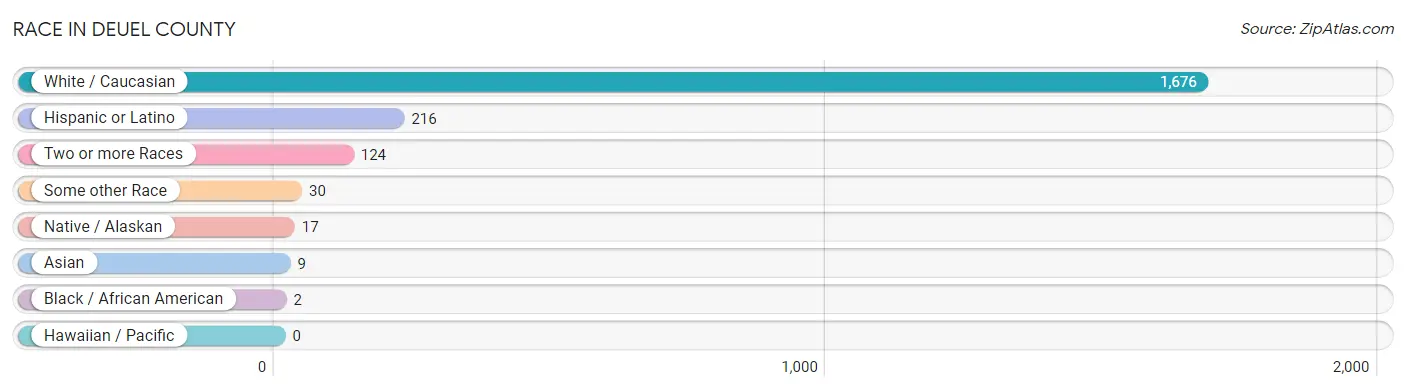
| Race | # Population | % Population |
| Asian | 9 | 0.5% |
| Black / African American | 2 | 0.1% |
| Hawaiian / Pacific | 0 | 0.0% |
| Hispanic or Latino | 216 | 11.6% |
| Native / Alaskan | 17 | 0.9% |
| White / Caucasian | 1,676 | 90.2% |
| Two or more Races | 124 | 6.7% |
| Some other Race | 30 | 1.6% |
| Total | 1,858 | 100.0% |
Ancestry in Deuel County
The most populous ancestries reported in Deuel County are German (699 | 37.6%), English (222 | 11.9%), Irish (193 | 10.4%), Mexican (184 | 9.9%), and American (94 | 5.1%), together accounting for 74.9% of all Deuel County residents.
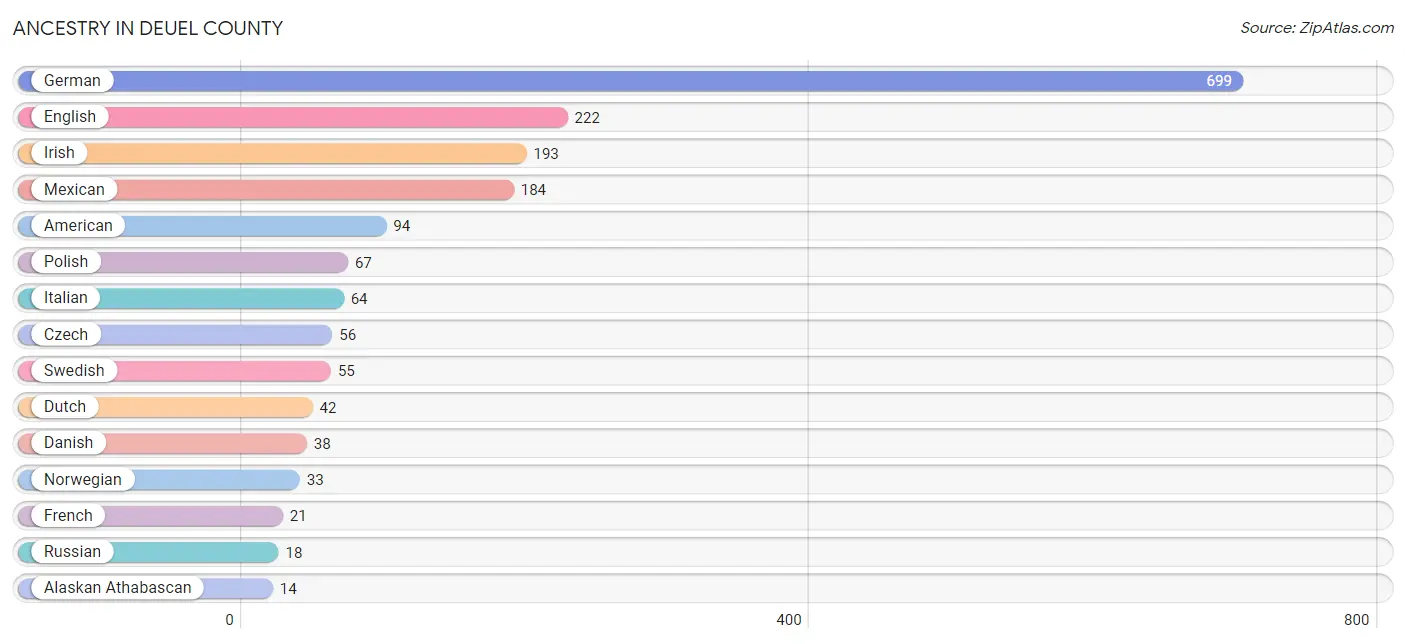
| Ancestry | # Population | % Population |
| Alaskan Athabascan | 14 | 0.7% |
| American | 94 | 5.1% |
| Arab | 3 | 0.2% |
| Austrian | 2 | 0.1% |
| Bhutanese | 4 | 0.2% |
| British | 4 | 0.2% |
| Cherokee | 4 | 0.2% |
| Chippewa | 2 | 0.1% |
| Czech | 56 | 3.0% |
| Danish | 38 | 2.1% |
| Dutch | 42 | 2.3% |
| English | 222 | 11.9% |
| European | 11 | 0.6% |
| French | 21 | 1.1% |
| French Canadian | 3 | 0.2% |
| German | 699 | 37.6% |
| Irish | 193 | 10.4% |
| Italian | 64 | 3.4% |
| Korean | 8 | 0.4% |
| Lebanese | 3 | 0.2% |
| Mexican | 184 | 9.9% |
| Mexican American Indian | 3 | 0.2% |
| Navajo | 9 | 0.5% |
| Norwegian | 33 | 1.8% |
| Pennsylvania German | 2 | 0.1% |
| Polish | 67 | 3.6% |
| Potawatomi | 2 | 0.1% |
| Russian | 18 | 1.0% |
| Scandinavian | 3 | 0.2% |
| Scotch-Irish | 7 | 0.4% |
| Scottish | 13 | 0.7% |
| Sioux | 3 | 0.2% |
| Spaniard | 12 | 0.6% |
| Spanish | 10 | 0.5% |
| Swedish | 55 | 3.0% |
| Syrian | 3 | 0.2% |
| Tlingit-Haida | 1 | 0.1% |
| Welsh | 3 | 0.2% |
| Yup'ik | 14 | 0.7% | View All 39 Rows |
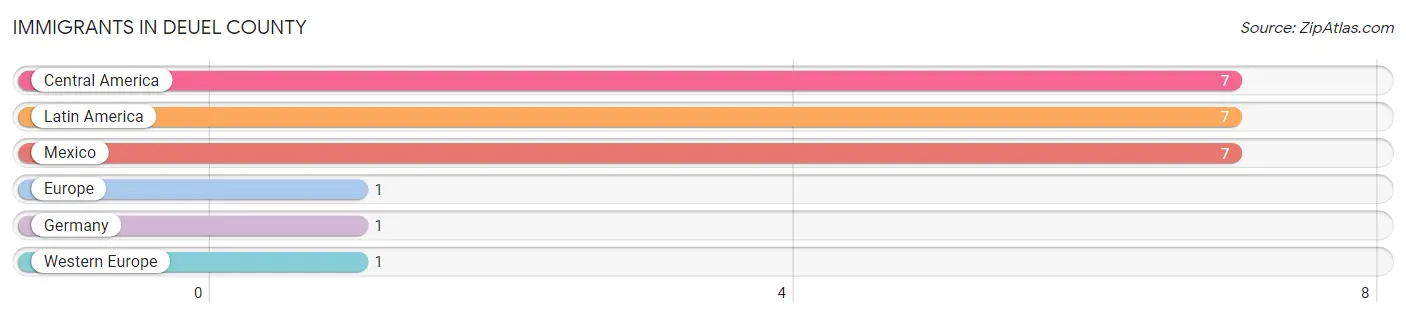
Immigrants in Deuel County
The most numerous immigrant groups reported in Deuel County came from Central America (7 | 0.4%), Latin America (7 | 0.4%), Mexico (7 | 0.4%), Europe (1 | 0.1%), and Germany (1 | 0.1%), together accounting for 1.2% of all Deuel County residents.
| Immigration Origin | # Population | % Population |
| Central America | 7 | 0.4% |
| Europe | 1 | 0.1% |
| Germany | 1 | 0.1% |
| Latin America | 7 | 0.4% |
| Mexico | 7 | 0.4% |
| Western Europe | 1 | 0.1% | View All 6 Rows |
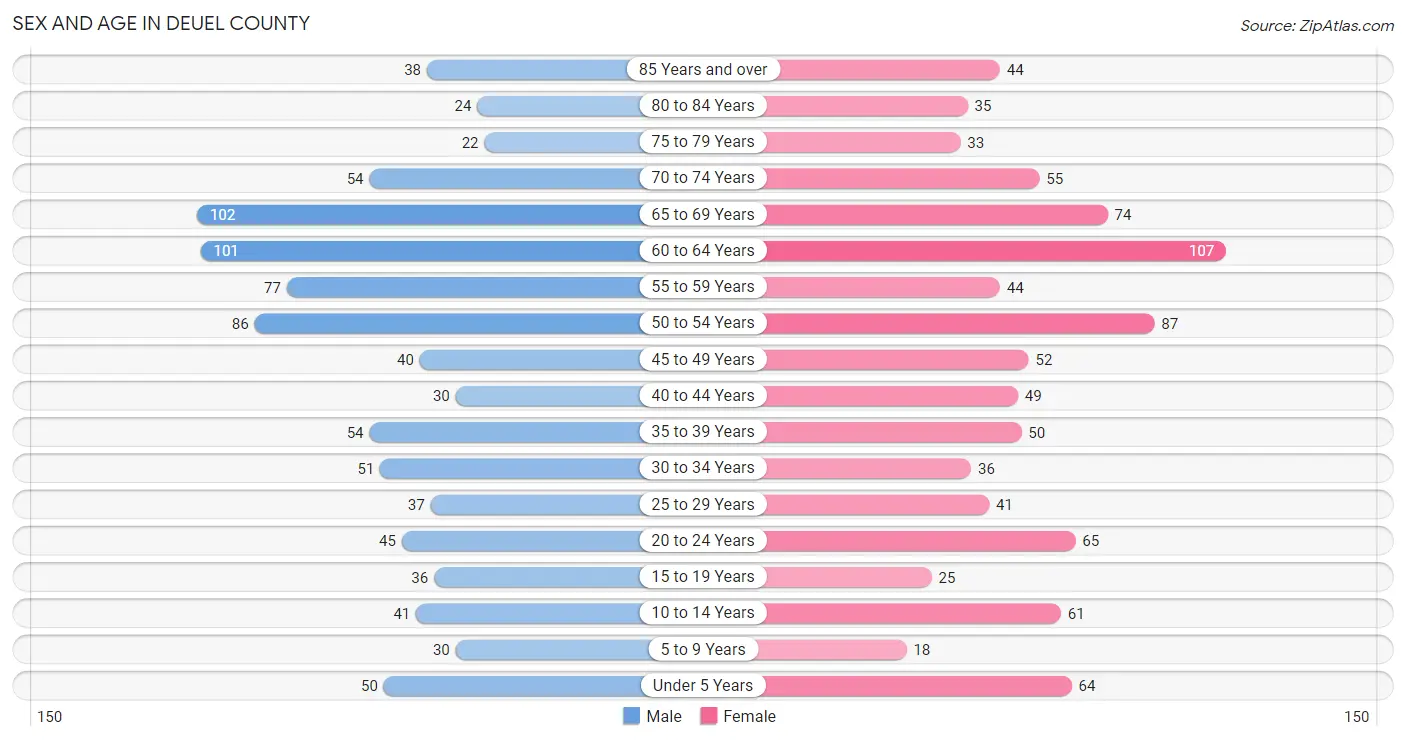
Sex and Age in Deuel County
Sex and Age in Deuel County
The most populous age groups in Deuel County are 65 to 69 Years (102 | 11.1%) for men and 60 to 64 Years (107 | 11.4%) for women.
| Age Bracket | Male | Female |
| Under 5 Years | 50 (5.4%) | 64 (6.8%) |
| 5 to 9 Years | 30 (3.3%) | 18 (1.9%) |
| 10 to 14 Years | 41 (4.5%) | 61 (6.5%) |
| 15 to 19 Years | 36 (3.9%) | 25 (2.7%) |
| 20 to 24 Years | 45 (4.9%) | 65 (6.9%) |
| 25 to 29 Years | 37 (4.0%) | 41 (4.4%) |
| 30 to 34 Years | 51 (5.6%) | 36 (3.8%) |
| 35 to 39 Years | 54 (5.9%) | 50 (5.3%) |
| 40 to 44 Years | 30 (3.3%) | 49 (5.2%) |
| 45 to 49 Years | 40 (4.4%) | 52 (5.5%) |
| 50 to 54 Years | 86 (9.4%) | 87 (9.3%) |
| 55 to 59 Years | 77 (8.4%) | 44 (4.7%) |
| 60 to 64 Years | 101 (11.0%) | 107 (11.4%) |
| 65 to 69 Years | 102 (11.1%) | 74 (7.9%) |
| 70 to 74 Years | 54 (5.9%) | 55 (5.9%) |
| 75 to 79 Years | 22 (2.4%) | 33 (3.5%) |
| 80 to 84 Years | 24 (2.6%) | 35 (3.7%) |
| 85 Years and over | 38 (4.1%) | 44 (4.7%) |
| Total | 918 (100.0%) | 940 (100.0%) |
Families and Households in Deuel County
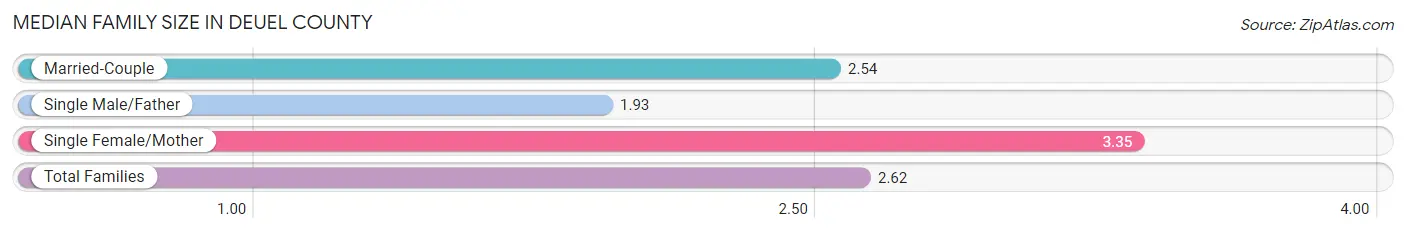
Median Family Size in Deuel County
The median family size in Deuel County is 2.62 persons per family, with single female/mother families (83 | 14.8%) accounting for the largest median family size of 3.35 persons per family. On the other hand, single male/father families (40 | 7.1%) represent the smallest median family size with 1.93 persons per family.
| Family Type | # Families | Family Size |
| Married-Couple | 437 (78.0%) | 2.54 |
| Single Male/Father | 40 (7.1%) | 1.93 |
| Single Female/Mother | 83 (14.8%) | 3.35 |
| Total Families | 560 (100.0%) | 2.62 |
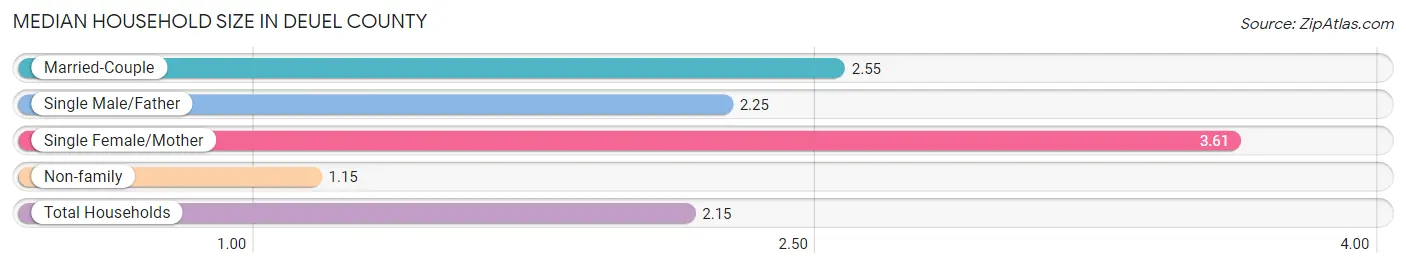
Median Household Size in Deuel County
The median household size in Deuel County is 2.15 persons per household, with single female/mother households (83 | 9.6%) accounting for the largest median household size of 3.61 persons per household. non-family households (301 | 35.0%) represent the smallest median household size with 1.15 persons per household.
| Household Type | # Households | Household Size |
| Married-Couple | 437 (50.7%) | 2.55 |
| Single Male/Father | 40 (4.6%) | 2.25 |
| Single Female/Mother | 83 (9.6%) | 3.61 |
| Non-family | 301 (35.0%) | 1.15 |
| Total Households | 861 (100.0%) | 2.15 |
Household Size by Marriage Status in Deuel County
Out of a total of 861 households in Deuel County, 560 (65.0%) are family households, while 301 (35.0%) are nonfamily households. The most numerous type of family households are 2-person households, comprising 310, and the most common type of nonfamily households are 1-person households, comprising 258.
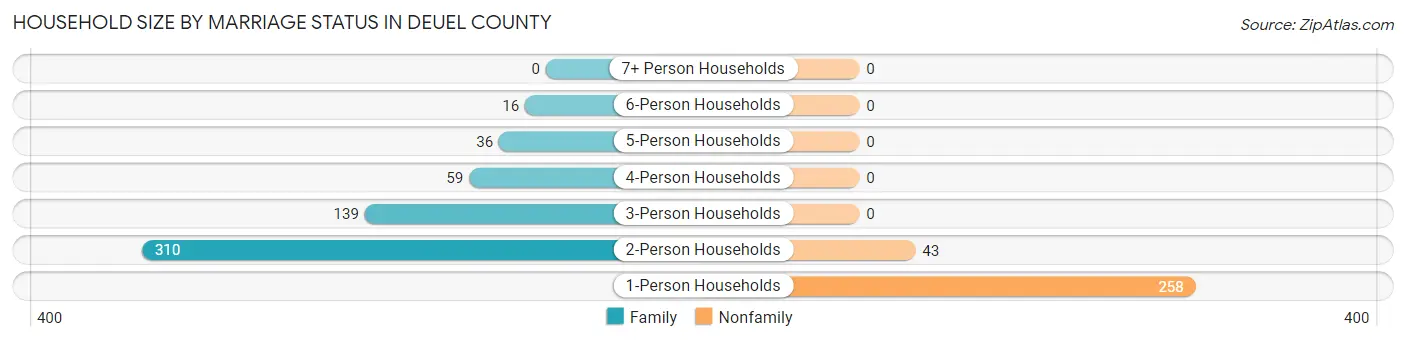
| Household Size | Family Households | Nonfamily Households |
| 1-Person Households | - | 258 (30.0%) |
| 2-Person Households | 310 (36.0%) | 43 (5.0%) |
| 3-Person Households | 139 (16.1%) | 0 (0.0%) |
| 4-Person Households | 59 (6.9%) | 0 (0.0%) |
| 5-Person Households | 36 (4.2%) | 0 (0.0%) |
| 6-Person Households | 16 (1.9%) | 0 (0.0%) |
| 7+ Person Households | 0 (0.0%) | 0 (0.0%) |
| Total | 560 (65.0%) | 301 (35.0%) |
Female Fertility in Deuel County
Fertility by Age in Deuel County
Average fertility rate in Deuel County is 129.0 births per 1,000 women. Women in the age bracket of 20 to 34 years have the highest fertility rate with 303.0 births per 1,000 women. Women in the age bracket of 20 to 34 years acount for 95.6% of all women with births.
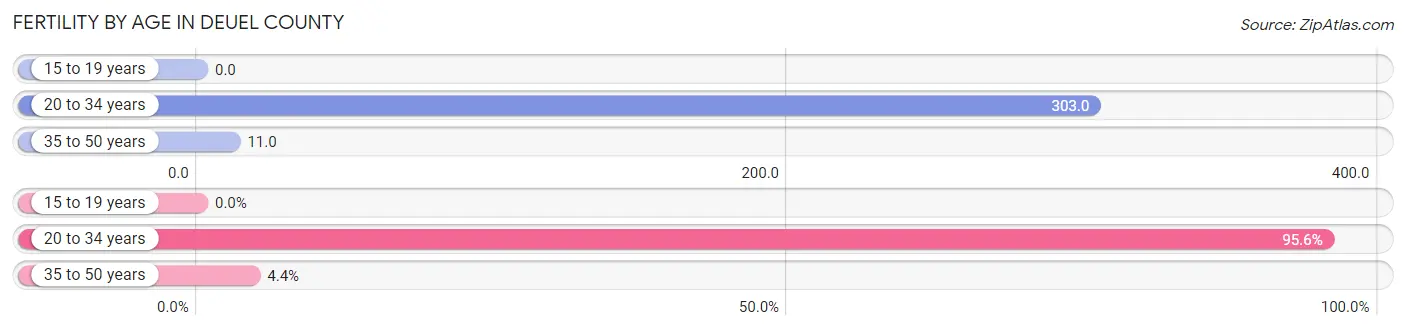
| Age Bracket | Women with Births | Births / 1,000 Women |
| 15 to 19 years | 0 (0.0%) | 0.0 |
| 20 to 34 years | 43 (95.6%) | 303.0 |
| 35 to 50 years | 2 (4.4%) | 11.0 |
| Total | 45 (100.0%) | 129.0 |
Fertility by Age by Marriage Status in Deuel County
82.2% of women with births (45) in Deuel County are married. The highest percentage of unmarried women with births falls into 35 to 50 years age bracket with 100.0% of them unmarried at the time of birth, while the lowest percentage of unmarried women with births belong to 20 to 34 years age bracket with 13.9% of them unmarried.
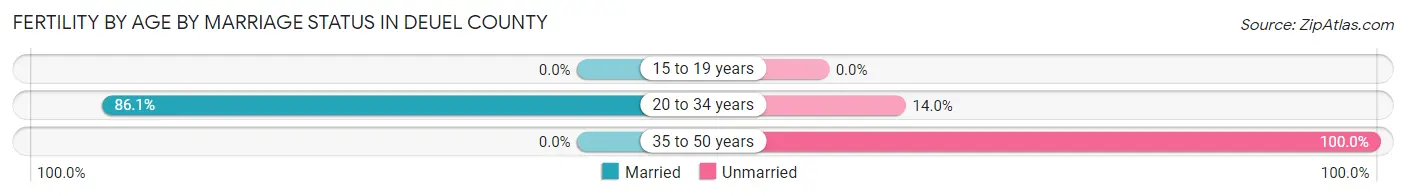
| Age Bracket | Married | Unmarried |
| 15 to 19 years | 0 (0.0%) | 0 (0.0%) |
| 20 to 34 years | 37 (86.1%) | 6 (14.0%) |
| 35 to 50 years | 0 (0.0%) | 2 (100.0%) |
| Total | 37 (82.2%) | 8 (17.8%) |
Fertility by Education in Deuel County
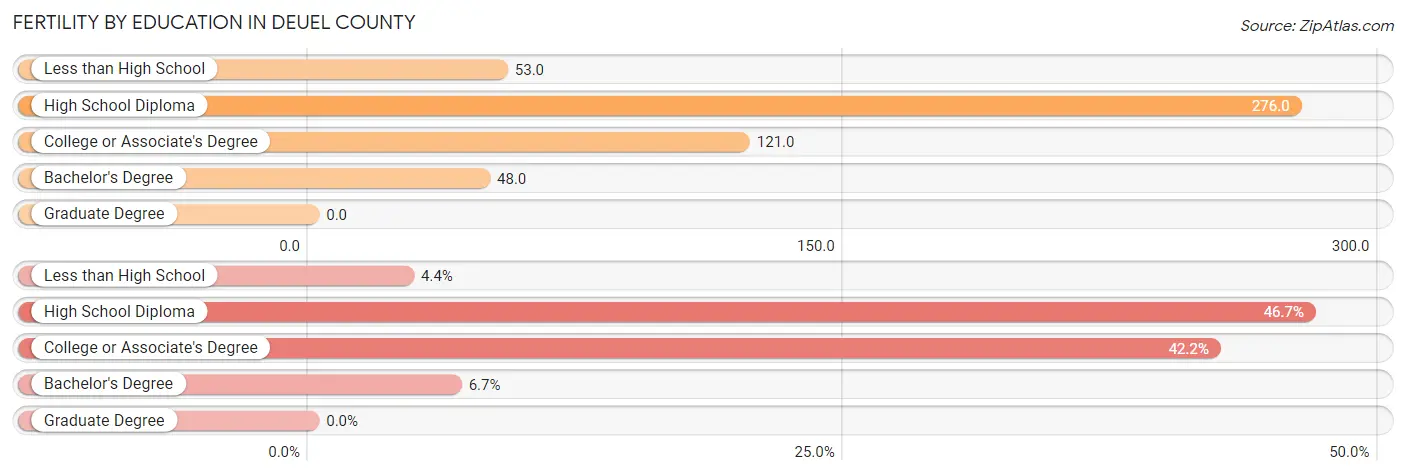
| Educational Attainment | Women with Births | Births / 1,000 Women |
| Less than High School | 2 (4.4%) | 53.0 |
| High School Diploma | 21 (46.7%) | 276.0 |
| College or Associate's Degree | 19 (42.2%) | 121.0 |
| Bachelor's Degree | 3 (6.7%) | 48.0 |
| Graduate Degree | 0 (0.0%) | 0.0 |
| Total | 45 (100.0%) | 129.0 |
Fertility by Education by Marriage Status in Deuel County
17.8% of women with births in Deuel County are unmarried. Women with the educational attainment of bachelor's degree are most likely to be married with 100.0% of them married at childbirth, while women with the educational attainment of less than high school are least likely to be married with 100.0% of them unmarried at childbirth.
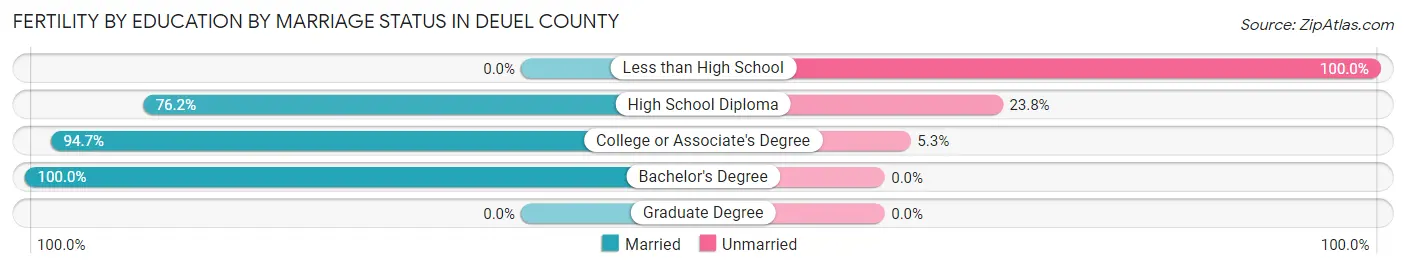
| Educational Attainment | Married | Unmarried |
| Less than High School | 0 (0.0%) | 2 (100.0%) |
| High School Diploma | 16 (76.2%) | 5 (23.8%) |
| College or Associate's Degree | 18 (94.7%) | 1 (5.3%) |
| Bachelor's Degree | 3 (100.0%) | 0 (0.0%) |
| Graduate Degree | 0 (0.0%) | 0 (0.0%) |
| Total | 37 (82.2%) | 8 (17.8%) |
Employment Characteristics in Deuel County
Employment by Class of Employer in Deuel County
Among the 876 employed individuals in Deuel County, private company employees (479 | 54.7%), local government employees (174 | 19.9%), and self-employed (not incorporated) (98 | 11.2%) make up the most common classes of employment.
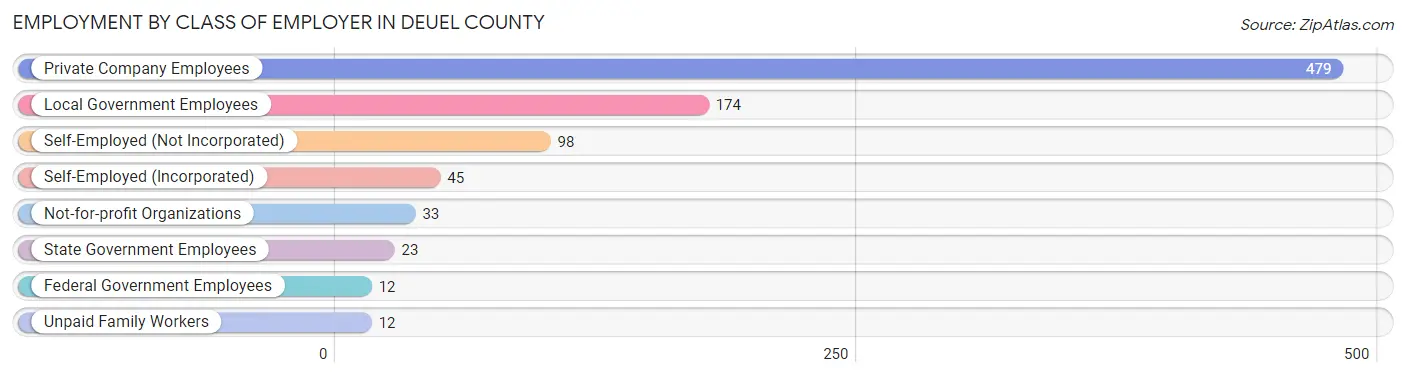
| Employer Class | # Employees | % Employees |
| Private Company Employees | 479 | 54.7% |
| Self-Employed (Incorporated) | 45 | 5.1% |
| Self-Employed (Not Incorporated) | 98 | 11.2% |
| Not-for-profit Organizations | 33 | 3.8% |
| Local Government Employees | 174 | 19.9% |
| State Government Employees | 23 | 2.6% |
| Federal Government Employees | 12 | 1.4% |
| Unpaid Family Workers | 12 | 1.4% |
| Total | 876 | 100.0% |
Employment Status by Age in Deuel County
According to the labor force statistics for Deuel County, out of the total population over 16 years of age (1,575), 58.2% or 917 individuals are in the labor force, with 3.8% or 35 of them unemployed. The age group with the highest labor force participation rate is 25 to 29 years, with 92.3% or 72 individuals in the labor force. Within the labor force, the 35 to 44 years age range has the highest percentage of unemployed individuals, with 9.7% or 14 of them being unemployed.
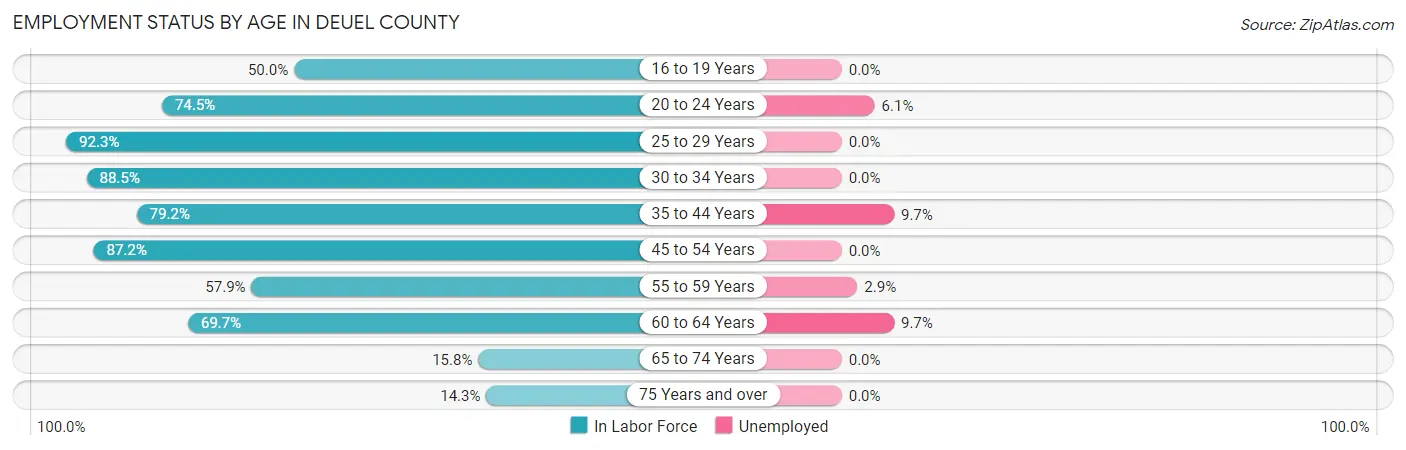
| Age Bracket | In Labor Force | Unemployed |
| 16 to 19 Years | 21 (50.0%) | 0 (0.0%) |
| 20 to 24 Years | 82 (74.5%) | 5 (6.1%) |
| 25 to 29 Years | 72 (92.3%) | 0 (0.0%) |
| 30 to 34 Years | 77 (88.5%) | 0 (0.0%) |
| 35 to 44 Years | 145 (79.2%) | 14 (9.7%) |
| 45 to 54 Years | 231 (87.2%) | 0 (0.0%) |
| 55 to 59 Years | 70 (57.9%) | 2 (2.9%) |
| 60 to 64 Years | 145 (69.7%) | 14 (9.7%) |
| 65 to 74 Years | 45 (15.8%) | 0 (0.0%) |
| 75 Years and over | 28 (14.3%) | 0 (0.0%) |
| Total | 917 (58.2%) | 35 (3.8%) |
Employment Status by Educational Attainment in Deuel County
According to labor force statistics for Deuel County, 78.6% of individuals (740) out of the total population between 25 and 64 years of age (942) are in the labor force, with 4.1% or 30 of them being unemployed. The group with the highest labor force participation rate are those with the educational attainment of bachelor's degree or higher, with 94.5% or 188 individuals in the labor force. Within the labor force, individuals with less than high school education have the highest percentage of unemployment, with 21.2% or 14 of them being unemployed.
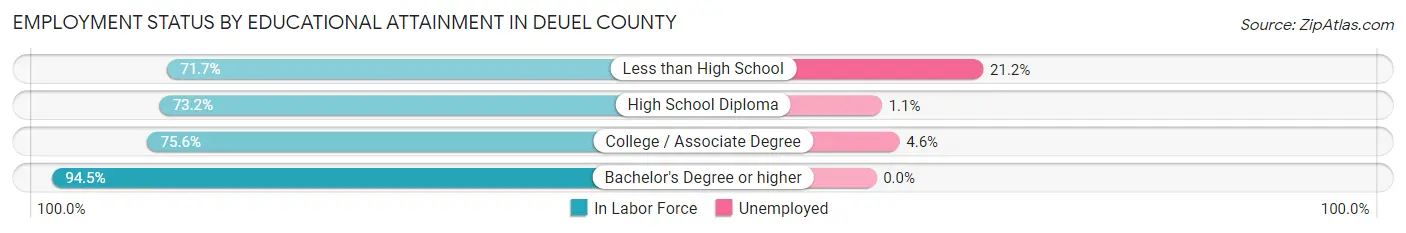
| Educational Attainment | In Labor Force | Unemployed |
| Less than High School | 66 (71.7%) | 20 (21.2%) |
| High School Diploma | 183 (73.2%) | 3 (1.1%) |
| College / Associate Degree | 303 (75.6%) | 18 (4.6%) |
| Bachelor's Degree or higher | 188 (94.5%) | 0 (0.0%) |
| Total | 740 (78.6%) | 39 (4.1%) |
Employment Occupations by Sex in Deuel County
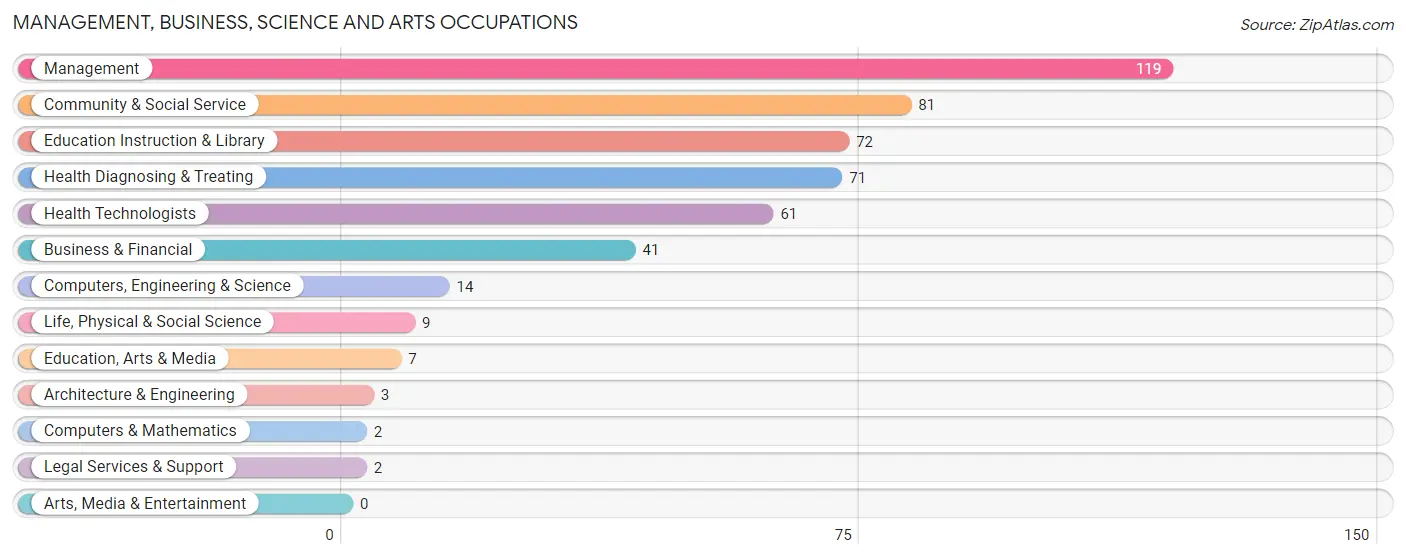
Management, Business, Science and Arts Occupations
The most common Management, Business, Science and Arts occupations in Deuel County are Management (119 | 13.5%), Community & Social Service (81 | 9.2%), Education Instruction & Library (72 | 8.2%), Health Diagnosing & Treating (71 | 8.1%), and Health Technologists (61 | 6.9%).
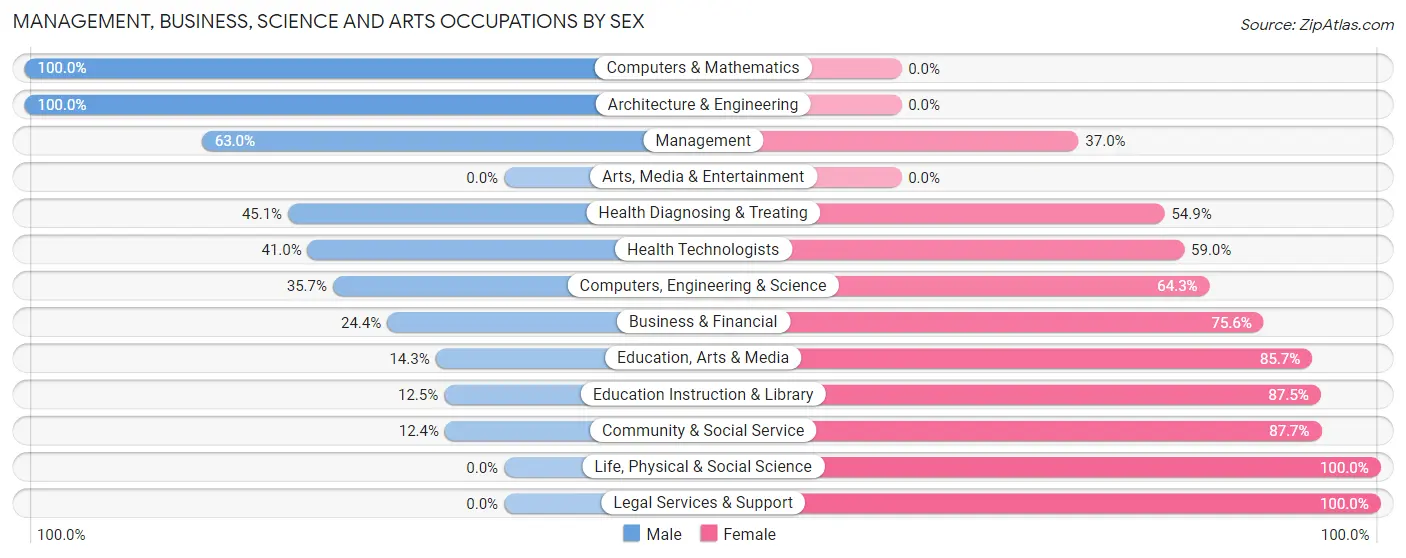
Management, Business, Science and Arts Occupations by Sex
Within the Management, Business, Science and Arts occupations in Deuel County, the most male-oriented occupations are Computers & Mathematics (100.0%), Architecture & Engineering (100.0%), and Management (63.0%), while the most female-oriented occupations are Life, Physical & Social Science (100.0%), Legal Services & Support (100.0%), and Community & Social Service (87.6%).
| Occupation | Male | Female |
| Management | 75 (63.0%) | 44 (37.0%) |
| Business & Financial | 10 (24.4%) | 31 (75.6%) |
| Computers, Engineering & Science | 5 (35.7%) | 9 (64.3%) |
| Computers & Mathematics | 2 (100.0%) | 0 (0.0%) |
| Architecture & Engineering | 3 (100.0%) | 0 (0.0%) |
| Life, Physical & Social Science | 0 (0.0%) | 9 (100.0%) |
| Community & Social Service | 10 (12.3%) | 71 (87.6%) |
| Education, Arts & Media | 1 (14.3%) | 6 (85.7%) |
| Legal Services & Support | 0 (0.0%) | 2 (100.0%) |
| Education Instruction & Library | 9 (12.5%) | 63 (87.5%) |
| Arts, Media & Entertainment | 0 (0.0%) | 0 (0.0%) |
| Health Diagnosing & Treating | 32 (45.1%) | 39 (54.9%) |
| Health Technologists | 25 (41.0%) | 36 (59.0%) |
| Total (Category) | 132 (40.5%) | 194 (59.5%) |
| Total (Overall) | 462 (52.4%) | 419 (47.6%) |
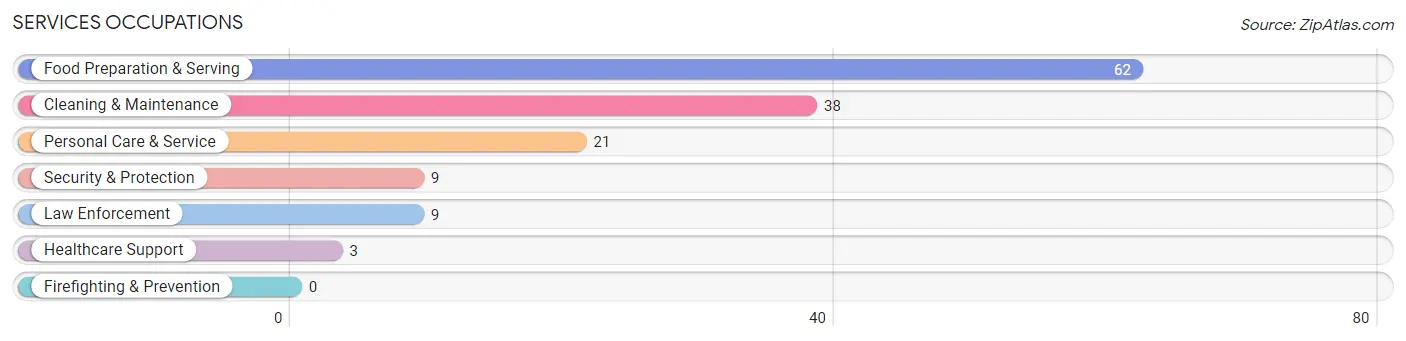
Services Occupations
The most common Services occupations in Deuel County are Food Preparation & Serving (62 | 7.0%), Cleaning & Maintenance (38 | 4.3%), Personal Care & Service (21 | 2.4%), Security & Protection (9 | 1.0%), and Law Enforcement (9 | 1.0%).
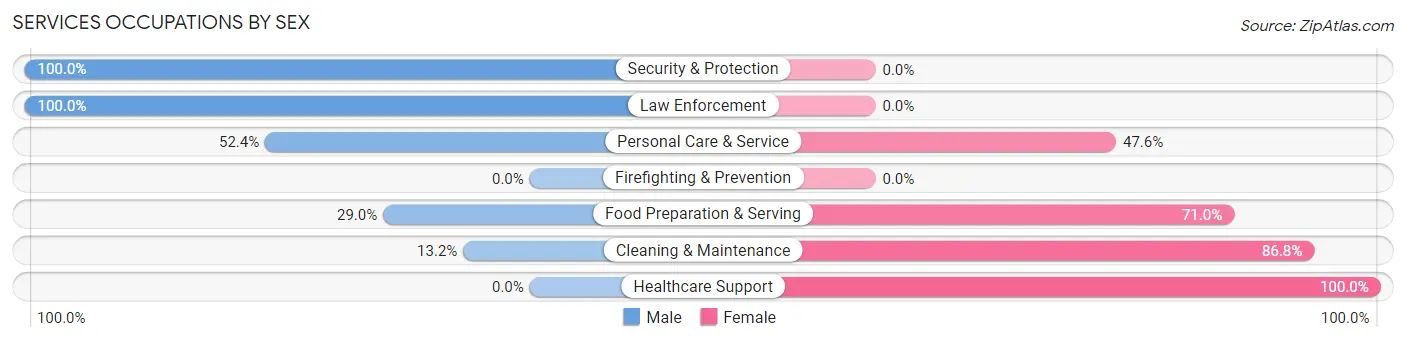
Services Occupations by Sex
Within the Services occupations in Deuel County, the most male-oriented occupations are Security & Protection (100.0%), Law Enforcement (100.0%), and Personal Care & Service (52.4%), while the most female-oriented occupations are Healthcare Support (100.0%), Cleaning & Maintenance (86.8%), and Food Preparation & Serving (71.0%).
| Occupation | Male | Female |
| Healthcare Support | 0 (0.0%) | 3 (100.0%) |
| Security & Protection | 9 (100.0%) | 0 (0.0%) |
| Firefighting & Prevention | 0 (0.0%) | 0 (0.0%) |
| Law Enforcement | 9 (100.0%) | 0 (0.0%) |
| Food Preparation & Serving | 18 (29.0%) | 44 (71.0%) |
| Cleaning & Maintenance | 5 (13.2%) | 33 (86.8%) |
| Personal Care & Service | 11 (52.4%) | 10 (47.6%) |
| Total (Category) | 43 (32.3%) | 90 (67.7%) |
| Total (Overall) | 462 (52.4%) | 419 (47.6%) |
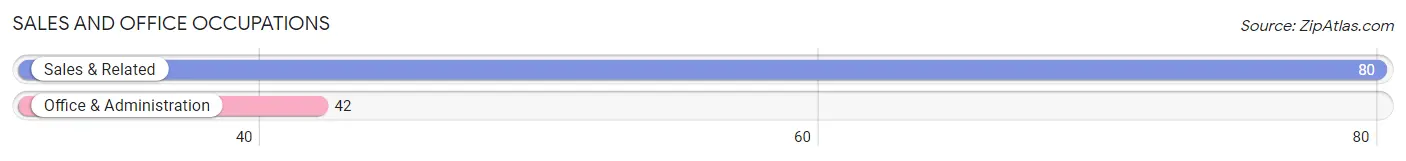
Sales and Office Occupations
The most common Sales and Office occupations in Deuel County are Sales & Related (80 | 9.1%), and Office & Administration (42 | 4.8%).
Sales and Office Occupations by Sex
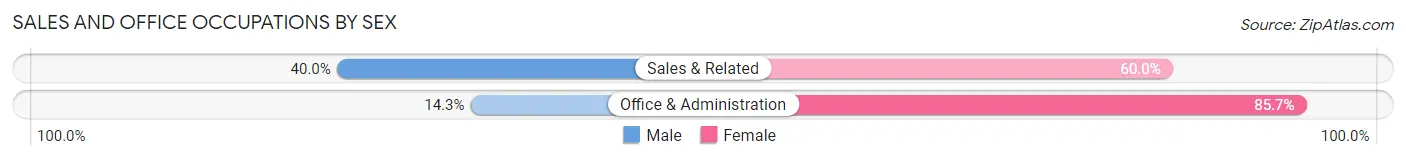
| Occupation | Male | Female |
| Sales & Related | 32 (40.0%) | 48 (60.0%) |
| Office & Administration | 6 (14.3%) | 36 (85.7%) |
| Total (Category) | 38 (31.1%) | 84 (68.9%) |
| Total (Overall) | 462 (52.4%) | 419 (47.6%) |
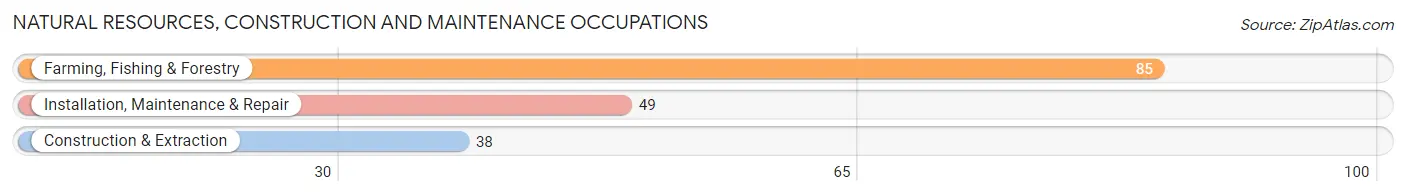
Natural Resources, Construction and Maintenance Occupations
The most common Natural Resources, Construction and Maintenance occupations in Deuel County are Farming, Fishing & Forestry (85 | 9.7%), Installation, Maintenance & Repair (49 | 5.6%), and Construction & Extraction (38 | 4.3%).
Natural Resources, Construction and Maintenance Occupations by Sex
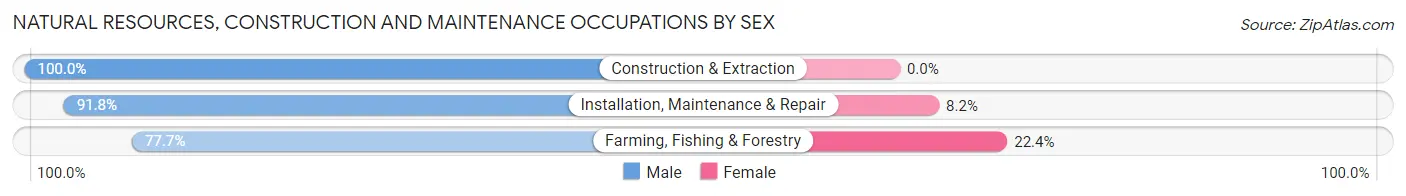
| Occupation | Male | Female |
| Farming, Fishing & Forestry | 66 (77.6%) | 19 (22.4%) |
| Construction & Extraction | 38 (100.0%) | 0 (0.0%) |
| Installation, Maintenance & Repair | 45 (91.8%) | 4 (8.2%) |
| Total (Category) | 149 (86.6%) | 23 (13.4%) |
| Total (Overall) | 462 (52.4%) | 419 (47.6%) |
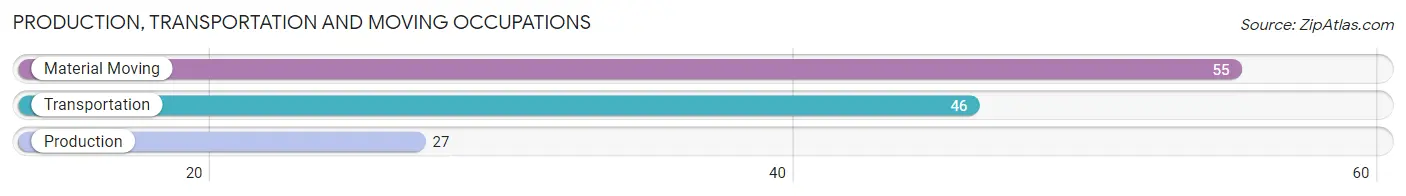
Production, Transportation and Moving Occupations
The most common Production, Transportation and Moving occupations in Deuel County are Material Moving (55 | 6.2%), Transportation (46 | 5.2%), and Production (27 | 3.1%).
Production, Transportation and Moving Occupations by Sex
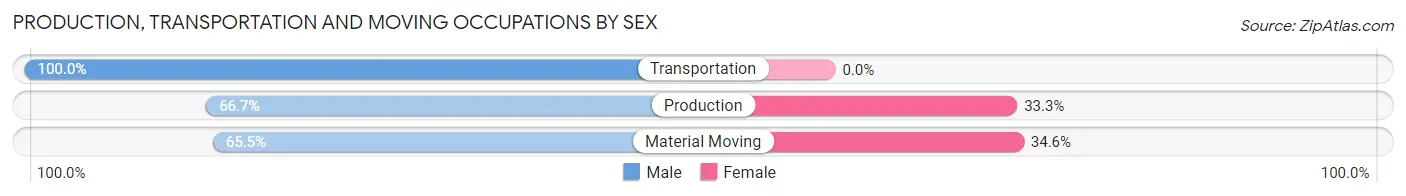
| Occupation | Male | Female |
| Production | 18 (66.7%) | 9 (33.3%) |
| Transportation | 46 (100.0%) | 0 (0.0%) |
| Material Moving | 36 (65.4%) | 19 (34.5%) |
| Total (Category) | 100 (78.1%) | 28 (21.9%) |
| Total (Overall) | 462 (52.4%) | 419 (47.6%) |
Employment Industries by Sex in Deuel County
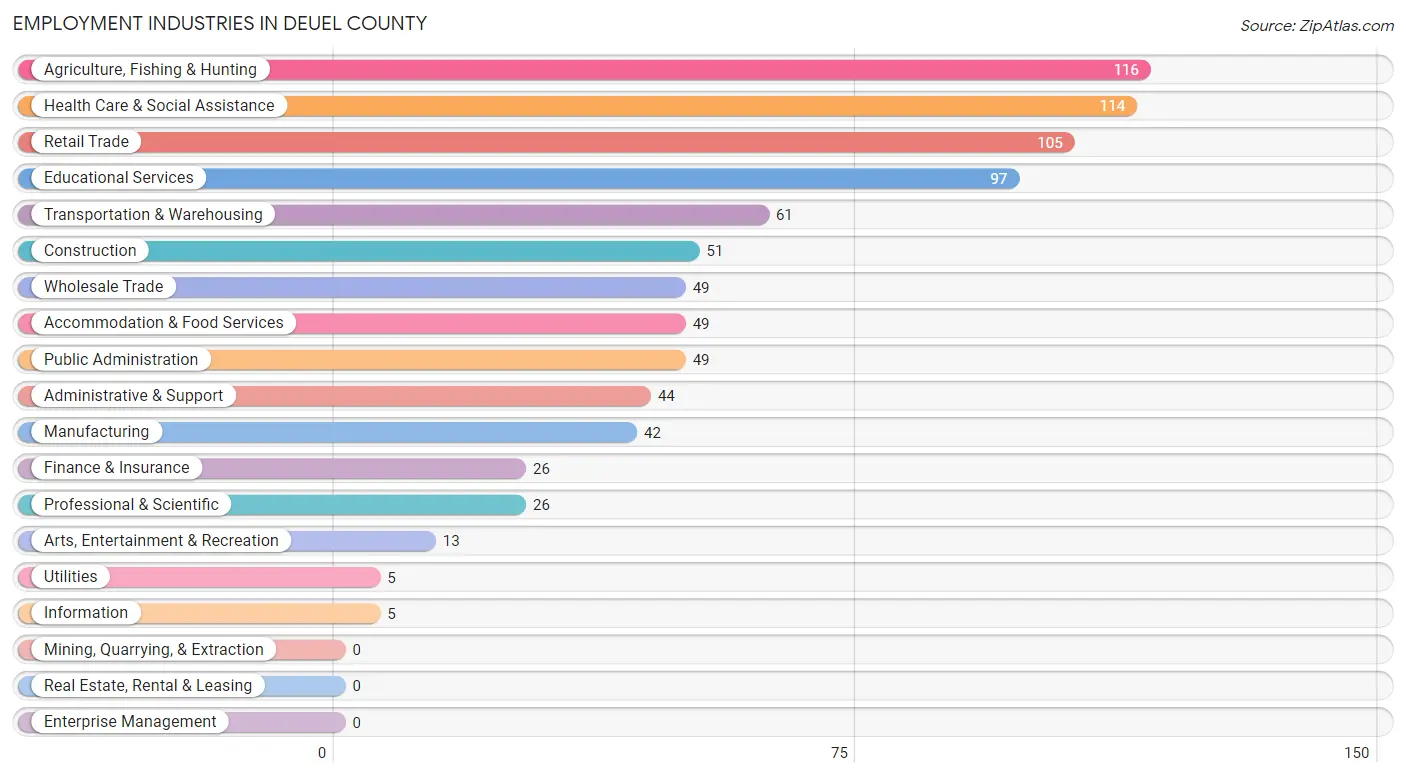
Employment Industries in Deuel County
The major employment industries in Deuel County include Agriculture, Fishing & Hunting (116 | 13.2%), Health Care & Social Assistance (114 | 12.9%), Retail Trade (105 | 11.9%), Educational Services (97 | 11.0%), and Transportation & Warehousing (61 | 6.9%).
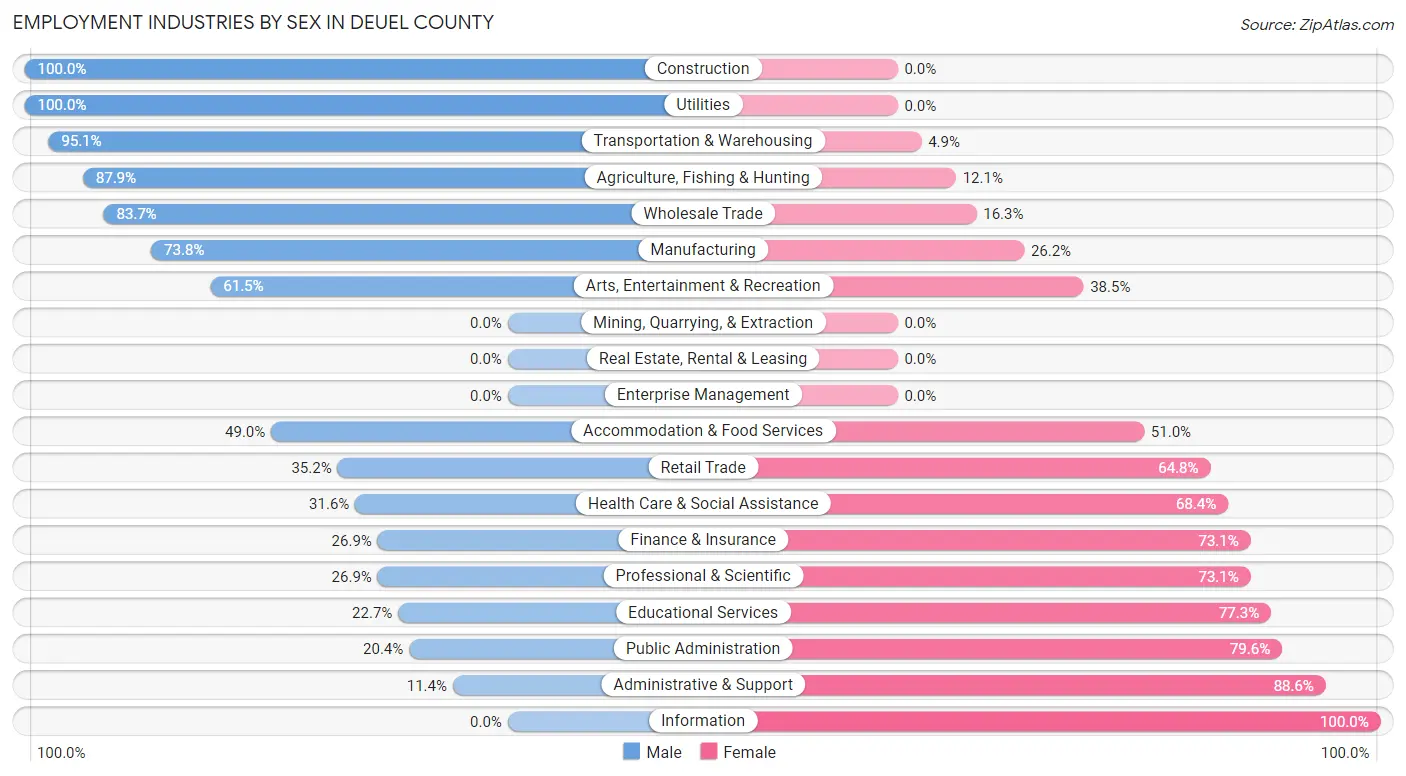
Employment Industries by Sex in Deuel County
The Deuel County industries that see more men than women are Construction (100.0%), Utilities (100.0%), and Transportation & Warehousing (95.1%), whereas the industries that tend to have a higher number of women are Information (100.0%), Administrative & Support (88.6%), and Public Administration (79.6%).
| Industry | Male | Female |
| Agriculture, Fishing & Hunting | 102 (87.9%) | 14 (12.1%) |
| Mining, Quarrying, & Extraction | 0 (0.0%) | 0 (0.0%) |
| Construction | 51 (100.0%) | 0 (0.0%) |
| Manufacturing | 31 (73.8%) | 11 (26.2%) |
| Wholesale Trade | 41 (83.7%) | 8 (16.3%) |
| Retail Trade | 37 (35.2%) | 68 (64.8%) |
| Transportation & Warehousing | 58 (95.1%) | 3 (4.9%) |
| Utilities | 5 (100.0%) | 0 (0.0%) |
| Information | 0 (0.0%) | 5 (100.0%) |
| Finance & Insurance | 7 (26.9%) | 19 (73.1%) |
| Real Estate, Rental & Leasing | 0 (0.0%) | 0 (0.0%) |
| Professional & Scientific | 7 (26.9%) | 19 (73.1%) |
| Enterprise Management | 0 (0.0%) | 0 (0.0%) |
| Administrative & Support | 5 (11.4%) | 39 (88.6%) |
| Educational Services | 22 (22.7%) | 75 (77.3%) |
| Health Care & Social Assistance | 36 (31.6%) | 78 (68.4%) |
| Arts, Entertainment & Recreation | 8 (61.5%) | 5 (38.5%) |
| Accommodation & Food Services | 24 (49.0%) | 25 (51.0%) |
| Public Administration | 10 (20.4%) | 39 (79.6%) |
| Total | 462 (52.4%) | 419 (47.6%) |
Education in Deuel County
School Enrollment in Deuel County
The most common levels of schooling among the 276 students in Deuel County are middle school (67 | 24.3%), high school (63 | 22.8%), and elementary school (36 | 13.0%).
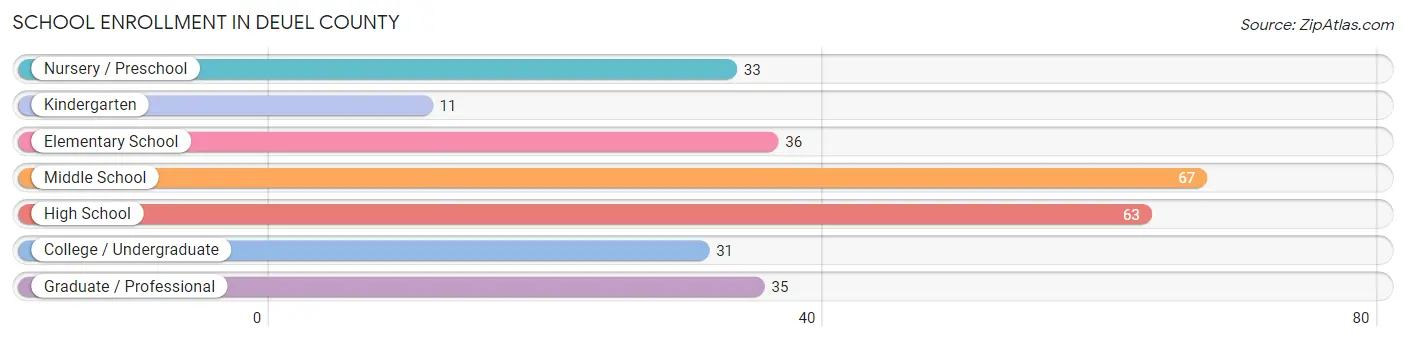
| School Level | # Students | % Students |
| Nursery / Preschool | 33 | 12.0% |
| Kindergarten | 11 | 4.0% |
| Elementary School | 36 | 13.0% |
| Middle School | 67 | 24.3% |
| High School | 63 | 22.8% |
| College / Undergraduate | 31 | 11.2% |
| Graduate / Professional | 35 | 12.7% |
| Total | 276 | 100.0% |
School Enrollment by Age by Funding Source in Deuel County
Out of a total of 276 students who are enrolled in schools in Deuel County, 28 (10.1%) attend a private institution, while the remaining 248 (89.9%) are enrolled in public schools. The age group of 35 years and over has the highest likelihood of being enrolled in private schools, with 5 (29.4% in the age bracket) enrolled. Conversely, the age group of 25 to 34 year olds has the lowest likelihood of being enrolled in a private school, with 2 (100.0% in the age bracket) attending a public institution.
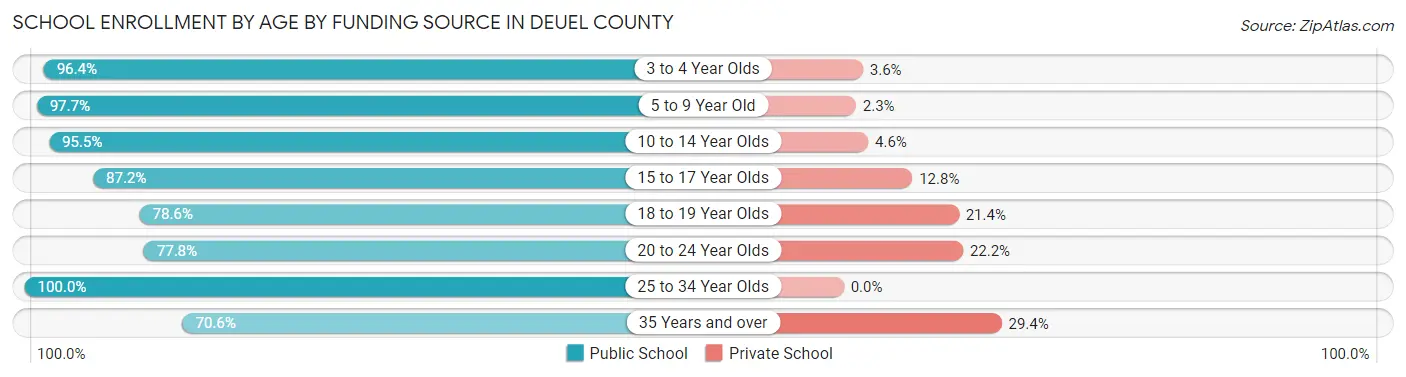
| Age Bracket | Public School | Private School |
| 3 to 4 Year Olds | 27 (96.4%) | 1 (3.6%) |
| 5 to 9 Year Old | 43 (97.7%) | 1 (2.3%) |
| 10 to 14 Year Olds | 84 (95.5%) | 4 (4.5%) |
| 15 to 17 Year Olds | 41 (87.2%) | 6 (12.8%) |
| 18 to 19 Year Olds | 11 (78.6%) | 3 (21.4%) |
| 20 to 24 Year Olds | 28 (77.8%) | 8 (22.2%) |
| 25 to 34 Year Olds | 2 (100.0%) | 0 (0.0%) |
| 35 Years and over | 12 (70.6%) | 5 (29.4%) |
| Total | 248 (89.9%) | 28 (10.1%) |
Educational Attainment by Field of Study in Deuel County
Education (75 | 23.6%), bio, nature & agricultural (63 | 19.8%), business (48 | 15.1%), science & technology (31 | 9.8%), and psychology (22 | 6.9%) are the most common fields of study among 318 individuals in Deuel County who have obtained a bachelor's degree or higher.
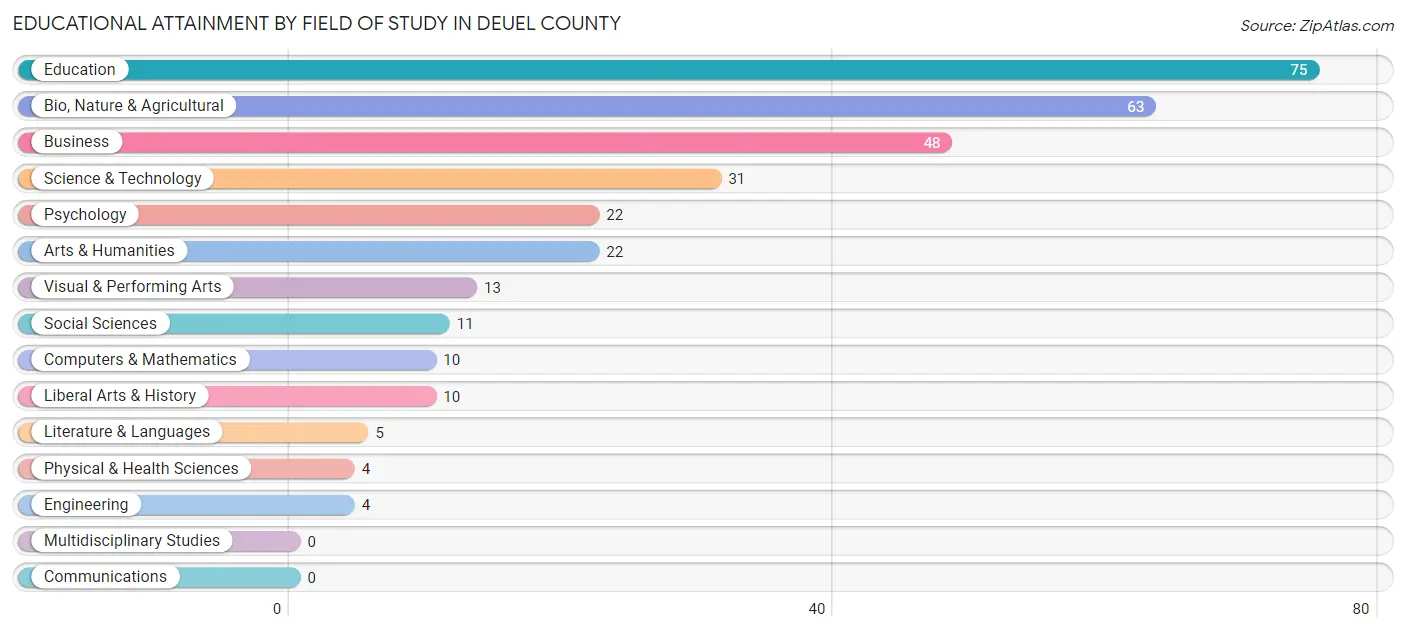
| Field of Study | # Graduates | % Graduates |
| Computers & Mathematics | 10 | 3.1% |
| Bio, Nature & Agricultural | 63 | 19.8% |
| Physical & Health Sciences | 4 | 1.3% |
| Psychology | 22 | 6.9% |
| Social Sciences | 11 | 3.5% |
| Engineering | 4 | 1.3% |
| Multidisciplinary Studies | 0 | 0.0% |
| Science & Technology | 31 | 9.8% |
| Business | 48 | 15.1% |
| Education | 75 | 23.6% |
| Literature & Languages | 5 | 1.6% |
| Liberal Arts & History | 10 | 3.1% |
| Visual & Performing Arts | 13 | 4.1% |
| Communications | 0 | 0.0% |
| Arts & Humanities | 22 | 6.9% |
| Total | 318 | 100.0% |
Transportation & Commute in Deuel County
Vehicle Availability by Sex in Deuel County
The most prevalent vehicle ownership categories in Deuel County are males with 2 vehicles (160, accounting for 34.6%) and females with 2 vehicles (137, making up 38.7%).
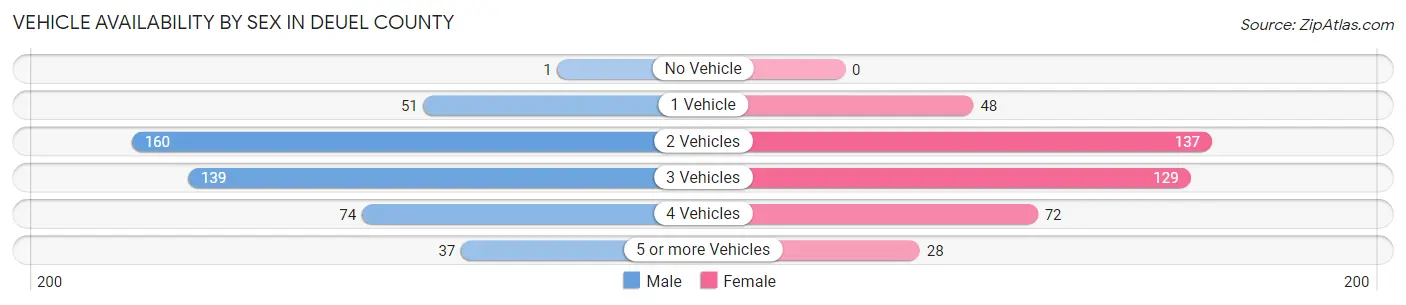
| Vehicles Available | Male | Female |
| No Vehicle | 1 (0.2%) | 0 (0.0%) |
| 1 Vehicle | 51 (11.0%) | 48 (11.6%) |
| 2 Vehicles | 160 (34.6%) | 137 (33.1%) |
| 3 Vehicles | 139 (30.1%) | 129 (31.2%) |
| 4 Vehicles | 74 (16.0%) | 72 (17.4%) |
| 5 or more Vehicles | 37 (8.0%) | 28 (6.8%) |
| Total | 462 (100.0%) | 414 (100.0%) |
Commute Time in Deuel County
The most frequently occuring commute durations in Deuel County are less than 5 minutes (166 commuters, 20.1%), 5 to 9 minutes (156 commuters, 18.9%), and 20 to 24 minutes (118 commuters, 14.3%).
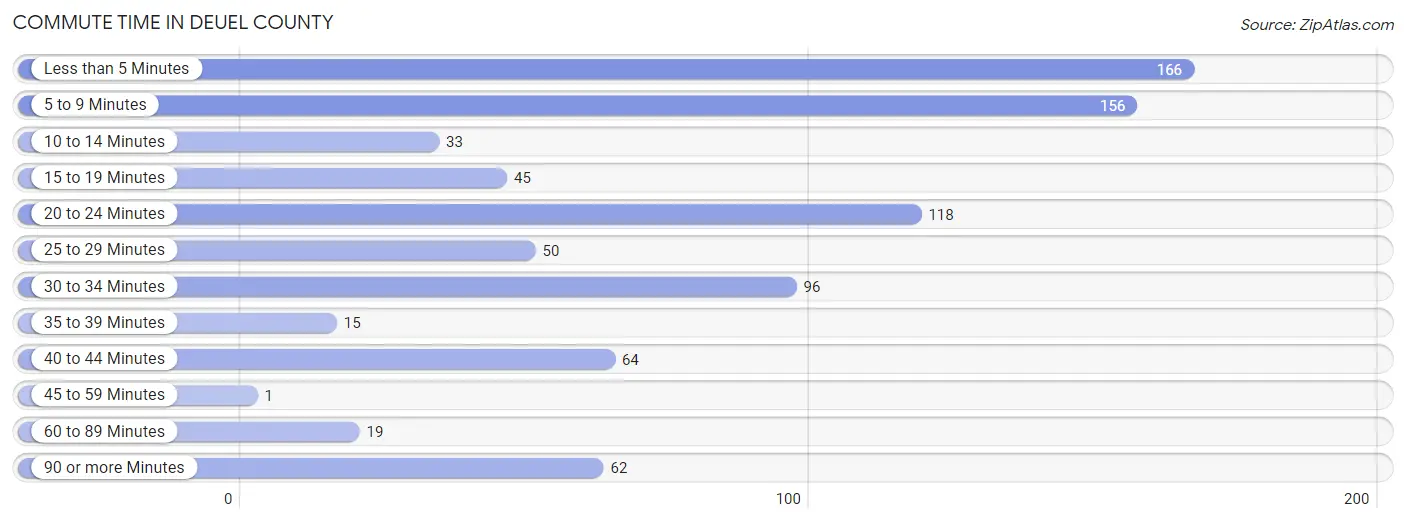
| Commute Time | # Commuters | % Commuters |
| Less than 5 Minutes | 166 | 20.1% |
| 5 to 9 Minutes | 156 | 18.9% |
| 10 to 14 Minutes | 33 | 4.0% |
| 15 to 19 Minutes | 45 | 5.4% |
| 20 to 24 Minutes | 118 | 14.3% |
| 25 to 29 Minutes | 50 | 6.1% |
| 30 to 34 Minutes | 96 | 11.6% |
| 35 to 39 Minutes | 15 | 1.8% |
| 40 to 44 Minutes | 64 | 7.8% |
| 45 to 59 Minutes | 1 | 0.1% |
| 60 to 89 Minutes | 19 | 2.3% |
| 90 or more Minutes | 62 | 7.5% |
Commute Time by Sex in Deuel County
The most common commute times in Deuel County are less than 5 minutes (74 commuters, 17.2%) for males and less than 5 minutes (92 commuters, 23.3%) for females.
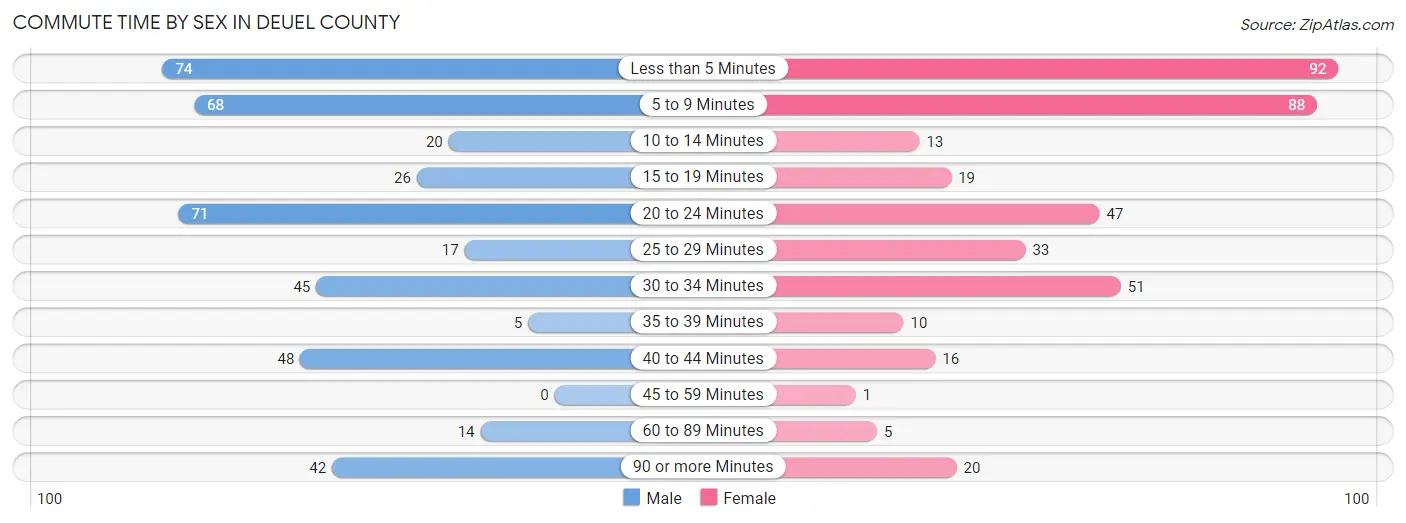
| Commute Time | Male | Female |
| Less than 5 Minutes | 74 (17.2%) | 92 (23.3%) |
| 5 to 9 Minutes | 68 (15.8%) | 88 (22.3%) |
| 10 to 14 Minutes | 20 (4.6%) | 13 (3.3%) |
| 15 to 19 Minutes | 26 (6.0%) | 19 (4.8%) |
| 20 to 24 Minutes | 71 (16.5%) | 47 (11.9%) |
| 25 to 29 Minutes | 17 (4.0%) | 33 (8.4%) |
| 30 to 34 Minutes | 45 (10.5%) | 51 (12.9%) |
| 35 to 39 Minutes | 5 (1.2%) | 10 (2.5%) |
| 40 to 44 Minutes | 48 (11.2%) | 16 (4.1%) |
| 45 to 59 Minutes | 0 (0.0%) | 1 (0.3%) |
| 60 to 89 Minutes | 14 (3.3%) | 5 (1.3%) |
| 90 or more Minutes | 42 (9.8%) | 20 (5.1%) |
Time of Departure to Work by Sex in Deuel County
The most frequent times of departure to work in Deuel County are 6:00 AM to 6:29 AM (92, 21.4%) for males and 7:00 AM to 7:29 AM (71, 18.0%) for females.
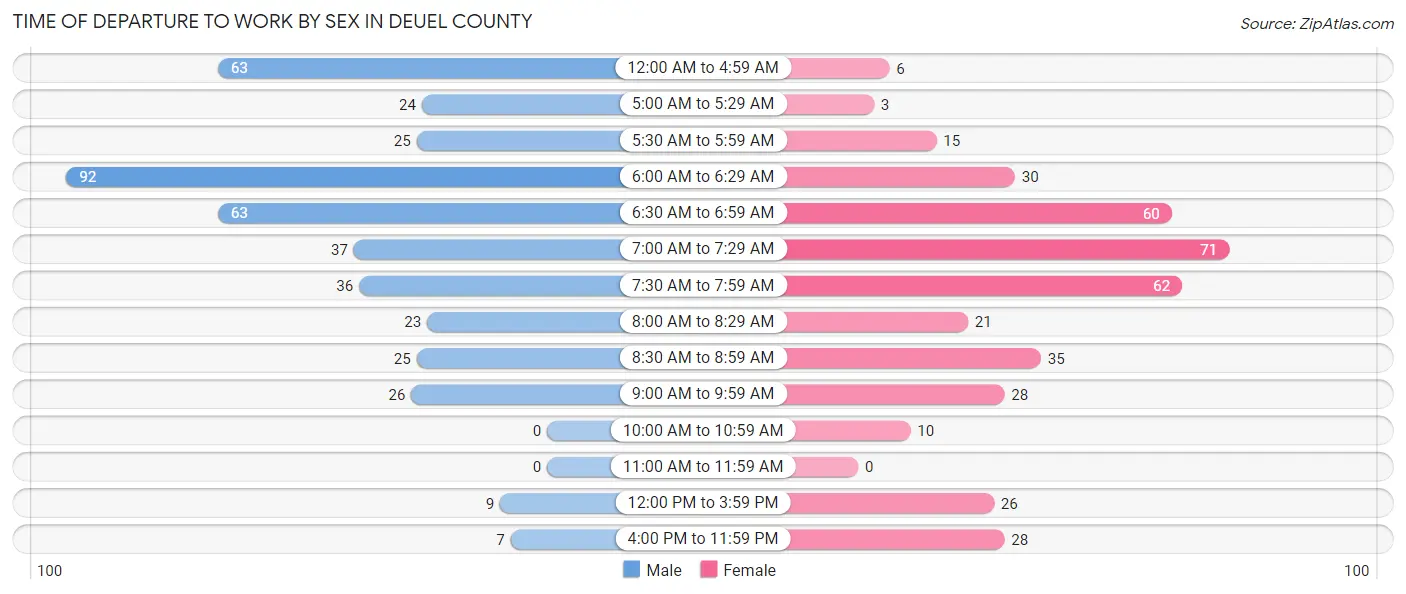
| Time of Departure | Male | Female |
| 12:00 AM to 4:59 AM | 63 (14.6%) | 6 (1.5%) |
| 5:00 AM to 5:29 AM | 24 (5.6%) | 3 (0.8%) |
| 5:30 AM to 5:59 AM | 25 (5.8%) | 15 (3.8%) |
| 6:00 AM to 6:29 AM | 92 (21.4%) | 30 (7.6%) |
| 6:30 AM to 6:59 AM | 63 (14.6%) | 60 (15.2%) |
| 7:00 AM to 7:29 AM | 37 (8.6%) | 71 (18.0%) |
| 7:30 AM to 7:59 AM | 36 (8.4%) | 62 (15.7%) |
| 8:00 AM to 8:29 AM | 23 (5.3%) | 21 (5.3%) |
| 8:30 AM to 8:59 AM | 25 (5.8%) | 35 (8.9%) |
| 9:00 AM to 9:59 AM | 26 (6.0%) | 28 (7.1%) |
| 10:00 AM to 10:59 AM | 0 (0.0%) | 10 (2.5%) |
| 11:00 AM to 11:59 AM | 0 (0.0%) | 0 (0.0%) |
| 12:00 PM to 3:59 PM | 9 (2.1%) | 26 (6.6%) |
| 4:00 PM to 11:59 PM | 7 (1.6%) | 28 (7.1%) |
| Total | 430 (100.0%) | 395 (100.0%) |
Housing Occupancy in Deuel County
Occupancy by Ownership in Deuel County
Of the total 861 dwellings in Deuel County, owner-occupied units account for 715 (83.0%), while renter-occupied units make up 146 (17.0%).
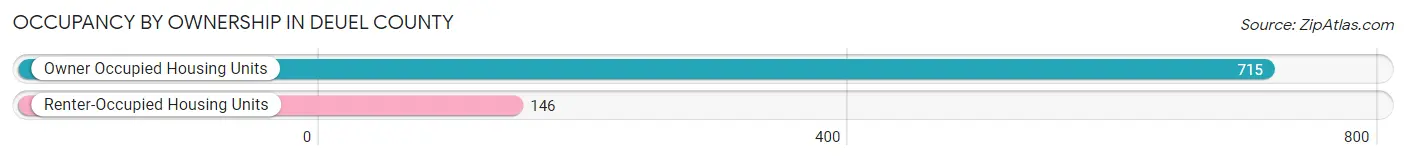
| Occupancy | # Housing Units | % Housing Units |
| Owner Occupied Housing Units | 715 | 83.0% |
| Renter-Occupied Housing Units | 146 | 17.0% |
| Total Occupied Housing Units | 861 | 100.0% |
Occupancy by Household Size in Deuel County
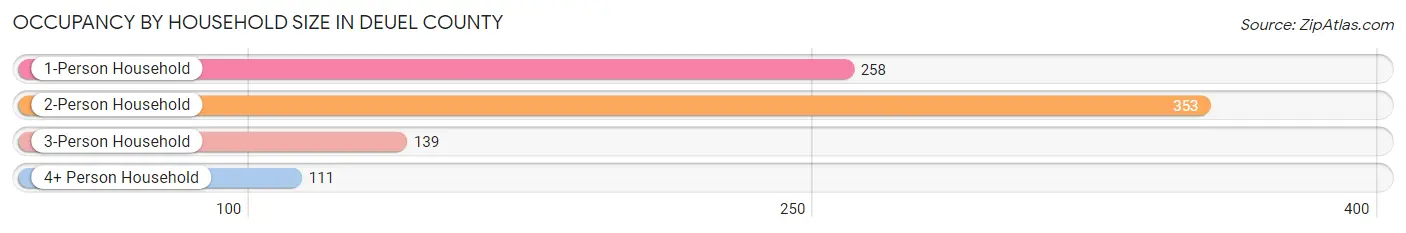
| Household Size | # Housing Units | % Housing Units |
| 1-Person Household | 258 | 30.0% |
| 2-Person Household | 353 | 41.0% |
| 3-Person Household | 139 | 16.1% |
| 4+ Person Household | 111 | 12.9% |
| Total Housing Units | 861 | 100.0% |
Occupancy by Ownership by Household Size in Deuel County
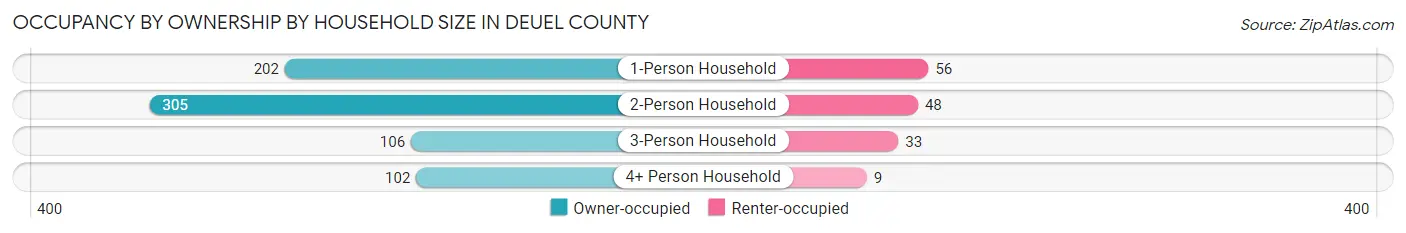
| Household Size | Owner-occupied | Renter-occupied |
| 1-Person Household | 202 (78.3%) | 56 (21.7%) |
| 2-Person Household | 305 (86.4%) | 48 (13.6%) |
| 3-Person Household | 106 (76.3%) | 33 (23.7%) |
| 4+ Person Household | 102 (91.9%) | 9 (8.1%) |
| Total Housing Units | 715 (83.0%) | 146 (17.0%) |
Occupancy by Educational Attainment in Deuel County
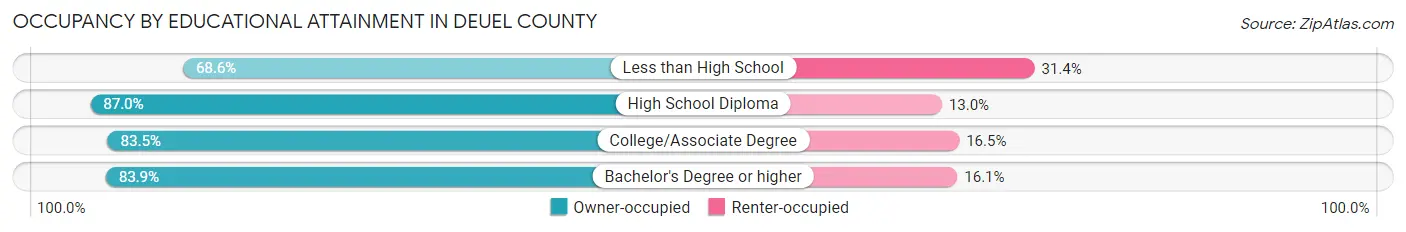
| Household Size | Owner-occupied | Renter-occupied |
| Less than High School | 59 (68.6%) | 27 (31.4%) |
| High School Diploma | 200 (87.0%) | 30 (13.0%) |
| College/Associate Degree | 284 (83.5%) | 56 (16.5%) |
| Bachelor's Degree or higher | 172 (83.9%) | 33 (16.1%) |
Occupancy by Age of Householder in Deuel County
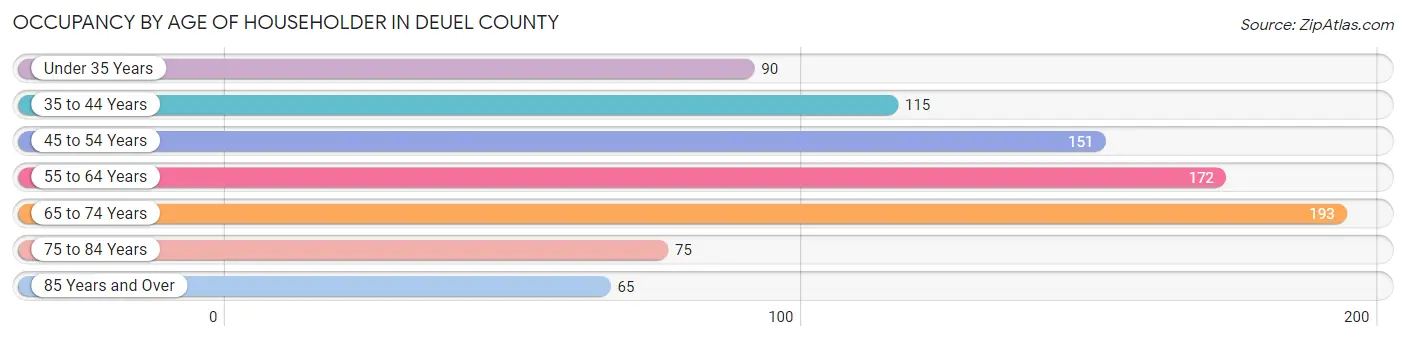
| Age Bracket | # Households | % Households |
| Under 35 Years | 90 | 10.4% |
| 35 to 44 Years | 115 | 13.4% |
| 45 to 54 Years | 151 | 17.5% |
| 55 to 64 Years | 172 | 20.0% |
| 65 to 74 Years | 193 | 22.4% |
| 75 to 84 Years | 75 | 8.7% |
| 85 Years and Over | 65 | 7.5% |
| Total | 861 | 100.0% |
Housing Finances in Deuel County
Median Income by Occupancy in Deuel County
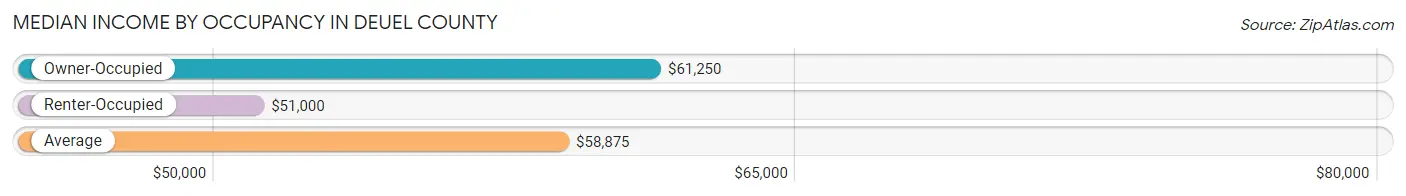
| Occupancy Type | # Households | Median Income |
| Owner-Occupied | 715 (83.0%) | $61,250 |
| Renter-Occupied | 146 (17.0%) | $51,000 |
| Average | 861 (100.0%) | $58,875 |
Occupancy by Householder Income Bracket in Deuel County
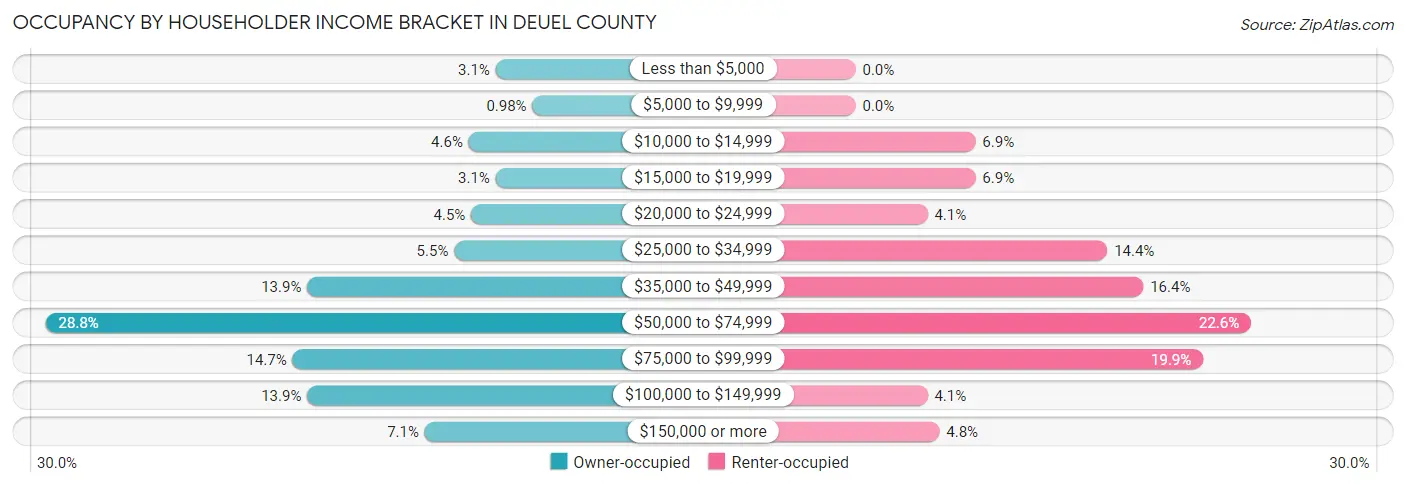
| Income Bracket | Owner-occupied | Renter-occupied |
| Less than $5,000 | 22 (3.1%) | 0 (0.0%) |
| $5,000 to $9,999 | 7 (1.0%) | 0 (0.0%) |
| $10,000 to $14,999 | 33 (4.6%) | 10 (6.9%) |
| $15,000 to $19,999 | 22 (3.1%) | 10 (6.9%) |
| $20,000 to $24,999 | 32 (4.5%) | 6 (4.1%) |
| $25,000 to $34,999 | 39 (5.4%) | 21 (14.4%) |
| $35,000 to $49,999 | 99 (13.9%) | 24 (16.4%) |
| $50,000 to $74,999 | 206 (28.8%) | 33 (22.6%) |
| $75,000 to $99,999 | 105 (14.7%) | 29 (19.9%) |
| $100,000 to $149,999 | 99 (13.9%) | 6 (4.1%) |
| $150,000 or more | 51 (7.1%) | 7 (4.8%) |
| Total | 715 (100.0%) | 146 (100.0%) |
Monthly Housing Cost Tiers in Deuel County
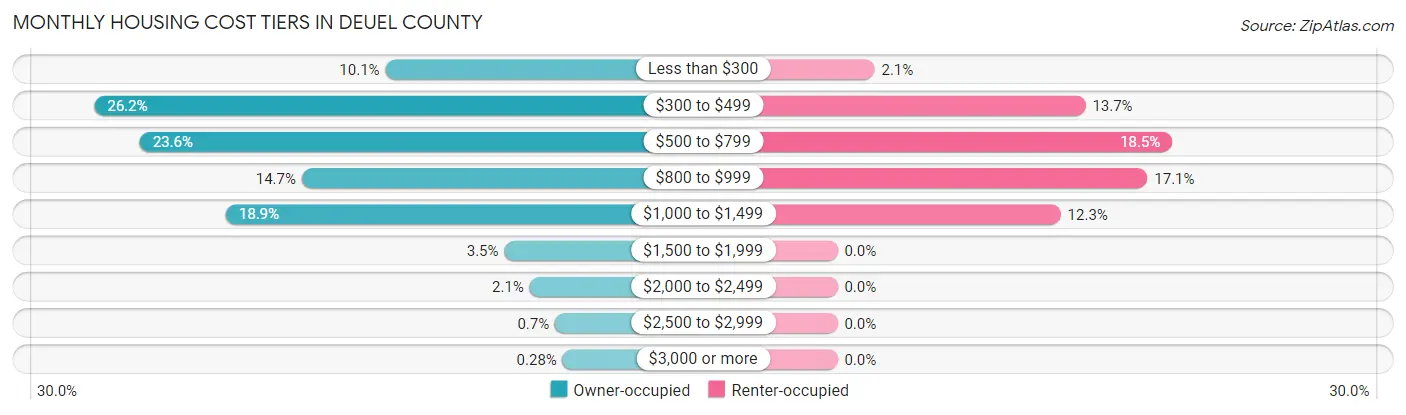
| Monthly Cost | Owner-occupied | Renter-occupied |
| Less than $300 | 72 (10.1%) | 3 (2.1%) |
| $300 to $499 | 187 (26.2%) | 20 (13.7%) |
| $500 to $799 | 169 (23.6%) | 27 (18.5%) |
| $800 to $999 | 105 (14.7%) | 25 (17.1%) |
| $1,000 to $1,499 | 135 (18.9%) | 18 (12.3%) |
| $1,500 to $1,999 | 25 (3.5%) | 0 (0.0%) |
| $2,000 to $2,499 | 15 (2.1%) | 0 (0.0%) |
| $2,500 to $2,999 | 5 (0.7%) | 0 (0.0%) |
| $3,000 or more | 2 (0.3%) | 0 (0.0%) |
| Total | 715 (100.0%) | 146 (100.0%) |
Physical Housing Characteristics in Deuel County
Housing Structures in Deuel County
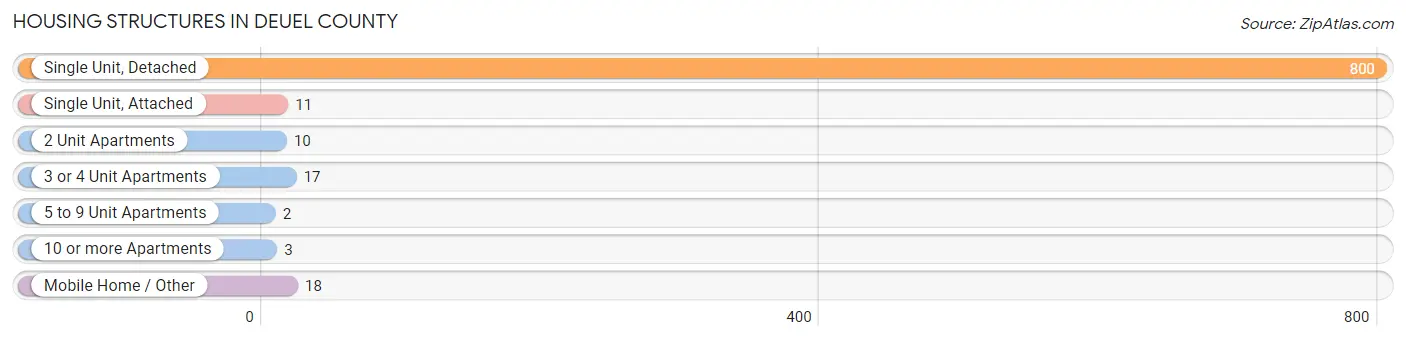
| Structure Type | # Housing Units | % Housing Units |
| Single Unit, Detached | 800 | 92.9% |
| Single Unit, Attached | 11 | 1.3% |
| 2 Unit Apartments | 10 | 1.2% |
| 3 or 4 Unit Apartments | 17 | 2.0% |
| 5 to 9 Unit Apartments | 2 | 0.2% |
| 10 or more Apartments | 3 | 0.4% |
| Mobile Home / Other | 18 | 2.1% |
| Total | 861 | 100.0% |
Housing Structures by Occupancy in Deuel County
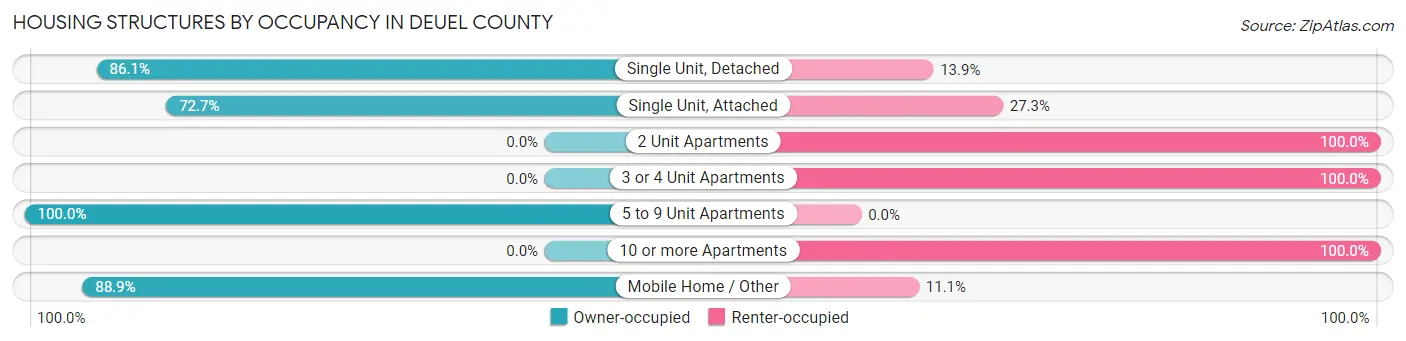
| Structure Type | Owner-occupied | Renter-occupied |
| Single Unit, Detached | 689 (86.1%) | 111 (13.9%) |
| Single Unit, Attached | 8 (72.7%) | 3 (27.3%) |
| 2 Unit Apartments | 0 (0.0%) | 10 (100.0%) |
| 3 or 4 Unit Apartments | 0 (0.0%) | 17 (100.0%) |
| 5 to 9 Unit Apartments | 2 (100.0%) | 0 (0.0%) |
| 10 or more Apartments | 0 (0.0%) | 3 (100.0%) |
| Mobile Home / Other | 16 (88.9%) | 2 (11.1%) |
| Total | 715 (83.0%) | 146 (17.0%) |
Housing Structures by Number of Rooms in Deuel County
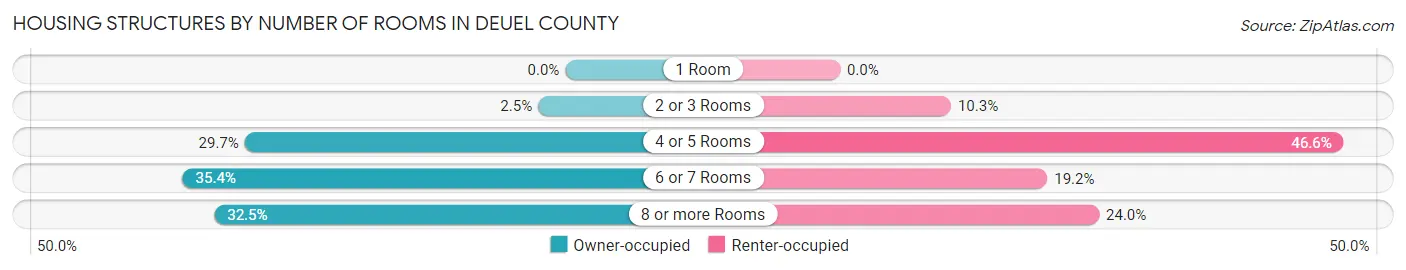
| Number of Rooms | Owner-occupied | Renter-occupied |
| 1 Room | 0 (0.0%) | 0 (0.0%) |
| 2 or 3 Rooms | 18 (2.5%) | 15 (10.3%) |
| 4 or 5 Rooms | 212 (29.6%) | 68 (46.6%) |
| 6 or 7 Rooms | 253 (35.4%) | 28 (19.2%) |
| 8 or more Rooms | 232 (32.5%) | 35 (24.0%) |
| Total | 715 (100.0%) | 146 (100.0%) |
Housing Structure by Heating Type in Deuel County
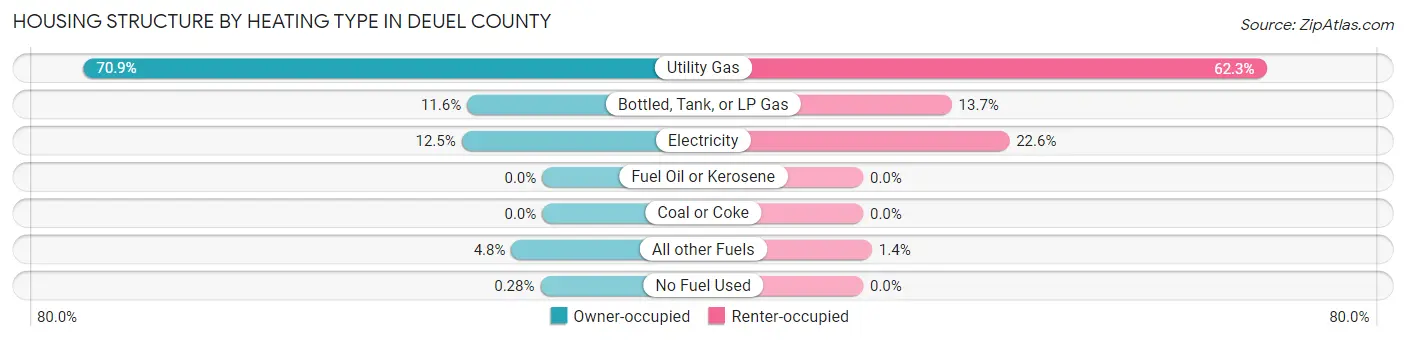
| Heating Type | Owner-occupied | Renter-occupied |
| Utility Gas | 507 (70.9%) | 91 (62.3%) |
| Bottled, Tank, or LP Gas | 83 (11.6%) | 20 (13.7%) |
| Electricity | 89 (12.4%) | 33 (22.6%) |
| Fuel Oil or Kerosene | 0 (0.0%) | 0 (0.0%) |
| Coal or Coke | 0 (0.0%) | 0 (0.0%) |
| All other Fuels | 34 (4.8%) | 2 (1.4%) |
| No Fuel Used | 2 (0.3%) | 0 (0.0%) |
| Total | 715 (100.0%) | 146 (100.0%) |
Household Vehicle Usage in Deuel County
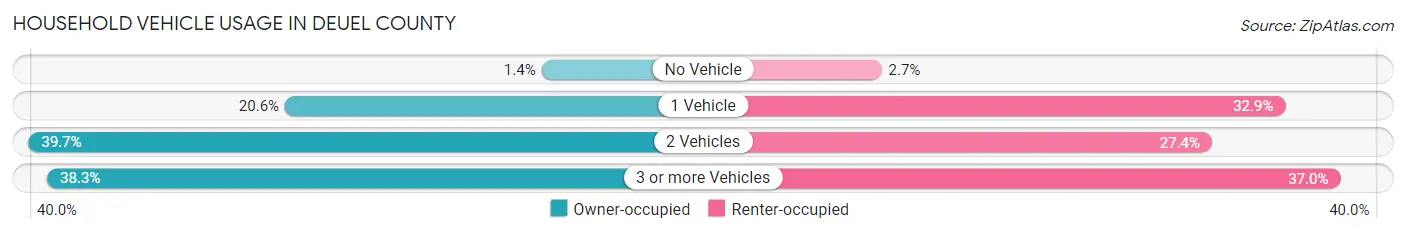
| Vehicles per Household | Owner-occupied | Renter-occupied |
| No Vehicle | 10 (1.4%) | 4 (2.7%) |
| 1 Vehicle | 147 (20.6%) | 48 (32.9%) |
| 2 Vehicles | 284 (39.7%) | 40 (27.4%) |
| 3 or more Vehicles | 274 (38.3%) | 54 (37.0%) |
| Total | 715 (100.0%) | 146 (100.0%) |
Real Estate & Mortgages in Deuel County
Real Estate and Mortgage Overview in Deuel County
| Characteristic | Without Mortgage | With Mortgage |
| Housing Units | 482 | 233 |
| Median Property Value | $88,300 | $105,100 |
| Median Household Income | $60,000 | $8 |
| Monthly Housing Costs | $484 | $0 |
| Real Estate Taxes | $1,210 | $11 |
Property Value by Mortgage Status in Deuel County
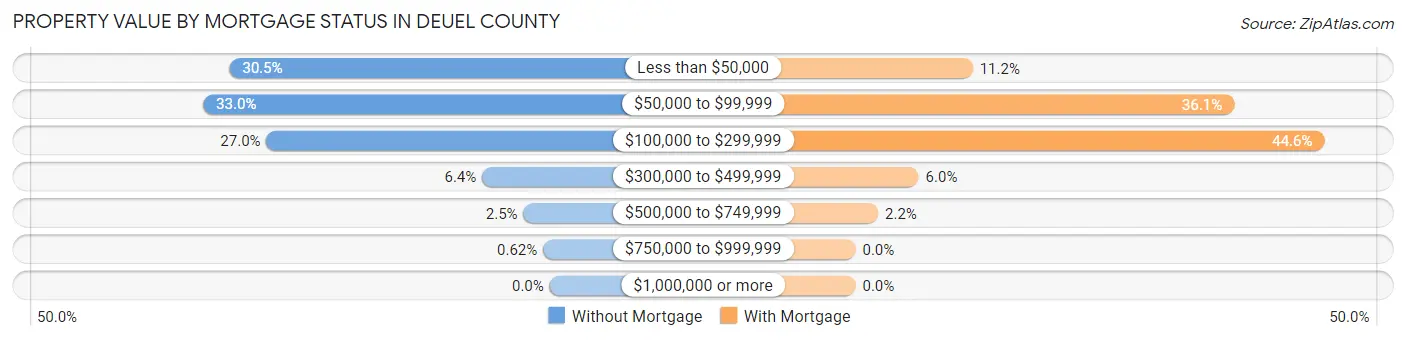
| Property Value | Without Mortgage | With Mortgage |
| Less than $50,000 | 147 (30.5%) | 26 (11.2%) |
| $50,000 to $99,999 | 159 (33.0%) | 84 (36.0%) |
| $100,000 to $299,999 | 130 (27.0%) | 104 (44.6%) |
| $300,000 to $499,999 | 31 (6.4%) | 14 (6.0%) |
| $500,000 to $749,999 | 12 (2.5%) | 5 (2.1%) |
| $750,000 to $999,999 | 3 (0.6%) | 0 (0.0%) |
| $1,000,000 or more | 0 (0.0%) | 0 (0.0%) |
| Total | 482 (100.0%) | 233 (100.0%) |
Household Income by Mortgage Status in Deuel County
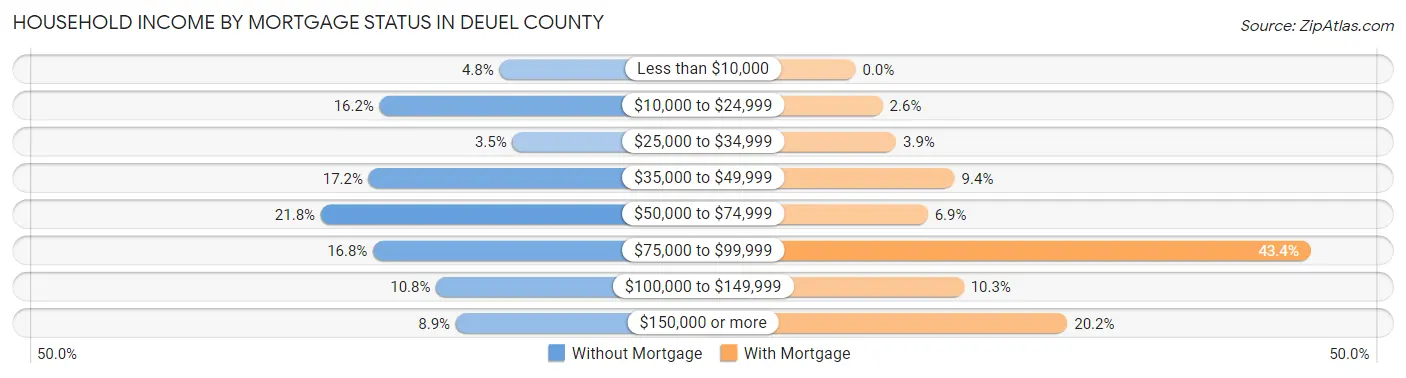
| Household Income | Without Mortgage | With Mortgage |
| Less than $10,000 | 23 (4.8%) | 0 (0.0%) |
| $10,000 to $24,999 | 78 (16.2%) | 6 (2.6%) |
| $25,000 to $34,999 | 17 (3.5%) | 9 (3.9%) |
| $35,000 to $49,999 | 83 (17.2%) | 22 (9.4%) |
| $50,000 to $74,999 | 105 (21.8%) | 16 (6.9%) |
| $75,000 to $99,999 | 81 (16.8%) | 101 (43.3%) |
| $100,000 to $149,999 | 52 (10.8%) | 24 (10.3%) |
| $150,000 or more | 43 (8.9%) | 47 (20.2%) |
| Total | 482 (100.0%) | 233 (100.0%) |
Property Value to Household Income Ratio in Deuel County
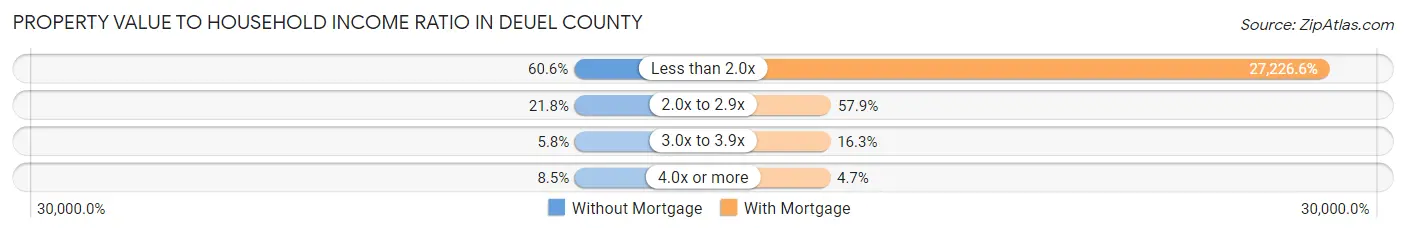
| Value-to-Income Ratio | Without Mortgage | With Mortgage |
| Less than 2.0x | 292 (60.6%) | 63,438 (27,226.6%) |
| 2.0x to 2.9x | 105 (21.8%) | 135 (57.9%) |
| 3.0x to 3.9x | 28 (5.8%) | 38 (16.3%) |
| 4.0x or more | 41 (8.5%) | 11 (4.7%) |
| Total | 482 (100.0%) | 233 (100.0%) |
Real Estate Taxes by Mortgage Status in Deuel County
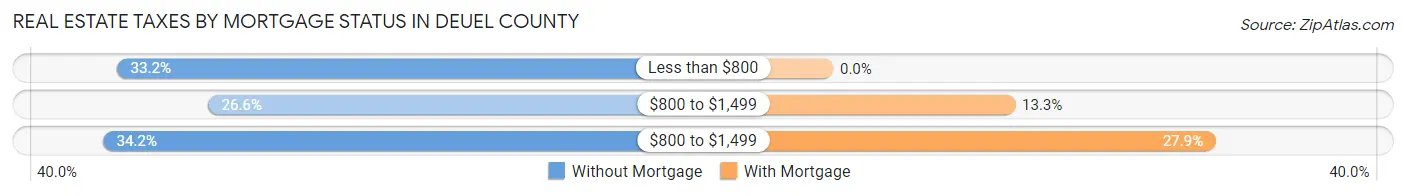
| Property Taxes | Without Mortgage | With Mortgage |
| Less than $800 | 160 (33.2%) | 0 (0.0%) |
| $800 to $1,499 | 128 (26.6%) | 31 (13.3%) |
| $800 to $1,499 | 165 (34.2%) | 65 (27.9%) |
| Total | 482 (100.0%) | 233 (100.0%) |
Health & Disability in Deuel County
Health Insurance Coverage by Age in Deuel County
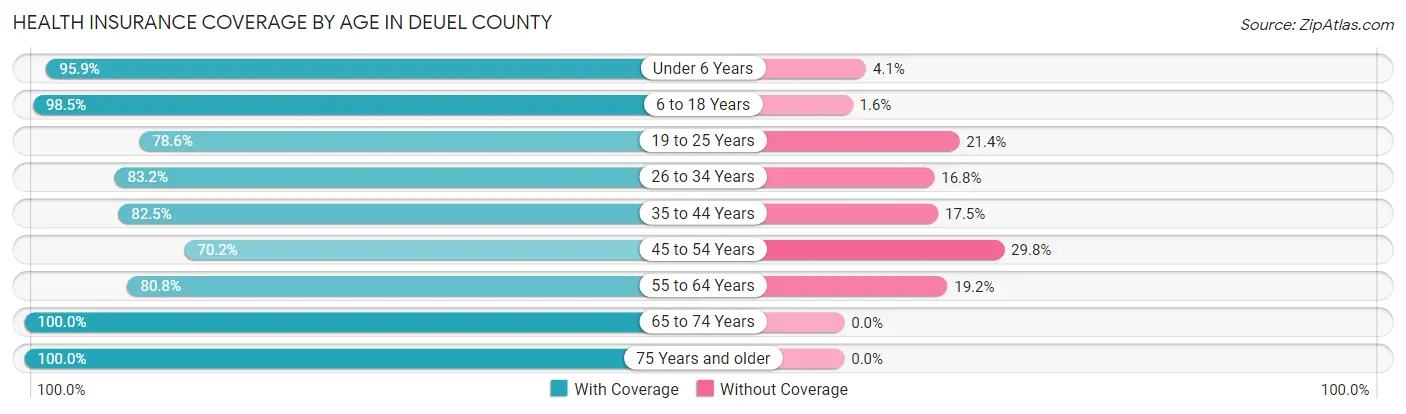
| Age Bracket | With Coverage | Without Coverage |
| Under 6 Years | 118 (95.9%) | 5 (4.1%) |
| 6 to 18 Years | 191 (98.5%) | 3 (1.5%) |
| 19 to 25 Years | 110 (78.6%) | 30 (21.4%) |
| 26 to 34 Years | 119 (83.2%) | 24 (16.8%) |
| 35 to 44 Years | 151 (82.5%) | 32 (17.5%) |
| 45 to 54 Years | 186 (70.2%) | 79 (29.8%) |
| 55 to 64 Years | 265 (80.8%) | 63 (19.2%) |
| 65 to 74 Years | 285 (100.0%) | 0 (0.0%) |
| 75 Years and older | 190 (100.0%) | 0 (0.0%) |
| Total | 1,615 (87.3%) | 236 (12.8%) |
Health Insurance Coverage by Citizenship Status in Deuel County
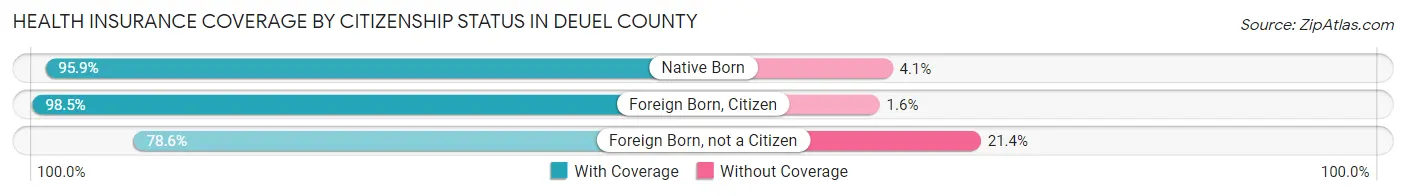
| Citizenship Status | With Coverage | Without Coverage |
| Native Born | 118 (95.9%) | 5 (4.1%) |
| Foreign Born, Citizen | 191 (98.5%) | 3 (1.5%) |
| Foreign Born, not a Citizen | 110 (78.6%) | 30 (21.4%) |
Health Insurance Coverage by Household Income in Deuel County
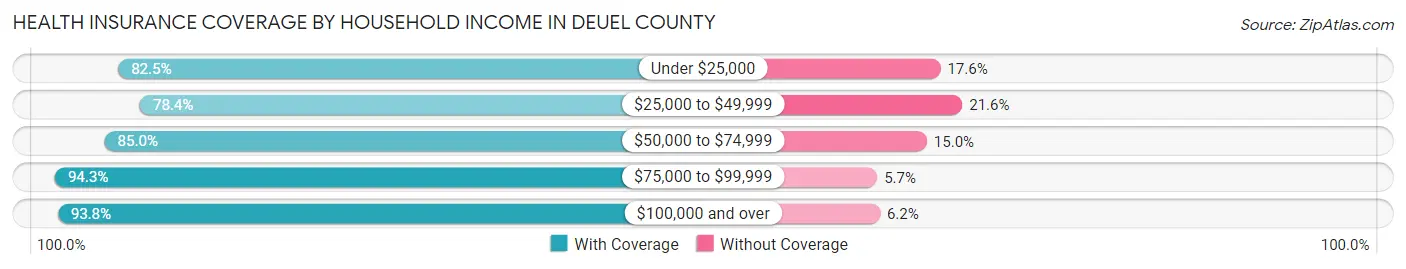
| Household Income | With Coverage | Without Coverage |
| Under $25,000 | 155 (82.5%) | 33 (17.5%) |
| $25,000 to $49,999 | 286 (78.4%) | 79 (21.6%) |
| $50,000 to $74,999 | 436 (85.0%) | 77 (15.0%) |
| $75,000 to $99,999 | 331 (94.3%) | 20 (5.7%) |
| $100,000 and over | 407 (93.8%) | 27 (6.2%) |
Public vs Private Health Insurance Coverage by Age in Deuel County
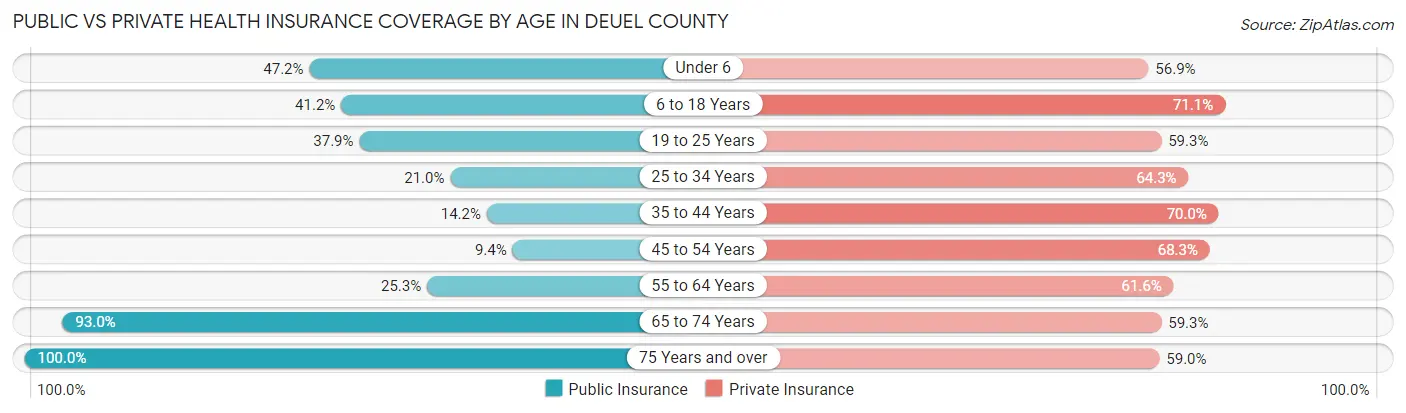
| Age Bracket | Public Insurance | Private Insurance |
| Under 6 | 58 (47.1%) | 70 (56.9%) |
| 6 to 18 Years | 80 (41.2%) | 138 (71.1%) |
| 19 to 25 Years | 53 (37.9%) | 83 (59.3%) |
| 25 to 34 Years | 30 (21.0%) | 92 (64.3%) |
| 35 to 44 Years | 26 (14.2%) | 128 (70.0%) |
| 45 to 54 Years | 25 (9.4%) | 181 (68.3%) |
| 55 to 64 Years | 83 (25.3%) | 202 (61.6%) |
| 65 to 74 Years | 265 (93.0%) | 169 (59.3%) |
| 75 Years and over | 190 (100.0%) | 112 (59.0%) |
| Total | 810 (43.8%) | 1,175 (63.5%) |
Disability Status by Sex by Age in Deuel County
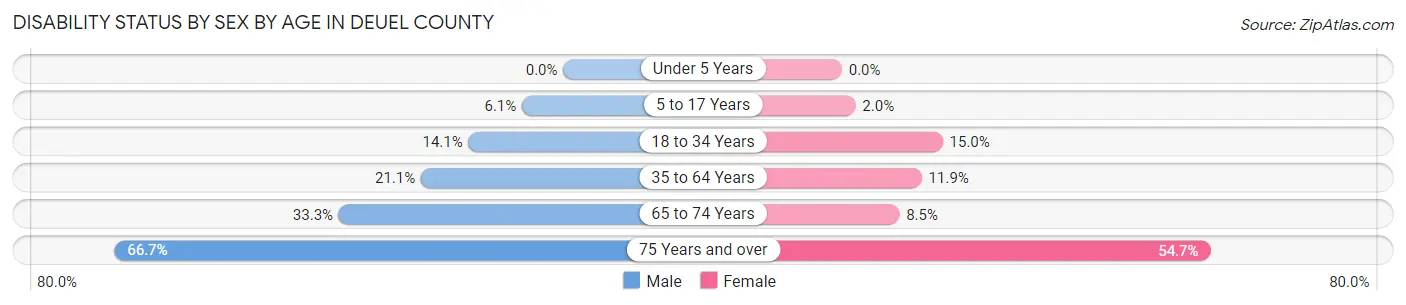
| Age Bracket | Male | Female |
| Under 5 Years | 0 (0.0%) | 0 (0.0%) |
| 5 to 17 Years | 6 (6.1%) | 2 (2.0%) |
| 18 to 34 Years | 20 (14.1%) | 22 (15.0%) |
| 35 to 64 Years | 82 (21.1%) | 46 (11.9%) |
| 65 to 74 Years | 52 (33.3%) | 11 (8.5%) |
| 75 Years and over | 56 (66.7%) | 58 (54.7%) |
Disability Class by Sex by Age in Deuel County
Disability Class: Hearing Difficulty
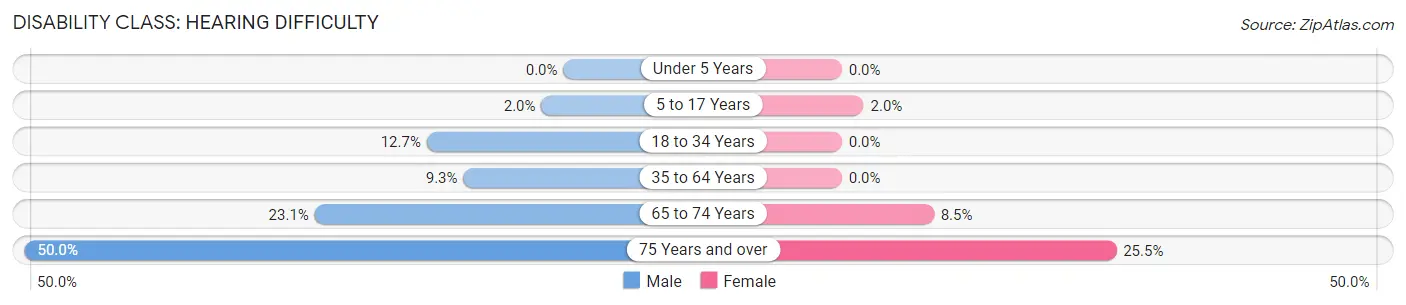
| Age Bracket | Male | Female |
| Under 5 Years | 0 (0.0%) | 0 (0.0%) |
| 5 to 17 Years | 2 (2.0%) | 2 (2.0%) |
| 18 to 34 Years | 18 (12.7%) | 0 (0.0%) |
| 35 to 64 Years | 36 (9.3%) | 0 (0.0%) |
| 65 to 74 Years | 36 (23.1%) | 11 (8.5%) |
| 75 Years and over | 42 (50.0%) | 27 (25.5%) |
Disability Class: Vision Difficulty
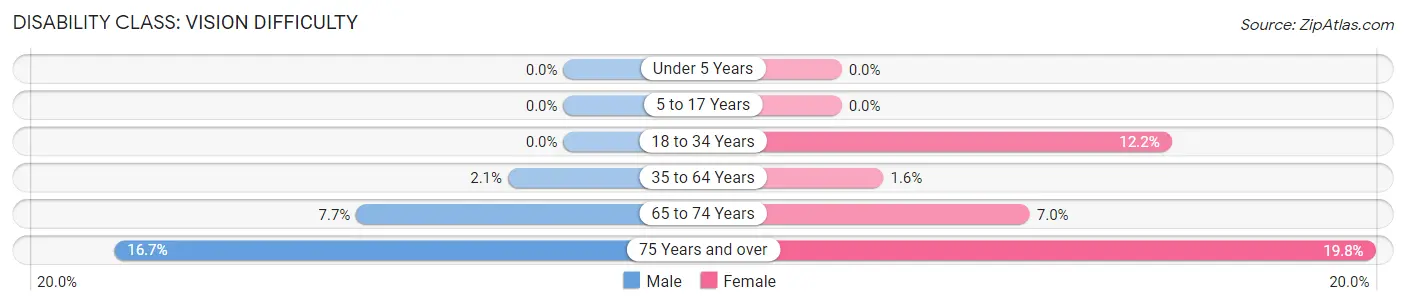
| Age Bracket | Male | Female |
| Under 5 Years | 0 (0.0%) | 0 (0.0%) |
| 5 to 17 Years | 0 (0.0%) | 0 (0.0%) |
| 18 to 34 Years | 0 (0.0%) | 18 (12.2%) |
| 35 to 64 Years | 8 (2.1%) | 6 (1.5%) |
| 65 to 74 Years | 12 (7.7%) | 9 (7.0%) |
| 75 Years and over | 14 (16.7%) | 21 (19.8%) |
Disability Class: Cognitive Difficulty
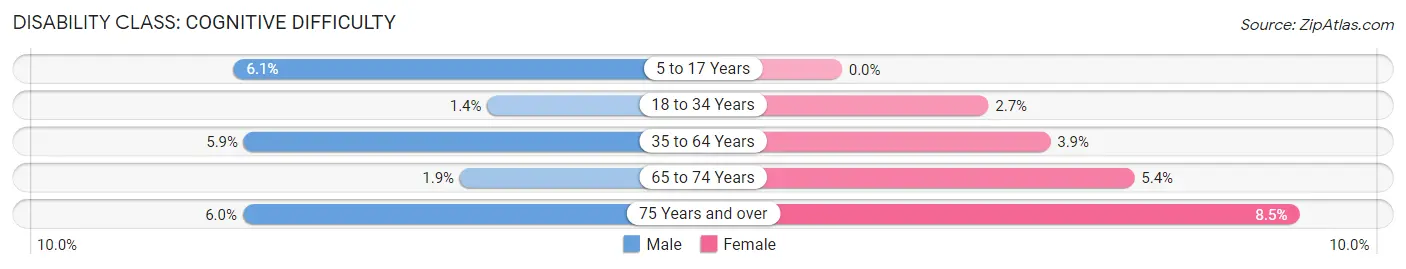
| Age Bracket | Male | Female |
| 5 to 17 Years | 6 (6.1%) | 0 (0.0%) |
| 18 to 34 Years | 2 (1.4%) | 4 (2.7%) |
| 35 to 64 Years | 23 (5.9%) | 15 (3.9%) |
| 65 to 74 Years | 3 (1.9%) | 7 (5.4%) |
| 75 Years and over | 5 (5.9%) | 9 (8.5%) |
Disability Class: Ambulatory Difficulty
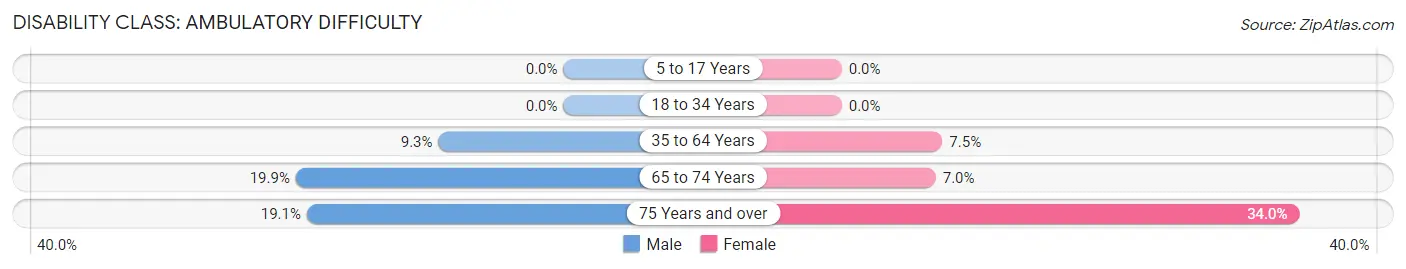
| Age Bracket | Male | Female |
| 5 to 17 Years | 0 (0.0%) | 0 (0.0%) |
| 18 to 34 Years | 0 (0.0%) | 0 (0.0%) |
| 35 to 64 Years | 36 (9.3%) | 29 (7.5%) |
| 65 to 74 Years | 31 (19.9%) | 9 (7.0%) |
| 75 Years and over | 16 (19.1%) | 36 (34.0%) |
Disability Class: Self-Care Difficulty
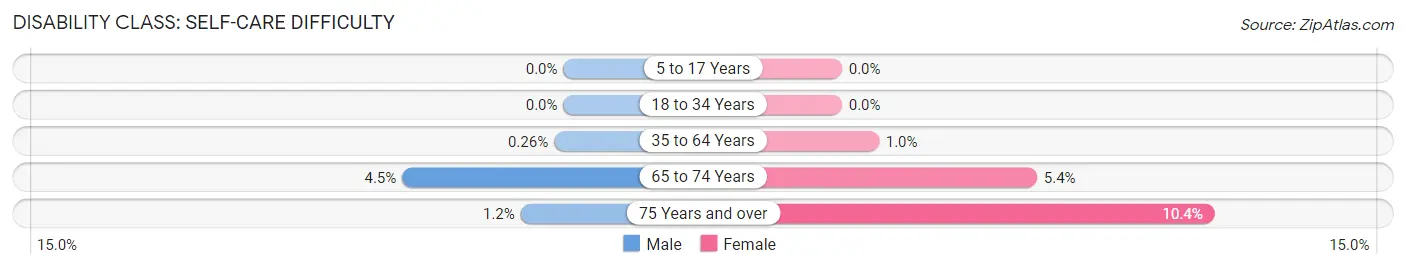
| Age Bracket | Male | Female |
| 5 to 17 Years | 0 (0.0%) | 0 (0.0%) |
| 18 to 34 Years | 0 (0.0%) | 0 (0.0%) |
| 35 to 64 Years | 1 (0.3%) | 4 (1.0%) |
| 65 to 74 Years | 7 (4.5%) | 7 (5.4%) |
| 75 Years and over | 1 (1.2%) | 11 (10.4%) |
Technology Access in Deuel County
Computing Device Access in Deuel County
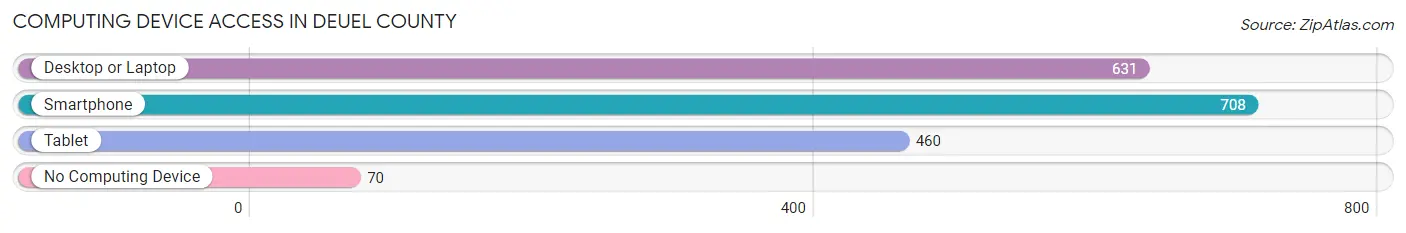
| Device Type | # Households | % Households |
| Desktop or Laptop | 631 | 73.3% |
| Smartphone | 708 | 82.2% |
| Tablet | 460 | 53.4% |
| No Computing Device | 70 | 8.1% |
| Total | 861 | 100.0% |
Internet Access in Deuel County
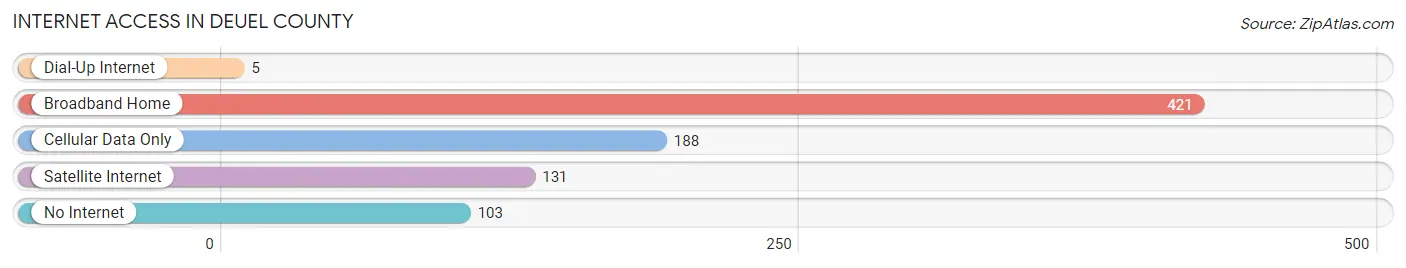
| Internet Type | # Households | % Households |
| Dial-Up Internet | 5 | 0.6% |
| Broadband Home | 421 | 48.9% |
| Cellular Data Only | 188 | 21.8% |
| Satellite Internet | 131 | 15.2% |
| No Internet | 103 | 12.0% |
| Total | 861 | 100.0% |
Deuel County Summary
Deuel County is located in the state of Nebraska, in the Midwestern United States. It is bordered by the states of South Dakota to the north, Wyoming to the west, and Colorado to the south. The county seat is Chappell, and the largest city is Chappell. As of the 2010 census, the population was 2,919.
History
Deuel County was established in 1887 and named after William Deuel, a prominent early settler. The county was originally part of Cheyenne County, which was created in 1873. The county was organized in 1887 and the first county seat was located in Chappell.
The first settlers in the area were ranchers and farmers, who were attracted by the fertile soil and abundant water. The first post office was established in 1887, and the first school was built in 1888.
Geography
Deuel County is located in the High Plains region of Nebraska. It is bordered by Cheyenne County to the north, Kimball County to the east, and Morrill County to the south. The county has a total area of 845 square miles, of which 844 square miles is land and 1 square mile is water.
The county is mostly flat, with some rolling hills in the western part. The highest point in the county is located in the northwest corner, at an elevation of 4,890 feet. The county is drained by the North Platte River, which flows through the western part of the county.
Economy
The economy of Deuel County is largely based on agriculture. The county is home to a variety of crops, including corn, wheat, soybeans, and alfalfa. Livestock production is also important, with cattle, sheep, and hogs being raised in the area.
The county is also home to several oil and gas fields, which provide jobs and revenue for the county. Tourism is also an important part of the economy, with visitors coming to the area to enjoy the natural beauty and outdoor recreation opportunities.
Demographics
As of the 2010 census, there were 2,919 people, 1,093 households, and 790 families living in the county. The population density was 3.5 people per square mile. The racial makeup of the county was 97.2% White, 0.3% African American, 0.2% Native American, 0.2% Asian, 0.1% Pacific Islander, 0.7% from other races, and 1.3% from two or more races. Hispanic or Latino of any race were 2.2% of the population.
The median income for a household in the county was $41,944, and the median income for a family was $50,000. The per capita income for the county was $19,945. About 11.2% of families and 14.2% of the population were below the poverty line, including 17.2% of those under age 18 and 8.2% of those age 65 or over.
Common Questions
What is Per Capita Income in Deuel County?
Per Capita income in Deuel County is $38,667.
What is the Median Family Income in Deuel County?
Median Family Income in Deuel County is $71,953.
What is the Median Household income in Deuel County?
Median Household Income in Deuel County is $58,875.
What is Income or Wage Gap in Deuel County?
Income or Wage Gap in Deuel County is 39.3%.
Women in Deuel County earn 60.7 cents for every dollar earned by a man.
What is Inequality or Gini Index in Deuel County?
Inequality or Gini Index in Deuel County is 0.48.
What is the Total Population of Deuel County?
Total Population of Deuel County is 1,858.
What is the Total Male Population of Deuel County?
Total Male Population of Deuel County is 918.
What is the Total Female Population of Deuel County?
Total Female Population of Deuel County is 940.
What is the Ratio of Males per 100 Females in Deuel County?
There are 97.66 Males per 100 Females in Deuel County.
What is the Ratio of Females per 100 Males in Deuel County?
There are 102.40 Females per 100 Males in Deuel County.
What is the Median Population Age in Deuel County?
Median Population Age in Deuel County is 51.0 Years.
What is the Average Family Size in Deuel County
Average Family Size in Deuel County is 2.6 People.
What is the Average Household Size in Deuel County
Average Household Size in Deuel County is 2.1 People.
How Large is the Labor Force in Deuel County?
There are 917 People in the Labor Forcein in Deuel County.
What is the Percentage of People in the Labor Force in Deuel County?
58.2% of People are in the Labor Force in Deuel County.
What is the Unemployment Rate in Deuel County?
Unemployment Rate in Deuel County is 3.8%.