Dawes County, NE Map & Demographics
Dawes County Map
Dawes County Overview
$27,256
PER CAPITA INCOME
$71,055
AVG FAMILY INCOME
$53,760
AVG HOUSEHOLD INCOME
25.0%
WAGE / INCOME GAP [ % ]
75.0¢/ $1
WAGE / INCOME GAP [ $ ]
0.38
INEQUALITY / GINI INDEX
8,279
TOTAL POPULATION
3,951
MALE POPULATION
4,328
FEMALE POPULATION
91.29
MALES / 100 FEMALES
109.54
FEMALES / 100 MALES
35.3
MEDIAN AGE
2.7
AVG FAMILY SIZE
2.1
AVG HOUSEHOLD SIZE
4,441
LABOR FORCE [ PEOPLE ]
63.8%
PERCENT IN LABOR FORCE
1.5%
UNEMPLOYMENT RATE
Dawes County Area Codes
Income in Dawes County
Income Overview in Dawes County
Per Capita Income in Dawes County is $27,256, while median incomes of families and households are $71,055 and $53,760 respectively.
| Characteristic | Number | Measure |
| Per Capita Income | 8,279 | $27,256 |
| Median Family Income | 2,034 | $71,055 |
| Mean Family Income | 2,034 | $79,030 |
| Median Household Income | 3,484 | $53,760 |
| Mean Household Income | 3,484 | $63,774 |
| Income Deficit | 2,034 | $0 |
| Wage / Income Gap (%) | 8,279 | 25.04% |
| Wage / Income Gap ($) | 8,279 | 74.96¢ per $1 |
| Gini / Inequality Index | 8,279 | 0.38 |
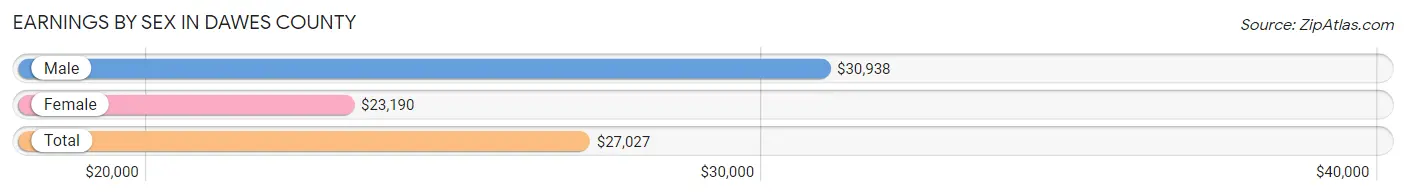
Earnings by Sex in Dawes County
Average Earnings in Dawes County are $27,027, $30,938 for men and $23,190 for women, a difference of 25.0%.
| Sex | Number | Average Earnings |
| Male | 2,505 (49.2%) | $30,938 |
| Female | 2,589 (50.8%) | $23,190 |
| Total | 5,094 (100.0%) | $27,027 |
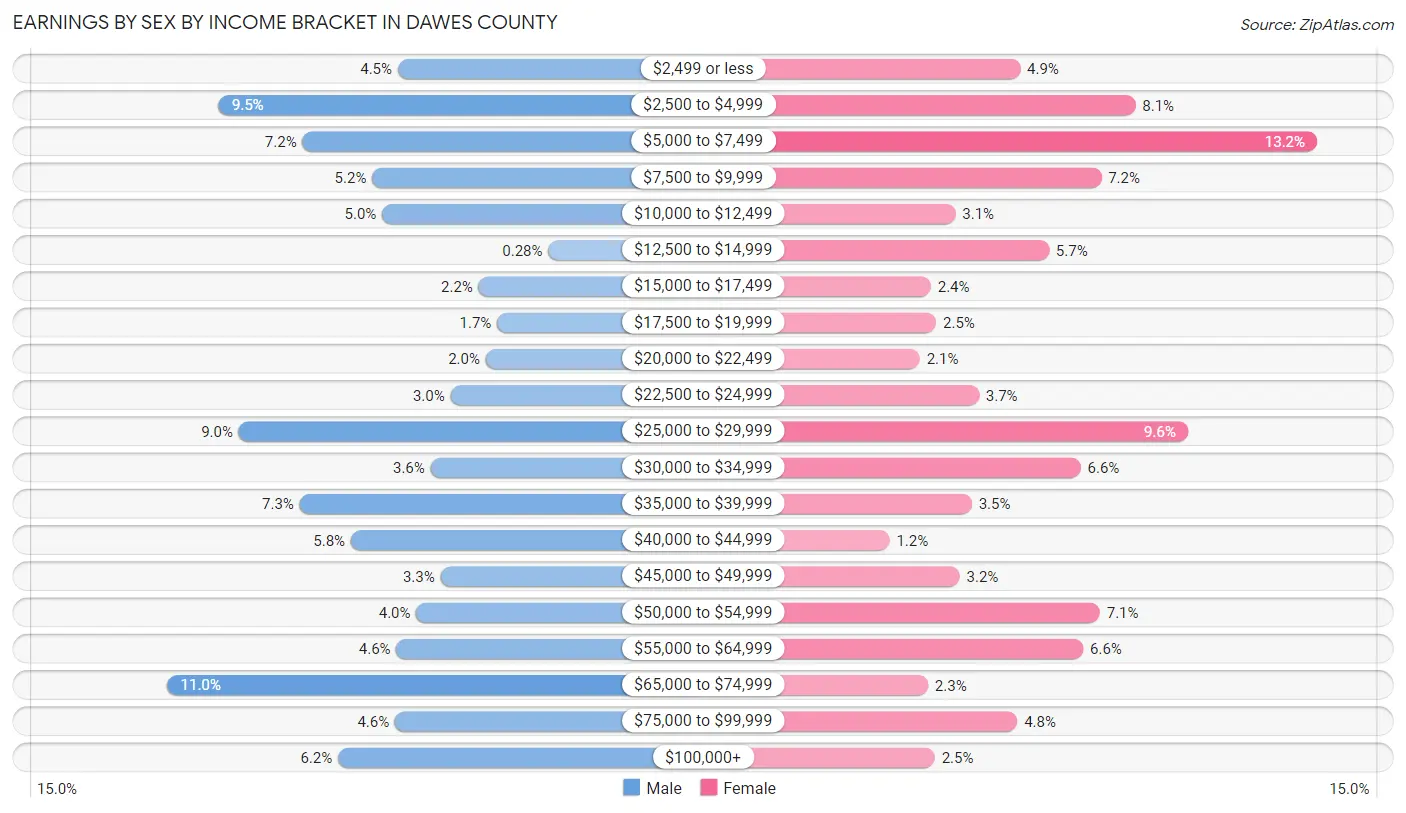
Earnings by Sex by Income Bracket in Dawes County
The most common earnings brackets in Dawes County are $65,000 to $74,999 for men (275 | 11.0%) and $5,000 to $7,499 for women (342 | 13.2%).
| Income | Male | Female |
| $2,499 or less | 113 (4.5%) | 126 (4.9%) |
| $2,500 to $4,999 | 239 (9.5%) | 210 (8.1%) |
| $5,000 to $7,499 | 180 (7.2%) | 342 (13.2%) |
| $7,500 to $9,999 | 131 (5.2%) | 185 (7.1%) |
| $10,000 to $12,499 | 124 (5.0%) | 79 (3.0%) |
| $12,500 to $14,999 | 7 (0.3%) | 147 (5.7%) |
| $15,000 to $17,499 | 56 (2.2%) | 61 (2.4%) |
| $17,500 to $19,999 | 43 (1.7%) | 65 (2.5%) |
| $20,000 to $22,499 | 51 (2.0%) | 53 (2.1%) |
| $22,500 to $24,999 | 76 (3.0%) | 96 (3.7%) |
| $25,000 to $29,999 | 225 (9.0%) | 248 (9.6%) |
| $30,000 to $34,999 | 90 (3.6%) | 170 (6.6%) |
| $35,000 to $39,999 | 182 (7.3%) | 91 (3.5%) |
| $40,000 to $44,999 | 146 (5.8%) | 31 (1.2%) |
| $45,000 to $49,999 | 83 (3.3%) | 82 (3.2%) |
| $50,000 to $54,999 | 100 (4.0%) | 184 (7.1%) |
| $55,000 to $64,999 | 114 (4.5%) | 172 (6.6%) |
| $65,000 to $74,999 | 275 (11.0%) | 59 (2.3%) |
| $75,000 to $99,999 | 115 (4.6%) | 124 (4.8%) |
| $100,000+ | 155 (6.2%) | 64 (2.5%) |
| Total | 2,505 (100.0%) | 2,589 (100.0%) |
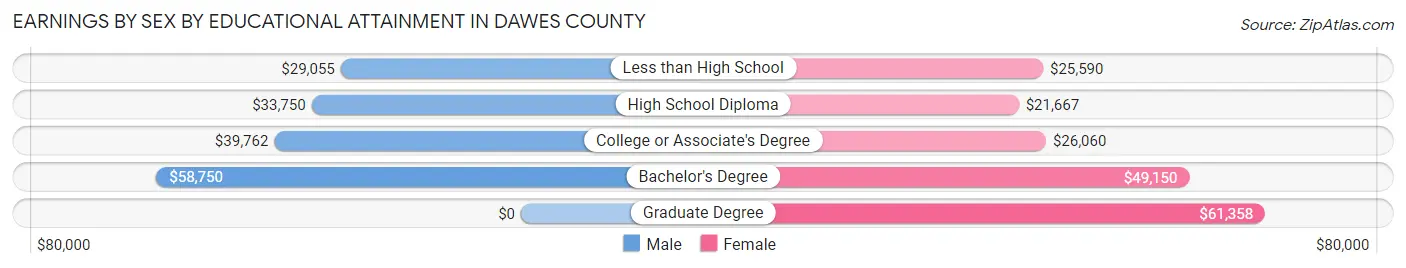
Earnings by Sex by Educational Attainment in Dawes County
Average earnings in Dawes County are $41,553 for men and $32,875 for women, a difference of 20.9%. Men with an educational attainment of bachelor's degree enjoy the highest average annual earnings of $58,750, while those with less than high school education earn the least with $29,055. Women with an educational attainment of graduate degree earn the most with the average annual earnings of $61,358, while those with high school diploma education have the smallest earnings of $21,667.
| Educational Attainment | Male Income | Female Income |
| Less than High School | $29,055 | $25,590 |
| High School Diploma | $33,750 | $21,667 |
| College or Associate's Degree | $39,762 | $26,060 |
| Bachelor's Degree | $58,750 | $49,150 |
| Graduate Degree | - | - |
| Total | $41,553 | $32,875 |
Family Income in Dawes County
Family Income Brackets in Dawes County
According to the Dawes County family income data, there are 539 families falling into the $50,000 to $74,999 income range, which is the most common income bracket and makes up 26.5% of all families. Conversely, the $200,000+ income bracket is the least frequent group with only 6 families (0.3%) belonging to this category.
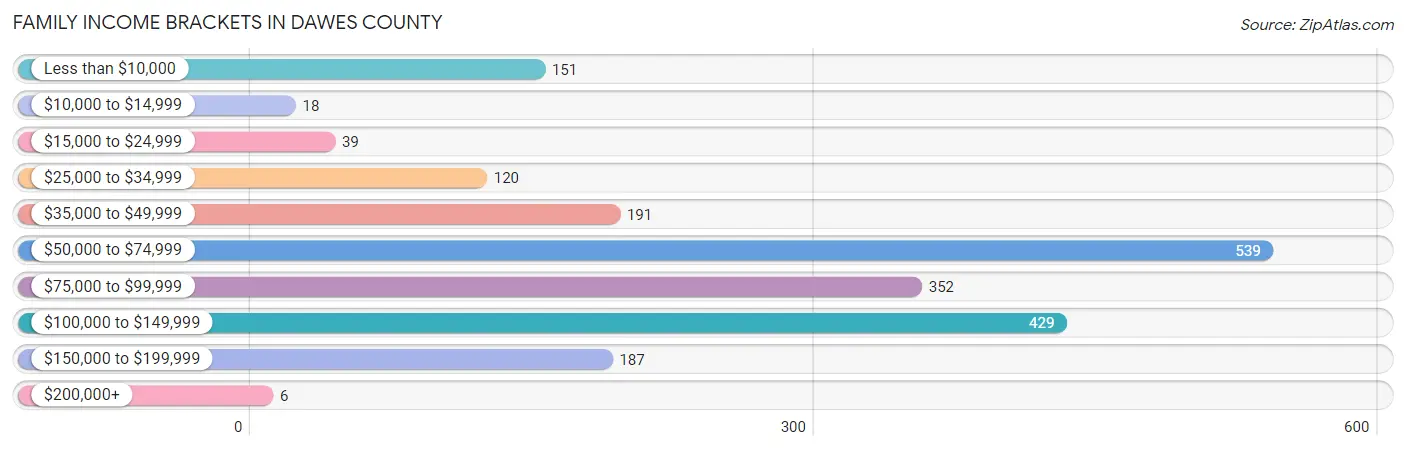
| Income Bracket | # Families | % Families |
| Less than $10,000 | 151 | 7.4% |
| $10,000 to $14,999 | 18 | 0.9% |
| $15,000 to $24,999 | 39 | 1.9% |
| $25,000 to $34,999 | 120 | 5.9% |
| $35,000 to $49,999 | 191 | 9.4% |
| $50,000 to $74,999 | 539 | 26.5% |
| $75,000 to $99,999 | 352 | 17.3% |
| $100,000 to $149,999 | 429 | 21.1% |
| $150,000 to $199,999 | 187 | 9.2% |
| $200,000+ | 6 | 0.3% |
Family Income by Famaliy Size in Dawes County
7+ person families (39 | 1.9%) account for the highest median family income in Dawes County with $124,063 per family, while 2-person families (1,204 | 59.2%) have the highest median income of $31,401 per family member.
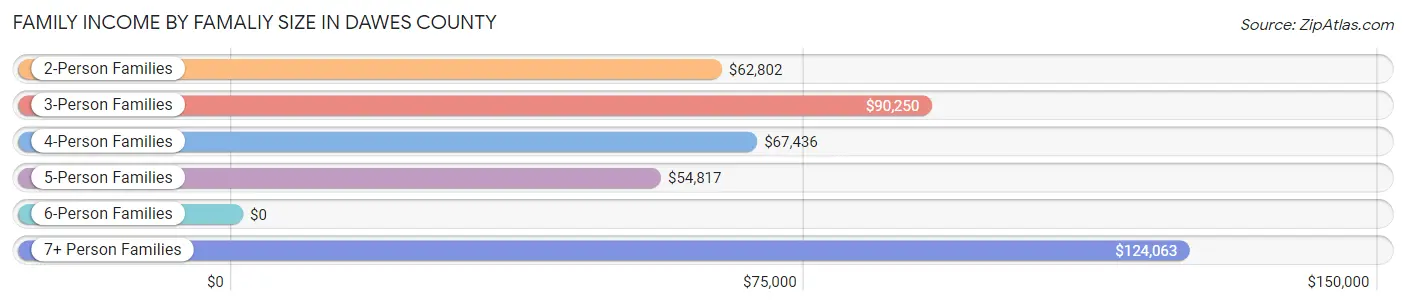
| Income Bracket | # Families | Median Income |
| 2-Person Families | 1,204 (59.2%) | $62,802 |
| 3-Person Families | 378 (18.6%) | $90,250 |
| 4-Person Families | 244 (12.0%) | $67,436 |
| 5-Person Families | 139 (6.8%) | $54,817 |
| 6-Person Families | 30 (1.5%) | $0 |
| 7+ Person Families | 39 (1.9%) | $124,063 |
| Total | 2,034 (100.0%) | $71,055 |
Family Income by Number of Earners in Dawes County
The median family income in Dawes County is $71,055, with families comprising 3+ earners (157) having the highest median family income of $99,135, while families with 1 earner (582) have the lowest median family income of $52,059, accounting for 7.7% and 28.6% of families, respectively.
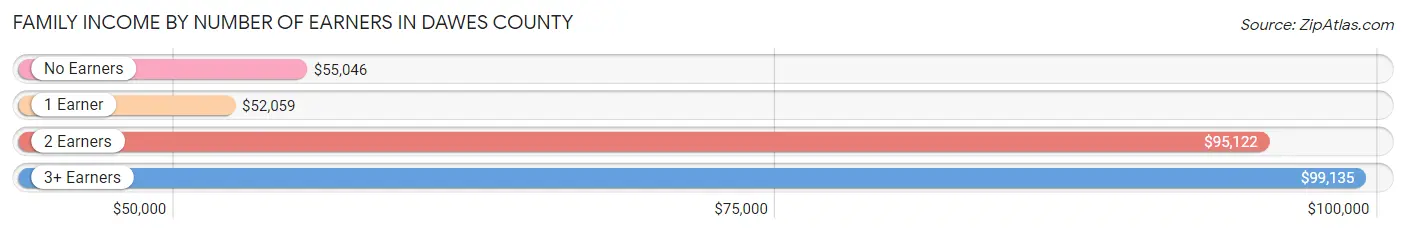
| Number of Earners | # Families | Median Income |
| No Earners | 323 (15.9%) | $55,046 |
| 1 Earner | 582 (28.6%) | $52,059 |
| 2 Earners | 972 (47.8%) | $95,122 |
| 3+ Earners | 157 (7.7%) | $99,135 |
| Total | 2,034 (100.0%) | $71,055 |
Household Income in Dawes County
Household Income Brackets in Dawes County
With 753 households falling in the category, the $50,000 to $74,999 income range is the most frequent in Dawes County, accounting for 21.6% of all households. In contrast, only 7 households (0.2%) fall into the $200,000+ income bracket, making it the least populous group.
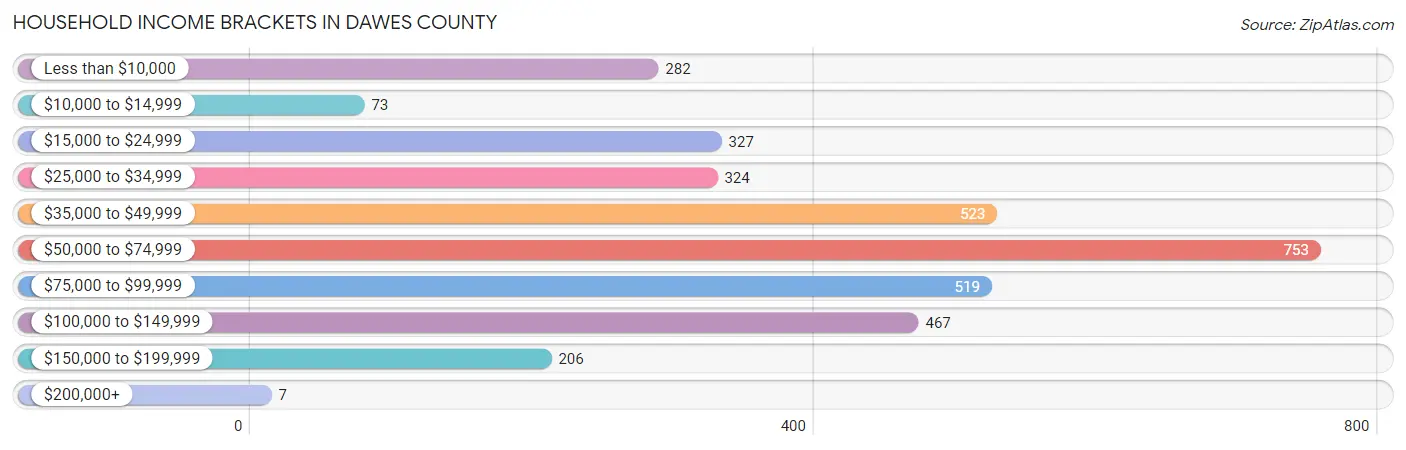
| Income Bracket | # Households | % Households |
| Less than $10,000 | 282 | 8.1% |
| $10,000 to $14,999 | 73 | 2.1% |
| $15,000 to $24,999 | 327 | 9.4% |
| $25,000 to $34,999 | 324 | 9.3% |
| $35,000 to $49,999 | 523 | 15.0% |
| $50,000 to $74,999 | 753 | 21.6% |
| $75,000 to $99,999 | 519 | 14.9% |
| $100,000 to $149,999 | 467 | 13.4% |
| $150,000 to $199,999 | 206 | 5.9% |
| $200,000+ | 7 | 0.2% |
Household Income by Householder Age in Dawes County
The median household income in Dawes County is $53,760, with the highest median household income of $73,333 found in the 45 to 64 years age bracket for the primary householder. A total of 1,160 households (33.3%) fall into this category. Meanwhile, the 15 to 24 years age bracket for the primary householder has the lowest median household income of $0, with 362 households (10.4%) in this group.
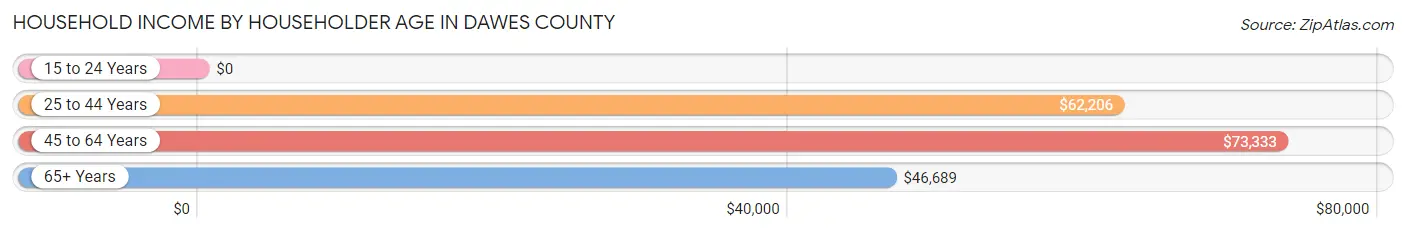
| Income Bracket | # Households | Median Income |
| 15 to 24 Years | 362 (10.4%) | $0 |
| 25 to 44 Years | 1,066 (30.6%) | $62,206 |
| 45 to 64 Years | 1,160 (33.3%) | $73,333 |
| 65+ Years | 896 (25.7%) | $46,689 |
| Total | 3,484 (100.0%) | $53,760 |
Poverty in Dawes County
Income Below Poverty by Sex and Age in Dawes County
With 10.9% poverty level for males and 14.8% for females among the residents of Dawes County, 18 to 24 year old males and 18 to 24 year old females are the most vulnerable to poverty, with 139 males (46.3%) and 303 females (55.2%) in their respective age groups living below the poverty level.
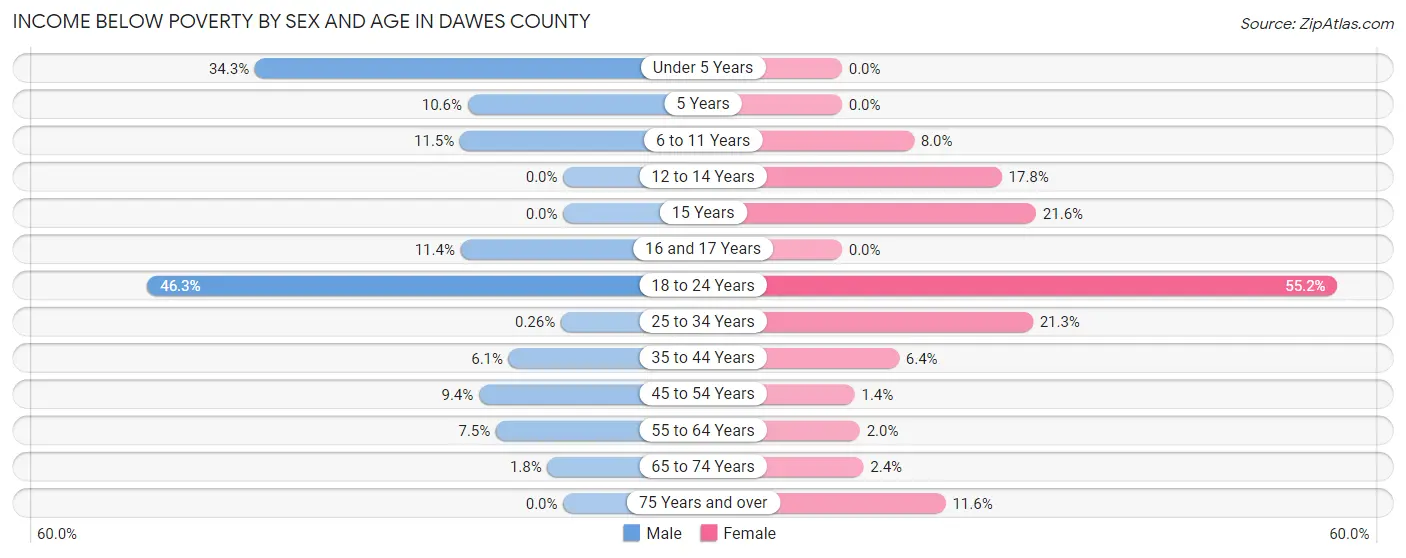
| Age Bracket | Male | Female |
| Under 5 Years | 91 (34.3%) | 0 (0.0%) |
| 5 Years | 5 (10.6%) | 0 (0.0%) |
| 6 to 11 Years | 23 (11.5%) | 23 (8.0%) |
| 12 to 14 Years | 0 (0.0%) | 21 (17.8%) |
| 15 Years | 0 (0.0%) | 8 (21.6%) |
| 16 and 17 Years | 12 (11.4%) | 0 (0.0%) |
| 18 to 24 Years | 139 (46.3%) | 303 (55.2%) |
| 25 to 34 Years | 1 (0.3%) | 128 (21.3%) |
| 35 to 44 Years | 27 (6.1%) | 23 (6.4%) |
| 45 to 54 Years | 38 (9.4%) | 5 (1.4%) |
| 55 to 64 Years | 40 (7.5%) | 10 (2.0%) |
| 65 to 74 Years | 7 (1.8%) | 10 (2.4%) |
| 75 Years and over | 0 (0.0%) | 50 (11.6%) |
| Total | 383 (10.9%) | 581 (14.8%) |
Income Above Poverty by Sex and Age in Dawes County
According to the poverty statistics in Dawes County, males aged 12 to 14 years and females aged under 5 years are the age groups that are most secure financially, with 100.0% of males and 100.0% of females in these age groups living above the poverty line.
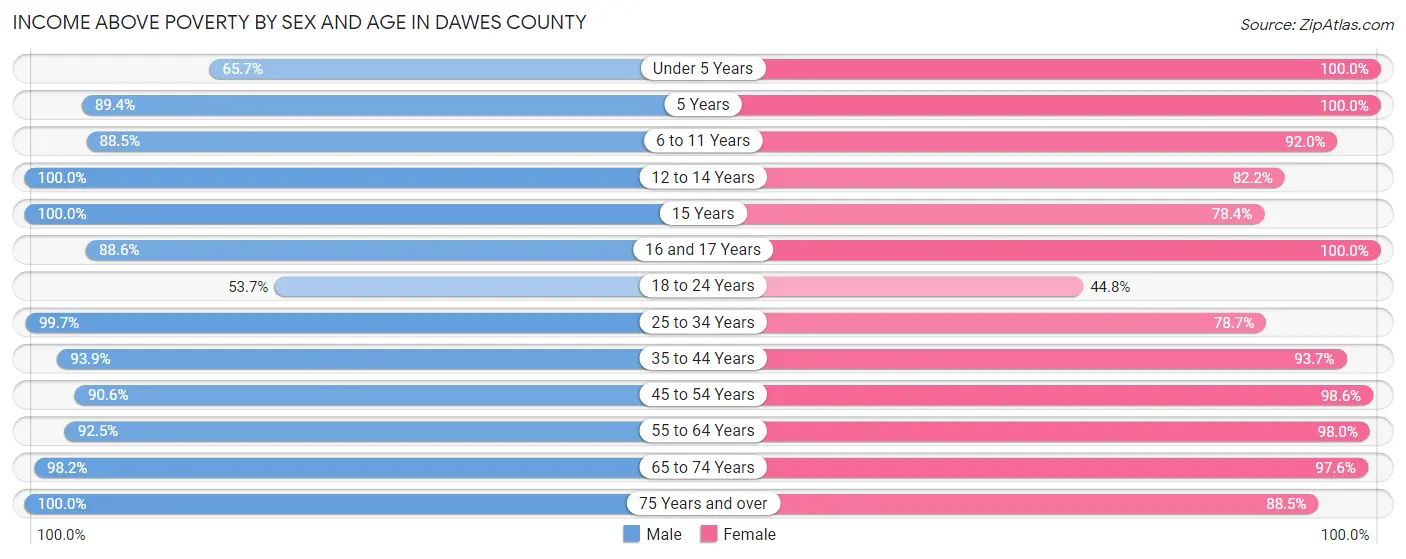
| Age Bracket | Male | Female |
| Under 5 Years | 174 (65.7%) | 170 (100.0%) |
| 5 Years | 42 (89.4%) | 50 (100.0%) |
| 6 to 11 Years | 177 (88.5%) | 264 (92.0%) |
| 12 to 14 Years | 119 (100.0%) | 97 (82.2%) |
| 15 Years | 25 (100.0%) | 29 (78.4%) |
| 16 and 17 Years | 93 (88.6%) | 53 (100.0%) |
| 18 to 24 Years | 161 (53.7%) | 246 (44.8%) |
| 25 to 34 Years | 391 (99.7%) | 474 (78.7%) |
| 35 to 44 Years | 418 (93.9%) | 339 (93.6%) |
| 45 to 54 Years | 367 (90.6%) | 347 (98.6%) |
| 55 to 64 Years | 494 (92.5%) | 491 (98.0%) |
| 65 to 74 Years | 391 (98.2%) | 406 (97.6%) |
| 75 Years and over | 269 (100.0%) | 383 (88.4%) |
| Total | 3,121 (89.1%) | 3,349 (85.2%) |
Income Below Poverty Among Married-Couple Families in Dawes County
The poverty statistics for married-couple families in Dawes County show that 3.0% or 49 of the total 1,627 families live below the poverty line. Families with 5 or more children have the highest poverty rate of 42.9%, comprising of 15 families. On the other hand, families with 1 or 2 children have the lowest poverty rate of 0.0%, which includes 0 families.
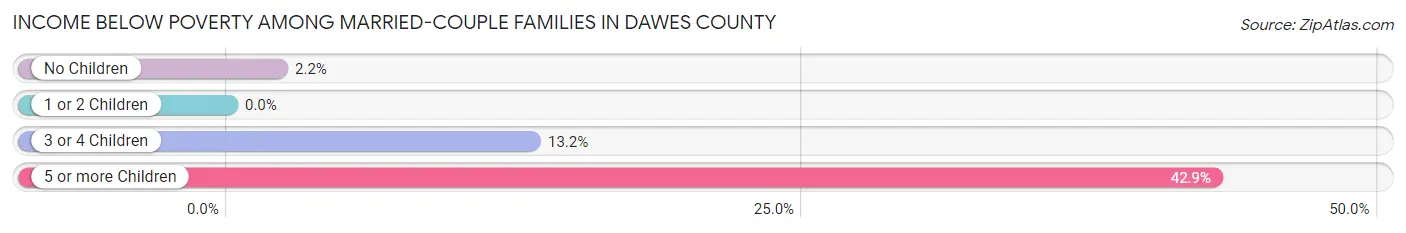
| Children | Above Poverty | Below Poverty |
| No Children | 989 (97.8%) | 22 (2.2%) |
| 1 or 2 Children | 490 (100.0%) | 0 (0.0%) |
| 3 or 4 Children | 79 (86.8%) | 12 (13.2%) |
| 5 or more Children | 20 (57.1%) | 15 (42.9%) |
| Total | 1,578 (97.0%) | 49 (3.0%) |
Income Below Poverty Among Single-Parent Households in Dawes County
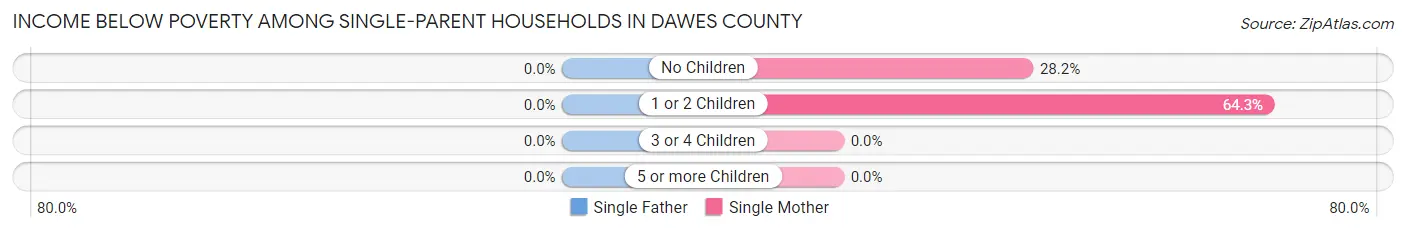
| Children | Single Father | Single Mother |
| No Children | 0 (0.0%) | 22 (28.2%) |
| 1 or 2 Children | 0 (0.0%) | 124 (64.2%) |
| 3 or 4 Children | 0 (0.0%) | 0 (0.0%) |
| 5 or more Children | 0 (0.0%) | 0 (0.0%) |
| Total | 0 (0.0%) | 146 (52.0%) |
Income Below Poverty Among Married-Couple vs Single-Parent Households in Dawes County
The poverty data for Dawes County shows that 49 of the married-couple family households (3.0%) and 146 of the single-parent households (35.9%) are living below the poverty level. Within the married-couple family households, those with 5 or more children have the highest poverty rate, with 15 households (42.9%) falling below the poverty line. Among the single-parent households, those with 1 or 2 children have the highest poverty rate, with 124 household (41.7%) living below poverty.
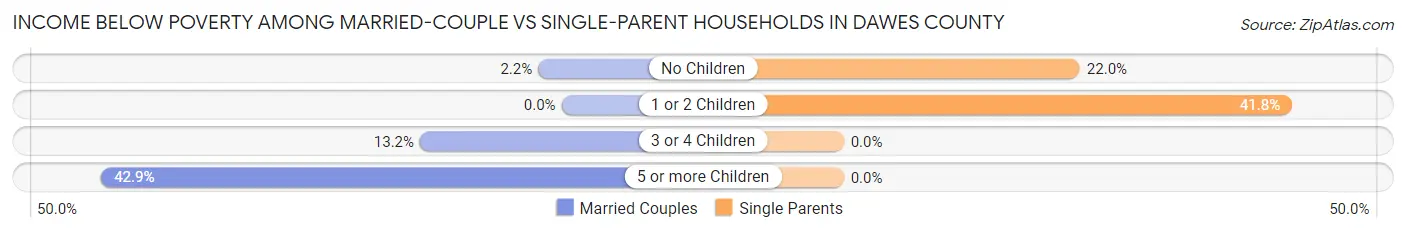
| Children | Married-Couple Families | Single-Parent Households |
| No Children | 22 (2.2%) | 22 (22.0%) |
| 1 or 2 Children | 0 (0.0%) | 124 (41.7%) |
| 3 or 4 Children | 12 (13.2%) | 0 (0.0%) |
| 5 or more Children | 15 (42.9%) | 0 (0.0%) |
| Total | 49 (3.0%) | 146 (35.9%) |
Race in Dawes County
The most populous races in Dawes County are White / Caucasian (7,268 | 87.8%), Two or more Races (497 | 6.0%), and Hispanic or Latino (478 | 5.8%).
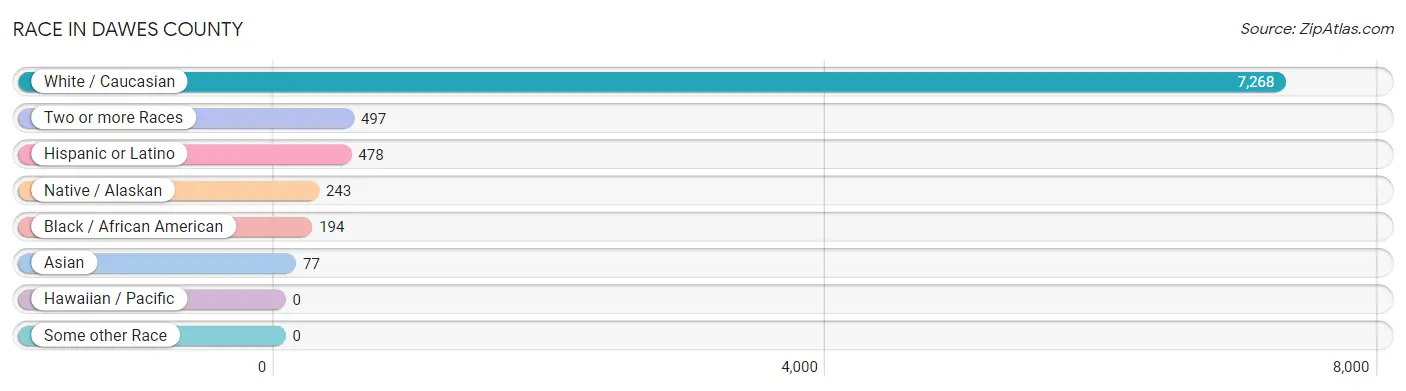
| Race | # Population | % Population |
| Asian | 77 | 0.9% |
| Black / African American | 194 | 2.3% |
| Hawaiian / Pacific | 0 | 0.0% |
| Hispanic or Latino | 478 | 5.8% |
| Native / Alaskan | 243 | 2.9% |
| White / Caucasian | 7,268 | 87.8% |
| Two or more Races | 497 | 6.0% |
| Some other Race | 0 | 0.0% |
| Total | 8,279 | 100.0% |
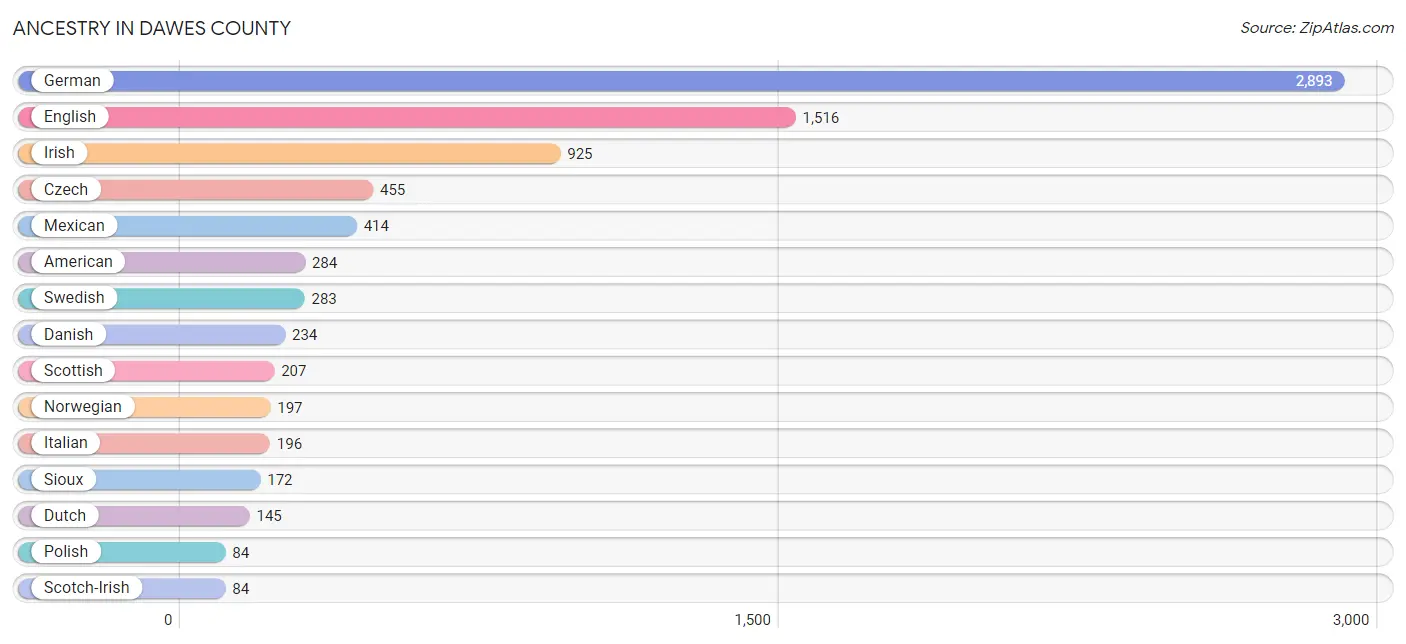
Ancestry in Dawes County
The most populous ancestries reported in Dawes County are German (2,893 | 34.9%), English (1,516 | 18.3%), Irish (925 | 11.2%), Czech (455 | 5.5%), and Mexican (414 | 5.0%), together accounting for 74.9% of all Dawes County residents.
| Ancestry | # Population | % Population |
| African | 5 | 0.1% |
| American | 284 | 3.4% |
| Apache | 8 | 0.1% |
| Arab | 12 | 0.1% |
| Bhutanese | 19 | 0.2% |
| British | 63 | 0.8% |
| Canadian | 8 | 0.1% |
| Cherokee | 17 | 0.2% |
| Chippewa | 5 | 0.1% |
| Cuban | 9 | 0.1% |
| Czech | 455 | 5.5% |
| Czechoslovakian | 30 | 0.4% |
| Danish | 234 | 2.8% |
| Dutch | 145 | 1.8% |
| Eastern European | 3 | 0.0% |
| English | 1,516 | 18.3% |
| European | 53 | 0.6% |
| Filipino | 54 | 0.6% |
| Finnish | 23 | 0.3% |
| French | 63 | 0.8% |
| French Canadian | 3 | 0.0% |
| German | 2,893 | 34.9% |
| German Russian | 4 | 0.1% |
| Greek | 70 | 0.9% |
| Hungarian | 81 | 1.0% |
| Indian (Asian) | 5 | 0.1% |
| Irish | 925 | 11.2% |
| Italian | 196 | 2.4% |
| Jamaican | 2 | 0.0% |
| Korean | 4 | 0.1% |
| Lebanese | 12 | 0.1% |
| Malaysian | 77 | 0.9% |
| Mexican | 414 | 5.0% |
| Native Hawaiian | 1 | 0.0% |
| Navajo | 64 | 0.8% |
| Nigerian | 5 | 0.1% |
| Northern European | 62 | 0.7% |
| Norwegian | 197 | 2.4% |
| Pennsylvania German | 19 | 0.2% |
| Polish | 84 | 1.0% |
| Puerto Rican | 14 | 0.2% |
| Russian | 35 | 0.4% |
| Scandinavian | 2 | 0.0% |
| Scotch-Irish | 84 | 1.0% |
| Scottish | 207 | 2.5% |
| Sioux | 172 | 2.1% |
| Spaniard | 38 | 0.5% |
| Subsaharan African | 10 | 0.1% |
| Swedish | 283 | 3.4% |
| Swiss | 58 | 0.7% |
| Syrian | 9 | 0.1% |
| Thai | 4 | 0.1% |
| Ukrainian | 15 | 0.2% |
| Welsh | 49 | 0.6% |
| Yugoslavian | 22 | 0.3% | View All 55 Rows |
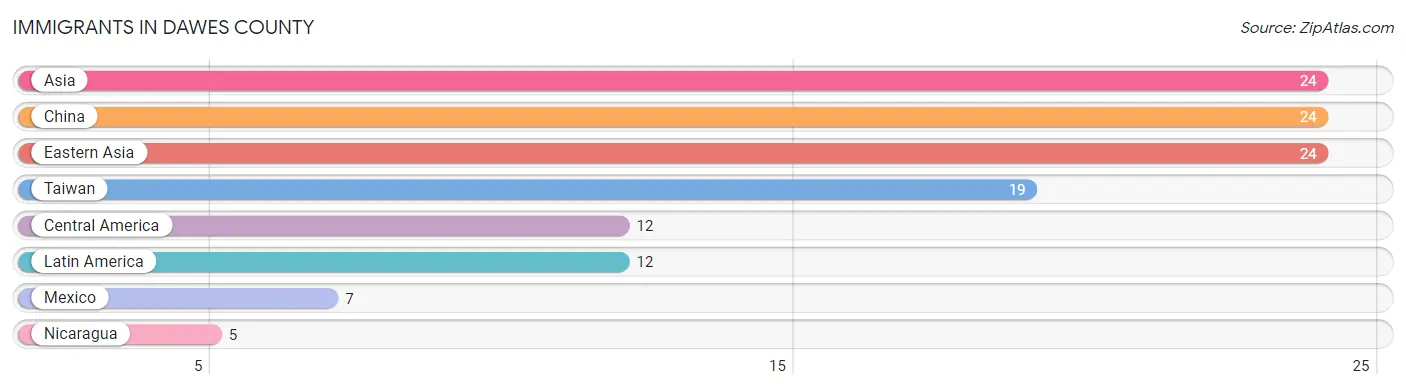
Immigrants in Dawes County
The most numerous immigrant groups reported in Dawes County came from Asia (24 | 0.3%), China (24 | 0.3%), Eastern Asia (24 | 0.3%), Taiwan (19 | 0.2%), and Central America (12 | 0.1%), together accounting for 1.2% of all Dawes County residents.
| Immigration Origin | # Population | % Population |
| Asia | 24 | 0.3% |
| Central America | 12 | 0.1% |
| China | 24 | 0.3% |
| Eastern Asia | 24 | 0.3% |
| Latin America | 12 | 0.1% |
| Mexico | 7 | 0.1% |
| Nicaragua | 5 | 0.1% |
| Taiwan | 19 | 0.2% | View All 8 Rows |
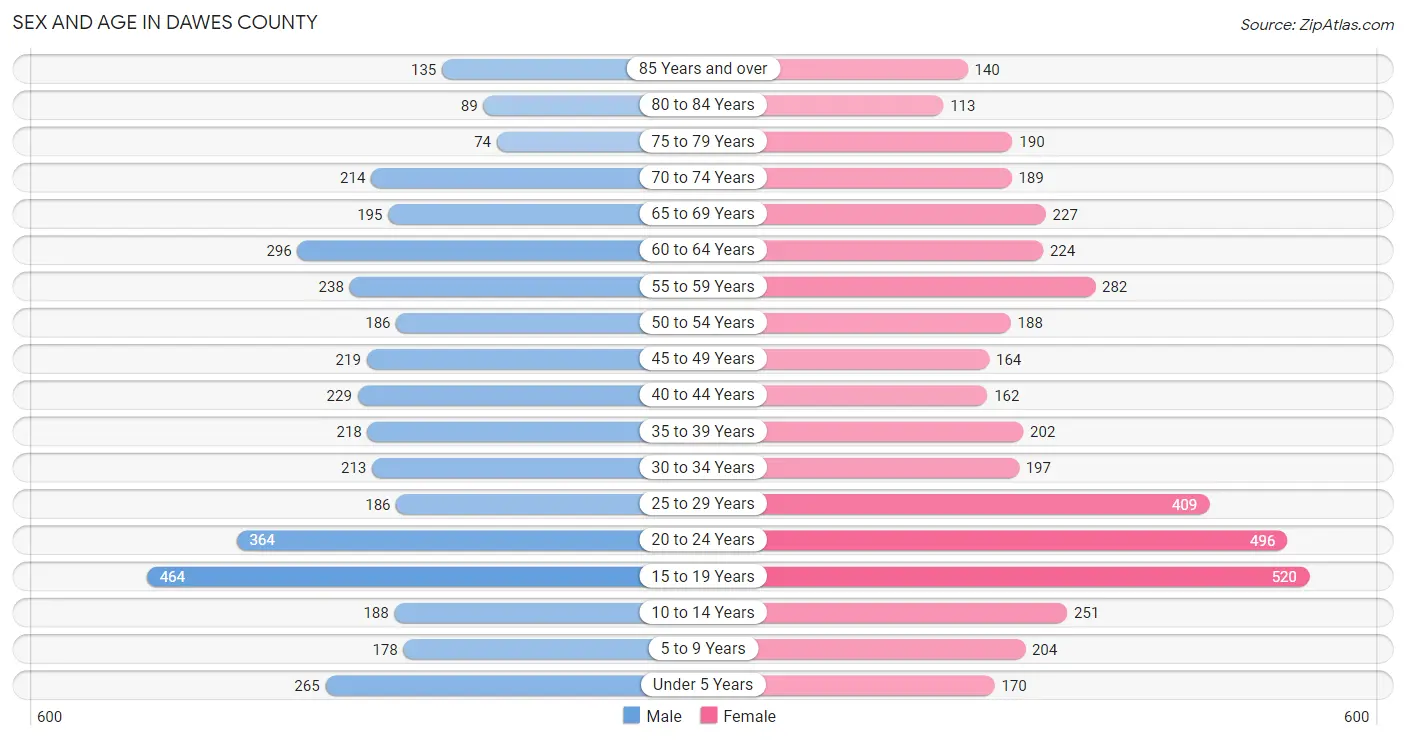
Sex and Age in Dawes County
Sex and Age in Dawes County
The most populous age groups in Dawes County are 15 to 19 Years (464 | 11.7%) for men and 15 to 19 Years (520 | 12.0%) for women.
| Age Bracket | Male | Female |
| Under 5 Years | 265 (6.7%) | 170 (3.9%) |
| 5 to 9 Years | 178 (4.5%) | 204 (4.7%) |
| 10 to 14 Years | 188 (4.8%) | 251 (5.8%) |
| 15 to 19 Years | 464 (11.7%) | 520 (12.0%) |
| 20 to 24 Years | 364 (9.2%) | 496 (11.5%) |
| 25 to 29 Years | 186 (4.7%) | 409 (9.5%) |
| 30 to 34 Years | 213 (5.4%) | 197 (4.5%) |
| 35 to 39 Years | 218 (5.5%) | 202 (4.7%) |
| 40 to 44 Years | 229 (5.8%) | 162 (3.7%) |
| 45 to 49 Years | 219 (5.5%) | 164 (3.8%) |
| 50 to 54 Years | 186 (4.7%) | 188 (4.3%) |
| 55 to 59 Years | 238 (6.0%) | 282 (6.5%) |
| 60 to 64 Years | 296 (7.5%) | 224 (5.2%) |
| 65 to 69 Years | 195 (4.9%) | 227 (5.2%) |
| 70 to 74 Years | 214 (5.4%) | 189 (4.4%) |
| 75 to 79 Years | 74 (1.9%) | 190 (4.4%) |
| 80 to 84 Years | 89 (2.2%) | 113 (2.6%) |
| 85 Years and over | 135 (3.4%) | 140 (3.2%) |
| Total | 3,951 (100.0%) | 4,328 (100.0%) |
Families and Households in Dawes County
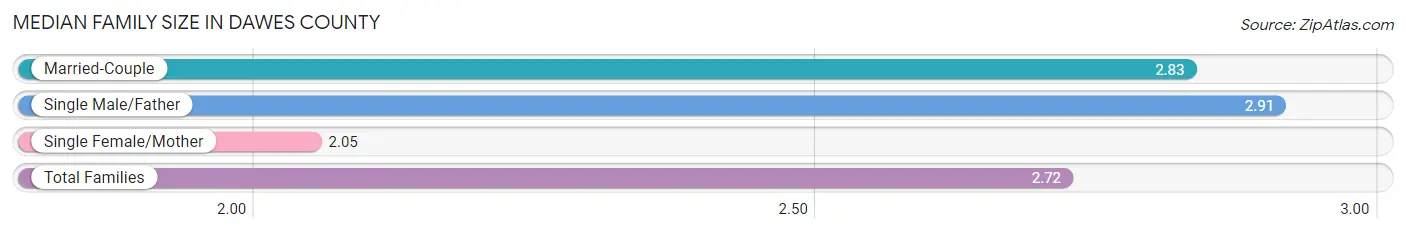
Median Family Size in Dawes County
The median family size in Dawes County is 2.72 persons per family, with single male/father families (126 | 6.2%) accounting for the largest median family size of 2.91 persons per family. On the other hand, single female/mother families (281 | 13.8%) represent the smallest median family size with 2.05 persons per family.
| Family Type | # Families | Family Size |
| Married-Couple | 1,627 (80.0%) | 2.83 |
| Single Male/Father | 126 (6.2%) | 2.91 |
| Single Female/Mother | 281 (13.8%) | 2.05 |
| Total Families | 2,034 (100.0%) | 2.72 |
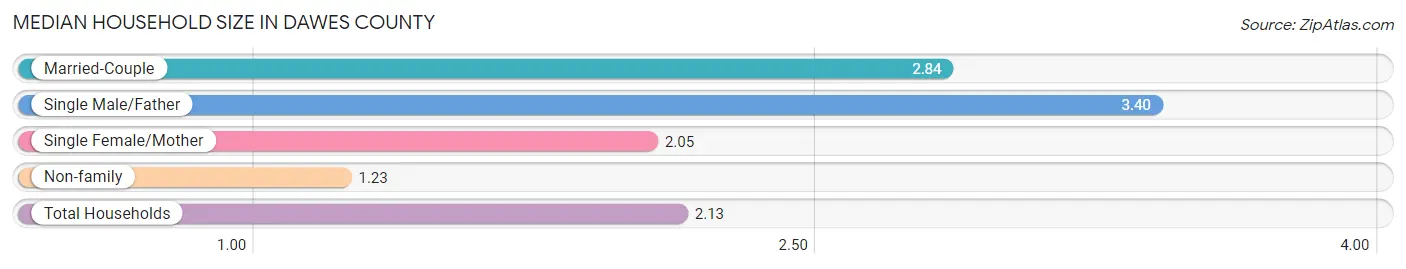
Median Household Size in Dawes County
The median household size in Dawes County is 2.13 persons per household, with single male/father households (126 | 3.6%) accounting for the largest median household size of 3.4 persons per household. non-family households (1,450 | 41.6%) represent the smallest median household size with 1.23 persons per household.
| Household Type | # Households | Household Size |
| Married-Couple | 1,627 (46.7%) | 2.84 |
| Single Male/Father | 126 (3.6%) | 3.40 |
| Single Female/Mother | 281 (8.1%) | 2.05 |
| Non-family | 1,450 (41.6%) | 1.23 |
| Total Households | 3,484 (100.0%) | 2.13 |
Household Size by Marriage Status in Dawes County
Out of a total of 3,484 households in Dawes County, 2,034 (58.4%) are family households, while 1,450 (41.6%) are nonfamily households. The most numerous type of family households are 2-person households, comprising 1,185, and the most common type of nonfamily households are 1-person households, comprising 1,193.
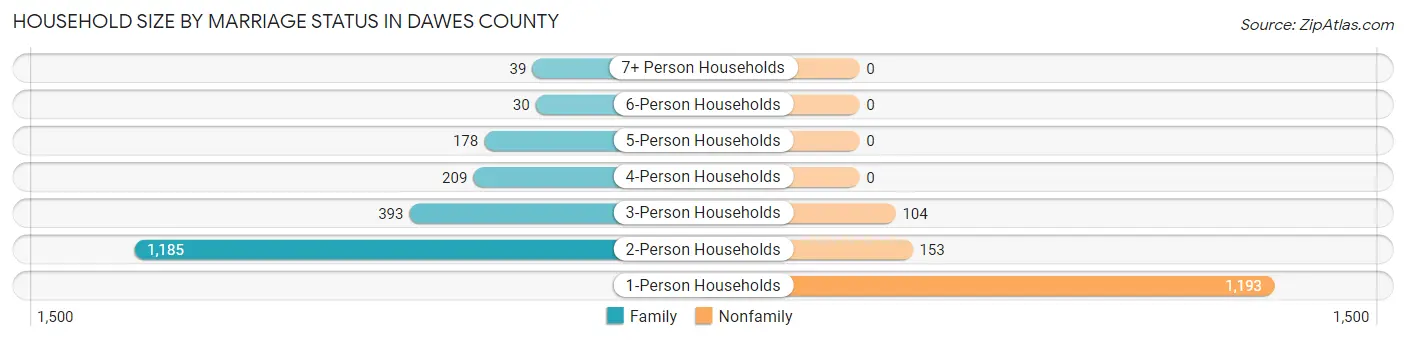
| Household Size | Family Households | Nonfamily Households |
| 1-Person Households | - | 1,193 (34.2%) |
| 2-Person Households | 1,185 (34.0%) | 153 (4.4%) |
| 3-Person Households | 393 (11.3%) | 104 (3.0%) |
| 4-Person Households | 209 (6.0%) | 0 (0.0%) |
| 5-Person Households | 178 (5.1%) | 0 (0.0%) |
| 6-Person Households | 30 (0.9%) | 0 (0.0%) |
| 7+ Person Households | 39 (1.1%) | 0 (0.0%) |
| Total | 2,034 (58.4%) | 1,450 (41.6%) |
Female Fertility in Dawes County
Fertility by Age in Dawes County
Average fertility rate in Dawes County is 46.0 births per 1,000 women. Women in the age bracket of 20 to 34 years have the highest fertility rate with 77.0 births per 1,000 women. Women in the age bracket of 20 to 34 years acount for 82.5% of all women with births.
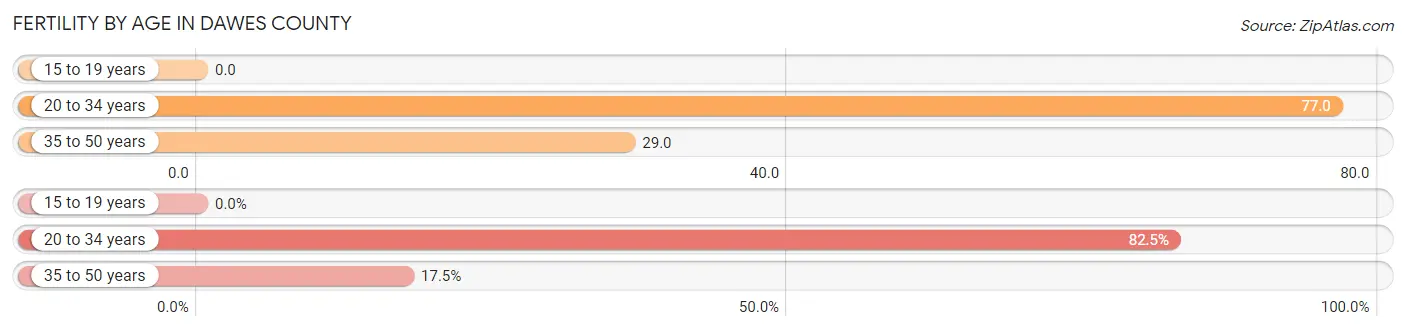
| Age Bracket | Women with Births | Births / 1,000 Women |
| 15 to 19 years | 0 (0.0%) | 0.0 |
| 20 to 34 years | 85 (82.5%) | 77.0 |
| 35 to 50 years | 18 (17.5%) | 29.0 |
| Total | 103 (100.0%) | 46.0 |
Fertility by Age by Marriage Status in Dawes County
99.0% of women with births (103) in Dawes County are married. The highest percentage of unmarried women with births falls into 20 to 34 years age bracket with 1.2% of them unmarried at the time of birth, while the lowest percentage of unmarried women with births belong to 35 to 50 years age bracket with 0.0% of them unmarried.
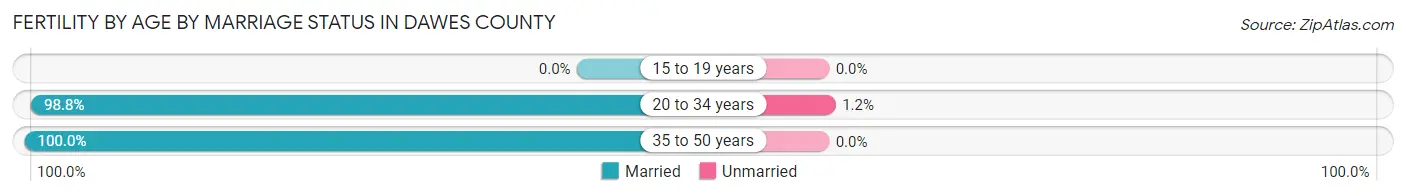
| Age Bracket | Married | Unmarried |
| 15 to 19 years | 0 (0.0%) | 0 (0.0%) |
| 20 to 34 years | 84 (98.8%) | 1 (1.2%) |
| 35 to 50 years | 18 (100.0%) | 0 (0.0%) |
| Total | 102 (99.0%) | 1 (1.0%) |
Fertility by Education in Dawes County
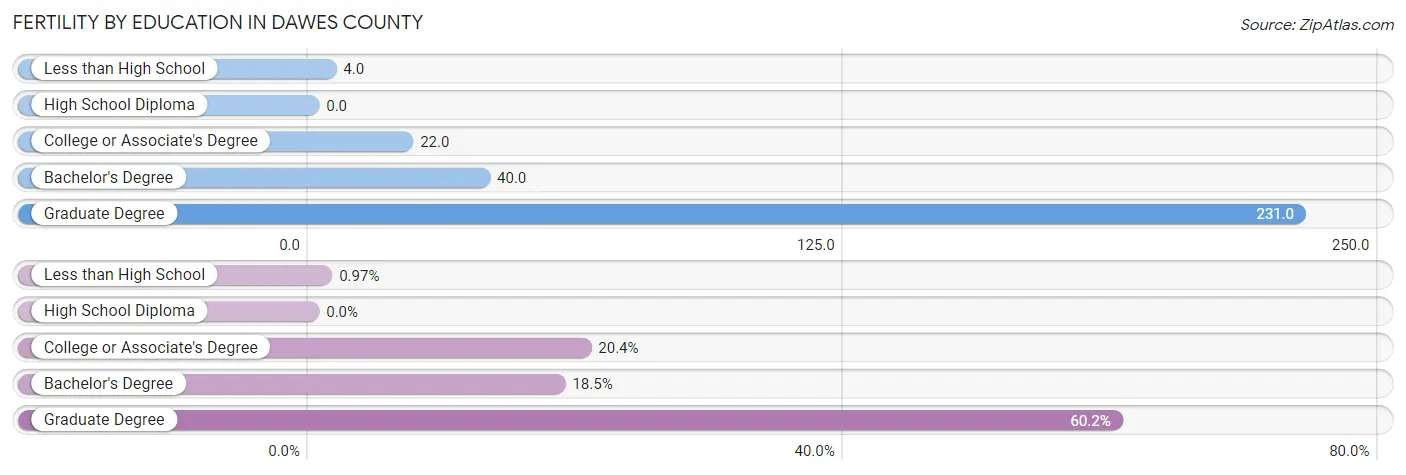
| Educational Attainment | Women with Births | Births / 1,000 Women |
| Less than High School | 1 (1.0%) | 4.0 |
| High School Diploma | 0 (0.0%) | 0.0 |
| College or Associate's Degree | 21 (20.4%) | 22.0 |
| Bachelor's Degree | 19 (18.4%) | 40.0 |
| Graduate Degree | 62 (60.2%) | 231.0 |
| Total | 103 (100.0%) | 46.0 |
Fertility by Education by Marriage Status in Dawes County
1.0% of women with births in Dawes County are unmarried. Women with the educational attainment of college or associate's degree are most likely to be married with 100.0% of them married at childbirth, while women with the educational attainment of less than high school are least likely to be married with 100.0% of them unmarried at childbirth.
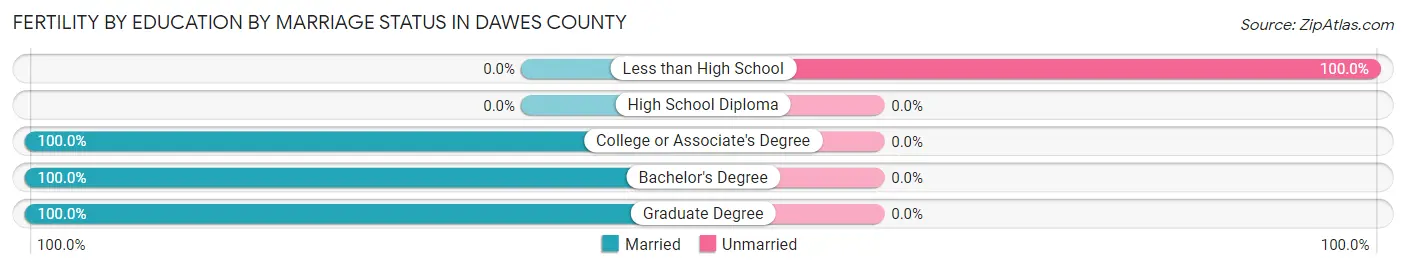
| Educational Attainment | Married | Unmarried |
| Less than High School | 0 (0.0%) | 1 (100.0%) |
| High School Diploma | 0 (0.0%) | 0 (0.0%) |
| College or Associate's Degree | 21 (100.0%) | 0 (0.0%) |
| Bachelor's Degree | 19 (100.0%) | 0 (0.0%) |
| Graduate Degree | 62 (100.0%) | 0 (0.0%) |
| Total | 102 (99.0%) | 1 (1.0%) |
Employment Characteristics in Dawes County
Employment by Class of Employer in Dawes County
Among the 4,292 employed individuals in Dawes County, private company employees (1,737 | 40.5%), state government employees (1,089 | 25.4%), and self-employed (not incorporated) (507 | 11.8%) make up the most common classes of employment.
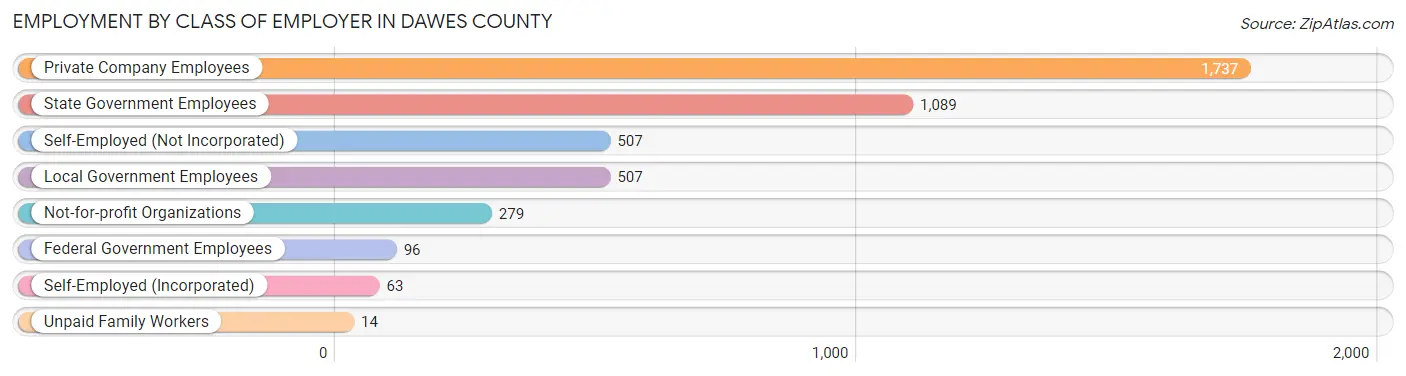
| Employer Class | # Employees | % Employees |
| Private Company Employees | 1,737 | 40.5% |
| Self-Employed (Incorporated) | 63 | 1.5% |
| Self-Employed (Not Incorporated) | 507 | 11.8% |
| Not-for-profit Organizations | 279 | 6.5% |
| Local Government Employees | 507 | 11.8% |
| State Government Employees | 1,089 | 25.4% |
| Federal Government Employees | 96 | 2.2% |
| Unpaid Family Workers | 14 | 0.3% |
| Total | 4,292 | 100.0% |
Employment Status by Age in Dawes County
According to the labor force statistics for Dawes County, out of the total population over 16 years of age (6,961), 63.8% or 4,441 individuals are in the labor force, with 1.5% or 67 of them unemployed. The age group with the highest labor force participation rate is 25 to 29 years, with 98.7% or 587 individuals in the labor force. Within the labor force, the 60 to 64 years age range has the highest percentage of unemployed individuals, with 8.7% or 22 of them being unemployed.
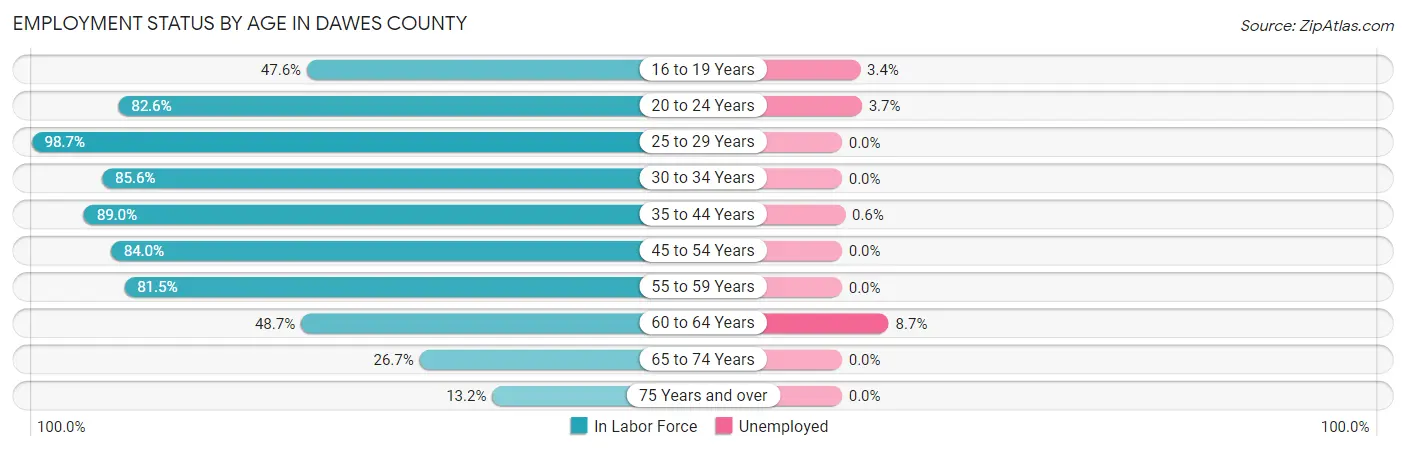
| Age Bracket | In Labor Force | Unemployed |
| 16 to 19 Years | 439 (47.6%) | 15 (3.4%) |
| 20 to 24 Years | 710 (82.6%) | 26 (3.7%) |
| 25 to 29 Years | 587 (98.7%) | 0 (0.0%) |
| 30 to 34 Years | 351 (85.6%) | 0 (0.0%) |
| 35 to 44 Years | 722 (89.0%) | 4 (0.6%) |
| 45 to 54 Years | 636 (84.0%) | 0 (0.0%) |
| 55 to 59 Years | 424 (81.5%) | 0 (0.0%) |
| 60 to 64 Years | 253 (48.7%) | 22 (8.7%) |
| 65 to 74 Years | 220 (26.7%) | 0 (0.0%) |
| 75 Years and over | 98 (13.2%) | 0 (0.0%) |
| Total | 4,441 (63.8%) | 67 (1.5%) |
Employment Status by Educational Attainment in Dawes County
According to labor force statistics for Dawes County, 82.3% of individuals (2,973) out of the total population between 25 and 64 years of age (3,613) are in the labor force, with 0.9% or 27 of them being unemployed. The group with the highest labor force participation rate are those with the educational attainment of less than high school, with 88.1% or 155 individuals in the labor force. Within the labor force, individuals with bachelor's degree or higher education have the highest percentage of unemployment, with 1.9% or 23 of them being unemployed.
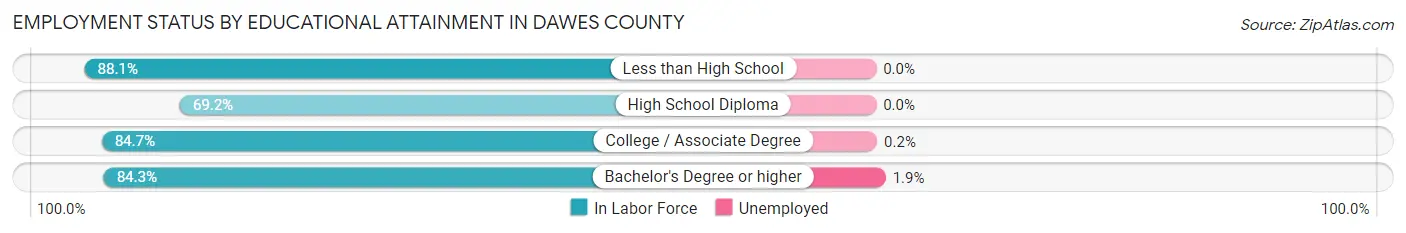
| Educational Attainment | In Labor Force | Unemployed |
| Less than High School | 155 (88.1%) | 0 (0.0%) |
| High School Diploma | 391 (69.2%) | 0 (0.0%) |
| College / Associate Degree | 1,223 (84.7%) | 3 (0.2%) |
| Bachelor's Degree or higher | 1,204 (84.3%) | 27 (1.9%) |
| Total | 2,973 (82.3%) | 33 (0.9%) |
Employment Occupations by Sex in Dawes County
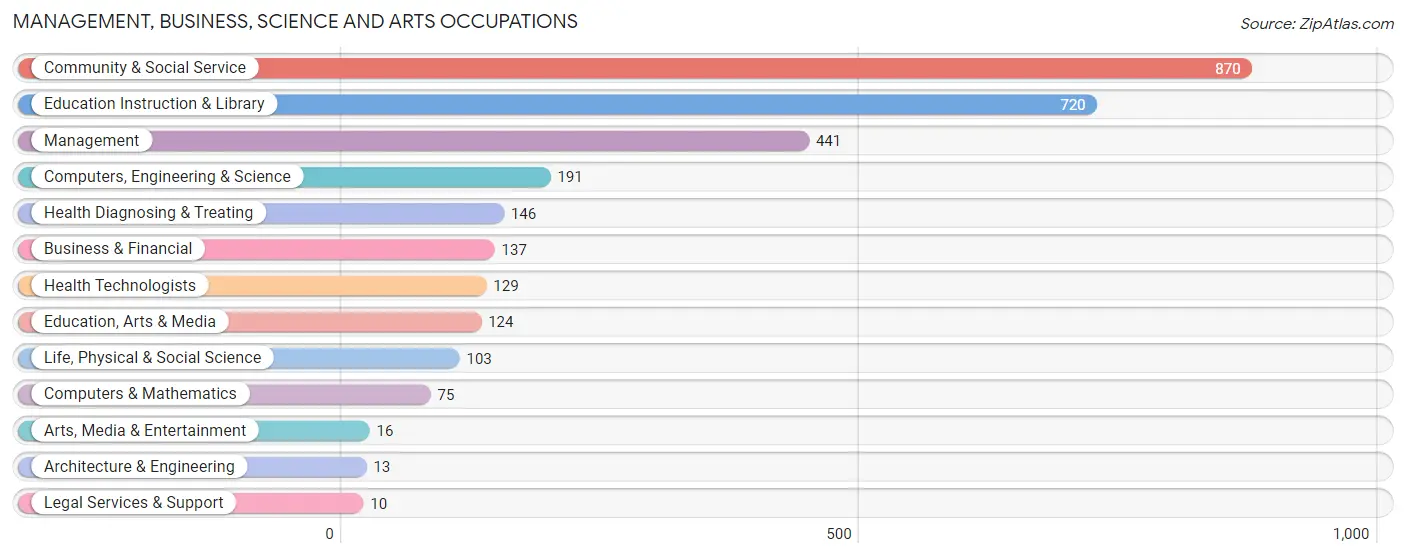
Management, Business, Science and Arts Occupations
The most common Management, Business, Science and Arts occupations in Dawes County are Community & Social Service (870 | 19.9%), Education Instruction & Library (720 | 16.5%), Management (441 | 10.1%), Computers, Engineering & Science (191 | 4.4%), and Health Diagnosing & Treating (146 | 3.3%).
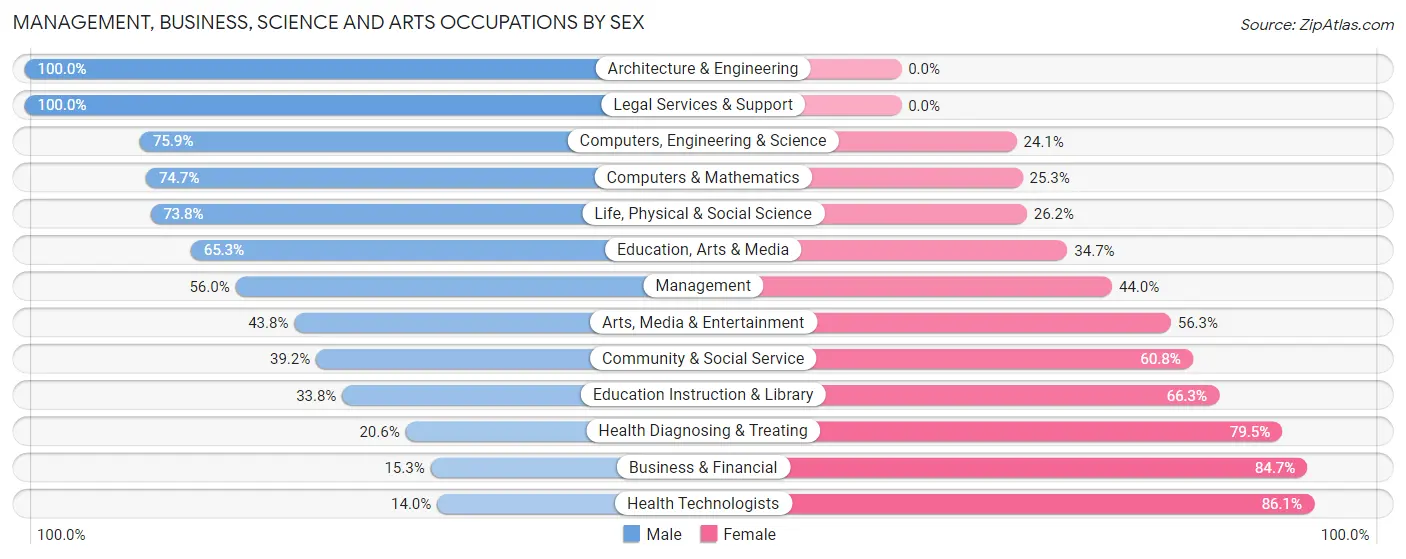
Management, Business, Science and Arts Occupations by Sex
Within the Management, Business, Science and Arts occupations in Dawes County, the most male-oriented occupations are Architecture & Engineering (100.0%), Legal Services & Support (100.0%), and Computers, Engineering & Science (75.9%), while the most female-oriented occupations are Health Technologists (86.1%), Business & Financial (84.7%), and Health Diagnosing & Treating (79.4%).
| Occupation | Male | Female |
| Management | 247 (56.0%) | 194 (44.0%) |
| Business & Financial | 21 (15.3%) | 116 (84.7%) |
| Computers, Engineering & Science | 145 (75.9%) | 46 (24.1%) |
| Computers & Mathematics | 56 (74.7%) | 19 (25.3%) |
| Architecture & Engineering | 13 (100.0%) | 0 (0.0%) |
| Life, Physical & Social Science | 76 (73.8%) | 27 (26.2%) |
| Community & Social Service | 341 (39.2%) | 529 (60.8%) |
| Education, Arts & Media | 81 (65.3%) | 43 (34.7%) |
| Legal Services & Support | 10 (100.0%) | 0 (0.0%) |
| Education Instruction & Library | 243 (33.8%) | 477 (66.2%) |
| Arts, Media & Entertainment | 7 (43.8%) | 9 (56.2%) |
| Health Diagnosing & Treating | 30 (20.5%) | 116 (79.4%) |
| Health Technologists | 18 (14.0%) | 111 (86.1%) |
| Total (Category) | 784 (43.9%) | 1,001 (56.1%) |
| Total (Overall) | 2,031 (46.4%) | 2,342 (53.6%) |
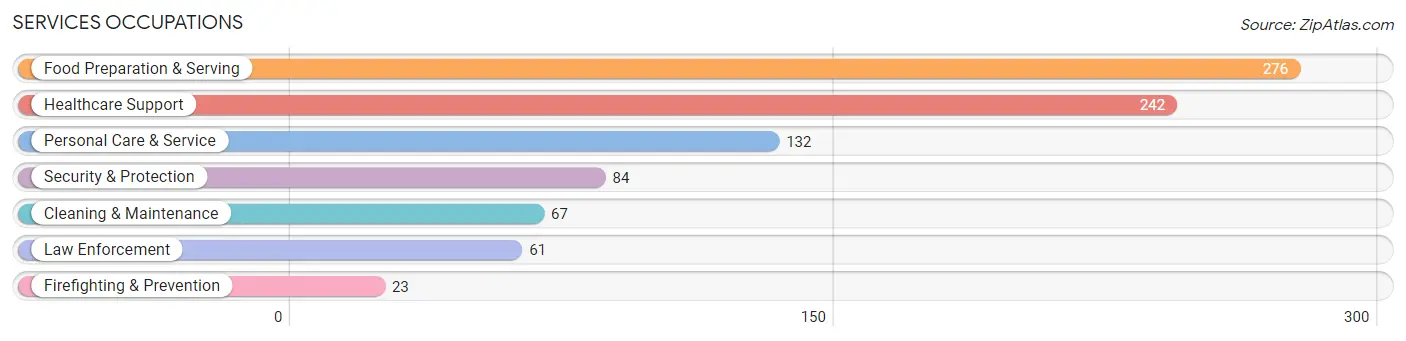
Services Occupations
The most common Services occupations in Dawes County are Food Preparation & Serving (276 | 6.3%), Healthcare Support (242 | 5.5%), Personal Care & Service (132 | 3.0%), Security & Protection (84 | 1.9%), and Cleaning & Maintenance (67 | 1.5%).
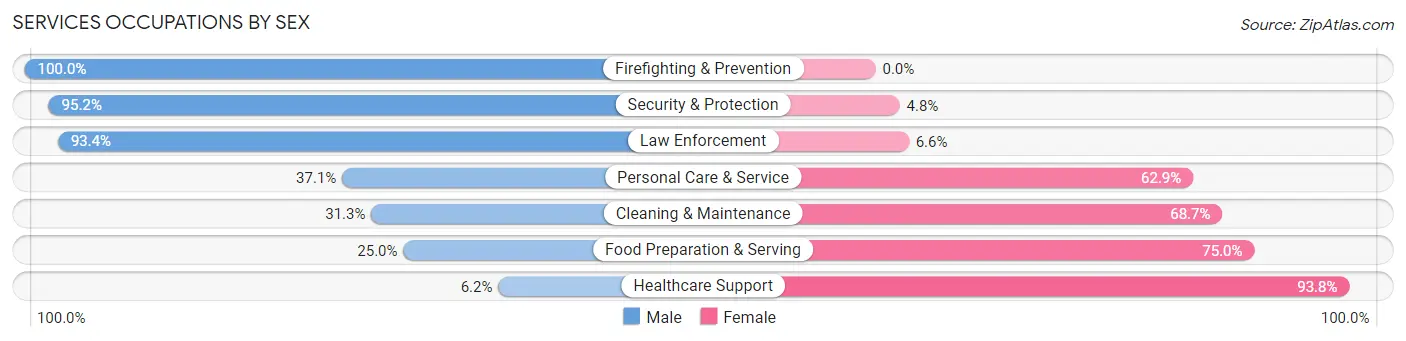
Services Occupations by Sex
Within the Services occupations in Dawes County, the most male-oriented occupations are Firefighting & Prevention (100.0%), Security & Protection (95.2%), and Law Enforcement (93.4%), while the most female-oriented occupations are Healthcare Support (93.8%), Food Preparation & Serving (75.0%), and Cleaning & Maintenance (68.7%).
| Occupation | Male | Female |
| Healthcare Support | 15 (6.2%) | 227 (93.8%) |
| Security & Protection | 80 (95.2%) | 4 (4.8%) |
| Firefighting & Prevention | 23 (100.0%) | 0 (0.0%) |
| Law Enforcement | 57 (93.4%) | 4 (6.6%) |
| Food Preparation & Serving | 69 (25.0%) | 207 (75.0%) |
| Cleaning & Maintenance | 21 (31.3%) | 46 (68.7%) |
| Personal Care & Service | 49 (37.1%) | 83 (62.9%) |
| Total (Category) | 234 (29.2%) | 567 (70.8%) |
| Total (Overall) | 2,031 (46.4%) | 2,342 (53.6%) |
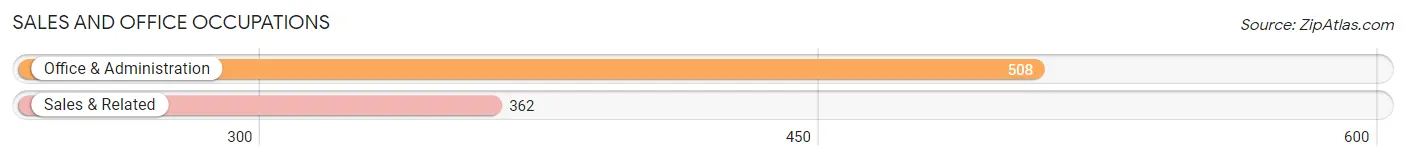
Sales and Office Occupations
The most common Sales and Office occupations in Dawes County are Office & Administration (508 | 11.6%), and Sales & Related (362 | 8.3%).
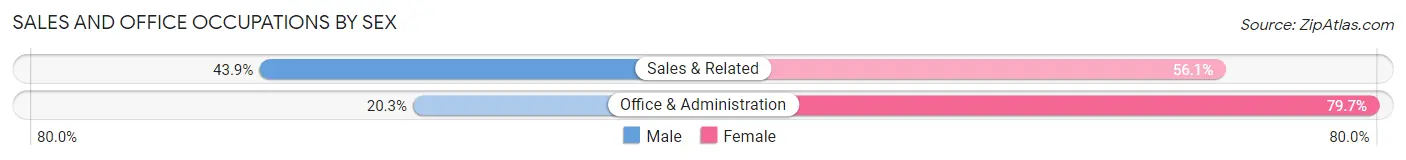
Sales and Office Occupations by Sex
| Occupation | Male | Female |
| Sales & Related | 159 (43.9%) | 203 (56.1%) |
| Office & Administration | 103 (20.3%) | 405 (79.7%) |
| Total (Category) | 262 (30.1%) | 608 (69.9%) |
| Total (Overall) | 2,031 (46.4%) | 2,342 (53.6%) |
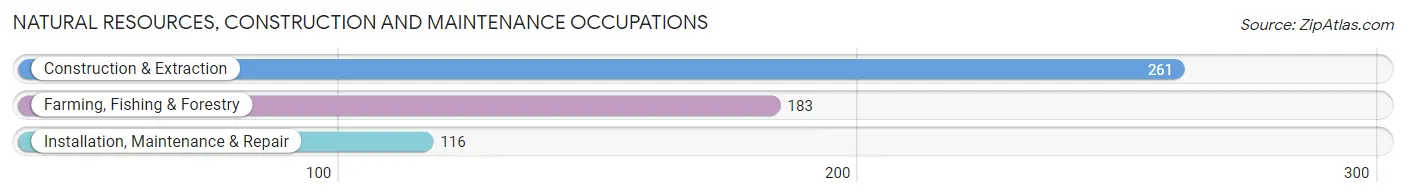
Natural Resources, Construction and Maintenance Occupations
The most common Natural Resources, Construction and Maintenance occupations in Dawes County are Construction & Extraction (261 | 6.0%), Farming, Fishing & Forestry (183 | 4.2%), and Installation, Maintenance & Repair (116 | 2.6%).
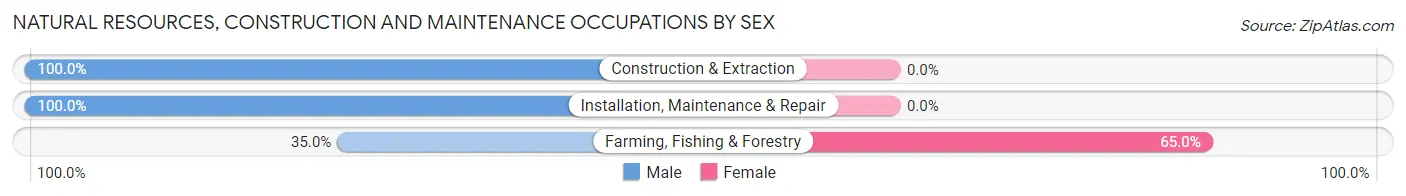
Natural Resources, Construction and Maintenance Occupations by Sex
| Occupation | Male | Female |
| Farming, Fishing & Forestry | 64 (35.0%) | 119 (65.0%) |
| Construction & Extraction | 261 (100.0%) | 0 (0.0%) |
| Installation, Maintenance & Repair | 116 (100.0%) | 0 (0.0%) |
| Total (Category) | 441 (78.7%) | 119 (21.2%) |
| Total (Overall) | 2,031 (46.4%) | 2,342 (53.6%) |
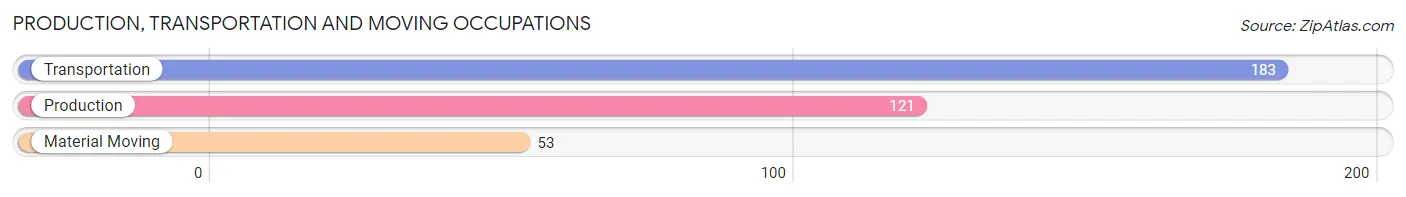
Production, Transportation and Moving Occupations
The most common Production, Transportation and Moving occupations in Dawes County are Transportation (183 | 4.2%), Production (121 | 2.8%), and Material Moving (53 | 1.2%).
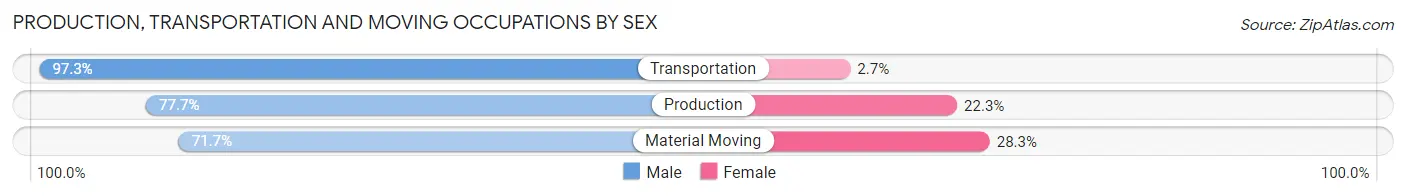
Production, Transportation and Moving Occupations by Sex
| Occupation | Male | Female |
| Production | 94 (77.7%) | 27 (22.3%) |
| Transportation | 178 (97.3%) | 5 (2.7%) |
| Material Moving | 38 (71.7%) | 15 (28.3%) |
| Total (Category) | 310 (86.8%) | 47 (13.2%) |
| Total (Overall) | 2,031 (46.4%) | 2,342 (53.6%) |
Employment Industries by Sex in Dawes County
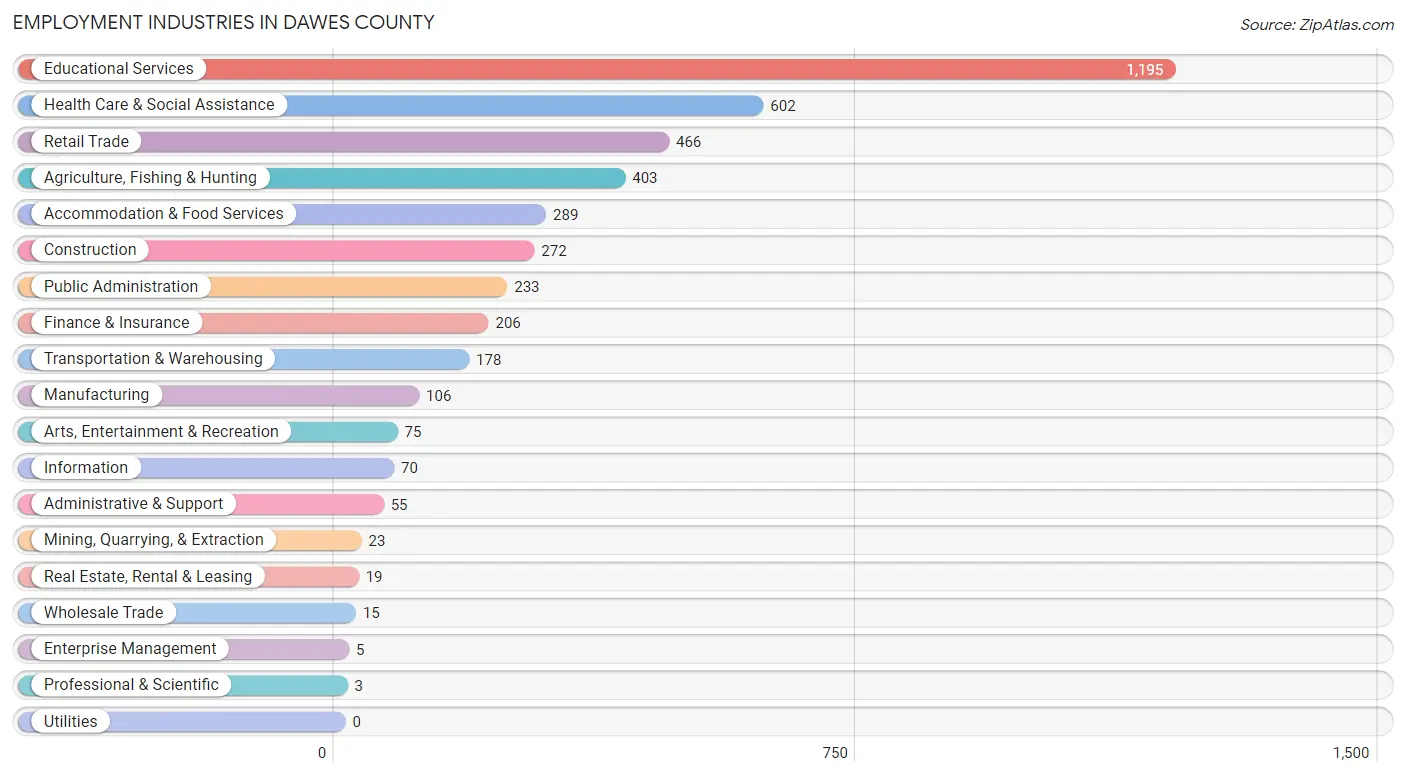
Employment Industries in Dawes County
The major employment industries in Dawes County include Educational Services (1,195 | 27.3%), Health Care & Social Assistance (602 | 13.8%), Retail Trade (466 | 10.7%), Agriculture, Fishing & Hunting (403 | 9.2%), and Accommodation & Food Services (289 | 6.6%).
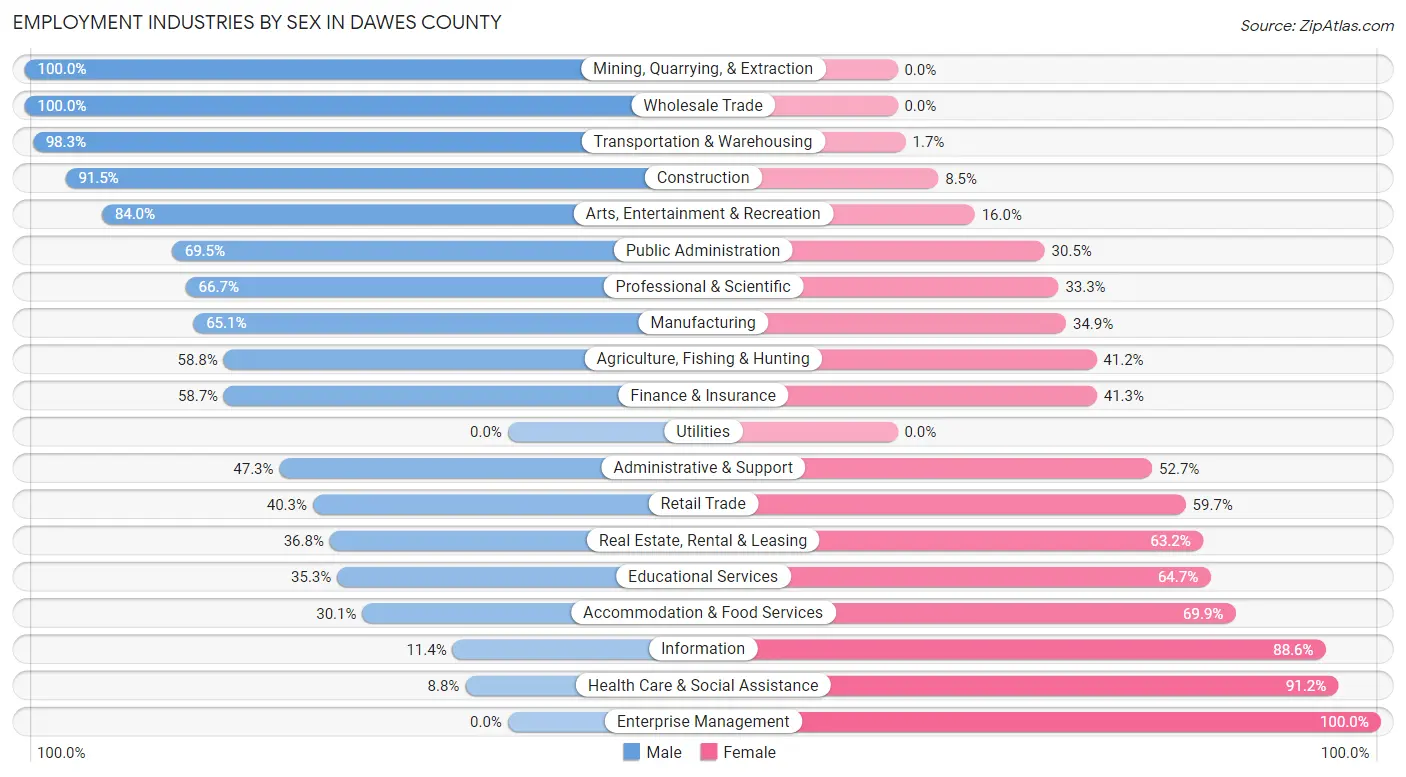
Employment Industries by Sex in Dawes County
The Dawes County industries that see more men than women are Mining, Quarrying, & Extraction (100.0%), Wholesale Trade (100.0%), and Transportation & Warehousing (98.3%), whereas the industries that tend to have a higher number of women are Enterprise Management (100.0%), Health Care & Social Assistance (91.2%), and Information (88.6%).
| Industry | Male | Female |
| Agriculture, Fishing & Hunting | 237 (58.8%) | 166 (41.2%) |
| Mining, Quarrying, & Extraction | 23 (100.0%) | 0 (0.0%) |
| Construction | 249 (91.5%) | 23 (8.5%) |
| Manufacturing | 69 (65.1%) | 37 (34.9%) |
| Wholesale Trade | 15 (100.0%) | 0 (0.0%) |
| Retail Trade | 188 (40.3%) | 278 (59.7%) |
| Transportation & Warehousing | 175 (98.3%) | 3 (1.7%) |
| Utilities | 0 (0.0%) | 0 (0.0%) |
| Information | 8 (11.4%) | 62 (88.6%) |
| Finance & Insurance | 121 (58.7%) | 85 (41.3%) |
| Real Estate, Rental & Leasing | 7 (36.8%) | 12 (63.2%) |
| Professional & Scientific | 2 (66.7%) | 1 (33.3%) |
| Enterprise Management | 0 (0.0%) | 5 (100.0%) |
| Administrative & Support | 26 (47.3%) | 29 (52.7%) |
| Educational Services | 422 (35.3%) | 773 (64.7%) |
| Health Care & Social Assistance | 53 (8.8%) | 549 (91.2%) |
| Arts, Entertainment & Recreation | 63 (84.0%) | 12 (16.0%) |
| Accommodation & Food Services | 87 (30.1%) | 202 (69.9%) |
| Public Administration | 162 (69.5%) | 71 (30.5%) |
| Total | 2,031 (46.4%) | 2,342 (53.6%) |
Education in Dawes County
School Enrollment in Dawes County
The most common levels of schooling among the 2,464 students in Dawes County are college / undergraduate (1,268 | 51.5%), elementary school (356 | 14.4%), and high school (320 | 13.0%).
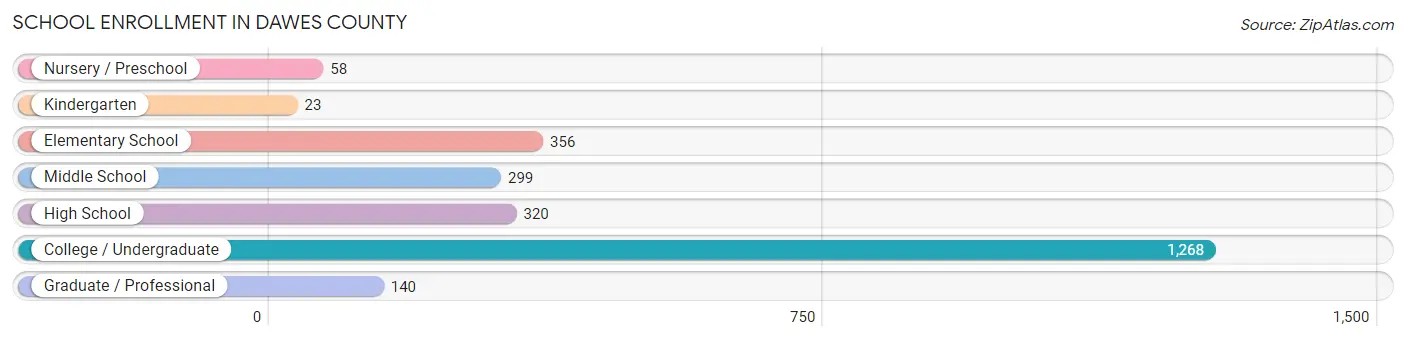
| School Level | # Students | % Students |
| Nursery / Preschool | 58 | 2.4% |
| Kindergarten | 23 | 0.9% |
| Elementary School | 356 | 14.4% |
| Middle School | 299 | 12.1% |
| High School | 320 | 13.0% |
| College / Undergraduate | 1,268 | 51.5% |
| Graduate / Professional | 140 | 5.7% |
| Total | 2,464 | 100.0% |
School Enrollment by Age by Funding Source in Dawes County
Out of a total of 2,464 students who are enrolled in schools in Dawes County, 212 (8.6%) attend a private institution, while the remaining 2,252 (91.4%) are enrolled in public schools. The age group of 3 to 4 year olds has the highest likelihood of being enrolled in private schools, with 26 (68.4% in the age bracket) enrolled. Conversely, the age group of 20 to 24 year olds has the lowest likelihood of being enrolled in a private school, with 641 (97.4% in the age bracket) attending a public institution.
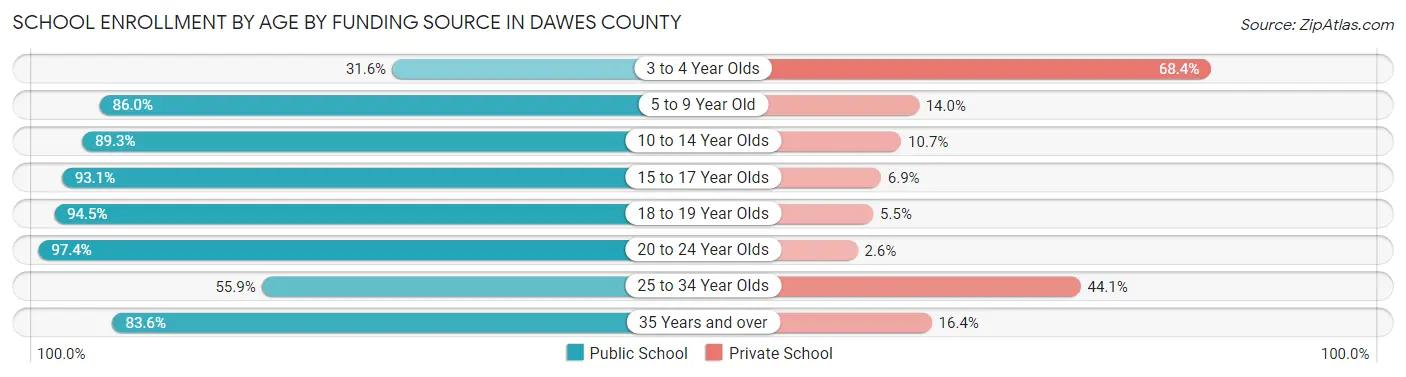
| Age Bracket | Public School | Private School |
| 3 to 4 Year Olds | 12 (31.6%) | 26 (68.4%) |
| 5 to 9 Year Old | 277 (86.0%) | 45 (14.0%) |
| 10 to 14 Year Olds | 392 (89.3%) | 47 (10.7%) |
| 15 to 17 Year Olds | 188 (93.1%) | 14 (6.9%) |
| 18 to 19 Year Olds | 671 (94.5%) | 39 (5.5%) |
| 20 to 24 Year Olds | 641 (97.4%) | 17 (2.6%) |
| 25 to 34 Year Olds | 19 (55.9%) | 15 (44.1%) |
| 35 Years and over | 51 (83.6%) | 10 (16.4%) |
| Total | 2,252 (91.4%) | 212 (8.6%) |
Educational Attainment by Field of Study in Dawes County
Education (588 | 25.2%), business (320 | 13.7%), physical & health sciences (199 | 8.5%), bio, nature & agricultural (194 | 8.3%), and science & technology (175 | 7.5%) are the most common fields of study among 2,334 individuals in Dawes County who have obtained a bachelor's degree or higher.
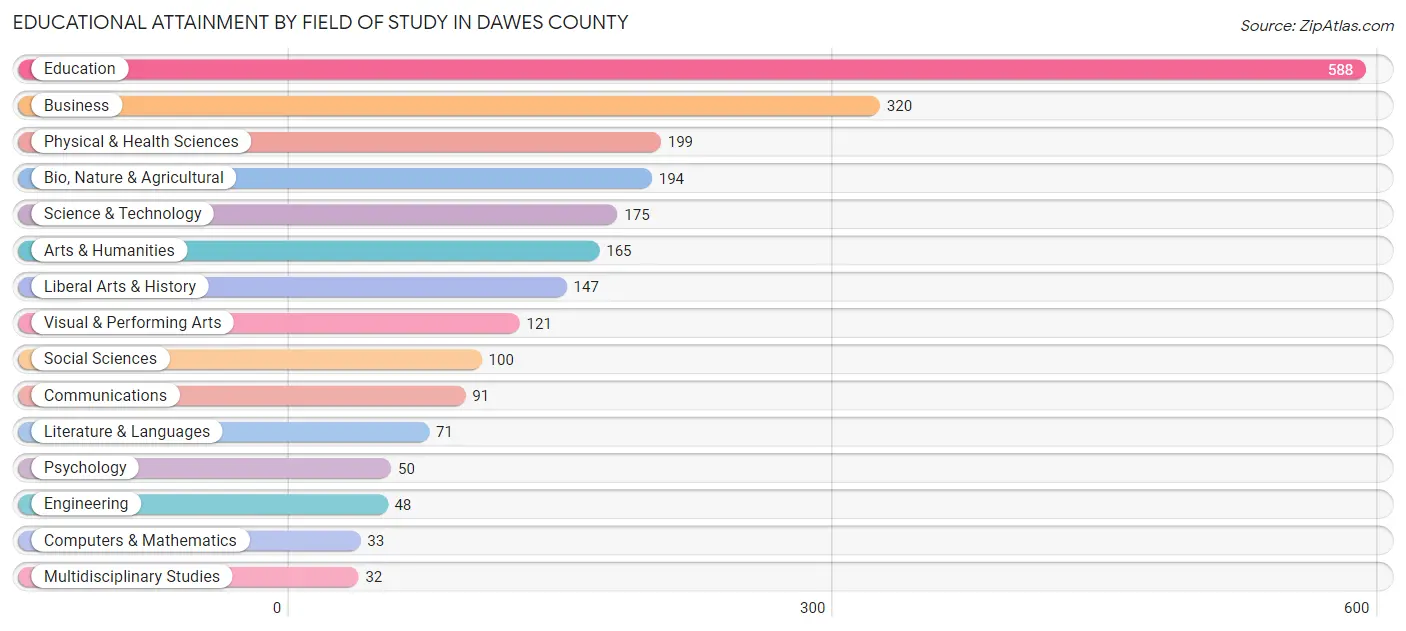
| Field of Study | # Graduates | % Graduates |
| Computers & Mathematics | 33 | 1.4% |
| Bio, Nature & Agricultural | 194 | 8.3% |
| Physical & Health Sciences | 199 | 8.5% |
| Psychology | 50 | 2.1% |
| Social Sciences | 100 | 4.3% |
| Engineering | 48 | 2.1% |
| Multidisciplinary Studies | 32 | 1.4% |
| Science & Technology | 175 | 7.5% |
| Business | 320 | 13.7% |
| Education | 588 | 25.2% |
| Literature & Languages | 71 | 3.0% |
| Liberal Arts & History | 147 | 6.3% |
| Visual & Performing Arts | 121 | 5.2% |
| Communications | 91 | 3.9% |
| Arts & Humanities | 165 | 7.1% |
| Total | 2,334 | 100.0% |
Transportation & Commute in Dawes County
Vehicle Availability by Sex in Dawes County
The most prevalent vehicle ownership categories in Dawes County are males with 2 vehicles (835, accounting for 44.3%) and females with 2 vehicles (973, making up 40.1%).
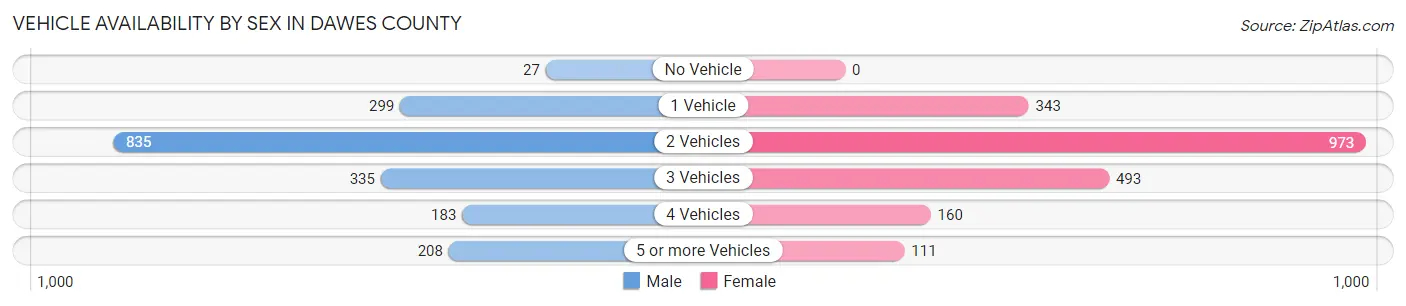
| Vehicles Available | Male | Female |
| No Vehicle | 27 (1.4%) | 0 (0.0%) |
| 1 Vehicle | 299 (15.9%) | 343 (16.5%) |
| 2 Vehicles | 835 (44.3%) | 973 (46.8%) |
| 3 Vehicles | 335 (17.7%) | 493 (23.7%) |
| 4 Vehicles | 183 (9.7%) | 160 (7.7%) |
| 5 or more Vehicles | 208 (11.0%) | 111 (5.3%) |
| Total | 1,887 (100.0%) | 2,080 (100.0%) |
Commute Time in Dawes County
The most frequently occuring commute durations in Dawes County are 5 to 9 minutes (1,292 commuters, 33.2%), less than 5 minutes (1,062 commuters, 27.3%), and 10 to 14 minutes (614 commuters, 15.8%).
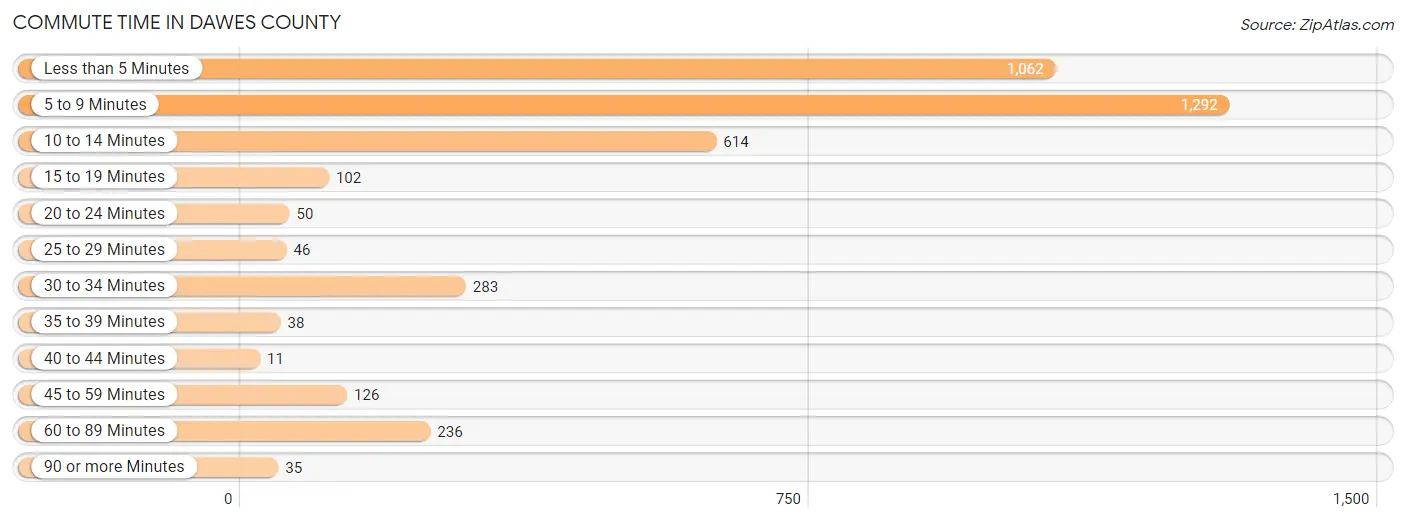
| Commute Time | # Commuters | % Commuters |
| Less than 5 Minutes | 1,062 | 27.3% |
| 5 to 9 Minutes | 1,292 | 33.2% |
| 10 to 14 Minutes | 614 | 15.8% |
| 15 to 19 Minutes | 102 | 2.6% |
| 20 to 24 Minutes | 50 | 1.3% |
| 25 to 29 Minutes | 46 | 1.2% |
| 30 to 34 Minutes | 283 | 7.3% |
| 35 to 39 Minutes | 38 | 1.0% |
| 40 to 44 Minutes | 11 | 0.3% |
| 45 to 59 Minutes | 126 | 3.2% |
| 60 to 89 Minutes | 236 | 6.1% |
| 90 or more Minutes | 35 | 0.9% |
Commute Time by Sex in Dawes County
The most common commute times in Dawes County are 5 to 9 minutes (632 commuters, 34.0%) for males and 5 to 9 minutes (660 commuters, 32.5%) for females.
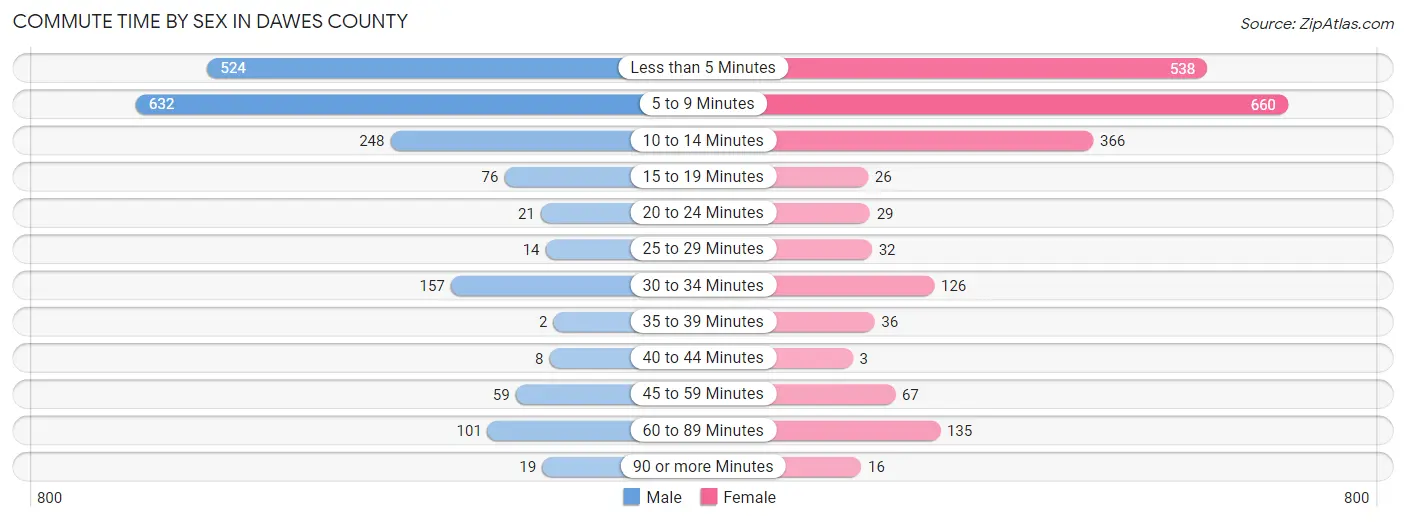
| Commute Time | Male | Female |
| Less than 5 Minutes | 524 (28.2%) | 538 (26.5%) |
| 5 to 9 Minutes | 632 (34.0%) | 660 (32.5%) |
| 10 to 14 Minutes | 248 (13.3%) | 366 (18.0%) |
| 15 to 19 Minutes | 76 (4.1%) | 26 (1.3%) |
| 20 to 24 Minutes | 21 (1.1%) | 29 (1.4%) |
| 25 to 29 Minutes | 14 (0.7%) | 32 (1.6%) |
| 30 to 34 Minutes | 157 (8.4%) | 126 (6.2%) |
| 35 to 39 Minutes | 2 (0.1%) | 36 (1.8%) |
| 40 to 44 Minutes | 8 (0.4%) | 3 (0.2%) |
| 45 to 59 Minutes | 59 (3.2%) | 67 (3.3%) |
| 60 to 89 Minutes | 101 (5.4%) | 135 (6.6%) |
| 90 or more Minutes | 19 (1.0%) | 16 (0.8%) |
Time of Departure to Work by Sex in Dawes County
The most frequent times of departure to work in Dawes County are 7:30 AM to 7:59 AM (320, 17.2%) for males and 7:00 AM to 7:29 AM (436, 21.4%) for females.
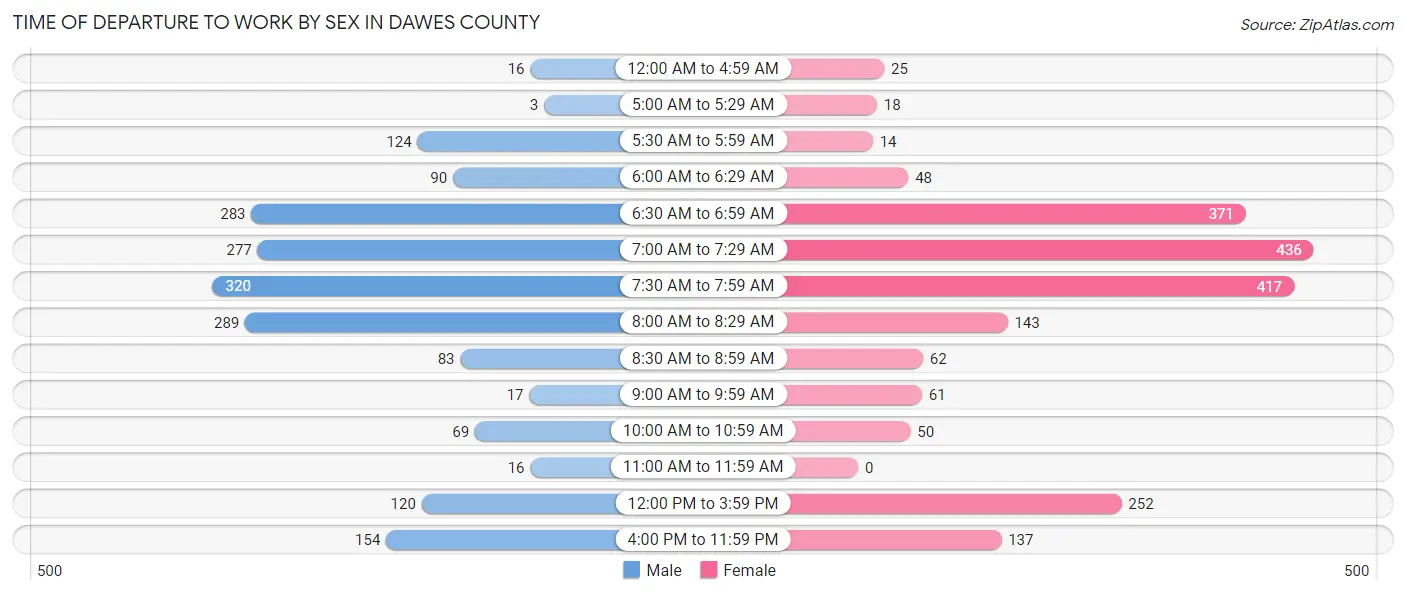
| Time of Departure | Male | Female |
| 12:00 AM to 4:59 AM | 16 (0.9%) | 25 (1.2%) |
| 5:00 AM to 5:29 AM | 3 (0.2%) | 18 (0.9%) |
| 5:30 AM to 5:59 AM | 124 (6.7%) | 14 (0.7%) |
| 6:00 AM to 6:29 AM | 90 (4.8%) | 48 (2.4%) |
| 6:30 AM to 6:59 AM | 283 (15.2%) | 371 (18.2%) |
| 7:00 AM to 7:29 AM | 277 (14.9%) | 436 (21.4%) |
| 7:30 AM to 7:59 AM | 320 (17.2%) | 417 (20.5%) |
| 8:00 AM to 8:29 AM | 289 (15.5%) | 143 (7.0%) |
| 8:30 AM to 8:59 AM | 83 (4.5%) | 62 (3.0%) |
| 9:00 AM to 9:59 AM | 17 (0.9%) | 61 (3.0%) |
| 10:00 AM to 10:59 AM | 69 (3.7%) | 50 (2.5%) |
| 11:00 AM to 11:59 AM | 16 (0.9%) | 0 (0.0%) |
| 12:00 PM to 3:59 PM | 120 (6.5%) | 252 (12.4%) |
| 4:00 PM to 11:59 PM | 154 (8.3%) | 137 (6.7%) |
| Total | 1,861 (100.0%) | 2,034 (100.0%) |
Housing Occupancy in Dawes County
Occupancy by Ownership in Dawes County
Of the total 3,484 dwellings in Dawes County, owner-occupied units account for 2,202 (63.2%), while renter-occupied units make up 1,282 (36.8%).
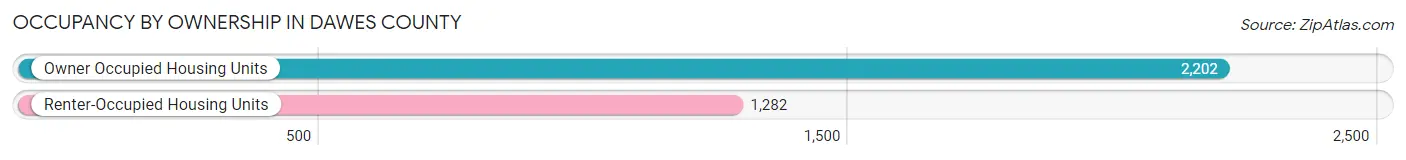
| Occupancy | # Housing Units | % Housing Units |
| Owner Occupied Housing Units | 2,202 | 63.2% |
| Renter-Occupied Housing Units | 1,282 | 36.8% |
| Total Occupied Housing Units | 3,484 | 100.0% |
Occupancy by Household Size in Dawes County
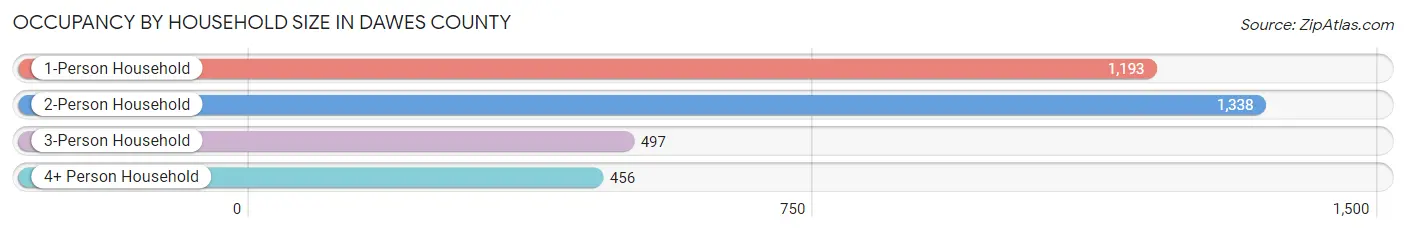
| Household Size | # Housing Units | % Housing Units |
| 1-Person Household | 1,193 | 34.2% |
| 2-Person Household | 1,338 | 38.4% |
| 3-Person Household | 497 | 14.3% |
| 4+ Person Household | 456 | 13.1% |
| Total Housing Units | 3,484 | 100.0% |
Occupancy by Ownership by Household Size in Dawes County
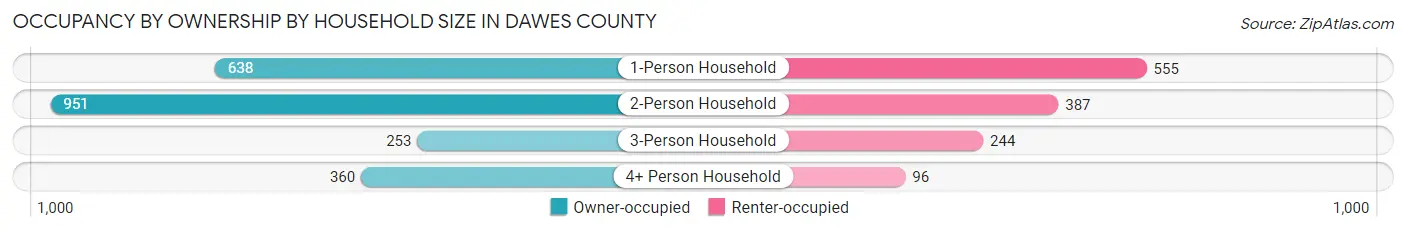
| Household Size | Owner-occupied | Renter-occupied |
| 1-Person Household | 638 (53.5%) | 555 (46.5%) |
| 2-Person Household | 951 (71.1%) | 387 (28.9%) |
| 3-Person Household | 253 (50.9%) | 244 (49.1%) |
| 4+ Person Household | 360 (78.9%) | 96 (21.0%) |
| Total Housing Units | 2,202 (63.2%) | 1,282 (36.8%) |
Occupancy by Educational Attainment in Dawes County
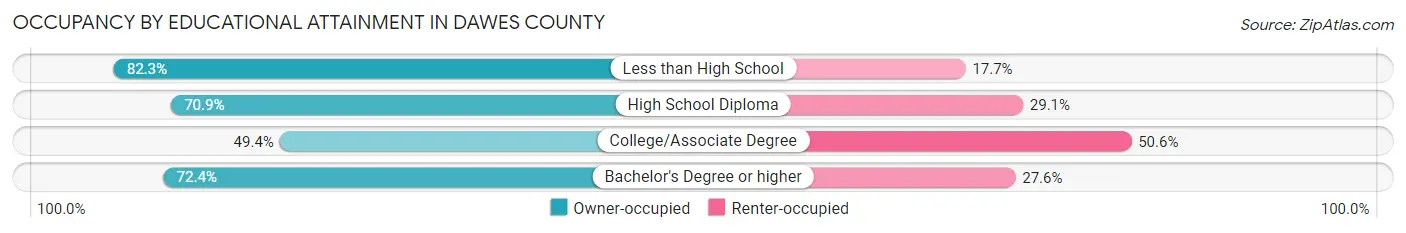
| Household Size | Owner-occupied | Renter-occupied |
| Less than High School | 93 (82.3%) | 20 (17.7%) |
| High School Diploma | 534 (70.9%) | 219 (29.1%) |
| College/Associate Degree | 690 (49.4%) | 706 (50.6%) |
| Bachelor's Degree or higher | 885 (72.4%) | 337 (27.6%) |
Occupancy by Age of Householder in Dawes County
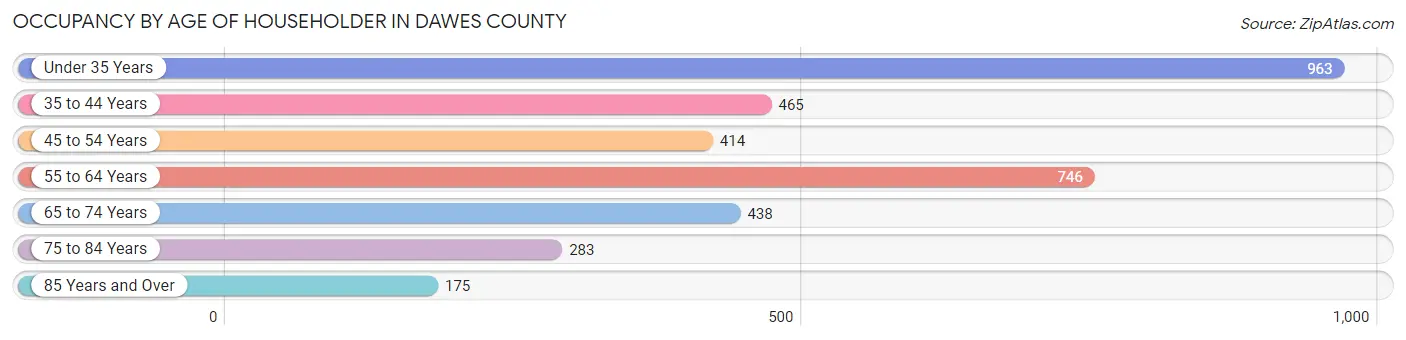
| Age Bracket | # Households | % Households |
| Under 35 Years | 963 | 27.6% |
| 35 to 44 Years | 465 | 13.4% |
| 45 to 54 Years | 414 | 11.9% |
| 55 to 64 Years | 746 | 21.4% |
| 65 to 74 Years | 438 | 12.6% |
| 75 to 84 Years | 283 | 8.1% |
| 85 Years and Over | 175 | 5.0% |
| Total | 3,484 | 100.0% |
Housing Finances in Dawes County
Median Income by Occupancy in Dawes County
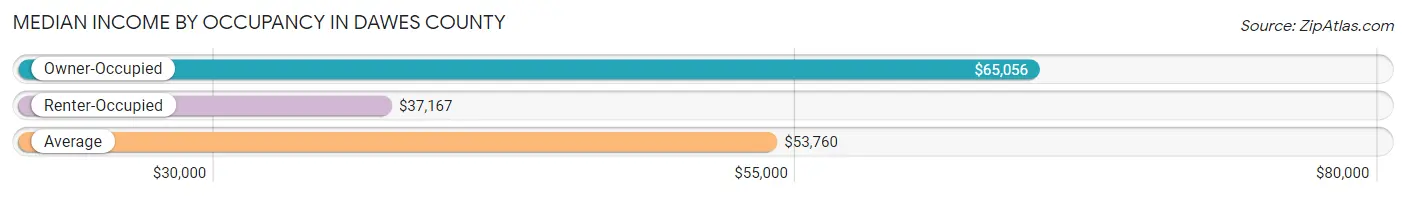
| Occupancy Type | # Households | Median Income |
| Owner-Occupied | 2,202 (63.2%) | $65,056 |
| Renter-Occupied | 1,282 (36.8%) | $37,167 |
| Average | 3,484 (100.0%) | $53,760 |
Occupancy by Householder Income Bracket in Dawes County
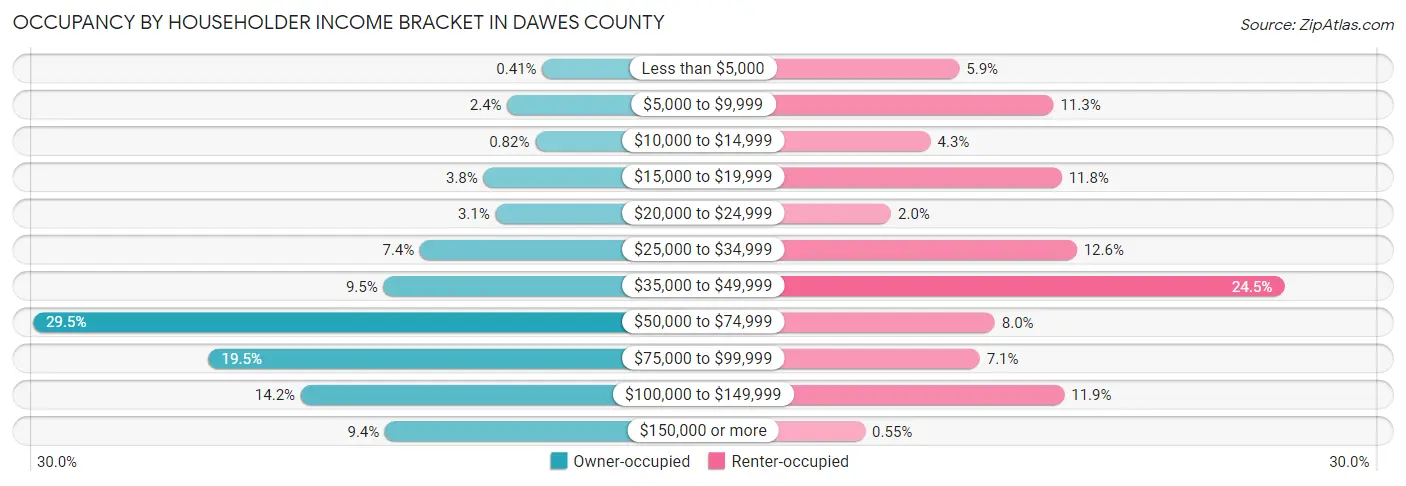
| Income Bracket | Owner-occupied | Renter-occupied |
| Less than $5,000 | 9 (0.4%) | 76 (5.9%) |
| $5,000 to $9,999 | 53 (2.4%) | 145 (11.3%) |
| $10,000 to $14,999 | 18 (0.8%) | 55 (4.3%) |
| $15,000 to $19,999 | 83 (3.8%) | 151 (11.8%) |
| $20,000 to $24,999 | 68 (3.1%) | 26 (2.0%) |
| $25,000 to $34,999 | 163 (7.4%) | 162 (12.6%) |
| $35,000 to $49,999 | 209 (9.5%) | 314 (24.5%) |
| $50,000 to $74,999 | 650 (29.5%) | 102 (8.0%) |
| $75,000 to $99,999 | 429 (19.5%) | 91 (7.1%) |
| $100,000 to $149,999 | 313 (14.2%) | 153 (11.9%) |
| $150,000 or more | 207 (9.4%) | 7 (0.5%) |
| Total | 2,202 (100.0%) | 1,282 (100.0%) |
Monthly Housing Cost Tiers in Dawes County
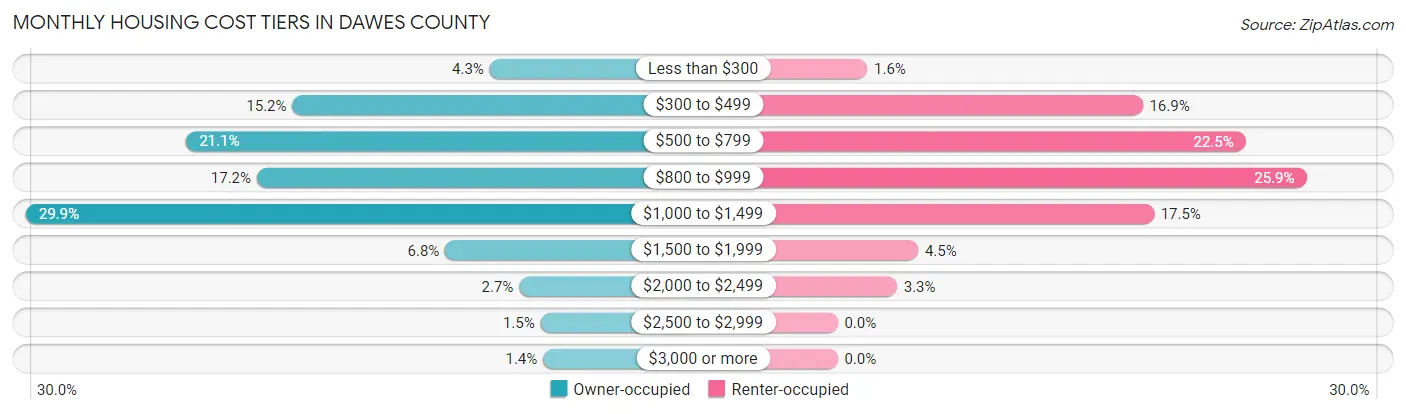
| Monthly Cost | Owner-occupied | Renter-occupied |
| Less than $300 | 95 (4.3%) | 21 (1.6%) |
| $300 to $499 | 335 (15.2%) | 216 (16.9%) |
| $500 to $799 | 464 (21.1%) | 289 (22.5%) |
| $800 to $999 | 378 (17.2%) | 332 (25.9%) |
| $1,000 to $1,499 | 659 (29.9%) | 224 (17.5%) |
| $1,500 to $1,999 | 149 (6.8%) | 57 (4.4%) |
| $2,000 to $2,499 | 59 (2.7%) | 42 (3.3%) |
| $2,500 to $2,999 | 33 (1.5%) | 0 (0.0%) |
| $3,000 or more | 30 (1.4%) | 0 (0.0%) |
| Total | 2,202 (100.0%) | 1,282 (100.0%) |
Physical Housing Characteristics in Dawes County
Housing Structures in Dawes County
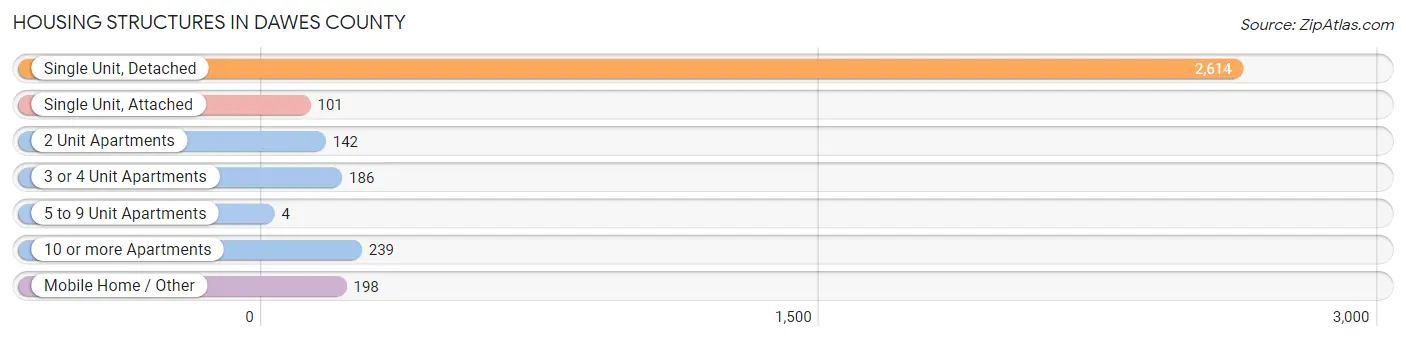
| Structure Type | # Housing Units | % Housing Units |
| Single Unit, Detached | 2,614 | 75.0% |
| Single Unit, Attached | 101 | 2.9% |
| 2 Unit Apartments | 142 | 4.1% |
| 3 or 4 Unit Apartments | 186 | 5.3% |
| 5 to 9 Unit Apartments | 4 | 0.1% |
| 10 or more Apartments | 239 | 6.9% |
| Mobile Home / Other | 198 | 5.7% |
| Total | 3,484 | 100.0% |
Housing Structures by Occupancy in Dawes County
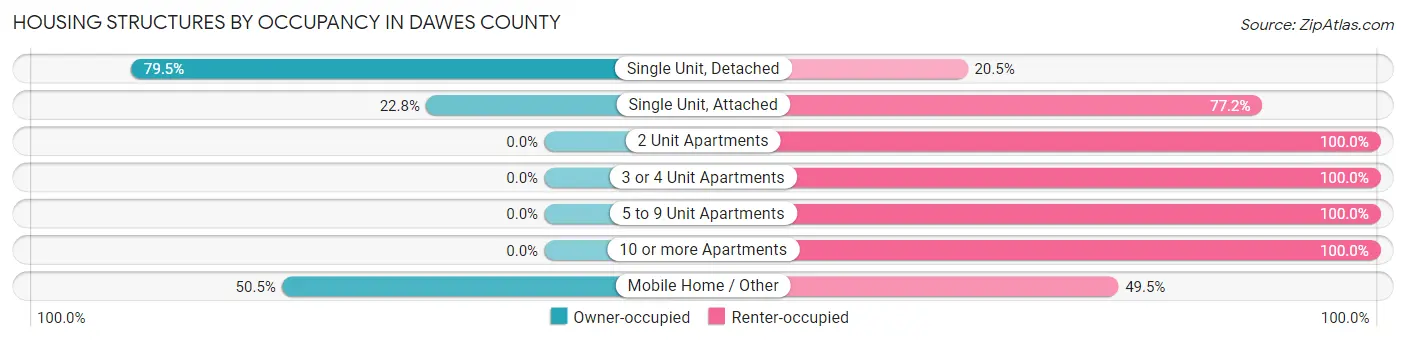
| Structure Type | Owner-occupied | Renter-occupied |
| Single Unit, Detached | 2,079 (79.5%) | 535 (20.5%) |
| Single Unit, Attached | 23 (22.8%) | 78 (77.2%) |
| 2 Unit Apartments | 0 (0.0%) | 142 (100.0%) |
| 3 or 4 Unit Apartments | 0 (0.0%) | 186 (100.0%) |
| 5 to 9 Unit Apartments | 0 (0.0%) | 4 (100.0%) |
| 10 or more Apartments | 0 (0.0%) | 239 (100.0%) |
| Mobile Home / Other | 100 (50.5%) | 98 (49.5%) |
| Total | 2,202 (63.2%) | 1,282 (36.8%) |
Housing Structures by Number of Rooms in Dawes County
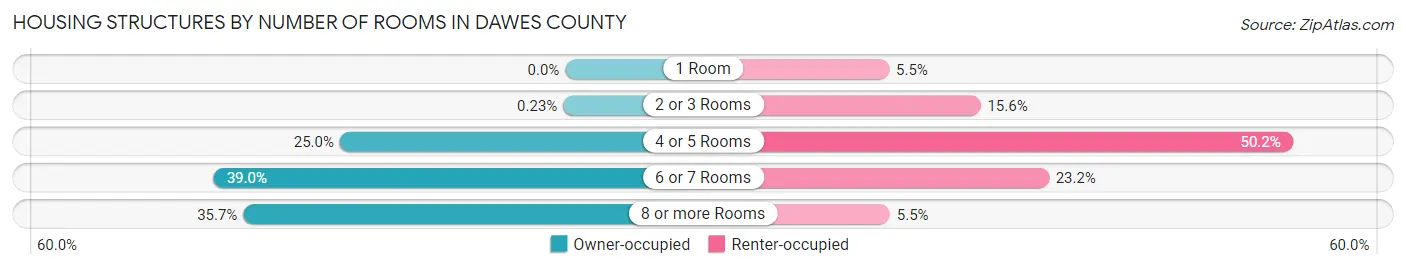
| Number of Rooms | Owner-occupied | Renter-occupied |
| 1 Room | 0 (0.0%) | 70 (5.5%) |
| 2 or 3 Rooms | 5 (0.2%) | 200 (15.6%) |
| 4 or 5 Rooms | 551 (25.0%) | 644 (50.2%) |
| 6 or 7 Rooms | 859 (39.0%) | 297 (23.2%) |
| 8 or more Rooms | 787 (35.7%) | 71 (5.5%) |
| Total | 2,202 (100.0%) | 1,282 (100.0%) |
Housing Structure by Heating Type in Dawes County
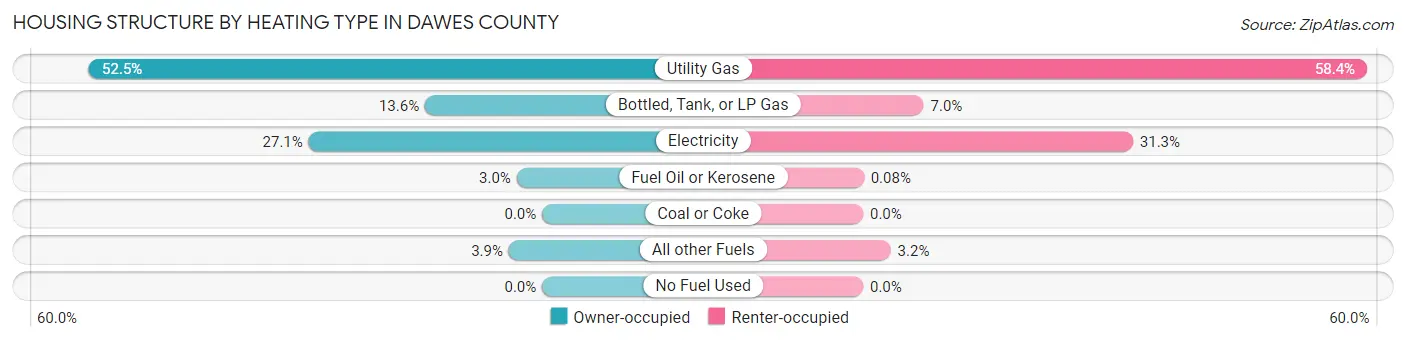
| Heating Type | Owner-occupied | Renter-occupied |
| Utility Gas | 1,157 (52.5%) | 749 (58.4%) |
| Bottled, Tank, or LP Gas | 299 (13.6%) | 90 (7.0%) |
| Electricity | 596 (27.1%) | 401 (31.3%) |
| Fuel Oil or Kerosene | 65 (2.9%) | 1 (0.1%) |
| Coal or Coke | 0 (0.0%) | 0 (0.0%) |
| All other Fuels | 85 (3.9%) | 41 (3.2%) |
| No Fuel Used | 0 (0.0%) | 0 (0.0%) |
| Total | 2,202 (100.0%) | 1,282 (100.0%) |
Household Vehicle Usage in Dawes County
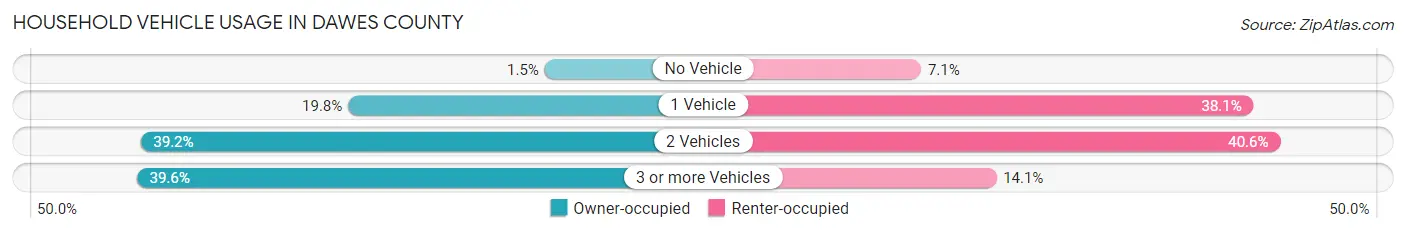
| Vehicles per Household | Owner-occupied | Renter-occupied |
| No Vehicle | 32 (1.5%) | 91 (7.1%) |
| 1 Vehicle | 436 (19.8%) | 489 (38.1%) |
| 2 Vehicles | 863 (39.2%) | 521 (40.6%) |
| 3 or more Vehicles | 871 (39.6%) | 181 (14.1%) |
| Total | 2,202 (100.0%) | 1,282 (100.0%) |
Real Estate & Mortgages in Dawes County
Real Estate and Mortgage Overview in Dawes County
| Characteristic | Without Mortgage | With Mortgage |
| Housing Units | 1,039 | 1,163 |
| Median Property Value | $127,500 | $149,200 |
| Median Household Income | $53,819 | $152 |
| Monthly Housing Costs | $560 | $30 |
| Real Estate Taxes | $1,993 | $20 |
Property Value by Mortgage Status in Dawes County
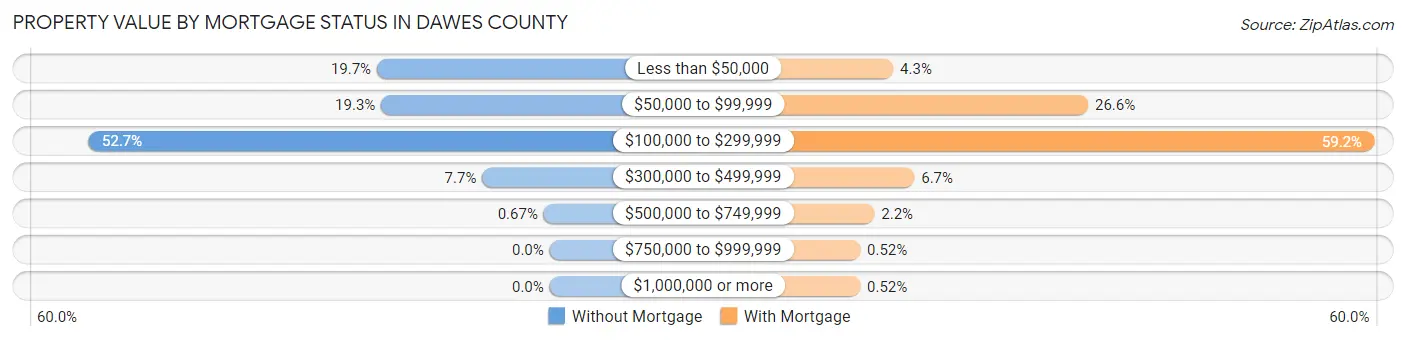
| Property Value | Without Mortgage | With Mortgage |
| Less than $50,000 | 205 (19.7%) | 50 (4.3%) |
| $50,000 to $99,999 | 200 (19.3%) | 309 (26.6%) |
| $100,000 to $299,999 | 547 (52.6%) | 689 (59.2%) |
| $300,000 to $499,999 | 80 (7.7%) | 78 (6.7%) |
| $500,000 to $749,999 | 7 (0.7%) | 25 (2.1%) |
| $750,000 to $999,999 | 0 (0.0%) | 6 (0.5%) |
| $1,000,000 or more | 0 (0.0%) | 6 (0.5%) |
| Total | 1,039 (100.0%) | 1,163 (100.0%) |
Household Income by Mortgage Status in Dawes County
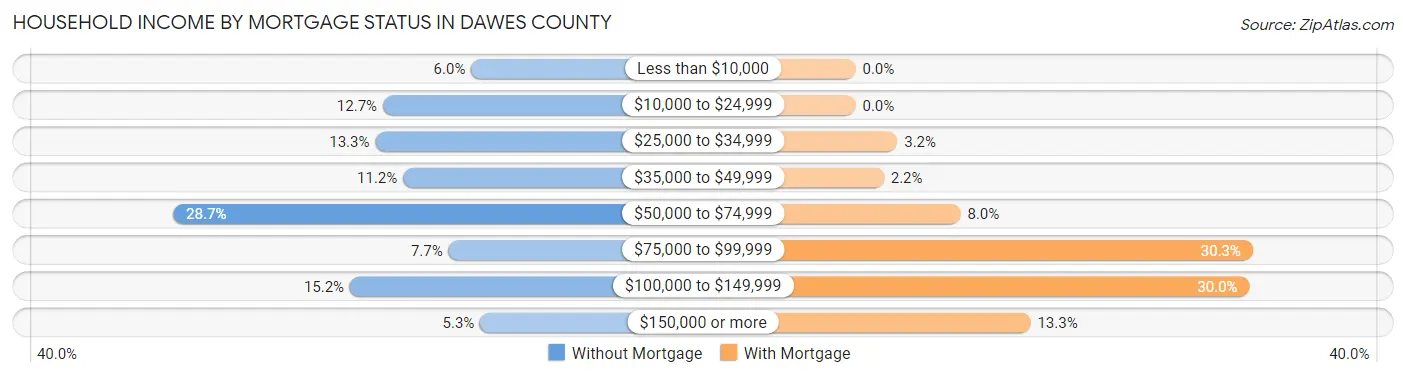
| Household Income | Without Mortgage | With Mortgage |
| Less than $10,000 | 62 (6.0%) | 0 (0.0%) |
| $10,000 to $24,999 | 132 (12.7%) | 0 (0.0%) |
| $25,000 to $34,999 | 138 (13.3%) | 37 (3.2%) |
| $35,000 to $49,999 | 116 (11.2%) | 25 (2.1%) |
| $50,000 to $74,999 | 298 (28.7%) | 93 (8.0%) |
| $75,000 to $99,999 | 80 (7.7%) | 352 (30.3%) |
| $100,000 to $149,999 | 158 (15.2%) | 349 (30.0%) |
| $150,000 or more | 55 (5.3%) | 155 (13.3%) |
| Total | 1,039 (100.0%) | 1,163 (100.0%) |
Property Value to Household Income Ratio in Dawes County
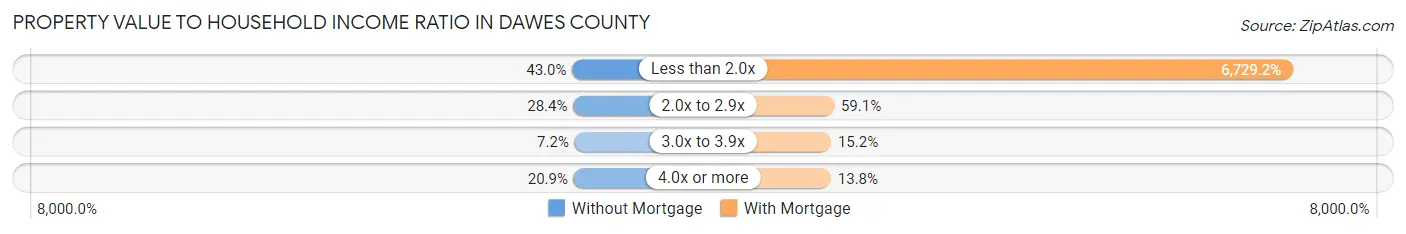
| Value-to-Income Ratio | Without Mortgage | With Mortgage |
| Less than 2.0x | 447 (43.0%) | 78,260 (6,729.1%) |
| 2.0x to 2.9x | 295 (28.4%) | 687 (59.1%) |
| 3.0x to 3.9x | 75 (7.2%) | 177 (15.2%) |
| 4.0x or more | 217 (20.9%) | 161 (13.8%) |
| Total | 1,039 (100.0%) | 1,163 (100.0%) |
Real Estate Taxes by Mortgage Status in Dawes County
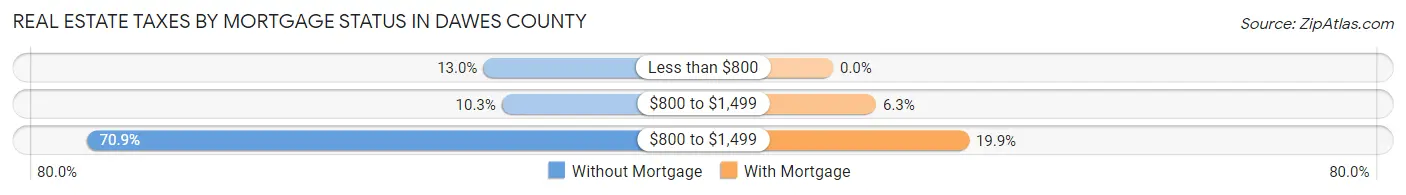
| Property Taxes | Without Mortgage | With Mortgage |
| Less than $800 | 135 (13.0%) | 0 (0.0%) |
| $800 to $1,499 | 107 (10.3%) | 73 (6.3%) |
| $800 to $1,499 | 737 (70.9%) | 231 (19.9%) |
| Total | 1,039 (100.0%) | 1,163 (100.0%) |
Health & Disability in Dawes County
Health Insurance Coverage by Age in Dawes County
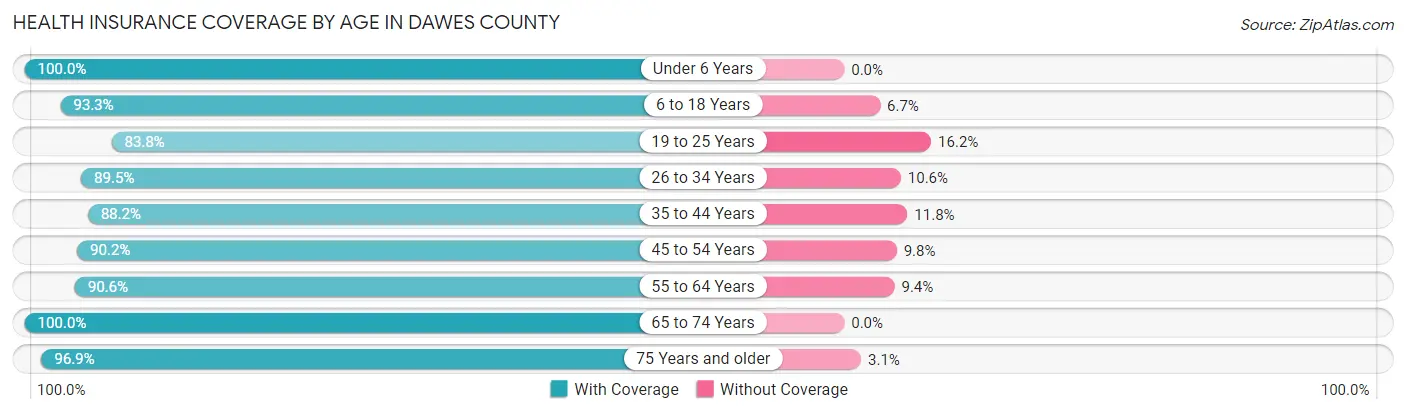
| Age Bracket | With Coverage | Without Coverage |
| Under 6 Years | 532 (100.0%) | 0 (0.0%) |
| 6 to 18 Years | 1,148 (93.3%) | 82 (6.7%) |
| 19 to 25 Years | 1,278 (83.8%) | 247 (16.2%) |
| 26 to 34 Years | 721 (89.4%) | 85 (10.5%) |
| 35 to 44 Years | 712 (88.2%) | 95 (11.8%) |
| 45 to 54 Years | 683 (90.2%) | 74 (9.8%) |
| 55 to 64 Years | 938 (90.6%) | 97 (9.4%) |
| 65 to 74 Years | 814 (100.0%) | 0 (0.0%) |
| 75 Years and older | 680 (96.9%) | 22 (3.1%) |
| Total | 7,506 (91.4%) | 702 (8.6%) |
Health Insurance Coverage by Citizenship Status in Dawes County
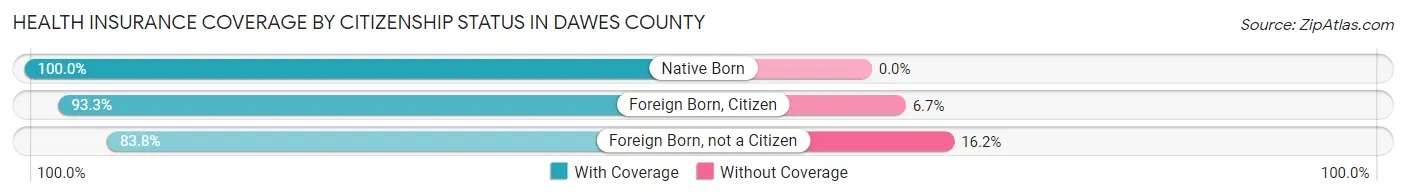
| Citizenship Status | With Coverage | Without Coverage |
| Native Born | 532 (100.0%) | 0 (0.0%) |
| Foreign Born, Citizen | 1,148 (93.3%) | 82 (6.7%) |
| Foreign Born, not a Citizen | 1,278 (83.8%) | 247 (16.2%) |
Health Insurance Coverage by Household Income in Dawes County
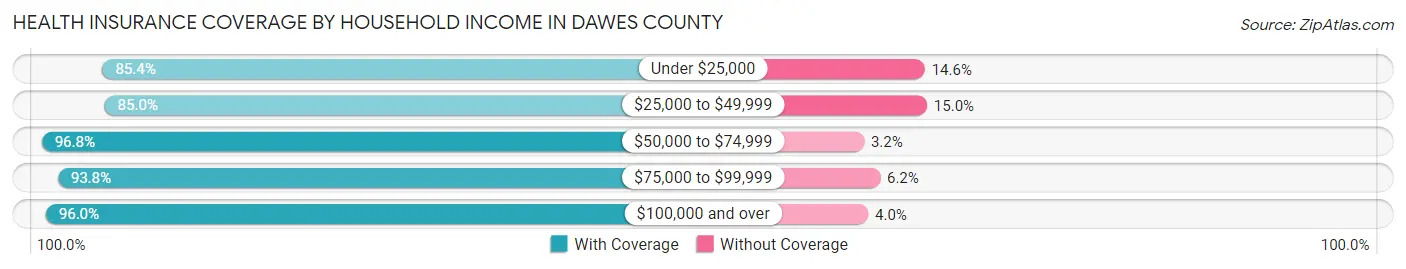
| Household Income | With Coverage | Without Coverage |
| Under $25,000 | 807 (85.4%) | 138 (14.6%) |
| $25,000 to $49,999 | 1,359 (85.0%) | 240 (15.0%) |
| $50,000 to $74,999 | 1,654 (96.8%) | 55 (3.2%) |
| $75,000 to $99,999 | 1,219 (93.8%) | 81 (6.2%) |
| $100,000 and over | 1,782 (96.0%) | 74 (4.0%) |
Public vs Private Health Insurance Coverage by Age in Dawes County
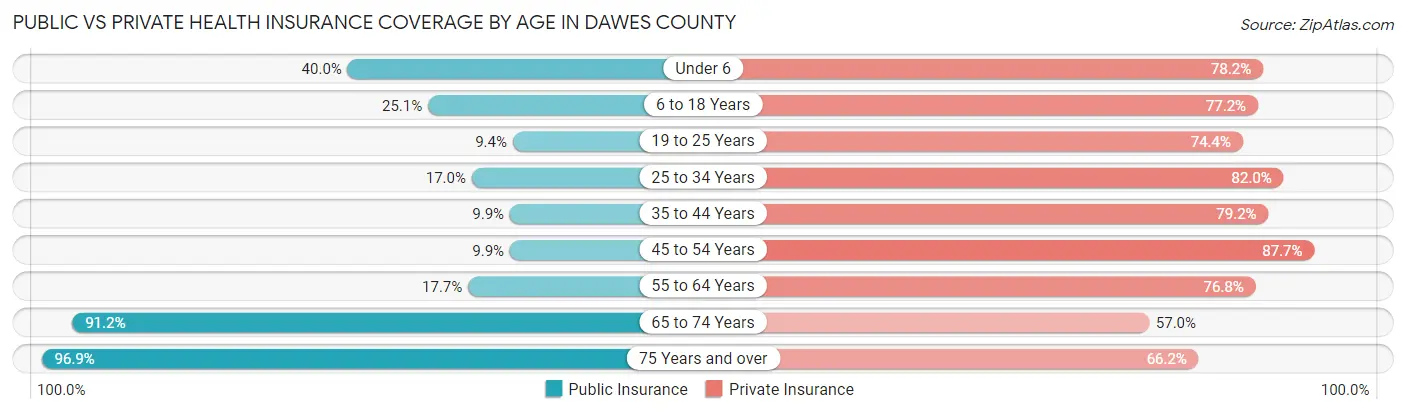
| Age Bracket | Public Insurance | Private Insurance |
| Under 6 | 213 (40.0%) | 416 (78.2%) |
| 6 to 18 Years | 309 (25.1%) | 950 (77.2%) |
| 19 to 25 Years | 143 (9.4%) | 1,135 (74.4%) |
| 25 to 34 Years | 137 (17.0%) | 661 (82.0%) |
| 35 to 44 Years | 80 (9.9%) | 639 (79.2%) |
| 45 to 54 Years | 75 (9.9%) | 664 (87.7%) |
| 55 to 64 Years | 183 (17.7%) | 795 (76.8%) |
| 65 to 74 Years | 742 (91.1%) | 464 (57.0%) |
| 75 Years and over | 680 (96.9%) | 465 (66.2%) |
| Total | 2,562 (31.2%) | 6,189 (75.4%) |
Disability Status by Sex by Age in Dawes County
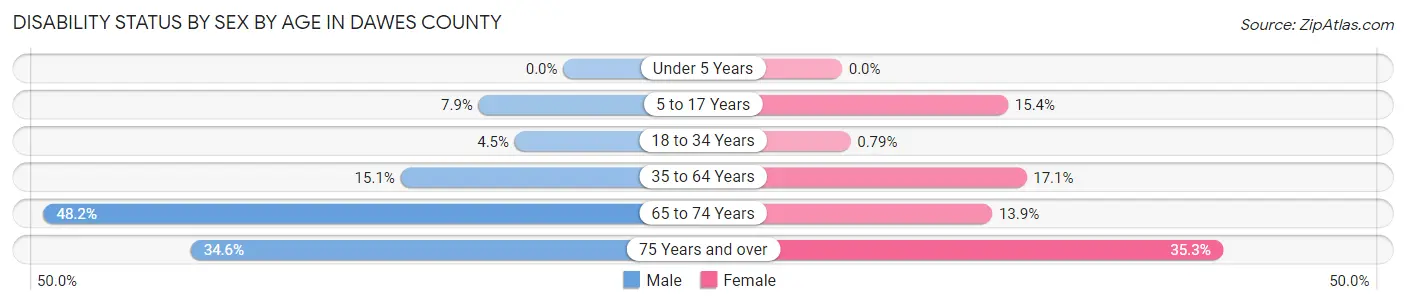
| Age Bracket | Male | Female |
| Under 5 Years | 0 (0.0%) | 0 (0.0%) |
| 5 to 17 Years | 39 (7.9%) | 86 (15.4%) |
| 18 to 34 Years | 49 (4.5%) | 12 (0.8%) |
| 35 to 64 Years | 209 (15.1%) | 208 (17.1%) |
| 65 to 74 Years | 192 (48.2%) | 58 (13.9%) |
| 75 Years and over | 93 (34.6%) | 153 (35.3%) |
Disability Class by Sex by Age in Dawes County
Disability Class: Hearing Difficulty
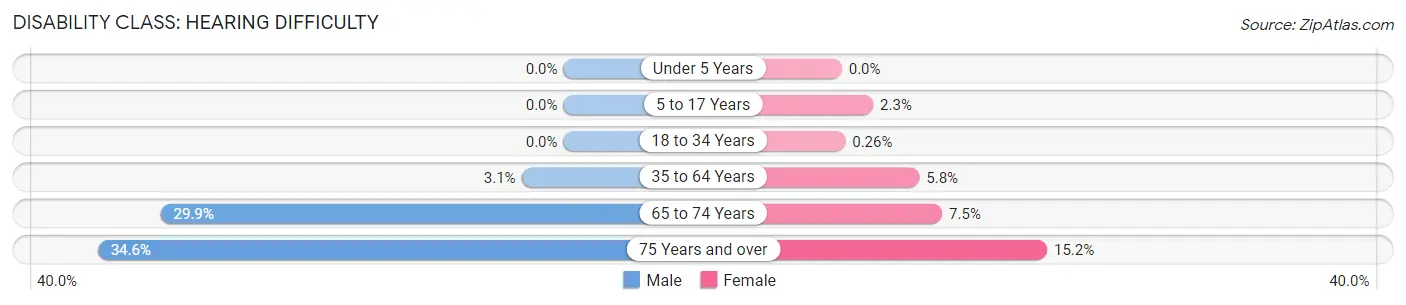
| Age Bracket | Male | Female |
| Under 5 Years | 0 (0.0%) | 0 (0.0%) |
| 5 to 17 Years | 0 (0.0%) | 13 (2.3%) |
| 18 to 34 Years | 0 (0.0%) | 4 (0.3%) |
| 35 to 64 Years | 43 (3.1%) | 70 (5.8%) |
| 65 to 74 Years | 119 (29.9%) | 31 (7.4%) |
| 75 Years and over | 93 (34.6%) | 66 (15.2%) |
Disability Class: Vision Difficulty
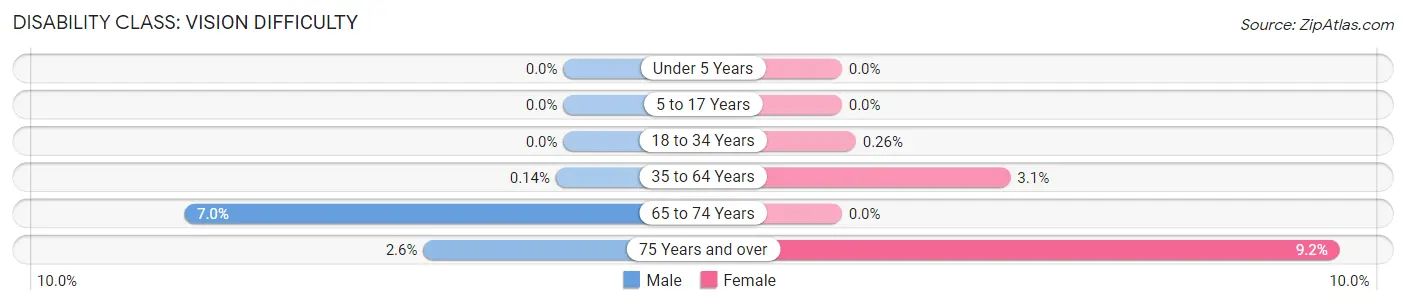
| Age Bracket | Male | Female |
| Under 5 Years | 0 (0.0%) | 0 (0.0%) |
| 5 to 17 Years | 0 (0.0%) | 0 (0.0%) |
| 18 to 34 Years | 0 (0.0%) | 4 (0.3%) |
| 35 to 64 Years | 2 (0.1%) | 38 (3.1%) |
| 65 to 74 Years | 28 (7.0%) | 0 (0.0%) |
| 75 Years and over | 7 (2.6%) | 40 (9.2%) |
Disability Class: Cognitive Difficulty
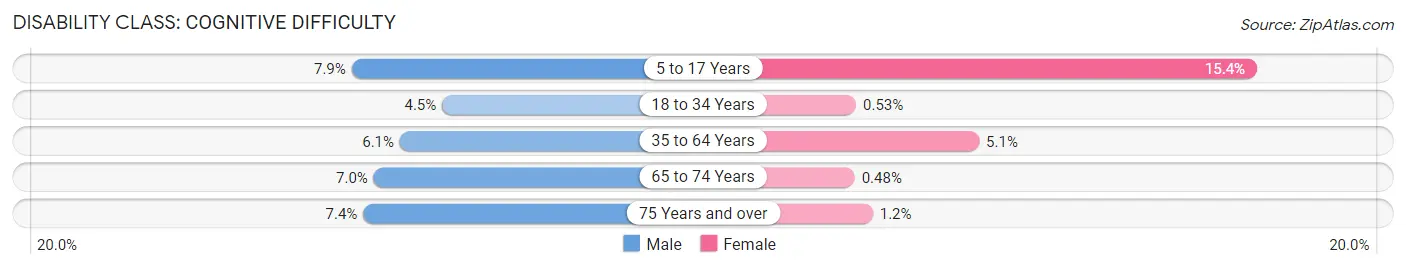
| Age Bracket | Male | Female |
| 5 to 17 Years | 39 (7.9%) | 86 (15.4%) |
| 18 to 34 Years | 49 (4.5%) | 8 (0.5%) |
| 35 to 64 Years | 84 (6.1%) | 62 (5.1%) |
| 65 to 74 Years | 28 (7.0%) | 2 (0.5%) |
| 75 Years and over | 20 (7.4%) | 5 (1.1%) |
Disability Class: Ambulatory Difficulty
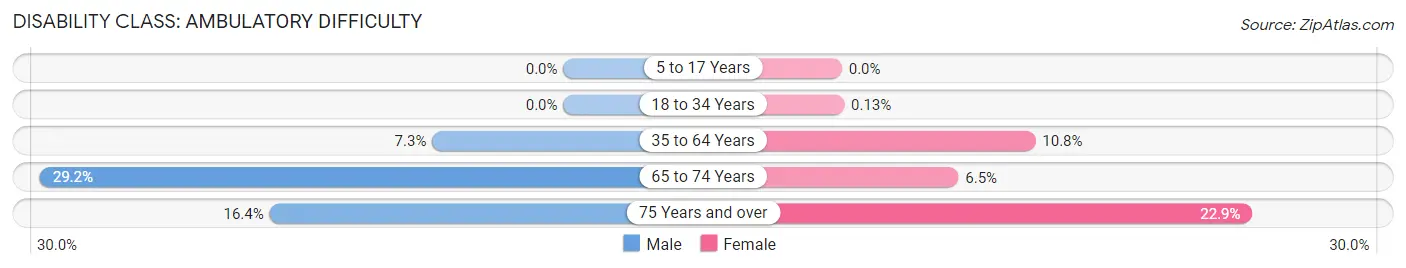
| Age Bracket | Male | Female |
| 5 to 17 Years | 0 (0.0%) | 0 (0.0%) |
| 18 to 34 Years | 0 (0.0%) | 2 (0.1%) |
| 35 to 64 Years | 101 (7.3%) | 131 (10.8%) |
| 65 to 74 Years | 116 (29.1%) | 27 (6.5%) |
| 75 Years and over | 44 (16.4%) | 99 (22.9%) |
Disability Class: Self-Care Difficulty
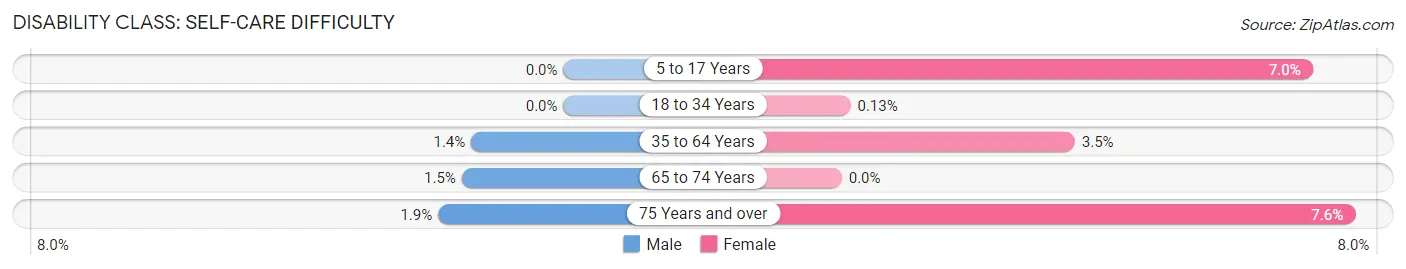
| Age Bracket | Male | Female |
| 5 to 17 Years | 0 (0.0%) | 39 (7.0%) |
| 18 to 34 Years | 0 (0.0%) | 2 (0.1%) |
| 35 to 64 Years | 19 (1.4%) | 42 (3.5%) |
| 65 to 74 Years | 6 (1.5%) | 0 (0.0%) |
| 75 Years and over | 5 (1.9%) | 33 (7.6%) |
Technology Access in Dawes County
Computing Device Access in Dawes County
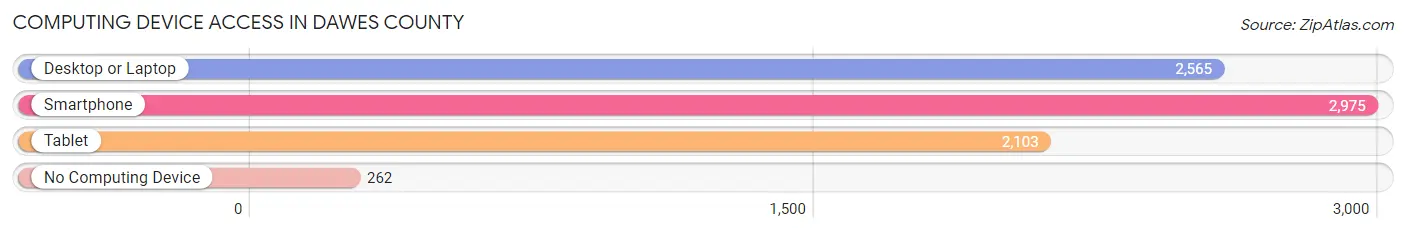
| Device Type | # Households | % Households |
| Desktop or Laptop | 2,565 | 73.6% |
| Smartphone | 2,975 | 85.4% |
| Tablet | 2,103 | 60.4% |
| No Computing Device | 262 | 7.5% |
| Total | 3,484 | 100.0% |
Internet Access in Dawes County
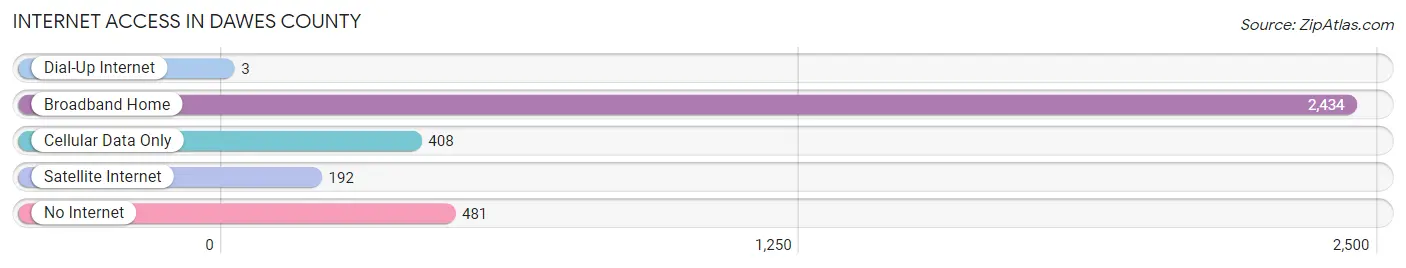
| Internet Type | # Households | % Households |
| Dial-Up Internet | 3 | 0.1% |
| Broadband Home | 2,434 | 69.9% |
| Cellular Data Only | 408 | 11.7% |
| Satellite Internet | 192 | 5.5% |
| No Internet | 481 | 13.8% |
| Total | 3,484 | 100.0% |
Dawes County Summary
Dawes County is located in the northwestern corner of Nebraska, and is bordered by Sioux County to the north, Sheridan County to the east, Box Butte County to the south, and Wyoming to the west. The county seat is Chadron, and the county was named after Civil War General William Dawes. The county has a total area of 1,845 square miles, and a population of 8,919 as of the 2010 census.
History
Dawes County was established in 1885, and was named after Civil War General William Dawes. The county was originally part of Sioux County, and was created when Sioux County was divided into two parts. The county was originally populated by Native American tribes, including the Sioux, Cheyenne, and Arapaho. The first settlers in the area were ranchers and farmers, who arrived in the late 19th century.
The county was home to the Pine Ridge Indian Reservation, which was established in 1889. The reservation was home to the Oglala Sioux Tribe, and was the site of the Wounded Knee Massacre in 1890. The massacre was the last major conflict between the US government and Native American tribes.
Geography
Dawes County is located in the northwestern corner of Nebraska, and is bordered by Sioux County to the north, Sheridan County to the east, Box Butte County to the south, and Wyoming to the west. The county has a total area of 1,845 square miles, and is mostly covered by prairie grasslands. The county is home to several rivers, including the White River, the Niobrara River, and the Cheyenne River.
The county is home to several state parks, including Chadron State Park, Fort Robinson State Park, and Toadstool Geologic Park. The county is also home to the Pine Ridge Indian Reservation, which is located in the northern part of the county.
Economy
The economy of Dawes County is largely based on agriculture and tourism. The county is home to several large ranches, and is a major producer of beef and other livestock. The county is also home to several tourist attractions, including Chadron State Park, Fort Robinson State Park, and Toadstool Geologic Park.
The county is also home to several industries, including manufacturing, energy production, and retail. The county is home to several wind farms, and is a major producer of wind energy. The county is also home to several retail stores, including grocery stores, clothing stores, and hardware stores.
Demographics
As of the 2010 census, the population of Dawes County was 8,919. The population is largely white (90.2%), with small percentages of Native American (4.2%), Hispanic (2.2%), and African American (1.2%) populations. The median household income in the county is $41,945, and the median age is 43.7.
The county is home to several Native American tribes, including the Oglala Sioux Tribe, the Cheyenne River Sioux Tribe, and the Arapaho Tribe. The county is also home to several religious denominations, including Catholic, Lutheran, and Methodist.
Common Questions
What is Per Capita Income in Dawes County?
Per Capita income in Dawes County is $27,256.
What is the Median Family Income in Dawes County?
Median Family Income in Dawes County is $71,055.
What is the Median Household income in Dawes County?
Median Household Income in Dawes County is $53,760.
What is Income or Wage Gap in Dawes County?
Income or Wage Gap in Dawes County is 25.0%.
Women in Dawes County earn 75.0 cents for every dollar earned by a man.
What is Inequality or Gini Index in Dawes County?
Inequality or Gini Index in Dawes County is 0.38.
What is the Total Population of Dawes County?
Total Population of Dawes County is 8,279.
What is the Total Male Population of Dawes County?
Total Male Population of Dawes County is 3,951.
What is the Total Female Population of Dawes County?
Total Female Population of Dawes County is 4,328.
What is the Ratio of Males per 100 Females in Dawes County?
There are 91.29 Males per 100 Females in Dawes County.
What is the Ratio of Females per 100 Males in Dawes County?
There are 109.54 Females per 100 Males in Dawes County.
What is the Median Population Age in Dawes County?
Median Population Age in Dawes County is 35.3 Years.
What is the Average Family Size in Dawes County
Average Family Size in Dawes County is 2.7 People.
What is the Average Household Size in Dawes County
Average Household Size in Dawes County is 2.1 People.
How Large is the Labor Force in Dawes County?
There are 4,441 People in the Labor Forcein in Dawes County.
What is the Percentage of People in the Labor Force in Dawes County?
63.8% of People are in the Labor Force in Dawes County.
What is the Unemployment Rate in Dawes County?
Unemployment Rate in Dawes County is 1.5%.