Custer County, NE Map & Demographics
Custer County Map
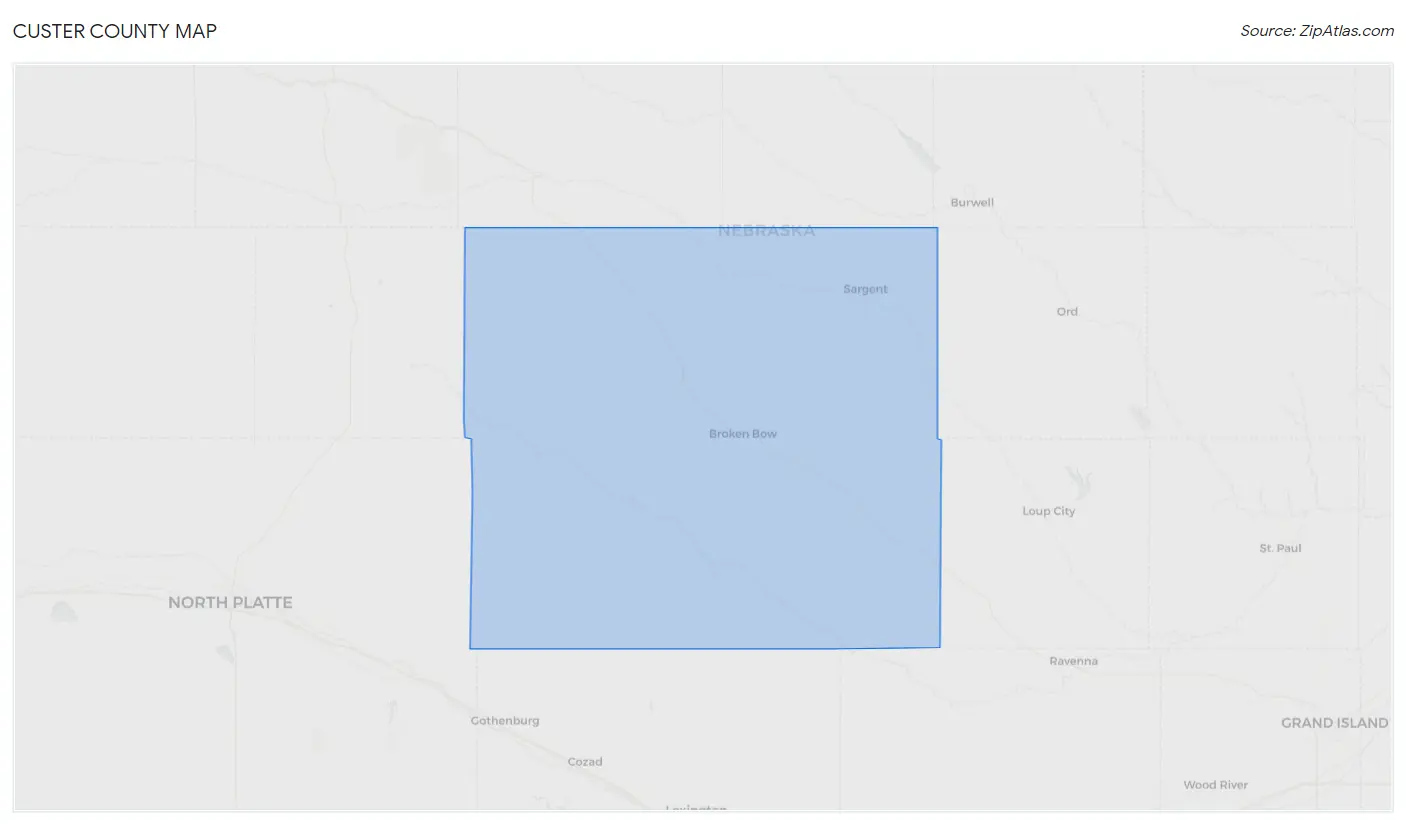
Custer County Overview
$35,562
PER CAPITA INCOME
$73,039
AVG FAMILY INCOME
$62,288
AVG HOUSEHOLD INCOME
33.7%
WAGE / INCOME GAP [ % ]
66.3¢/ $1
WAGE / INCOME GAP [ $ ]
$12,164
FAMILY INCOME DEFICIT
0.45
INEQUALITY / GINI INDEX
10,566
TOTAL POPULATION
5,314
MALE POPULATION
5,252
FEMALE POPULATION
101.18
MALES / 100 FEMALES
98.83
FEMALES / 100 MALES
42.1
MEDIAN AGE
2.9
AVG FAMILY SIZE
2.3
AVG HOUSEHOLD SIZE
5,343
LABOR FORCE [ PEOPLE ]
63.9%
PERCENT IN LABOR FORCE
1.6%
UNEMPLOYMENT RATE
Custer County Area Codes
Income in Custer County
Income Overview in Custer County
Per Capita Income in Custer County is $35,562, while median incomes of families and households are $73,039 and $62,288 respectively.
| Characteristic | Number | Measure |
| Per Capita Income | 10,566 | $35,562 |
| Median Family Income | 2,951 | $73,039 |
| Mean Family Income | 2,951 | $97,906 |
| Median Household Income | 4,543 | $62,288 |
| Mean Household Income | 4,543 | $82,921 |
| Income Deficit | 2,951 | $12,164 |
| Wage / Income Gap (%) | 10,566 | 33.68% |
| Wage / Income Gap ($) | 10,566 | 66.32¢ per $1 |
| Gini / Inequality Index | 10,566 | 0.45 |
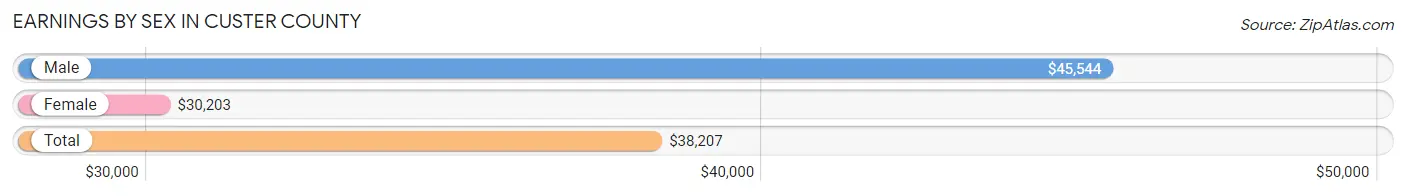
Earnings by Sex in Custer County
Average Earnings in Custer County are $38,207, $45,544 for men and $30,203 for women, a difference of 33.7%.
| Sex | Number | Average Earnings |
| Male | 3,205 (54.8%) | $45,544 |
| Female | 2,643 (45.2%) | $30,203 |
| Total | 5,848 (100.0%) | $38,207 |
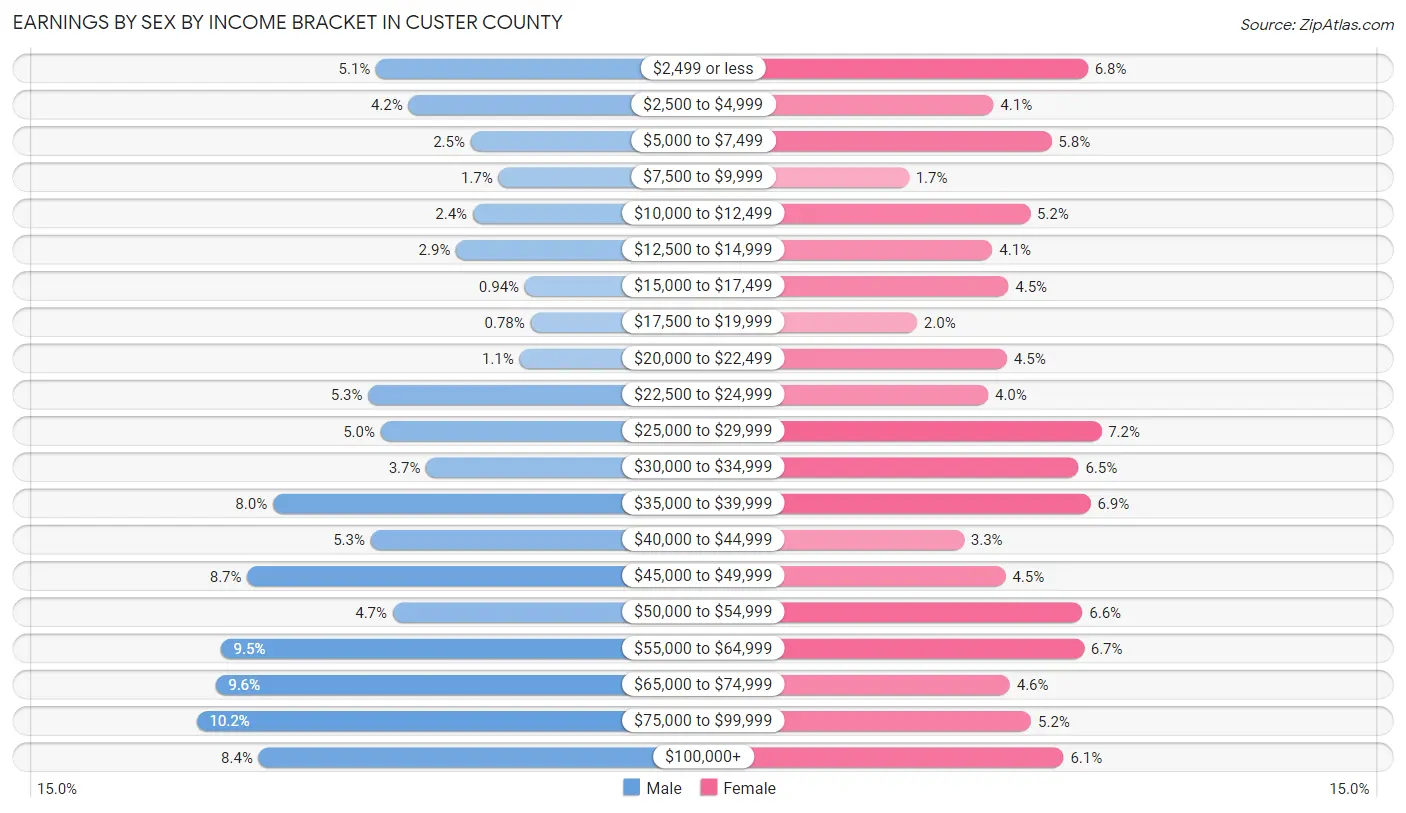
Earnings by Sex by Income Bracket in Custer County
The most common earnings brackets in Custer County are $75,000 to $99,999 for men (326 | 10.2%) and $25,000 to $29,999 for women (189 | 7.1%).
| Income | Male | Female |
| $2,499 or less | 164 (5.1%) | 179 (6.8%) |
| $2,500 to $4,999 | 135 (4.2%) | 109 (4.1%) |
| $5,000 to $7,499 | 79 (2.5%) | 152 (5.8%) |
| $7,500 to $9,999 | 54 (1.7%) | 46 (1.7%) |
| $10,000 to $12,499 | 77 (2.4%) | 136 (5.1%) |
| $12,500 to $14,999 | 92 (2.9%) | 108 (4.1%) |
| $15,000 to $17,499 | 30 (0.9%) | 120 (4.5%) |
| $17,500 to $19,999 | 25 (0.8%) | 52 (2.0%) |
| $20,000 to $22,499 | 35 (1.1%) | 119 (4.5%) |
| $22,500 to $24,999 | 171 (5.3%) | 105 (4.0%) |
| $25,000 to $29,999 | 160 (5.0%) | 189 (7.1%) |
| $30,000 to $34,999 | 119 (3.7%) | 172 (6.5%) |
| $35,000 to $39,999 | 257 (8.0%) | 181 (6.9%) |
| $40,000 to $44,999 | 169 (5.3%) | 87 (3.3%) |
| $45,000 to $49,999 | 280 (8.7%) | 118 (4.5%) |
| $50,000 to $54,999 | 149 (4.6%) | 175 (6.6%) |
| $55,000 to $64,999 | 304 (9.5%) | 176 (6.7%) |
| $65,000 to $74,999 | 309 (9.6%) | 121 (4.6%) |
| $75,000 to $99,999 | 326 (10.2%) | 137 (5.2%) |
| $100,000+ | 270 (8.4%) | 161 (6.1%) |
| Total | 3,205 (100.0%) | 2,643 (100.0%) |
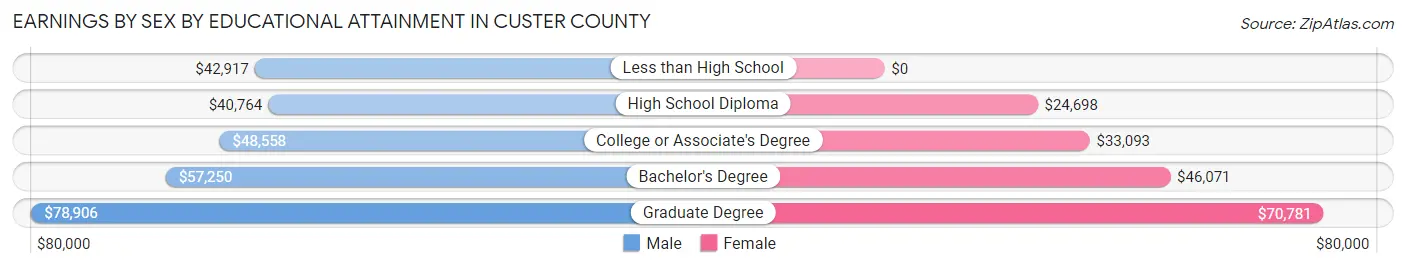
Earnings by Sex by Educational Attainment in Custer County
Average earnings in Custer County are $48,879 for men and $35,364 for women, a difference of 27.7%. Men with an educational attainment of graduate degree enjoy the highest average annual earnings of $78,906, while those with high school diploma education earn the least with $40,764. Women with an educational attainment of graduate degree earn the most with the average annual earnings of $70,781, while those with high school diploma education have the smallest earnings of $24,698.
| Educational Attainment | Male Income | Female Income |
| Less than High School | $42,917 | $0 |
| High School Diploma | $40,764 | $24,698 |
| College or Associate's Degree | $48,558 | $33,093 |
| Bachelor's Degree | $57,250 | $46,071 |
| Graduate Degree | $78,906 | $70,781 |
| Total | $48,879 | $35,364 |
Family Income in Custer County
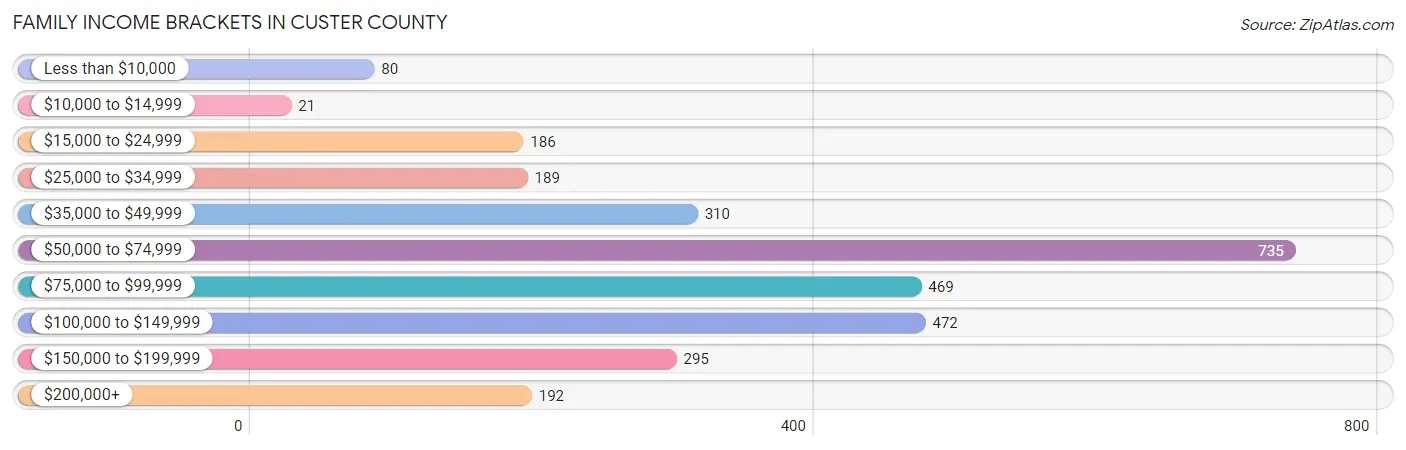
Family Income Brackets in Custer County
According to the Custer County family income data, there are 735 families falling into the $50,000 to $74,999 income range, which is the most common income bracket and makes up 24.9% of all families. Conversely, the $10,000 to $14,999 income bracket is the least frequent group with only 21 families (0.7%) belonging to this category.
| Income Bracket | # Families | % Families |
| Less than $10,000 | 80 | 2.7% |
| $10,000 to $14,999 | 21 | 0.7% |
| $15,000 to $24,999 | 186 | 6.3% |
| $25,000 to $34,999 | 189 | 6.4% |
| $35,000 to $49,999 | 310 | 10.5% |
| $50,000 to $74,999 | 735 | 24.9% |
| $75,000 to $99,999 | 469 | 15.9% |
| $100,000 to $149,999 | 472 | 16.0% |
| $150,000 to $199,999 | 295 | 10.0% |
| $200,000+ | 192 | 6.5% |
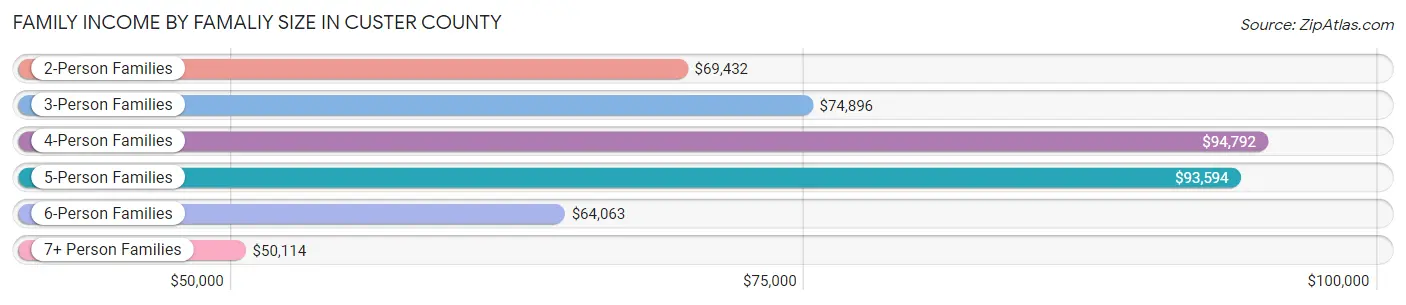
Family Income by Famaliy Size in Custer County
4-person families (382 | 12.9%) account for the highest median family income in Custer County with $94,792 per family, while 2-person families (1,753 | 59.4%) have the highest median income of $34,716 per family member.
| Income Bracket | # Families | Median Income |
| 2-Person Families | 1,753 (59.4%) | $69,432 |
| 3-Person Families | 469 (15.9%) | $74,896 |
| 4-Person Families | 382 (12.9%) | $94,792 |
| 5-Person Families | 211 (7.1%) | $93,594 |
| 6-Person Families | 49 (1.7%) | $64,063 |
| 7+ Person Families | 87 (2.9%) | $50,114 |
| Total | 2,951 (100.0%) | $73,039 |
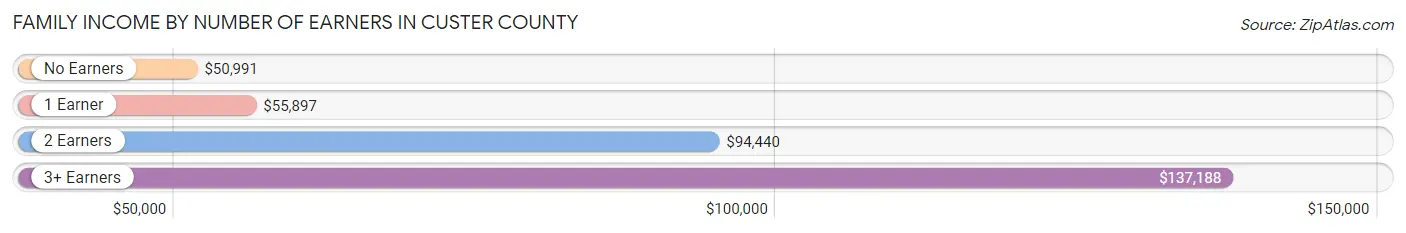
Family Income by Number of Earners in Custer County
The median family income in Custer County is $73,039, with families comprising 3+ earners (375) having the highest median family income of $137,188, while families with no earners (404) have the lowest median family income of $50,991, accounting for 12.7% and 13.7% of families, respectively.
| Number of Earners | # Families | Median Income |
| No Earners | 404 (13.7%) | $50,991 |
| 1 Earner | 876 (29.7%) | $55,897 |
| 2 Earners | 1,296 (43.9%) | $94,440 |
| 3+ Earners | 375 (12.7%) | $137,188 |
| Total | 2,951 (100.0%) | $73,039 |
Household Income in Custer County
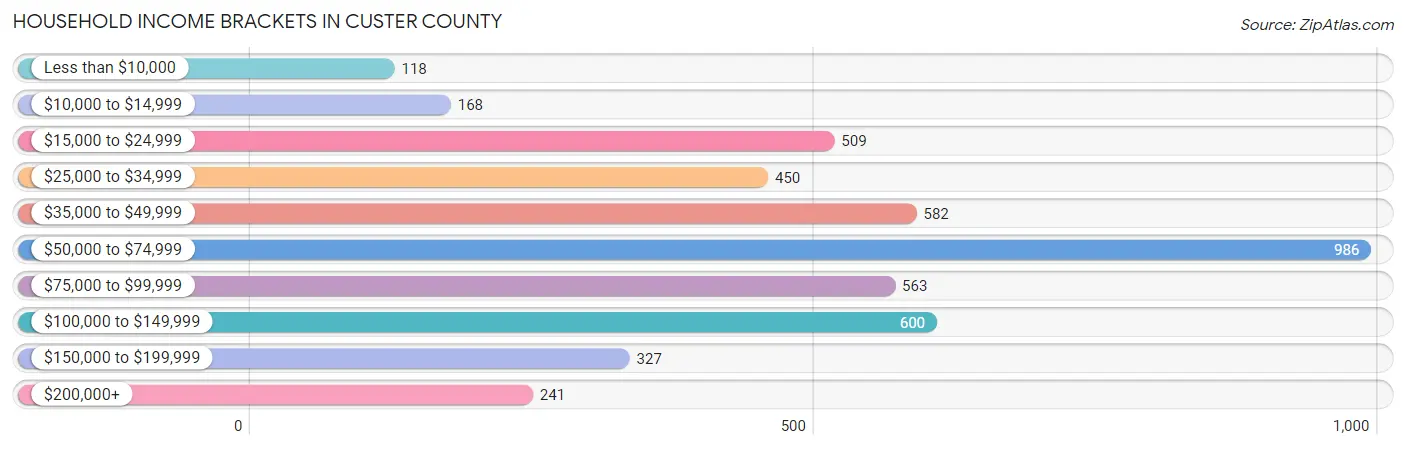
Household Income Brackets in Custer County
With 986 households falling in the category, the $50,000 to $74,999 income range is the most frequent in Custer County, accounting for 21.7% of all households. In contrast, only 118 households (2.6%) fall into the less than $10,000 income bracket, making it the least populous group.
| Income Bracket | # Households | % Households |
| Less than $10,000 | 118 | 2.6% |
| $10,000 to $14,999 | 168 | 3.7% |
| $15,000 to $24,999 | 509 | 11.2% |
| $25,000 to $34,999 | 450 | 9.9% |
| $35,000 to $49,999 | 582 | 12.8% |
| $50,000 to $74,999 | 986 | 21.7% |
| $75,000 to $99,999 | 563 | 12.4% |
| $100,000 to $149,999 | 600 | 13.2% |
| $150,000 to $199,999 | 327 | 7.2% |
| $200,000+ | 241 | 5.3% |
Household Income by Householder Age in Custer County
The median household income in Custer County is $62,288, with the highest median household income of $73,348 found in the 45 to 64 years age bracket for the primary householder. A total of 1,499 households (33.0%) fall into this category. Meanwhile, the 15 to 24 years age bracket for the primary householder has the lowest median household income of $48,409, with 252 households (5.6%) in this group.
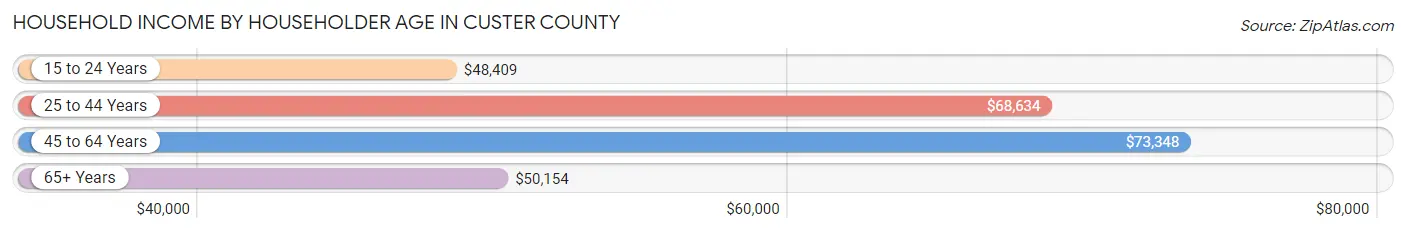
| Income Bracket | # Households | Median Income |
| 15 to 24 Years | 252 (5.6%) | $48,409 |
| 25 to 44 Years | 1,319 (29.0%) | $68,634 |
| 45 to 64 Years | 1,499 (33.0%) | $73,348 |
| 65+ Years | 1,473 (32.4%) | $50,154 |
| Total | 4,543 (100.0%) | $62,288 |
Poverty in Custer County
Income Below Poverty by Sex and Age in Custer County
With 10.6% poverty level for males and 12.0% for females among the residents of Custer County, 16 and 17 year old males and 5 year old females are the most vulnerable to poverty, with 71 males (37.8%) and 43 females (64.2%) in their respective age groups living below the poverty level.
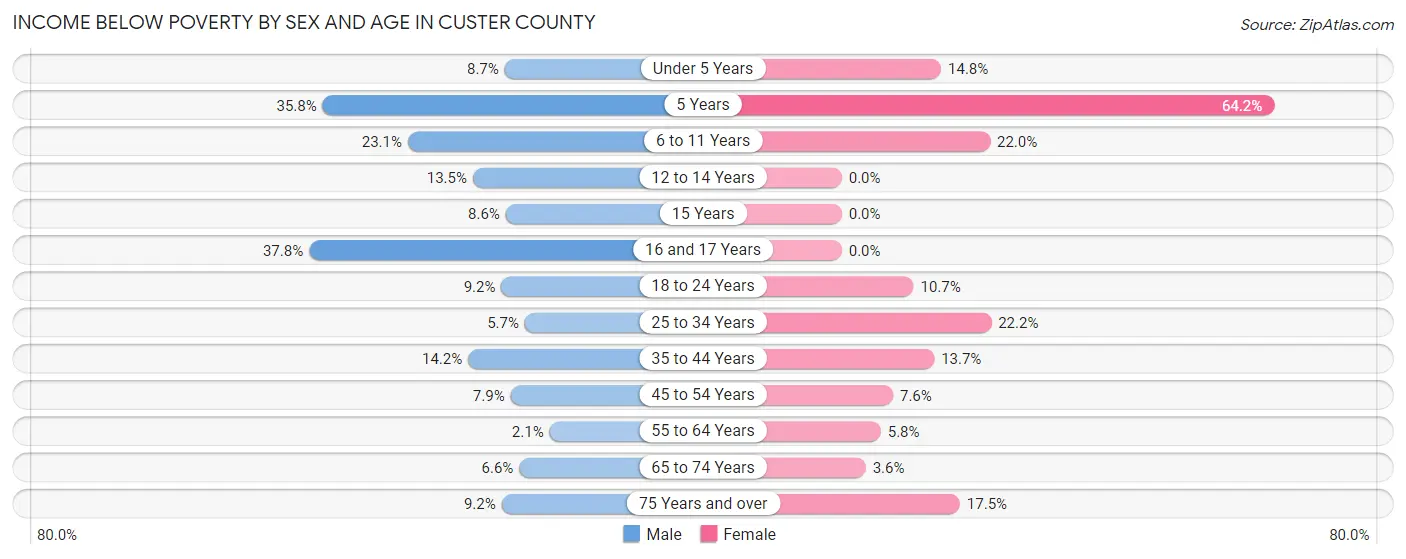
| Age Bracket | Male | Female |
| Under 5 Years | 28 (8.7%) | 41 (14.7%) |
| 5 Years | 54 (35.8%) | 43 (64.2%) |
| 6 to 11 Years | 67 (23.1%) | 81 (22.0%) |
| 12 to 14 Years | 37 (13.5%) | 0 (0.0%) |
| 15 Years | 3 (8.6%) | 0 (0.0%) |
| 16 and 17 Years | 71 (37.8%) | 0 (0.0%) |
| 18 to 24 Years | 36 (9.2%) | 34 (10.7%) |
| 25 to 34 Years | 33 (5.7%) | 138 (22.2%) |
| 35 to 44 Years | 90 (14.1%) | 73 (13.7%) |
| 45 to 54 Years | 43 (7.9%) | 41 (7.6%) |
| 55 to 64 Years | 16 (2.1%) | 42 (5.8%) |
| 65 to 74 Years | 42 (6.6%) | 21 (3.5%) |
| 75 Years and over | 39 (9.2%) | 104 (17.5%) |
| Total | 559 (10.6%) | 618 (12.0%) |
Income Above Poverty by Sex and Age in Custer County
According to the poverty statistics in Custer County, males aged 55 to 64 years and females aged 12 to 14 years are the age groups that are most secure financially, with 97.9% of males and 100.0% of females in these age groups living above the poverty line.
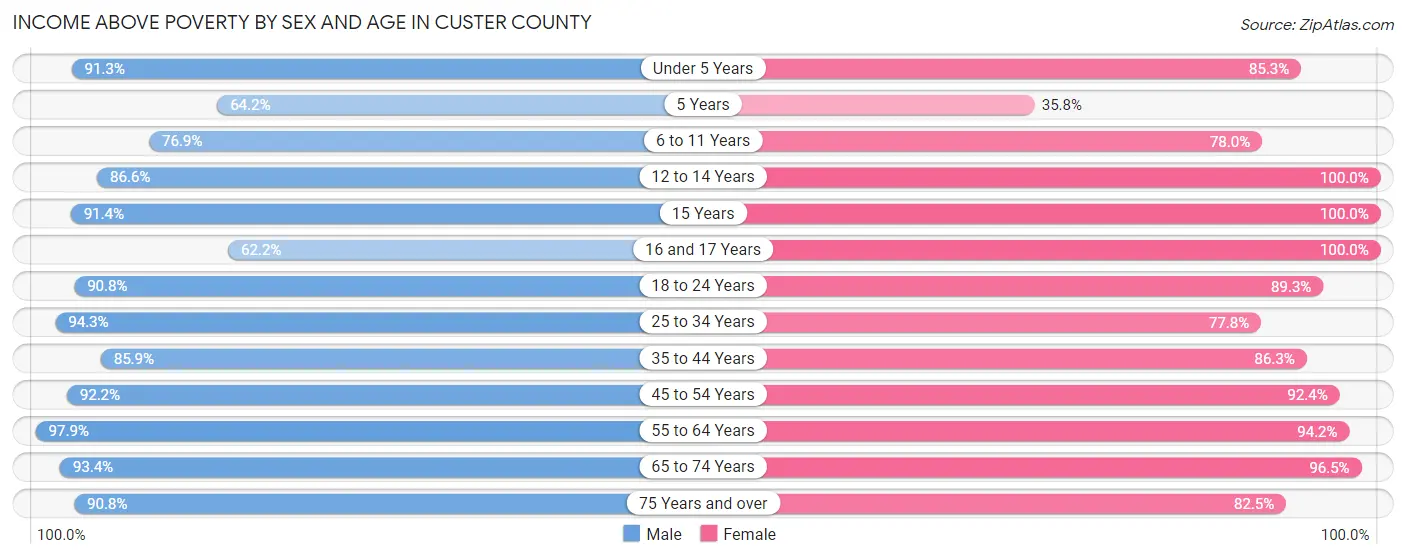
| Age Bracket | Male | Female |
| Under 5 Years | 293 (91.3%) | 237 (85.3%) |
| 5 Years | 97 (64.2%) | 24 (35.8%) |
| 6 to 11 Years | 223 (76.9%) | 287 (78.0%) |
| 12 to 14 Years | 238 (86.6%) | 298 (100.0%) |
| 15 Years | 32 (91.4%) | 67 (100.0%) |
| 16 and 17 Years | 117 (62.2%) | 144 (100.0%) |
| 18 to 24 Years | 355 (90.8%) | 285 (89.3%) |
| 25 to 34 Years | 544 (94.3%) | 484 (77.8%) |
| 35 to 44 Years | 546 (85.9%) | 459 (86.3%) |
| 45 to 54 Years | 505 (92.1%) | 498 (92.4%) |
| 55 to 64 Years | 762 (97.9%) | 684 (94.2%) |
| 65 to 74 Years | 598 (93.4%) | 570 (96.5%) |
| 75 Years and over | 386 (90.8%) | 489 (82.5%) |
| Total | 4,696 (89.4%) | 4,526 (88.0%) |
Income Below Poverty Among Married-Couple Families in Custer County
The poverty statistics for married-couple families in Custer County show that 3.7% or 89 of the total 2,422 families live below the poverty line. Families with 5 or more children have the highest poverty rate of 22.2%, comprising of 12 families. On the other hand, families with no children have the lowest poverty rate of 1.8%, which includes 29 families.
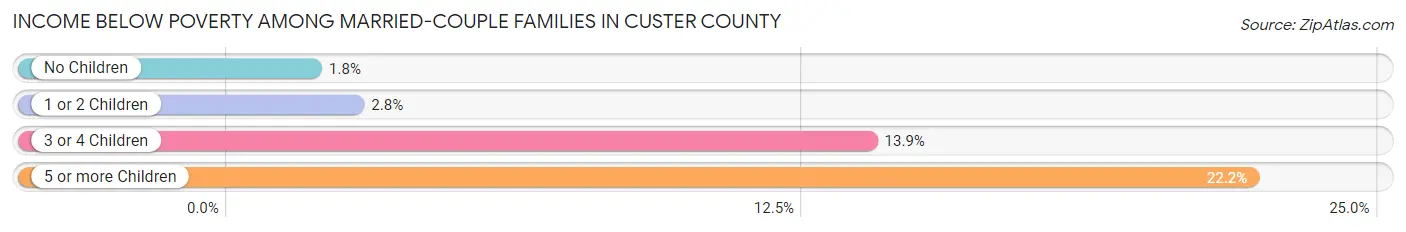
| Children | Above Poverty | Below Poverty |
| No Children | 1,557 (98.2%) | 29 (1.8%) |
| 1 or 2 Children | 530 (97.3%) | 15 (2.8%) |
| 3 or 4 Children | 204 (86.1%) | 33 (13.9%) |
| 5 or more Children | 42 (77.8%) | 12 (22.2%) |
| Total | 2,333 (96.3%) | 89 (3.7%) |
Income Below Poverty Among Single-Parent Households in Custer County
According to the poverty data in Custer County, 9.5% or 22 single-father households and 35.6% or 106 single-mother households are living below the poverty line. Among single-father households, those with no children have the highest poverty rate, with 14 households (27.5%) experiencing poverty. Likewise, among single-mother households, those with 3 or 4 children have the highest poverty rate, with 32 households (64.0%) falling below the poverty line.
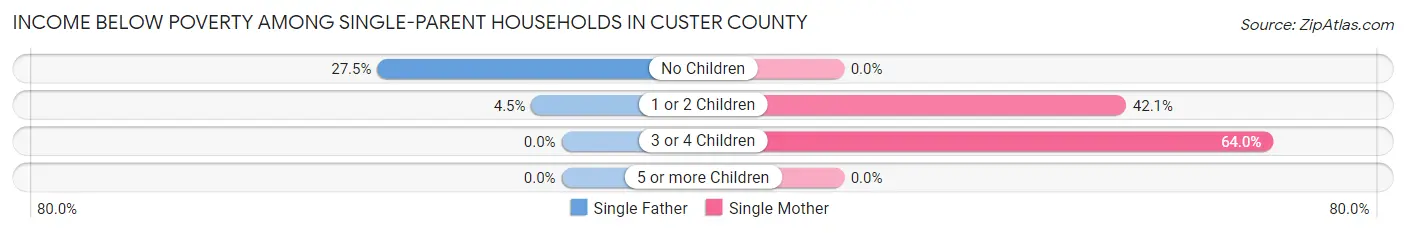
| Children | Single Father | Single Mother |
| No Children | 14 (27.5%) | 0 (0.0%) |
| 1 or 2 Children | 8 (4.5%) | 74 (42.0%) |
| 3 or 4 Children | 0 (0.0%) | 32 (64.0%) |
| 5 or more Children | 0 (0.0%) | 0 (0.0%) |
| Total | 22 (9.5%) | 106 (35.6%) |
Income Below Poverty Among Married-Couple vs Single-Parent Households in Custer County
The poverty data for Custer County shows that 89 of the married-couple family households (3.7%) and 128 of the single-parent households (24.2%) are living below the poverty level. Within the married-couple family households, those with 5 or more children have the highest poverty rate, with 12 households (22.2%) falling below the poverty line. Among the single-parent households, those with 3 or 4 children have the highest poverty rate, with 32 household (61.5%) living below poverty.
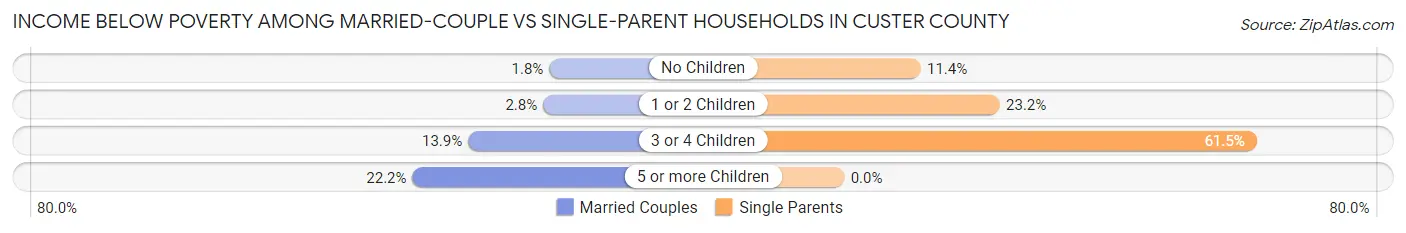
| Children | Married-Couple Families | Single-Parent Households |
| No Children | 29 (1.8%) | 14 (11.4%) |
| 1 or 2 Children | 15 (2.8%) | 82 (23.2%) |
| 3 or 4 Children | 33 (13.9%) | 32 (61.5%) |
| 5 or more Children | 12 (22.2%) | 0 (0.0%) |
| Total | 89 (3.7%) | 128 (24.2%) |
Race in Custer County
The most populous races in Custer County are White / Caucasian (10,058 | 95.2%), Hispanic or Latino (388 | 3.7%), and Two or more Races (257 | 2.4%).
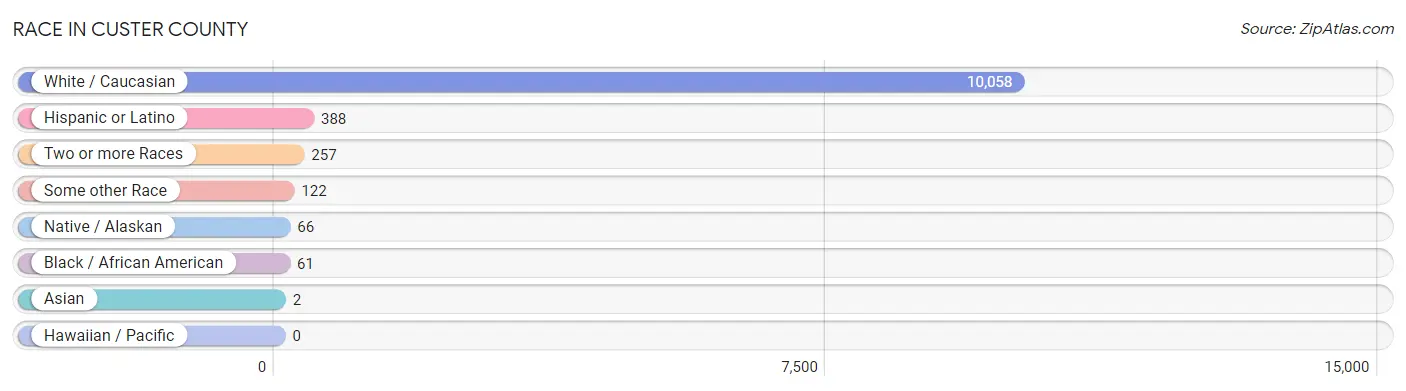
| Race | # Population | % Population |
| Asian | 2 | 0.0% |
| Black / African American | 61 | 0.6% |
| Hawaiian / Pacific | 0 | 0.0% |
| Hispanic or Latino | 388 | 3.7% |
| Native / Alaskan | 66 | 0.6% |
| White / Caucasian | 10,058 | 95.2% |
| Two or more Races | 257 | 2.4% |
| Some other Race | 122 | 1.1% |
| Total | 10,566 | 100.0% |
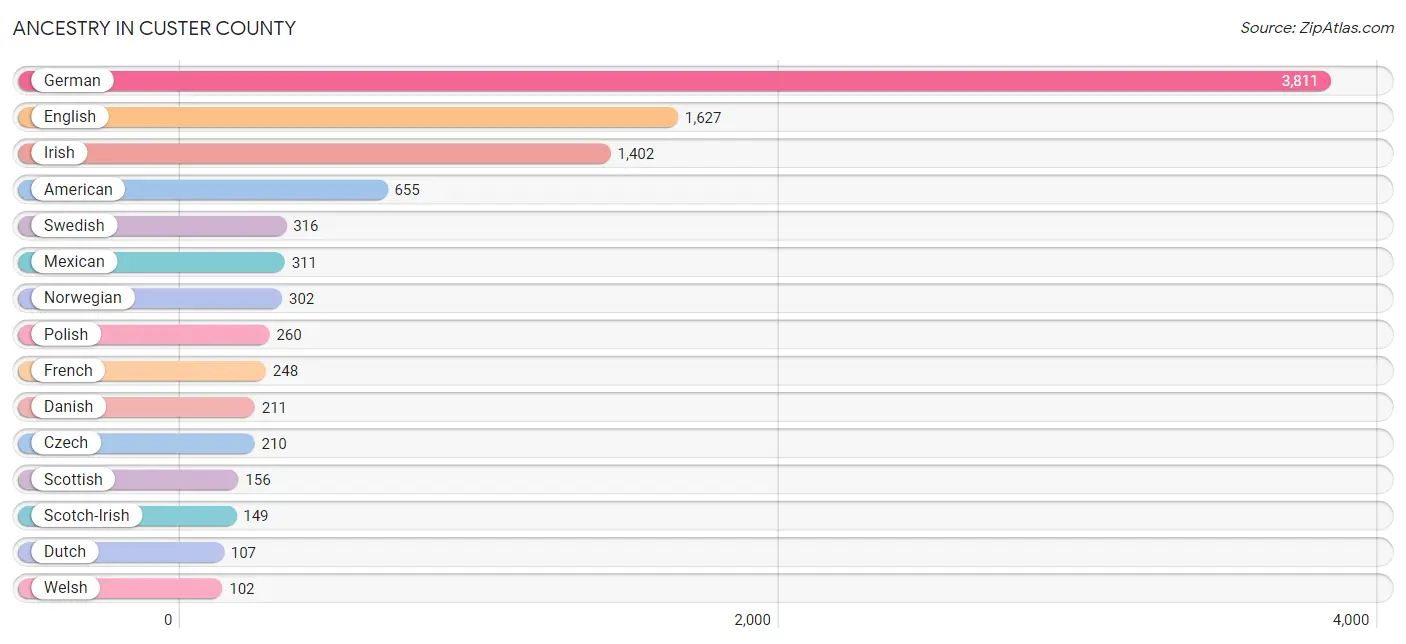
Ancestry in Custer County
The most populous ancestries reported in Custer County are German (3,811 | 36.1%), English (1,627 | 15.4%), Irish (1,402 | 13.3%), American (655 | 6.2%), and Swedish (316 | 3.0%), together accounting for 73.9% of all Custer County residents.
| Ancestry | # Population | % Population |
| American | 655 | 6.2% |
| Arab | 7 | 0.1% |
| Austrian | 5 | 0.1% |
| Bhutanese | 1 | 0.0% |
| British | 3 | 0.0% |
| Burmese | 6 | 0.1% |
| Central American | 68 | 0.6% |
| Cherokee | 37 | 0.4% |
| Croatian | 2 | 0.0% |
| Cuban | 1 | 0.0% |
| Czech | 210 | 2.0% |
| Czechoslovakian | 20 | 0.2% |
| Danish | 211 | 2.0% |
| Dutch | 107 | 1.0% |
| Eastern European | 29 | 0.3% |
| English | 1,627 | 15.4% |
| Estonian | 21 | 0.2% |
| European | 91 | 0.9% |
| Finnish | 4 | 0.0% |
| French | 248 | 2.4% |
| French Canadian | 14 | 0.1% |
| German | 3,811 | 36.1% |
| Greek | 1 | 0.0% |
| Guatemalan | 37 | 0.4% |
| Hungarian | 1 | 0.0% |
| Irish | 1,402 | 13.3% |
| Italian | 88 | 0.8% |
| Lebanese | 3 | 0.0% |
| Lithuanian | 5 | 0.1% |
| Luxembourger | 1 | 0.0% |
| Malaysian | 1 | 0.0% |
| Mexican | 311 | 2.9% |
| Mexican American Indian | 2 | 0.0% |
| New Zealander | 6 | 0.1% |
| Northern European | 27 | 0.3% |
| Norwegian | 302 | 2.9% |
| Pennsylvania German | 3 | 0.0% |
| Polish | 260 | 2.5% |
| Puerto Rican | 4 | 0.0% |
| Russian | 38 | 0.4% |
| Salvadoran | 31 | 0.3% |
| Scandinavian | 54 | 0.5% |
| Scotch-Irish | 149 | 1.4% |
| Scottish | 156 | 1.5% |
| Sioux | 57 | 0.5% |
| Slovene | 17 | 0.2% |
| Subsaharan African | 1 | 0.0% |
| Sudanese | 1 | 0.0% |
| Swedish | 316 | 3.0% |
| Swiss | 11 | 0.1% |
| Syrian | 4 | 0.0% |
| Trinidadian and Tobagonian | 8 | 0.1% |
| Ukrainian | 16 | 0.2% |
| Welsh | 102 | 1.0% |
| West Indian | 36 | 0.3% | View All 55 Rows |
Immigrants in Custer County
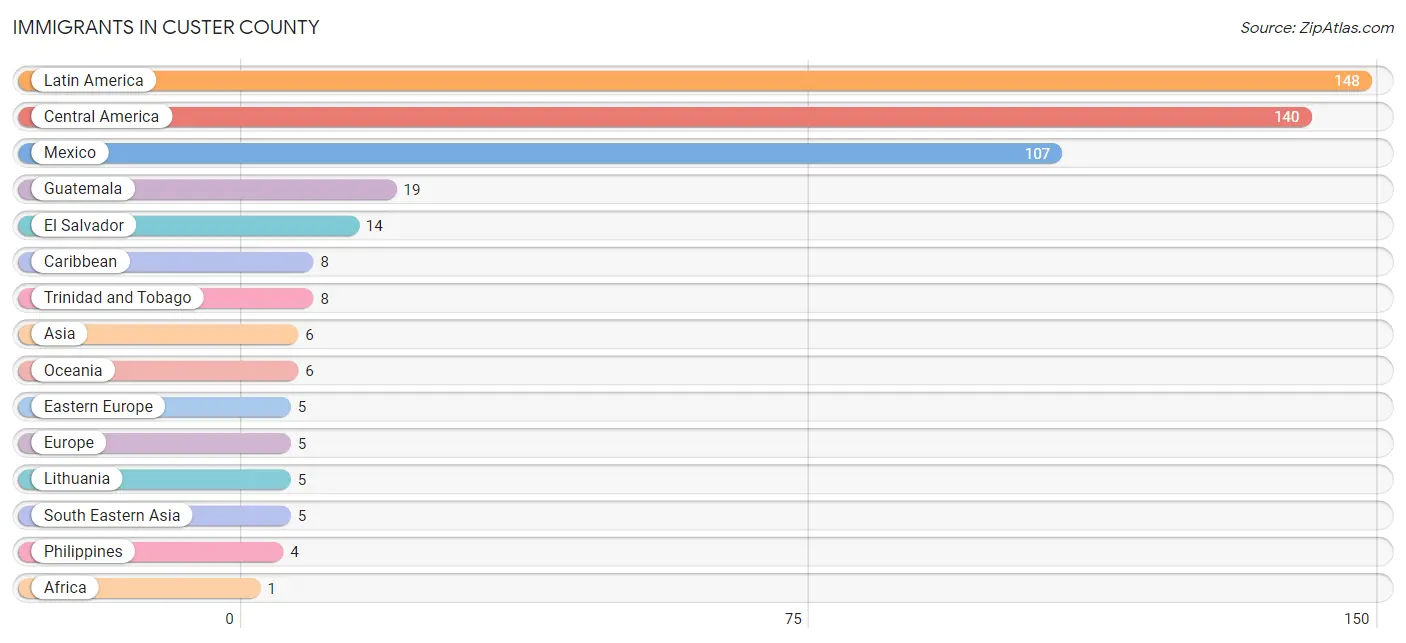
The most numerous immigrant groups reported in Custer County came from Latin America (148 | 1.4%), Central America (140 | 1.3%), Mexico (107 | 1.0%), Guatemala (19 | 0.2%), and El Salvador (14 | 0.1%), together accounting for 4.1% of all Custer County residents.
| Immigration Origin | # Population | % Population |
| Africa | 1 | 0.0% |
| Asia | 6 | 0.1% |
| Caribbean | 8 | 0.1% |
| Central America | 140 | 1.3% |
| Eastern Africa | 1 | 0.0% |
| Eastern Asia | 1 | 0.0% |
| Eastern Europe | 5 | 0.1% |
| El Salvador | 14 | 0.1% |
| Ethiopia | 1 | 0.0% |
| Europe | 5 | 0.1% |
| Guatemala | 19 | 0.2% |
| Japan | 1 | 0.0% |
| Laos | 1 | 0.0% |
| Latin America | 148 | 1.4% |
| Lithuania | 5 | 0.1% |
| Mexico | 107 | 1.0% |
| Oceania | 6 | 0.1% |
| Philippines | 4 | 0.0% |
| South Eastern Asia | 5 | 0.1% |
| Trinidad and Tobago | 8 | 0.1% | View All 20 Rows |
Sex and Age in Custer County
Sex and Age in Custer County
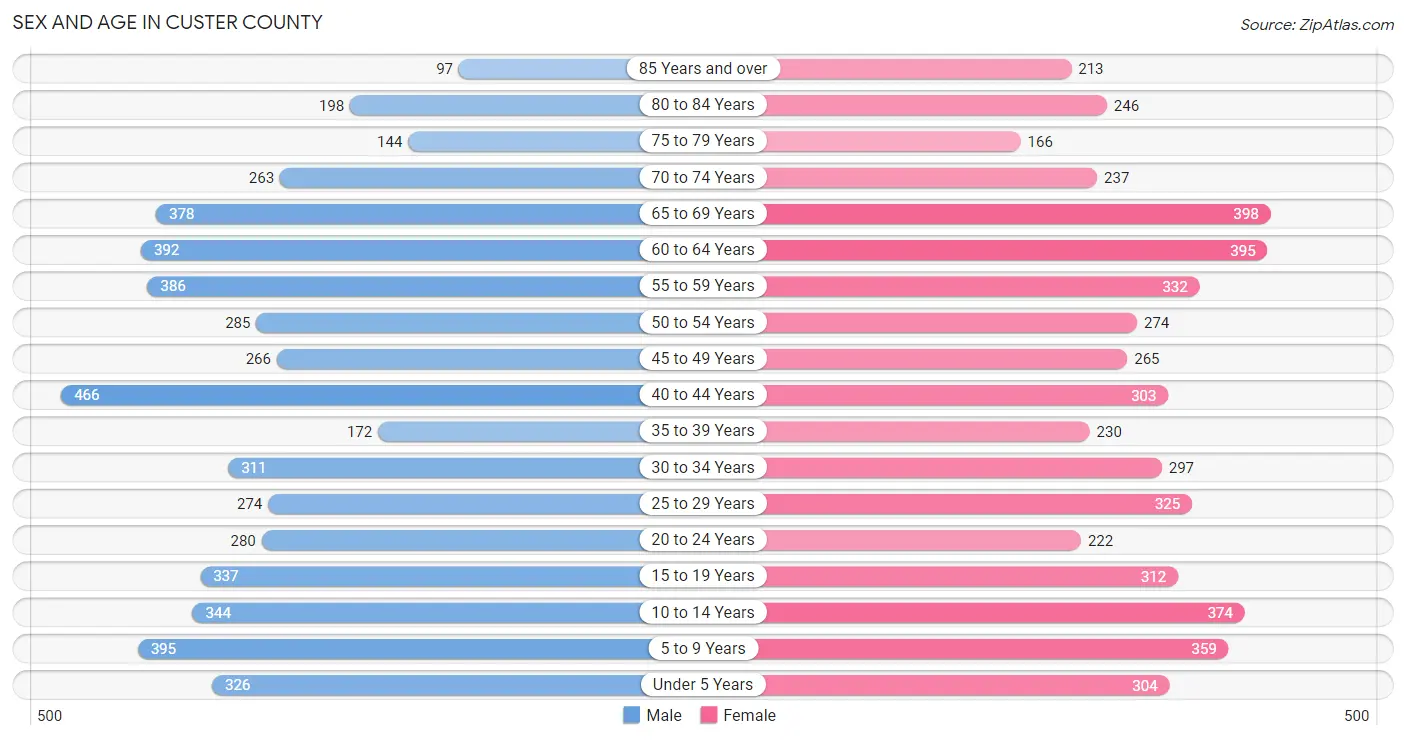
The most populous age groups in Custer County are 40 to 44 Years (466 | 8.8%) for men and 65 to 69 Years (398 | 7.6%) for women.
| Age Bracket | Male | Female |
| Under 5 Years | 326 (6.1%) | 304 (5.8%) |
| 5 to 9 Years | 395 (7.4%) | 359 (6.8%) |
| 10 to 14 Years | 344 (6.5%) | 374 (7.1%) |
| 15 to 19 Years | 337 (6.3%) | 312 (5.9%) |
| 20 to 24 Years | 280 (5.3%) | 222 (4.2%) |
| 25 to 29 Years | 274 (5.2%) | 325 (6.2%) |
| 30 to 34 Years | 311 (5.9%) | 297 (5.7%) |
| 35 to 39 Years | 172 (3.2%) | 230 (4.4%) |
| 40 to 44 Years | 466 (8.8%) | 303 (5.8%) |
| 45 to 49 Years | 266 (5.0%) | 265 (5.1%) |
| 50 to 54 Years | 285 (5.4%) | 274 (5.2%) |
| 55 to 59 Years | 386 (7.3%) | 332 (6.3%) |
| 60 to 64 Years | 392 (7.4%) | 395 (7.5%) |
| 65 to 69 Years | 378 (7.1%) | 398 (7.6%) |
| 70 to 74 Years | 263 (5.0%) | 237 (4.5%) |
| 75 to 79 Years | 144 (2.7%) | 166 (3.2%) |
| 80 to 84 Years | 198 (3.7%) | 246 (4.7%) |
| 85 Years and over | 97 (1.8%) | 213 (4.1%) |
| Total | 5,314 (100.0%) | 5,252 (100.0%) |
Families and Households in Custer County
Median Family Size in Custer County
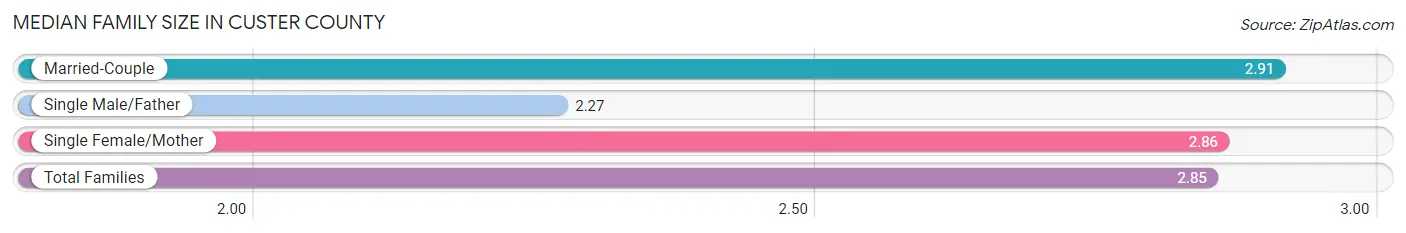
The median family size in Custer County is 2.85 persons per family, with married-couple families (2,422 | 82.1%) accounting for the largest median family size of 2.91 persons per family. On the other hand, single male/father families (231 | 7.8%) represent the smallest median family size with 2.27 persons per family.
| Family Type | # Families | Family Size |
| Married-Couple | 2,422 (82.1%) | 2.91 |
| Single Male/Father | 231 (7.8%) | 2.27 |
| Single Female/Mother | 298 (10.1%) | 2.86 |
| Total Families | 2,951 (100.0%) | 2.85 |
Median Household Size in Custer County
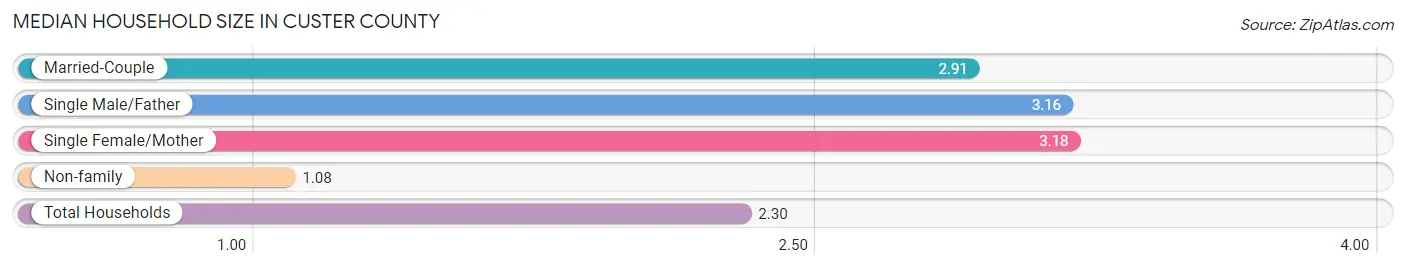
The median household size in Custer County is 2.30 persons per household, with single female/mother households (298 | 6.6%) accounting for the largest median household size of 3.18 persons per household. non-family households (1,592 | 35.0%) represent the smallest median household size with 1.08 persons per household.
| Household Type | # Households | Household Size |
| Married-Couple | 2,422 (53.3%) | 2.91 |
| Single Male/Father | 231 (5.1%) | 3.16 |
| Single Female/Mother | 298 (6.6%) | 3.18 |
| Non-family | 1,592 (35.0%) | 1.08 |
| Total Households | 4,543 (100.0%) | 2.30 |
Household Size by Marriage Status in Custer County
Out of a total of 4,543 households in Custer County, 2,951 (65.0%) are family households, while 1,592 (35.0%) are nonfamily households. The most numerous type of family households are 2-person households, comprising 1,593, and the most common type of nonfamily households are 1-person households, comprising 1,455.
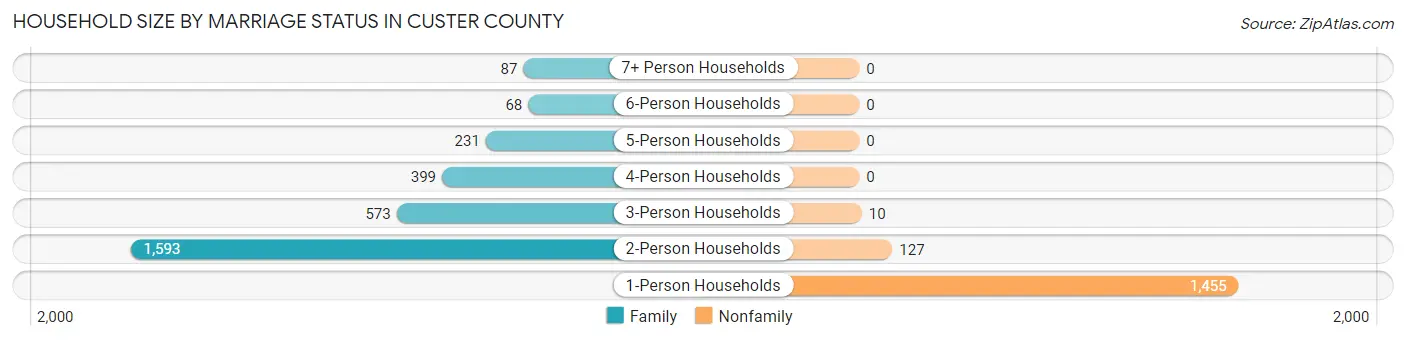
| Household Size | Family Households | Nonfamily Households |
| 1-Person Households | - | 1,455 (32.0%) |
| 2-Person Households | 1,593 (35.1%) | 127 (2.8%) |
| 3-Person Households | 573 (12.6%) | 10 (0.2%) |
| 4-Person Households | 399 (8.8%) | 0 (0.0%) |
| 5-Person Households | 231 (5.1%) | 0 (0.0%) |
| 6-Person Households | 68 (1.5%) | 0 (0.0%) |
| 7+ Person Households | 87 (1.9%) | 0 (0.0%) |
| Total | 2,951 (65.0%) | 1,592 (35.0%) |
Female Fertility in Custer County
Fertility by Age in Custer County
Average fertility rate in Custer County is 65.0 births per 1,000 women. Women in the age bracket of 20 to 34 years have the highest fertility rate with 145.0 births per 1,000 women. Women in the age bracket of 20 to 34 years acount for 91.7% of all women with births.
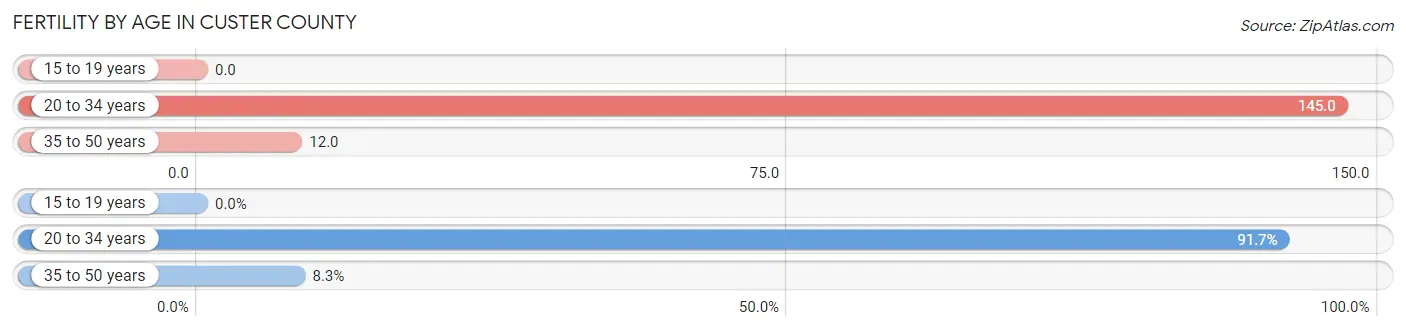
| Age Bracket | Women with Births | Births / 1,000 Women |
| 15 to 19 years | 0 (0.0%) | 0.0 |
| 20 to 34 years | 122 (91.7%) | 145.0 |
| 35 to 50 years | 11 (8.3%) | 12.0 |
| Total | 133 (100.0%) | 65.0 |
Fertility by Age by Marriage Status in Custer County
47.4% of women with births (133) in Custer County are married. The highest percentage of unmarried women with births falls into 20 to 34 years age bracket with 57.4% of them unmarried at the time of birth, while the lowest percentage of unmarried women with births belong to 35 to 50 years age bracket with 0.0% of them unmarried.
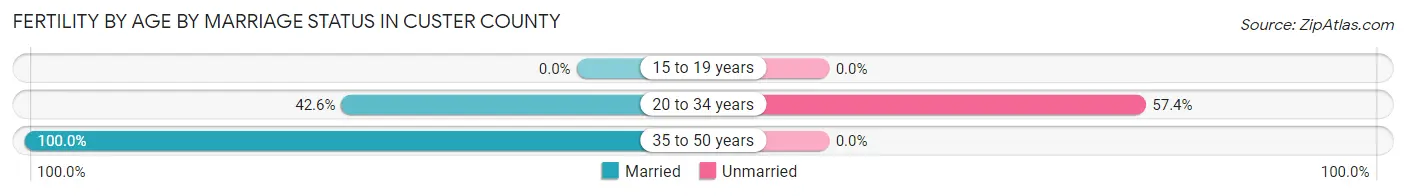
| Age Bracket | Married | Unmarried |
| 15 to 19 years | 0 (0.0%) | 0 (0.0%) |
| 20 to 34 years | 52 (42.6%) | 70 (57.4%) |
| 35 to 50 years | 11 (100.0%) | 0 (0.0%) |
| Total | 63 (47.4%) | 70 (52.6%) |
Fertility by Education in Custer County
Average fertility rate in Custer County is 65.0 births per 1,000 women. Women with the education attainment of high school diploma have the highest fertility rate of 85.0 births per 1,000 women, while women with the education attainment of less than high school have the lowest fertility at 42.0 births per 1,000 women. Women with the education attainment of college or associate's degree represent 30.8% of all women with births.
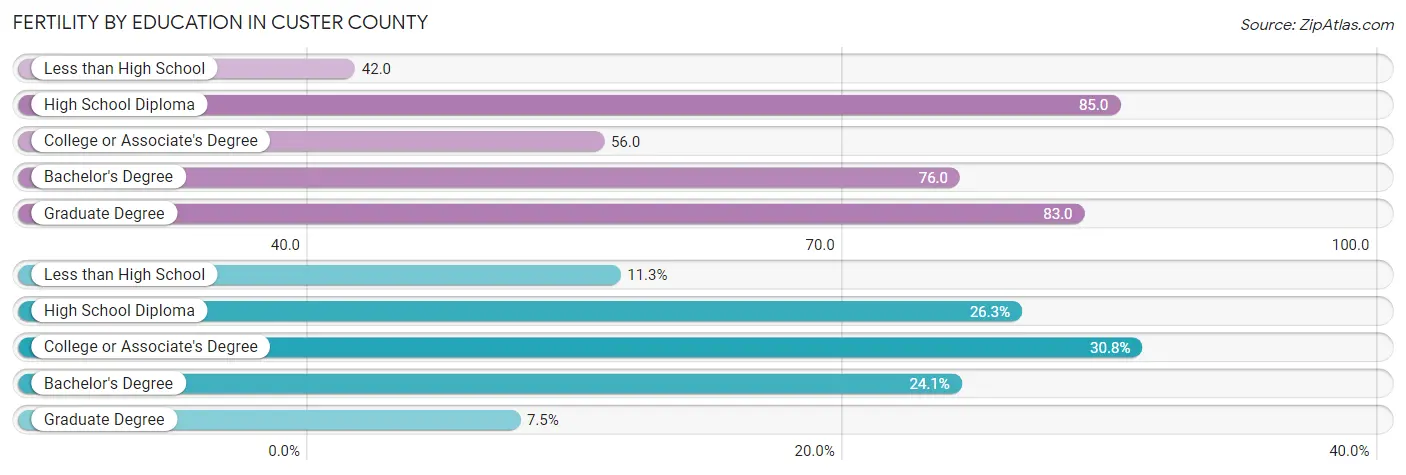
| Educational Attainment | Women with Births | Births / 1,000 Women |
| Less than High School | 15 (11.3%) | 42.0 |
| High School Diploma | 35 (26.3%) | 85.0 |
| College or Associate's Degree | 41 (30.8%) | 56.0 |
| Bachelor's Degree | 32 (24.1%) | 76.0 |
| Graduate Degree | 10 (7.5%) | 83.0 |
| Total | 133 (100.0%) | 65.0 |
Fertility by Education by Marriage Status in Custer County
52.6% of women with births in Custer County are unmarried. Women with the educational attainment of bachelor's degree are most likely to be married with 100.0% of them married at childbirth, while women with the educational attainment of less than high school are least likely to be married with 100.0% of them unmarried at childbirth.
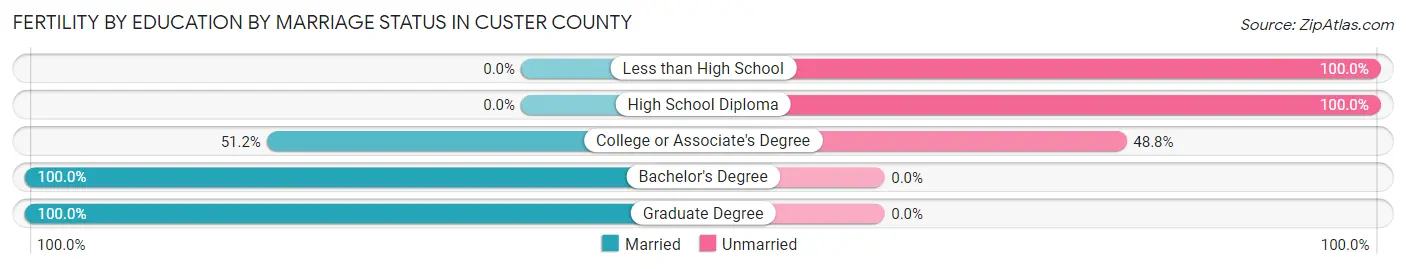
| Educational Attainment | Married | Unmarried |
| Less than High School | 0 (0.0%) | 15 (100.0%) |
| High School Diploma | 0 (0.0%) | 35 (100.0%) |
| College or Associate's Degree | 21 (51.2%) | 20 (48.8%) |
| Bachelor's Degree | 32 (100.0%) | 0 (0.0%) |
| Graduate Degree | 10 (100.0%) | 0 (0.0%) |
| Total | 63 (47.4%) | 70 (52.6%) |
Employment Characteristics in Custer County
Employment by Class of Employer in Custer County
Among the 5,072 employed individuals in Custer County, private company employees (2,796 | 55.1%), self-employed (not incorporated) (727 | 14.3%), and local government employees (530 | 10.4%) make up the most common classes of employment.
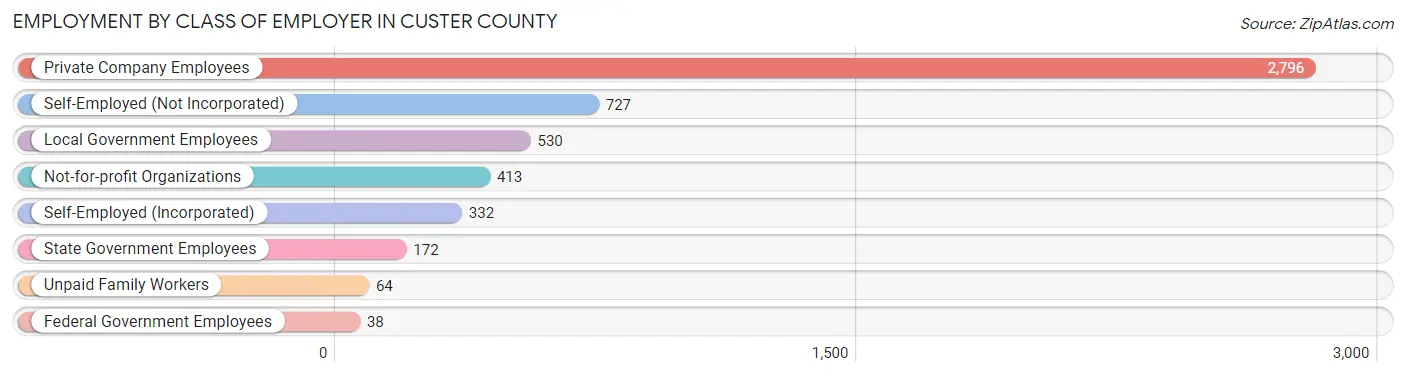
| Employer Class | # Employees | % Employees |
| Private Company Employees | 2,796 | 55.1% |
| Self-Employed (Incorporated) | 332 | 6.6% |
| Self-Employed (Not Incorporated) | 727 | 14.3% |
| Not-for-profit Organizations | 413 | 8.1% |
| Local Government Employees | 530 | 10.4% |
| State Government Employees | 172 | 3.4% |
| Federal Government Employees | 38 | 0.7% |
| Unpaid Family Workers | 64 | 1.3% |
| Total | 5,072 | 100.0% |
Employment Status by Age in Custer County
According to the labor force statistics for Custer County, out of the total population over 16 years of age (8,362), 63.9% or 5,343 individuals are in the labor force, with 1.6% or 85 of them unemployed. The age group with the highest labor force participation rate is 35 to 44 years, with 86.6% or 1,014 individuals in the labor force. Within the labor force, the 60 to 64 years age range has the highest percentage of unemployed individuals, with 5.8% or 31 of them being unemployed.
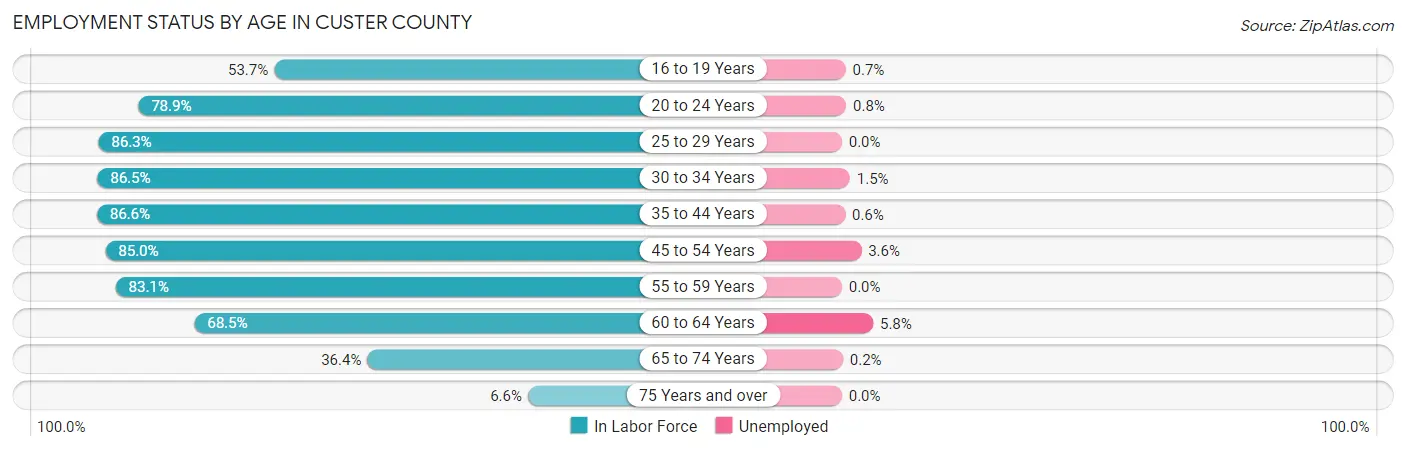
| Age Bracket | In Labor Force | Unemployed |
| 16 to 19 Years | 294 (53.7%) | 2 (0.7%) |
| 20 to 24 Years | 396 (78.9%) | 3 (0.8%) |
| 25 to 29 Years | 517 (86.3%) | 0 (0.0%) |
| 30 to 34 Years | 526 (86.5%) | 8 (1.5%) |
| 35 to 44 Years | 1,014 (86.6%) | 6 (0.6%) |
| 45 to 54 Years | 926 (85.0%) | 33 (3.6%) |
| 55 to 59 Years | 597 (83.1%) | 0 (0.0%) |
| 60 to 64 Years | 539 (68.5%) | 31 (5.8%) |
| 65 to 74 Years | 464 (36.4%) | 1 (0.2%) |
| 75 Years and over | 70 (6.6%) | 0 (0.0%) |
| Total | 5,343 (63.9%) | 85 (1.6%) |
Employment Status by Educational Attainment in Custer County
According to labor force statistics for Custer County, 82.8% of individuals (4,118) out of the total population between 25 and 64 years of age (4,973) are in the labor force, with 1.9% or 78 of them being unemployed. The group with the highest labor force participation rate are those with the educational attainment of bachelor's degree or higher, with 89.3% or 1,261 individuals in the labor force. Within the labor force, individuals with college / associate degree education have the highest percentage of unemployment, with 2.7% or 45 of them being unemployed.
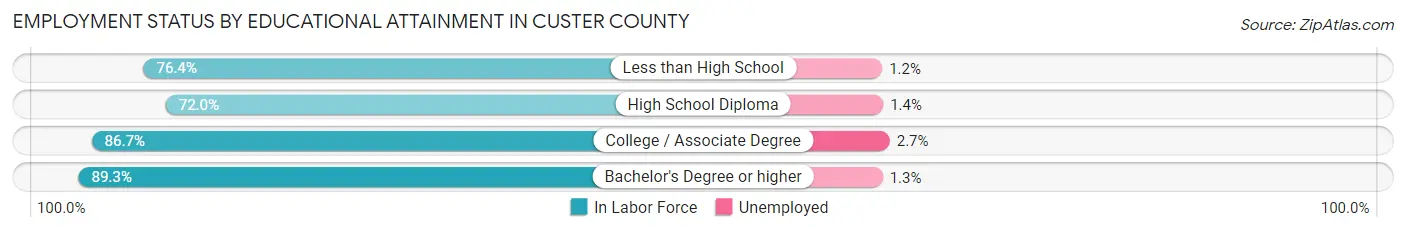
| Educational Attainment | In Labor Force | Unemployed |
| Less than High School | 168 (76.4%) | 3 (1.2%) |
| High School Diploma | 1,007 (72.0%) | 20 (1.4%) |
| College / Associate Degree | 1,685 (86.7%) | 52 (2.7%) |
| Bachelor's Degree or higher | 1,261 (89.3%) | 18 (1.3%) |
| Total | 4,118 (82.8%) | 94 (1.9%) |
Employment Occupations by Sex in Custer County
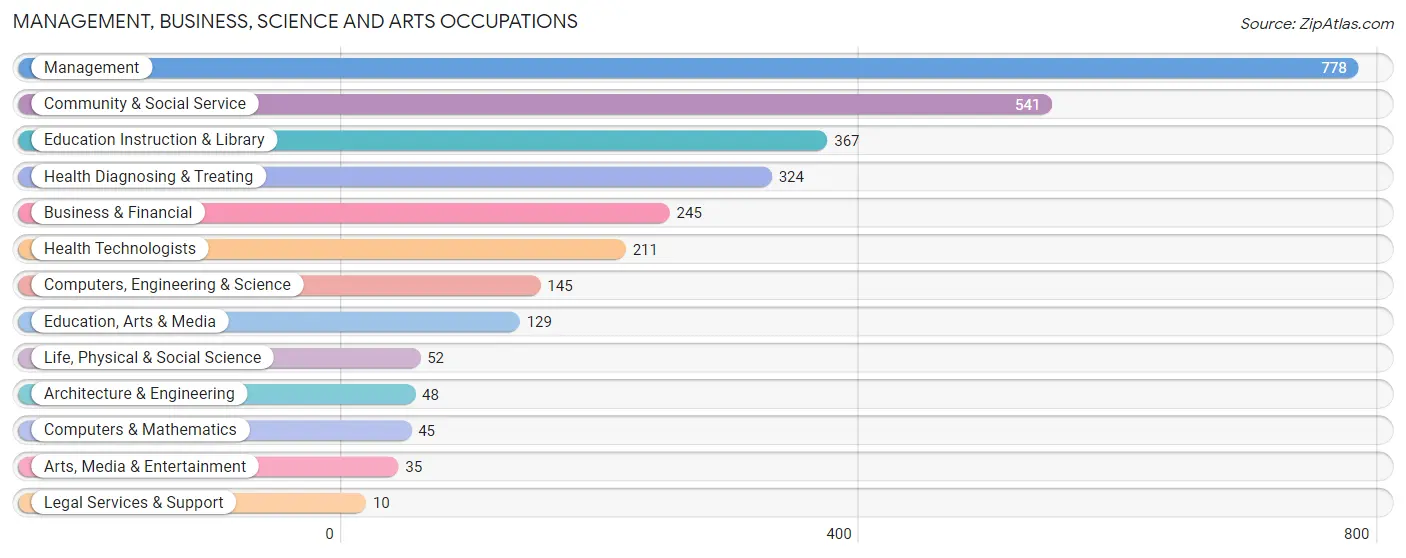
Management, Business, Science and Arts Occupations
The most common Management, Business, Science and Arts occupations in Custer County are Management (778 | 14.8%), Community & Social Service (541 | 10.3%), Education Instruction & Library (367 | 7.0%), Health Diagnosing & Treating (324 | 6.2%), and Business & Financial (245 | 4.7%).
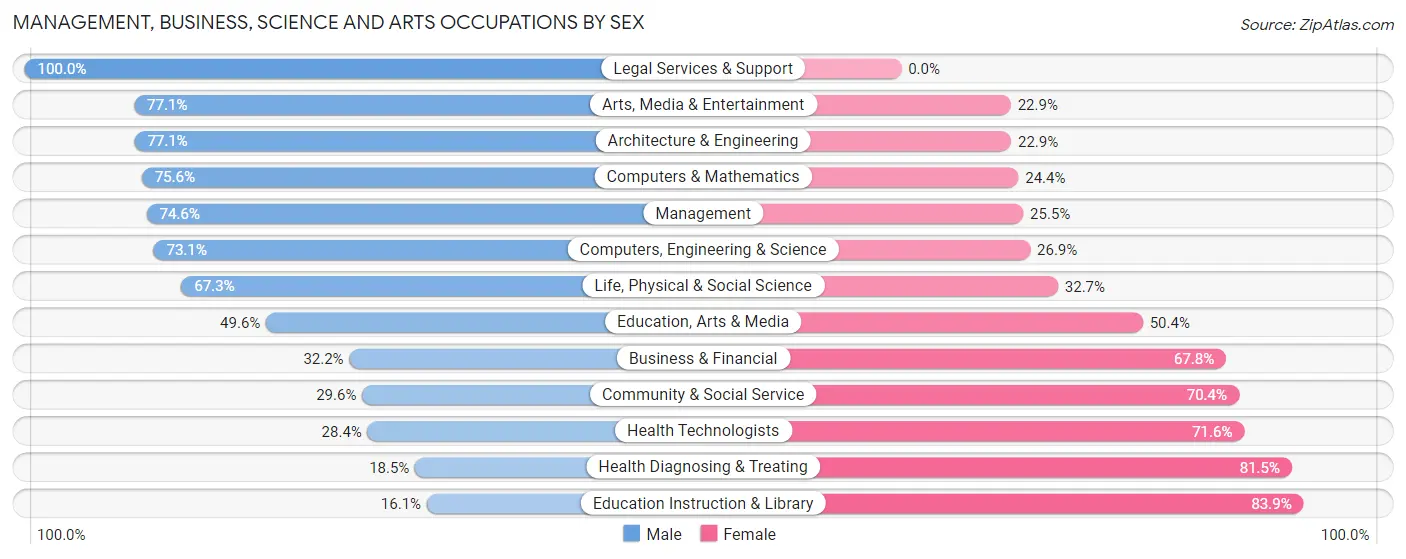
Management, Business, Science and Arts Occupations by Sex
Within the Management, Business, Science and Arts occupations in Custer County, the most male-oriented occupations are Legal Services & Support (100.0%), Arts, Media & Entertainment (77.1%), and Architecture & Engineering (77.1%), while the most female-oriented occupations are Education Instruction & Library (83.9%), Health Diagnosing & Treating (81.5%), and Health Technologists (71.6%).
| Occupation | Male | Female |
| Management | 580 (74.6%) | 198 (25.5%) |
| Business & Financial | 79 (32.2%) | 166 (67.8%) |
| Computers, Engineering & Science | 106 (73.1%) | 39 (26.9%) |
| Computers & Mathematics | 34 (75.6%) | 11 (24.4%) |
| Architecture & Engineering | 37 (77.1%) | 11 (22.9%) |
| Life, Physical & Social Science | 35 (67.3%) | 17 (32.7%) |
| Community & Social Service | 160 (29.6%) | 381 (70.4%) |
| Education, Arts & Media | 64 (49.6%) | 65 (50.4%) |
| Legal Services & Support | 10 (100.0%) | 0 (0.0%) |
| Education Instruction & Library | 59 (16.1%) | 308 (83.9%) |
| Arts, Media & Entertainment | 27 (77.1%) | 8 (22.9%) |
| Health Diagnosing & Treating | 60 (18.5%) | 264 (81.5%) |
| Health Technologists | 60 (28.4%) | 151 (71.6%) |
| Total (Category) | 985 (48.4%) | 1,048 (51.5%) |
| Total (Overall) | 2,866 (54.5%) | 2,395 (45.5%) |
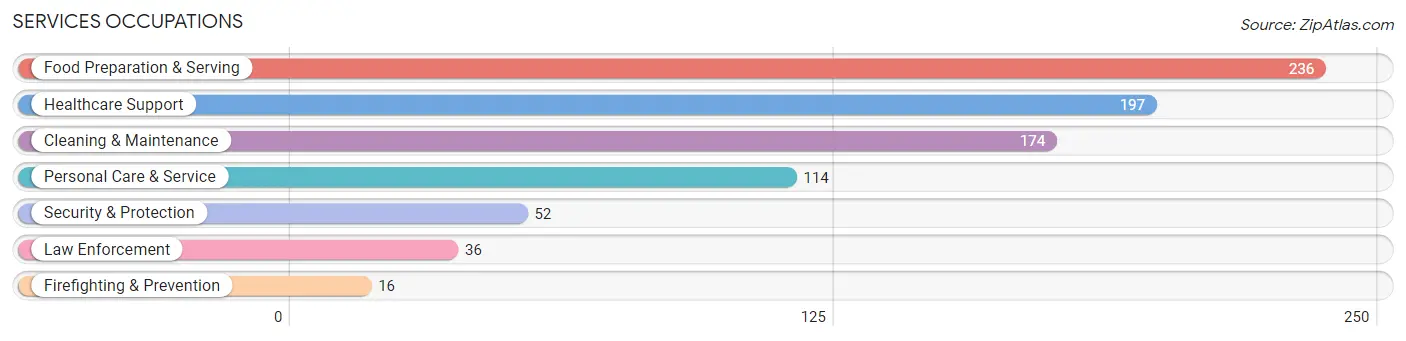
Services Occupations
The most common Services occupations in Custer County are Food Preparation & Serving (236 | 4.5%), Healthcare Support (197 | 3.7%), Cleaning & Maintenance (174 | 3.3%), Personal Care & Service (114 | 2.2%), and Security & Protection (52 | 1.0%).
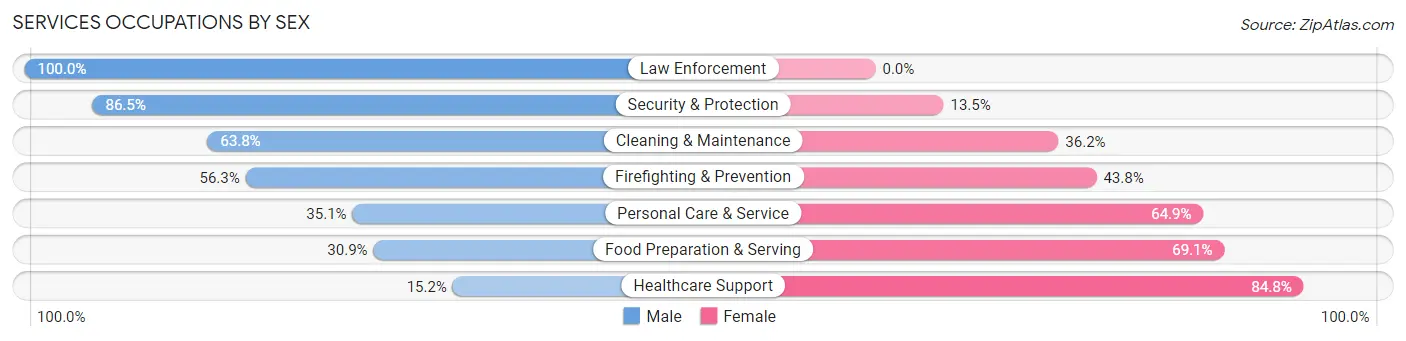
Services Occupations by Sex
Within the Services occupations in Custer County, the most male-oriented occupations are Law Enforcement (100.0%), Security & Protection (86.5%), and Cleaning & Maintenance (63.8%), while the most female-oriented occupations are Healthcare Support (84.8%), Food Preparation & Serving (69.1%), and Personal Care & Service (64.9%).
| Occupation | Male | Female |
| Healthcare Support | 30 (15.2%) | 167 (84.8%) |
| Security & Protection | 45 (86.5%) | 7 (13.5%) |
| Firefighting & Prevention | 9 (56.2%) | 7 (43.8%) |
| Law Enforcement | 36 (100.0%) | 0 (0.0%) |
| Food Preparation & Serving | 73 (30.9%) | 163 (69.1%) |
| Cleaning & Maintenance | 111 (63.8%) | 63 (36.2%) |
| Personal Care & Service | 40 (35.1%) | 74 (64.9%) |
| Total (Category) | 299 (38.7%) | 474 (61.3%) |
| Total (Overall) | 2,866 (54.5%) | 2,395 (45.5%) |
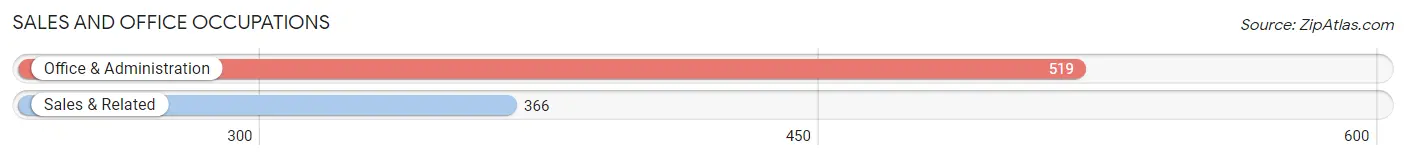
Sales and Office Occupations
The most common Sales and Office occupations in Custer County are Office & Administration (519 | 9.9%), and Sales & Related (366 | 7.0%).
Sales and Office Occupations by Sex

| Occupation | Male | Female |
| Sales & Related | 175 (47.8%) | 191 (52.2%) |
| Office & Administration | 72 (13.9%) | 447 (86.1%) |
| Total (Category) | 247 (27.9%) | 638 (72.1%) |
| Total (Overall) | 2,866 (54.5%) | 2,395 (45.5%) |
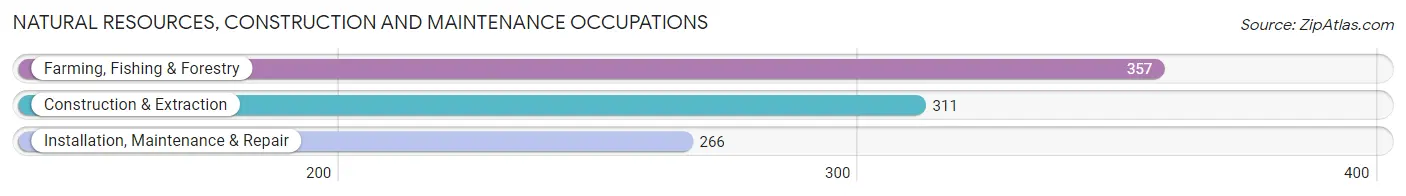
Natural Resources, Construction and Maintenance Occupations
The most common Natural Resources, Construction and Maintenance occupations in Custer County are Farming, Fishing & Forestry (357 | 6.8%), Construction & Extraction (311 | 5.9%), and Installation, Maintenance & Repair (266 | 5.1%).
Natural Resources, Construction and Maintenance Occupations by Sex
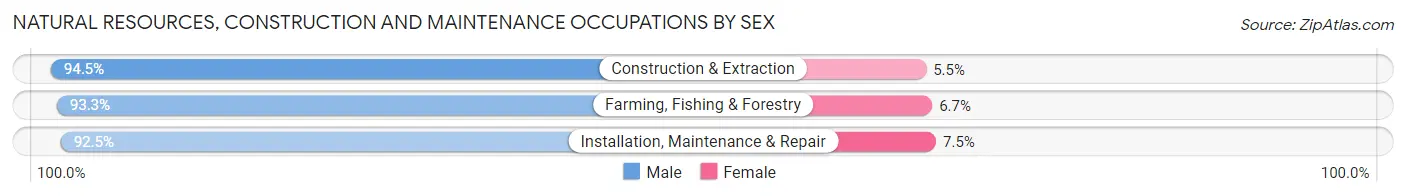
| Occupation | Male | Female |
| Farming, Fishing & Forestry | 333 (93.3%) | 24 (6.7%) |
| Construction & Extraction | 294 (94.5%) | 17 (5.5%) |
| Installation, Maintenance & Repair | 246 (92.5%) | 20 (7.5%) |
| Total (Category) | 873 (93.5%) | 61 (6.5%) |
| Total (Overall) | 2,866 (54.5%) | 2,395 (45.5%) |
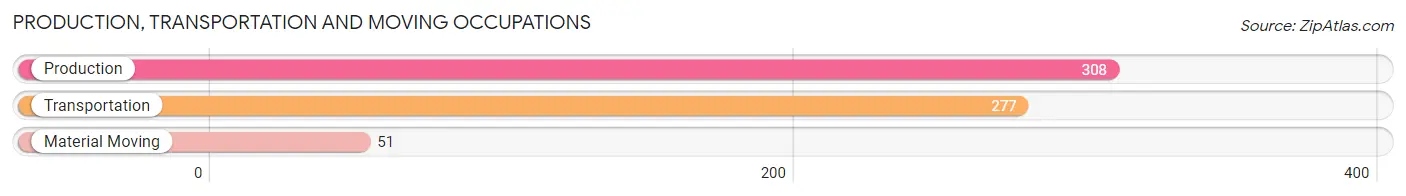
Production, Transportation and Moving Occupations
The most common Production, Transportation and Moving occupations in Custer County are Production (308 | 5.9%), Transportation (277 | 5.3%), and Material Moving (51 | 1.0%).
Production, Transportation and Moving Occupations by Sex
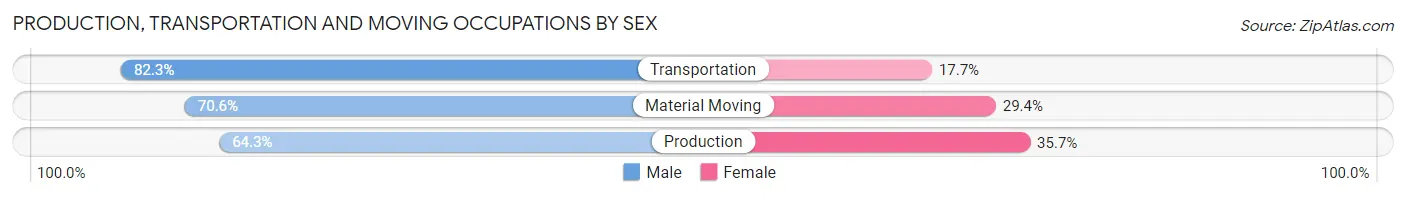
| Occupation | Male | Female |
| Production | 198 (64.3%) | 110 (35.7%) |
| Transportation | 228 (82.3%) | 49 (17.7%) |
| Material Moving | 36 (70.6%) | 15 (29.4%) |
| Total (Category) | 462 (72.6%) | 174 (27.4%) |
| Total (Overall) | 2,866 (54.5%) | 2,395 (45.5%) |
Employment Industries by Sex in Custer County
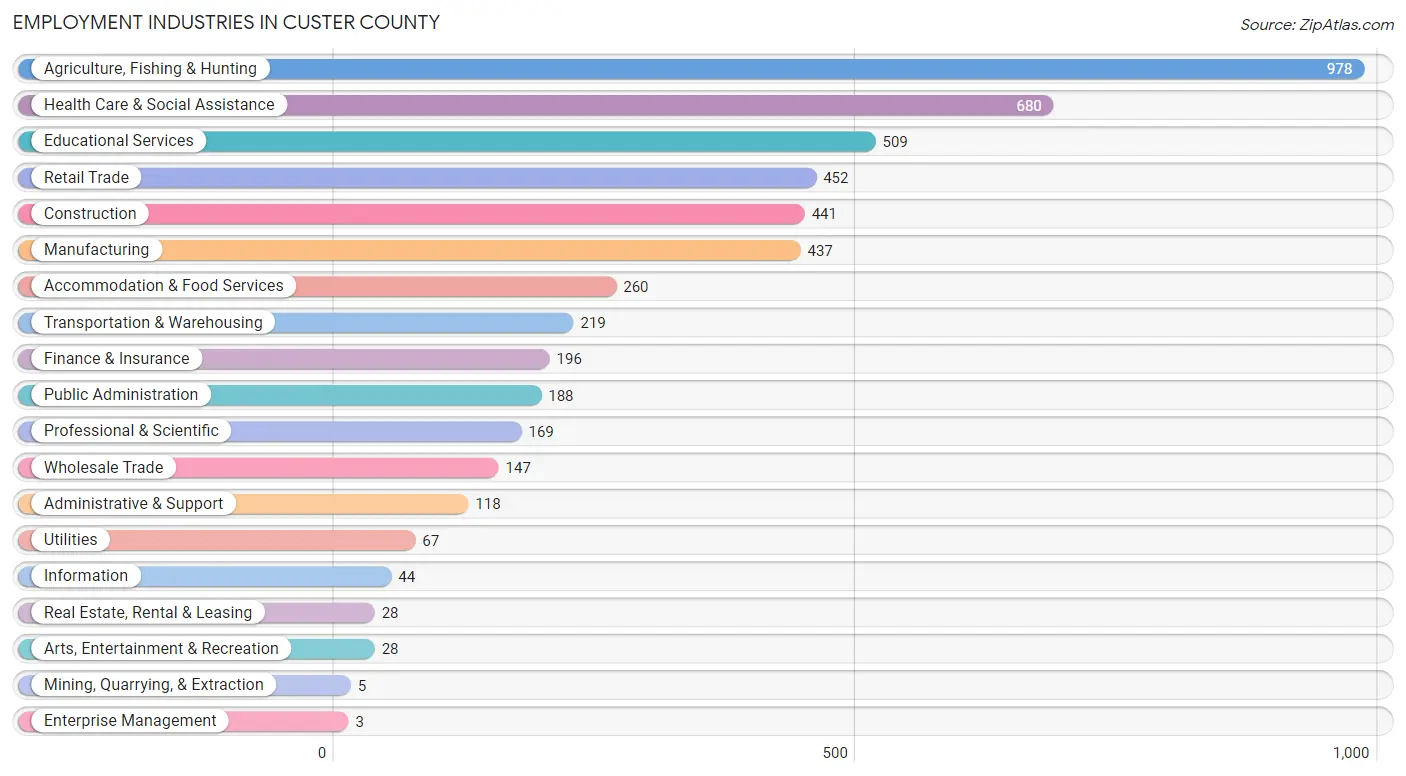
Employment Industries in Custer County
The major employment industries in Custer County include Agriculture, Fishing & Hunting (978 | 18.6%), Health Care & Social Assistance (680 | 12.9%), Educational Services (509 | 9.7%), Retail Trade (452 | 8.6%), and Construction (441 | 8.4%).
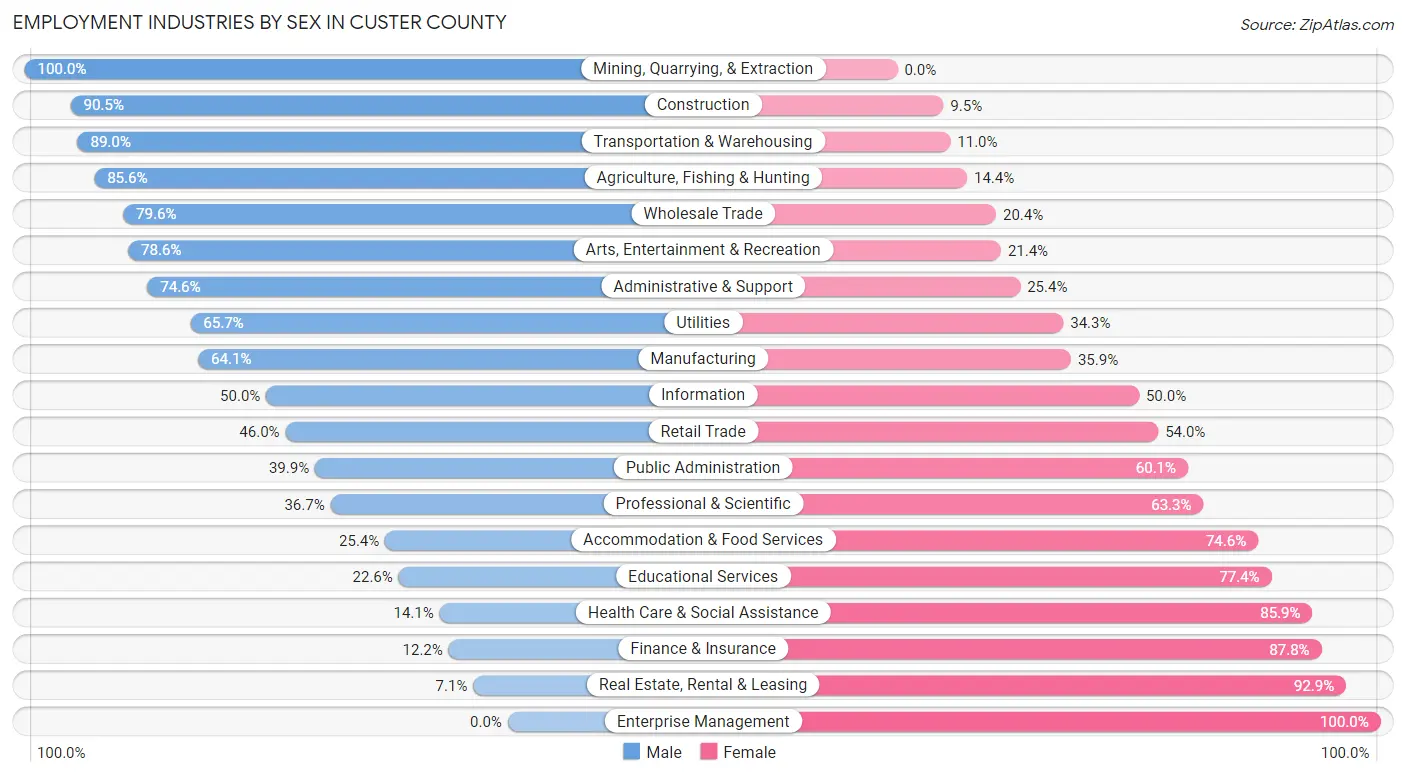
Employment Industries by Sex in Custer County
The Custer County industries that see more men than women are Mining, Quarrying, & Extraction (100.0%), Construction (90.5%), and Transportation & Warehousing (89.0%), whereas the industries that tend to have a higher number of women are Enterprise Management (100.0%), Real Estate, Rental & Leasing (92.9%), and Finance & Insurance (87.8%).
| Industry | Male | Female |
| Agriculture, Fishing & Hunting | 837 (85.6%) | 141 (14.4%) |
| Mining, Quarrying, & Extraction | 5 (100.0%) | 0 (0.0%) |
| Construction | 399 (90.5%) | 42 (9.5%) |
| Manufacturing | 280 (64.1%) | 157 (35.9%) |
| Wholesale Trade | 117 (79.6%) | 30 (20.4%) |
| Retail Trade | 208 (46.0%) | 244 (54.0%) |
| Transportation & Warehousing | 195 (89.0%) | 24 (11.0%) |
| Utilities | 44 (65.7%) | 23 (34.3%) |
| Information | 22 (50.0%) | 22 (50.0%) |
| Finance & Insurance | 24 (12.2%) | 172 (87.8%) |
| Real Estate, Rental & Leasing | 2 (7.1%) | 26 (92.9%) |
| Professional & Scientific | 62 (36.7%) | 107 (63.3%) |
| Enterprise Management | 0 (0.0%) | 3 (100.0%) |
| Administrative & Support | 88 (74.6%) | 30 (25.4%) |
| Educational Services | 115 (22.6%) | 394 (77.4%) |
| Health Care & Social Assistance | 96 (14.1%) | 584 (85.9%) |
| Arts, Entertainment & Recreation | 22 (78.6%) | 6 (21.4%) |
| Accommodation & Food Services | 66 (25.4%) | 194 (74.6%) |
| Public Administration | 75 (39.9%) | 113 (60.1%) |
| Total | 2,866 (54.5%) | 2,395 (45.5%) |
Education in Custer County
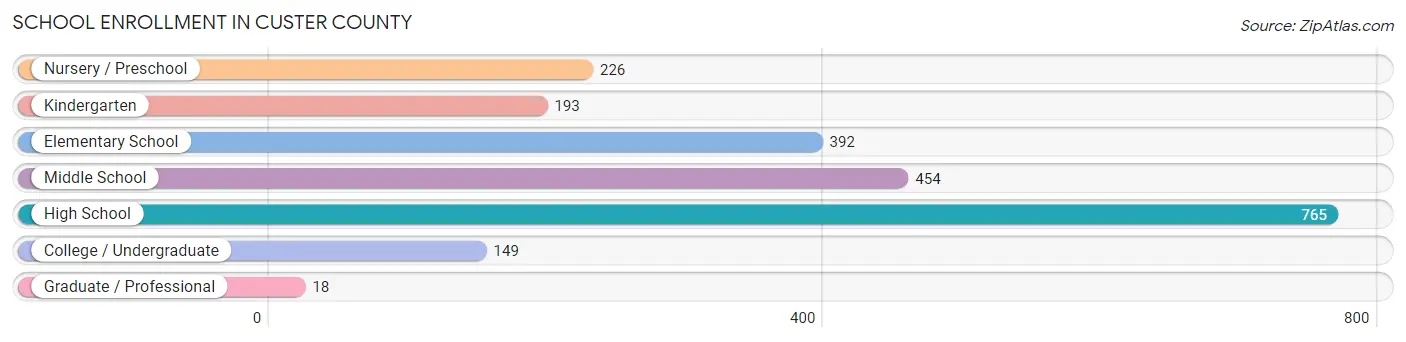
School Enrollment in Custer County
The most common levels of schooling among the 2,197 students in Custer County are high school (765 | 34.8%), middle school (454 | 20.7%), and elementary school (392 | 17.8%).
| School Level | # Students | % Students |
| Nursery / Preschool | 226 | 10.3% |
| Kindergarten | 193 | 8.8% |
| Elementary School | 392 | 17.8% |
| Middle School | 454 | 20.7% |
| High School | 765 | 34.8% |
| College / Undergraduate | 149 | 6.8% |
| Graduate / Professional | 18 | 0.8% |
| Total | 2,197 | 100.0% |
School Enrollment by Age by Funding Source in Custer County
Out of a total of 2,197 students who are enrolled in schools in Custer County, 343 (15.6%) attend a private institution, while the remaining 1,854 (84.4%) are enrolled in public schools. The age group of 20 to 24 year olds has the highest likelihood of being enrolled in private schools, with 32 (33.0% in the age bracket) enrolled. Conversely, the age group of 15 to 17 year olds has the lowest likelihood of being enrolled in a private school, with 405 (97.1% in the age bracket) attending a public institution.
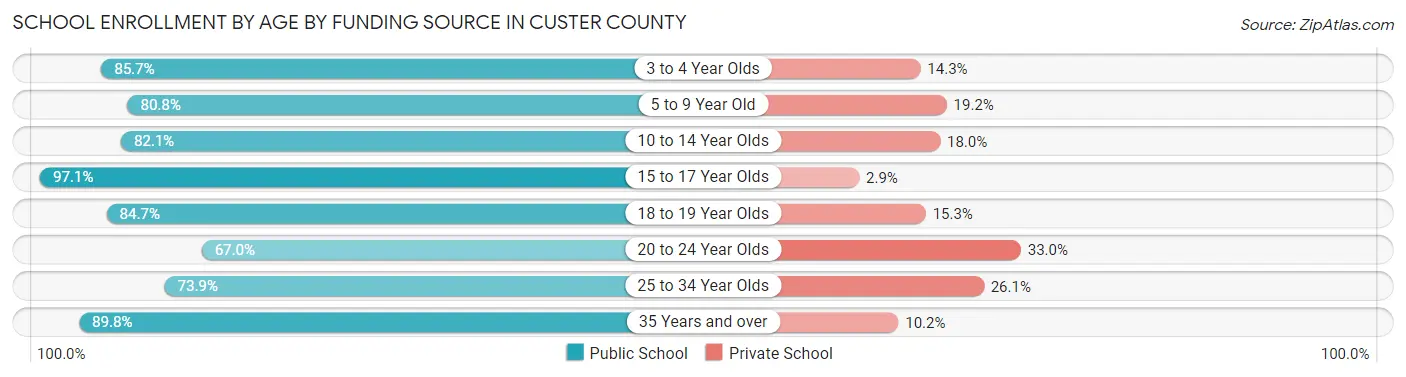
| Age Bracket | Public School | Private School |
| 3 to 4 Year Olds | 102 (85.7%) | 17 (14.3%) |
| 5 to 9 Year Old | 514 (80.8%) | 122 (19.2%) |
| 10 to 14 Year Olds | 576 (82.1%) | 126 (17.9%) |
| 15 to 17 Year Olds | 405 (97.1%) | 12 (2.9%) |
| 18 to 19 Year Olds | 122 (84.7%) | 22 (15.3%) |
| 20 to 24 Year Olds | 65 (67.0%) | 32 (33.0%) |
| 25 to 34 Year Olds | 17 (73.9%) | 6 (26.1%) |
| 35 Years and over | 53 (89.8%) | 6 (10.2%) |
| Total | 1,854 (84.4%) | 343 (15.6%) |
Educational Attainment by Field of Study in Custer County
Education (536 | 26.7%), business (350 | 17.4%), bio, nature & agricultural (278 | 13.9%), science & technology (241 | 12.0%), and arts & humanities (174 | 8.7%) are the most common fields of study among 2,007 individuals in Custer County who have obtained a bachelor's degree or higher.
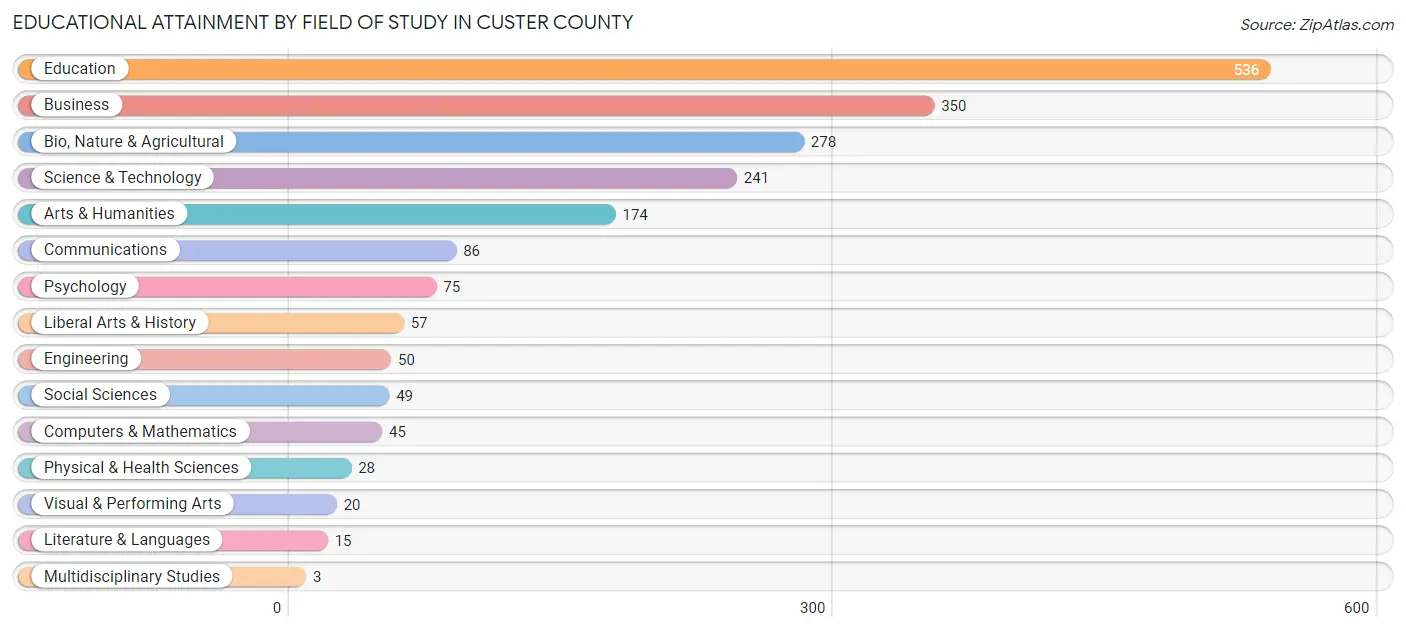
| Field of Study | # Graduates | % Graduates |
| Computers & Mathematics | 45 | 2.2% |
| Bio, Nature & Agricultural | 278 | 13.9% |
| Physical & Health Sciences | 28 | 1.4% |
| Psychology | 75 | 3.7% |
| Social Sciences | 49 | 2.4% |
| Engineering | 50 | 2.5% |
| Multidisciplinary Studies | 3 | 0.2% |
| Science & Technology | 241 | 12.0% |
| Business | 350 | 17.4% |
| Education | 536 | 26.7% |
| Literature & Languages | 15 | 0.7% |
| Liberal Arts & History | 57 | 2.8% |
| Visual & Performing Arts | 20 | 1.0% |
| Communications | 86 | 4.3% |
| Arts & Humanities | 174 | 8.7% |
| Total | 2,007 | 100.0% |
Transportation & Commute in Custer County
Vehicle Availability by Sex in Custer County
The most prevalent vehicle ownership categories in Custer County are males with 3 vehicles (906, accounting for 32.7%) and females with 3 vehicles (767, making up 39.5%).
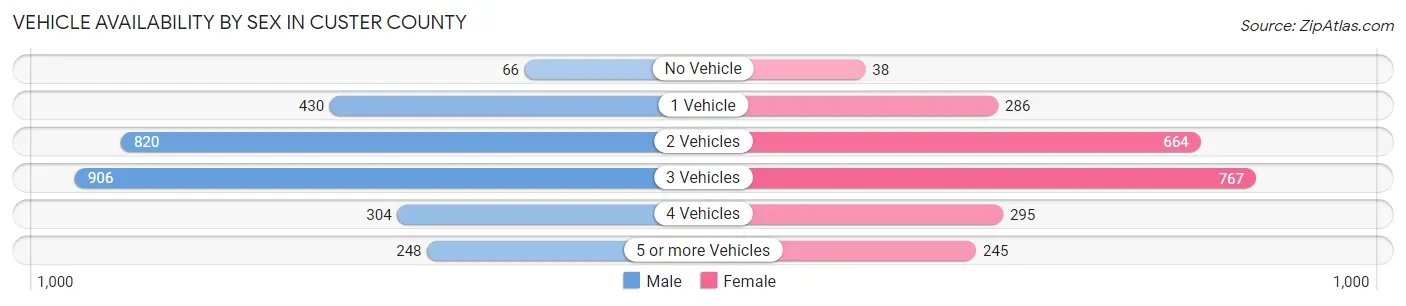
| Vehicles Available | Male | Female |
| No Vehicle | 66 (2.4%) | 38 (1.7%) |
| 1 Vehicle | 430 (15.5%) | 286 (12.5%) |
| 2 Vehicles | 820 (29.6%) | 664 (28.9%) |
| 3 Vehicles | 906 (32.7%) | 767 (33.4%) |
| 4 Vehicles | 304 (11.0%) | 295 (12.9%) |
| 5 or more Vehicles | 248 (8.9%) | 245 (10.7%) |
| Total | 2,774 (100.0%) | 2,295 (100.0%) |
Commute Time in Custer County
The most frequently occuring commute durations in Custer County are 5 to 9 minutes (1,248 commuters, 26.2%), less than 5 minutes (779 commuters, 16.3%), and 10 to 14 minutes (706 commuters, 14.8%).
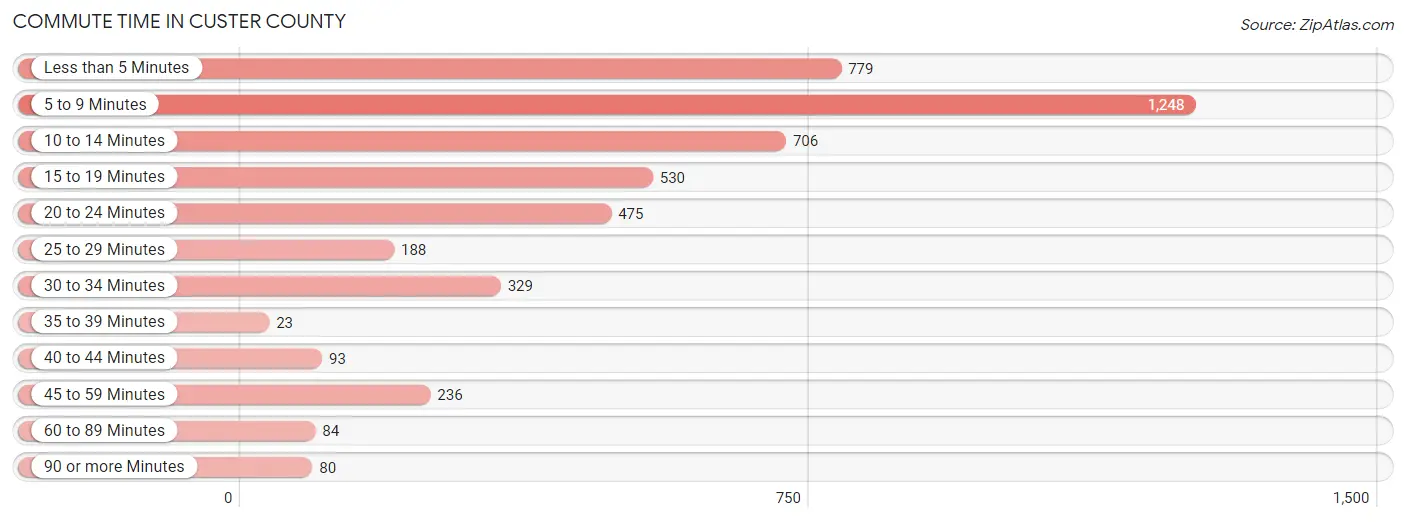
| Commute Time | # Commuters | % Commuters |
| Less than 5 Minutes | 779 | 16.3% |
| 5 to 9 Minutes | 1,248 | 26.2% |
| 10 to 14 Minutes | 706 | 14.8% |
| 15 to 19 Minutes | 530 | 11.1% |
| 20 to 24 Minutes | 475 | 10.0% |
| 25 to 29 Minutes | 188 | 3.9% |
| 30 to 34 Minutes | 329 | 6.9% |
| 35 to 39 Minutes | 23 | 0.5% |
| 40 to 44 Minutes | 93 | 1.9% |
| 45 to 59 Minutes | 236 | 5.0% |
| 60 to 89 Minutes | 84 | 1.8% |
| 90 or more Minutes | 80 | 1.7% |
Commute Time by Sex in Custer County
The most common commute times in Custer County are 5 to 9 minutes (589 commuters, 22.7%) for males and 5 to 9 minutes (659 commuters, 30.3%) for females.
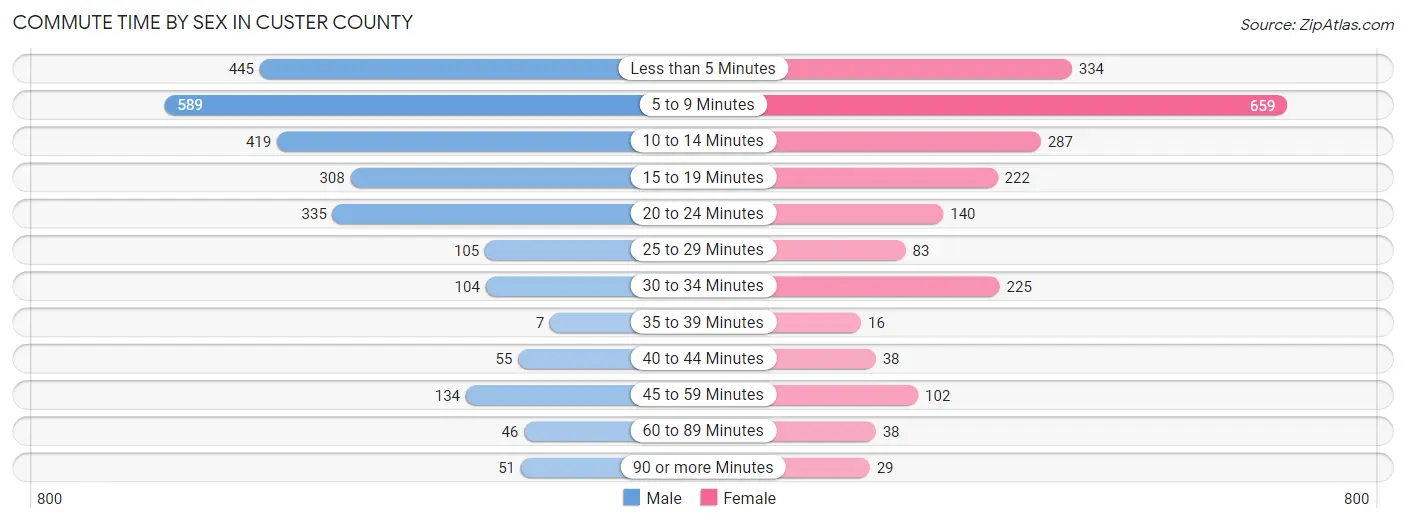
| Commute Time | Male | Female |
| Less than 5 Minutes | 445 (17.1%) | 334 (15.4%) |
| 5 to 9 Minutes | 589 (22.7%) | 659 (30.3%) |
| 10 to 14 Minutes | 419 (16.1%) | 287 (13.2%) |
| 15 to 19 Minutes | 308 (11.9%) | 222 (10.2%) |
| 20 to 24 Minutes | 335 (12.9%) | 140 (6.4%) |
| 25 to 29 Minutes | 105 (4.0%) | 83 (3.8%) |
| 30 to 34 Minutes | 104 (4.0%) | 225 (10.3%) |
| 35 to 39 Minutes | 7 (0.3%) | 16 (0.7%) |
| 40 to 44 Minutes | 55 (2.1%) | 38 (1.8%) |
| 45 to 59 Minutes | 134 (5.2%) | 102 (4.7%) |
| 60 to 89 Minutes | 46 (1.8%) | 38 (1.8%) |
| 90 or more Minutes | 51 (2.0%) | 29 (1.3%) |
Time of Departure to Work by Sex in Custer County
The most frequent times of departure to work in Custer County are 7:00 AM to 7:29 AM (536, 20.6%) for males and 7:30 AM to 7:59 AM (454, 20.9%) for females.
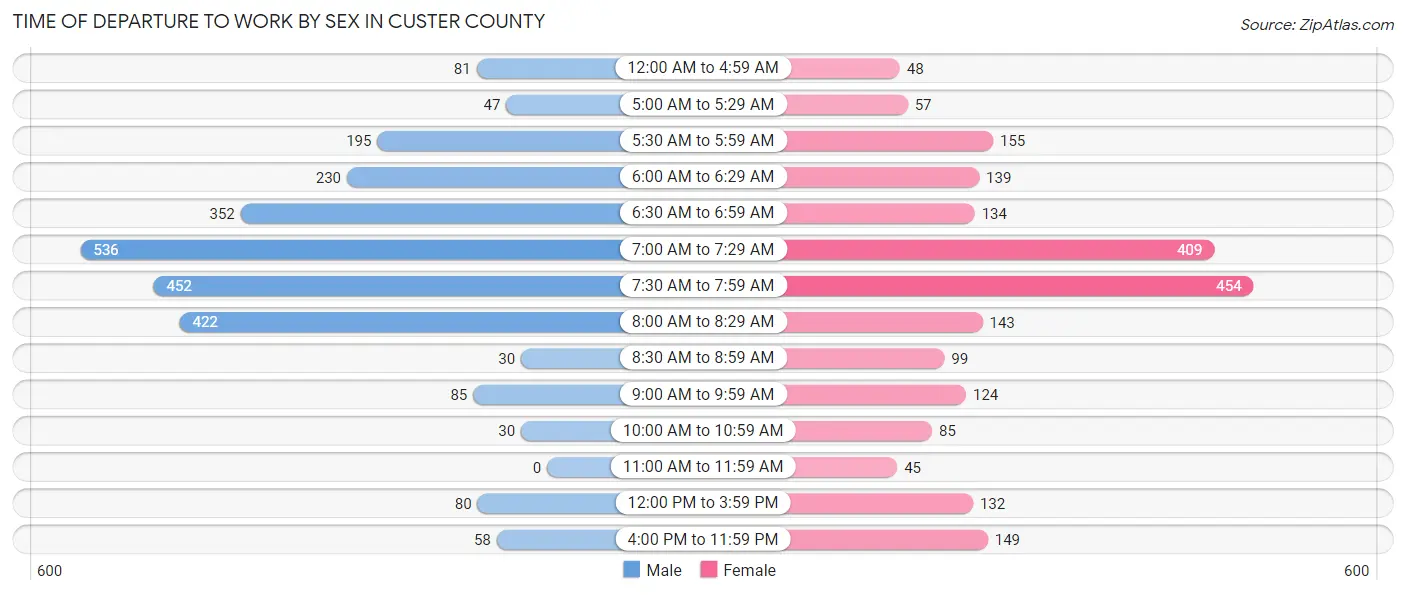
| Time of Departure | Male | Female |
| 12:00 AM to 4:59 AM | 81 (3.1%) | 48 (2.2%) |
| 5:00 AM to 5:29 AM | 47 (1.8%) | 57 (2.6%) |
| 5:30 AM to 5:59 AM | 195 (7.5%) | 155 (7.1%) |
| 6:00 AM to 6:29 AM | 230 (8.8%) | 139 (6.4%) |
| 6:30 AM to 6:59 AM | 352 (13.6%) | 134 (6.2%) |
| 7:00 AM to 7:29 AM | 536 (20.6%) | 409 (18.8%) |
| 7:30 AM to 7:59 AM | 452 (17.4%) | 454 (20.9%) |
| 8:00 AM to 8:29 AM | 422 (16.2%) | 143 (6.6%) |
| 8:30 AM to 8:59 AM | 30 (1.1%) | 99 (4.6%) |
| 9:00 AM to 9:59 AM | 85 (3.3%) | 124 (5.7%) |
| 10:00 AM to 10:59 AM | 30 (1.1%) | 85 (3.9%) |
| 11:00 AM to 11:59 AM | 0 (0.0%) | 45 (2.1%) |
| 12:00 PM to 3:59 PM | 80 (3.1%) | 132 (6.1%) |
| 4:00 PM to 11:59 PM | 58 (2.2%) | 149 (6.9%) |
| Total | 2,598 (100.0%) | 2,173 (100.0%) |
Housing Occupancy in Custer County
Occupancy by Ownership in Custer County
Of the total 4,543 dwellings in Custer County, owner-occupied units account for 3,160 (69.6%), while renter-occupied units make up 1,383 (30.4%).
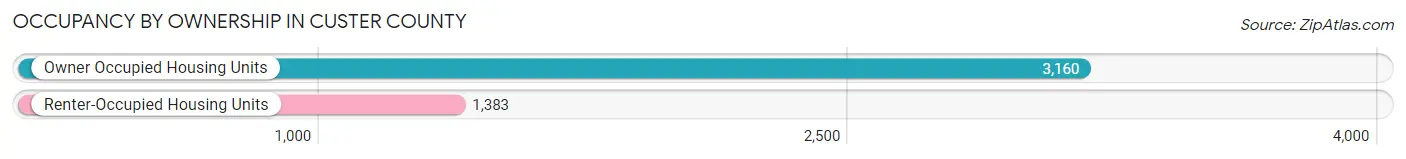
| Occupancy | # Housing Units | % Housing Units |
| Owner Occupied Housing Units | 3,160 | 69.6% |
| Renter-Occupied Housing Units | 1,383 | 30.4% |
| Total Occupied Housing Units | 4,543 | 100.0% |
Occupancy by Household Size in Custer County
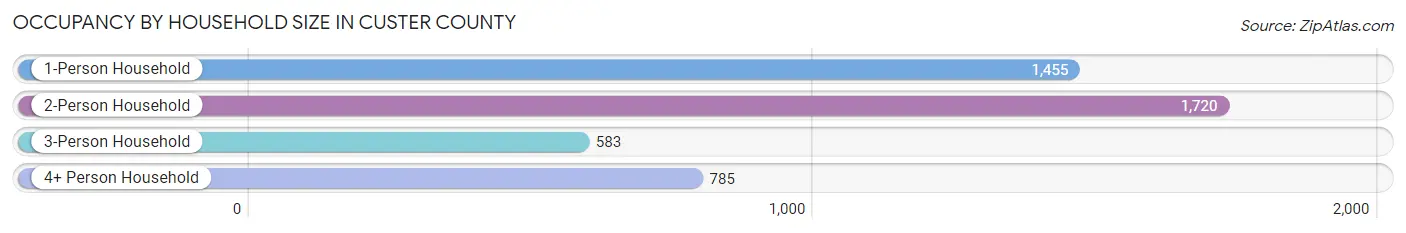
| Household Size | # Housing Units | % Housing Units |
| 1-Person Household | 1,455 | 32.0% |
| 2-Person Household | 1,720 | 37.9% |
| 3-Person Household | 583 | 12.8% |
| 4+ Person Household | 785 | 17.3% |
| Total Housing Units | 4,543 | 100.0% |
Occupancy by Ownership by Household Size in Custer County
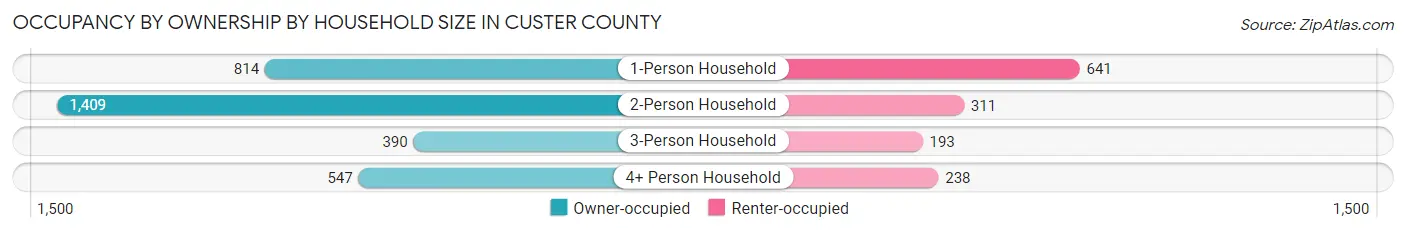
| Household Size | Owner-occupied | Renter-occupied |
| 1-Person Household | 814 (55.9%) | 641 (44.1%) |
| 2-Person Household | 1,409 (81.9%) | 311 (18.1%) |
| 3-Person Household | 390 (66.9%) | 193 (33.1%) |
| 4+ Person Household | 547 (69.7%) | 238 (30.3%) |
| Total Housing Units | 3,160 (69.6%) | 1,383 (30.4%) |
Occupancy by Educational Attainment in Custer County
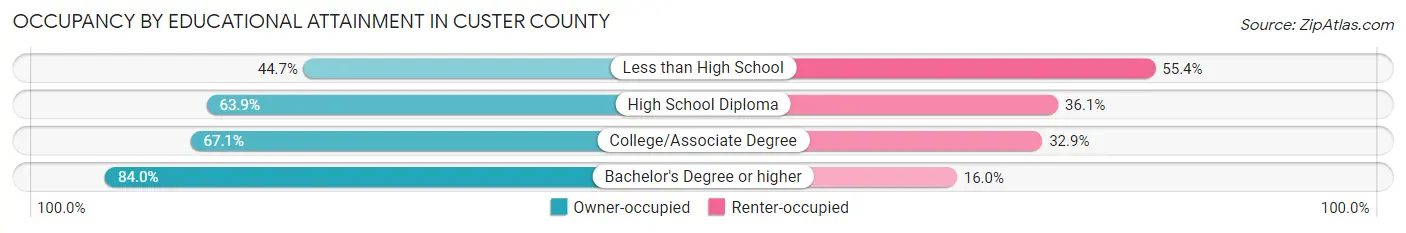
| Household Size | Owner-occupied | Renter-occupied |
| Less than High School | 71 (44.7%) | 88 (55.3%) |
| High School Diploma | 884 (63.9%) | 499 (36.1%) |
| College/Associate Degree | 1,253 (67.1%) | 615 (32.9%) |
| Bachelor's Degree or higher | 952 (84.0%) | 181 (16.0%) |
Occupancy by Age of Householder in Custer County
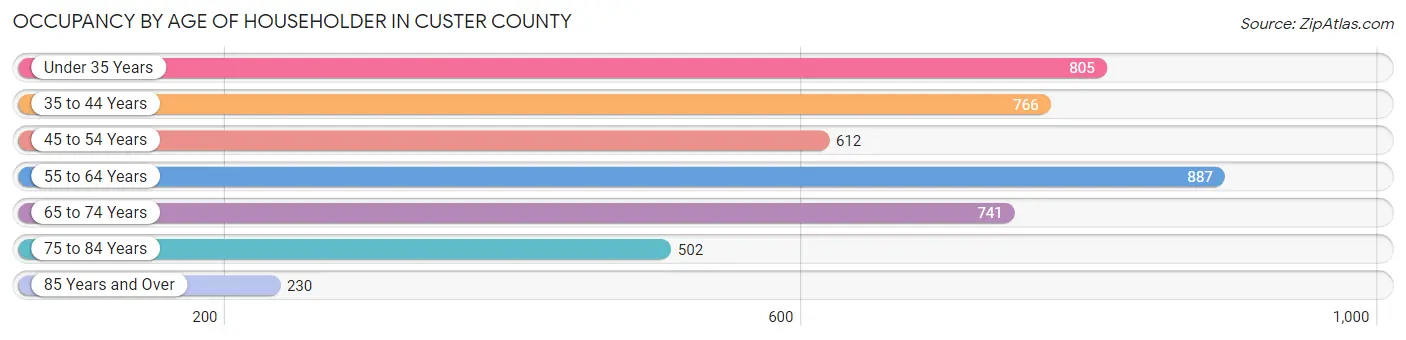
| Age Bracket | # Households | % Households |
| Under 35 Years | 805 | 17.7% |
| 35 to 44 Years | 766 | 16.9% |
| 45 to 54 Years | 612 | 13.5% |
| 55 to 64 Years | 887 | 19.5% |
| 65 to 74 Years | 741 | 16.3% |
| 75 to 84 Years | 502 | 11.1% |
| 85 Years and Over | 230 | 5.1% |
| Total | 4,543 | 100.0% |
Housing Finances in Custer County
Median Income by Occupancy in Custer County
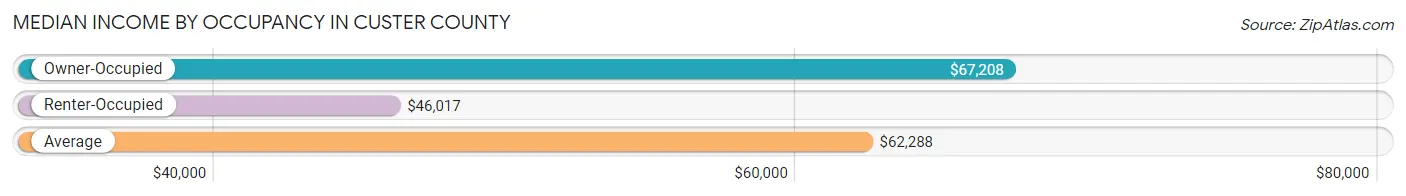
| Occupancy Type | # Households | Median Income |
| Owner-Occupied | 3,160 (69.6%) | $67,208 |
| Renter-Occupied | 1,383 (30.4%) | $46,017 |
| Average | 4,543 (100.0%) | $62,288 |
Occupancy by Householder Income Bracket in Custer County
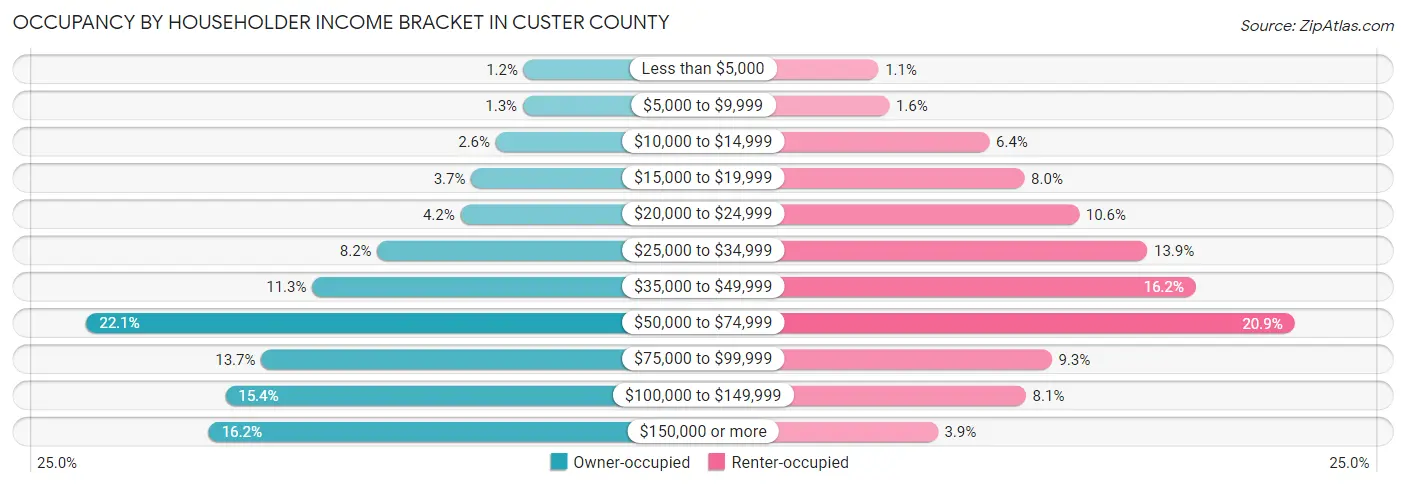
| Income Bracket | Owner-occupied | Renter-occupied |
| Less than $5,000 | 39 (1.2%) | 15 (1.1%) |
| $5,000 to $9,999 | 40 (1.3%) | 22 (1.6%) |
| $10,000 to $14,999 | 81 (2.6%) | 88 (6.4%) |
| $15,000 to $19,999 | 118 (3.7%) | 111 (8.0%) |
| $20,000 to $24,999 | 134 (4.2%) | 147 (10.6%) |
| $25,000 to $34,999 | 259 (8.2%) | 192 (13.9%) |
| $35,000 to $49,999 | 357 (11.3%) | 224 (16.2%) |
| $50,000 to $74,999 | 697 (22.1%) | 289 (20.9%) |
| $75,000 to $99,999 | 434 (13.7%) | 129 (9.3%) |
| $100,000 to $149,999 | 488 (15.4%) | 112 (8.1%) |
| $150,000 or more | 513 (16.2%) | 54 (3.9%) |
| Total | 3,160 (100.0%) | 1,383 (100.0%) |
Monthly Housing Cost Tiers in Custer County
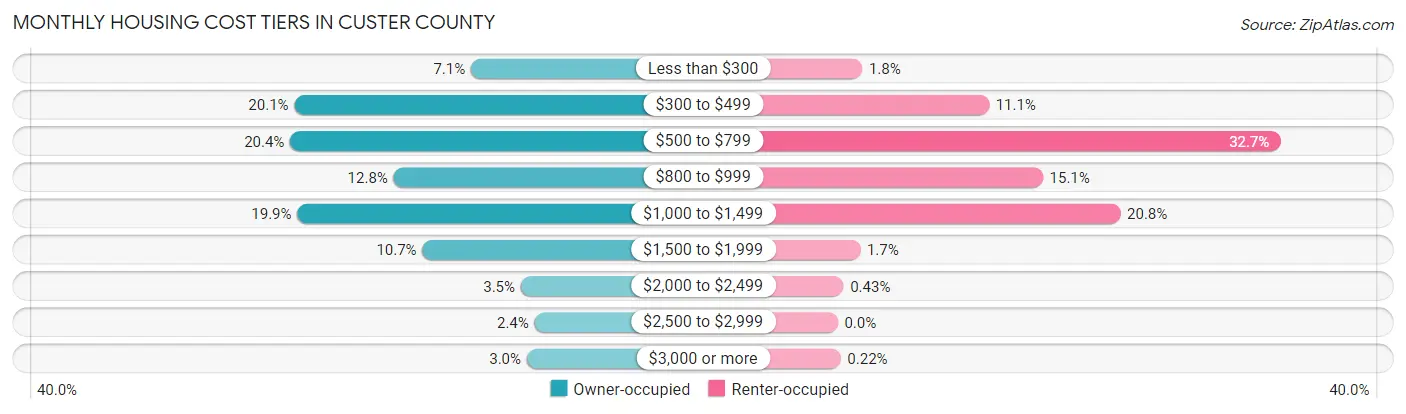
| Monthly Cost | Owner-occupied | Renter-occupied |
| Less than $300 | 225 (7.1%) | 25 (1.8%) |
| $300 to $499 | 636 (20.1%) | 154 (11.1%) |
| $500 to $799 | 646 (20.4%) | 452 (32.7%) |
| $800 to $999 | 405 (12.8%) | 209 (15.1%) |
| $1,000 to $1,499 | 629 (19.9%) | 288 (20.8%) |
| $1,500 to $1,999 | 338 (10.7%) | 23 (1.7%) |
| $2,000 to $2,499 | 109 (3.5%) | 6 (0.4%) |
| $2,500 to $2,999 | 77 (2.4%) | 0 (0.0%) |
| $3,000 or more | 95 (3.0%) | 3 (0.2%) |
| Total | 3,160 (100.0%) | 1,383 (100.0%) |
Physical Housing Characteristics in Custer County
Housing Structures in Custer County
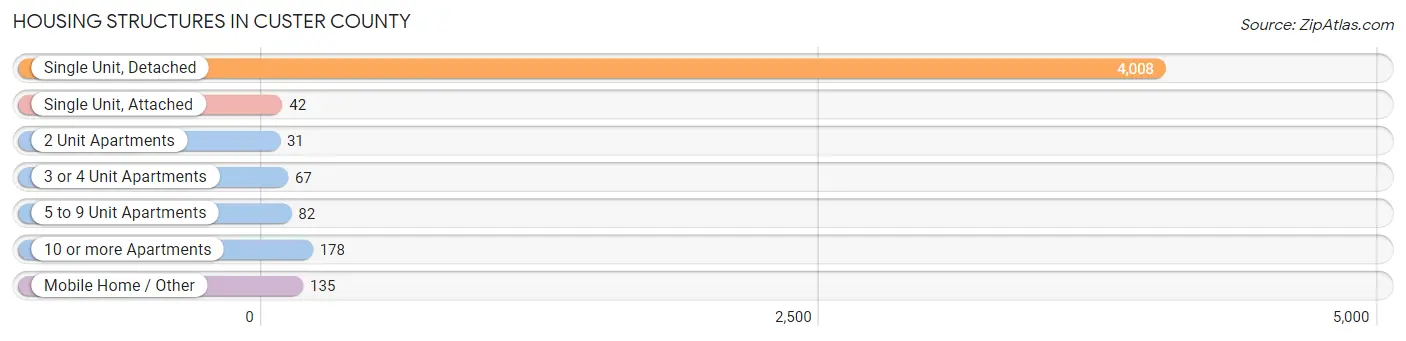
| Structure Type | # Housing Units | % Housing Units |
| Single Unit, Detached | 4,008 | 88.2% |
| Single Unit, Attached | 42 | 0.9% |
| 2 Unit Apartments | 31 | 0.7% |
| 3 or 4 Unit Apartments | 67 | 1.5% |
| 5 to 9 Unit Apartments | 82 | 1.8% |
| 10 or more Apartments | 178 | 3.9% |
| Mobile Home / Other | 135 | 3.0% |
| Total | 4,543 | 100.0% |
Housing Structures by Occupancy in Custer County
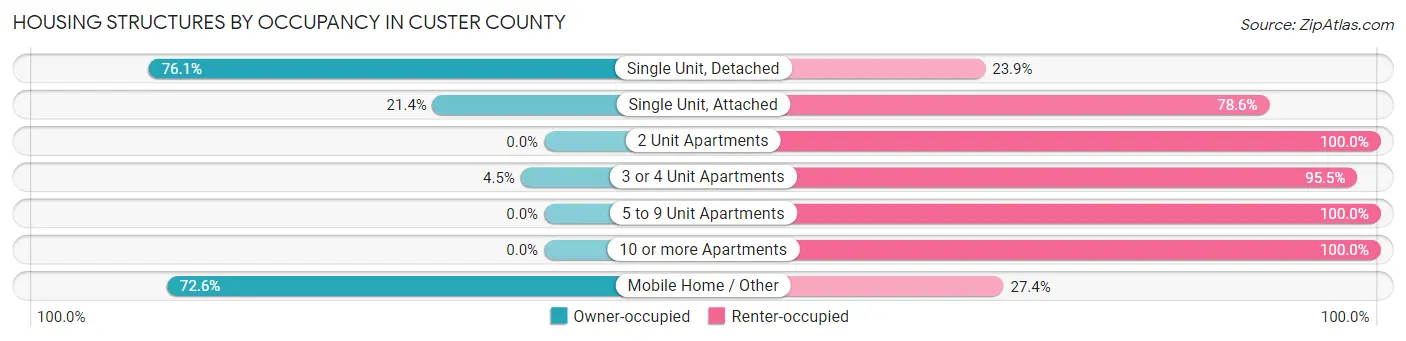
| Structure Type | Owner-occupied | Renter-occupied |
| Single Unit, Detached | 3,050 (76.1%) | 958 (23.9%) |
| Single Unit, Attached | 9 (21.4%) | 33 (78.6%) |
| 2 Unit Apartments | 0 (0.0%) | 31 (100.0%) |
| 3 or 4 Unit Apartments | 3 (4.5%) | 64 (95.5%) |
| 5 to 9 Unit Apartments | 0 (0.0%) | 82 (100.0%) |
| 10 or more Apartments | 0 (0.0%) | 178 (100.0%) |
| Mobile Home / Other | 98 (72.6%) | 37 (27.4%) |
| Total | 3,160 (69.6%) | 1,383 (30.4%) |
Housing Structures by Number of Rooms in Custer County
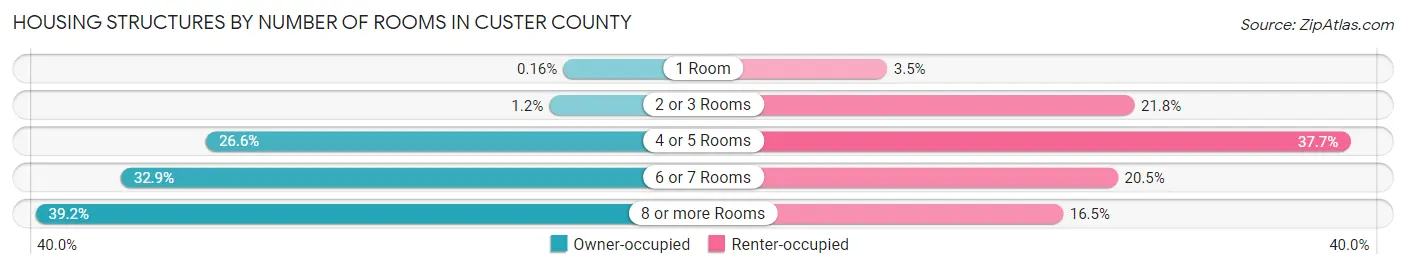
| Number of Rooms | Owner-occupied | Renter-occupied |
| 1 Room | 5 (0.2%) | 48 (3.5%) |
| 2 or 3 Rooms | 38 (1.2%) | 301 (21.8%) |
| 4 or 5 Rooms | 840 (26.6%) | 522 (37.7%) |
| 6 or 7 Rooms | 1,039 (32.9%) | 284 (20.5%) |
| 8 or more Rooms | 1,238 (39.2%) | 228 (16.5%) |
| Total | 3,160 (100.0%) | 1,383 (100.0%) |
Housing Structure by Heating Type in Custer County
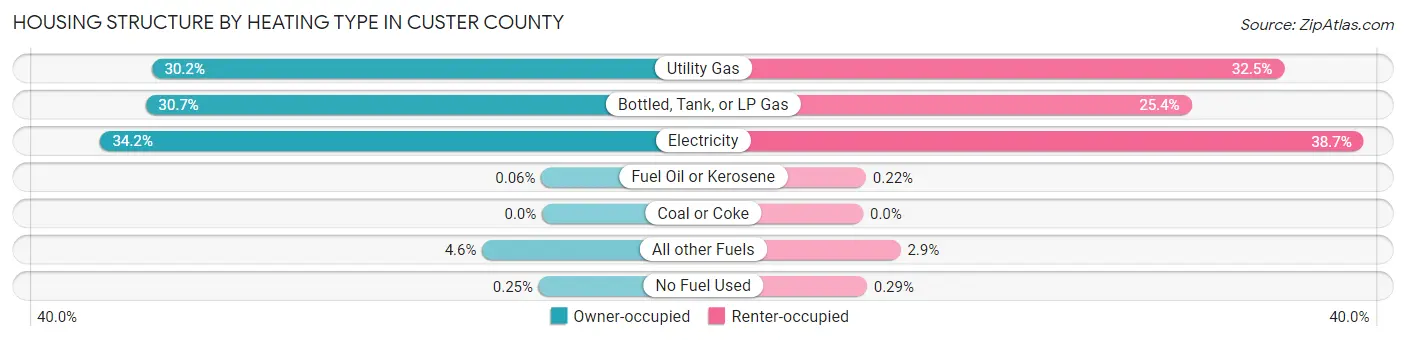
| Heating Type | Owner-occupied | Renter-occupied |
| Utility Gas | 954 (30.2%) | 450 (32.5%) |
| Bottled, Tank, or LP Gas | 969 (30.7%) | 351 (25.4%) |
| Electricity | 1,081 (34.2%) | 535 (38.7%) |
| Fuel Oil or Kerosene | 2 (0.1%) | 3 (0.2%) |
| Coal or Coke | 0 (0.0%) | 0 (0.0%) |
| All other Fuels | 146 (4.6%) | 40 (2.9%) |
| No Fuel Used | 8 (0.3%) | 4 (0.3%) |
| Total | 3,160 (100.0%) | 1,383 (100.0%) |
Household Vehicle Usage in Custer County
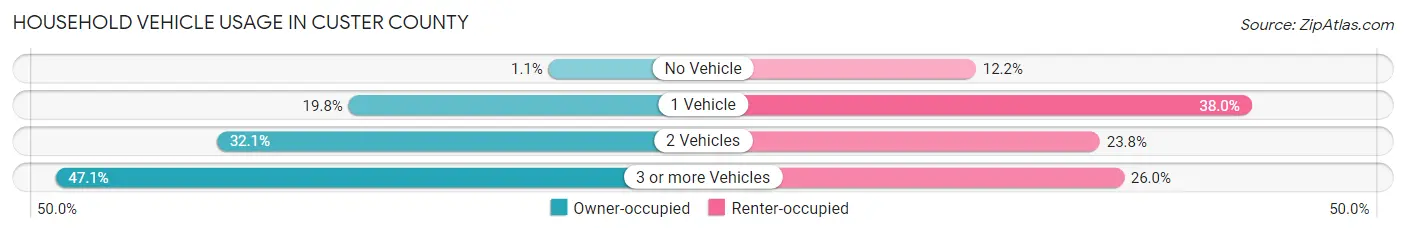
| Vehicles per Household | Owner-occupied | Renter-occupied |
| No Vehicle | 34 (1.1%) | 169 (12.2%) |
| 1 Vehicle | 624 (19.8%) | 525 (38.0%) |
| 2 Vehicles | 1,013 (32.1%) | 329 (23.8%) |
| 3 or more Vehicles | 1,489 (47.1%) | 360 (26.0%) |
| Total | 3,160 (100.0%) | 1,383 (100.0%) |
Real Estate & Mortgages in Custer County
Real Estate and Mortgage Overview in Custer County
| Characteristic | Without Mortgage | With Mortgage |
| Housing Units | 1,751 | 1,409 |
| Median Property Value | $105,600 | $152,200 |
| Median Household Income | $57,750 | $303 |
| Monthly Housing Costs | $521 | $95 |
| Real Estate Taxes | $1,412 | $72 |
Property Value by Mortgage Status in Custer County
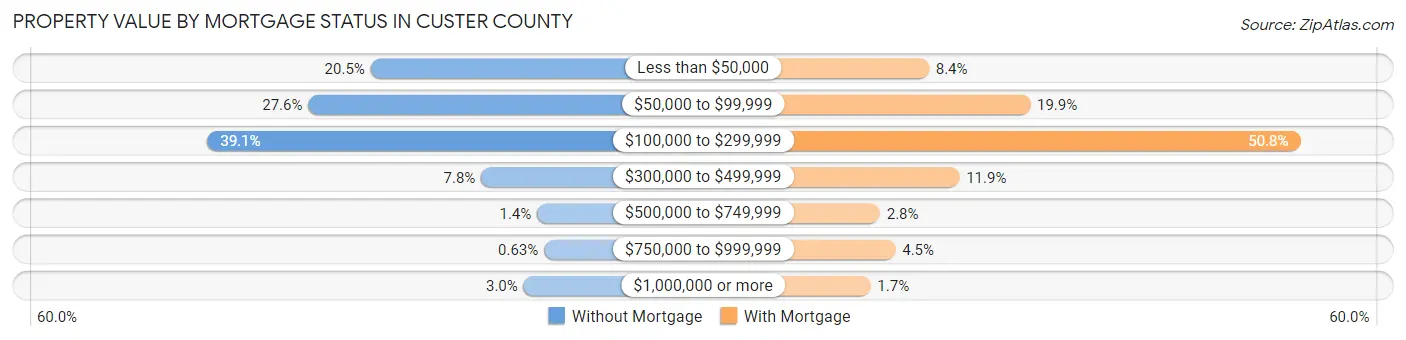
| Property Value | Without Mortgage | With Mortgage |
| Less than $50,000 | 358 (20.4%) | 118 (8.4%) |
| $50,000 to $99,999 | 483 (27.6%) | 281 (19.9%) |
| $100,000 to $299,999 | 685 (39.1%) | 716 (50.8%) |
| $300,000 to $499,999 | 137 (7.8%) | 167 (11.8%) |
| $500,000 to $749,999 | 25 (1.4%) | 39 (2.8%) |
| $750,000 to $999,999 | 11 (0.6%) | 64 (4.5%) |
| $1,000,000 or more | 52 (3.0%) | 24 (1.7%) |
| Total | 1,751 (100.0%) | 1,409 (100.0%) |
Household Income by Mortgage Status in Custer County
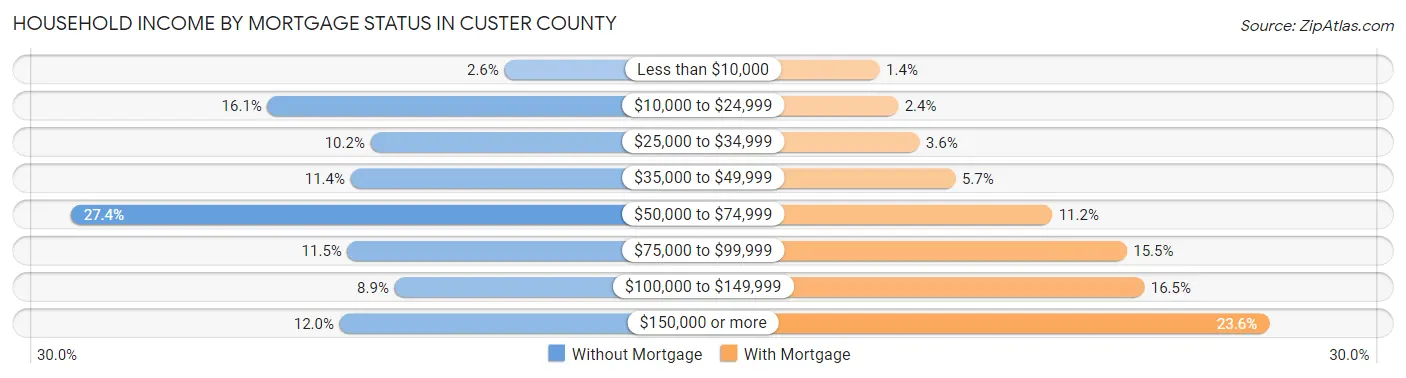
| Household Income | Without Mortgage | With Mortgage |
| Less than $10,000 | 45 (2.6%) | 19 (1.3%) |
| $10,000 to $24,999 | 282 (16.1%) | 34 (2.4%) |
| $25,000 to $34,999 | 179 (10.2%) | 51 (3.6%) |
| $35,000 to $49,999 | 199 (11.4%) | 80 (5.7%) |
| $50,000 to $74,999 | 479 (27.4%) | 158 (11.2%) |
| $75,000 to $99,999 | 202 (11.5%) | 218 (15.5%) |
| $100,000 to $149,999 | 155 (8.8%) | 232 (16.5%) |
| $150,000 or more | 210 (12.0%) | 333 (23.6%) |
| Total | 1,751 (100.0%) | 1,409 (100.0%) |
Property Value to Household Income Ratio in Custer County
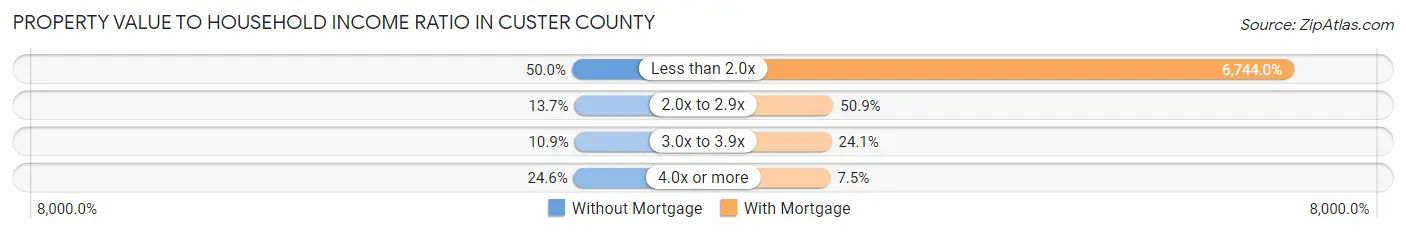
| Value-to-Income Ratio | Without Mortgage | With Mortgage |
| Less than 2.0x | 875 (50.0%) | 95,023 (6,744.0%) |
| 2.0x to 2.9x | 239 (13.7%) | 717 (50.9%) |
| 3.0x to 3.9x | 191 (10.9%) | 340 (24.1%) |
| 4.0x or more | 431 (24.6%) | 105 (7.4%) |
| Total | 1,751 (100.0%) | 1,409 (100.0%) |
Real Estate Taxes by Mortgage Status in Custer County
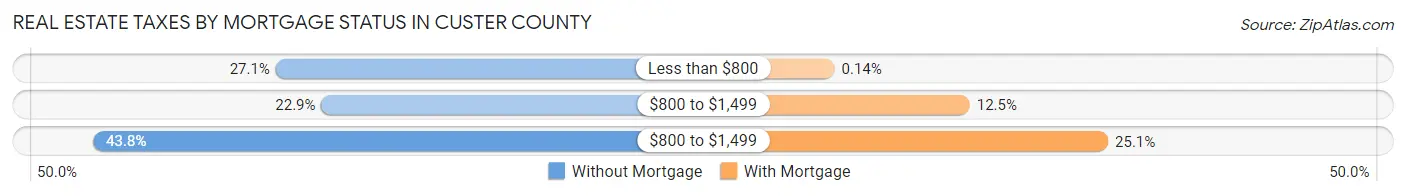
| Property Taxes | Without Mortgage | With Mortgage |
| Less than $800 | 474 (27.1%) | 2 (0.1%) |
| $800 to $1,499 | 401 (22.9%) | 176 (12.5%) |
| $800 to $1,499 | 766 (43.8%) | 354 (25.1%) |
| Total | 1,751 (100.0%) | 1,409 (100.0%) |
Health & Disability in Custer County
Health Insurance Coverage by Age in Custer County
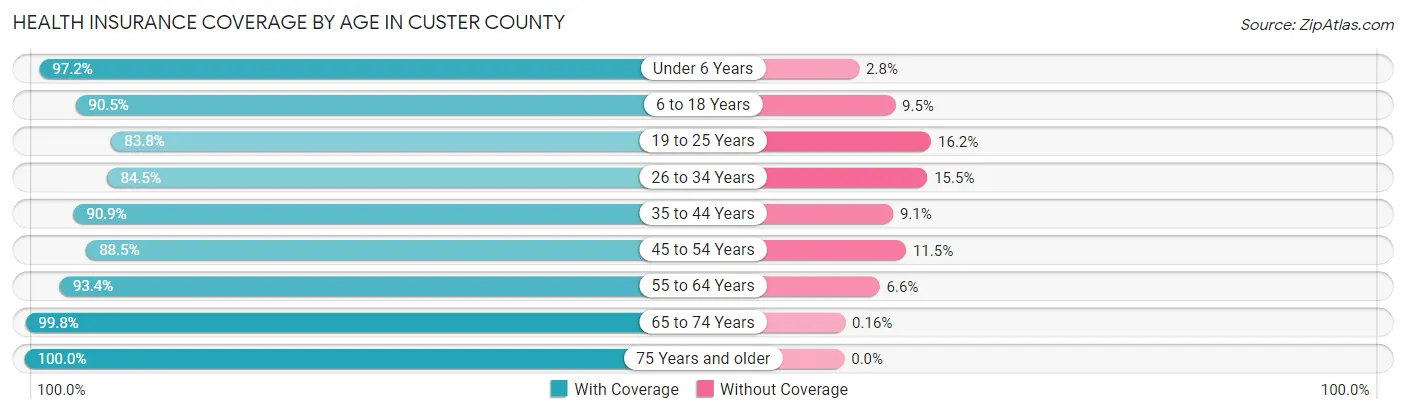
| Age Bracket | With Coverage | Without Coverage |
| Under 6 Years | 841 (97.2%) | 24 (2.8%) |
| 6 to 18 Years | 1,613 (90.5%) | 169 (9.5%) |
| 19 to 25 Years | 611 (83.8%) | 118 (16.2%) |
| 26 to 34 Years | 907 (84.5%) | 166 (15.5%) |
| 35 to 44 Years | 1,062 (90.9%) | 106 (9.1%) |
| 45 to 54 Years | 962 (88.5%) | 125 (11.5%) |
| 55 to 64 Years | 1,405 (93.4%) | 99 (6.6%) |
| 65 to 74 Years | 1,229 (99.8%) | 2 (0.2%) |
| 75 Years and older | 1,018 (100.0%) | 0 (0.0%) |
| Total | 9,648 (92.3%) | 809 (7.7%) |
Health Insurance Coverage by Citizenship Status in Custer County
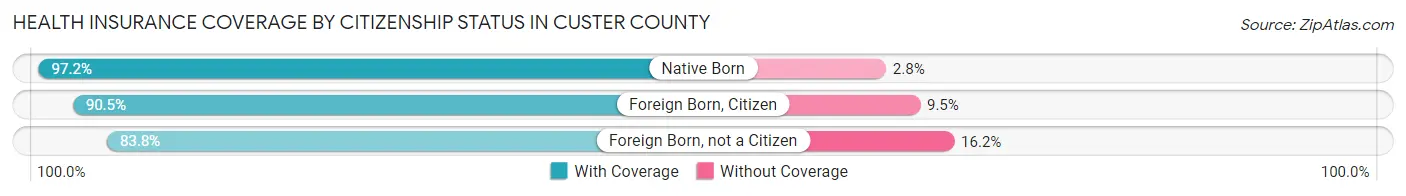
| Citizenship Status | With Coverage | Without Coverage |
| Native Born | 841 (97.2%) | 24 (2.8%) |
| Foreign Born, Citizen | 1,613 (90.5%) | 169 (9.5%) |
| Foreign Born, not a Citizen | 611 (83.8%) | 118 (16.2%) |
Health Insurance Coverage by Household Income in Custer County
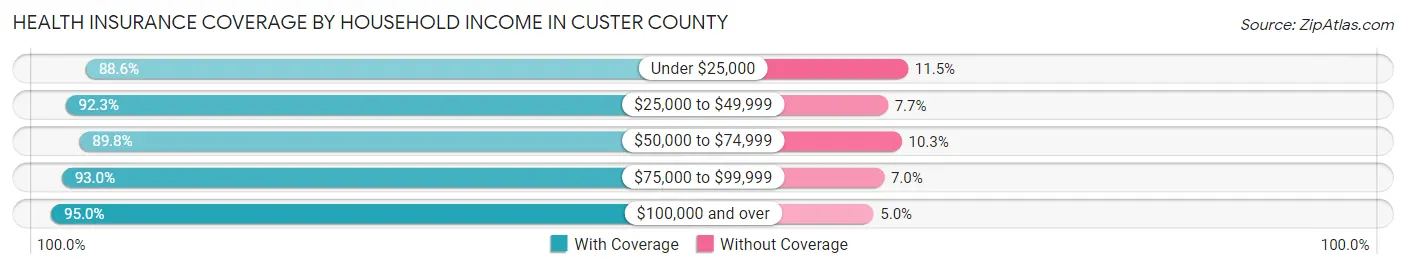
| Household Income | With Coverage | Without Coverage |
| Under $25,000 | 1,075 (88.5%) | 139 (11.5%) |
| $25,000 to $49,999 | 1,878 (92.3%) | 156 (7.7%) |
| $50,000 to $74,999 | 2,083 (89.7%) | 238 (10.2%) |
| $75,000 to $99,999 | 1,551 (93.0%) | 116 (7.0%) |
| $100,000 and over | 3,057 (95.0%) | 160 (5.0%) |
Public vs Private Health Insurance Coverage by Age in Custer County
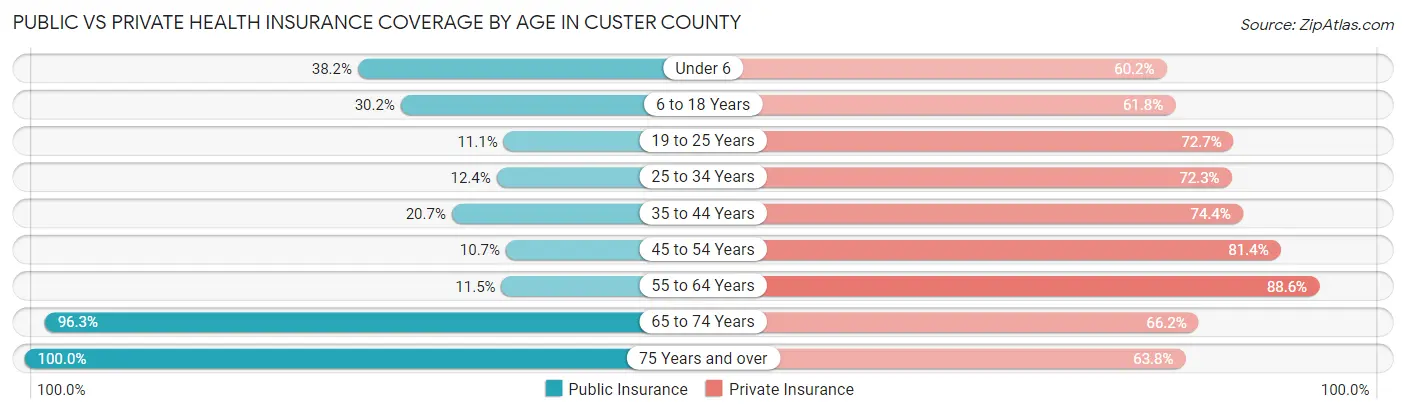
| Age Bracket | Public Insurance | Private Insurance |
| Under 6 | 330 (38.2%) | 521 (60.2%) |
| 6 to 18 Years | 538 (30.2%) | 1,102 (61.8%) |
| 19 to 25 Years | 81 (11.1%) | 530 (72.7%) |
| 25 to 34 Years | 133 (12.4%) | 776 (72.3%) |
| 35 to 44 Years | 242 (20.7%) | 869 (74.4%) |
| 45 to 54 Years | 116 (10.7%) | 885 (81.4%) |
| 55 to 64 Years | 173 (11.5%) | 1,332 (88.6%) |
| 65 to 74 Years | 1,185 (96.3%) | 815 (66.2%) |
| 75 Years and over | 1,018 (100.0%) | 649 (63.7%) |
| Total | 3,816 (36.5%) | 7,479 (71.5%) |
Disability Status by Sex by Age in Custer County
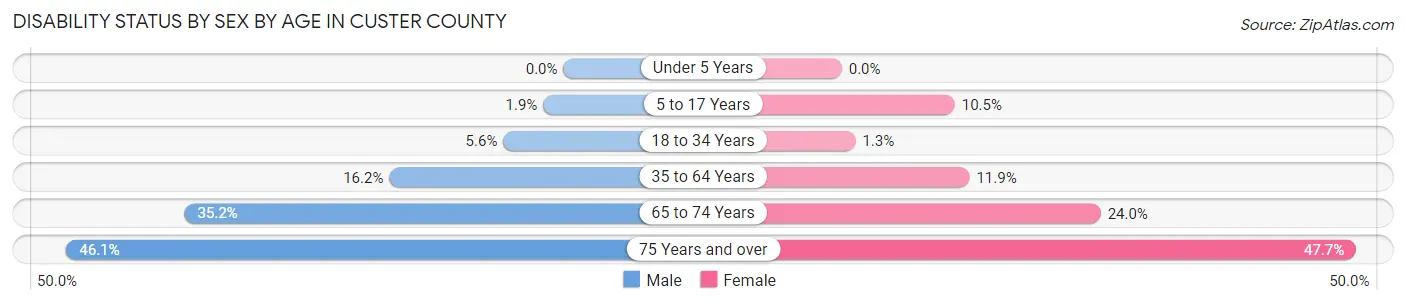
| Age Bracket | Male | Female |
| Under 5 Years | 0 (0.0%) | 0 (0.0%) |
| 5 to 17 Years | 18 (1.9%) | 99 (10.5%) |
| 18 to 34 Years | 54 (5.6%) | 12 (1.3%) |
| 35 to 64 Years | 317 (16.2%) | 213 (11.8%) |
| 65 to 74 Years | 225 (35.2%) | 142 (24.0%) |
| 75 Years and over | 196 (46.1%) | 283 (47.7%) |
Disability Class by Sex by Age in Custer County
Disability Class: Hearing Difficulty
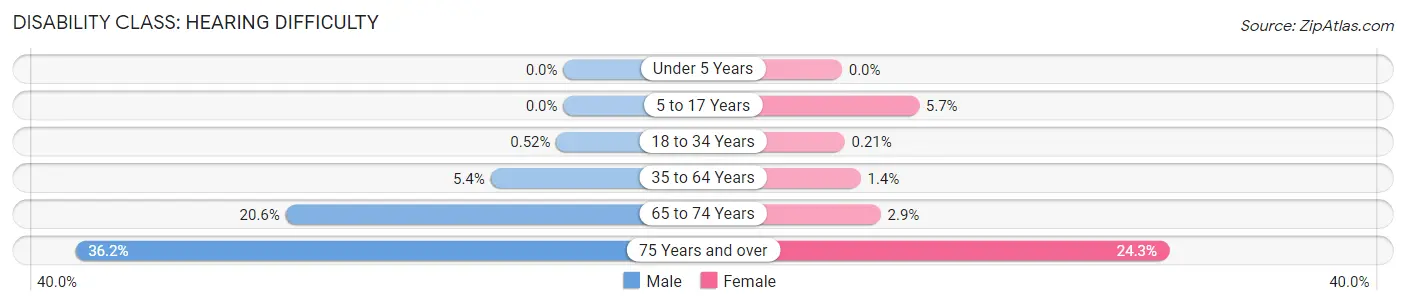
| Age Bracket | Male | Female |
| Under 5 Years | 0 (0.0%) | 0 (0.0%) |
| 5 to 17 Years | 0 (0.0%) | 54 (5.7%) |
| 18 to 34 Years | 5 (0.5%) | 2 (0.2%) |
| 35 to 64 Years | 106 (5.4%) | 25 (1.4%) |
| 65 to 74 Years | 132 (20.6%) | 17 (2.9%) |
| 75 Years and over | 154 (36.2%) | 144 (24.3%) |
Disability Class: Vision Difficulty
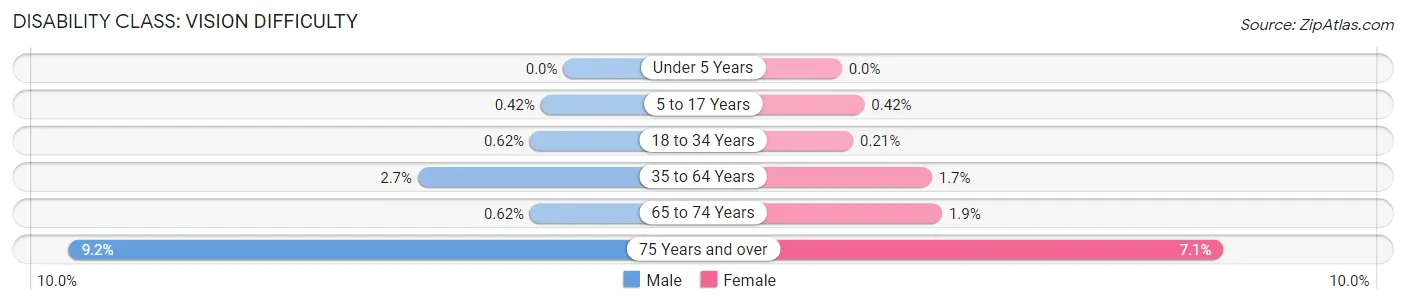
| Age Bracket | Male | Female |
| Under 5 Years | 0 (0.0%) | 0 (0.0%) |
| 5 to 17 Years | 4 (0.4%) | 4 (0.4%) |
| 18 to 34 Years | 6 (0.6%) | 2 (0.2%) |
| 35 to 64 Years | 53 (2.7%) | 30 (1.7%) |
| 65 to 74 Years | 4 (0.6%) | 11 (1.9%) |
| 75 Years and over | 39 (9.2%) | 42 (7.1%) |
Disability Class: Cognitive Difficulty
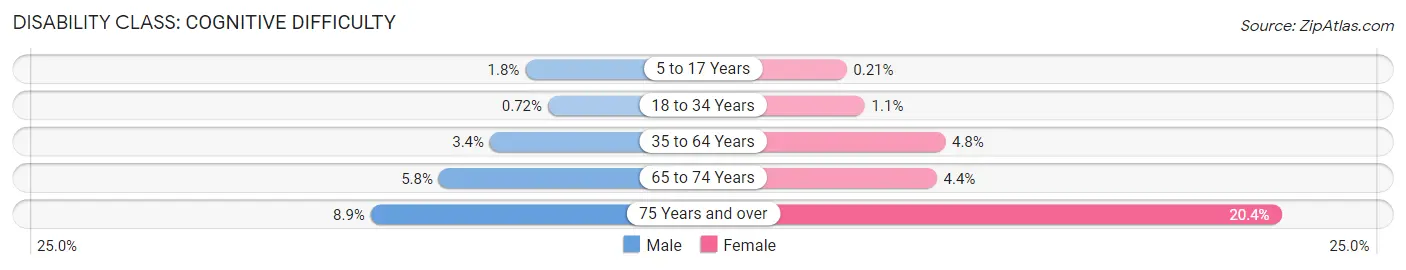
| Age Bracket | Male | Female |
| 5 to 17 Years | 17 (1.8%) | 2 (0.2%) |
| 18 to 34 Years | 7 (0.7%) | 10 (1.1%) |
| 35 to 64 Years | 67 (3.4%) | 86 (4.8%) |
| 65 to 74 Years | 37 (5.8%) | 26 (4.4%) |
| 75 Years and over | 38 (8.9%) | 121 (20.4%) |
Disability Class: Ambulatory Difficulty
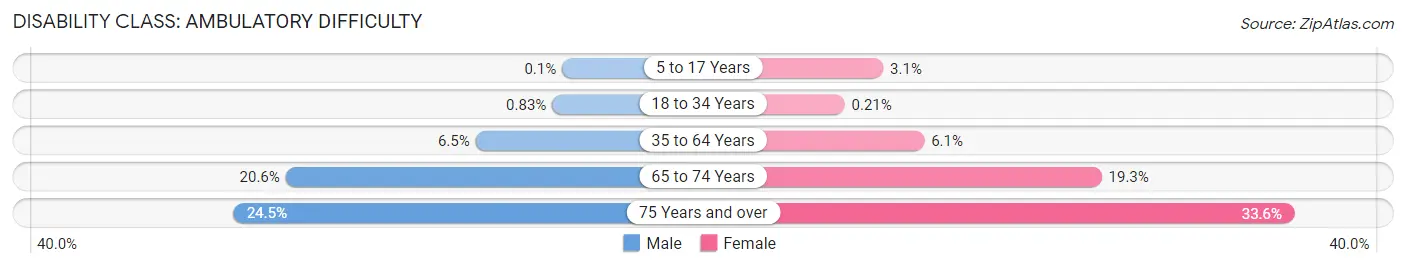
| Age Bracket | Male | Female |
| 5 to 17 Years | 1 (0.1%) | 29 (3.1%) |
| 18 to 34 Years | 8 (0.8%) | 2 (0.2%) |
| 35 to 64 Years | 128 (6.5%) | 110 (6.1%) |
| 65 to 74 Years | 132 (20.6%) | 114 (19.3%) |
| 75 Years and over | 104 (24.5%) | 199 (33.6%) |
Disability Class: Self-Care Difficulty
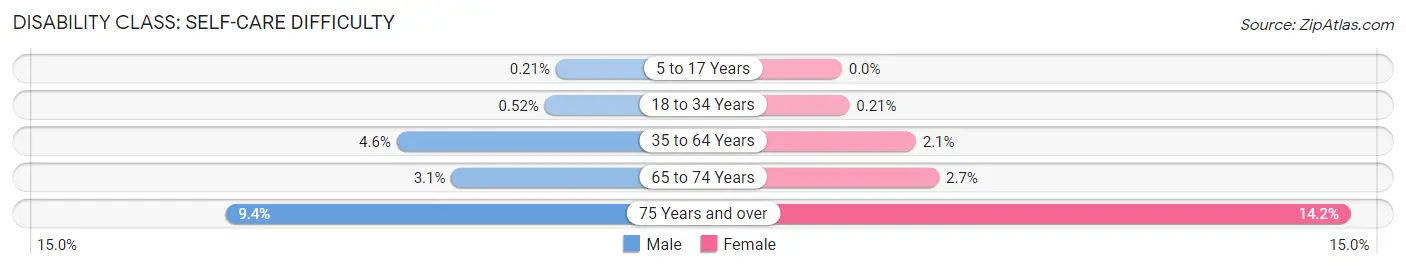
| Age Bracket | Male | Female |
| 5 to 17 Years | 2 (0.2%) | 0 (0.0%) |
| 18 to 34 Years | 5 (0.5%) | 2 (0.2%) |
| 35 to 64 Years | 91 (4.6%) | 37 (2.1%) |
| 65 to 74 Years | 20 (3.1%) | 16 (2.7%) |
| 75 Years and over | 40 (9.4%) | 84 (14.2%) |
Technology Access in Custer County
Computing Device Access in Custer County
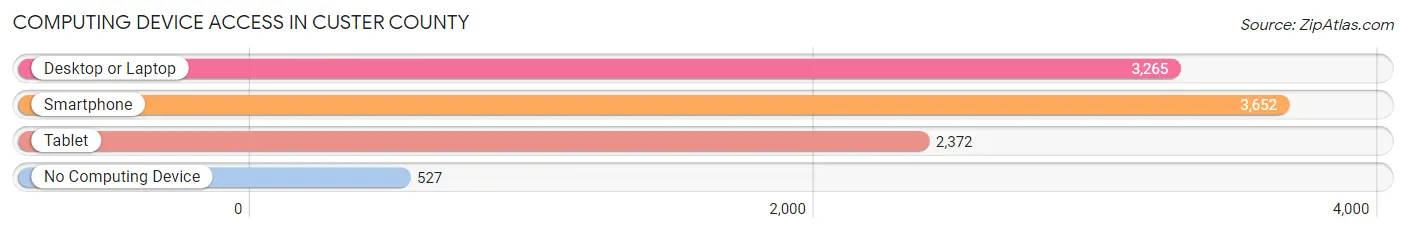
| Device Type | # Households | % Households |
| Desktop or Laptop | 3,265 | 71.9% |
| Smartphone | 3,652 | 80.4% |
| Tablet | 2,372 | 52.2% |
| No Computing Device | 527 | 11.6% |
| Total | 4,543 | 100.0% |
Internet Access in Custer County
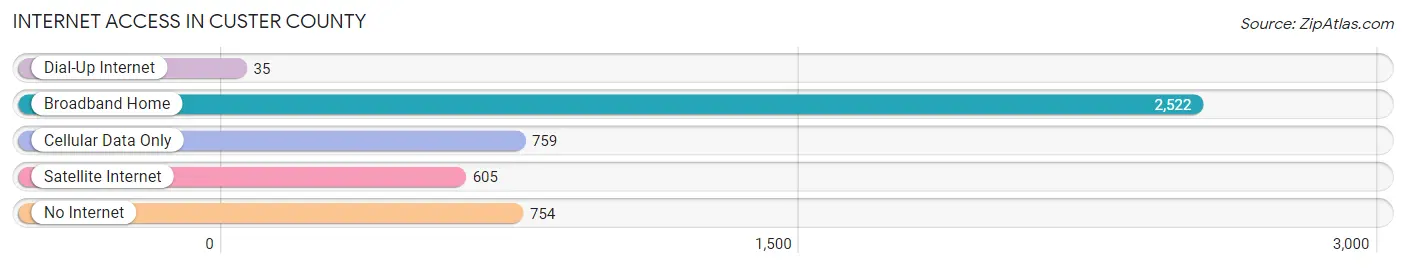
| Internet Type | # Households | % Households |
| Dial-Up Internet | 35 | 0.8% |
| Broadband Home | 2,522 | 55.5% |
| Cellular Data Only | 759 | 16.7% |
| Satellite Internet | 605 | 13.3% |
| No Internet | 754 | 16.6% |
| Total | 4,543 | 100.0% |
Custer County Summary
Custer County is located in the central part of the state of Nebraska, in the Great Plains region of the United States. It is bordered by the counties of Lincoln, Dawson, Buffalo, and Sherman. The county seat is Broken Bow, and the county has a total area of 845 square miles. As of the 2010 census, the population was 10,939.
History
Custer County was established in 1877 and named after General George Armstrong Custer, who was killed at the Battle of Little Bighorn in 1876. The county was originally part of the Nebraska Territory, and was one of the original nine counties established in the state. The county was originally populated by Native American tribes, including the Pawnee, Omaha, and Otoe.
The first settlers in the county were homesteaders, who arrived in the late 1870s and early 1880s. The first town in the county was Anselmo, which was founded in 1881. The county seat, Broken Bow, was founded in 1882.
Geography
Custer County is located in the Great Plains region of the United States. It is bordered by the counties of Lincoln, Dawson, Buffalo, and Sherman. The county has a total area of 845 square miles, of which 844 square miles is land and 1 square mile is water. The county is mostly flat, with rolling hills in the east and south. The county is drained by the Middle Loup River and its tributaries.
The county is home to several state parks and recreation areas, including the Calamus State Recreation Area, the Fort Hartsuff State Historical Park, and the Niobrara State Park.
Economy
The economy of Custer County is largely based on agriculture. The county is home to several large farms, which produce corn, soybeans, wheat, and other crops. Cattle ranching is also an important part of the county's economy.
The county is also home to several manufacturing companies, including a furniture factory, a plastics factory, and a metal fabrication plant. The county is also home to several retail stores, restaurants, and other businesses.
Demographics
As of the 2010 census, the population of Custer County was 10,939. The population was spread out, with 49.3% male and 50.7% female. The median age was 41.7 years.
The racial makeup of the county was 95.2% White, 0.7% African American, 0.5% Native American, 0.3% Asian, 0.1% Pacific Islander, 1.7% from other races, and 1.5% from two or more races. Hispanic or Latino of any race were 4.2% of the population.
The median income for a household in the county was $41,945, and the median income for a family was $50,945. The per capita income for the county was $20,945. About 11.2% of families and 14.2% of the population were below the poverty line, including 19.2% of those under age 18 and 8.2% of those age 65 or over.
Common Questions
What is Per Capita Income in Custer County?
Per Capita income in Custer County is $35,562.
What is the Median Family Income in Custer County?
Median Family Income in Custer County is $73,039.
What is the Median Household income in Custer County?
Median Household Income in Custer County is $62,288.
What is Income or Wage Gap in Custer County?
Income or Wage Gap in Custer County is 33.7%.
Women in Custer County earn 66.3 cents for every dollar earned by a man.
What is Family Income Deficit in Custer County?
Family Income Deficit in Custer County is $12,164.
Families that are below poverty line in Custer County earn $12,164 less on average than the poverty threshold level.
What is Inequality or Gini Index in Custer County?
Inequality or Gini Index in Custer County is 0.45.
What is the Total Population of Custer County?
Total Population of Custer County is 10,566.
What is the Total Male Population of Custer County?
Total Male Population of Custer County is 5,314.
What is the Total Female Population of Custer County?
Total Female Population of Custer County is 5,252.
What is the Ratio of Males per 100 Females in Custer County?
There are 101.18 Males per 100 Females in Custer County.
What is the Ratio of Females per 100 Males in Custer County?
There are 98.83 Females per 100 Males in Custer County.
What is the Median Population Age in Custer County?
Median Population Age in Custer County is 42.1 Years.
What is the Average Family Size in Custer County
Average Family Size in Custer County is 2.9 People.
What is the Average Household Size in Custer County
Average Household Size in Custer County is 2.3 People.
How Large is the Labor Force in Custer County?
There are 5,343 People in the Labor Forcein in Custer County.
What is the Percentage of People in the Labor Force in Custer County?
63.9% of People are in the Labor Force in Custer County.
What is the Unemployment Rate in Custer County?
Unemployment Rate in Custer County is 1.6%.