Cherry County, NE Map & Demographics
Cherry County Overview
$31,424
PER CAPITA INCOME
$69,813
AVG FAMILY INCOME
$62,373
AVG HOUSEHOLD INCOME
31.5%
WAGE / INCOME GAP [ % ]
68.5¢/ $1
WAGE / INCOME GAP [ $ ]
$11,853
FAMILY INCOME DEFICIT
0.41
INEQUALITY / GINI INDEX
5,473
TOTAL POPULATION
2,815
MALE POPULATION
2,658
FEMALE POPULATION
105.91
MALES / 100 FEMALES
94.42
FEMALES / 100 MALES
41.5
MEDIAN AGE
3.0
AVG FAMILY SIZE
2.5
AVG HOUSEHOLD SIZE
2,939
LABOR FORCE [ PEOPLE ]
67.6%
PERCENT IN LABOR FORCE
0.4%
UNEMPLOYMENT RATE
Income in Cherry County
Income Overview in Cherry County
Per Capita Income in Cherry County is $31,424, while median incomes of families and households are $69,813 and $62,373 respectively.
| Characteristic | Number | Measure |
| Per Capita Income | 5,473 | $31,424 |
| Median Family Income | 1,422 | $69,813 |
| Mean Family Income | 1,422 | $91,417 |
| Median Household Income | 2,110 | $62,373 |
| Mean Household Income | 2,110 | $78,414 |
| Income Deficit | 1,422 | $11,853 |
| Wage / Income Gap (%) | 5,473 | 31.50% |
| Wage / Income Gap ($) | 5,473 | 68.50¢ per $1 |
| Gini / Inequality Index | 5,473 | 0.41 |
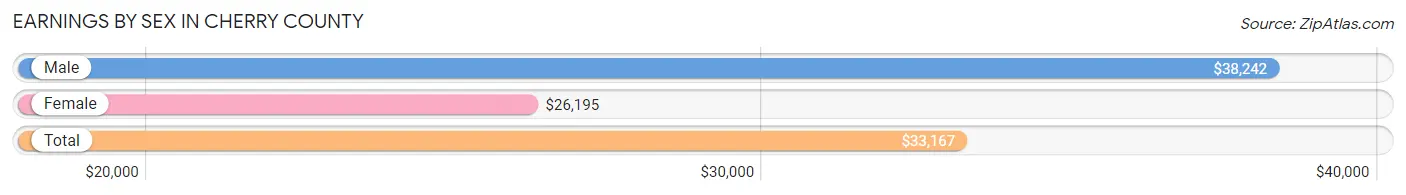
Earnings by Sex in Cherry County
Average Earnings in Cherry County are $33,167, $38,242 for men and $26,195 for women, a difference of 31.5%.
| Sex | Number | Average Earnings |
| Male | 1,798 (55.6%) | $38,242 |
| Female | 1,433 (44.4%) | $26,195 |
| Total | 3,231 (100.0%) | $33,167 |
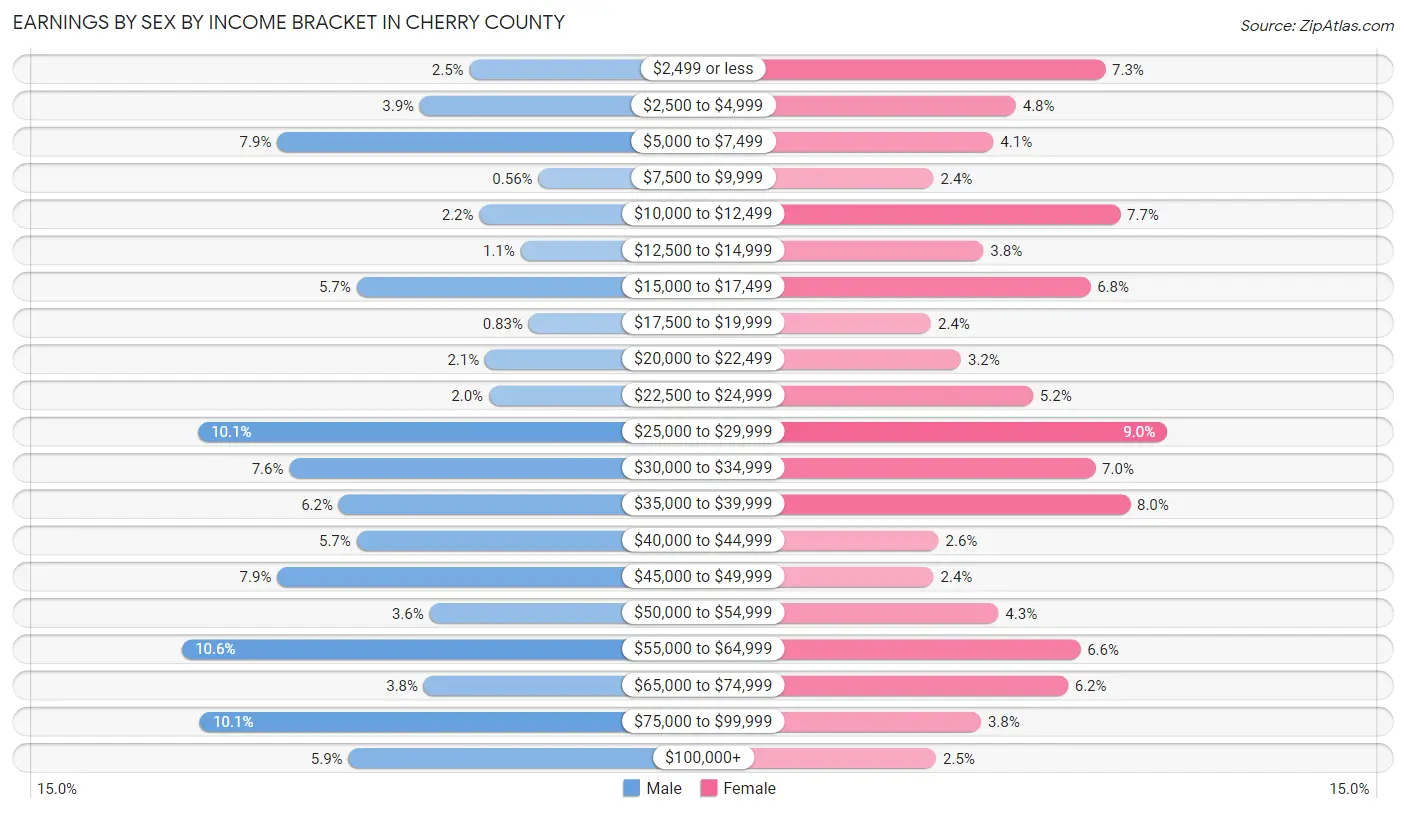
Earnings by Sex by Income Bracket in Cherry County
The most common earnings brackets in Cherry County are $55,000 to $64,999 for men (190 | 10.6%) and $25,000 to $29,999 for women (129 | 9.0%).
| Income | Male | Female |
| $2,499 or less | 45 (2.5%) | 104 (7.3%) |
| $2,500 to $4,999 | 70 (3.9%) | 68 (4.8%) |
| $5,000 to $7,499 | 142 (7.9%) | 59 (4.1%) |
| $7,500 to $9,999 | 10 (0.6%) | 35 (2.4%) |
| $10,000 to $12,499 | 40 (2.2%) | 110 (7.7%) |
| $12,500 to $14,999 | 19 (1.1%) | 55 (3.8%) |
| $15,000 to $17,499 | 102 (5.7%) | 98 (6.8%) |
| $17,500 to $19,999 | 15 (0.8%) | 34 (2.4%) |
| $20,000 to $22,499 | 37 (2.1%) | 46 (3.2%) |
| $22,500 to $24,999 | 35 (1.9%) | 75 (5.2%) |
| $25,000 to $29,999 | 182 (10.1%) | 129 (9.0%) |
| $30,000 to $34,999 | 136 (7.6%) | 100 (7.0%) |
| $35,000 to $39,999 | 111 (6.2%) | 114 (8.0%) |
| $40,000 to $44,999 | 102 (5.7%) | 37 (2.6%) |
| $45,000 to $49,999 | 142 (7.9%) | 35 (2.4%) |
| $50,000 to $54,999 | 65 (3.6%) | 61 (4.3%) |
| $55,000 to $64,999 | 190 (10.6%) | 94 (6.6%) |
| $65,000 to $74,999 | 68 (3.8%) | 89 (6.2%) |
| $75,000 to $99,999 | 181 (10.1%) | 54 (3.8%) |
| $100,000+ | 106 (5.9%) | 36 (2.5%) |
| Total | 1,798 (100.0%) | 1,433 (100.0%) |
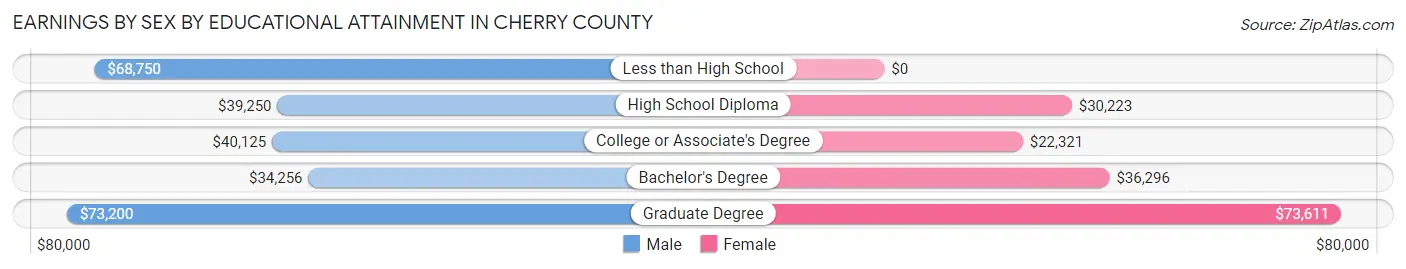
Earnings by Sex by Educational Attainment in Cherry County
Average earnings in Cherry County are $42,188 for men and $29,771 for women, a difference of 29.4%. Men with an educational attainment of graduate degree enjoy the highest average annual earnings of $73,200, while those with bachelor's degree education earn the least with $34,256. Women with an educational attainment of graduate degree earn the most with the average annual earnings of $73,611, while those with college or associate's degree education have the smallest earnings of $22,321.
| Educational Attainment | Male Income | Female Income |
| Less than High School | $68,750 | $0 |
| High School Diploma | $39,250 | $30,223 |
| College or Associate's Degree | $40,125 | $22,321 |
| Bachelor's Degree | $34,256 | $36,296 |
| Graduate Degree | $73,200 | $73,611 |
| Total | $42,188 | $29,771 |
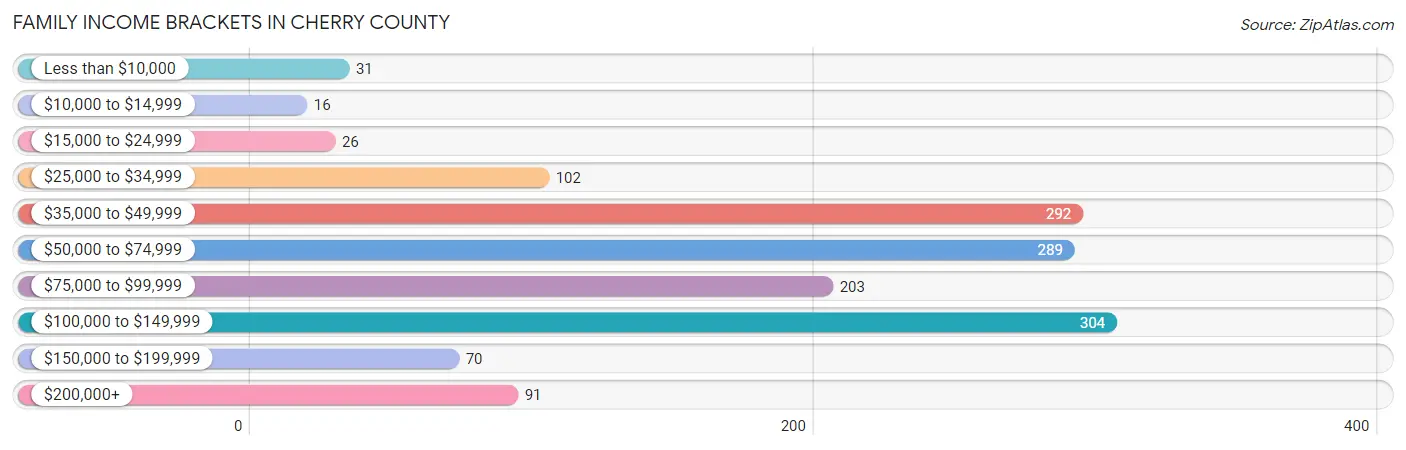
Family Income in Cherry County
Family Income Brackets in Cherry County
According to the Cherry County family income data, there are 304 families falling into the $100,000 to $149,999 income range, which is the most common income bracket and makes up 21.4% of all families. Conversely, the $10,000 to $14,999 income bracket is the least frequent group with only 16 families (1.1%) belonging to this category.
| Income Bracket | # Families | % Families |
| Less than $10,000 | 31 | 2.2% |
| $10,000 to $14,999 | 16 | 1.1% |
| $15,000 to $24,999 | 26 | 1.8% |
| $25,000 to $34,999 | 102 | 7.2% |
| $35,000 to $49,999 | 292 | 20.5% |
| $50,000 to $74,999 | 289 | 20.3% |
| $75,000 to $99,999 | 203 | 14.3% |
| $100,000 to $149,999 | 304 | 21.4% |
| $150,000 to $199,999 | 70 | 4.9% |
| $200,000+ | 91 | 6.4% |
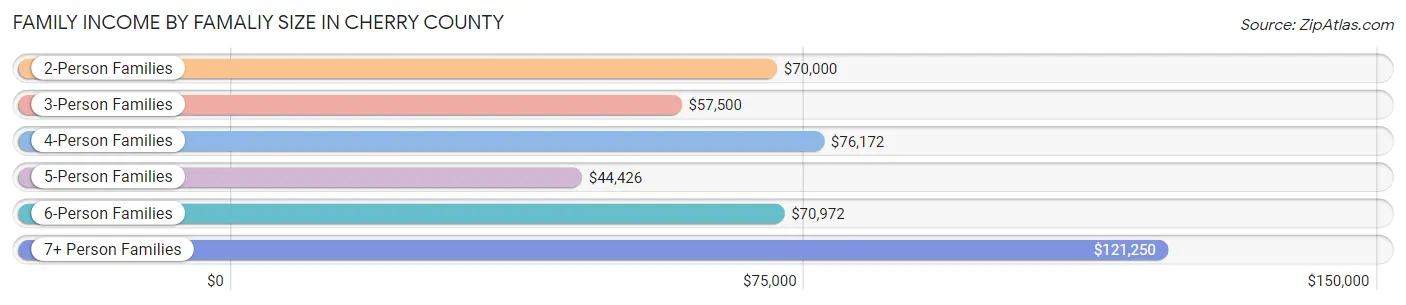
Family Income by Famaliy Size in Cherry County
7+ person families (11 | 0.8%) account for the highest median family income in Cherry County with $121,250 per family, while 2-person families (846 | 59.5%) have the highest median income of $35,000 per family member.
| Income Bracket | # Families | Median Income |
| 2-Person Families | 846 (59.5%) | $70,000 |
| 3-Person Families | 194 (13.6%) | $57,500 |
| 4-Person Families | 239 (16.8%) | $76,172 |
| 5-Person Families | 115 (8.1%) | $44,426 |
| 6-Person Families | 17 (1.2%) | $70,972 |
| 7+ Person Families | 11 (0.8%) | $121,250 |
| Total | 1,422 (100.0%) | $69,813 |
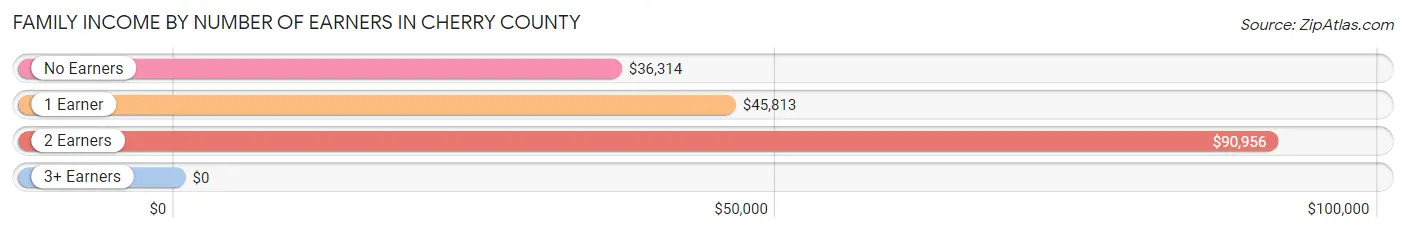
Family Income by Number of Earners in Cherry County
| Number of Earners | # Families | Median Income |
| No Earners | 149 (10.5%) | $36,314 |
| 1 Earner | 319 (22.4%) | $45,813 |
| 2 Earners | 793 (55.8%) | $90,956 |
| 3+ Earners | 161 (11.3%) | $0 |
| Total | 1,422 (100.0%) | $69,813 |
Household Income in Cherry County
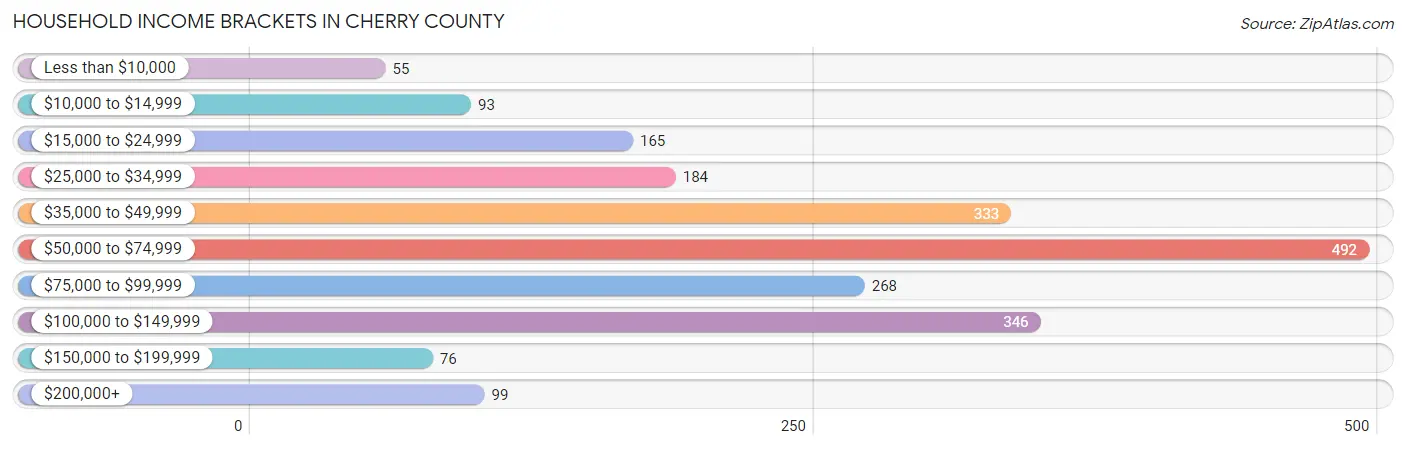
Household Income Brackets in Cherry County
With 492 households falling in the category, the $50,000 to $74,999 income range is the most frequent in Cherry County, accounting for 23.3% of all households. In contrast, only 55 households (2.6%) fall into the less than $10,000 income bracket, making it the least populous group.
| Income Bracket | # Households | % Households |
| Less than $10,000 | 55 | 2.6% |
| $10,000 to $14,999 | 93 | 4.4% |
| $15,000 to $24,999 | 165 | 7.8% |
| $25,000 to $34,999 | 184 | 8.7% |
| $35,000 to $49,999 | 333 | 15.8% |
| $50,000 to $74,999 | 492 | 23.3% |
| $75,000 to $99,999 | 268 | 12.7% |
| $100,000 to $149,999 | 346 | 16.4% |
| $150,000 to $199,999 | 76 | 3.6% |
| $200,000+ | 99 | 4.7% |
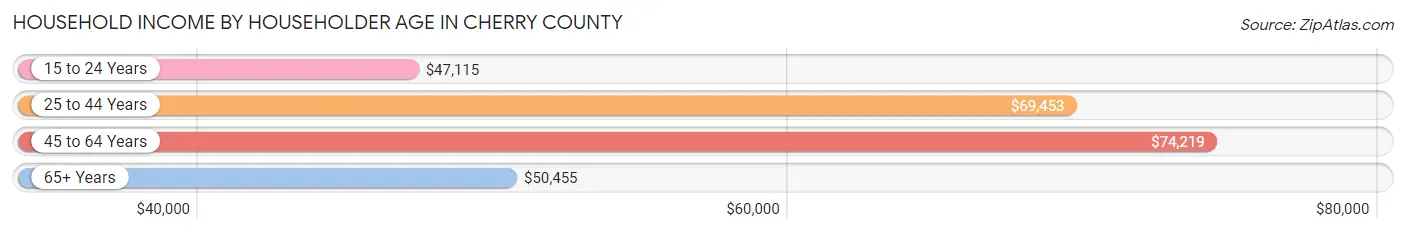
Household Income by Householder Age in Cherry County
The median household income in Cherry County is $62,373, with the highest median household income of $74,219 found in the 45 to 64 years age bracket for the primary householder. A total of 781 households (37.0%) fall into this category. Meanwhile, the 15 to 24 years age bracket for the primary householder has the lowest median household income of $47,115, with 104 households (4.9%) in this group.
| Income Bracket | # Households | Median Income |
| 15 to 24 Years | 104 (4.9%) | $47,115 |
| 25 to 44 Years | 497 (23.5%) | $69,453 |
| 45 to 64 Years | 781 (37.0%) | $74,219 |
| 65+ Years | 728 (34.5%) | $50,455 |
| Total | 2,110 (100.0%) | $62,373 |
Poverty in Cherry County
Income Below Poverty by Sex and Age in Cherry County
With 7.2% poverty level for males and 12.5% for females among the residents of Cherry County, 75 year old and over males and under 5 year old females are the most vulnerable to poverty, with 27 males (11.7%) and 93 females (40.6%) in their respective age groups living below the poverty level.
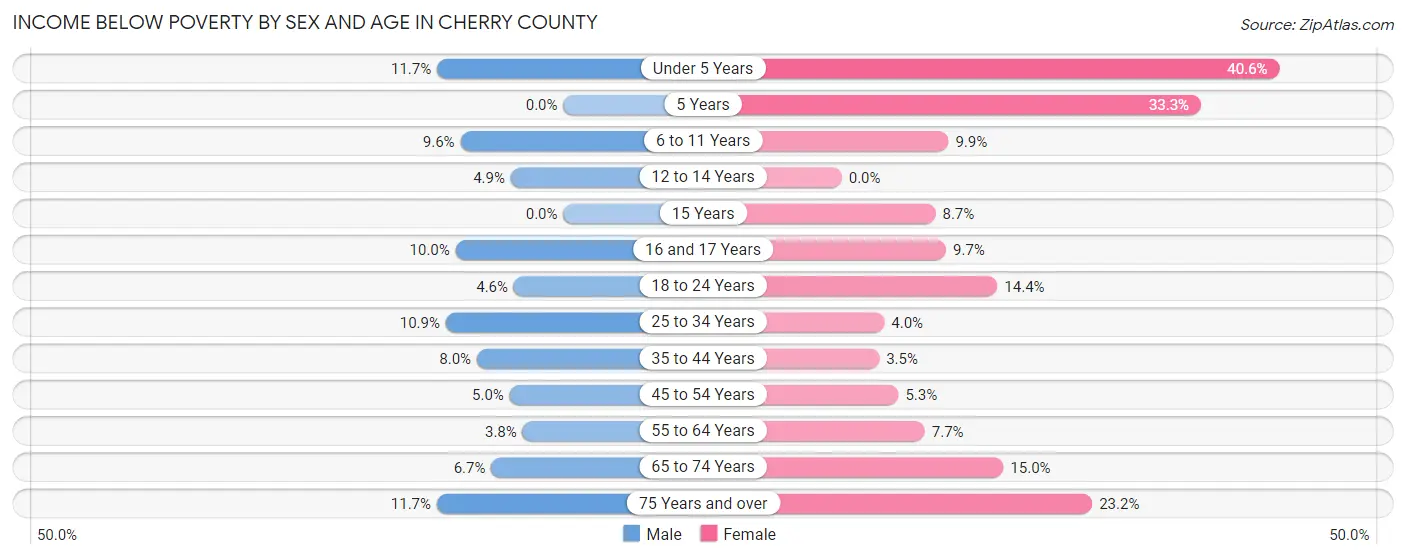
| Age Bracket | Male | Female |
| Under 5 Years | 17 (11.7%) | 93 (40.6%) |
| 5 Years | 0 (0.0%) | 3 (33.3%) |
| 6 to 11 Years | 15 (9.6%) | 20 (9.9%) |
| 12 to 14 Years | 8 (4.9%) | 0 (0.0%) |
| 15 Years | 0 (0.0%) | 4 (8.7%) |
| 16 and 17 Years | 10 (10.0%) | 9 (9.7%) |
| 18 to 24 Years | 10 (4.6%) | 27 (14.4%) |
| 25 to 34 Years | 36 (10.9%) | 10 (4.0%) |
| 35 to 44 Years | 26 (8.0%) | 11 (3.5%) |
| 45 to 54 Years | 14 (5.0%) | 14 (5.3%) |
| 55 to 64 Years | 17 (3.8%) | 28 (7.7%) |
| 65 to 74 Years | 20 (6.7%) | 45 (15.0%) |
| 75 Years and over | 27 (11.7%) | 66 (23.2%) |
| Total | 200 (7.2%) | 330 (12.5%) |
Income Above Poverty by Sex and Age in Cherry County
According to the poverty statistics in Cherry County, males aged 5 years and females aged 12 to 14 years are the age groups that are most secure financially, with 100.0% of males and 100.0% of females in these age groups living above the poverty line.
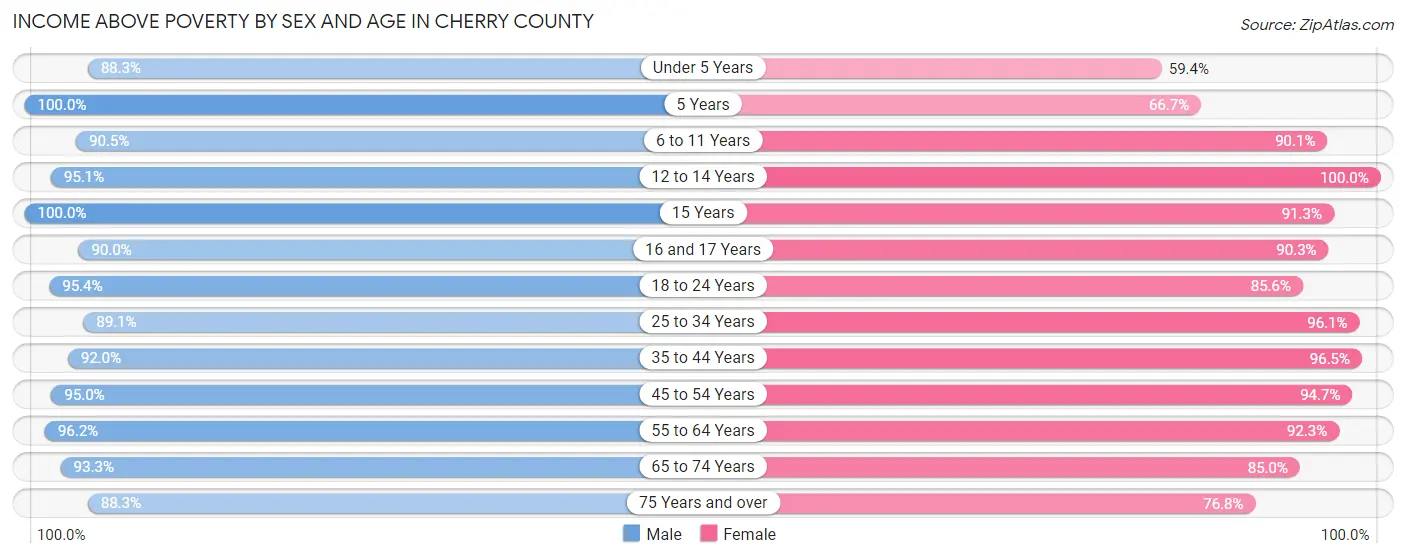
| Age Bracket | Male | Female |
| Under 5 Years | 128 (88.3%) | 136 (59.4%) |
| 5 Years | 49 (100.0%) | 6 (66.7%) |
| 6 to 11 Years | 142 (90.4%) | 182 (90.1%) |
| 12 to 14 Years | 156 (95.1%) | 89 (100.0%) |
| 15 Years | 23 (100.0%) | 42 (91.3%) |
| 16 and 17 Years | 90 (90.0%) | 84 (90.3%) |
| 18 to 24 Years | 208 (95.4%) | 160 (85.6%) |
| 25 to 34 Years | 294 (89.1%) | 243 (96.1%) |
| 35 to 44 Years | 298 (92.0%) | 306 (96.5%) |
| 45 to 54 Years | 267 (95.0%) | 252 (94.7%) |
| 55 to 64 Years | 433 (96.2%) | 335 (92.3%) |
| 65 to 74 Years | 279 (93.3%) | 255 (85.0%) |
| 75 Years and over | 203 (88.3%) | 218 (76.8%) |
| Total | 2,570 (92.8%) | 2,308 (87.5%) |
Income Below Poverty Among Married-Couple Families in Cherry County
The poverty statistics for married-couple families in Cherry County show that 4.4% or 54 of the total 1,227 families live below the poverty line. Families with 3 or 4 children have the highest poverty rate of 15.4%, comprising of 12 families. On the other hand, families with 5 or more children have the lowest poverty rate of 0.0%, which includes 0 families.
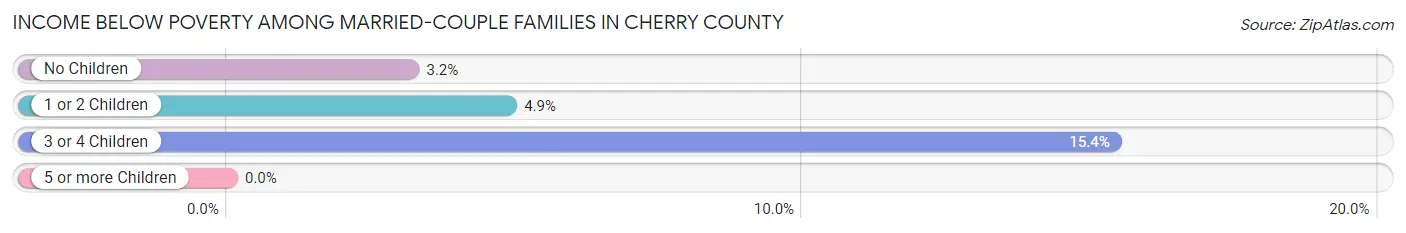
| Children | Above Poverty | Below Poverty |
| No Children | 766 (96.8%) | 25 (3.2%) |
| 1 or 2 Children | 333 (95.1%) | 17 (4.9%) |
| 3 or 4 Children | 66 (84.6%) | 12 (15.4%) |
| 5 or more Children | 8 (100.0%) | 0 (0.0%) |
| Total | 1,173 (95.6%) | 54 (4.4%) |
Income Below Poverty Among Single-Parent Households in Cherry County
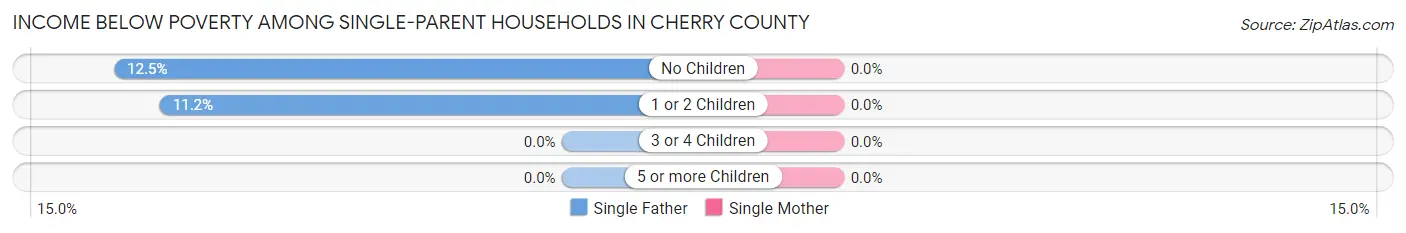
| Children | Single Father | Single Mother |
| No Children | 3 (12.5%) | 0 (0.0%) |
| 1 or 2 Children | 11 (11.2%) | 0 (0.0%) |
| 3 or 4 Children | 0 (0.0%) | 0 (0.0%) |
| 5 or more Children | 0 (0.0%) | 0 (0.0%) |
| Total | 14 (11.5%) | 0 (0.0%) |
Income Below Poverty Among Married-Couple vs Single-Parent Households in Cherry County
The poverty data for Cherry County shows that 54 of the married-couple family households (4.4%) and 14 of the single-parent households (7.2%) are living below the poverty level. Within the married-couple family households, those with 3 or 4 children have the highest poverty rate, with 12 households (15.4%) falling below the poverty line. Among the single-parent households, those with 1 or 2 children have the highest poverty rate, with 11 household (7.6%) living below poverty.
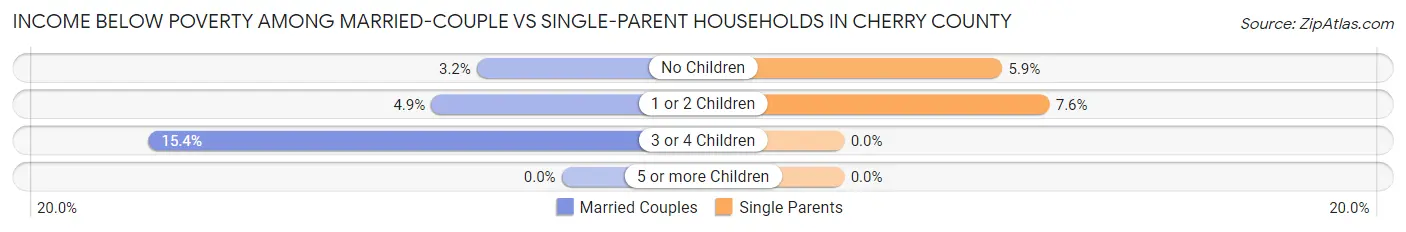
| Children | Married-Couple Families | Single-Parent Households |
| No Children | 25 (3.2%) | 3 (5.9%) |
| 1 or 2 Children | 17 (4.9%) | 11 (7.6%) |
| 3 or 4 Children | 12 (15.4%) | 0 (0.0%) |
| 5 or more Children | 0 (0.0%) | 0 (0.0%) |
| Total | 54 (4.4%) | 14 (7.2%) |
Race in Cherry County
The most populous races in Cherry County are White / Caucasian (4,646 | 84.9%), Two or more Races (437 | 8.0%), and Native / Alaskan (204 | 3.7%).
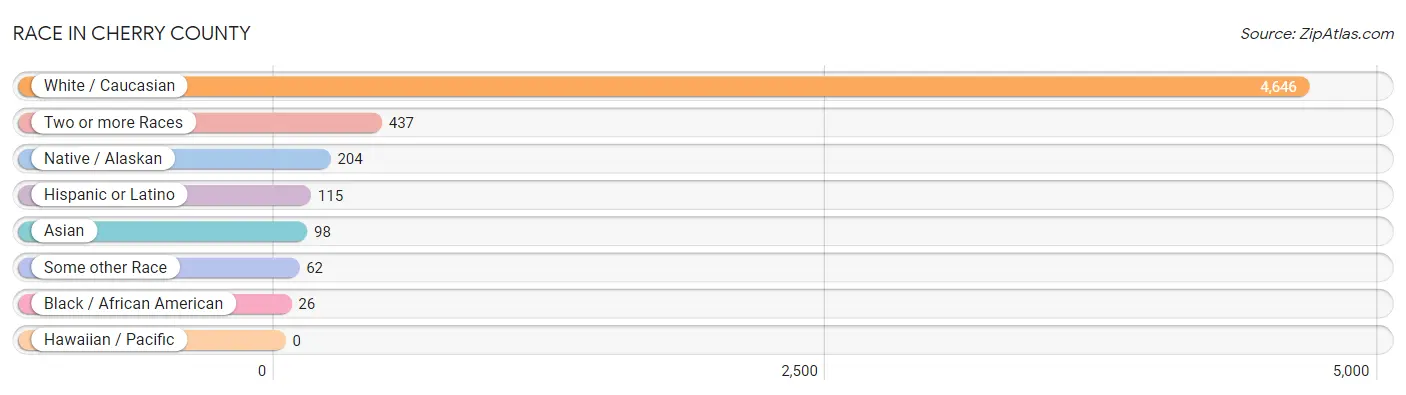
| Race | # Population | % Population |
| Asian | 98 | 1.8% |
| Black / African American | 26 | 0.5% |
| Hawaiian / Pacific | 0 | 0.0% |
| Hispanic or Latino | 115 | 2.1% |
| Native / Alaskan | 204 | 3.7% |
| White / Caucasian | 4,646 | 84.9% |
| Two or more Races | 437 | 8.0% |
| Some other Race | 62 | 1.1% |
| Total | 5,473 | 100.0% |
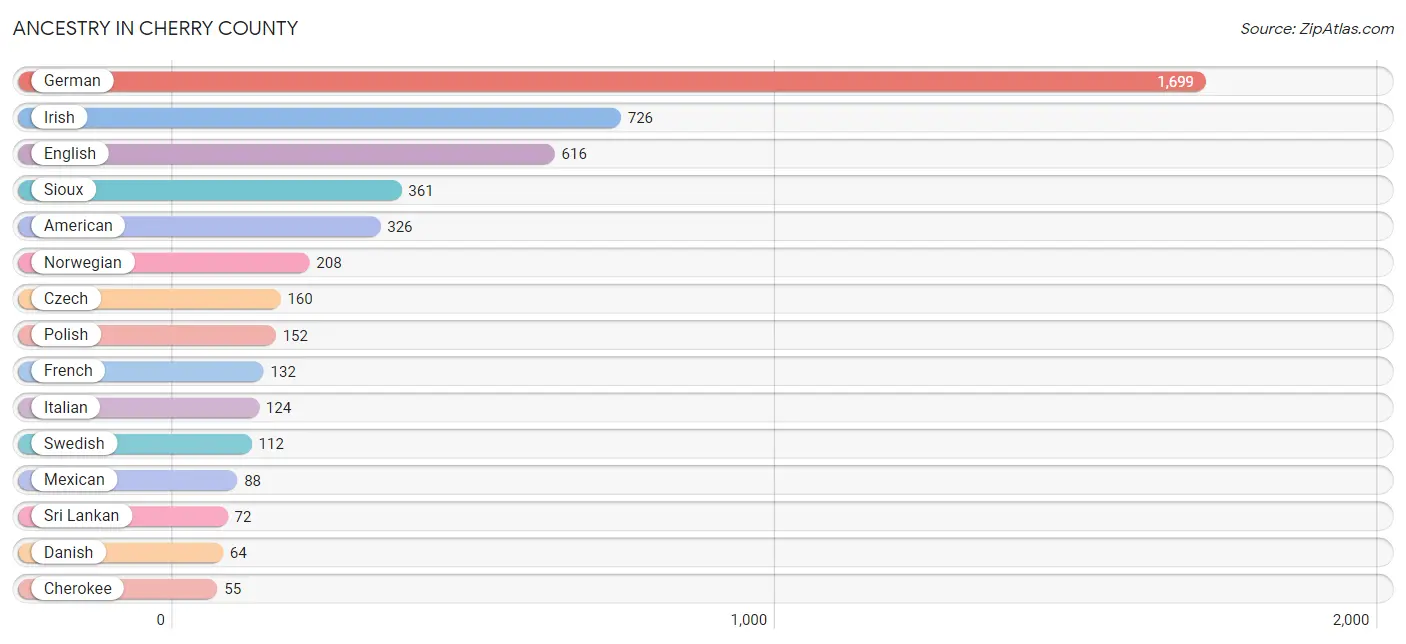
Ancestry in Cherry County
The most populous ancestries reported in Cherry County are German (1,699 | 31.0%), Irish (726 | 13.3%), English (616 | 11.3%), Sioux (361 | 6.6%), and American (326 | 6.0%), together accounting for 68.1% of all Cherry County residents.
| Ancestry | # Population | % Population |
| American | 326 | 6.0% |
| Arab | 7 | 0.1% |
| Belgian | 8 | 0.2% |
| British | 1 | 0.0% |
| Burmese | 26 | 0.5% |
| Cherokee | 55 | 1.0% |
| Czech | 160 | 2.9% |
| Danish | 64 | 1.2% |
| Dutch | 53 | 1.0% |
| English | 616 | 11.3% |
| European | 15 | 0.3% |
| French | 132 | 2.4% |
| German | 1,699 | 31.0% |
| Guyanese | 27 | 0.5% |
| Irish | 726 | 13.3% |
| Italian | 124 | 2.3% |
| Korean | 2 | 0.0% |
| Lebanese | 7 | 0.1% |
| Mexican | 88 | 1.6% |
| Northern European | 33 | 0.6% |
| Norwegian | 208 | 3.8% |
| Polish | 152 | 2.8% |
| Portuguese | 54 | 1.0% |
| Russian | 11 | 0.2% |
| Scandinavian | 10 | 0.2% |
| Scotch-Irish | 9 | 0.2% |
| Scottish | 32 | 0.6% |
| Sioux | 361 | 6.6% |
| Spanish | 26 | 0.5% |
| Sri Lankan | 72 | 1.3% |
| Swedish | 112 | 2.1% |
| Swiss | 37 | 0.7% |
| Welsh | 1 | 0.0% | View All 33 Rows |
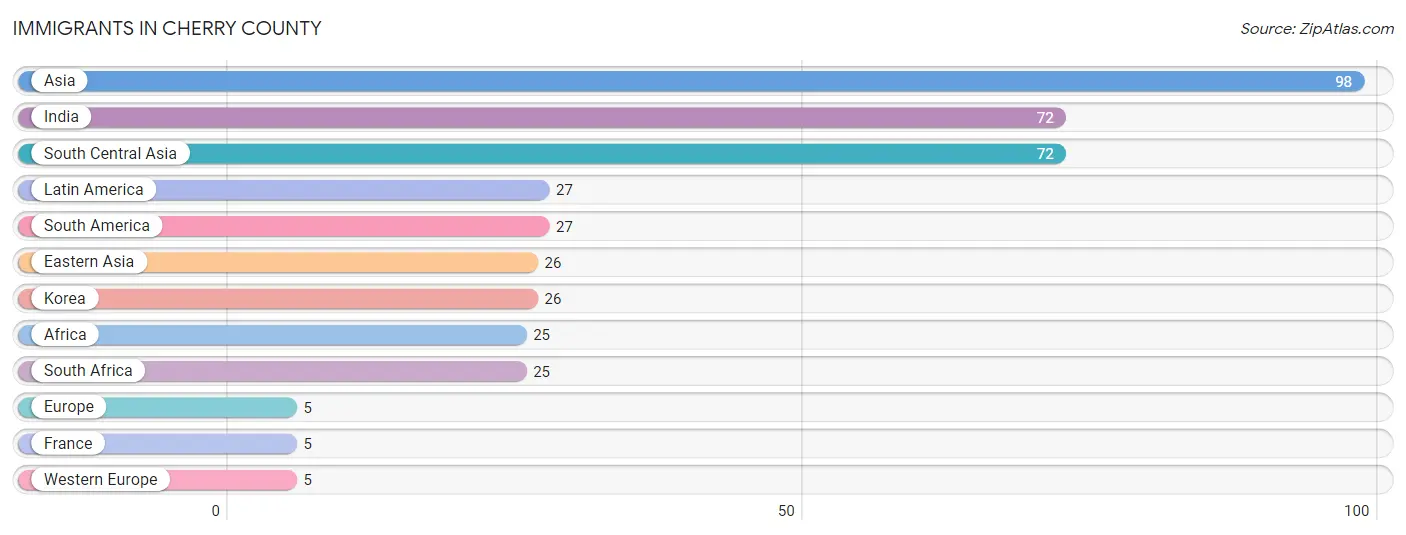
Immigrants in Cherry County
The most numerous immigrant groups reported in Cherry County came from Asia (98 | 1.8%), India (72 | 1.3%), South Central Asia (72 | 1.3%), Latin America (27 | 0.5%), and South America (27 | 0.5%), together accounting for 5.4% of all Cherry County residents.
| Immigration Origin | # Population | % Population |
| Africa | 25 | 0.5% |
| Asia | 98 | 1.8% |
| Eastern Asia | 26 | 0.5% |
| Europe | 5 | 0.1% |
| France | 5 | 0.1% |
| India | 72 | 1.3% |
| Korea | 26 | 0.5% |
| Latin America | 27 | 0.5% |
| South Africa | 25 | 0.5% |
| South America | 27 | 0.5% |
| South Central Asia | 72 | 1.3% |
| Western Europe | 5 | 0.1% | View All 12 Rows |
Sex and Age in Cherry County
Sex and Age in Cherry County
The most populous age groups in Cherry County are 60 to 64 Years (234 | 8.3%) for men and 60 to 64 Years (237 | 8.9%) for women.
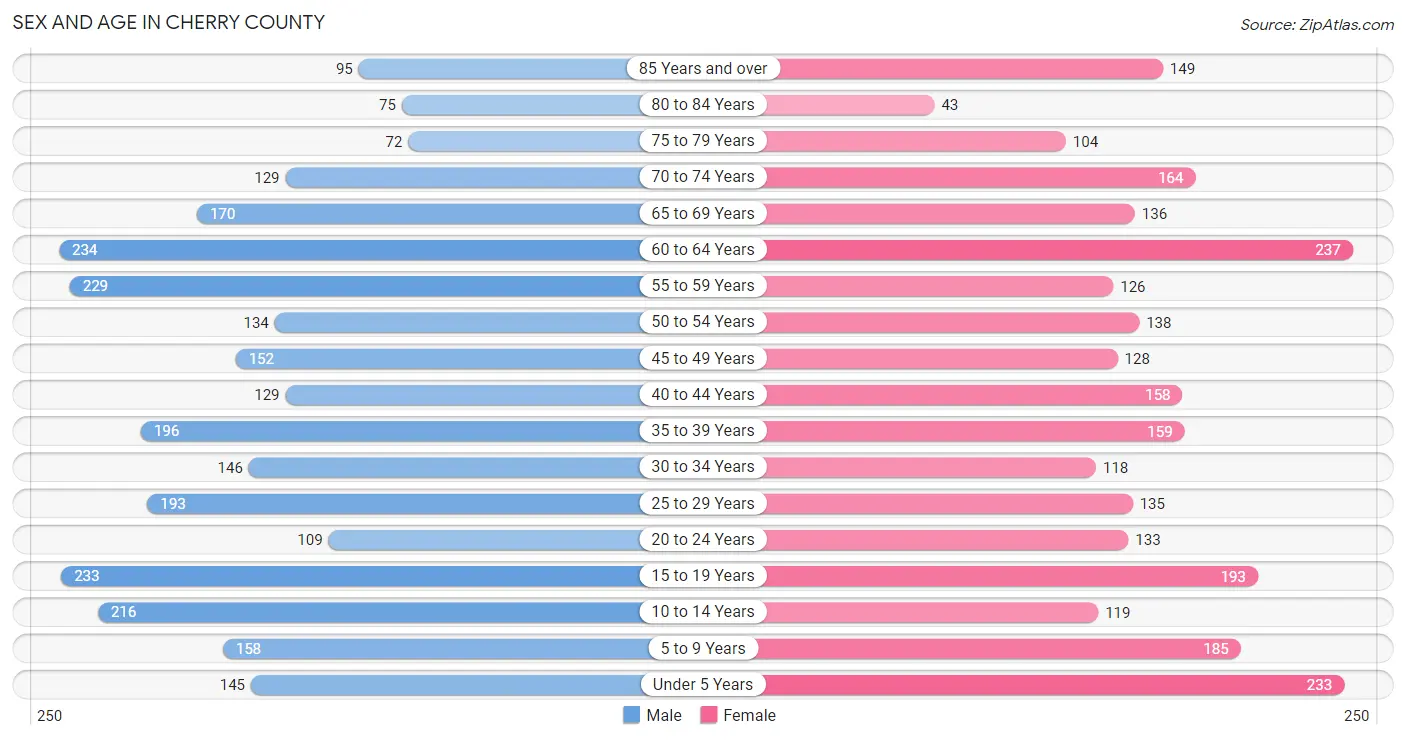
| Age Bracket | Male | Female |
| Under 5 Years | 145 (5.1%) | 233 (8.8%) |
| 5 to 9 Years | 158 (5.6%) | 185 (7.0%) |
| 10 to 14 Years | 216 (7.7%) | 119 (4.5%) |
| 15 to 19 Years | 233 (8.3%) | 193 (7.3%) |
| 20 to 24 Years | 109 (3.9%) | 133 (5.0%) |
| 25 to 29 Years | 193 (6.9%) | 135 (5.1%) |
| 30 to 34 Years | 146 (5.2%) | 118 (4.4%) |
| 35 to 39 Years | 196 (7.0%) | 159 (6.0%) |
| 40 to 44 Years | 129 (4.6%) | 158 (5.9%) |
| 45 to 49 Years | 152 (5.4%) | 128 (4.8%) |
| 50 to 54 Years | 134 (4.8%) | 138 (5.2%) |
| 55 to 59 Years | 229 (8.1%) | 126 (4.7%) |
| 60 to 64 Years | 234 (8.3%) | 237 (8.9%) |
| 65 to 69 Years | 170 (6.0%) | 136 (5.1%) |
| 70 to 74 Years | 129 (4.6%) | 164 (6.2%) |
| 75 to 79 Years | 72 (2.6%) | 104 (3.9%) |
| 80 to 84 Years | 75 (2.7%) | 43 (1.6%) |
| 85 Years and over | 95 (3.4%) | 149 (5.6%) |
| Total | 2,815 (100.0%) | 2,658 (100.0%) |
Families and Households in Cherry County
Median Family Size in Cherry County
The median family size in Cherry County is 3.03 persons per family, with single male/father families (122 | 8.6%) accounting for the largest median family size of 3.43 persons per family. On the other hand, single female/mother families (73 | 5.1%) represent the smallest median family size with 2.90 persons per family.
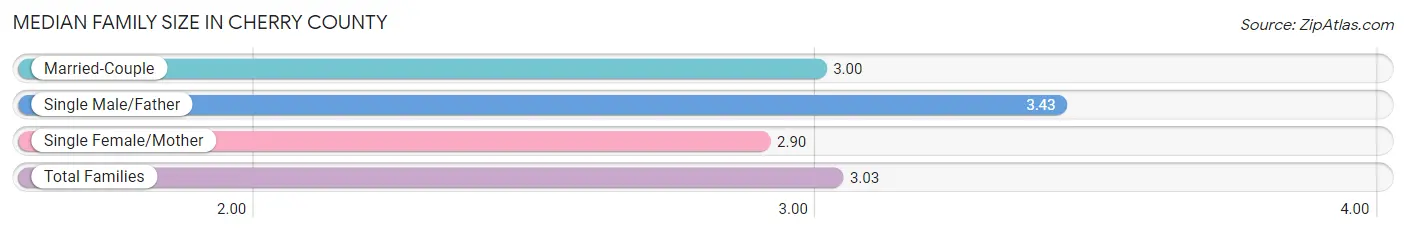
| Family Type | # Families | Family Size |
| Married-Couple | 1,227 (86.3%) | 3.00 |
| Single Male/Father | 122 (8.6%) | 3.43 |
| Single Female/Mother | 73 (5.1%) | 2.90 |
| Total Families | 1,422 (100.0%) | 3.03 |
Median Household Size in Cherry County
The median household size in Cherry County is 2.54 persons per household, with single male/father households (122 | 5.8%) accounting for the largest median household size of 3.89 persons per household. non-family households (688 | 32.6%) represent the smallest median household size with 1.41 persons per household.
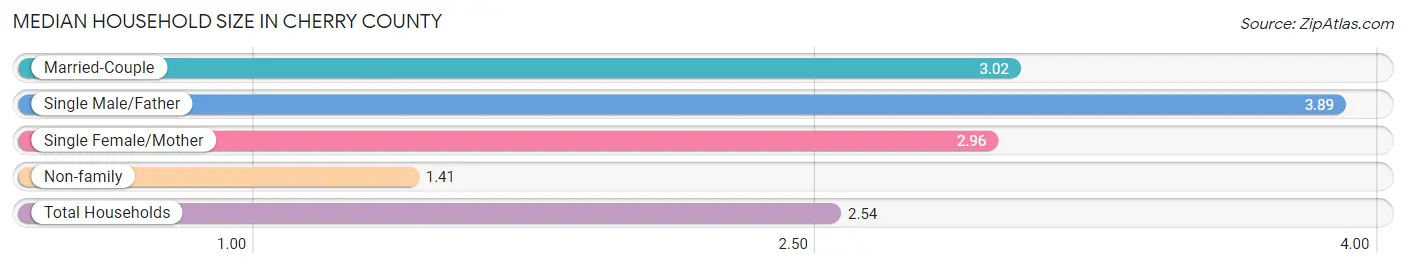
| Household Type | # Households | Household Size |
| Married-Couple | 1,227 (58.2%) | 3.02 |
| Single Male/Father | 122 (5.8%) | 3.89 |
| Single Female/Mother | 73 (3.5%) | 2.96 |
| Non-family | 688 (32.6%) | 1.41 |
| Total Households | 2,110 (100.0%) | 2.54 |
Household Size by Marriage Status in Cherry County
Out of a total of 2,110 households in Cherry County, 1,422 (67.4%) are family households, while 688 (32.6%) are nonfamily households. The most numerous type of family households are 2-person households, comprising 826, and the most common type of nonfamily households are 1-person households, comprising 525.
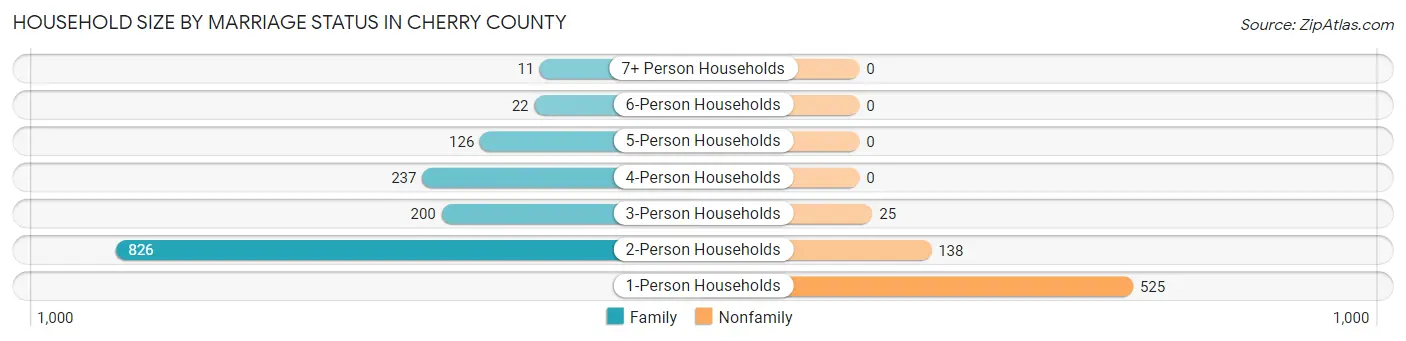
| Household Size | Family Households | Nonfamily Households |
| 1-Person Households | - | 525 (24.9%) |
| 2-Person Households | 826 (39.2%) | 138 (6.5%) |
| 3-Person Households | 200 (9.5%) | 25 (1.2%) |
| 4-Person Households | 237 (11.2%) | 0 (0.0%) |
| 5-Person Households | 126 (6.0%) | 0 (0.0%) |
| 6-Person Households | 22 (1.0%) | 0 (0.0%) |
| 7+ Person Households | 11 (0.5%) | 0 (0.0%) |
| Total | 1,422 (67.4%) | 688 (32.6%) |
Female Fertility in Cherry County
Fertility by Age in Cherry County
Average fertility rate in Cherry County is 36.0 births per 1,000 women. Women in the age bracket of 20 to 34 years have the highest fertility rate with 93.0 births per 1,000 women. Women in the age bracket of 20 to 34 years acount for 94.7% of all women with births.
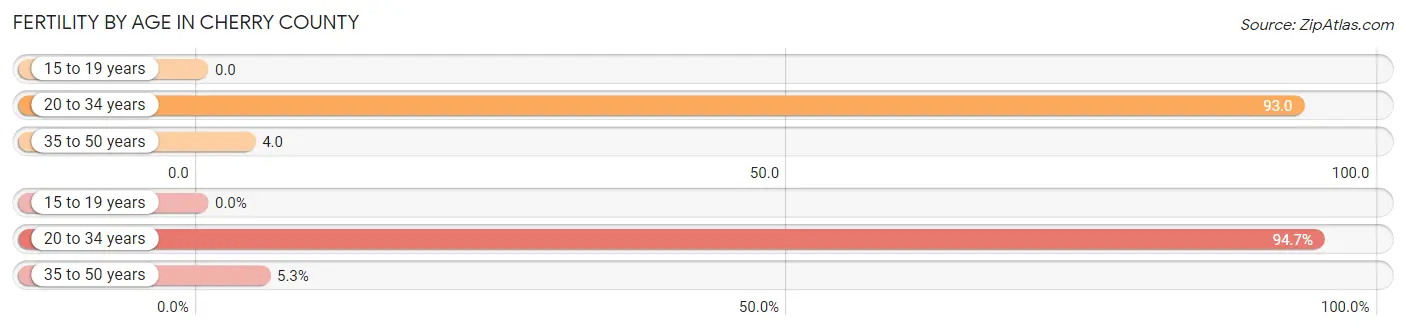
| Age Bracket | Women with Births | Births / 1,000 Women |
| 15 to 19 years | 0 (0.0%) | 0.0 |
| 20 to 34 years | 36 (94.7%) | 93.0 |
| 35 to 50 years | 2 (5.3%) | 4.0 |
| Total | 38 (100.0%) | 36.0 |
Fertility by Age by Marriage Status in Cherry County
31.6% of women with births (38) in Cherry County are married. The highest percentage of unmarried women with births falls into 20 to 34 years age bracket with 72.2% of them unmarried at the time of birth, while the lowest percentage of unmarried women with births belong to 35 to 50 years age bracket with 0.0% of them unmarried.
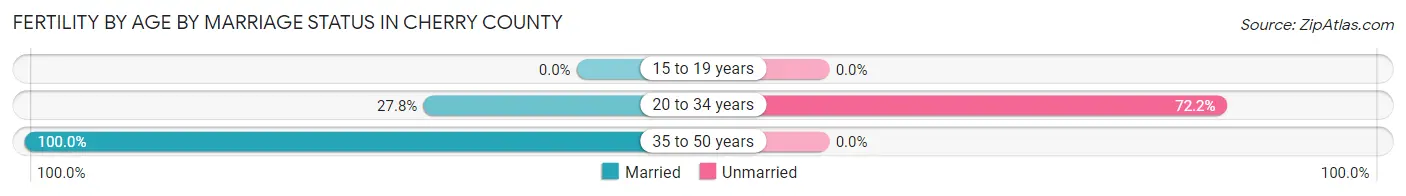
| Age Bracket | Married | Unmarried |
| 15 to 19 years | 0 (0.0%) | 0 (0.0%) |
| 20 to 34 years | 10 (27.8%) | 26 (72.2%) |
| 35 to 50 years | 2 (100.0%) | 0 (0.0%) |
| Total | 12 (31.6%) | 26 (68.4%) |
Fertility by Education in Cherry County
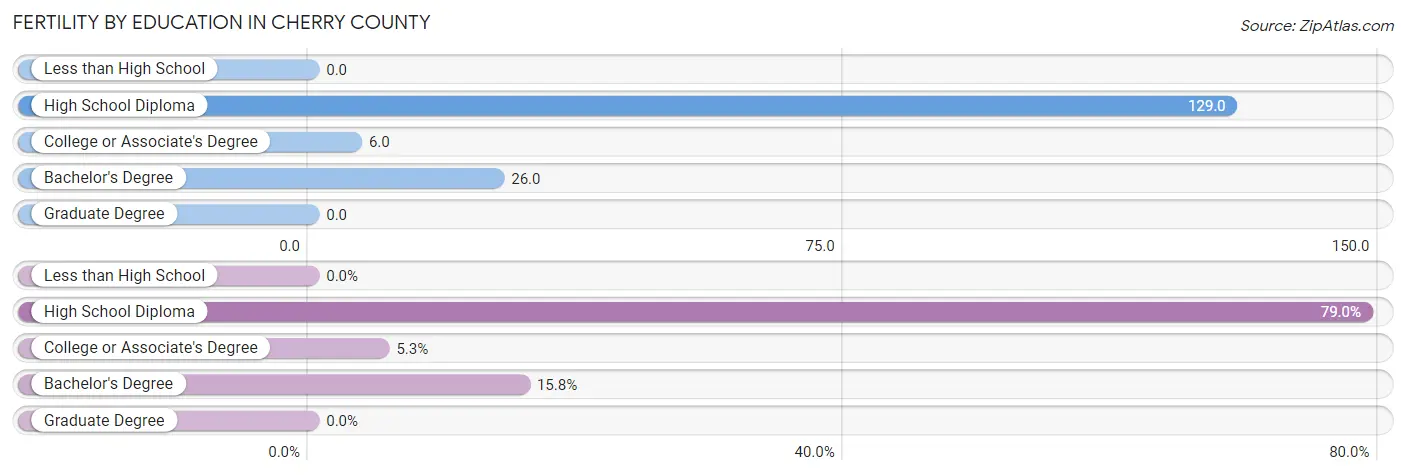
| Educational Attainment | Women with Births | Births / 1,000 Women |
| Less than High School | 0 (0.0%) | 0.0 |
| High School Diploma | 30 (78.9%) | 129.0 |
| College or Associate's Degree | 2 (5.3%) | 6.0 |
| Bachelor's Degree | 6 (15.8%) | 26.0 |
| Graduate Degree | 0 (0.0%) | 0.0 |
| Total | 38 (100.0%) | 36.0 |
Fertility by Education by Marriage Status in Cherry County
68.4% of women with births in Cherry County are unmarried. Women with the educational attainment of college or associate's degree are most likely to be married with 100.0% of them married at childbirth, while women with the educational attainment of high school diploma are least likely to be married with 86.7% of them unmarried at childbirth.
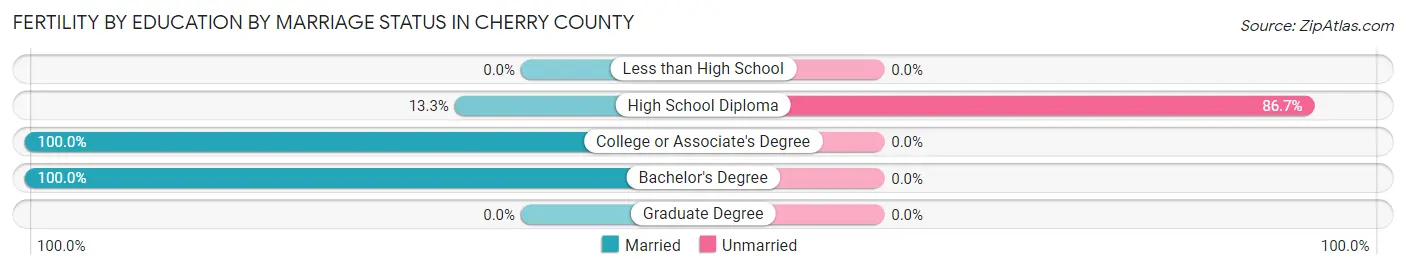
| Educational Attainment | Married | Unmarried |
| Less than High School | 0 (0.0%) | 0 (0.0%) |
| High School Diploma | 4 (13.3%) | 26 (86.7%) |
| College or Associate's Degree | 2 (100.0%) | 0 (0.0%) |
| Bachelor's Degree | 6 (100.0%) | 0 (0.0%) |
| Graduate Degree | 0 (0.0%) | 0 (0.0%) |
| Total | 12 (31.6%) | 26 (68.4%) |
Employment Characteristics in Cherry County
Employment by Class of Employer in Cherry County
Among the 2,804 employed individuals in Cherry County, private company employees (1,373 | 49.0%), self-employed (not incorporated) (502 | 17.9%), and not-for-profit organizations (226 | 8.1%) make up the most common classes of employment.
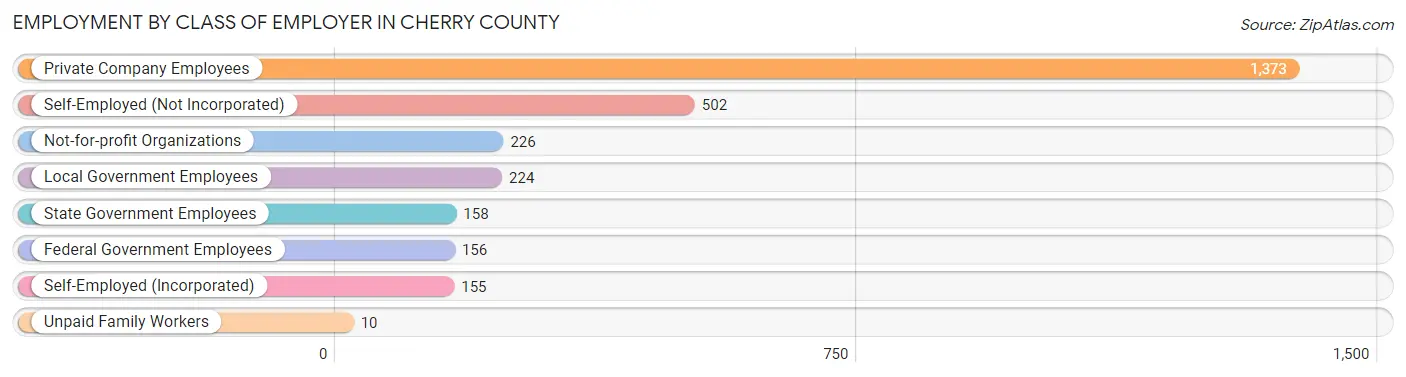
| Employer Class | # Employees | % Employees |
| Private Company Employees | 1,373 | 49.0% |
| Self-Employed (Incorporated) | 155 | 5.5% |
| Self-Employed (Not Incorporated) | 502 | 17.9% |
| Not-for-profit Organizations | 226 | 8.1% |
| Local Government Employees | 224 | 8.0% |
| State Government Employees | 158 | 5.6% |
| Federal Government Employees | 156 | 5.6% |
| Unpaid Family Workers | 10 | 0.4% |
| Total | 2,804 | 100.0% |
Employment Status by Age in Cherry County
According to the labor force statistics for Cherry County, out of the total population over 16 years of age (4,348), 67.6% or 2,939 individuals are in the labor force, with 0.4% or 12 of them unemployed. The age group with the highest labor force participation rate is 20 to 24 years, with 92.6% or 224 individuals in the labor force. Within the labor force, the 20 to 24 years age range has the highest percentage of unemployed individuals, with 3.6% or 8 of them being unemployed.
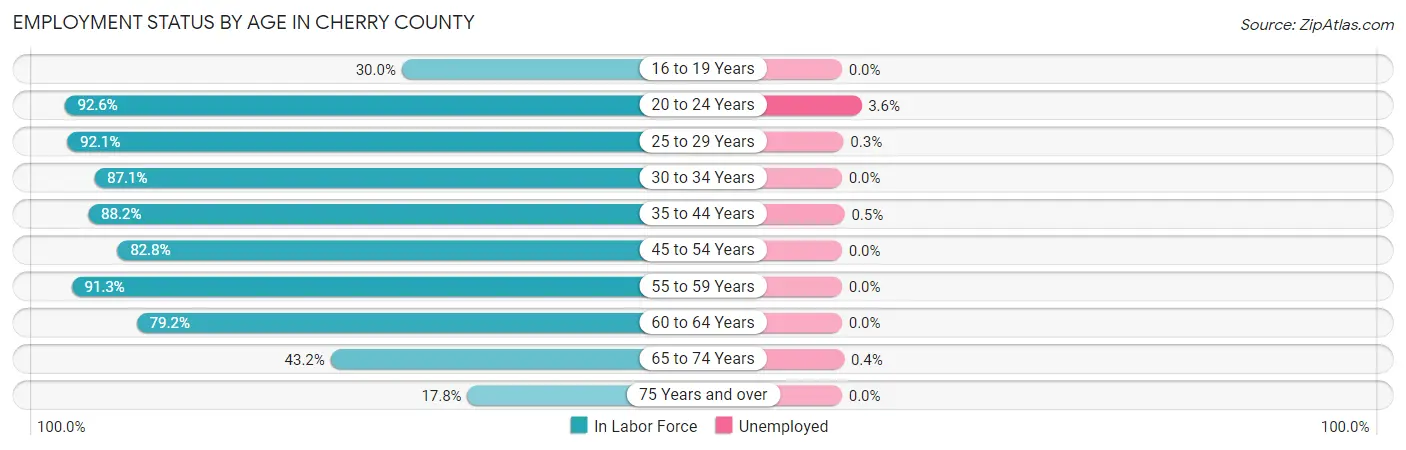
| Age Bracket | In Labor Force | Unemployed |
| 16 to 19 Years | 107 (30.0%) | 0 (0.0%) |
| 20 to 24 Years | 224 (92.6%) | 8 (3.6%) |
| 25 to 29 Years | 302 (92.1%) | 1 (0.3%) |
| 30 to 34 Years | 230 (87.1%) | 0 (0.0%) |
| 35 to 44 Years | 566 (88.2%) | 3 (0.5%) |
| 45 to 54 Years | 457 (82.8%) | 0 (0.0%) |
| 55 to 59 Years | 324 (91.3%) | 0 (0.0%) |
| 60 to 64 Years | 373 (79.2%) | 0 (0.0%) |
| 65 to 74 Years | 259 (43.2%) | 1 (0.4%) |
| 75 Years and over | 96 (17.8%) | 0 (0.0%) |
| Total | 2,939 (67.6%) | 12 (0.4%) |
Employment Status by Educational Attainment in Cherry County
According to labor force statistics for Cherry County, 86.2% of individuals (2,252) out of the total population between 25 and 64 years of age (2,612) are in the labor force, with 0.2% or 5 of them being unemployed. The group with the highest labor force participation rate are those with the educational attainment of bachelor's degree or higher, with 94.4% or 669 individuals in the labor force. Within the labor force, individuals with high school diploma education have the highest percentage of unemployment, with 0.5% or 3 of them being unemployed.
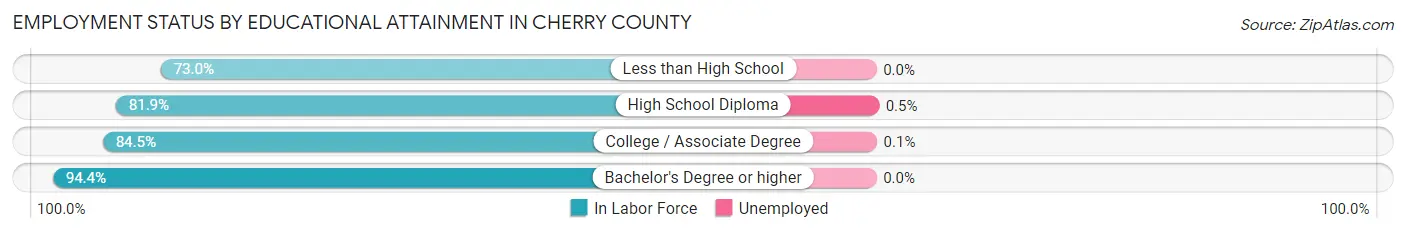
| Educational Attainment | In Labor Force | Unemployed |
| Less than High School | 27 (73.0%) | 0 (0.0%) |
| High School Diploma | 655 (81.9%) | 4 (0.5%) |
| College / Associate Degree | 901 (84.5%) | 1 (0.1%) |
| Bachelor's Degree or higher | 669 (94.4%) | 0 (0.0%) |
| Total | 2,252 (86.2%) | 5 (0.2%) |
Employment Occupations by Sex in Cherry County
Management, Business, Science and Arts Occupations
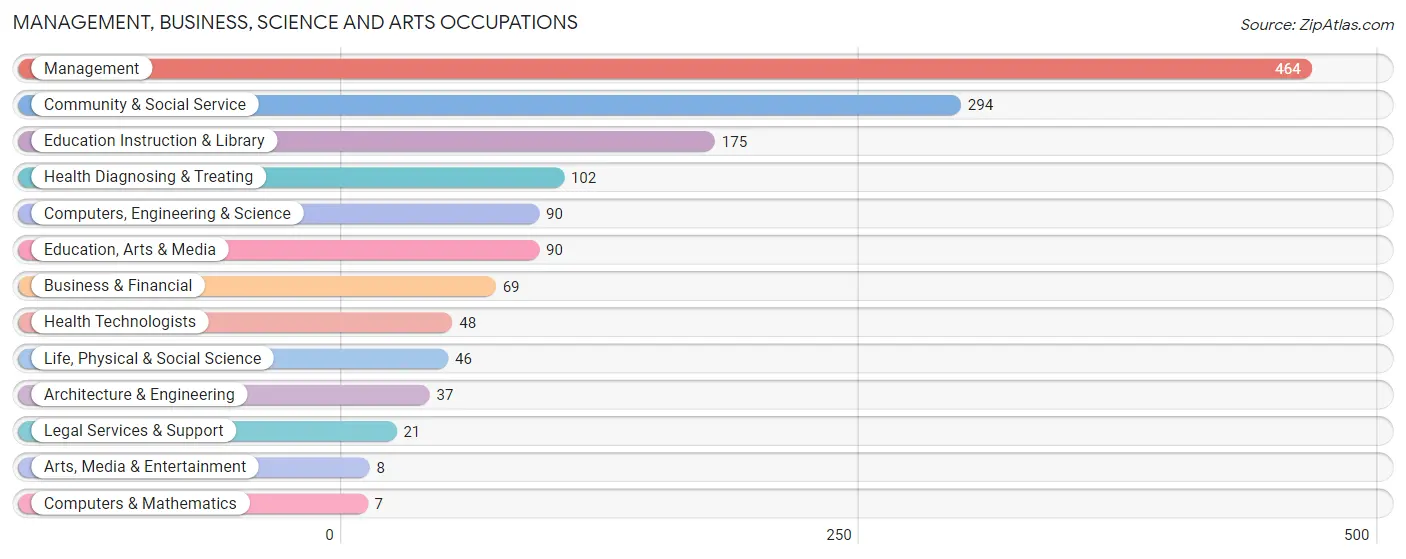
The most common Management, Business, Science and Arts occupations in Cherry County are Management (464 | 15.9%), Community & Social Service (294 | 10.1%), Education Instruction & Library (175 | 6.0%), Health Diagnosing & Treating (102 | 3.5%), and Computers, Engineering & Science (90 | 3.1%).
Management, Business, Science and Arts Occupations by Sex
Within the Management, Business, Science and Arts occupations in Cherry County, the most male-oriented occupations are Computers & Mathematics (100.0%), Architecture & Engineering (100.0%), and Computers, Engineering & Science (88.9%), while the most female-oriented occupations are Business & Financial (100.0%), Legal Services & Support (100.0%), and Health Diagnosing & Treating (98.0%).
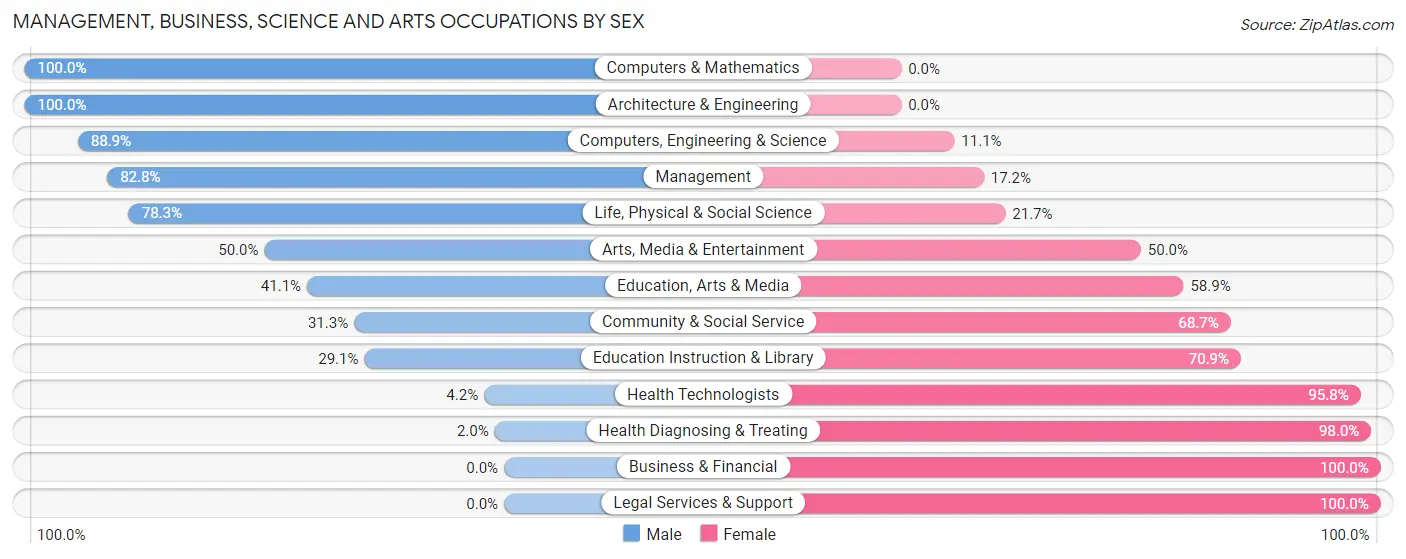
| Occupation | Male | Female |
| Management | 384 (82.8%) | 80 (17.2%) |
| Business & Financial | 0 (0.0%) | 69 (100.0%) |
| Computers, Engineering & Science | 80 (88.9%) | 10 (11.1%) |
| Computers & Mathematics | 7 (100.0%) | 0 (0.0%) |
| Architecture & Engineering | 37 (100.0%) | 0 (0.0%) |
| Life, Physical & Social Science | 36 (78.3%) | 10 (21.7%) |
| Community & Social Service | 92 (31.3%) | 202 (68.7%) |
| Education, Arts & Media | 37 (41.1%) | 53 (58.9%) |
| Legal Services & Support | 0 (0.0%) | 21 (100.0%) |
| Education Instruction & Library | 51 (29.1%) | 124 (70.9%) |
| Arts, Media & Entertainment | 4 (50.0%) | 4 (50.0%) |
| Health Diagnosing & Treating | 2 (2.0%) | 100 (98.0%) |
| Health Technologists | 2 (4.2%) | 46 (95.8%) |
| Total (Category) | 558 (54.8%) | 461 (45.2%) |
| Total (Overall) | 1,690 (57.8%) | 1,235 (42.2%) |
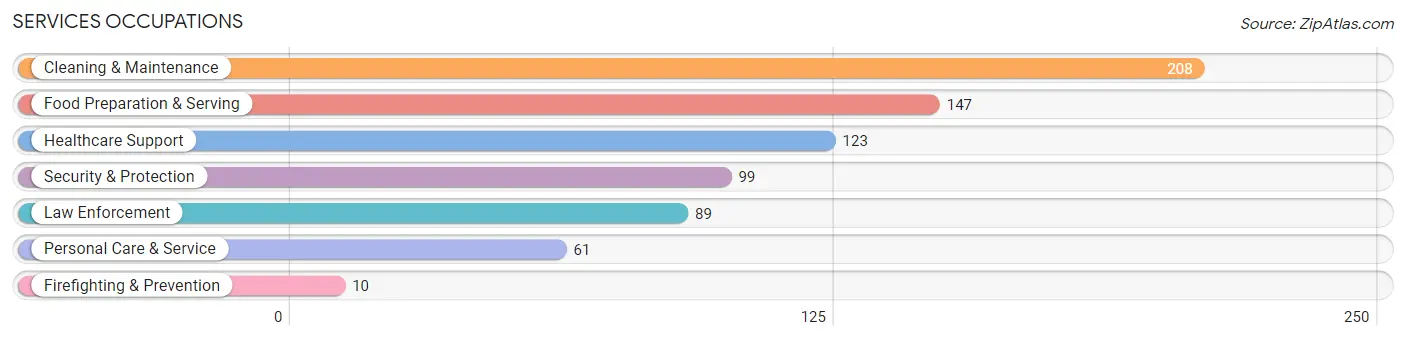
Services Occupations
The most common Services occupations in Cherry County are Cleaning & Maintenance (208 | 7.1%), Food Preparation & Serving (147 | 5.0%), Healthcare Support (123 | 4.2%), Security & Protection (99 | 3.4%), and Law Enforcement (89 | 3.0%).
Services Occupations by Sex
Within the Services occupations in Cherry County, the most male-oriented occupations are Firefighting & Prevention (100.0%), Security & Protection (76.8%), and Law Enforcement (74.2%), while the most female-oriented occupations are Personal Care & Service (100.0%), Healthcare Support (96.8%), and Food Preparation & Serving (55.8%).
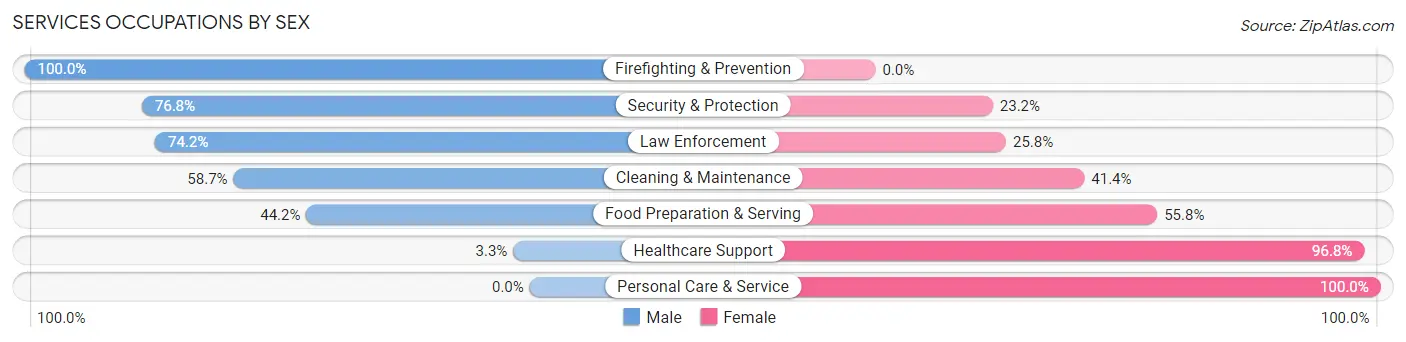
| Occupation | Male | Female |
| Healthcare Support | 4 (3.3%) | 119 (96.8%) |
| Security & Protection | 76 (76.8%) | 23 (23.2%) |
| Firefighting & Prevention | 10 (100.0%) | 0 (0.0%) |
| Law Enforcement | 66 (74.2%) | 23 (25.8%) |
| Food Preparation & Serving | 65 (44.2%) | 82 (55.8%) |
| Cleaning & Maintenance | 122 (58.7%) | 86 (41.3%) |
| Personal Care & Service | 0 (0.0%) | 61 (100.0%) |
| Total (Category) | 267 (41.8%) | 371 (58.2%) |
| Total (Overall) | 1,690 (57.8%) | 1,235 (42.2%) |
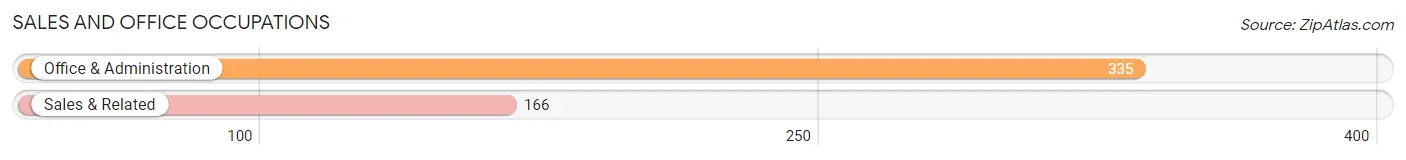
Sales and Office Occupations
The most common Sales and Office occupations in Cherry County are Office & Administration (335 | 11.5%), and Sales & Related (166 | 5.7%).
Sales and Office Occupations by Sex
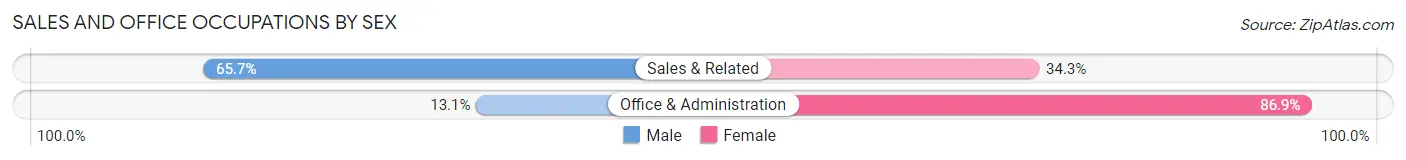
| Occupation | Male | Female |
| Sales & Related | 109 (65.7%) | 57 (34.3%) |
| Office & Administration | 44 (13.1%) | 291 (86.9%) |
| Total (Category) | 153 (30.5%) | 348 (69.5%) |
| Total (Overall) | 1,690 (57.8%) | 1,235 (42.2%) |
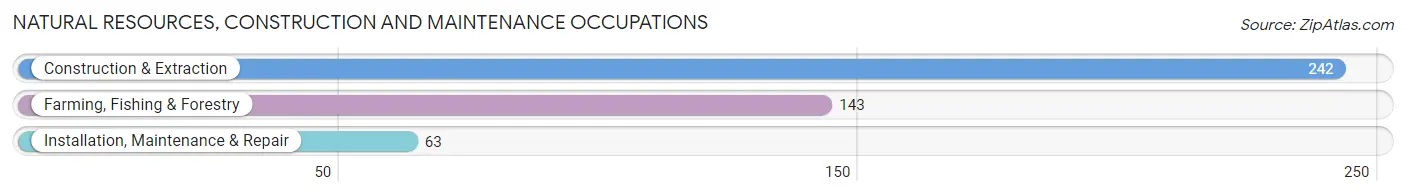
Natural Resources, Construction and Maintenance Occupations
The most common Natural Resources, Construction and Maintenance occupations in Cherry County are Construction & Extraction (242 | 8.3%), Farming, Fishing & Forestry (143 | 4.9%), and Installation, Maintenance & Repair (63 | 2.1%).
Natural Resources, Construction and Maintenance Occupations by Sex
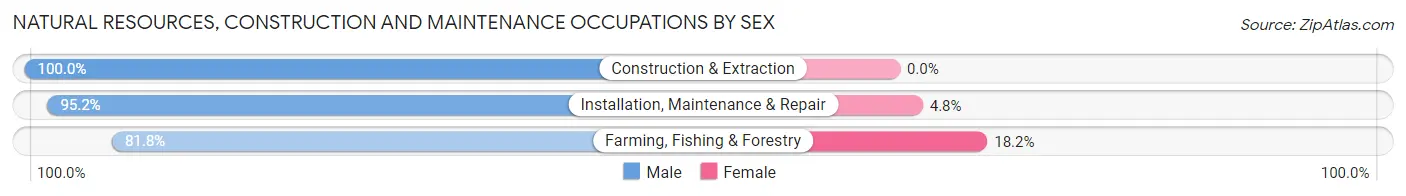
| Occupation | Male | Female |
| Farming, Fishing & Forestry | 117 (81.8%) | 26 (18.2%) |
| Construction & Extraction | 242 (100.0%) | 0 (0.0%) |
| Installation, Maintenance & Repair | 60 (95.2%) | 3 (4.8%) |
| Total (Category) | 419 (93.5%) | 29 (6.5%) |
| Total (Overall) | 1,690 (57.8%) | 1,235 (42.2%) |
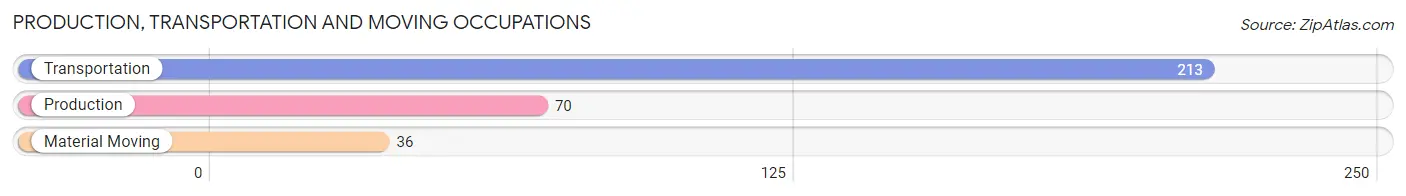
Production, Transportation and Moving Occupations
The most common Production, Transportation and Moving occupations in Cherry County are Transportation (213 | 7.3%), Production (70 | 2.4%), and Material Moving (36 | 1.2%).
Production, Transportation and Moving Occupations by Sex
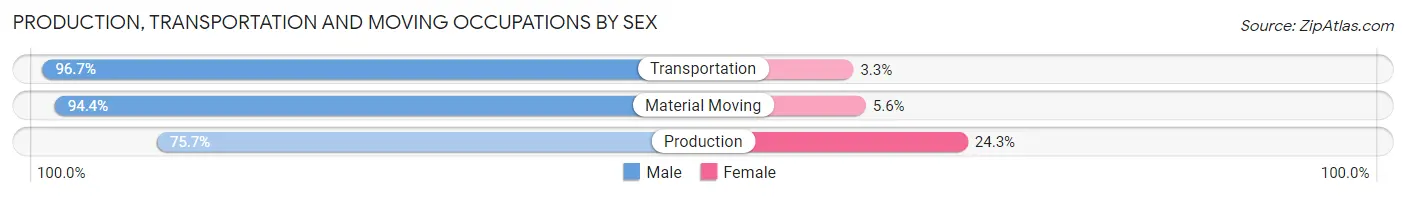
| Occupation | Male | Female |
| Production | 53 (75.7%) | 17 (24.3%) |
| Transportation | 206 (96.7%) | 7 (3.3%) |
| Material Moving | 34 (94.4%) | 2 (5.6%) |
| Total (Category) | 293 (91.8%) | 26 (8.2%) |
| Total (Overall) | 1,690 (57.8%) | 1,235 (42.2%) |
Employment Industries by Sex in Cherry County
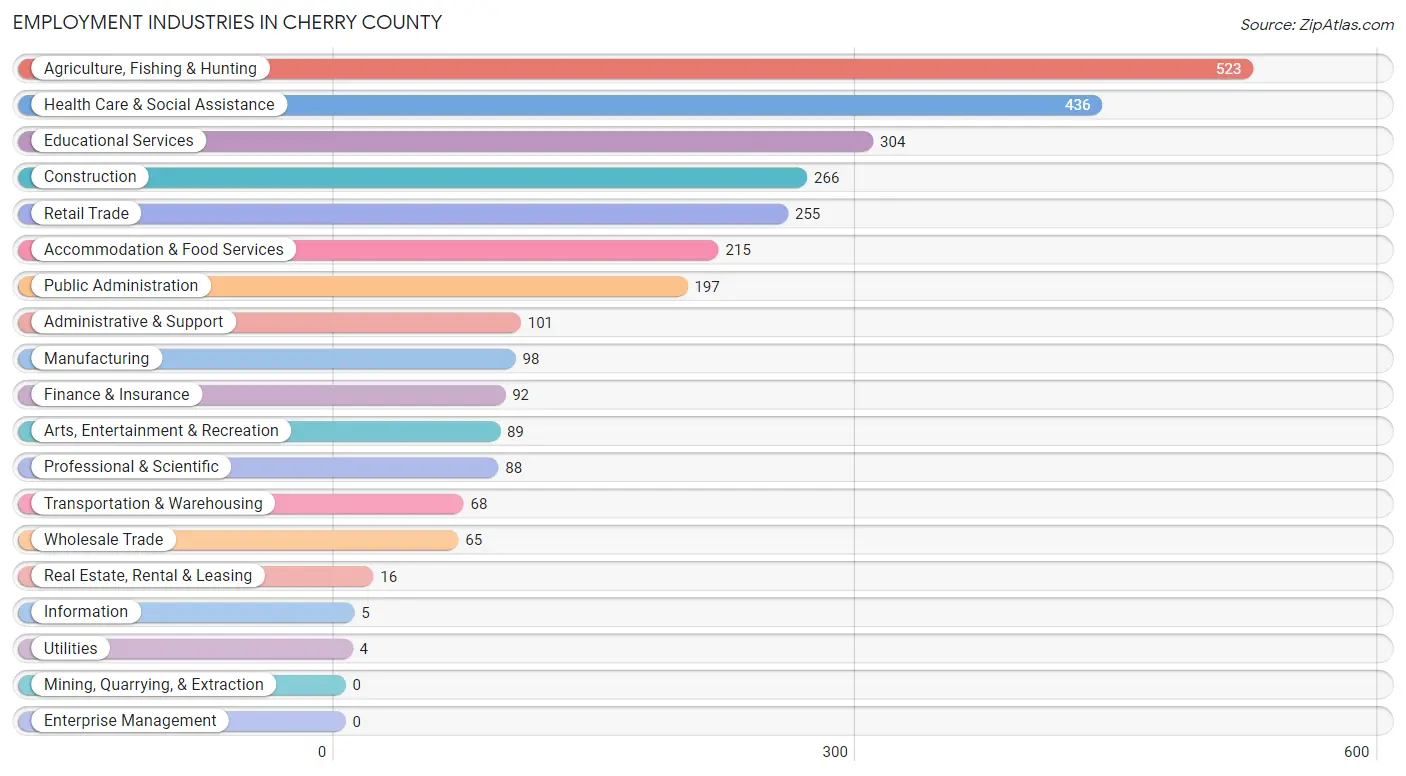
Employment Industries in Cherry County
The major employment industries in Cherry County include Agriculture, Fishing & Hunting (523 | 17.9%), Health Care & Social Assistance (436 | 14.9%), Educational Services (304 | 10.4%), Construction (266 | 9.1%), and Retail Trade (255 | 8.7%).
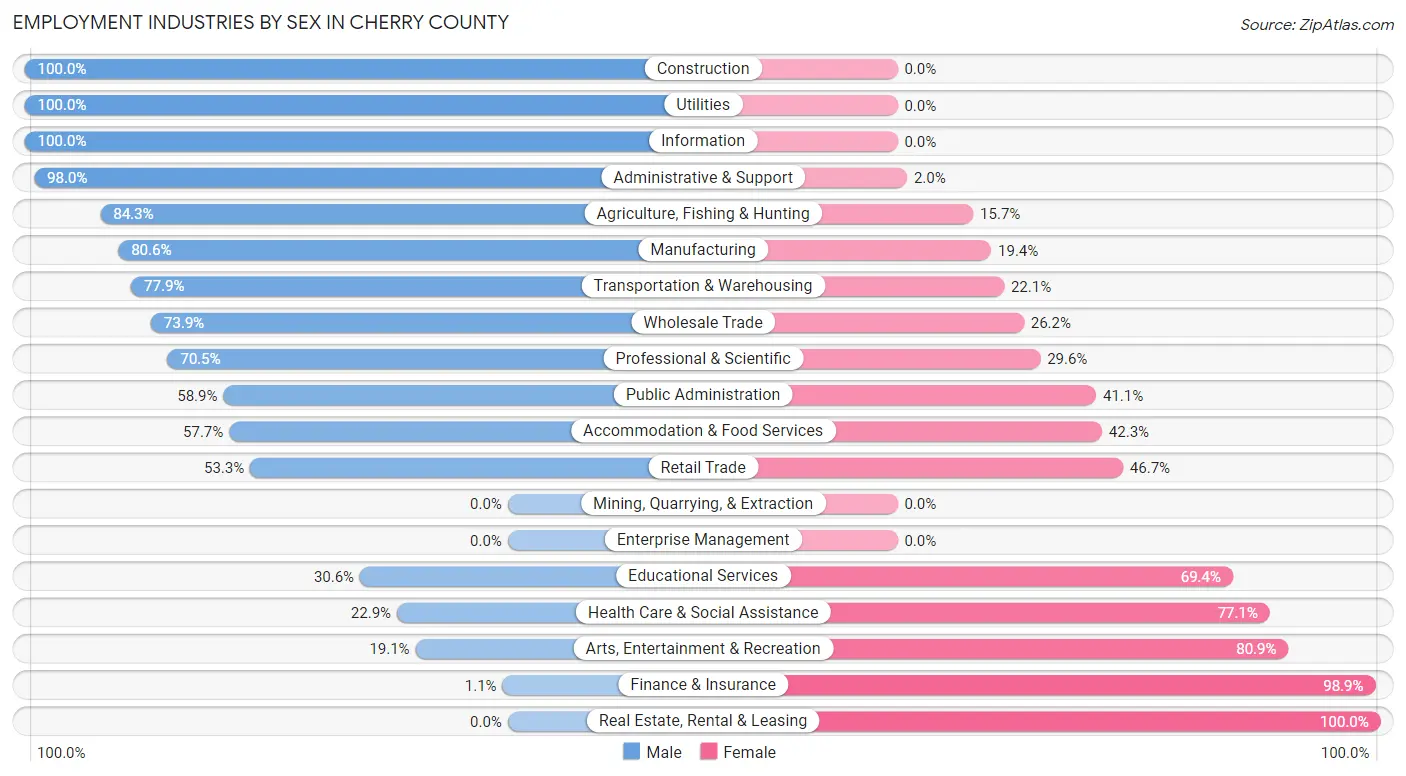
Employment Industries by Sex in Cherry County
The Cherry County industries that see more men than women are Construction (100.0%), Utilities (100.0%), and Information (100.0%), whereas the industries that tend to have a higher number of women are Real Estate, Rental & Leasing (100.0%), Finance & Insurance (98.9%), and Arts, Entertainment & Recreation (80.9%).
| Industry | Male | Female |
| Agriculture, Fishing & Hunting | 441 (84.3%) | 82 (15.7%) |
| Mining, Quarrying, & Extraction | 0 (0.0%) | 0 (0.0%) |
| Construction | 266 (100.0%) | 0 (0.0%) |
| Manufacturing | 79 (80.6%) | 19 (19.4%) |
| Wholesale Trade | 48 (73.9%) | 17 (26.2%) |
| Retail Trade | 136 (53.3%) | 119 (46.7%) |
| Transportation & Warehousing | 53 (77.9%) | 15 (22.1%) |
| Utilities | 4 (100.0%) | 0 (0.0%) |
| Information | 5 (100.0%) | 0 (0.0%) |
| Finance & Insurance | 1 (1.1%) | 91 (98.9%) |
| Real Estate, Rental & Leasing | 0 (0.0%) | 16 (100.0%) |
| Professional & Scientific | 62 (70.5%) | 26 (29.5%) |
| Enterprise Management | 0 (0.0%) | 0 (0.0%) |
| Administrative & Support | 99 (98.0%) | 2 (2.0%) |
| Educational Services | 93 (30.6%) | 211 (69.4%) |
| Health Care & Social Assistance | 100 (22.9%) | 336 (77.1%) |
| Arts, Entertainment & Recreation | 17 (19.1%) | 72 (80.9%) |
| Accommodation & Food Services | 124 (57.7%) | 91 (42.3%) |
| Public Administration | 116 (58.9%) | 81 (41.1%) |
| Total | 1,690 (57.8%) | 1,235 (42.2%) |
Education in Cherry County
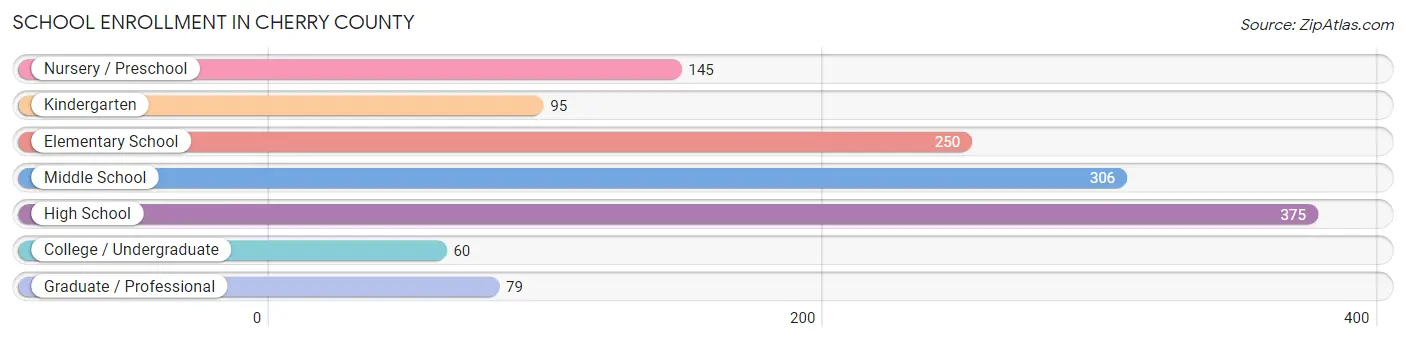
School Enrollment in Cherry County
The most common levels of schooling among the 1,310 students in Cherry County are high school (375 | 28.6%), middle school (306 | 23.4%), and elementary school (250 | 19.1%).
| School Level | # Students | % Students |
| Nursery / Preschool | 145 | 11.1% |
| Kindergarten | 95 | 7.2% |
| Elementary School | 250 | 19.1% |
| Middle School | 306 | 23.4% |
| High School | 375 | 28.6% |
| College / Undergraduate | 60 | 4.6% |
| Graduate / Professional | 79 | 6.0% |
| Total | 1,310 | 100.0% |
School Enrollment by Age by Funding Source in Cherry County
Out of a total of 1,310 students who are enrolled in schools in Cherry County, 234 (17.9%) attend a private institution, while the remaining 1,076 (82.1%) are enrolled in public schools. The age group of 3 to 4 year olds has the highest likelihood of being enrolled in private schools, with 82 (63.1% in the age bracket) enrolled. Conversely, the age group of 25 to 34 year olds has the lowest likelihood of being enrolled in a private school, with 61 (100.0% in the age bracket) attending a public institution.
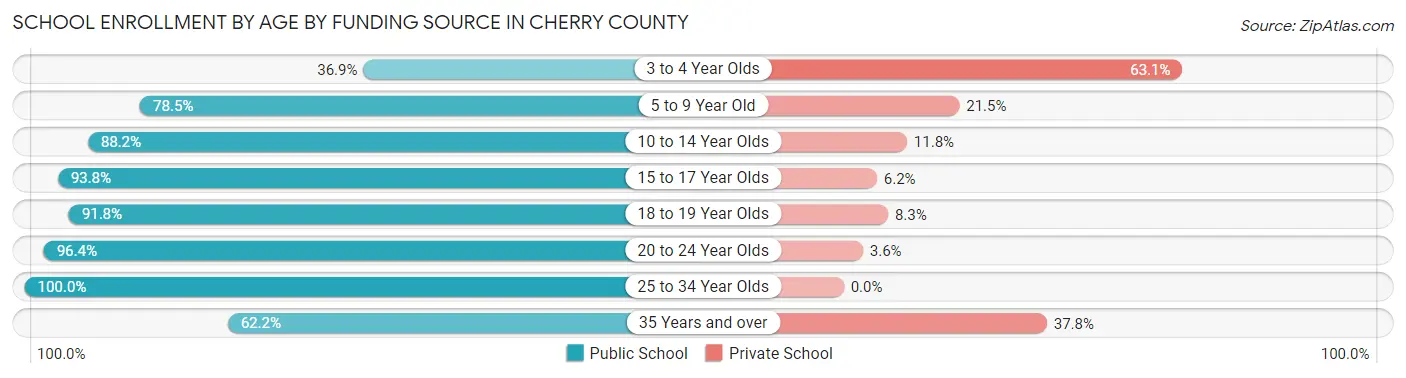
| Age Bracket | Public School | Private School |
| 3 to 4 Year Olds | 48 (36.9%) | 82 (63.1%) |
| 5 to 9 Year Old | 266 (78.5%) | 73 (21.5%) |
| 10 to 14 Year Olds | 292 (88.2%) | 39 (11.8%) |
| 15 to 17 Year Olds | 243 (93.8%) | 16 (6.2%) |
| 18 to 19 Year Olds | 89 (91.7%) | 8 (8.3%) |
| 20 to 24 Year Olds | 54 (96.4%) | 2 (3.6%) |
| 25 to 34 Year Olds | 61 (100.0%) | 0 (0.0%) |
| 35 Years and over | 23 (62.2%) | 14 (37.8%) |
| Total | 1,076 (82.1%) | 234 (17.9%) |
Educational Attainment by Field of Study in Cherry County
Education (280 | 26.0%), bio, nature & agricultural (244 | 22.7%), business (167 | 15.5%), arts & humanities (159 | 14.8%), and science & technology (101 | 9.4%) are the most common fields of study among 1,076 individuals in Cherry County who have obtained a bachelor's degree or higher.
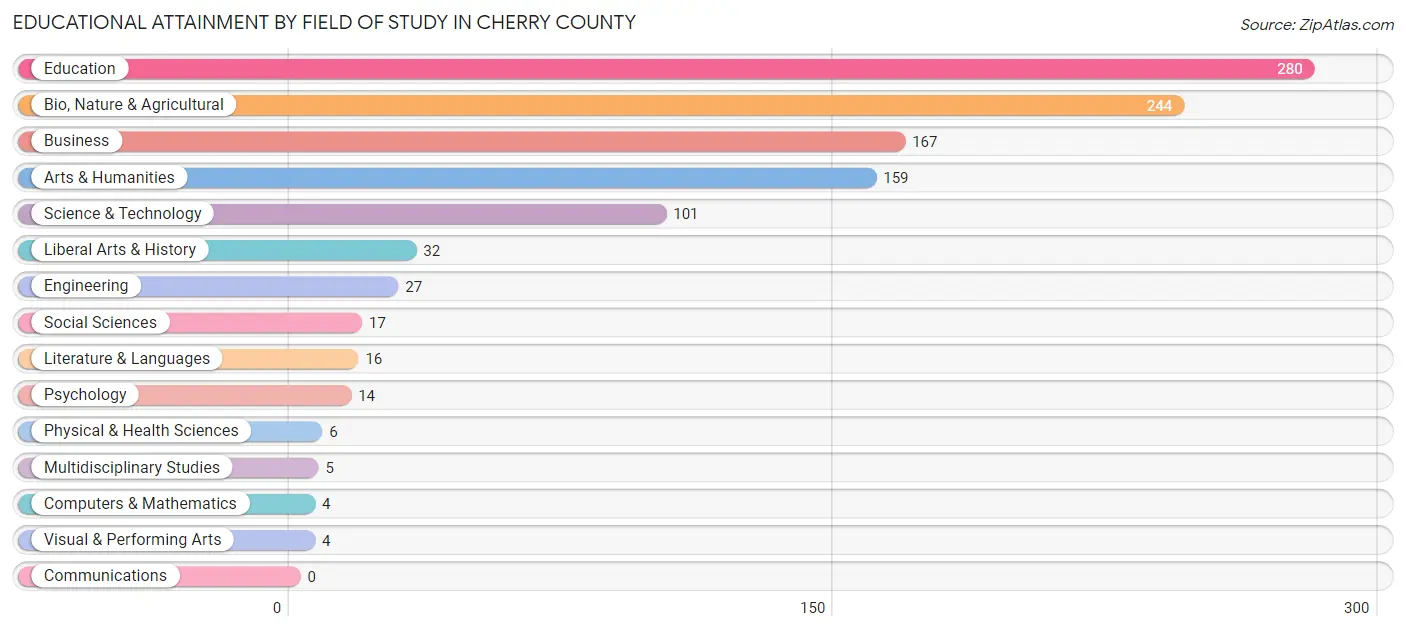
| Field of Study | # Graduates | % Graduates |
| Computers & Mathematics | 4 | 0.4% |
| Bio, Nature & Agricultural | 244 | 22.7% |
| Physical & Health Sciences | 6 | 0.6% |
| Psychology | 14 | 1.3% |
| Social Sciences | 17 | 1.6% |
| Engineering | 27 | 2.5% |
| Multidisciplinary Studies | 5 | 0.5% |
| Science & Technology | 101 | 9.4% |
| Business | 167 | 15.5% |
| Education | 280 | 26.0% |
| Literature & Languages | 16 | 1.5% |
| Liberal Arts & History | 32 | 3.0% |
| Visual & Performing Arts | 4 | 0.4% |
| Communications | 0 | 0.0% |
| Arts & Humanities | 159 | 14.8% |
| Total | 1,076 | 100.0% |
Transportation & Commute in Cherry County
Vehicle Availability by Sex in Cherry County
The most prevalent vehicle ownership categories in Cherry County are males with 2 vehicles (700, accounting for 44.8%) and females with 2 vehicles (386, making up 58.0%).
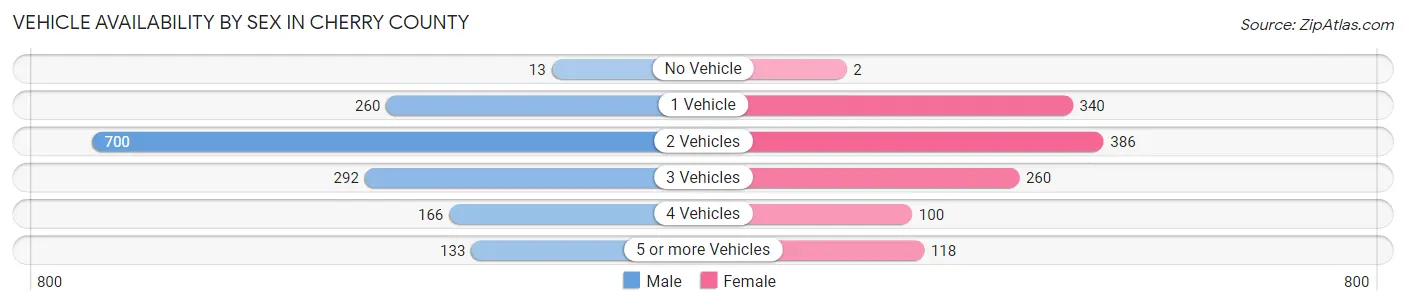
| Vehicles Available | Male | Female |
| No Vehicle | 13 (0.8%) | 2 (0.2%) |
| 1 Vehicle | 260 (16.6%) | 340 (28.2%) |
| 2 Vehicles | 700 (44.8%) | 386 (32.0%) |
| 3 Vehicles | 292 (18.7%) | 260 (21.6%) |
| 4 Vehicles | 166 (10.6%) | 100 (8.3%) |
| 5 or more Vehicles | 133 (8.5%) | 118 (9.8%) |
| Total | 1,564 (100.0%) | 1,206 (100.0%) |
Commute Time in Cherry County
The most frequently occuring commute durations in Cherry County are 5 to 9 minutes (776 commuters, 31.1%), less than 5 minutes (685 commuters, 27.5%), and 10 to 14 minutes (319 commuters, 12.8%).
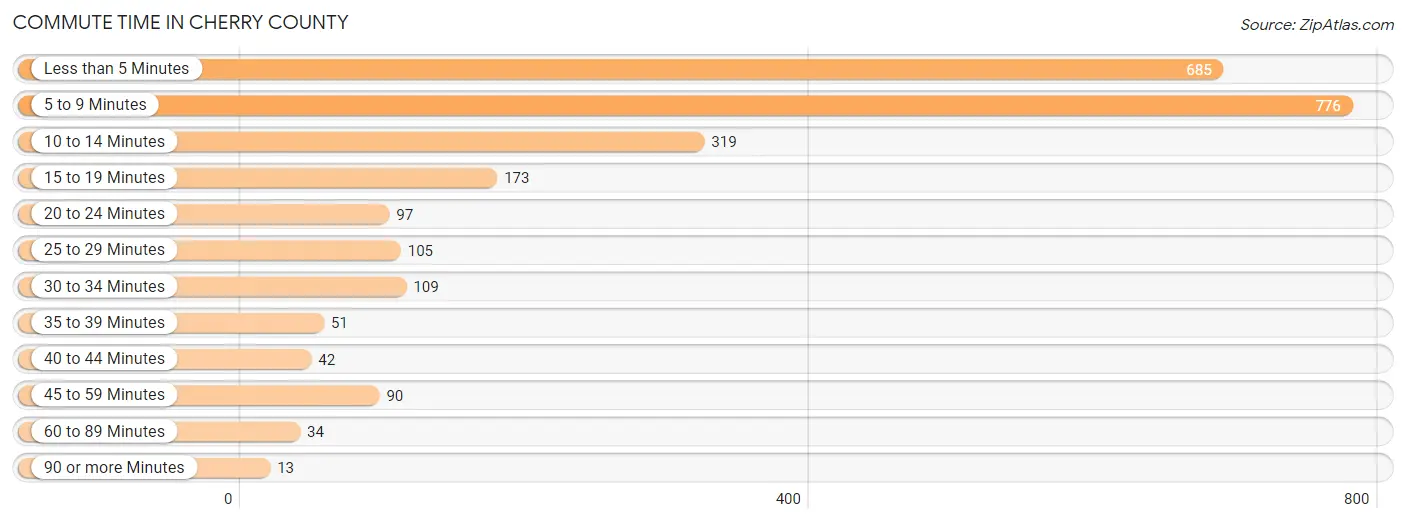
| Commute Time | # Commuters | % Commuters |
| Less than 5 Minutes | 685 | 27.5% |
| 5 to 9 Minutes | 776 | 31.1% |
| 10 to 14 Minutes | 319 | 12.8% |
| 15 to 19 Minutes | 173 | 6.9% |
| 20 to 24 Minutes | 97 | 3.9% |
| 25 to 29 Minutes | 105 | 4.2% |
| 30 to 34 Minutes | 109 | 4.4% |
| 35 to 39 Minutes | 51 | 2.0% |
| 40 to 44 Minutes | 42 | 1.7% |
| 45 to 59 Minutes | 90 | 3.6% |
| 60 to 89 Minutes | 34 | 1.4% |
| 90 or more Minutes | 13 | 0.5% |
Commute Time by Sex in Cherry County
The most common commute times in Cherry County are less than 5 minutes (476 commuters, 34.9%) for males and 5 to 9 minutes (396 commuters, 35.0%) for females.
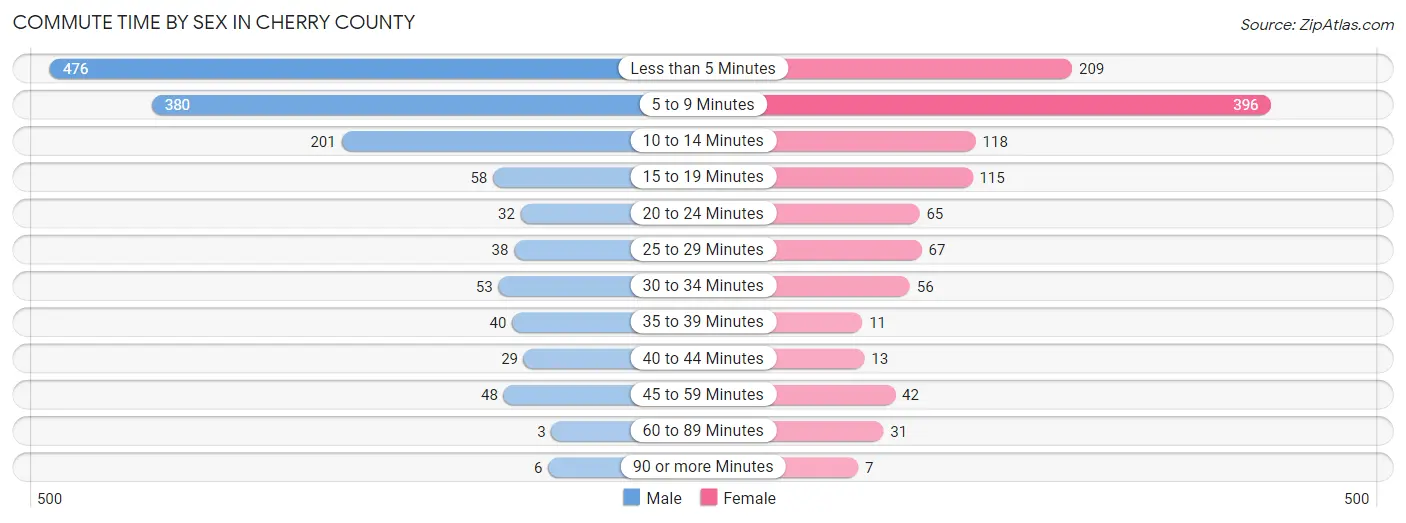
| Commute Time | Male | Female |
| Less than 5 Minutes | 476 (34.9%) | 209 (18.5%) |
| 5 to 9 Minutes | 380 (27.9%) | 396 (35.0%) |
| 10 to 14 Minutes | 201 (14.7%) | 118 (10.4%) |
| 15 to 19 Minutes | 58 (4.3%) | 115 (10.2%) |
| 20 to 24 Minutes | 32 (2.4%) | 65 (5.8%) |
| 25 to 29 Minutes | 38 (2.8%) | 67 (5.9%) |
| 30 to 34 Minutes | 53 (3.9%) | 56 (5.0%) |
| 35 to 39 Minutes | 40 (2.9%) | 11 (1.0%) |
| 40 to 44 Minutes | 29 (2.1%) | 13 (1.1%) |
| 45 to 59 Minutes | 48 (3.5%) | 42 (3.7%) |
| 60 to 89 Minutes | 3 (0.2%) | 31 (2.7%) |
| 90 or more Minutes | 6 (0.4%) | 7 (0.6%) |
Time of Departure to Work by Sex in Cherry County
The most frequent times of departure to work in Cherry County are 7:30 AM to 7:59 AM (384, 28.1%) for males and 7:30 AM to 7:59 AM (311, 27.5%) for females.
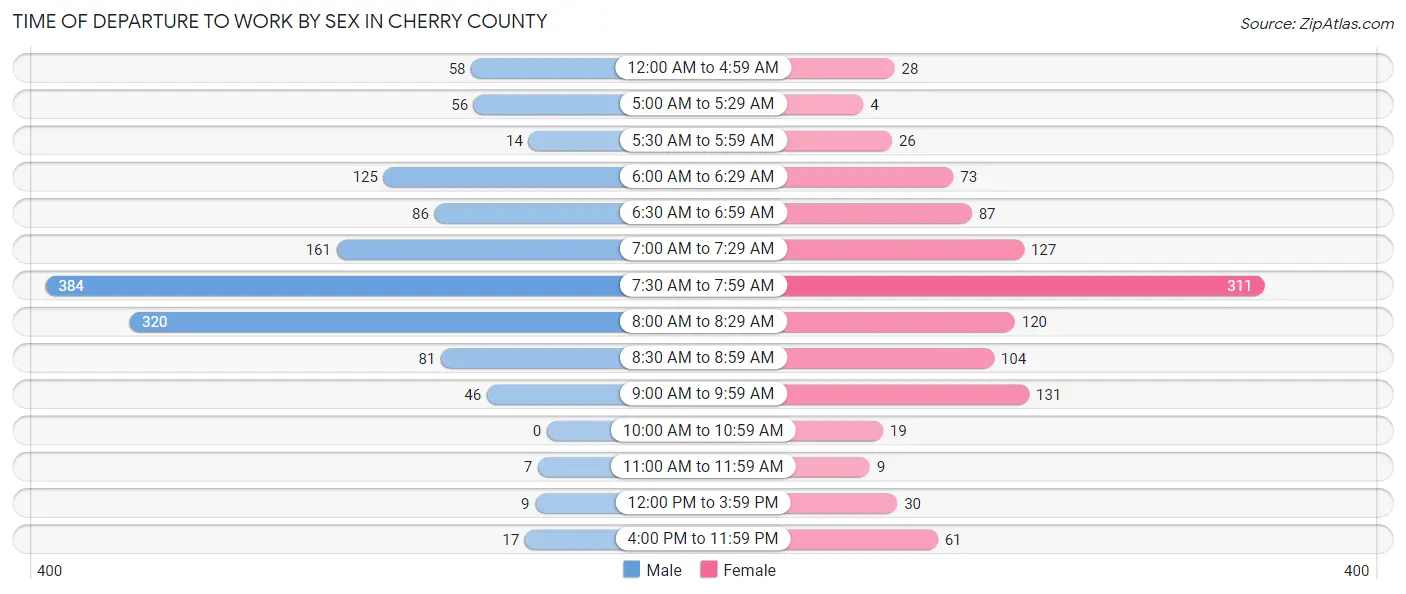
| Time of Departure | Male | Female |
| 12:00 AM to 4:59 AM | 58 (4.3%) | 28 (2.5%) |
| 5:00 AM to 5:29 AM | 56 (4.1%) | 4 (0.4%) |
| 5:30 AM to 5:59 AM | 14 (1.0%) | 26 (2.3%) |
| 6:00 AM to 6:29 AM | 125 (9.2%) | 73 (6.5%) |
| 6:30 AM to 6:59 AM | 86 (6.3%) | 87 (7.7%) |
| 7:00 AM to 7:29 AM | 161 (11.8%) | 127 (11.2%) |
| 7:30 AM to 7:59 AM | 384 (28.1%) | 311 (27.5%) |
| 8:00 AM to 8:29 AM | 320 (23.5%) | 120 (10.6%) |
| 8:30 AM to 8:59 AM | 81 (5.9%) | 104 (9.2%) |
| 9:00 AM to 9:59 AM | 46 (3.4%) | 131 (11.6%) |
| 10:00 AM to 10:59 AM | 0 (0.0%) | 19 (1.7%) |
| 11:00 AM to 11:59 AM | 7 (0.5%) | 9 (0.8%) |
| 12:00 PM to 3:59 PM | 9 (0.7%) | 30 (2.6%) |
| 4:00 PM to 11:59 PM | 17 (1.3%) | 61 (5.4%) |
| Total | 1,364 (100.0%) | 1,130 (100.0%) |
Housing Occupancy in Cherry County
Occupancy by Ownership in Cherry County
Of the total 2,110 dwellings in Cherry County, owner-occupied units account for 1,213 (57.5%), while renter-occupied units make up 897 (42.5%).
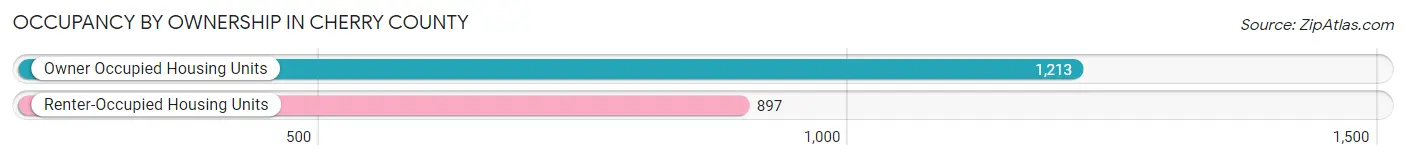
| Occupancy | # Housing Units | % Housing Units |
| Owner Occupied Housing Units | 1,213 | 57.5% |
| Renter-Occupied Housing Units | 897 | 42.5% |
| Total Occupied Housing Units | 2,110 | 100.0% |
Occupancy by Household Size in Cherry County
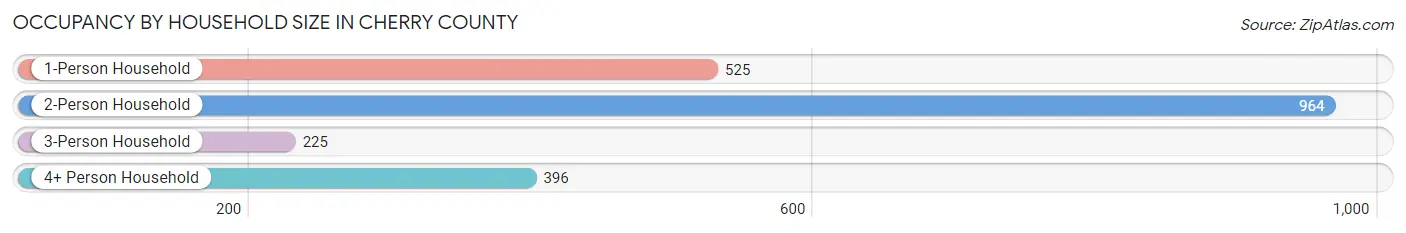
| Household Size | # Housing Units | % Housing Units |
| 1-Person Household | 525 | 24.9% |
| 2-Person Household | 964 | 45.7% |
| 3-Person Household | 225 | 10.7% |
| 4+ Person Household | 396 | 18.8% |
| Total Housing Units | 2,110 | 100.0% |
Occupancy by Ownership by Household Size in Cherry County
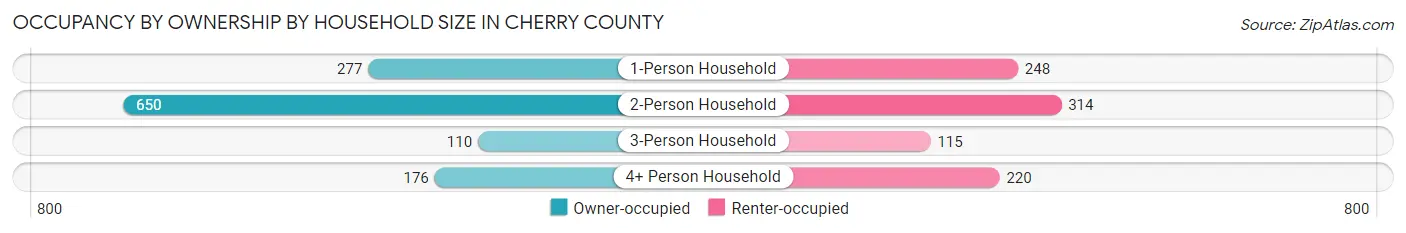
| Household Size | Owner-occupied | Renter-occupied |
| 1-Person Household | 277 (52.8%) | 248 (47.2%) |
| 2-Person Household | 650 (67.4%) | 314 (32.6%) |
| 3-Person Household | 110 (48.9%) | 115 (51.1%) |
| 4+ Person Household | 176 (44.4%) | 220 (55.6%) |
| Total Housing Units | 1,213 (57.5%) | 897 (42.5%) |
Occupancy by Educational Attainment in Cherry County
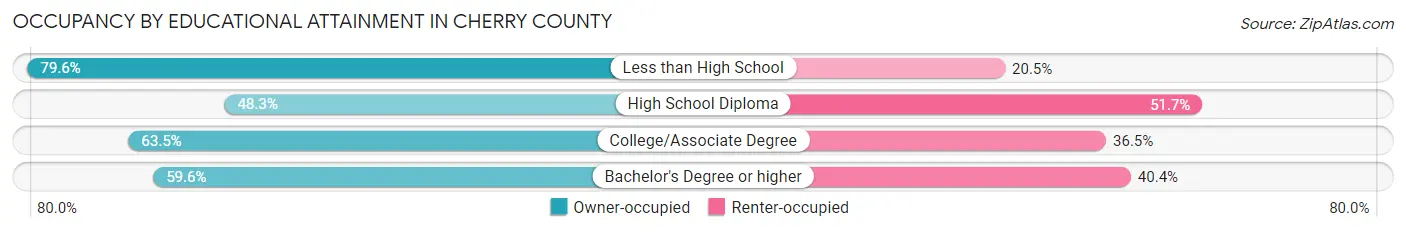
| Household Size | Owner-occupied | Renter-occupied |
| Less than High School | 35 (79.5%) | 9 (20.4%) |
| High School Diploma | 352 (48.3%) | 377 (51.7%) |
| College/Associate Degree | 472 (63.5%) | 271 (36.5%) |
| Bachelor's Degree or higher | 354 (59.6%) | 240 (40.4%) |
Occupancy by Age of Householder in Cherry County
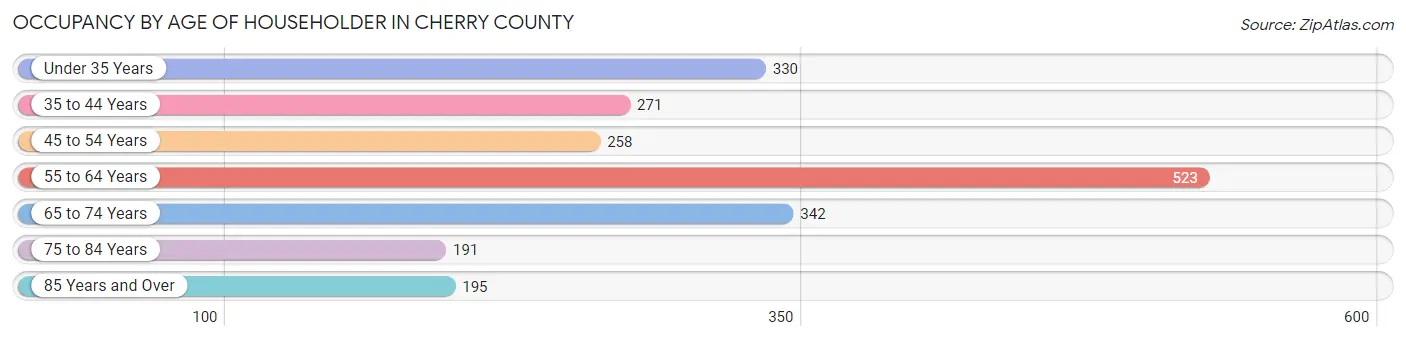
| Age Bracket | # Households | % Households |
| Under 35 Years | 330 | 15.6% |
| 35 to 44 Years | 271 | 12.8% |
| 45 to 54 Years | 258 | 12.2% |
| 55 to 64 Years | 523 | 24.8% |
| 65 to 74 Years | 342 | 16.2% |
| 75 to 84 Years | 191 | 9.0% |
| 85 Years and Over | 195 | 9.2% |
| Total | 2,110 | 100.0% |
Housing Finances in Cherry County
Median Income by Occupancy in Cherry County
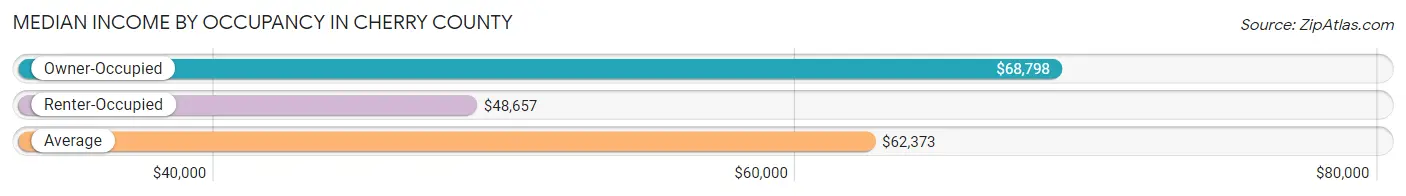
| Occupancy Type | # Households | Median Income |
| Owner-Occupied | 1,213 (57.5%) | $68,798 |
| Renter-Occupied | 897 (42.5%) | $48,657 |
| Average | 2,110 (100.0%) | $62,373 |
Occupancy by Householder Income Bracket in Cherry County
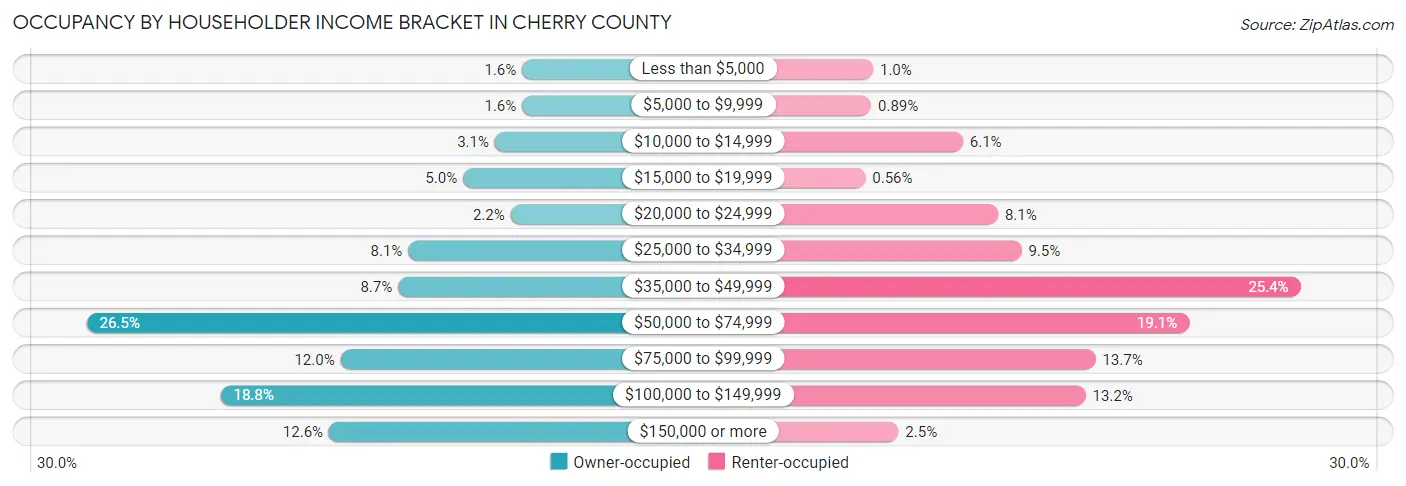
| Income Bracket | Owner-occupied | Renter-occupied |
| Less than $5,000 | 19 (1.6%) | 9 (1.0%) |
| $5,000 to $9,999 | 19 (1.6%) | 8 (0.9%) |
| $10,000 to $14,999 | 38 (3.1%) | 55 (6.1%) |
| $15,000 to $19,999 | 60 (5.0%) | 5 (0.6%) |
| $20,000 to $24,999 | 27 (2.2%) | 73 (8.1%) |
| $25,000 to $34,999 | 98 (8.1%) | 85 (9.5%) |
| $35,000 to $49,999 | 105 (8.7%) | 228 (25.4%) |
| $50,000 to $74,999 | 321 (26.5%) | 171 (19.1%) |
| $75,000 to $99,999 | 145 (11.9%) | 123 (13.7%) |
| $100,000 to $149,999 | 228 (18.8%) | 118 (13.2%) |
| $150,000 or more | 153 (12.6%) | 22 (2.5%) |
| Total | 1,213 (100.0%) | 897 (100.0%) |
Monthly Housing Cost Tiers in Cherry County
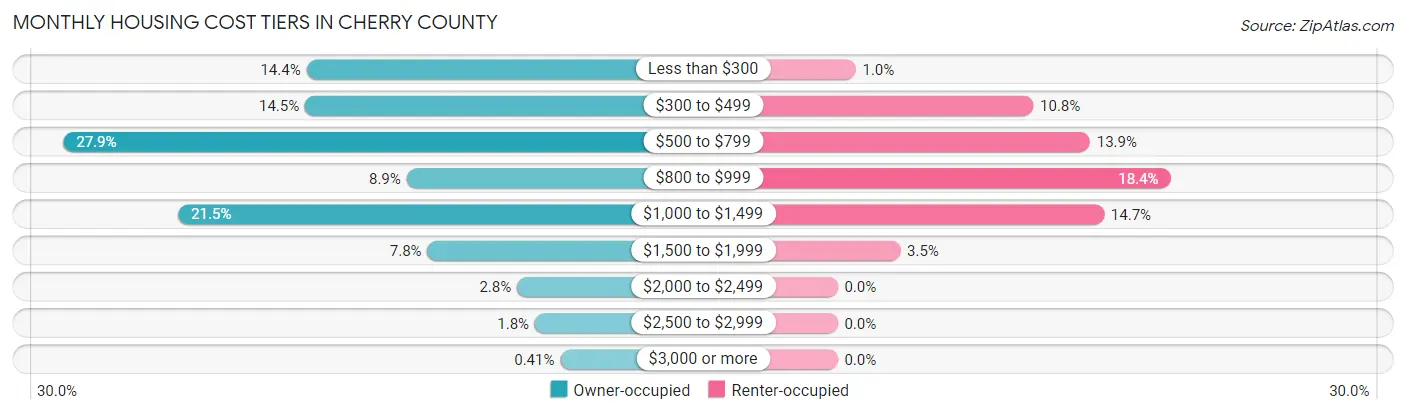
| Monthly Cost | Owner-occupied | Renter-occupied |
| Less than $300 | 175 (14.4%) | 9 (1.0%) |
| $300 to $499 | 176 (14.5%) | 97 (10.8%) |
| $500 to $799 | 338 (27.9%) | 125 (13.9%) |
| $800 to $999 | 108 (8.9%) | 165 (18.4%) |
| $1,000 to $1,499 | 261 (21.5%) | 132 (14.7%) |
| $1,500 to $1,999 | 94 (7.7%) | 31 (3.5%) |
| $2,000 to $2,499 | 34 (2.8%) | 0 (0.0%) |
| $2,500 to $2,999 | 22 (1.8%) | 0 (0.0%) |
| $3,000 or more | 5 (0.4%) | 0 (0.0%) |
| Total | 1,213 (100.0%) | 897 (100.0%) |
Physical Housing Characteristics in Cherry County
Housing Structures in Cherry County
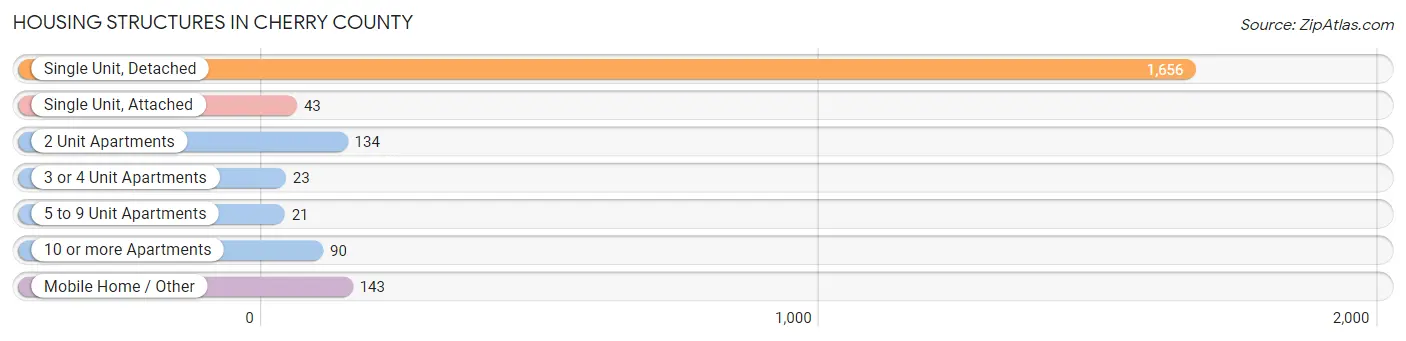
| Structure Type | # Housing Units | % Housing Units |
| Single Unit, Detached | 1,656 | 78.5% |
| Single Unit, Attached | 43 | 2.0% |
| 2 Unit Apartments | 134 | 6.4% |
| 3 or 4 Unit Apartments | 23 | 1.1% |
| 5 to 9 Unit Apartments | 21 | 1.0% |
| 10 or more Apartments | 90 | 4.3% |
| Mobile Home / Other | 143 | 6.8% |
| Total | 2,110 | 100.0% |
Housing Structures by Occupancy in Cherry County
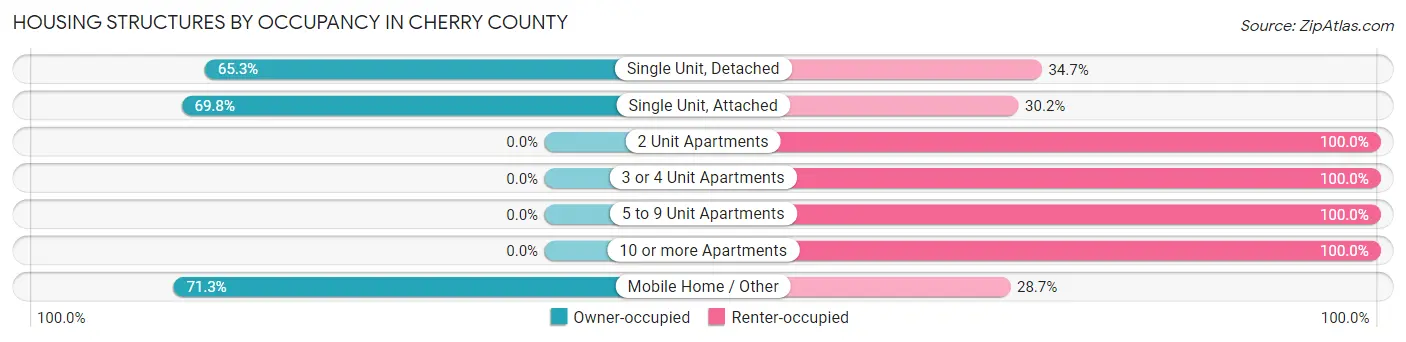
| Structure Type | Owner-occupied | Renter-occupied |
| Single Unit, Detached | 1,081 (65.3%) | 575 (34.7%) |
| Single Unit, Attached | 30 (69.8%) | 13 (30.2%) |
| 2 Unit Apartments | 0 (0.0%) | 134 (100.0%) |
| 3 or 4 Unit Apartments | 0 (0.0%) | 23 (100.0%) |
| 5 to 9 Unit Apartments | 0 (0.0%) | 21 (100.0%) |
| 10 or more Apartments | 0 (0.0%) | 90 (100.0%) |
| Mobile Home / Other | 102 (71.3%) | 41 (28.7%) |
| Total | 1,213 (57.5%) | 897 (42.5%) |
Housing Structures by Number of Rooms in Cherry County
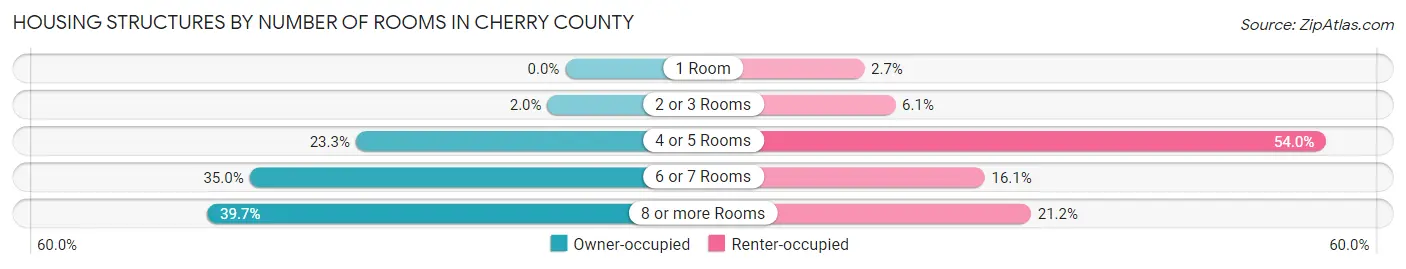
| Number of Rooms | Owner-occupied | Renter-occupied |
| 1 Room | 0 (0.0%) | 24 (2.7%) |
| 2 or 3 Rooms | 24 (2.0%) | 55 (6.1%) |
| 4 or 5 Rooms | 282 (23.3%) | 484 (54.0%) |
| 6 or 7 Rooms | 425 (35.0%) | 144 (16.1%) |
| 8 or more Rooms | 482 (39.7%) | 190 (21.2%) |
| Total | 1,213 (100.0%) | 897 (100.0%) |
Housing Structure by Heating Type in Cherry County
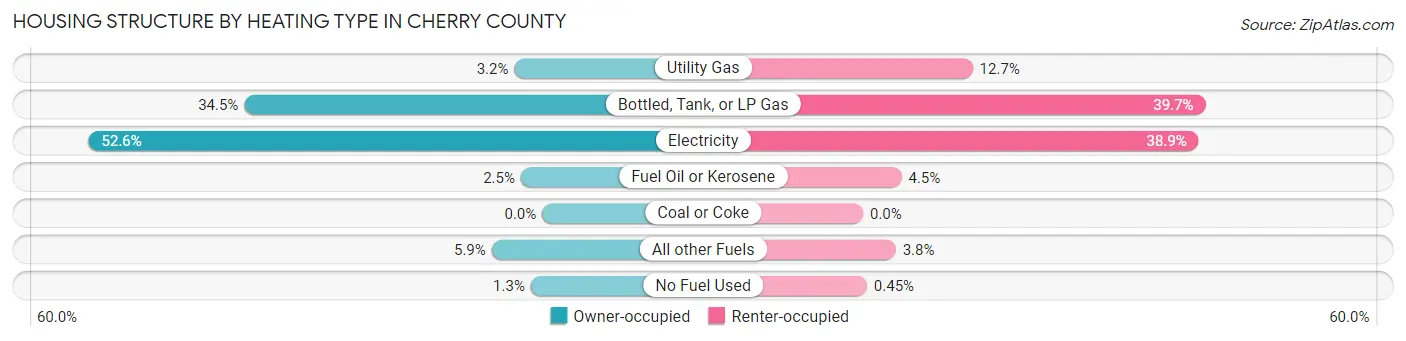
| Heating Type | Owner-occupied | Renter-occupied |
| Utility Gas | 39 (3.2%) | 114 (12.7%) |
| Bottled, Tank, or LP Gas | 419 (34.5%) | 356 (39.7%) |
| Electricity | 638 (52.6%) | 349 (38.9%) |
| Fuel Oil or Kerosene | 30 (2.5%) | 40 (4.5%) |
| Coal or Coke | 0 (0.0%) | 0 (0.0%) |
| All other Fuels | 71 (5.9%) | 34 (3.8%) |
| No Fuel Used | 16 (1.3%) | 4 (0.4%) |
| Total | 1,213 (100.0%) | 897 (100.0%) |
Household Vehicle Usage in Cherry County
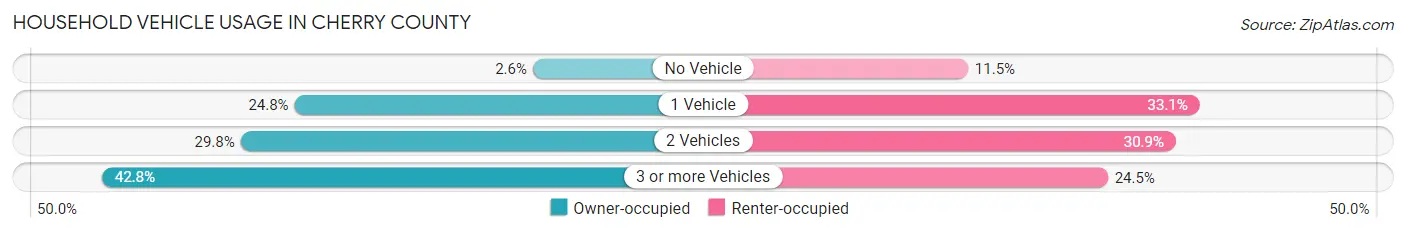
| Vehicles per Household | Owner-occupied | Renter-occupied |
| No Vehicle | 31 (2.6%) | 103 (11.5%) |
| 1 Vehicle | 301 (24.8%) | 297 (33.1%) |
| 2 Vehicles | 362 (29.8%) | 277 (30.9%) |
| 3 or more Vehicles | 519 (42.8%) | 220 (24.5%) |
| Total | 1,213 (100.0%) | 897 (100.0%) |
Real Estate & Mortgages in Cherry County
Real Estate and Mortgage Overview in Cherry County
| Characteristic | Without Mortgage | With Mortgage |
| Housing Units | 722 | 491 |
| Median Property Value | $120,600 | $149,800 |
| Median Household Income | $62,188 | $48 |
| Monthly Housing Costs | $521 | $5 |
| Real Estate Taxes | $1,593 | $18 |
Property Value by Mortgage Status in Cherry County
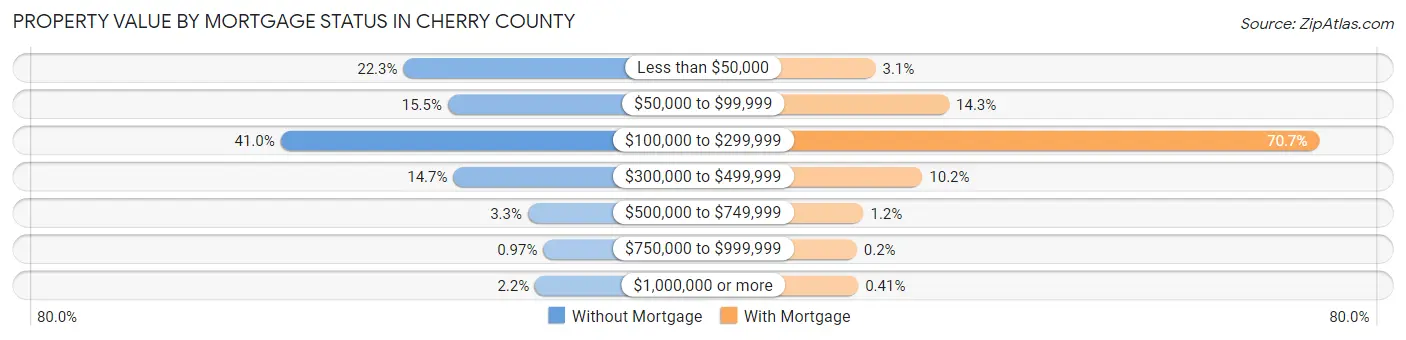
| Property Value | Without Mortgage | With Mortgage |
| Less than $50,000 | 161 (22.3%) | 15 (3.0%) |
| $50,000 to $99,999 | 112 (15.5%) | 70 (14.3%) |
| $100,000 to $299,999 | 296 (41.0%) | 347 (70.7%) |
| $300,000 to $499,999 | 106 (14.7%) | 50 (10.2%) |
| $500,000 to $749,999 | 24 (3.3%) | 6 (1.2%) |
| $750,000 to $999,999 | 7 (1.0%) | 1 (0.2%) |
| $1,000,000 or more | 16 (2.2%) | 2 (0.4%) |
| Total | 722 (100.0%) | 491 (100.0%) |
Household Income by Mortgage Status in Cherry County
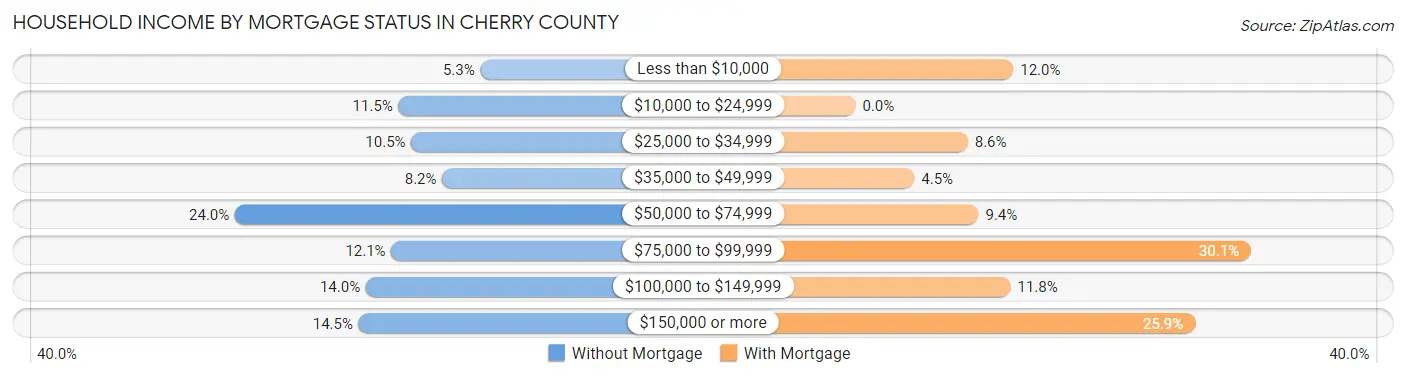
| Household Income | Without Mortgage | With Mortgage |
| Less than $10,000 | 38 (5.3%) | 59 (12.0%) |
| $10,000 to $24,999 | 83 (11.5%) | 0 (0.0%) |
| $25,000 to $34,999 | 76 (10.5%) | 42 (8.6%) |
| $35,000 to $49,999 | 59 (8.2%) | 22 (4.5%) |
| $50,000 to $74,999 | 173 (24.0%) | 46 (9.4%) |
| $75,000 to $99,999 | 87 (12.0%) | 148 (30.1%) |
| $100,000 to $149,999 | 101 (14.0%) | 58 (11.8%) |
| $150,000 or more | 105 (14.5%) | 127 (25.9%) |
| Total | 722 (100.0%) | 491 (100.0%) |
Property Value to Household Income Ratio in Cherry County
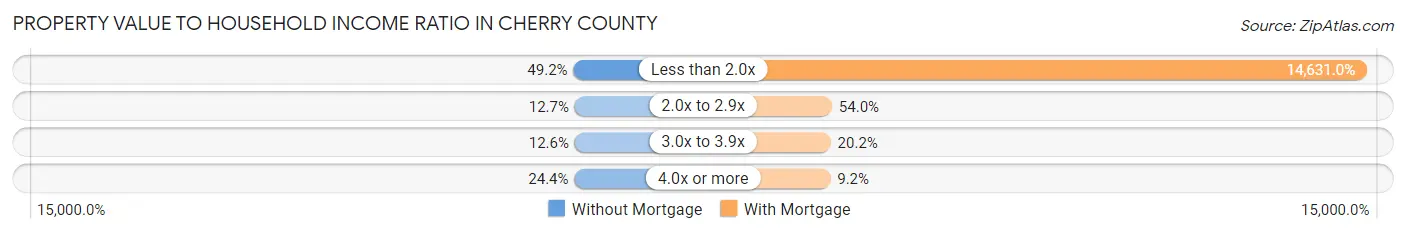
| Value-to-Income Ratio | Without Mortgage | With Mortgage |
| Less than 2.0x | 355 (49.2%) | 71,838 (14,631.0%) |
| 2.0x to 2.9x | 92 (12.7%) | 265 (54.0%) |
| 3.0x to 3.9x | 91 (12.6%) | 99 (20.2%) |
| 4.0x or more | 176 (24.4%) | 45 (9.2%) |
| Total | 722 (100.0%) | 491 (100.0%) |
Real Estate Taxes by Mortgage Status in Cherry County
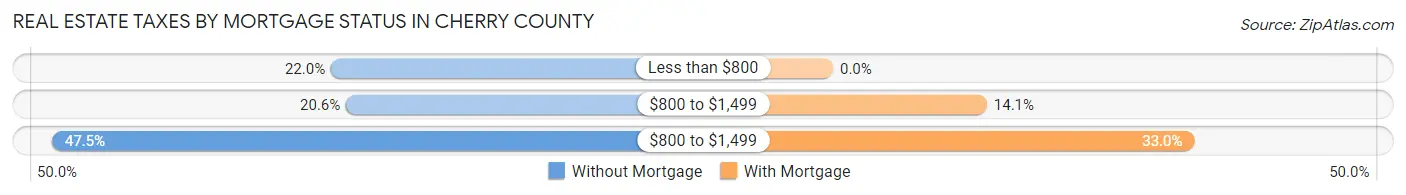
| Property Taxes | Without Mortgage | With Mortgage |
| Less than $800 | 159 (22.0%) | 0 (0.0%) |
| $800 to $1,499 | 149 (20.6%) | 69 (14.1%) |
| $800 to $1,499 | 343 (47.5%) | 162 (33.0%) |
| Total | 722 (100.0%) | 491 (100.0%) |
Health & Disability in Cherry County
Health Insurance Coverage by Age in Cherry County
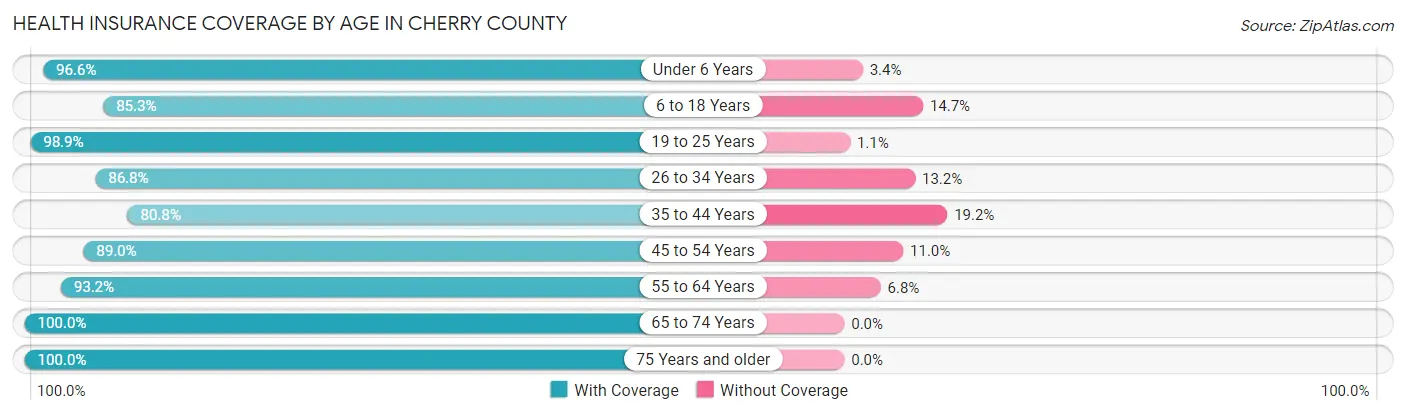
| Age Bracket | With Coverage | Without Coverage |
| Under 6 Years | 421 (96.6%) | 15 (3.4%) |
| 6 to 18 Years | 826 (85.3%) | 142 (14.7%) |
| 19 to 25 Years | 375 (98.9%) | 4 (1.1%) |
| 26 to 34 Years | 454 (86.8%) | 69 (13.2%) |
| 35 to 44 Years | 518 (80.8%) | 123 (19.2%) |
| 45 to 54 Years | 487 (89.0%) | 60 (11.0%) |
| 55 to 64 Years | 758 (93.2%) | 55 (6.8%) |
| 65 to 74 Years | 599 (100.0%) | 0 (0.0%) |
| 75 Years and older | 514 (100.0%) | 0 (0.0%) |
| Total | 4,952 (91.4%) | 468 (8.6%) |
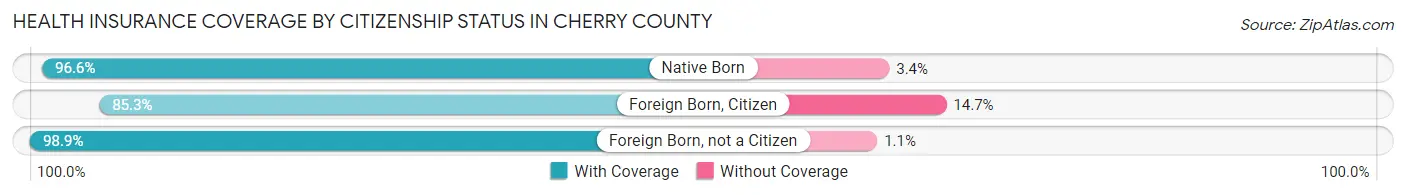
Health Insurance Coverage by Citizenship Status in Cherry County
| Citizenship Status | With Coverage | Without Coverage |
| Native Born | 421 (96.6%) | 15 (3.4%) |
| Foreign Born, Citizen | 826 (85.3%) | 142 (14.7%) |
| Foreign Born, not a Citizen | 375 (98.9%) | 4 (1.1%) |
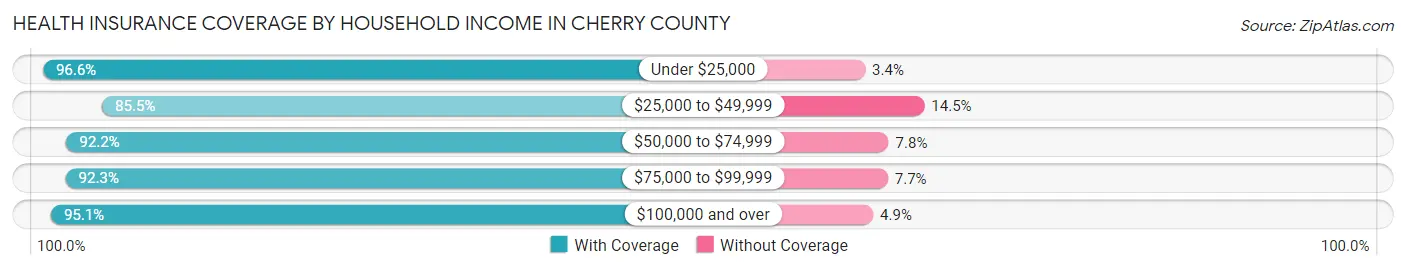
Health Insurance Coverage by Household Income in Cherry County
| Household Income | With Coverage | Without Coverage |
| Under $25,000 | 506 (96.6%) | 18 (3.4%) |
| $25,000 to $49,999 | 1,228 (85.5%) | 209 (14.5%) |
| $50,000 to $74,999 | 975 (92.2%) | 83 (7.8%) |
| $75,000 to $99,999 | 708 (92.3%) | 59 (7.7%) |
| $100,000 and over | 1,500 (95.1%) | 78 (4.9%) |
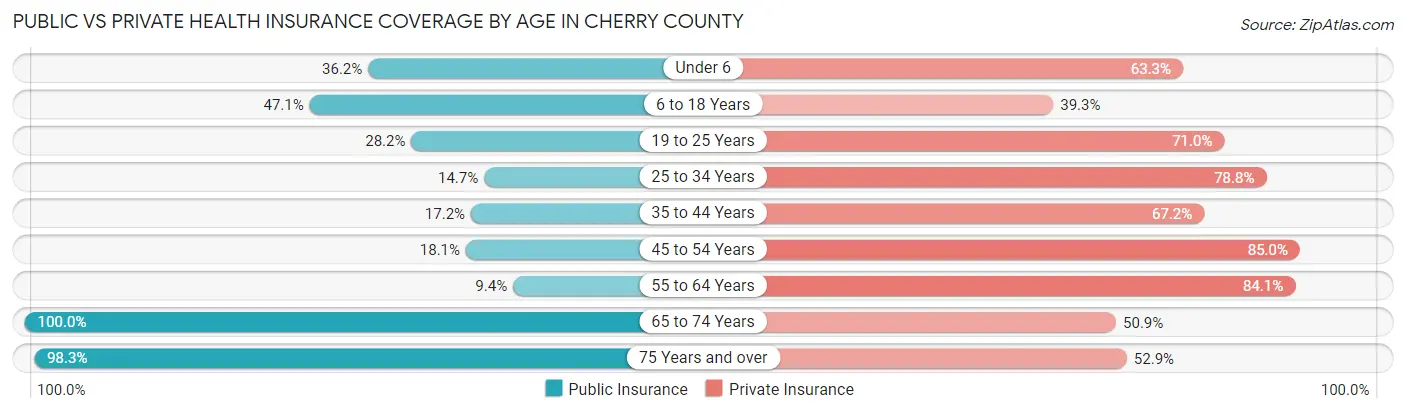
Public vs Private Health Insurance Coverage by Age in Cherry County
| Age Bracket | Public Insurance | Private Insurance |
| Under 6 | 158 (36.2%) | 276 (63.3%) |
| 6 to 18 Years | 456 (47.1%) | 380 (39.3%) |
| 19 to 25 Years | 107 (28.2%) | 269 (71.0%) |
| 25 to 34 Years | 77 (14.7%) | 412 (78.8%) |
| 35 to 44 Years | 110 (17.2%) | 431 (67.2%) |
| 45 to 54 Years | 99 (18.1%) | 465 (85.0%) |
| 55 to 64 Years | 76 (9.3%) | 684 (84.1%) |
| 65 to 74 Years | 599 (100.0%) | 305 (50.9%) |
| 75 Years and over | 505 (98.3%) | 272 (52.9%) |
| Total | 2,187 (40.4%) | 3,494 (64.5%) |
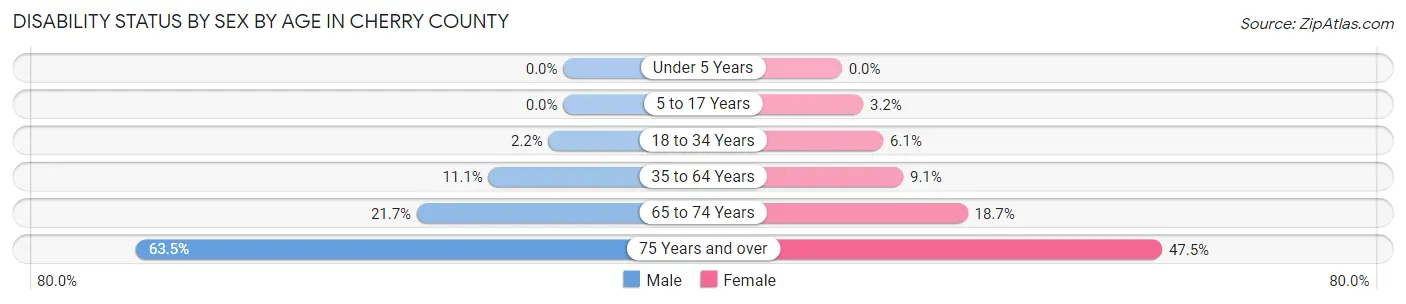
Disability Status by Sex by Age in Cherry County
| Age Bracket | Male | Female |
| Under 5 Years | 0 (0.0%) | 0 (0.0%) |
| 5 to 17 Years | 0 (0.0%) | 14 (3.2%) |
| 18 to 34 Years | 12 (2.2%) | 27 (6.1%) |
| 35 to 64 Years | 117 (11.1%) | 86 (9.1%) |
| 65 to 74 Years | 65 (21.7%) | 56 (18.7%) |
| 75 Years and over | 146 (63.5%) | 135 (47.5%) |
Disability Class by Sex by Age in Cherry County
Disability Class: Hearing Difficulty
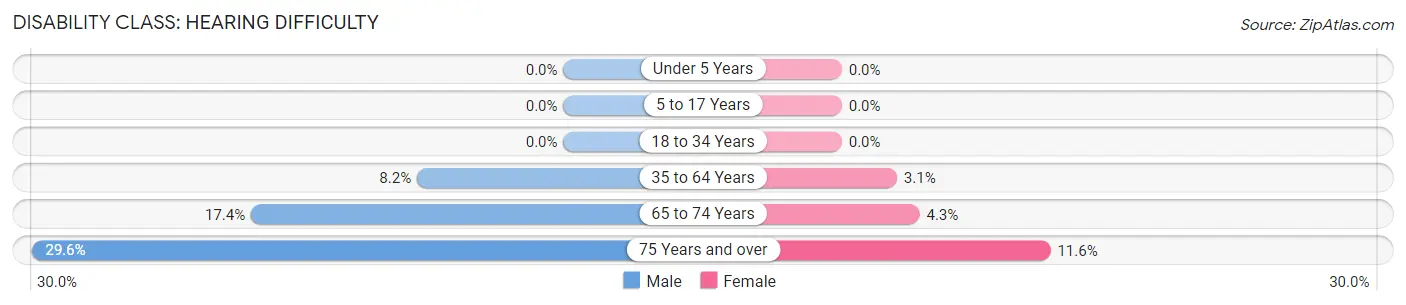
| Age Bracket | Male | Female |
| Under 5 Years | 0 (0.0%) | 0 (0.0%) |
| 5 to 17 Years | 0 (0.0%) | 0 (0.0%) |
| 18 to 34 Years | 0 (0.0%) | 0 (0.0%) |
| 35 to 64 Years | 86 (8.2%) | 29 (3.1%) |
| 65 to 74 Years | 52 (17.4%) | 13 (4.3%) |
| 75 Years and over | 68 (29.6%) | 33 (11.6%) |
Disability Class: Vision Difficulty
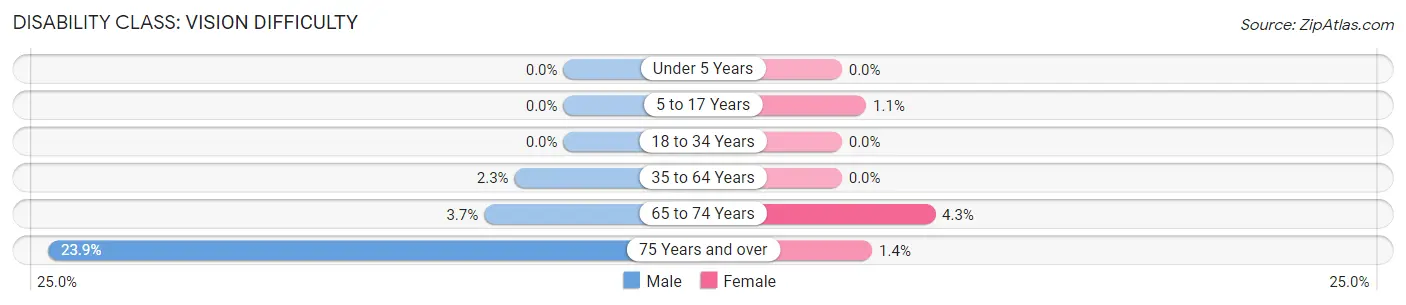
| Age Bracket | Male | Female |
| Under 5 Years | 0 (0.0%) | 0 (0.0%) |
| 5 to 17 Years | 0 (0.0%) | 5 (1.1%) |
| 18 to 34 Years | 0 (0.0%) | 0 (0.0%) |
| 35 to 64 Years | 24 (2.3%) | 0 (0.0%) |
| 65 to 74 Years | 11 (3.7%) | 13 (4.3%) |
| 75 Years and over | 55 (23.9%) | 4 (1.4%) |
Disability Class: Cognitive Difficulty
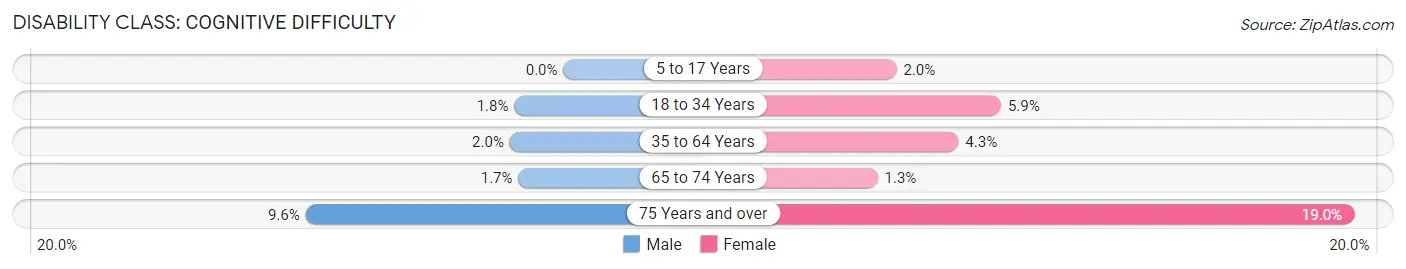
| Age Bracket | Male | Female |
| 5 to 17 Years | 0 (0.0%) | 9 (2.0%) |
| 18 to 34 Years | 10 (1.8%) | 26 (5.9%) |
| 35 to 64 Years | 21 (2.0%) | 41 (4.3%) |
| 65 to 74 Years | 5 (1.7%) | 4 (1.3%) |
| 75 Years and over | 22 (9.6%) | 54 (19.0%) |
Disability Class: Ambulatory Difficulty
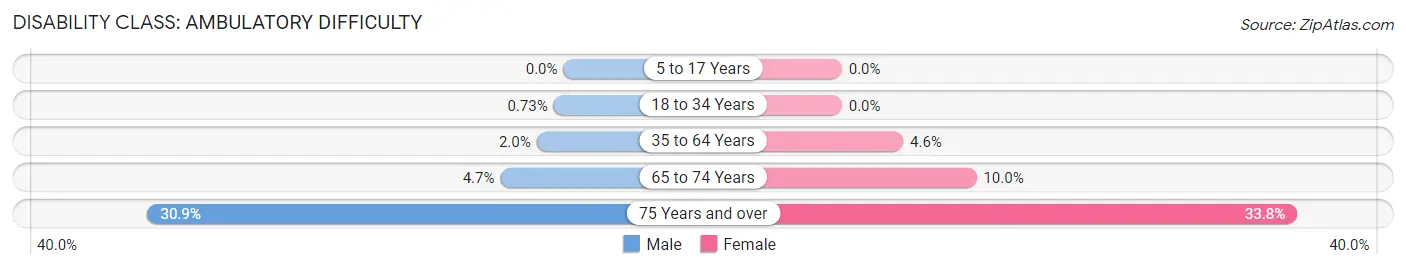
| Age Bracket | Male | Female |
| 5 to 17 Years | 0 (0.0%) | 0 (0.0%) |
| 18 to 34 Years | 4 (0.7%) | 0 (0.0%) |
| 35 to 64 Years | 21 (2.0%) | 43 (4.5%) |
| 65 to 74 Years | 14 (4.7%) | 30 (10.0%) |
| 75 Years and over | 71 (30.9%) | 96 (33.8%) |
Disability Class: Self-Care Difficulty
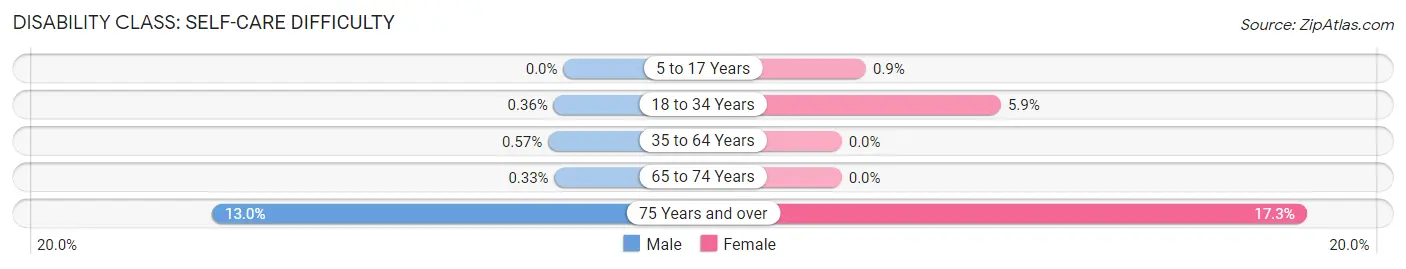
| Age Bracket | Male | Female |
| 5 to 17 Years | 0 (0.0%) | 4 (0.9%) |
| 18 to 34 Years | 2 (0.4%) | 26 (5.9%) |
| 35 to 64 Years | 6 (0.6%) | 0 (0.0%) |
| 65 to 74 Years | 1 (0.3%) | 0 (0.0%) |
| 75 Years and over | 30 (13.0%) | 49 (17.2%) |
Technology Access in Cherry County
Computing Device Access in Cherry County
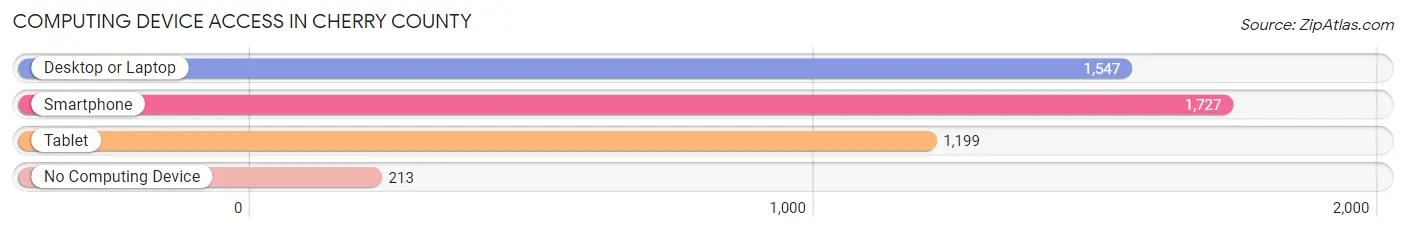
| Device Type | # Households | % Households |
| Desktop or Laptop | 1,547 | 73.3% |
| Smartphone | 1,727 | 81.9% |
| Tablet | 1,199 | 56.8% |
| No Computing Device | 213 | 10.1% |
| Total | 2,110 | 100.0% |
Internet Access in Cherry County
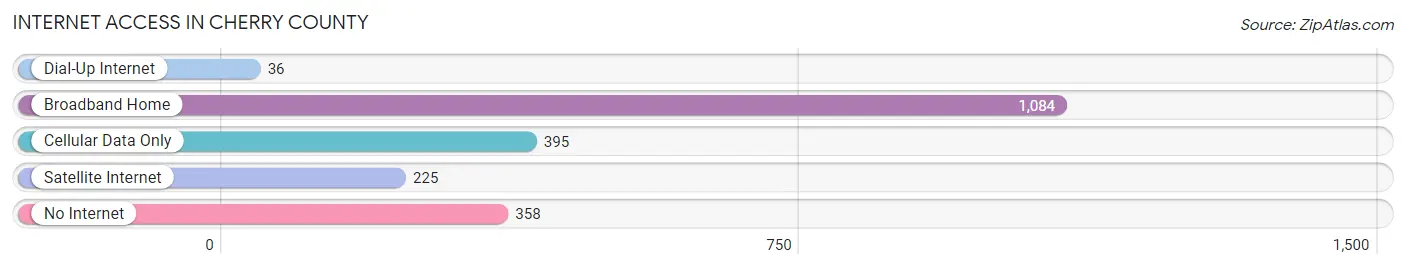
| Internet Type | # Households | % Households |
| Dial-Up Internet | 36 | 1.7% |
| Broadband Home | 1,084 | 51.4% |
| Cellular Data Only | 395 | 18.7% |
| Satellite Internet | 225 | 10.7% |
| No Internet | 358 | 17.0% |
| Total | 2,110 | 100.0% |
Cherry County Summary
Cherry County is located in the north-central region of Nebraska, and is the largest county in the state. It is bordered by Sioux County to the north, Dawes County to the east, Grant County to the south, and the South Dakota border to the west. The county seat is Valentine, and the county was named after Lieutenant Samuel A. Cherry, who was killed in the Battle of White Bird Canyon during the Nez Perce War of 1877.
Geography
Cherry County covers an area of 5,818 square miles, making it the largest county in Nebraska. It is located in the Sandhills region of the state, and is characterized by rolling hills and grasslands. The Niobrara River runs through the county, and there are several small lakes and reservoirs, including Lake McConaughy, which is the largest lake in the state. The county is also home to the Fort Niobrara National Wildlife Refuge, which is a popular destination for birdwatchers and other wildlife enthusiasts.
Demographics
As of the 2010 census, Cherry County had a population of 5,713, making it the least populous county in Nebraska. The population is spread out across the county, with the largest population centers being Valentine, Cody, and Kilgore. The population is predominantly white (96.2%), with small percentages of Native American (1.2%), African American (0.4%), and Asian (0.2%) residents. The median household income is $41,945, and the median home value is $112,400.
Economy
Cherry County is largely rural, and the economy is based on agriculture and ranching. The county is home to several large cattle ranches, and the beef industry is a major contributor to the local economy. Other industries include tourism, oil and gas production, and manufacturing. The county is also home to the Fort Niobrara National Wildlife Refuge, which is a popular destination for birdwatchers and other wildlife enthusiasts.
History
Cherry County was established in 1883, and was named after Lieutenant Samuel A. Cherry, who was killed in the Battle of White Bird Canyon during the Nez Perce War of 1877. The county was originally populated by Native American tribes, including the Omaha, Pawnee, and Sioux. The first settlers arrived in the late 1800s, and the county was officially organized in 1884. The county seat was established in Valentine in 1885, and the county has remained largely rural since then.
Common Questions
What is Per Capita Income in Cherry County?
Per Capita income in Cherry County is $31,424.
What is the Median Family Income in Cherry County?
Median Family Income in Cherry County is $69,813.
What is the Median Household income in Cherry County?
Median Household Income in Cherry County is $62,373.
What is Income or Wage Gap in Cherry County?
Income or Wage Gap in Cherry County is 31.5%.
Women in Cherry County earn 68.5 cents for every dollar earned by a man.
What is Family Income Deficit in Cherry County?
Family Income Deficit in Cherry County is $11,853.
Families that are below poverty line in Cherry County earn $11,853 less on average than the poverty threshold level.
What is Inequality or Gini Index in Cherry County?
Inequality or Gini Index in Cherry County is 0.41.
What is the Total Population of Cherry County?
Total Population of Cherry County is 5,473.
What is the Total Male Population of Cherry County?
Total Male Population of Cherry County is 2,815.
What is the Total Female Population of Cherry County?
Total Female Population of Cherry County is 2,658.
What is the Ratio of Males per 100 Females in Cherry County?
There are 105.91 Males per 100 Females in Cherry County.
What is the Ratio of Females per 100 Males in Cherry County?
There are 94.42 Females per 100 Males in Cherry County.
What is the Median Population Age in Cherry County?
Median Population Age in Cherry County is 41.5 Years.
What is the Average Family Size in Cherry County
Average Family Size in Cherry County is 3.0 People.
What is the Average Household Size in Cherry County
Average Household Size in Cherry County is 2.5 People.
How Large is the Labor Force in Cherry County?
There are 2,939 People in the Labor Forcein in Cherry County.
What is the Percentage of People in the Labor Force in Cherry County?
67.6% of People are in the Labor Force in Cherry County.
What is the Unemployment Rate in Cherry County?
Unemployment Rate in Cherry County is 0.4%.