Brown County, NE Map & Demographics
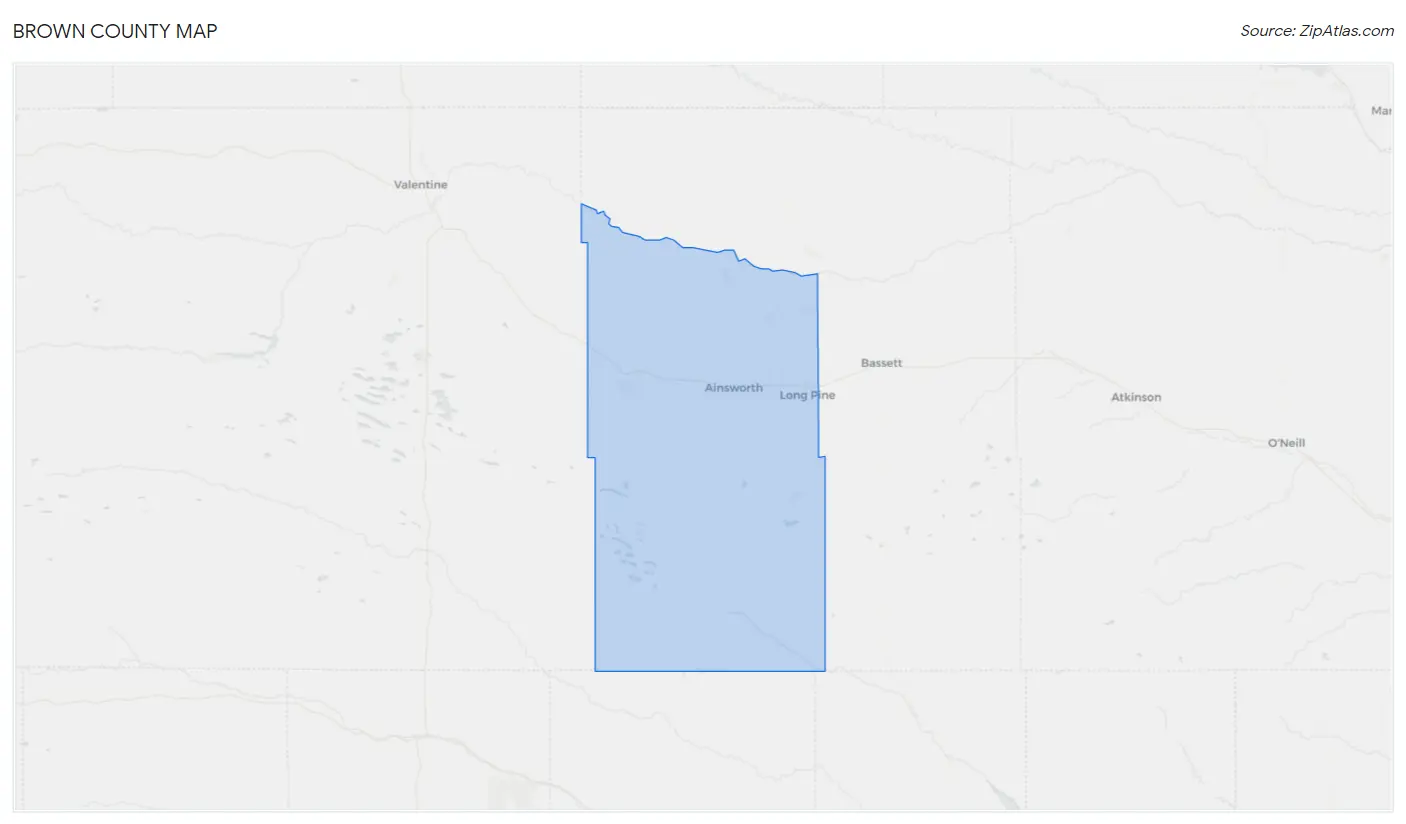
Brown County Map
Brown County Overview
$31,772
PER CAPITA INCOME
$61,310
AVG FAMILY INCOME
$44,267
AVG HOUSEHOLD INCOME
22.7%
WAGE / INCOME GAP [ % ]
77.3¢/ $1
WAGE / INCOME GAP [ $ ]
$10,466
FAMILY INCOME DEFICIT
0.48
INEQUALITY / GINI INDEX
2,691
TOTAL POPULATION
1,324
MALE POPULATION
1,367
FEMALE POPULATION
96.85
MALES / 100 FEMALES
103.25
FEMALES / 100 MALES
46.9
MEDIAN AGE
3.0
AVG FAMILY SIZE
2.2
AVG HOUSEHOLD SIZE
1,292
LABOR FORCE [ PEOPLE ]
57.6%
PERCENT IN LABOR FORCE
0.5%
UNEMPLOYMENT RATE
Brown County Area Codes
Income in Brown County
Income Overview in Brown County
Per Capita Income in Brown County is $31,772, while median incomes of families and households are $61,310 and $44,267 respectively.
| Characteristic | Number | Measure |
| Per Capita Income | 2,691 | $31,772 |
| Median Family Income | 680 | $61,310 |
| Mean Family Income | 680 | $86,513 |
| Median Household Income | 1,217 | $44,267 |
| Mean Household Income | 1,217 | $68,043 |
| Income Deficit | 680 | $10,466 |
| Wage / Income Gap (%) | 2,691 | 22.73% |
| Wage / Income Gap ($) | 2,691 | 77.27¢ per $1 |
| Gini / Inequality Index | 2,691 | 0.48 |
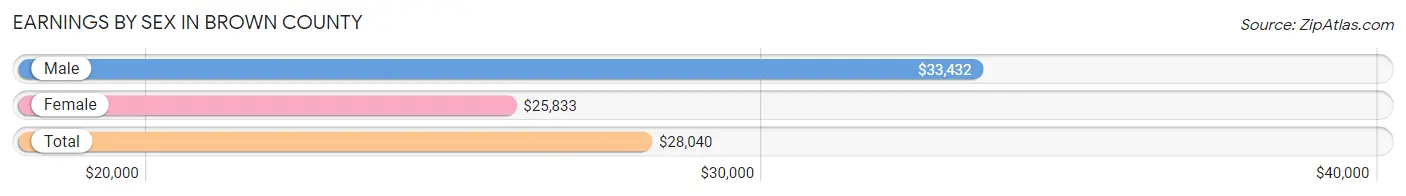
Earnings by Sex in Brown County
Average Earnings in Brown County are $28,040, $33,432 for men and $25,833 for women, a difference of 22.7%.
| Sex | Number | Average Earnings |
| Male | 851 (59.4%) | $33,432 |
| Female | 582 (40.6%) | $25,833 |
| Total | 1,433 (100.0%) | $28,040 |
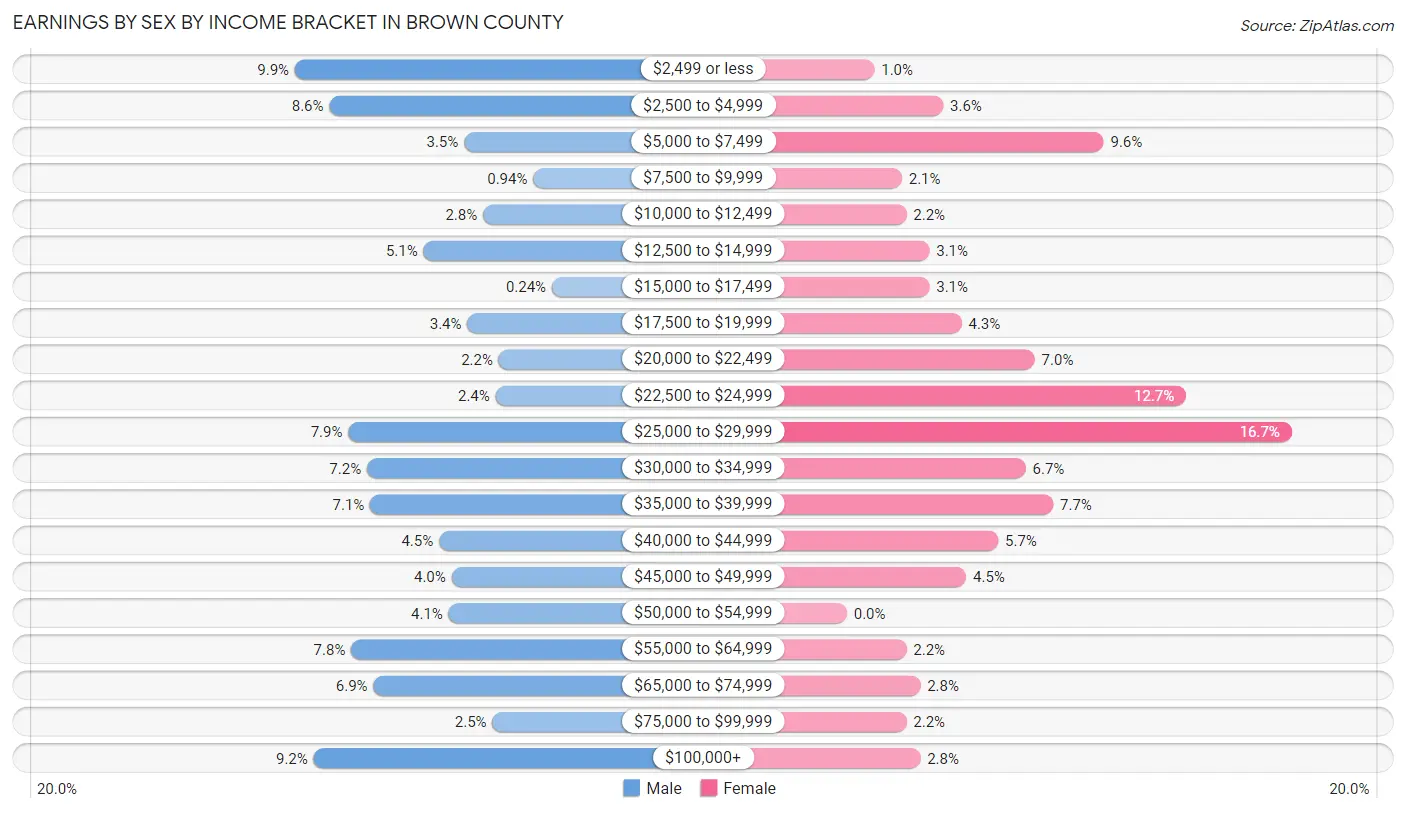
Earnings by Sex by Income Bracket in Brown County
The most common earnings brackets in Brown County are $2,499 or less for men (84 | 9.9%) and $25,000 to $29,999 for women (97 | 16.7%).
| Income | Male | Female |
| $2,499 or less | 84 (9.9%) | 6 (1.0%) |
| $2,500 to $4,999 | 73 (8.6%) | 21 (3.6%) |
| $5,000 to $7,499 | 30 (3.5%) | 56 (9.6%) |
| $7,500 to $9,999 | 8 (0.9%) | 12 (2.1%) |
| $10,000 to $12,499 | 24 (2.8%) | 13 (2.2%) |
| $12,500 to $14,999 | 43 (5.1%) | 18 (3.1%) |
| $15,000 to $17,499 | 2 (0.2%) | 18 (3.1%) |
| $17,500 to $19,999 | 29 (3.4%) | 25 (4.3%) |
| $20,000 to $22,499 | 19 (2.2%) | 41 (7.0%) |
| $22,500 to $24,999 | 20 (2.4%) | 74 (12.7%) |
| $25,000 to $29,999 | 67 (7.9%) | 97 (16.7%) |
| $30,000 to $34,999 | 61 (7.2%) | 39 (6.7%) |
| $35,000 to $39,999 | 60 (7.0%) | 45 (7.7%) |
| $40,000 to $44,999 | 38 (4.5%) | 33 (5.7%) |
| $45,000 to $49,999 | 34 (4.0%) | 26 (4.5%) |
| $50,000 to $54,999 | 35 (4.1%) | 0 (0.0%) |
| $55,000 to $64,999 | 66 (7.8%) | 13 (2.2%) |
| $65,000 to $74,999 | 59 (6.9%) | 16 (2.8%) |
| $75,000 to $99,999 | 21 (2.5%) | 13 (2.2%) |
| $100,000+ | 78 (9.2%) | 16 (2.8%) |
| Total | 851 (100.0%) | 582 (100.0%) |
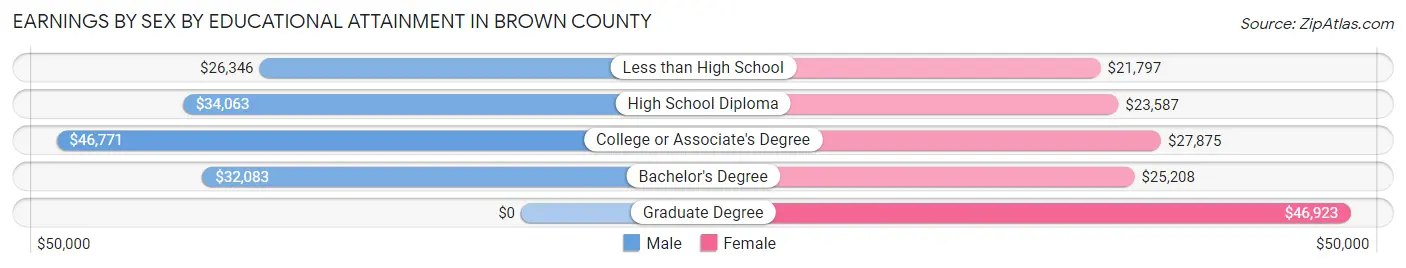
Earnings by Sex by Educational Attainment in Brown County
Average earnings in Brown County are $37,862 for men and $26,369 for women, a difference of 30.3%. Men with an educational attainment of college or associate's degree enjoy the highest average annual earnings of $46,771, while those with less than high school education earn the least with $26,346. Women with an educational attainment of graduate degree earn the most with the average annual earnings of $46,923, while those with less than high school education have the smallest earnings of $21,797.
| Educational Attainment | Male Income | Female Income |
| Less than High School | $26,346 | $21,797 |
| High School Diploma | $34,063 | $23,587 |
| College or Associate's Degree | $46,771 | $27,875 |
| Bachelor's Degree | $32,083 | $25,208 |
| Graduate Degree | - | - |
| Total | $37,862 | $26,369 |
Family Income in Brown County
Family Income Brackets in Brown County
According to the Brown County family income data, there are 163 families falling into the $50,000 to $74,999 income range, which is the most common income bracket and makes up 24.0% of all families. Conversely, the $150,000 to $199,999 income bracket is the least frequent group with only 2 families (0.3%) belonging to this category.
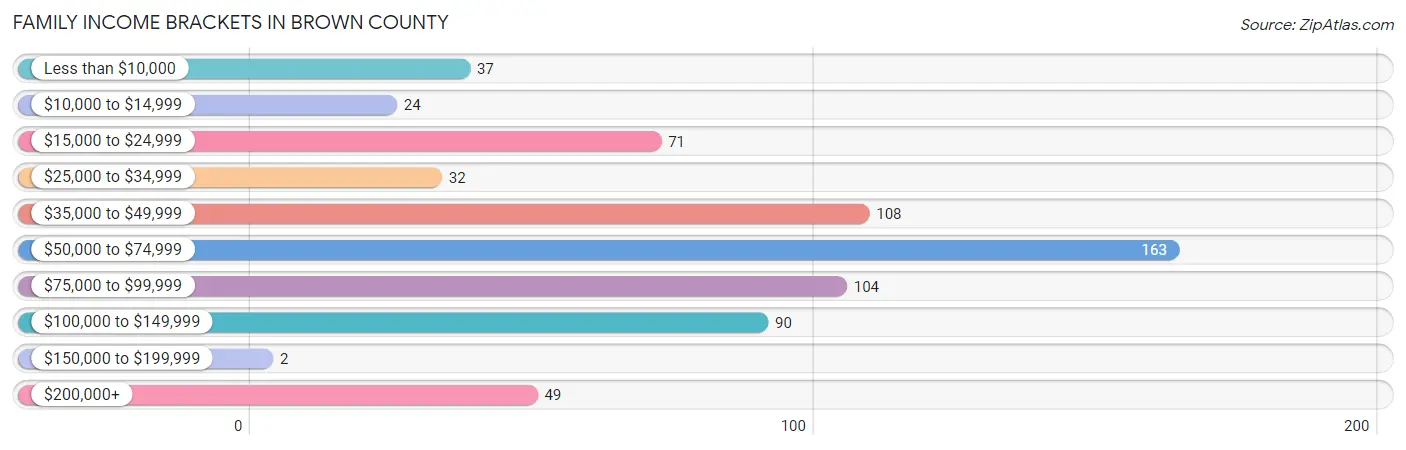
| Income Bracket | # Families | % Families |
| Less than $10,000 | 37 | 5.4% |
| $10,000 to $14,999 | 24 | 3.5% |
| $15,000 to $24,999 | 71 | 10.4% |
| $25,000 to $34,999 | 32 | 4.7% |
| $35,000 to $49,999 | 108 | 15.9% |
| $50,000 to $74,999 | 163 | 24.0% |
| $75,000 to $99,999 | 104 | 15.3% |
| $100,000 to $149,999 | 90 | 13.2% |
| $150,000 to $199,999 | 2 | 0.3% |
| $200,000+ | 49 | 7.2% |
Family Income by Famaliy Size in Brown County
4-person families (95 | 14.0%) account for the highest median family income in Brown County with $90,069 per family, while 2-person families (450 | 66.2%) have the highest median income of $29,474 per family member.
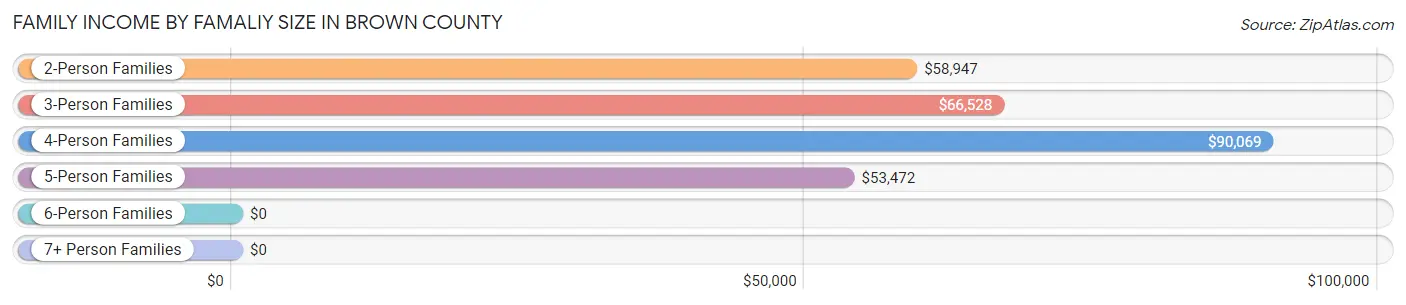
| Income Bracket | # Families | Median Income |
| 2-Person Families | 450 (66.2%) | $58,947 |
| 3-Person Families | 81 (11.9%) | $66,528 |
| 4-Person Families | 95 (14.0%) | $90,069 |
| 5-Person Families | 49 (7.2%) | $53,472 |
| 6-Person Families | 5 (0.7%) | $0 |
| 7+ Person Families | 0 (0.0%) | $0 |
| Total | 680 (100.0%) | $61,310 |
Family Income by Number of Earners in Brown County
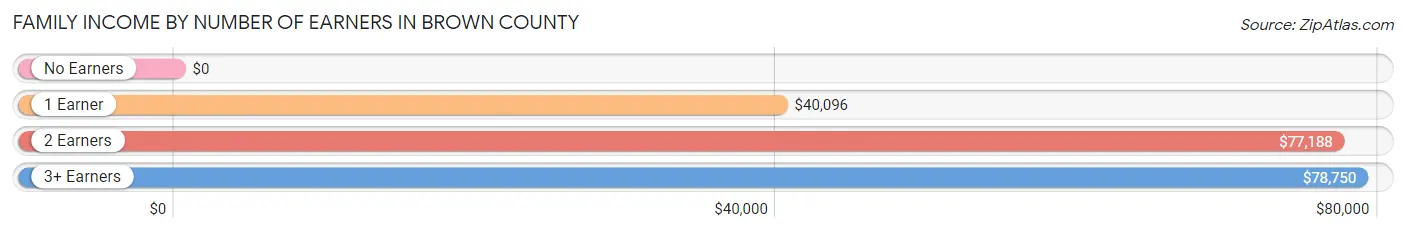
| Number of Earners | # Families | Median Income |
| No Earners | 84 (12.3%) | $0 |
| 1 Earner | 223 (32.8%) | $40,096 |
| 2 Earners | 330 (48.5%) | $77,188 |
| 3+ Earners | 43 (6.3%) | $78,750 |
| Total | 680 (100.0%) | $61,310 |
Household Income in Brown County
Household Income Brackets in Brown County
With 243 households falling in the category, the $50,000 to $74,999 income range is the most frequent in Brown County, accounting for 20.0% of all households. In contrast, only 28 households (2.3%) fall into the $150,000 to $199,999 income bracket, making it the least populous group.
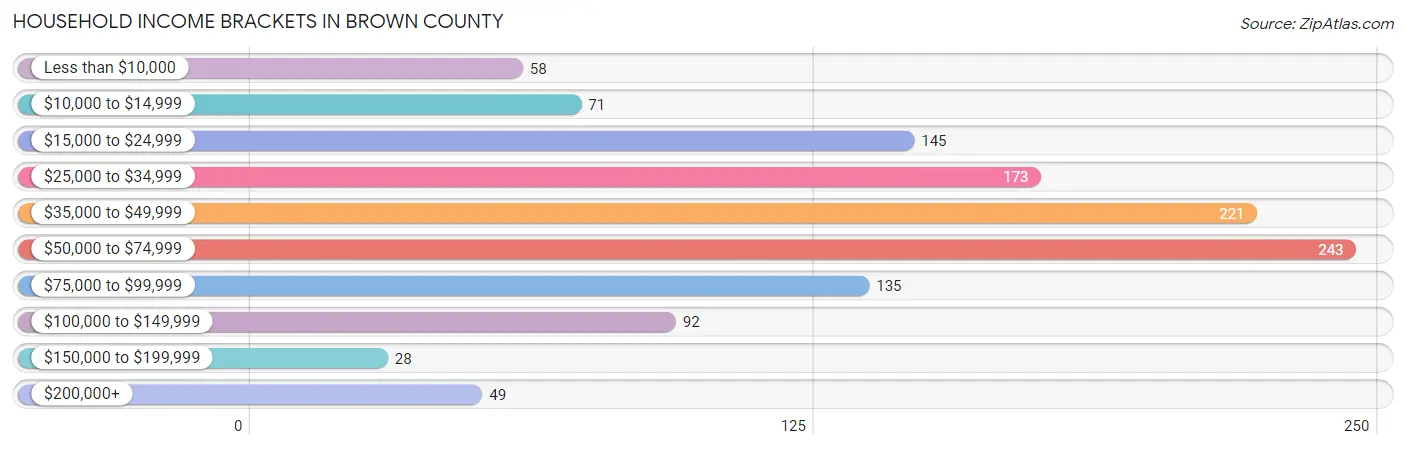
| Income Bracket | # Households | % Households |
| Less than $10,000 | 58 | 4.8% |
| $10,000 to $14,999 | 71 | 5.8% |
| $15,000 to $24,999 | 145 | 11.9% |
| $25,000 to $34,999 | 173 | 14.2% |
| $35,000 to $49,999 | 221 | 18.2% |
| $50,000 to $74,999 | 243 | 20.0% |
| $75,000 to $99,999 | 135 | 11.1% |
| $100,000 to $149,999 | 92 | 7.6% |
| $150,000 to $199,999 | 28 | 2.3% |
| $200,000+ | 49 | 4.0% |
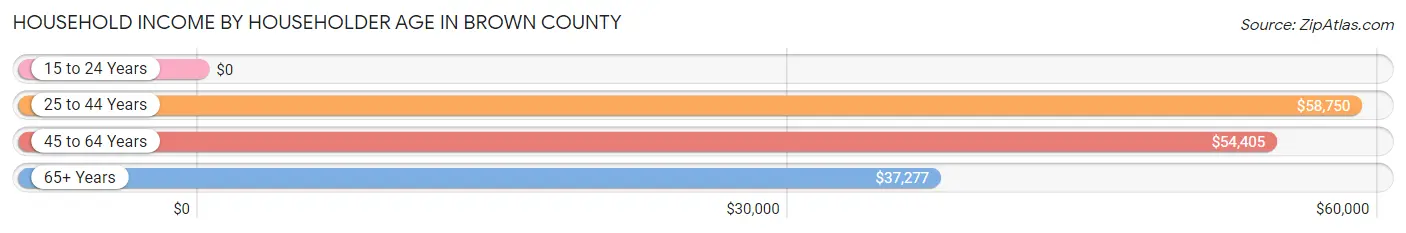
Household Income by Householder Age in Brown County
The median household income in Brown County is $44,267, with the highest median household income of $58,750 found in the 25 to 44 years age bracket for the primary householder. A total of 257 households (21.1%) fall into this category. Meanwhile, the 15 to 24 years age bracket for the primary householder has the lowest median household income of $0, with 55 households (4.5%) in this group.
| Income Bracket | # Households | Median Income |
| 15 to 24 Years | 55 (4.5%) | $0 |
| 25 to 44 Years | 257 (21.1%) | $58,750 |
| 45 to 64 Years | 356 (29.2%) | $54,405 |
| 65+ Years | 549 (45.1%) | $37,277 |
| Total | 1,217 (100.0%) | $44,267 |
Poverty in Brown County
Income Below Poverty by Sex and Age in Brown County
With 5.9% poverty level for males and 11.8% for females among the residents of Brown County, under 5 year old males and 16 and 17 year old females are the most vulnerable to poverty, with 14 males (18.9%) and 11 females (44.0%) in their respective age groups living below the poverty level.
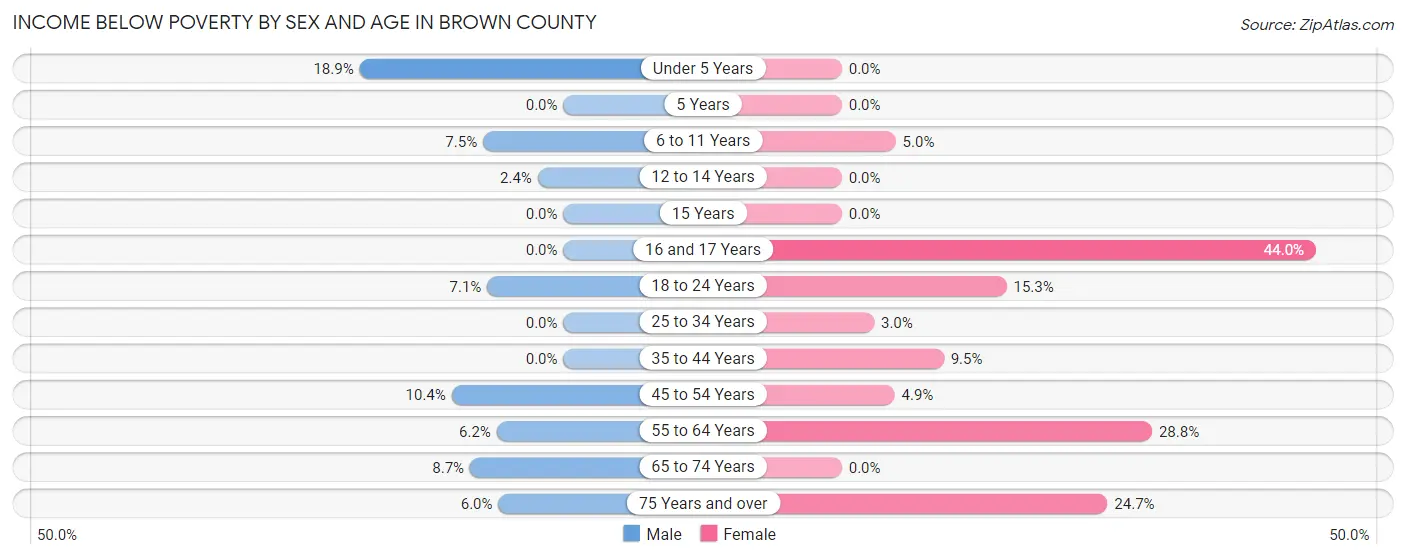
| Age Bracket | Male | Female |
| Under 5 Years | 14 (18.9%) | 0 (0.0%) |
| 5 Years | 0 (0.0%) | 0 (0.0%) |
| 6 to 11 Years | 5 (7.5%) | 2 (5.0%) |
| 12 to 14 Years | 1 (2.4%) | 0 (0.0%) |
| 15 Years | 0 (0.0%) | 0 (0.0%) |
| 16 and 17 Years | 0 (0.0%) | 11 (44.0%) |
| 18 to 24 Years | 7 (7.1%) | 13 (15.3%) |
| 25 to 34 Years | 0 (0.0%) | 4 (3.0%) |
| 35 to 44 Years | 0 (0.0%) | 14 (9.5%) |
| 45 to 54 Years | 14 (10.4%) | 5 (4.9%) |
| 55 to 64 Years | 12 (6.2%) | 57 (28.8%) |
| 65 to 74 Years | 17 (8.7%) | 0 (0.0%) |
| 75 Years and over | 7 (6.0%) | 53 (24.6%) |
| Total | 77 (5.9%) | 159 (11.8%) |
Income Above Poverty by Sex and Age in Brown County
According to the poverty statistics in Brown County, males aged 5 years and females aged under 5 years are the age groups that are most secure financially, with 100.0% of males and 100.0% of females in these age groups living above the poverty line.
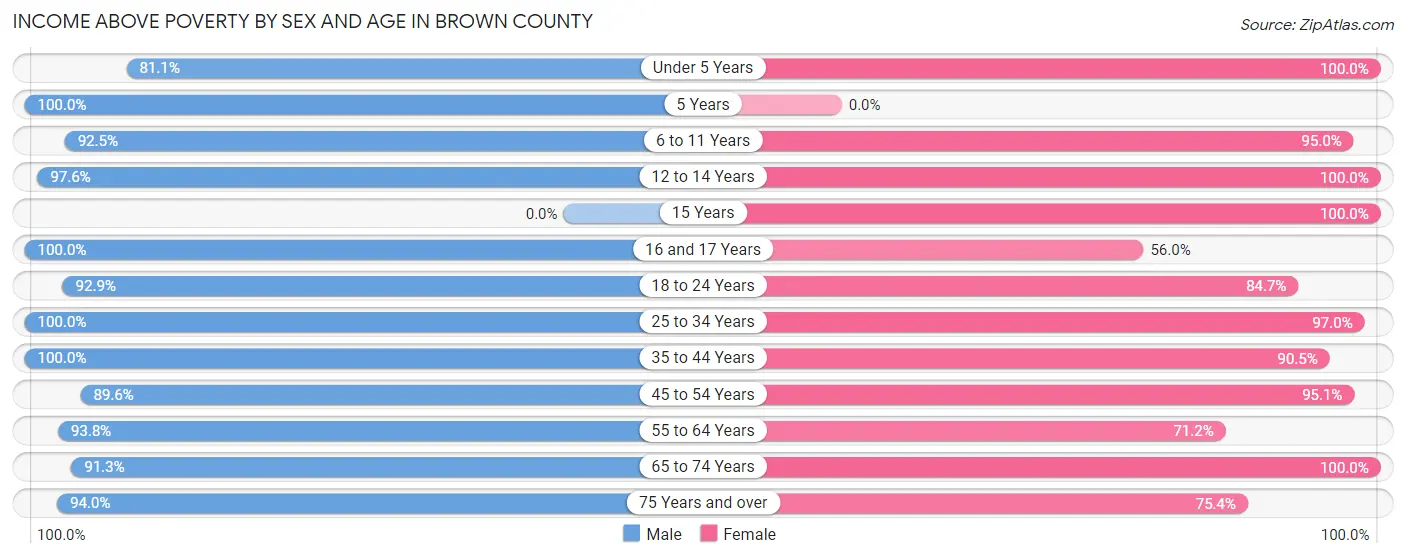
| Age Bracket | Male | Female |
| Under 5 Years | 60 (81.1%) | 132 (100.0%) |
| 5 Years | 44 (100.0%) | 0 (0.0%) |
| 6 to 11 Years | 62 (92.5%) | 38 (95.0%) |
| 12 to 14 Years | 41 (97.6%) | 45 (100.0%) |
| 15 Years | 0 (0.0%) | 4 (100.0%) |
| 16 and 17 Years | 42 (100.0%) | 14 (56.0%) |
| 18 to 24 Years | 92 (92.9%) | 72 (84.7%) |
| 25 to 34 Years | 152 (100.0%) | 130 (97.0%) |
| 35 to 44 Years | 141 (100.0%) | 134 (90.5%) |
| 45 to 54 Years | 121 (89.6%) | 97 (95.1%) |
| 55 to 64 Years | 182 (93.8%) | 141 (71.2%) |
| 65 to 74 Years | 179 (91.3%) | 222 (100.0%) |
| 75 Years and over | 109 (94.0%) | 162 (75.3%) |
| Total | 1,225 (94.1%) | 1,191 (88.2%) |
Income Below Poverty Among Married-Couple Families in Brown County
The poverty statistics for married-couple families in Brown County show that 9.3% or 55 of the total 591 families live below the poverty line. Families with no children have the highest poverty rate of 10.7%, comprising of 47 families. On the other hand, families with 3 or 4 children have the lowest poverty rate of 0.0%, which includes 0 families.
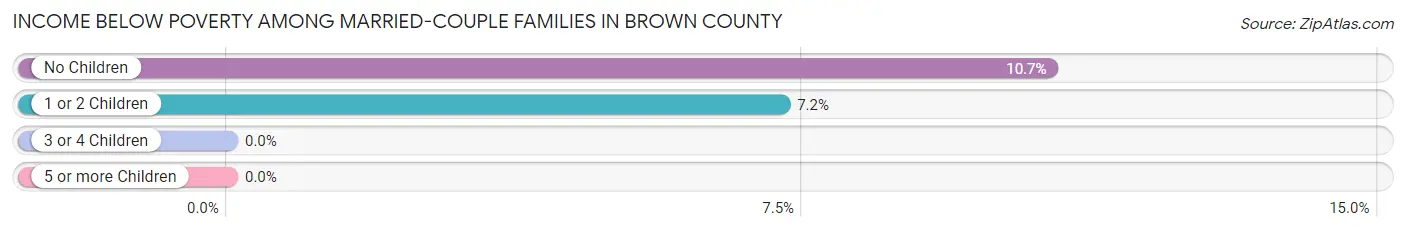
| Children | Above Poverty | Below Poverty |
| No Children | 392 (89.3%) | 47 (10.7%) |
| 1 or 2 Children | 103 (92.8%) | 8 (7.2%) |
| 3 or 4 Children | 41 (100.0%) | 0 (0.0%) |
| 5 or more Children | 0 (0.0%) | 0 (0.0%) |
| Total | 536 (90.7%) | 55 (9.3%) |
Income Below Poverty Among Single-Parent Households in Brown County
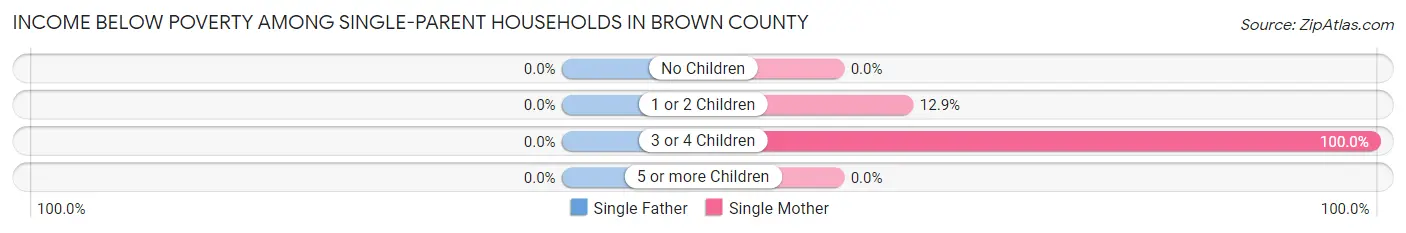
| Children | Single Father | Single Mother |
| No Children | 0 (0.0%) | 0 (0.0%) |
| 1 or 2 Children | 0 (0.0%) | 8 (12.9%) |
| 3 or 4 Children | 0 (0.0%) | 4 (100.0%) |
| 5 or more Children | 0 (0.0%) | 0 (0.0%) |
| Total | 0 (0.0%) | 12 (14.1%) |
Income Below Poverty Among Married-Couple vs Single-Parent Households in Brown County
The poverty data for Brown County shows that 55 of the married-couple family households (9.3%) and 12 of the single-parent households (13.5%) are living below the poverty level. Within the married-couple family households, those with no children have the highest poverty rate, with 47 households (10.7%) falling below the poverty line. Among the single-parent households, those with 3 or 4 children have the highest poverty rate, with 4 household (100.0%) living below poverty.
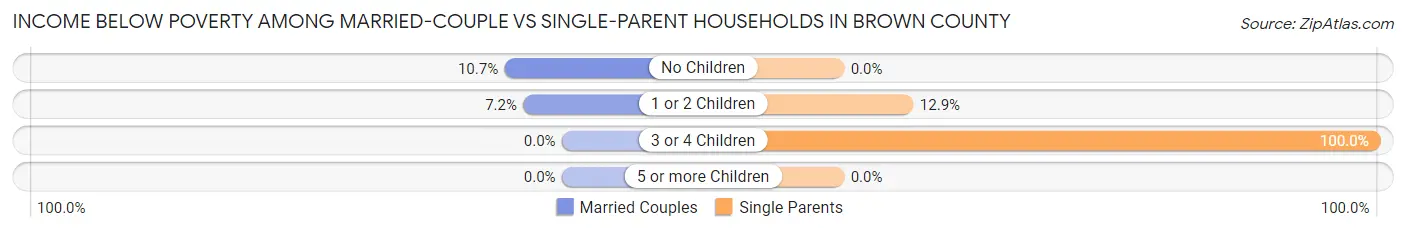
| Children | Married-Couple Families | Single-Parent Households |
| No Children | 47 (10.7%) | 0 (0.0%) |
| 1 or 2 Children | 8 (7.2%) | 8 (12.9%) |
| 3 or 4 Children | 0 (0.0%) | 4 (100.0%) |
| 5 or more Children | 0 (0.0%) | 0 (0.0%) |
| Total | 55 (9.3%) | 12 (13.5%) |
Race in Brown County
The most populous races in Brown County are White / Caucasian (2,504 | 93.0%), Two or more Races (131 | 4.9%), and Hispanic or Latino (108 | 4.0%).
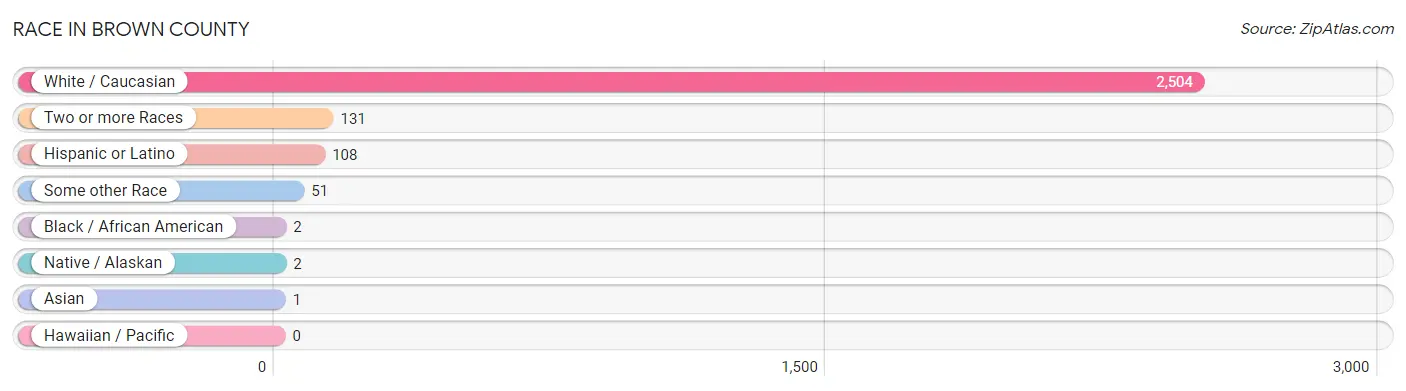
| Race | # Population | % Population |
| Asian | 1 | 0.0% |
| Black / African American | 2 | 0.1% |
| Hawaiian / Pacific | 0 | 0.0% |
| Hispanic or Latino | 108 | 4.0% |
| Native / Alaskan | 2 | 0.1% |
| White / Caucasian | 2,504 | 93.0% |
| Two or more Races | 131 | 4.9% |
| Some other Race | 51 | 1.9% |
| Total | 2,691 | 100.0% |
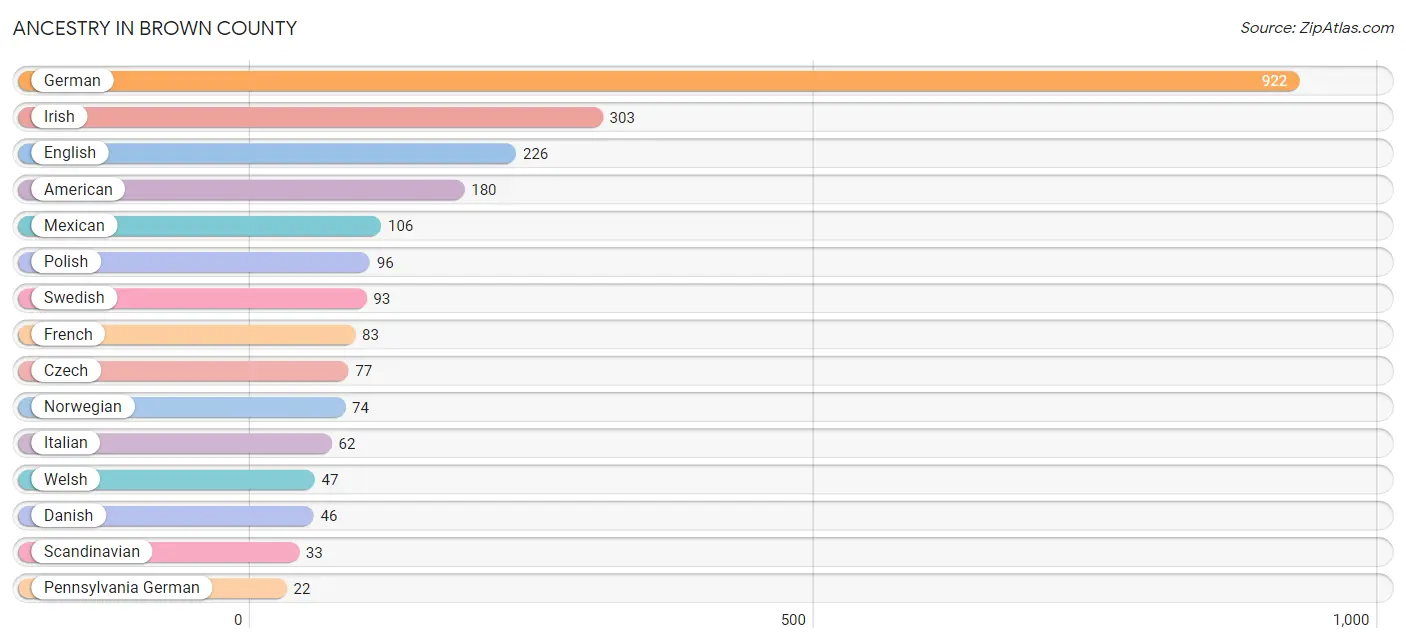
Ancestry in Brown County
The most populous ancestries reported in Brown County are German (922 | 34.3%), Irish (303 | 11.3%), English (226 | 8.4%), American (180 | 6.7%), and Mexican (106 | 3.9%), together accounting for 64.5% of all Brown County residents.
| Ancestry | # Population | % Population |
| American | 180 | 6.7% |
| Arab | 21 | 0.8% |
| British | 15 | 0.6% |
| Canadian | 7 | 0.3% |
| Cherokee | 1 | 0.0% |
| Czech | 77 | 2.9% |
| Czechoslovakian | 5 | 0.2% |
| Danish | 46 | 1.7% |
| Delaware | 5 | 0.2% |
| Dutch | 10 | 0.4% |
| Eastern European | 16 | 0.6% |
| English | 226 | 8.4% |
| European | 2 | 0.1% |
| Finnish | 1 | 0.0% |
| French | 83 | 3.1% |
| French Canadian | 15 | 0.6% |
| German | 922 | 34.3% |
| Guamanian / Chamorro | 19 | 0.7% |
| Hungarian | 8 | 0.3% |
| Irish | 303 | 11.3% |
| Italian | 62 | 2.3% |
| Korean | 8 | 0.3% |
| Lebanese | 21 | 0.8% |
| Mexican | 106 | 3.9% |
| Northern European | 5 | 0.2% |
| Norwegian | 74 | 2.8% |
| Pakistani | 1 | 0.0% |
| Pennsylvania German | 22 | 0.8% |
| Polish | 96 | 3.6% |
| Russian | 8 | 0.3% |
| Scandinavian | 33 | 1.2% |
| Scotch-Irish | 13 | 0.5% |
| Scottish | 7 | 0.3% |
| Swedish | 93 | 3.5% |
| Swiss | 16 | 0.6% |
| Welsh | 47 | 1.8% | View All 36 Rows |
Immigrants in Brown County
The most numerous immigrant groups reported in Brown County came from Central America (47 | 1.8%), Latin America (47 | 1.8%), Mexico (47 | 1.8%), Asia (1 | 0.0%), and Philippines (1 | 0.0%), together accounting for 5.3% of all Brown County residents.
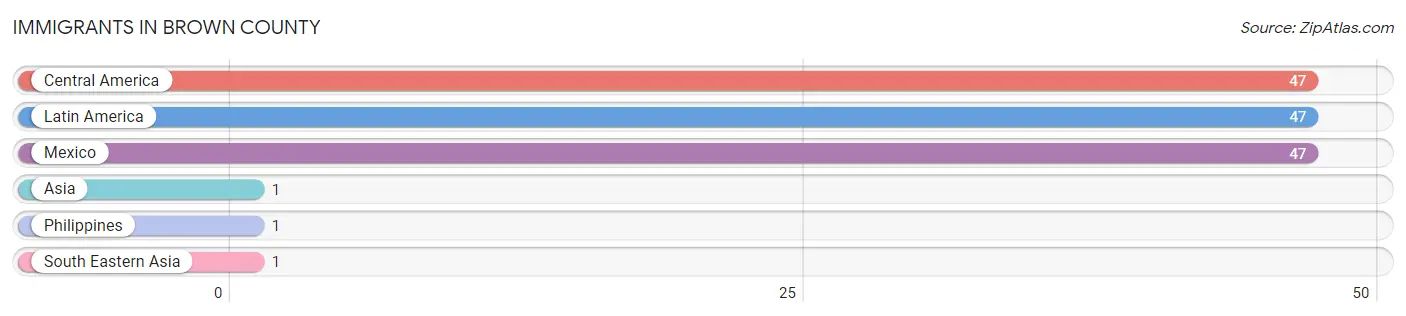
| Immigration Origin | # Population | % Population |
| Asia | 1 | 0.0% |
| Central America | 47 | 1.8% |
| Latin America | 47 | 1.8% |
| Mexico | 47 | 1.8% |
| Philippines | 1 | 0.0% |
| South Eastern Asia | 1 | 0.0% | View All 6 Rows |
Sex and Age in Brown County
Sex and Age in Brown County
The most populous age groups in Brown County are 65 to 69 Years (118 | 8.9%) for men and 70 to 74 Years (138 | 10.1%) for women.
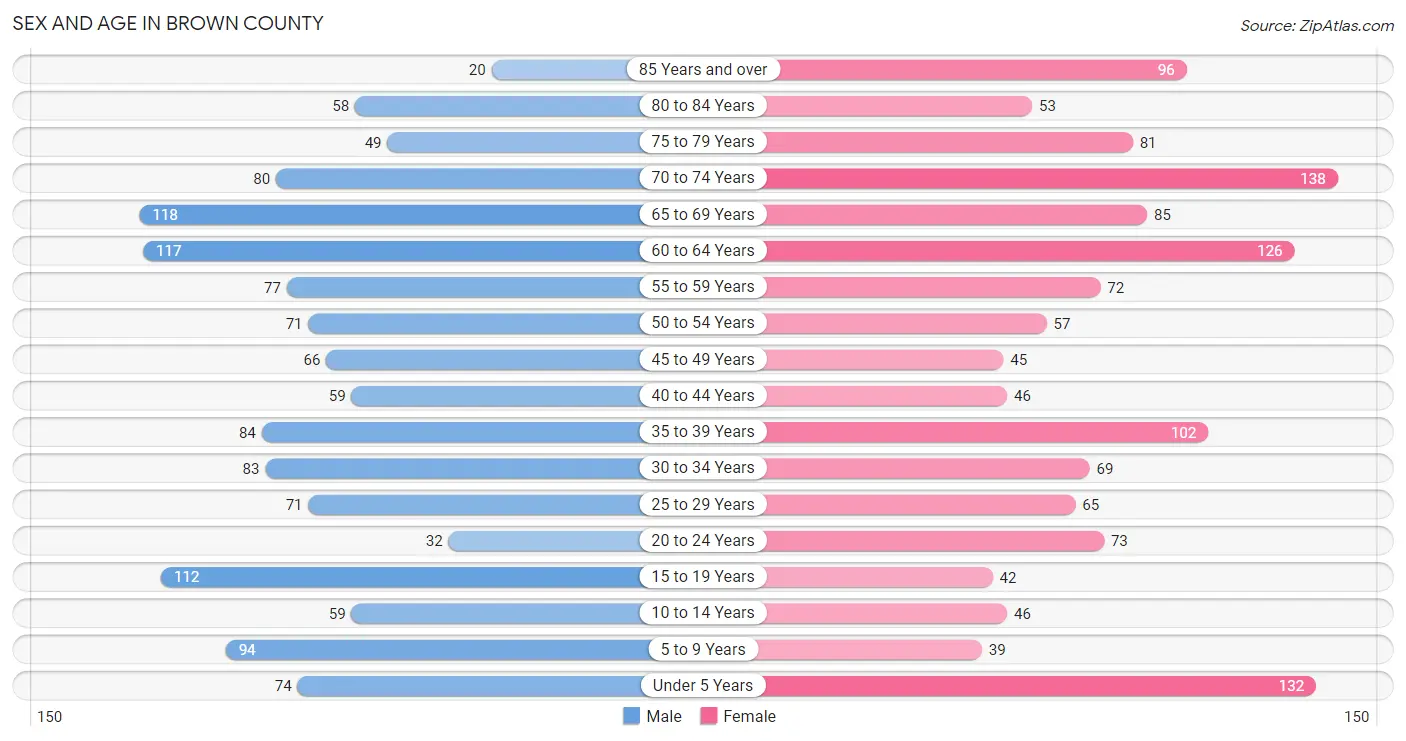
| Age Bracket | Male | Female |
| Under 5 Years | 74 (5.6%) | 132 (9.7%) |
| 5 to 9 Years | 94 (7.1%) | 39 (2.9%) |
| 10 to 14 Years | 59 (4.5%) | 46 (3.4%) |
| 15 to 19 Years | 112 (8.5%) | 42 (3.1%) |
| 20 to 24 Years | 32 (2.4%) | 73 (5.3%) |
| 25 to 29 Years | 71 (5.4%) | 65 (4.8%) |
| 30 to 34 Years | 83 (6.3%) | 69 (5.1%) |
| 35 to 39 Years | 84 (6.3%) | 102 (7.5%) |
| 40 to 44 Years | 59 (4.5%) | 46 (3.4%) |
| 45 to 49 Years | 66 (5.0%) | 45 (3.3%) |
| 50 to 54 Years | 71 (5.4%) | 57 (4.2%) |
| 55 to 59 Years | 77 (5.8%) | 72 (5.3%) |
| 60 to 64 Years | 117 (8.8%) | 126 (9.2%) |
| 65 to 69 Years | 118 (8.9%) | 85 (6.2%) |
| 70 to 74 Years | 80 (6.0%) | 138 (10.1%) |
| 75 to 79 Years | 49 (3.7%) | 81 (5.9%) |
| 80 to 84 Years | 58 (4.4%) | 53 (3.9%) |
| 85 Years and over | 20 (1.5%) | 96 (7.0%) |
| Total | 1,324 (100.0%) | 1,367 (100.0%) |
Families and Households in Brown County
Median Family Size in Brown County
The median family size in Brown County is 3.00 persons per family, with single male/father families (4 | 0.6%) accounting for the largest median family size of 6.75 persons per family. On the other hand, married-couple families (591 | 86.9%) represent the smallest median family size with 2.89 persons per family.
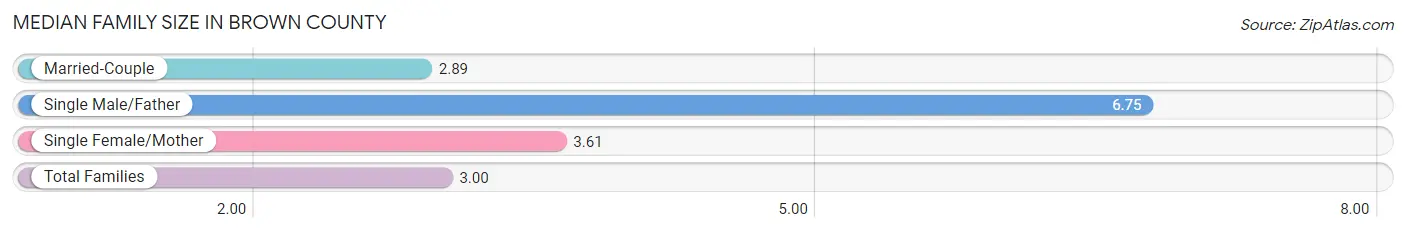
| Family Type | # Families | Family Size |
| Married-Couple | 591 (86.9%) | 2.89 |
| Single Male/Father | 4 (0.6%) | 6.75 |
| Single Female/Mother | 85 (12.5%) | 3.61 |
| Total Families | 680 (100.0%) | 3.00 |
Median Household Size in Brown County
The median household size in Brown County is 2.18 persons per household, with single male/father households (4 | 0.3%) accounting for the largest median household size of 6.75 persons per household. non-family households (537 | 44.1%) represent the smallest median household size with 1.11 persons per household.
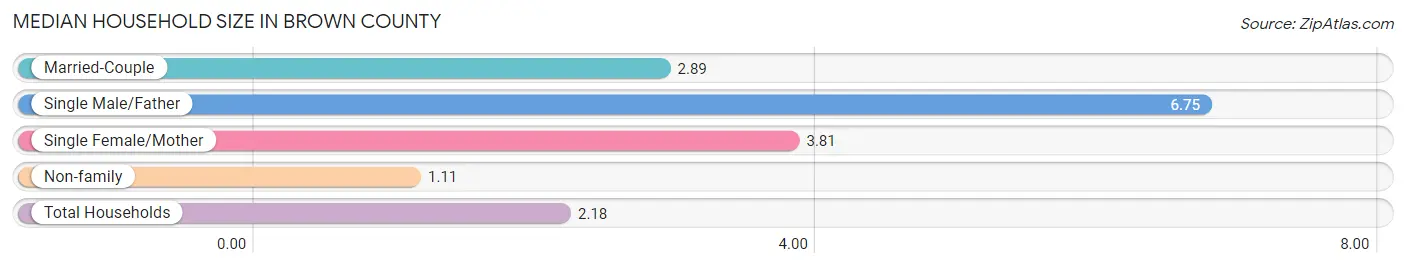
| Household Type | # Households | Household Size |
| Married-Couple | 591 (48.6%) | 2.89 |
| Single Male/Father | 4 (0.3%) | 6.75 |
| Single Female/Mother | 85 (7.0%) | 3.81 |
| Non-family | 537 (44.1%) | 1.11 |
| Total Households | 1,217 (100.0%) | 2.18 |
Household Size by Marriage Status in Brown County
Out of a total of 1,217 households in Brown County, 680 (55.9%) are family households, while 537 (44.1%) are nonfamily households. The most numerous type of family households are 2-person households, comprising 444, and the most common type of nonfamily households are 1-person households, comprising 487.
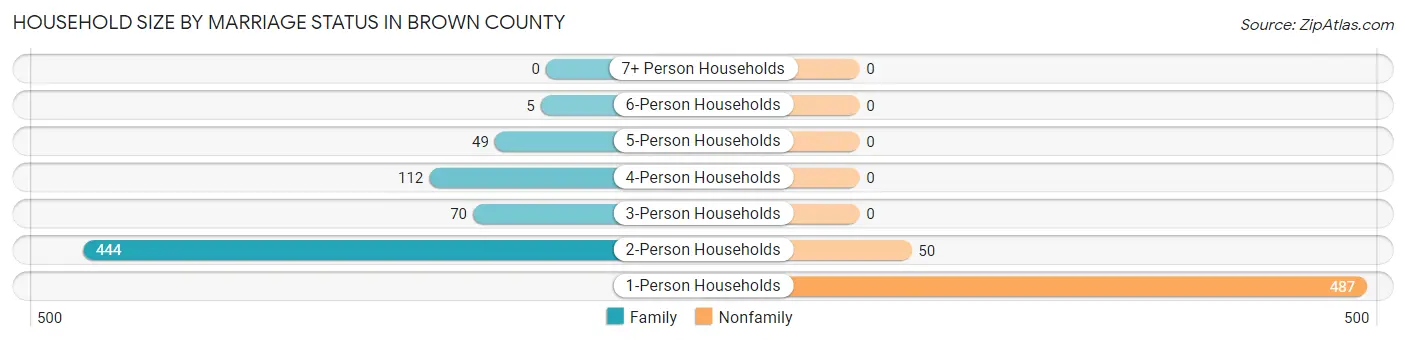
| Household Size | Family Households | Nonfamily Households |
| 1-Person Households | - | 487 (40.0%) |
| 2-Person Households | 444 (36.5%) | 50 (4.1%) |
| 3-Person Households | 70 (5.8%) | 0 (0.0%) |
| 4-Person Households | 112 (9.2%) | 0 (0.0%) |
| 5-Person Households | 49 (4.0%) | 0 (0.0%) |
| 6-Person Households | 5 (0.4%) | 0 (0.0%) |
| 7+ Person Households | 0 (0.0%) | 0 (0.0%) |
| Total | 680 (55.9%) | 537 (44.1%) |
Female Fertility in Brown County
Fertility by Age in Brown County
Average fertility rate in Brown County is 103.0 births per 1,000 women. Women in the age bracket of 15 to 19 years have the highest fertility rate with 143.0 births per 1,000 women. Women in the age bracket of 20 to 34 years acount for 61.7% of all women with births.
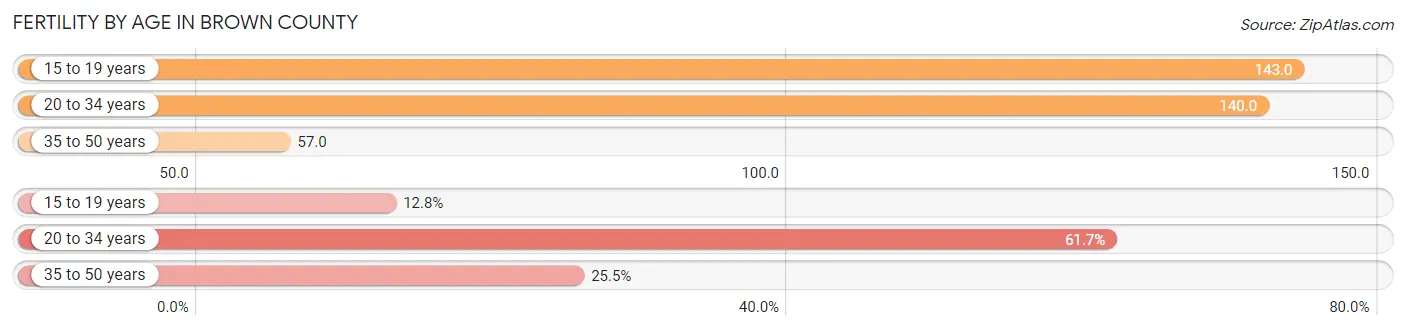
| Age Bracket | Women with Births | Births / 1,000 Women |
| 15 to 19 years | 6 (12.8%) | 143.0 |
| 20 to 34 years | 29 (61.7%) | 140.0 |
| 35 to 50 years | 12 (25.5%) | 57.0 |
| Total | 47 (100.0%) | 103.0 |
Fertility by Age by Marriage Status in Brown County
51.1% of women with births (47) in Brown County are married. The highest percentage of unmarried women with births falls into 15 to 19 years age bracket with 100.0% of them unmarried at the time of birth, while the lowest percentage of unmarried women with births belong to 20 to 34 years age bracket with 37.9% of them unmarried.
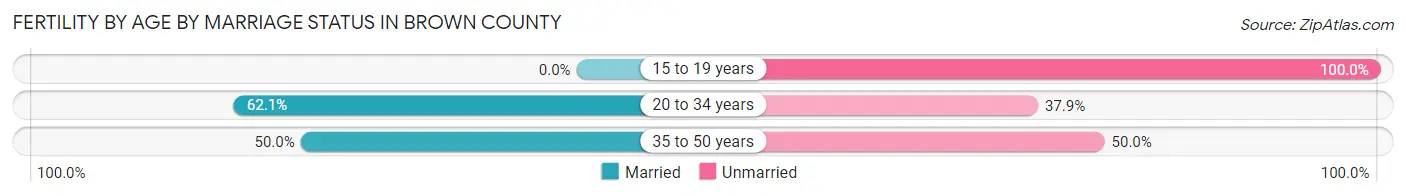
| Age Bracket | Married | Unmarried |
| 15 to 19 years | 0 (0.0%) | 6 (100.0%) |
| 20 to 34 years | 18 (62.1%) | 11 (37.9%) |
| 35 to 50 years | 6 (50.0%) | 6 (50.0%) |
| Total | 24 (51.1%) | 23 (48.9%) |
Fertility by Education in Brown County
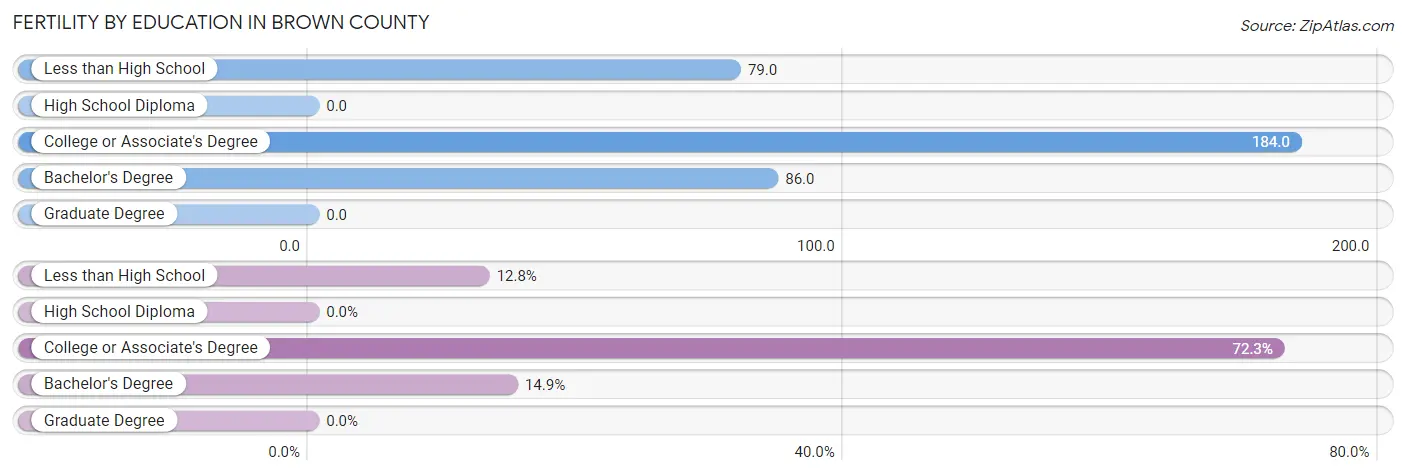
| Educational Attainment | Women with Births | Births / 1,000 Women |
| Less than High School | 6 (12.8%) | 79.0 |
| High School Diploma | 0 (0.0%) | 0.0 |
| College or Associate's Degree | 34 (72.3%) | 184.0 |
| Bachelor's Degree | 7 (14.9%) | 86.0 |
| Graduate Degree | 0 (0.0%) | 0.0 |
| Total | 47 (100.0%) | 103.0 |
Fertility by Education by Marriage Status in Brown County
48.9% of women with births in Brown County are unmarried. Women with the educational attainment of bachelor's degree are most likely to be married with 100.0% of them married at childbirth, while women with the educational attainment of less than high school are least likely to be married with 100.0% of them unmarried at childbirth.
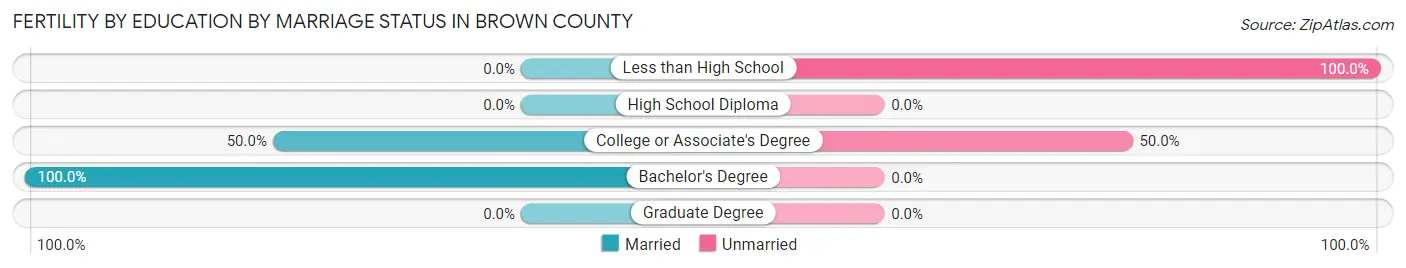
| Educational Attainment | Married | Unmarried |
| Less than High School | 0 (0.0%) | 6 (100.0%) |
| High School Diploma | 0 (0.0%) | 0 (0.0%) |
| College or Associate's Degree | 17 (50.0%) | 17 (50.0%) |
| Bachelor's Degree | 7 (100.0%) | 0 (0.0%) |
| Graduate Degree | 0 (0.0%) | 0 (0.0%) |
| Total | 24 (51.1%) | 23 (48.9%) |
Employment Characteristics in Brown County
Employment by Class of Employer in Brown County
Among the 1,253 employed individuals in Brown County, private company employees (622 | 49.6%), self-employed (not incorporated) (258 | 20.6%), and local government employees (105 | 8.4%) make up the most common classes of employment.
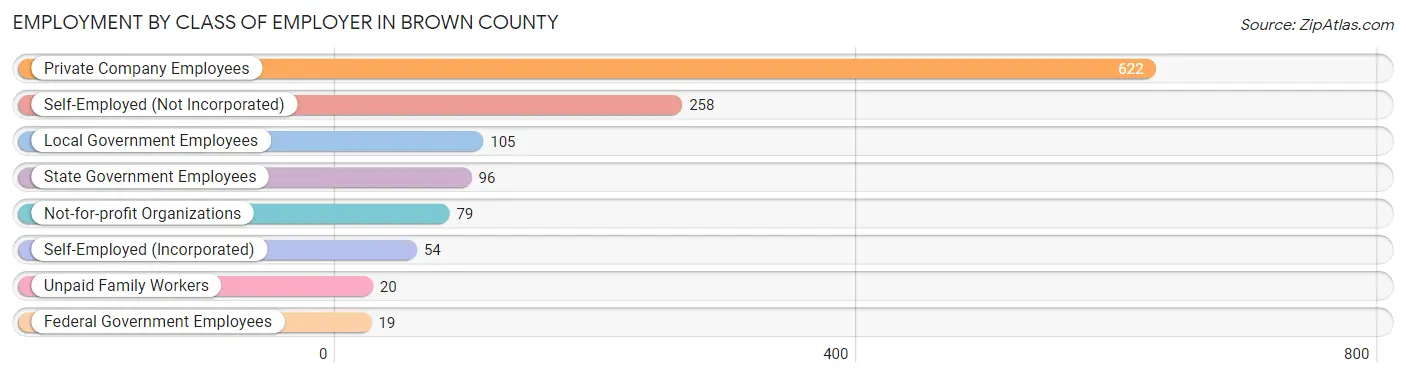
| Employer Class | # Employees | % Employees |
| Private Company Employees | 622 | 49.6% |
| Self-Employed (Incorporated) | 54 | 4.3% |
| Self-Employed (Not Incorporated) | 258 | 20.6% |
| Not-for-profit Organizations | 79 | 6.3% |
| Local Government Employees | 105 | 8.4% |
| State Government Employees | 96 | 7.7% |
| Federal Government Employees | 19 | 1.5% |
| Unpaid Family Workers | 20 | 1.6% |
| Total | 1,253 | 100.0% |
Employment Status by Age in Brown County
According to the labor force statistics for Brown County, out of the total population over 16 years of age (2,243), 57.6% or 1,292 individuals are in the labor force, with 0.5% or 6 of them unemployed. The age group with the highest labor force participation rate is 30 to 34 years, with 96.1% or 146 individuals in the labor force. Within the labor force, the 35 to 44 years age range has the highest percentage of unemployed individuals, with 2.8% or 6 of them being unemployed.
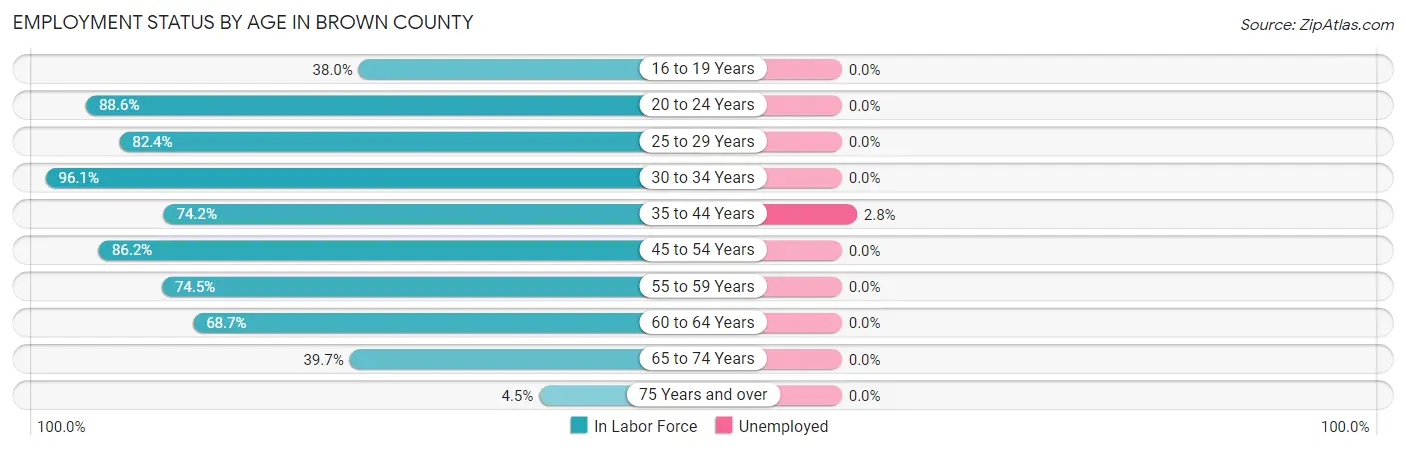
| Age Bracket | In Labor Force | Unemployed |
| 16 to 19 Years | 57 (38.0%) | 0 (0.0%) |
| 20 to 24 Years | 93 (88.6%) | 0 (0.0%) |
| 25 to 29 Years | 112 (82.4%) | 0 (0.0%) |
| 30 to 34 Years | 146 (96.1%) | 0 (0.0%) |
| 35 to 44 Years | 216 (74.2%) | 6 (2.8%) |
| 45 to 54 Years | 206 (86.2%) | 0 (0.0%) |
| 55 to 59 Years | 111 (74.5%) | 0 (0.0%) |
| 60 to 64 Years | 167 (68.7%) | 0 (0.0%) |
| 65 to 74 Years | 167 (39.7%) | 0 (0.0%) |
| 75 Years and over | 16 (4.5%) | 0 (0.0%) |
| Total | 1,292 (57.6%) | 6 (0.5%) |
Employment Status by Educational Attainment in Brown County
According to labor force statistics for Brown County, 79.2% of individuals (958) out of the total population between 25 and 64 years of age (1,210) are in the labor force, with 0.6% or 6 of them being unemployed. The group with the highest labor force participation rate are those with the educational attainment of less than high school, with 89.4% or 93 individuals in the labor force. Within the labor force, individuals with less than high school education have the highest percentage of unemployment, with 6.5% or 6 of them being unemployed.
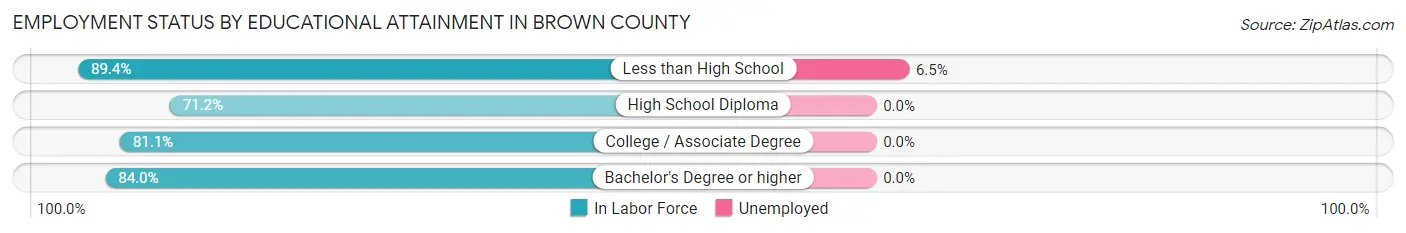
| Educational Attainment | In Labor Force | Unemployed |
| Less than High School | 93 (89.4%) | 7 (6.5%) |
| High School Diploma | 280 (71.2%) | 0 (0.0%) |
| College / Associate Degree | 386 (81.1%) | 0 (0.0%) |
| Bachelor's Degree or higher | 199 (84.0%) | 0 (0.0%) |
| Total | 958 (79.2%) | 7 (0.6%) |
Employment Occupations by Sex in Brown County
Management, Business, Science and Arts Occupations
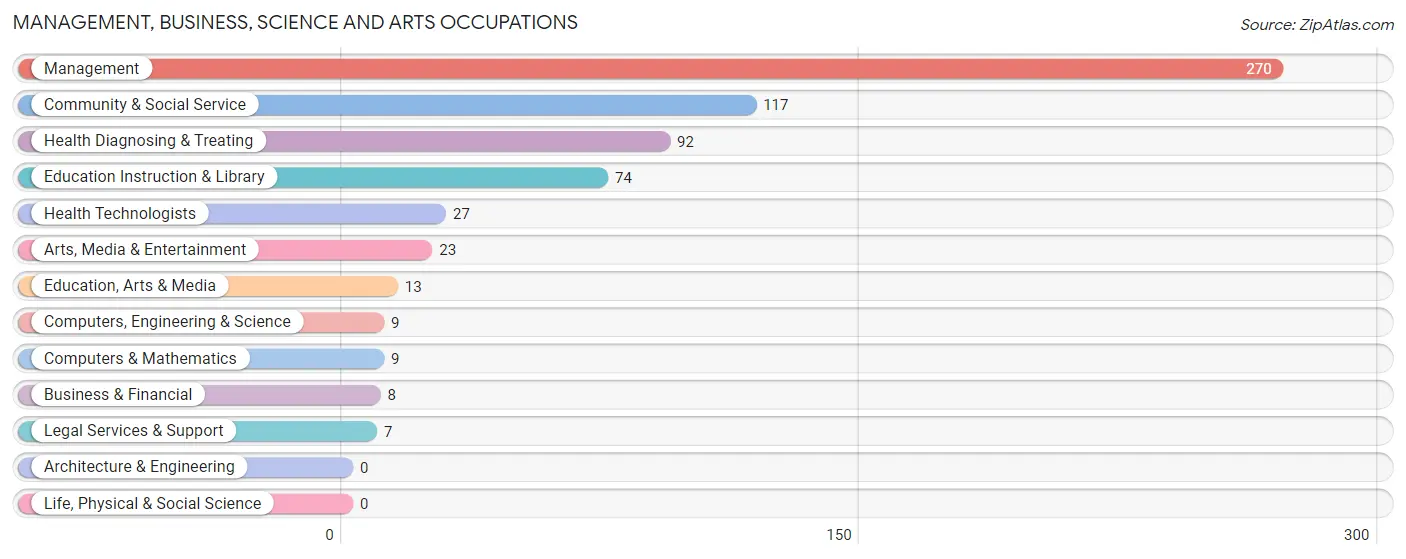
The most common Management, Business, Science and Arts occupations in Brown County are Management (270 | 21.0%), Community & Social Service (117 | 9.1%), Health Diagnosing & Treating (92 | 7.2%), Education Instruction & Library (74 | 5.8%), and Health Technologists (27 | 2.1%).
Management, Business, Science and Arts Occupations by Sex
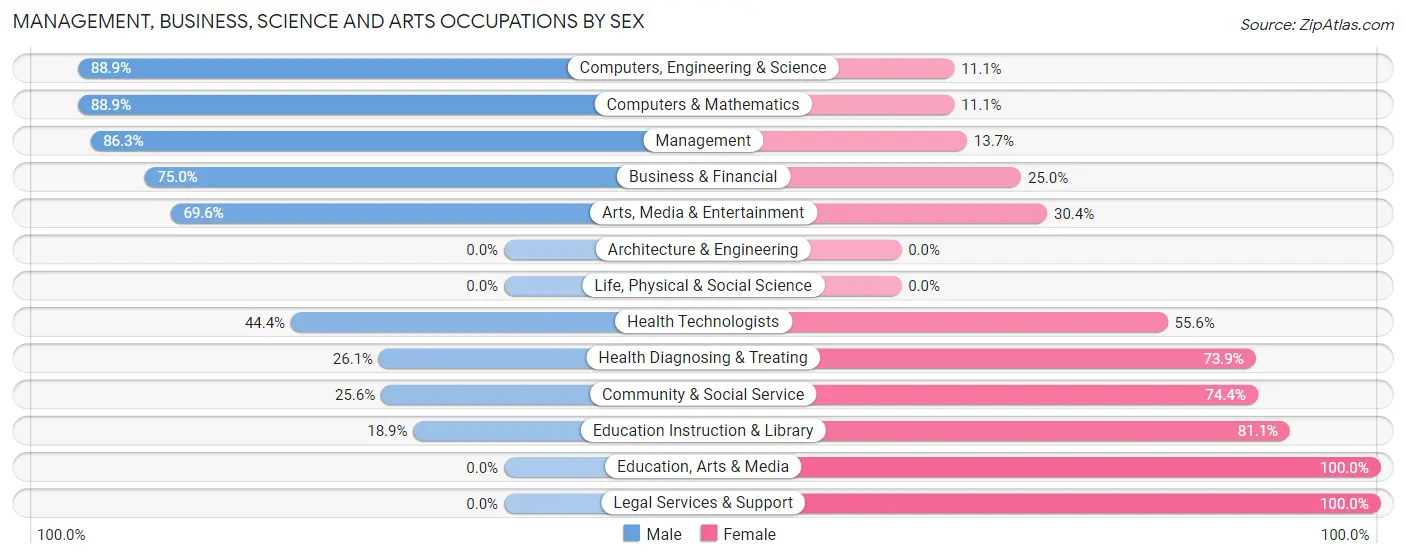
Within the Management, Business, Science and Arts occupations in Brown County, the most male-oriented occupations are Computers, Engineering & Science (88.9%), Computers & Mathematics (88.9%), and Management (86.3%), while the most female-oriented occupations are Education, Arts & Media (100.0%), Legal Services & Support (100.0%), and Education Instruction & Library (81.1%).
| Occupation | Male | Female |
| Management | 233 (86.3%) | 37 (13.7%) |
| Business & Financial | 6 (75.0%) | 2 (25.0%) |
| Computers, Engineering & Science | 8 (88.9%) | 1 (11.1%) |
| Computers & Mathematics | 8 (88.9%) | 1 (11.1%) |
| Architecture & Engineering | 0 (0.0%) | 0 (0.0%) |
| Life, Physical & Social Science | 0 (0.0%) | 0 (0.0%) |
| Community & Social Service | 30 (25.6%) | 87 (74.4%) |
| Education, Arts & Media | 0 (0.0%) | 13 (100.0%) |
| Legal Services & Support | 0 (0.0%) | 7 (100.0%) |
| Education Instruction & Library | 14 (18.9%) | 60 (81.1%) |
| Arts, Media & Entertainment | 16 (69.6%) | 7 (30.4%) |
| Health Diagnosing & Treating | 24 (26.1%) | 68 (73.9%) |
| Health Technologists | 12 (44.4%) | 15 (55.6%) |
| Total (Category) | 301 (60.7%) | 195 (39.3%) |
| Total (Overall) | 715 (55.6%) | 570 (44.4%) |
Services Occupations
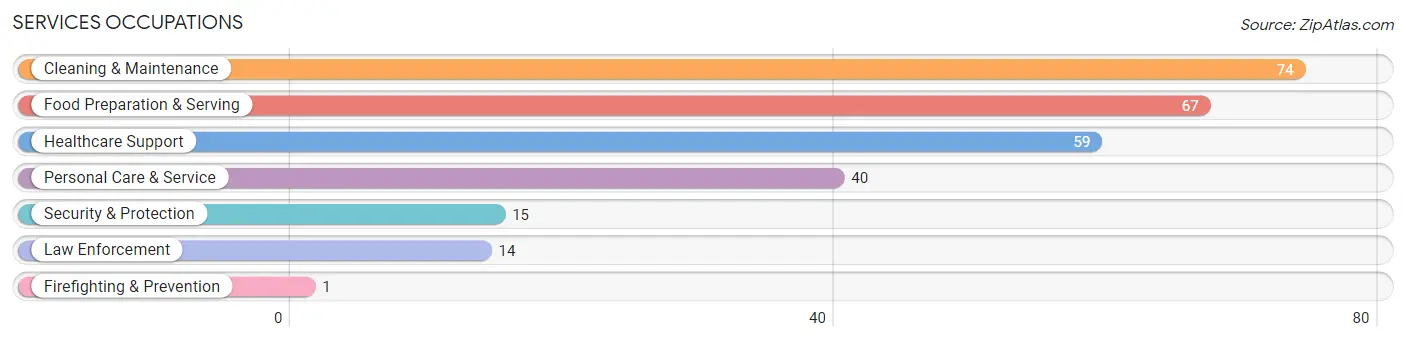
The most common Services occupations in Brown County are Cleaning & Maintenance (74 | 5.8%), Food Preparation & Serving (67 | 5.2%), Healthcare Support (59 | 4.6%), Personal Care & Service (40 | 3.1%), and Security & Protection (15 | 1.2%).
Services Occupations by Sex
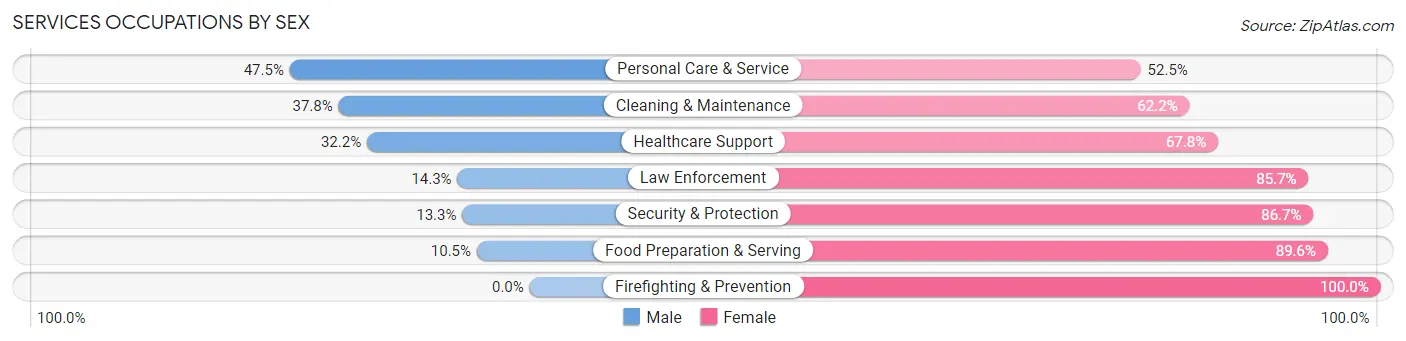
Within the Services occupations in Brown County, the most male-oriented occupations are Personal Care & Service (47.5%), Cleaning & Maintenance (37.8%), and Healthcare Support (32.2%), while the most female-oriented occupations are Firefighting & Prevention (100.0%), Food Preparation & Serving (89.5%), and Security & Protection (86.7%).
| Occupation | Male | Female |
| Healthcare Support | 19 (32.2%) | 40 (67.8%) |
| Security & Protection | 2 (13.3%) | 13 (86.7%) |
| Firefighting & Prevention | 0 (0.0%) | 1 (100.0%) |
| Law Enforcement | 2 (14.3%) | 12 (85.7%) |
| Food Preparation & Serving | 7 (10.4%) | 60 (89.5%) |
| Cleaning & Maintenance | 28 (37.8%) | 46 (62.2%) |
| Personal Care & Service | 19 (47.5%) | 21 (52.5%) |
| Total (Category) | 75 (29.4%) | 180 (70.6%) |
| Total (Overall) | 715 (55.6%) | 570 (44.4%) |
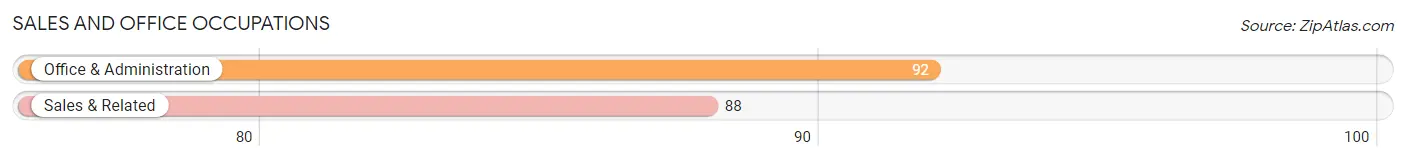
Sales and Office Occupations
The most common Sales and Office occupations in Brown County are Office & Administration (92 | 7.2%), and Sales & Related (88 | 6.9%).
Sales and Office Occupations by Sex
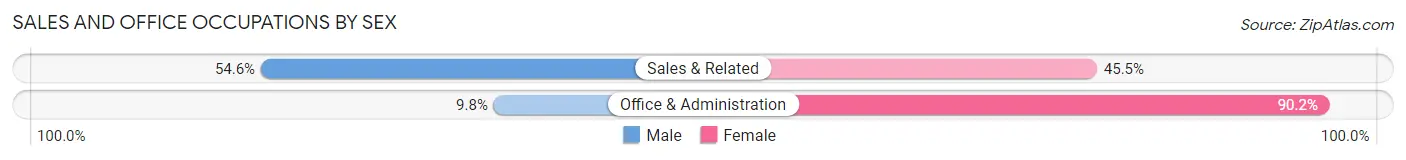
| Occupation | Male | Female |
| Sales & Related | 48 (54.5%) | 40 (45.5%) |
| Office & Administration | 9 (9.8%) | 83 (90.2%) |
| Total (Category) | 57 (31.7%) | 123 (68.3%) |
| Total (Overall) | 715 (55.6%) | 570 (44.4%) |
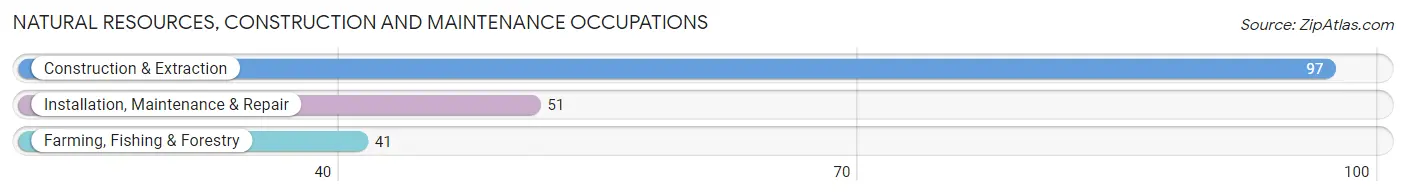
Natural Resources, Construction and Maintenance Occupations
The most common Natural Resources, Construction and Maintenance occupations in Brown County are Construction & Extraction (97 | 7.5%), Installation, Maintenance & Repair (51 | 4.0%), and Farming, Fishing & Forestry (41 | 3.2%).
Natural Resources, Construction and Maintenance Occupations by Sex
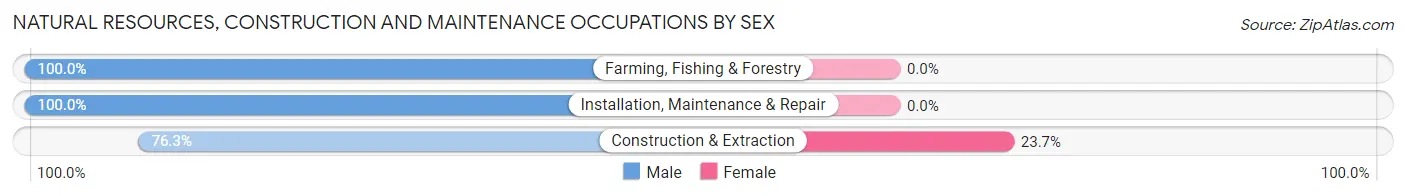
| Occupation | Male | Female |
| Farming, Fishing & Forestry | 41 (100.0%) | 0 (0.0%) |
| Construction & Extraction | 74 (76.3%) | 23 (23.7%) |
| Installation, Maintenance & Repair | 51 (100.0%) | 0 (0.0%) |
| Total (Category) | 166 (87.8%) | 23 (12.2%) |
| Total (Overall) | 715 (55.6%) | 570 (44.4%) |
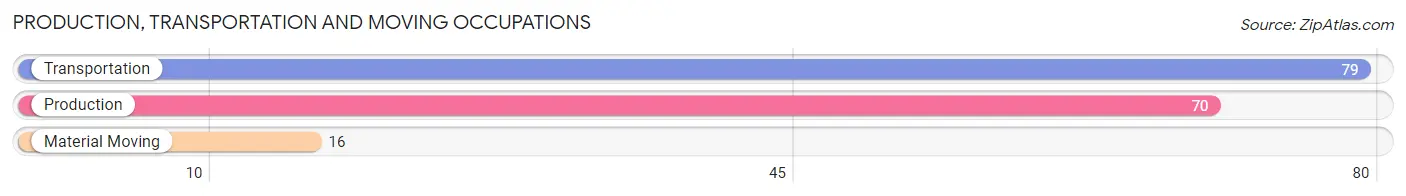
Production, Transportation and Moving Occupations
The most common Production, Transportation and Moving occupations in Brown County are Transportation (79 | 6.1%), Production (70 | 5.4%), and Material Moving (16 | 1.3%).
Production, Transportation and Moving Occupations by Sex
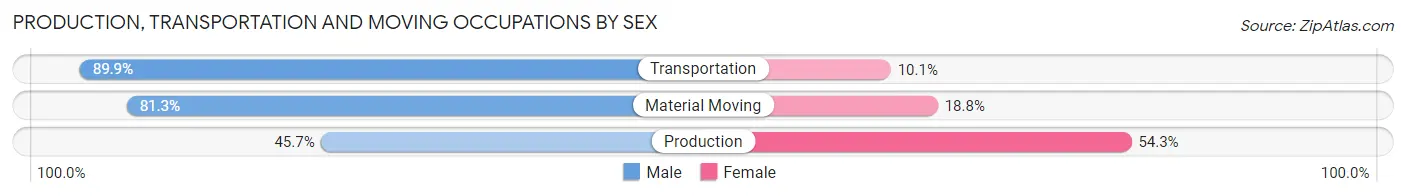
| Occupation | Male | Female |
| Production | 32 (45.7%) | 38 (54.3%) |
| Transportation | 71 (89.9%) | 8 (10.1%) |
| Material Moving | 13 (81.2%) | 3 (18.8%) |
| Total (Category) | 116 (70.3%) | 49 (29.7%) |
| Total (Overall) | 715 (55.6%) | 570 (44.4%) |
Employment Industries by Sex in Brown County
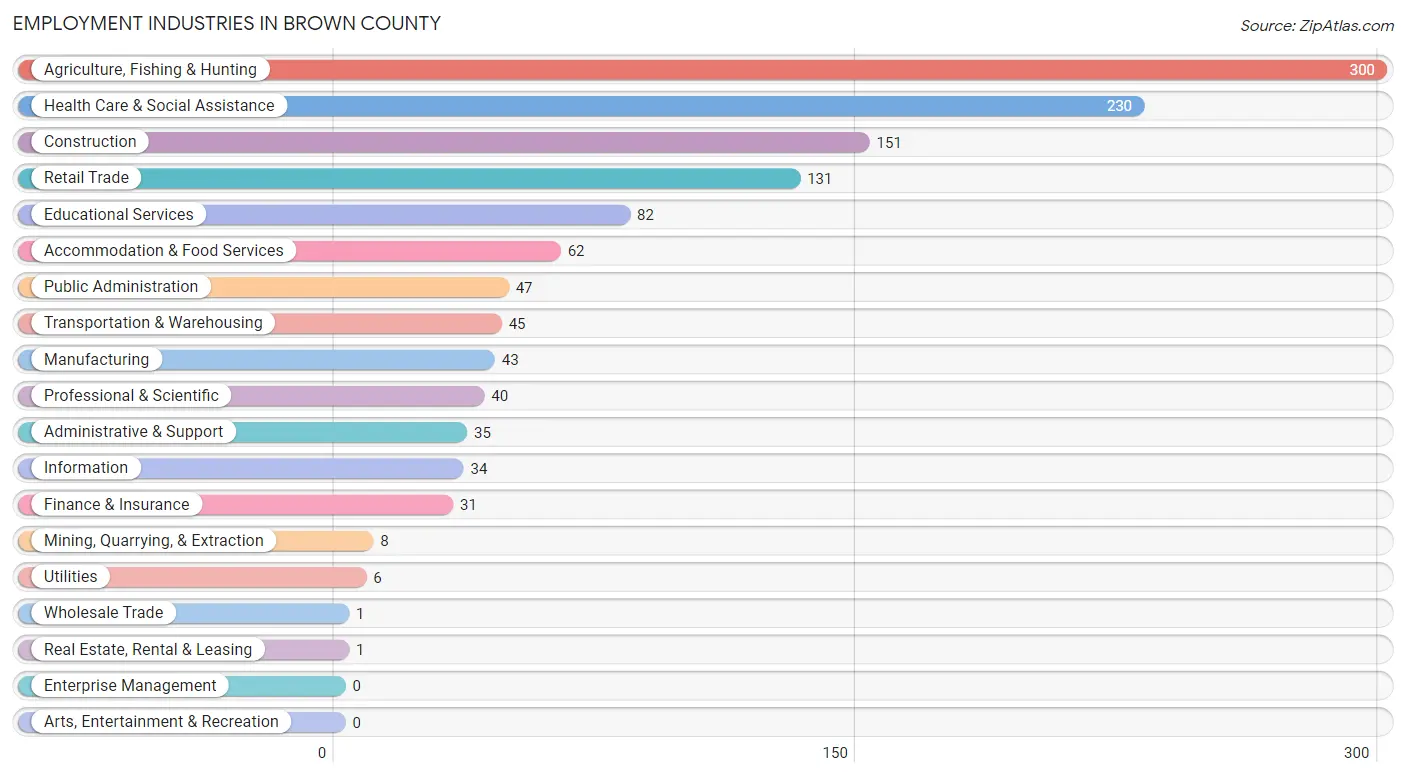
Employment Industries in Brown County
The major employment industries in Brown County include Agriculture, Fishing & Hunting (300 | 23.4%), Health Care & Social Assistance (230 | 17.9%), Construction (151 | 11.7%), Retail Trade (131 | 10.2%), and Educational Services (82 | 6.4%).
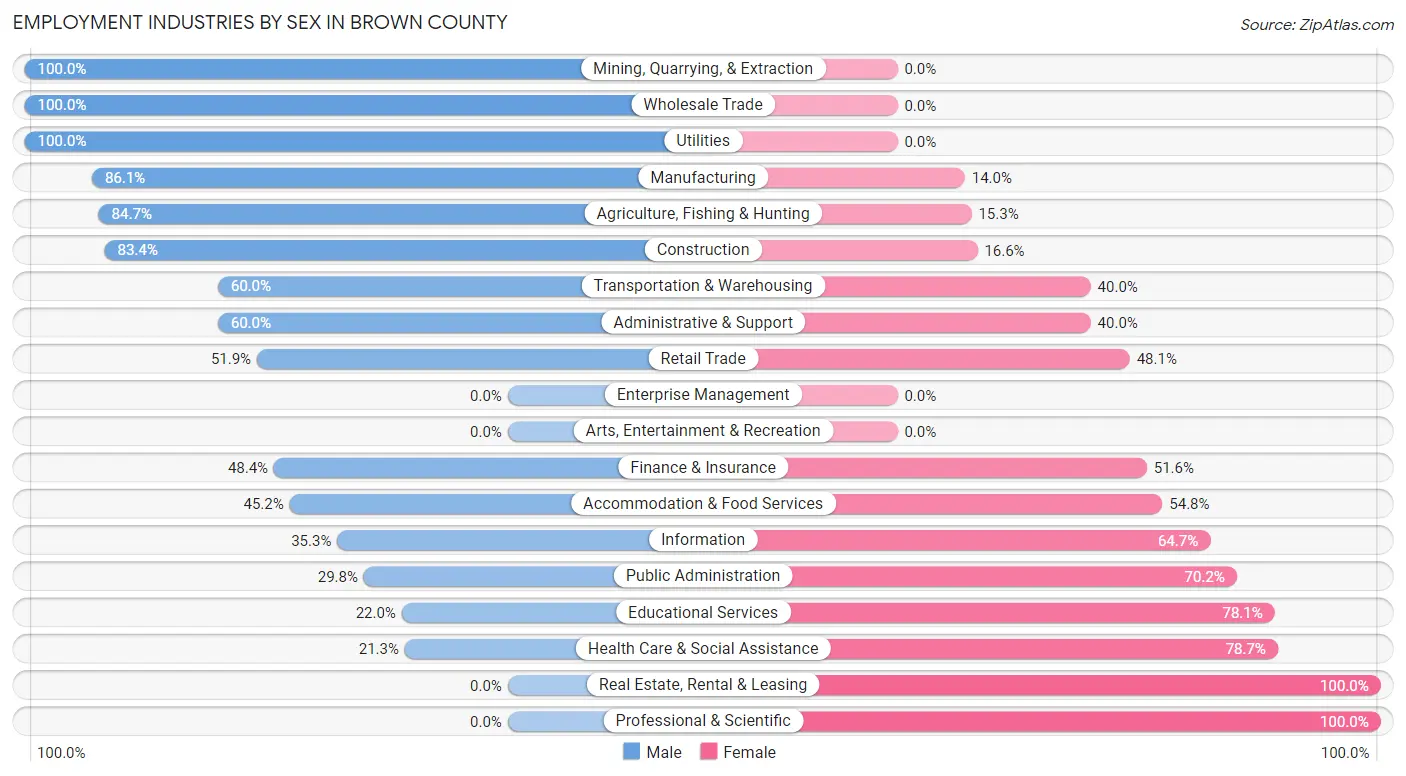
Employment Industries by Sex in Brown County
The Brown County industries that see more men than women are Mining, Quarrying, & Extraction (100.0%), Wholesale Trade (100.0%), and Utilities (100.0%), whereas the industries that tend to have a higher number of women are Real Estate, Rental & Leasing (100.0%), Professional & Scientific (100.0%), and Health Care & Social Assistance (78.7%).
| Industry | Male | Female |
| Agriculture, Fishing & Hunting | 254 (84.7%) | 46 (15.3%) |
| Mining, Quarrying, & Extraction | 8 (100.0%) | 0 (0.0%) |
| Construction | 126 (83.4%) | 25 (16.6%) |
| Manufacturing | 37 (86.1%) | 6 (14.0%) |
| Wholesale Trade | 1 (100.0%) | 0 (0.0%) |
| Retail Trade | 68 (51.9%) | 63 (48.1%) |
| Transportation & Warehousing | 27 (60.0%) | 18 (40.0%) |
| Utilities | 6 (100.0%) | 0 (0.0%) |
| Information | 12 (35.3%) | 22 (64.7%) |
| Finance & Insurance | 15 (48.4%) | 16 (51.6%) |
| Real Estate, Rental & Leasing | 0 (0.0%) | 1 (100.0%) |
| Professional & Scientific | 0 (0.0%) | 40 (100.0%) |
| Enterprise Management | 0 (0.0%) | 0 (0.0%) |
| Administrative & Support | 21 (60.0%) | 14 (40.0%) |
| Educational Services | 18 (22.0%) | 64 (78.0%) |
| Health Care & Social Assistance | 49 (21.3%) | 181 (78.7%) |
| Arts, Entertainment & Recreation | 0 (0.0%) | 0 (0.0%) |
| Accommodation & Food Services | 28 (45.2%) | 34 (54.8%) |
| Public Administration | 14 (29.8%) | 33 (70.2%) |
| Total | 715 (55.6%) | 570 (44.4%) |
Education in Brown County
School Enrollment in Brown County
The most common levels of schooling among the 482 students in Brown County are high school (140 | 29.0%), middle school (105 | 21.8%), and elementary school (89 | 18.5%).
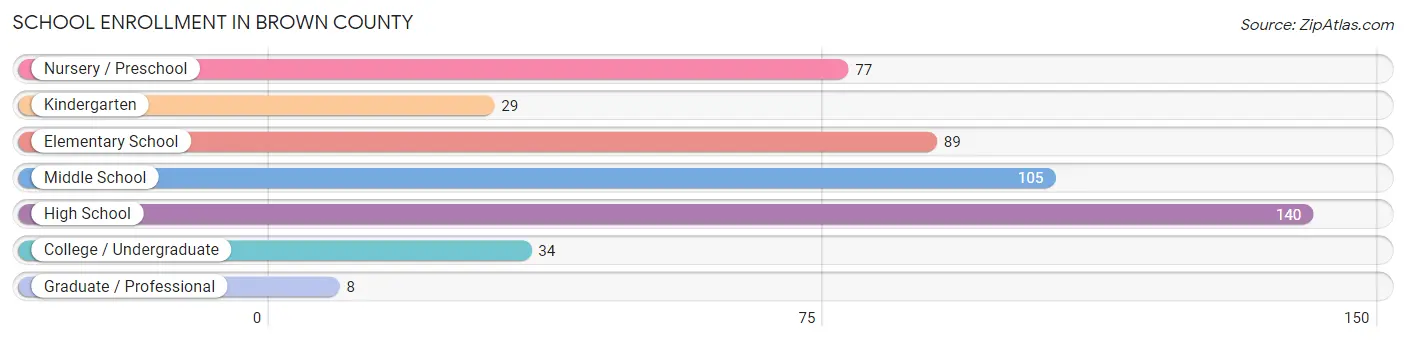
| School Level | # Students | % Students |
| Nursery / Preschool | 77 | 16.0% |
| Kindergarten | 29 | 6.0% |
| Elementary School | 89 | 18.5% |
| Middle School | 105 | 21.8% |
| High School | 140 | 29.0% |
| College / Undergraduate | 34 | 7.0% |
| Graduate / Professional | 8 | 1.7% |
| Total | 482 | 100.0% |
School Enrollment by Age by Funding Source in Brown County
Out of a total of 482 students who are enrolled in schools in Brown County, 68 (14.1%) attend a private institution, while the remaining 414 (85.9%) are enrolled in public schools. The age group of 15 to 17 year olds has the highest likelihood of being enrolled in private schools, with 46 (64.8% in the age bracket) enrolled. Conversely, the age group of 18 to 19 year olds has the lowest likelihood of being enrolled in a private school, with 77 (100.0% in the age bracket) attending a public institution.
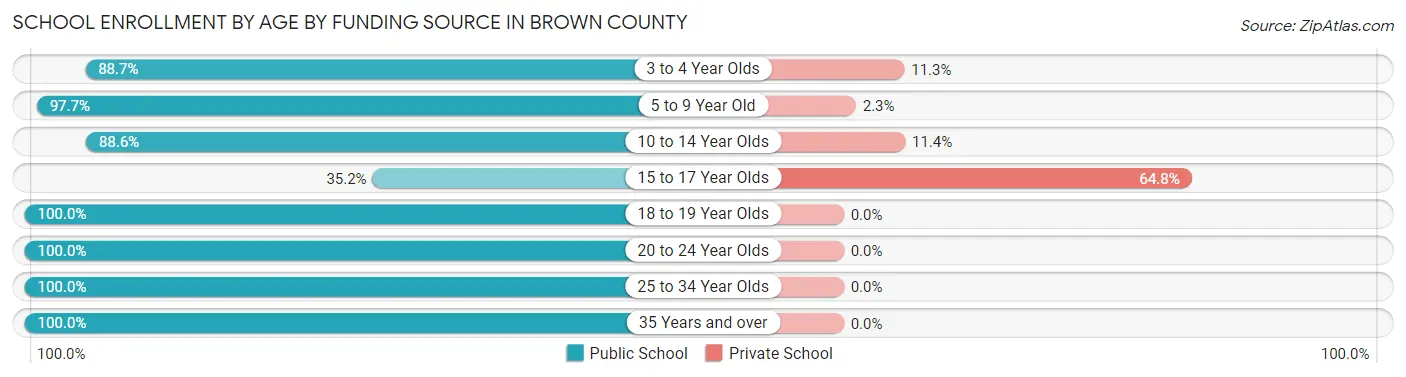
| Age Bracket | Public School | Private School |
| 3 to 4 Year Olds | 55 (88.7%) | 7 (11.3%) |
| 5 to 9 Year Old | 130 (97.7%) | 3 (2.3%) |
| 10 to 14 Year Olds | 93 (88.6%) | 12 (11.4%) |
| 15 to 17 Year Olds | 25 (35.2%) | 46 (64.8%) |
| 18 to 19 Year Olds | 77 (100.0%) | 0 (0.0%) |
| 20 to 24 Year Olds | 8 (100.0%) | 0 (0.0%) |
| 25 to 34 Year Olds | 13 (100.0%) | 0 (0.0%) |
| 35 Years and over | 13 (100.0%) | 0 (0.0%) |
| Total | 414 (85.9%) | 68 (14.1%) |
Educational Attainment by Field of Study in Brown County
Bio, nature & agricultural (120 | 23.4%), science & technology (120 | 23.4%), education (78 | 15.2%), business (51 | 10.0%), and liberal arts & history (40 | 7.8%) are the most common fields of study among 512 individuals in Brown County who have obtained a bachelor's degree or higher.
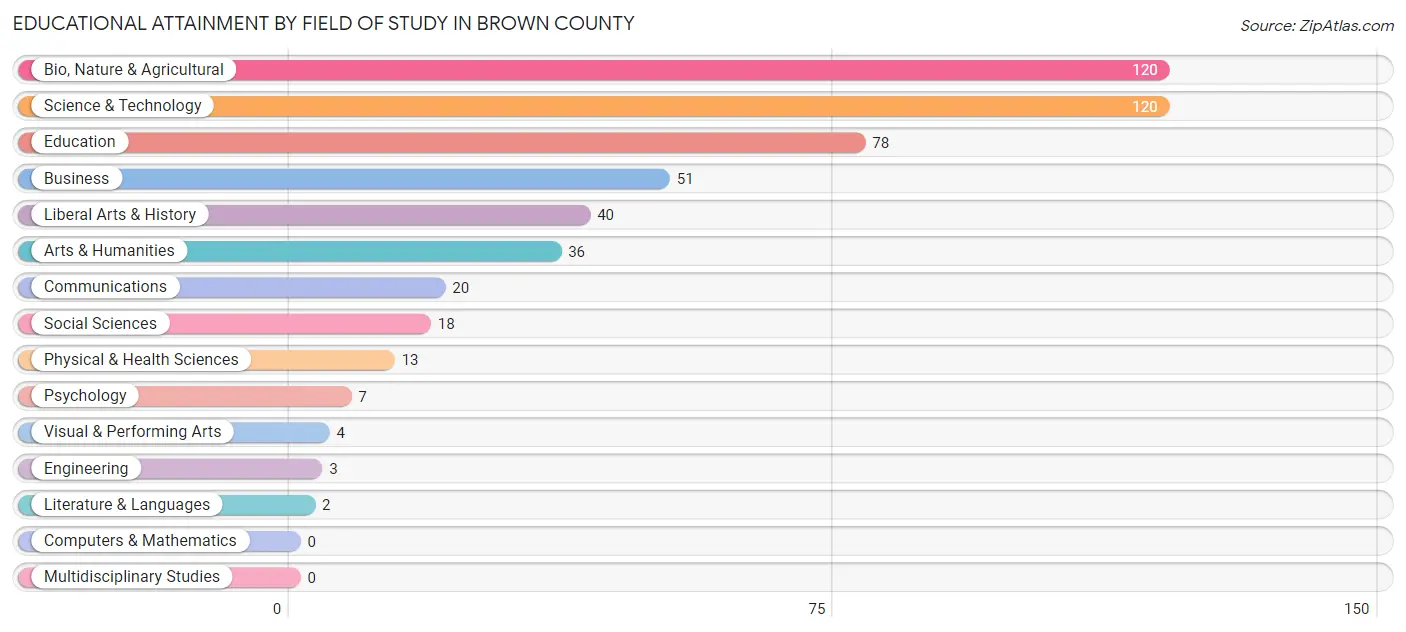
| Field of Study | # Graduates | % Graduates |
| Computers & Mathematics | 0 | 0.0% |
| Bio, Nature & Agricultural | 120 | 23.4% |
| Physical & Health Sciences | 13 | 2.5% |
| Psychology | 7 | 1.4% |
| Social Sciences | 18 | 3.5% |
| Engineering | 3 | 0.6% |
| Multidisciplinary Studies | 0 | 0.0% |
| Science & Technology | 120 | 23.4% |
| Business | 51 | 10.0% |
| Education | 78 | 15.2% |
| Literature & Languages | 2 | 0.4% |
| Liberal Arts & History | 40 | 7.8% |
| Visual & Performing Arts | 4 | 0.8% |
| Communications | 20 | 3.9% |
| Arts & Humanities | 36 | 7.0% |
| Total | 512 | 100.0% |
Transportation & Commute in Brown County
Vehicle Availability by Sex in Brown County
The most prevalent vehicle ownership categories in Brown County are males with 2 vehicles (269, accounting for 39.0%) and females with 2 vehicles (237, making up 47.8%).
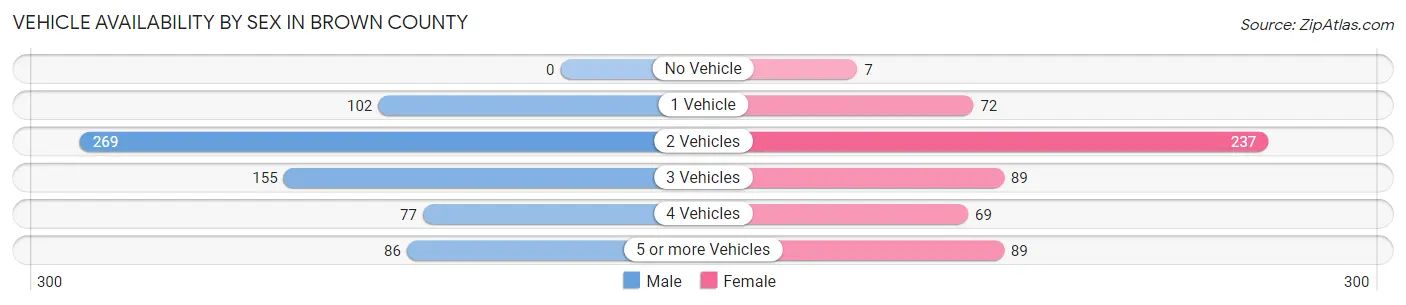
| Vehicles Available | Male | Female |
| No Vehicle | 0 (0.0%) | 7 (1.2%) |
| 1 Vehicle | 102 (14.8%) | 72 (12.8%) |
| 2 Vehicles | 269 (39.0%) | 237 (42.1%) |
| 3 Vehicles | 155 (22.5%) | 89 (15.8%) |
| 4 Vehicles | 77 (11.2%) | 69 (12.3%) |
| 5 or more Vehicles | 86 (12.5%) | 89 (15.8%) |
| Total | 689 (100.0%) | 563 (100.0%) |
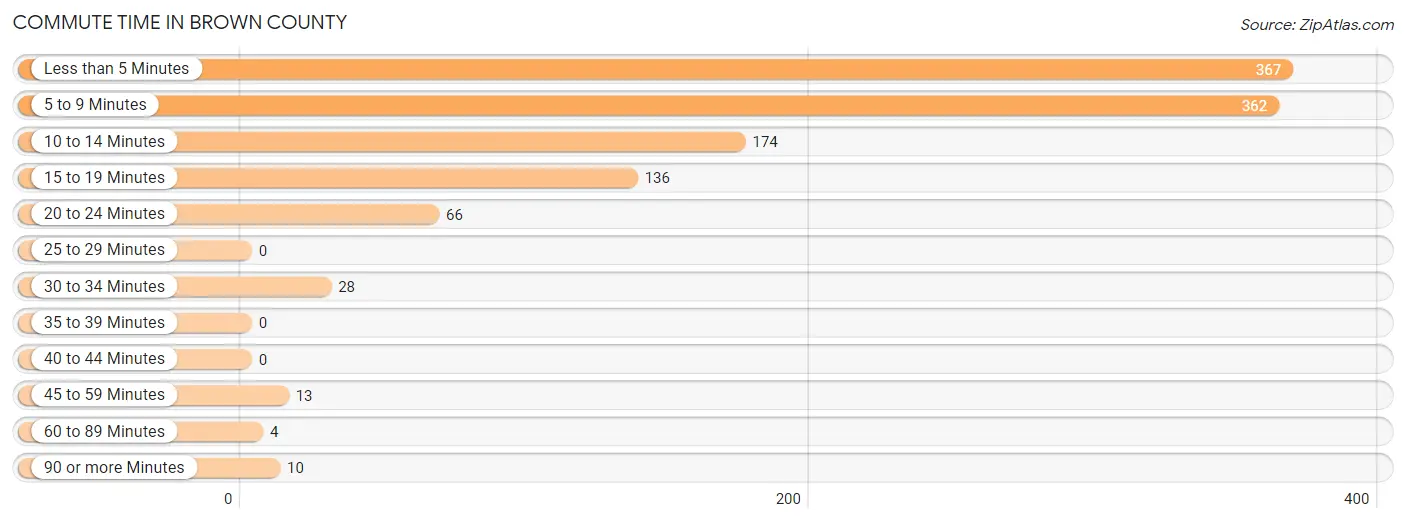
Commute Time in Brown County
The most frequently occuring commute durations in Brown County are less than 5 minutes (367 commuters, 31.6%), 5 to 9 minutes (362 commuters, 31.2%), and 10 to 14 minutes (174 commuters, 15.0%).
| Commute Time | # Commuters | % Commuters |
| Less than 5 Minutes | 367 | 31.6% |
| 5 to 9 Minutes | 362 | 31.2% |
| 10 to 14 Minutes | 174 | 15.0% |
| 15 to 19 Minutes | 136 | 11.7% |
| 20 to 24 Minutes | 66 | 5.7% |
| 25 to 29 Minutes | 0 | 0.0% |
| 30 to 34 Minutes | 28 | 2.4% |
| 35 to 39 Minutes | 0 | 0.0% |
| 40 to 44 Minutes | 0 | 0.0% |
| 45 to 59 Minutes | 13 | 1.1% |
| 60 to 89 Minutes | 4 | 0.3% |
| 90 or more Minutes | 10 | 0.9% |
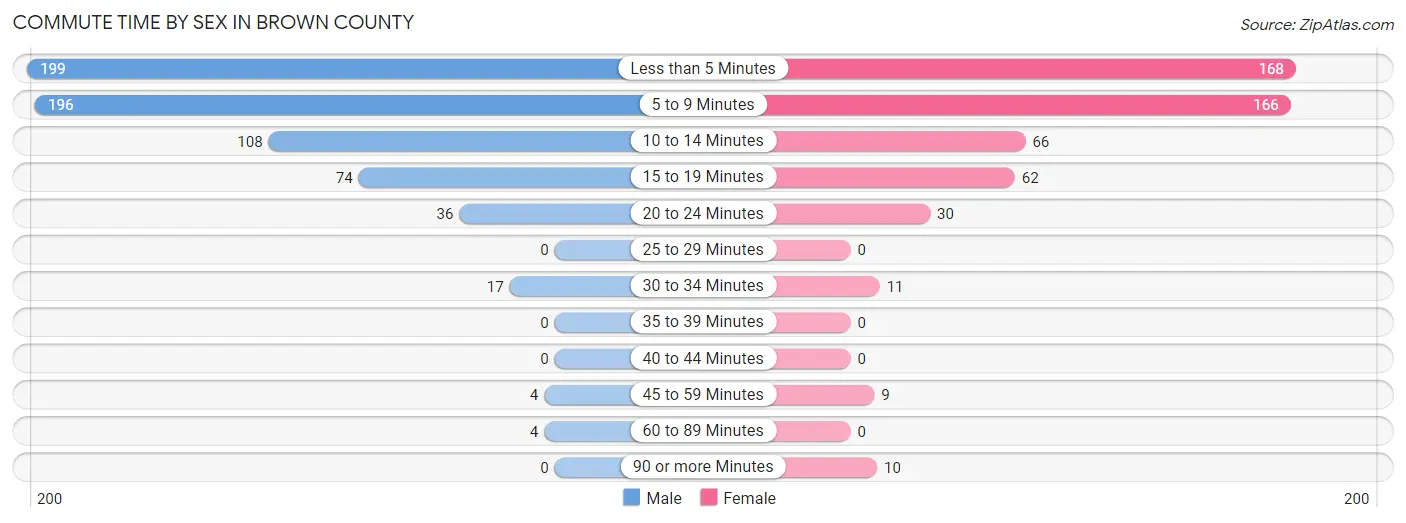
Commute Time by Sex in Brown County
The most common commute times in Brown County are less than 5 minutes (199 commuters, 31.2%) for males and less than 5 minutes (168 commuters, 32.2%) for females.
| Commute Time | Male | Female |
| Less than 5 Minutes | 199 (31.2%) | 168 (32.2%) |
| 5 to 9 Minutes | 196 (30.7%) | 166 (31.8%) |
| 10 to 14 Minutes | 108 (16.9%) | 66 (12.6%) |
| 15 to 19 Minutes | 74 (11.6%) | 62 (11.9%) |
| 20 to 24 Minutes | 36 (5.6%) | 30 (5.8%) |
| 25 to 29 Minutes | 0 (0.0%) | 0 (0.0%) |
| 30 to 34 Minutes | 17 (2.7%) | 11 (2.1%) |
| 35 to 39 Minutes | 0 (0.0%) | 0 (0.0%) |
| 40 to 44 Minutes | 0 (0.0%) | 0 (0.0%) |
| 45 to 59 Minutes | 4 (0.6%) | 9 (1.7%) |
| 60 to 89 Minutes | 4 (0.6%) | 0 (0.0%) |
| 90 or more Minutes | 0 (0.0%) | 10 (1.9%) |
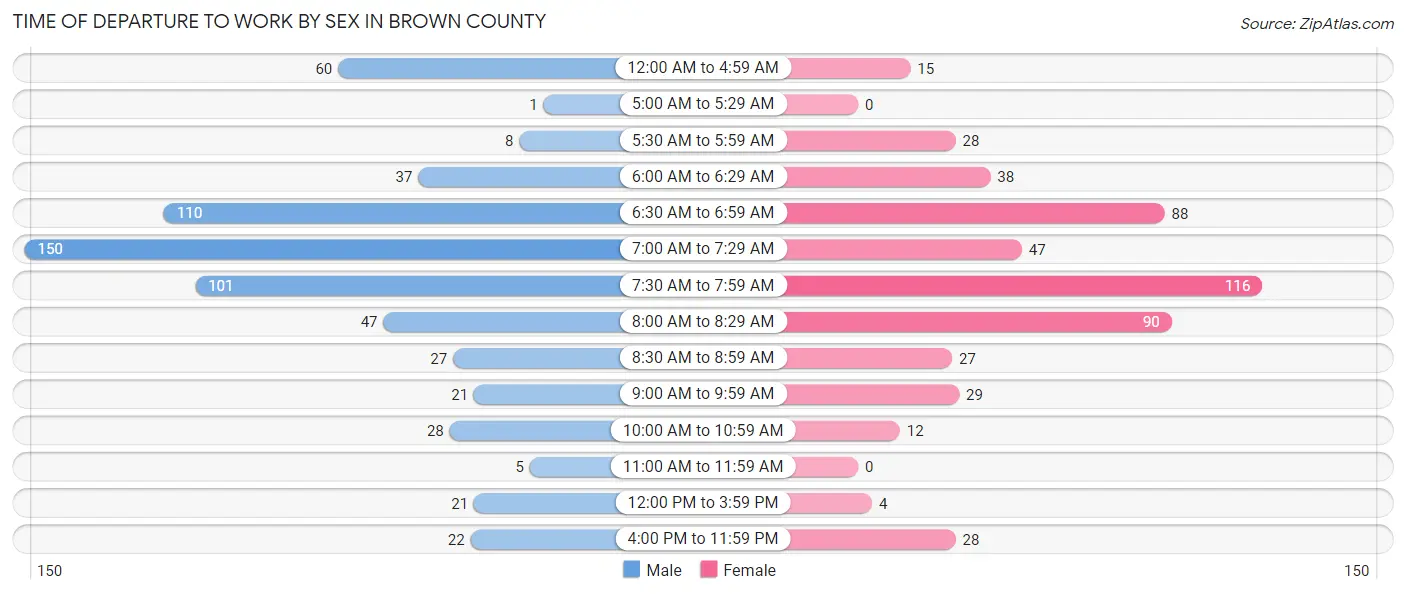
Time of Departure to Work by Sex in Brown County
The most frequent times of departure to work in Brown County are 7:00 AM to 7:29 AM (150, 23.5%) for males and 7:30 AM to 7:59 AM (116, 22.2%) for females.
| Time of Departure | Male | Female |
| 12:00 AM to 4:59 AM | 60 (9.4%) | 15 (2.9%) |
| 5:00 AM to 5:29 AM | 1 (0.2%) | 0 (0.0%) |
| 5:30 AM to 5:59 AM | 8 (1.3%) | 28 (5.4%) |
| 6:00 AM to 6:29 AM | 37 (5.8%) | 38 (7.3%) |
| 6:30 AM to 6:59 AM | 110 (17.2%) | 88 (16.9%) |
| 7:00 AM to 7:29 AM | 150 (23.5%) | 47 (9.0%) |
| 7:30 AM to 7:59 AM | 101 (15.8%) | 116 (22.2%) |
| 8:00 AM to 8:29 AM | 47 (7.4%) | 90 (17.2%) |
| 8:30 AM to 8:59 AM | 27 (4.2%) | 27 (5.2%) |
| 9:00 AM to 9:59 AM | 21 (3.3%) | 29 (5.6%) |
| 10:00 AM to 10:59 AM | 28 (4.4%) | 12 (2.3%) |
| 11:00 AM to 11:59 AM | 5 (0.8%) | 0 (0.0%) |
| 12:00 PM to 3:59 PM | 21 (3.3%) | 4 (0.8%) |
| 4:00 PM to 11:59 PM | 22 (3.5%) | 28 (5.4%) |
| Total | 638 (100.0%) | 522 (100.0%) |
Housing Occupancy in Brown County
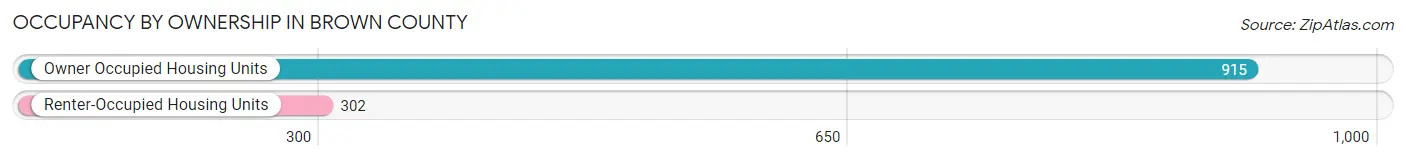
Occupancy by Ownership in Brown County
Of the total 1,217 dwellings in Brown County, owner-occupied units account for 915 (75.2%), while renter-occupied units make up 302 (24.8%).
| Occupancy | # Housing Units | % Housing Units |
| Owner Occupied Housing Units | 915 | 75.2% |
| Renter-Occupied Housing Units | 302 | 24.8% |
| Total Occupied Housing Units | 1,217 | 100.0% |
Occupancy by Household Size in Brown County
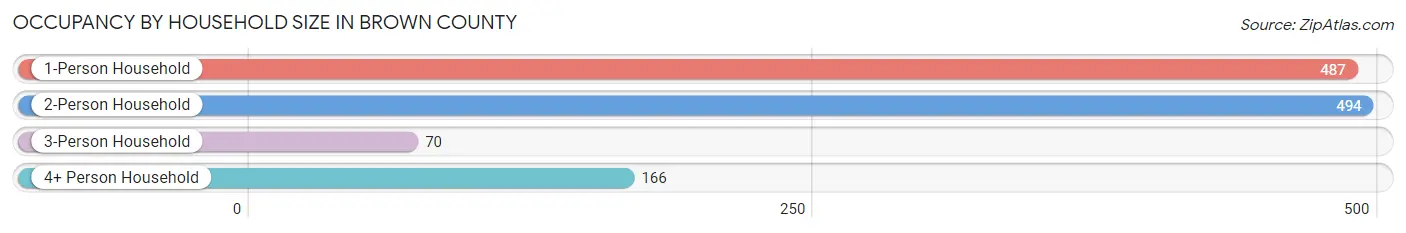
| Household Size | # Housing Units | % Housing Units |
| 1-Person Household | 487 | 40.0% |
| 2-Person Household | 494 | 40.6% |
| 3-Person Household | 70 | 5.8% |
| 4+ Person Household | 166 | 13.6% |
| Total Housing Units | 1,217 | 100.0% |
Occupancy by Ownership by Household Size in Brown County
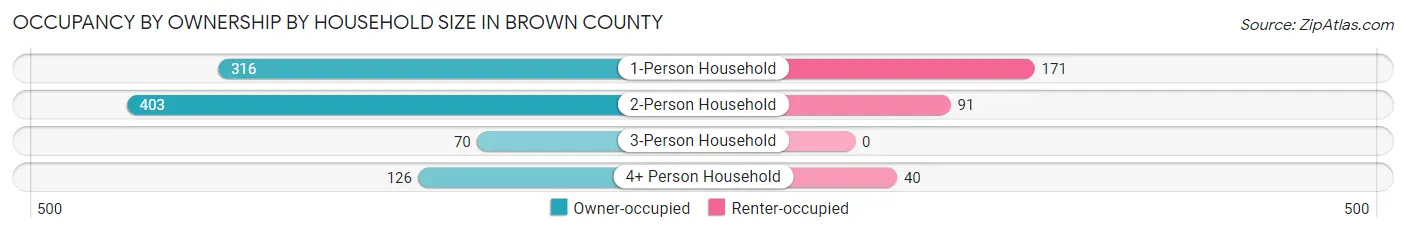
| Household Size | Owner-occupied | Renter-occupied |
| 1-Person Household | 316 (64.9%) | 171 (35.1%) |
| 2-Person Household | 403 (81.6%) | 91 (18.4%) |
| 3-Person Household | 70 (100.0%) | 0 (0.0%) |
| 4+ Person Household | 126 (75.9%) | 40 (24.1%) |
| Total Housing Units | 915 (75.2%) | 302 (24.8%) |
Occupancy by Educational Attainment in Brown County
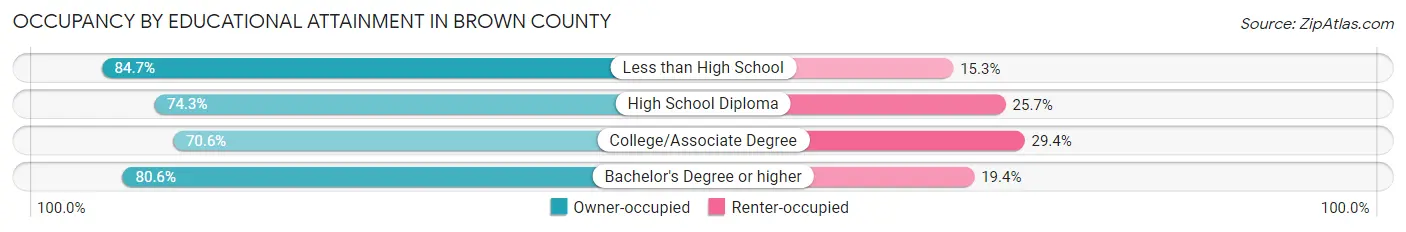
| Household Size | Owner-occupied | Renter-occupied |
| Less than High School | 61 (84.7%) | 11 (15.3%) |
| High School Diploma | 278 (74.3%) | 96 (25.7%) |
| College/Associate Degree | 319 (70.6%) | 133 (29.4%) |
| Bachelor's Degree or higher | 257 (80.6%) | 62 (19.4%) |
Occupancy by Age of Householder in Brown County
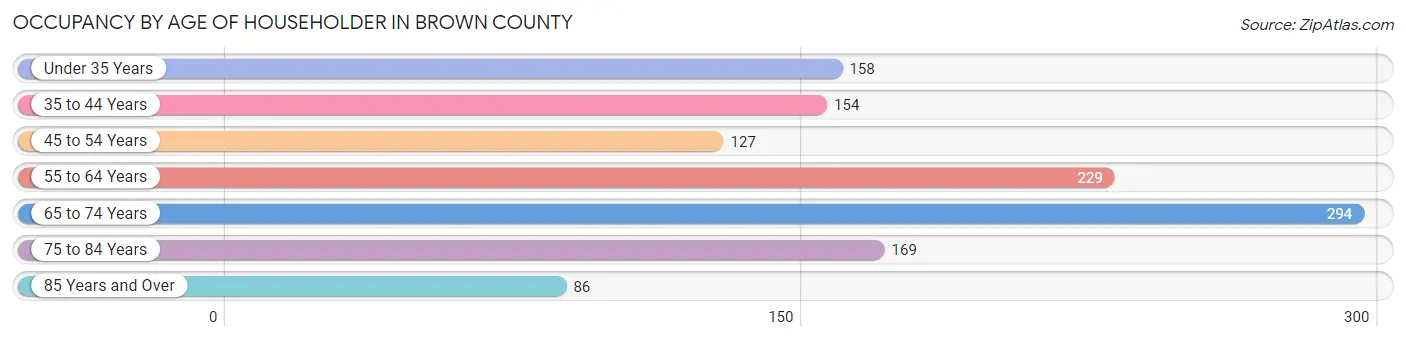
| Age Bracket | # Households | % Households |
| Under 35 Years | 158 | 13.0% |
| 35 to 44 Years | 154 | 12.7% |
| 45 to 54 Years | 127 | 10.4% |
| 55 to 64 Years | 229 | 18.8% |
| 65 to 74 Years | 294 | 24.2% |
| 75 to 84 Years | 169 | 13.9% |
| 85 Years and Over | 86 | 7.1% |
| Total | 1,217 | 100.0% |
Housing Finances in Brown County
Median Income by Occupancy in Brown County
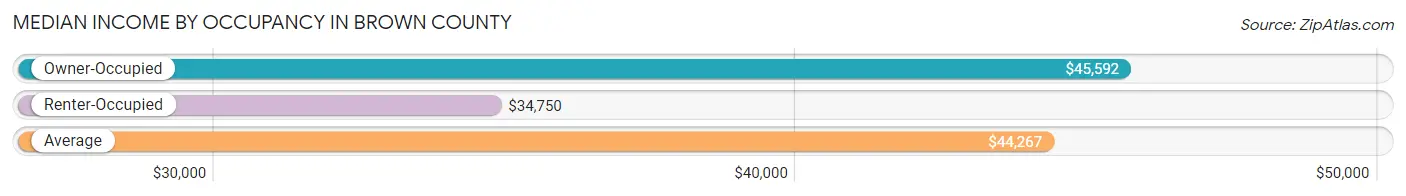
| Occupancy Type | # Households | Median Income |
| Owner-Occupied | 915 (75.2%) | $45,592 |
| Renter-Occupied | 302 (24.8%) | $34,750 |
| Average | 1,217 (100.0%) | $44,267 |
Occupancy by Householder Income Bracket in Brown County
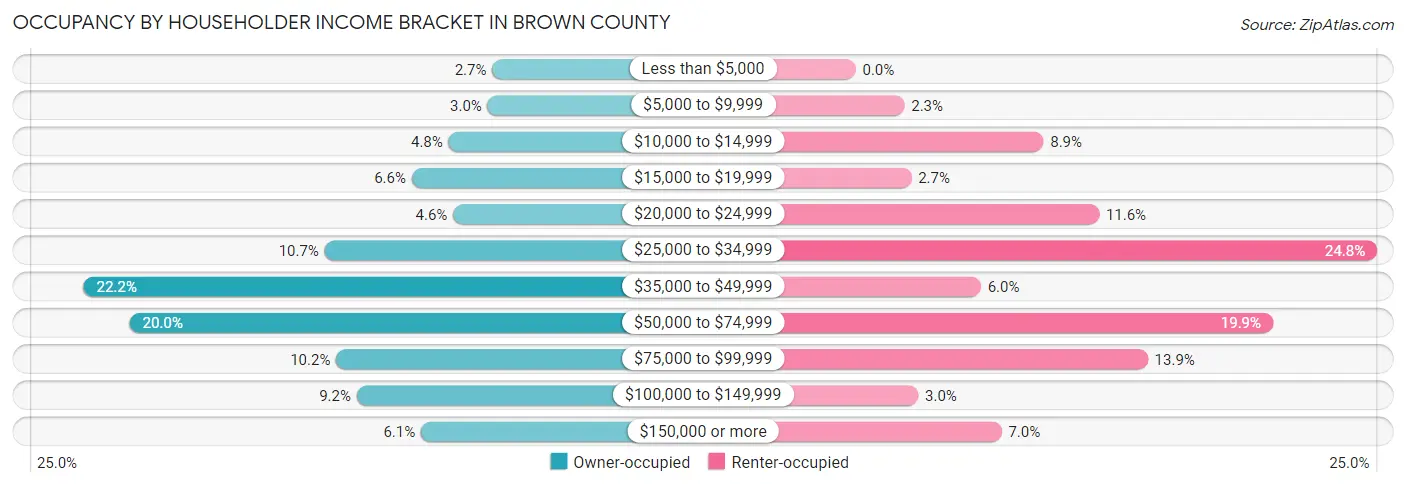
| Income Bracket | Owner-occupied | Renter-occupied |
| Less than $5,000 | 25 (2.7%) | 0 (0.0%) |
| $5,000 to $9,999 | 27 (2.9%) | 7 (2.3%) |
| $10,000 to $14,999 | 44 (4.8%) | 27 (8.9%) |
| $15,000 to $19,999 | 60 (6.6%) | 8 (2.6%) |
| $20,000 to $24,999 | 42 (4.6%) | 35 (11.6%) |
| $25,000 to $34,999 | 98 (10.7%) | 75 (24.8%) |
| $35,000 to $49,999 | 203 (22.2%) | 18 (6.0%) |
| $50,000 to $74,999 | 183 (20.0%) | 60 (19.9%) |
| $75,000 to $99,999 | 93 (10.2%) | 42 (13.9%) |
| $100,000 to $149,999 | 84 (9.2%) | 9 (3.0%) |
| $150,000 or more | 56 (6.1%) | 21 (7.0%) |
| Total | 915 (100.0%) | 302 (100.0%) |
Monthly Housing Cost Tiers in Brown County
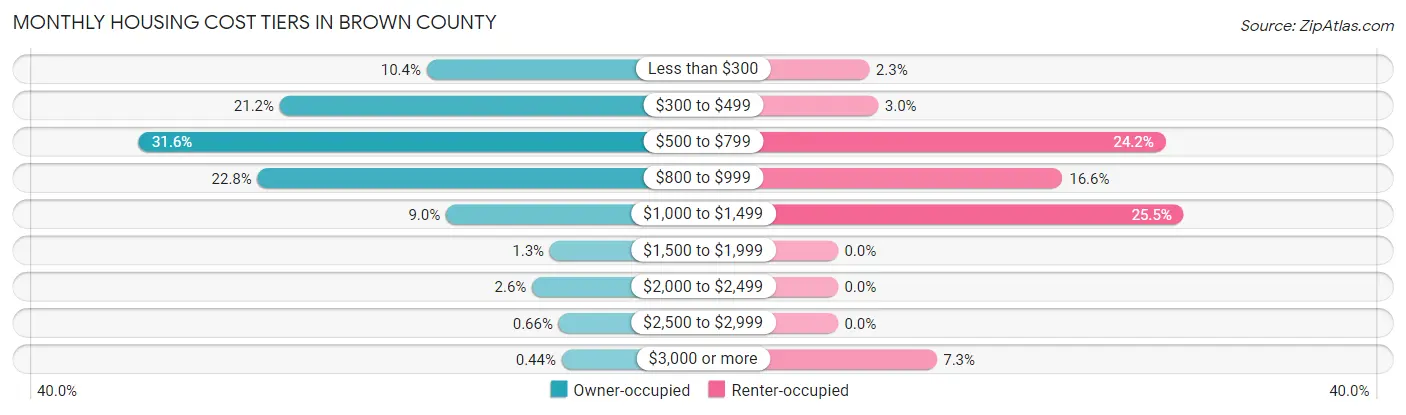
| Monthly Cost | Owner-occupied | Renter-occupied |
| Less than $300 | 95 (10.4%) | 7 (2.3%) |
| $300 to $499 | 194 (21.2%) | 9 (3.0%) |
| $500 to $799 | 289 (31.6%) | 73 (24.2%) |
| $800 to $999 | 209 (22.8%) | 50 (16.6%) |
| $1,000 to $1,499 | 82 (9.0%) | 77 (25.5%) |
| $1,500 to $1,999 | 12 (1.3%) | 0 (0.0%) |
| $2,000 to $2,499 | 24 (2.6%) | 0 (0.0%) |
| $2,500 to $2,999 | 6 (0.7%) | 0 (0.0%) |
| $3,000 or more | 4 (0.4%) | 22 (7.3%) |
| Total | 915 (100.0%) | 302 (100.0%) |
Physical Housing Characteristics in Brown County
Housing Structures in Brown County
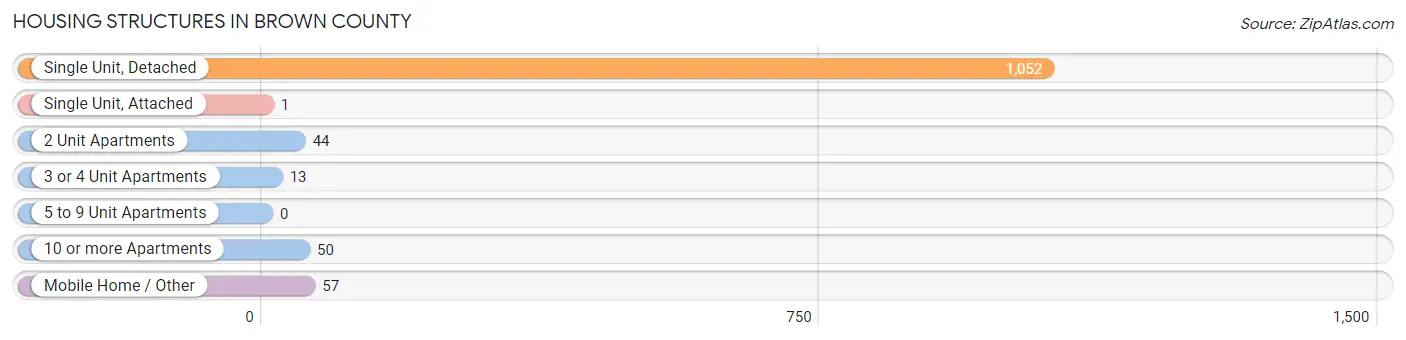
| Structure Type | # Housing Units | % Housing Units |
| Single Unit, Detached | 1,052 | 86.4% |
| Single Unit, Attached | 1 | 0.1% |
| 2 Unit Apartments | 44 | 3.6% |
| 3 or 4 Unit Apartments | 13 | 1.1% |
| 5 to 9 Unit Apartments | 0 | 0.0% |
| 10 or more Apartments | 50 | 4.1% |
| Mobile Home / Other | 57 | 4.7% |
| Total | 1,217 | 100.0% |
Housing Structures by Occupancy in Brown County
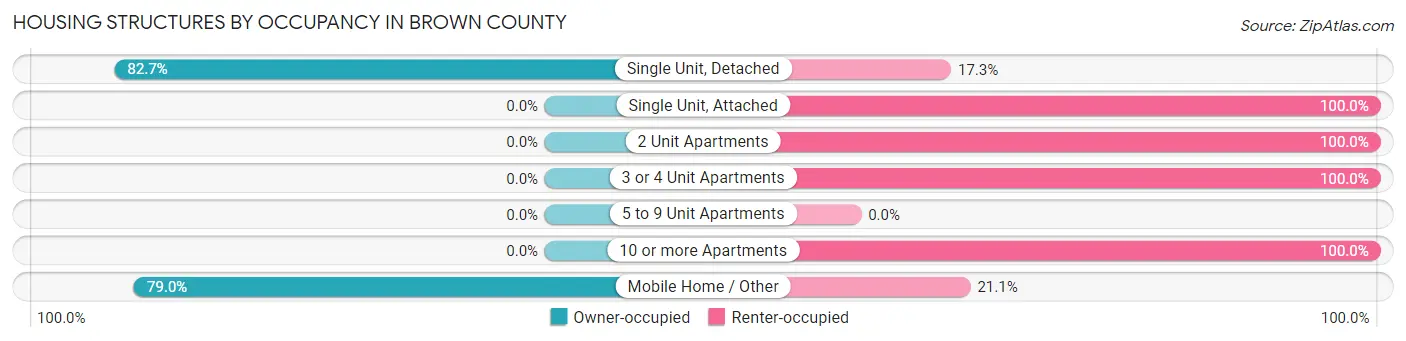
| Structure Type | Owner-occupied | Renter-occupied |
| Single Unit, Detached | 870 (82.7%) | 182 (17.3%) |
| Single Unit, Attached | 0 (0.0%) | 1 (100.0%) |
| 2 Unit Apartments | 0 (0.0%) | 44 (100.0%) |
| 3 or 4 Unit Apartments | 0 (0.0%) | 13 (100.0%) |
| 5 to 9 Unit Apartments | 0 (0.0%) | 0 (0.0%) |
| 10 or more Apartments | 0 (0.0%) | 50 (100.0%) |
| Mobile Home / Other | 45 (78.9%) | 12 (21.0%) |
| Total | 915 (75.2%) | 302 (24.8%) |
Housing Structures by Number of Rooms in Brown County
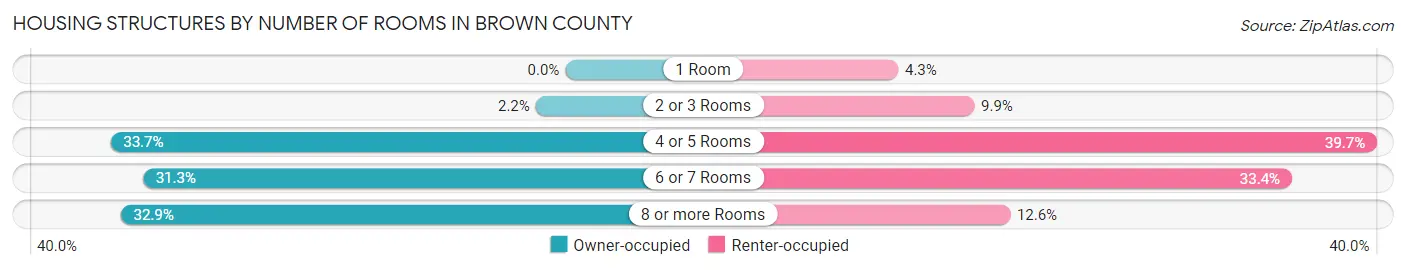
| Number of Rooms | Owner-occupied | Renter-occupied |
| 1 Room | 0 (0.0%) | 13 (4.3%) |
| 2 or 3 Rooms | 20 (2.2%) | 30 (9.9%) |
| 4 or 5 Rooms | 308 (33.7%) | 120 (39.7%) |
| 6 or 7 Rooms | 286 (31.3%) | 101 (33.4%) |
| 8 or more Rooms | 301 (32.9%) | 38 (12.6%) |
| Total | 915 (100.0%) | 302 (100.0%) |
Housing Structure by Heating Type in Brown County
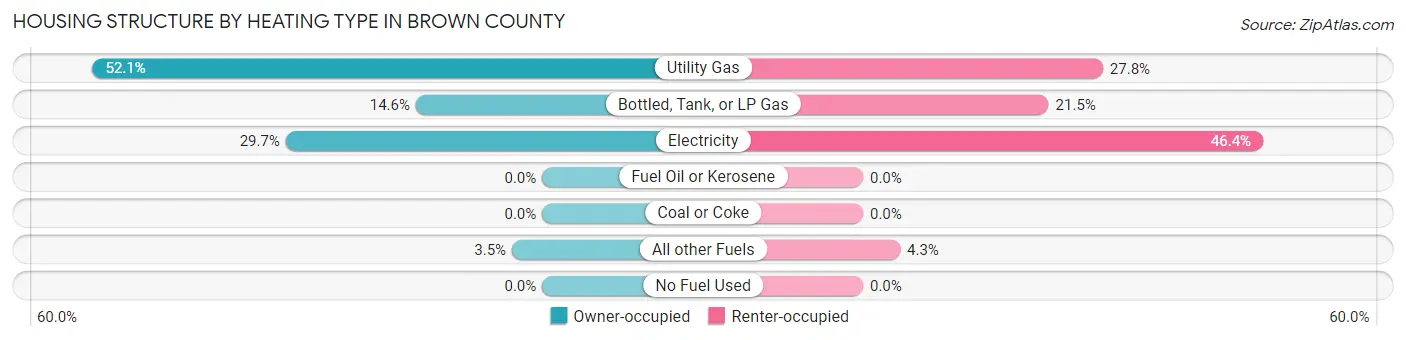
| Heating Type | Owner-occupied | Renter-occupied |
| Utility Gas | 477 (52.1%) | 84 (27.8%) |
| Bottled, Tank, or LP Gas | 134 (14.6%) | 65 (21.5%) |
| Electricity | 272 (29.7%) | 140 (46.4%) |
| Fuel Oil or Kerosene | 0 (0.0%) | 0 (0.0%) |
| Coal or Coke | 0 (0.0%) | 0 (0.0%) |
| All other Fuels | 32 (3.5%) | 13 (4.3%) |
| No Fuel Used | 0 (0.0%) | 0 (0.0%) |
| Total | 915 (100.0%) | 302 (100.0%) |
Household Vehicle Usage in Brown County
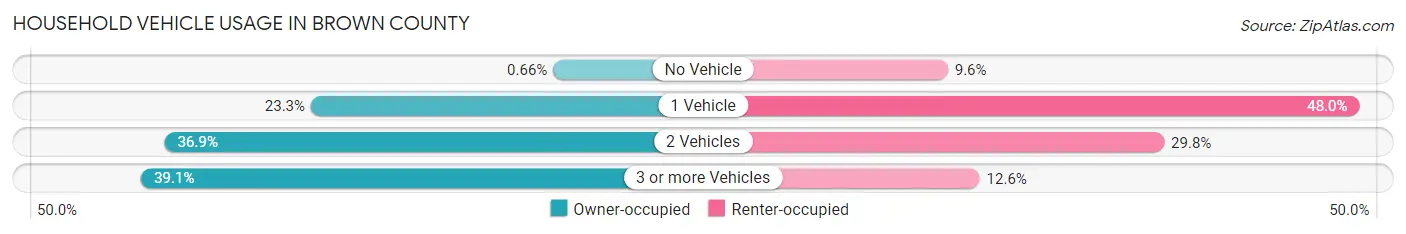
| Vehicles per Household | Owner-occupied | Renter-occupied |
| No Vehicle | 6 (0.7%) | 29 (9.6%) |
| 1 Vehicle | 213 (23.3%) | 145 (48.0%) |
| 2 Vehicles | 338 (36.9%) | 90 (29.8%) |
| 3 or more Vehicles | 358 (39.1%) | 38 (12.6%) |
| Total | 915 (100.0%) | 302 (100.0%) |
Real Estate & Mortgages in Brown County
Real Estate and Mortgage Overview in Brown County
| Characteristic | Without Mortgage | With Mortgage |
| Housing Units | 557 | 358 |
| Median Property Value | $82,800 | $103,400 |
| Median Household Income | $42,422 | $22 |
| Monthly Housing Costs | $487 | $4 |
| Real Estate Taxes | $1,036 | $17 |
Property Value by Mortgage Status in Brown County
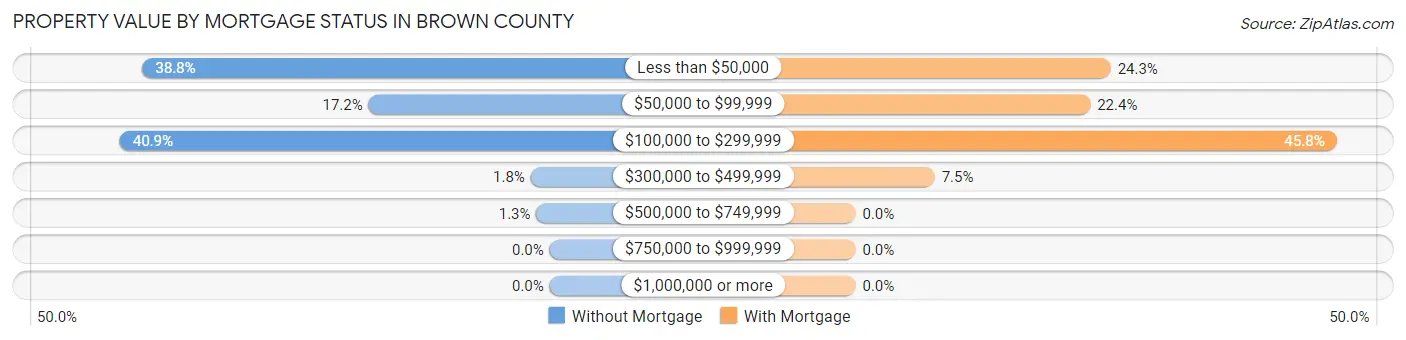
| Property Value | Without Mortgage | With Mortgage |
| Less than $50,000 | 216 (38.8%) | 87 (24.3%) |
| $50,000 to $99,999 | 96 (17.2%) | 80 (22.4%) |
| $100,000 to $299,999 | 228 (40.9%) | 164 (45.8%) |
| $300,000 to $499,999 | 10 (1.8%) | 27 (7.5%) |
| $500,000 to $749,999 | 7 (1.3%) | 0 (0.0%) |
| $750,000 to $999,999 | 0 (0.0%) | 0 (0.0%) |
| $1,000,000 or more | 0 (0.0%) | 0 (0.0%) |
| Total | 557 (100.0%) | 358 (100.0%) |
Household Income by Mortgage Status in Brown County
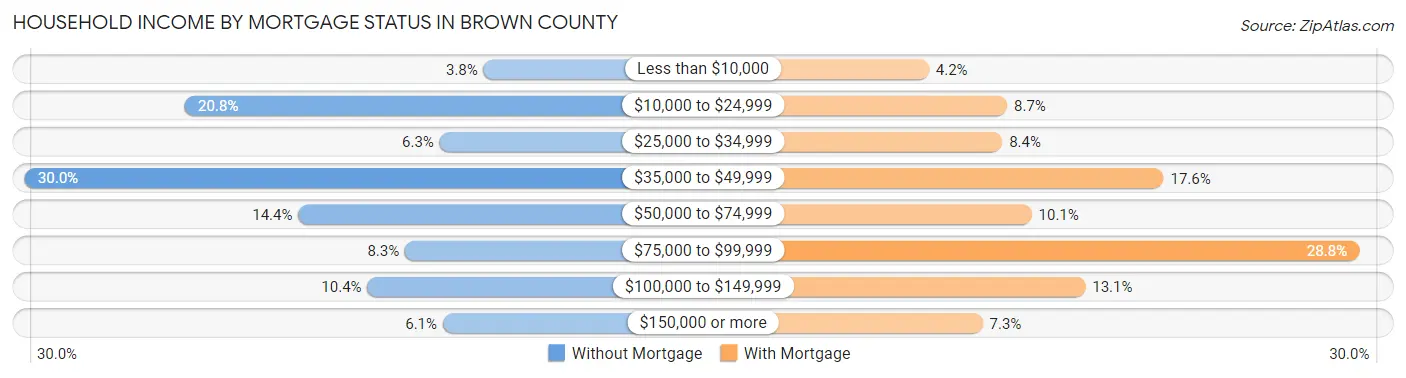
| Household Income | Without Mortgage | With Mortgage |
| Less than $10,000 | 21 (3.8%) | 15 (4.2%) |
| $10,000 to $24,999 | 116 (20.8%) | 31 (8.7%) |
| $25,000 to $34,999 | 35 (6.3%) | 30 (8.4%) |
| $35,000 to $49,999 | 167 (30.0%) | 63 (17.6%) |
| $50,000 to $74,999 | 80 (14.4%) | 36 (10.1%) |
| $75,000 to $99,999 | 46 (8.3%) | 103 (28.8%) |
| $100,000 to $149,999 | 58 (10.4%) | 47 (13.1%) |
| $150,000 or more | 34 (6.1%) | 26 (7.3%) |
| Total | 557 (100.0%) | 358 (100.0%) |
Property Value to Household Income Ratio in Brown County
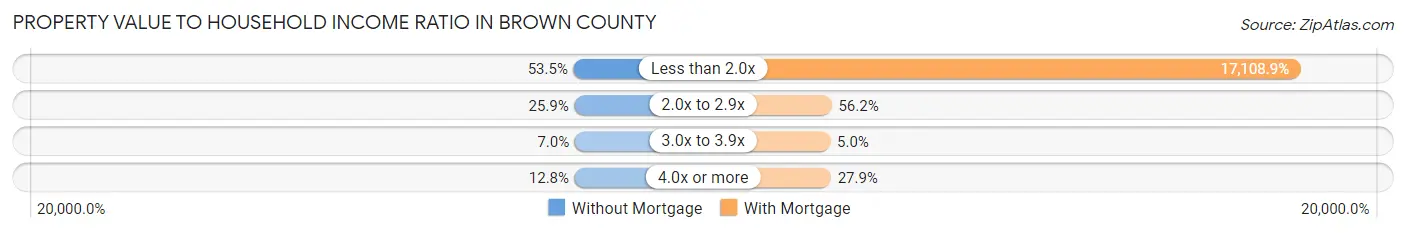
| Value-to-Income Ratio | Without Mortgage | With Mortgage |
| Less than 2.0x | 298 (53.5%) | 61,250 (17,108.9%) |
| 2.0x to 2.9x | 144 (25.9%) | 201 (56.1%) |
| 3.0x to 3.9x | 39 (7.0%) | 18 (5.0%) |
| 4.0x or more | 71 (12.8%) | 100 (27.9%) |
| Total | 557 (100.0%) | 358 (100.0%) |
Real Estate Taxes by Mortgage Status in Brown County
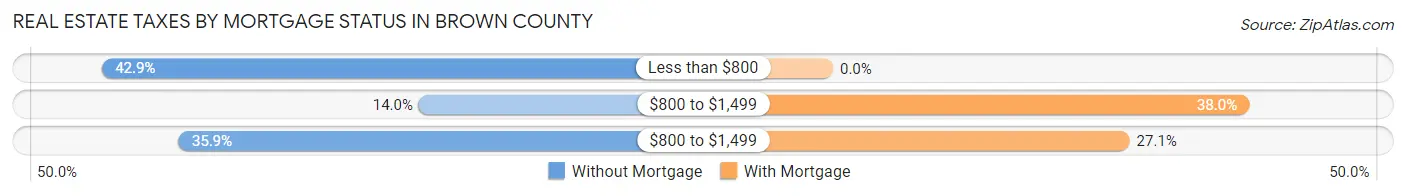
| Property Taxes | Without Mortgage | With Mortgage |
| Less than $800 | 239 (42.9%) | 0 (0.0%) |
| $800 to $1,499 | 78 (14.0%) | 136 (38.0%) |
| $800 to $1,499 | 200 (35.9%) | 97 (27.1%) |
| Total | 557 (100.0%) | 358 (100.0%) |
Health & Disability in Brown County
Health Insurance Coverage by Age in Brown County
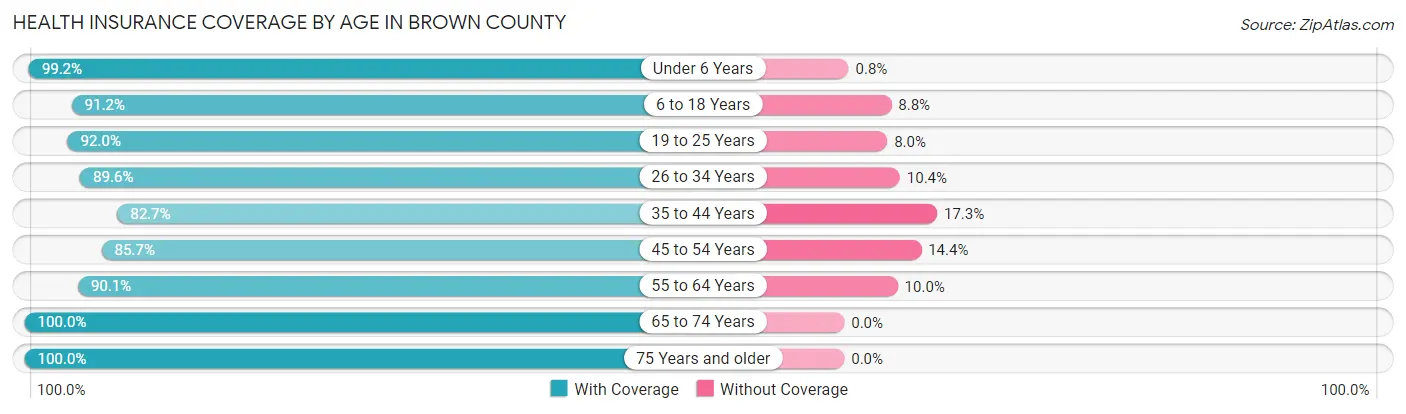
| Age Bracket | With Coverage | Without Coverage |
| Under 6 Years | 248 (99.2%) | 2 (0.8%) |
| 6 to 18 Years | 281 (91.2%) | 27 (8.8%) |
| 19 to 25 Years | 138 (92.0%) | 12 (8.0%) |
| 26 to 34 Years | 251 (89.6%) | 29 (10.4%) |
| 35 to 44 Years | 239 (82.7%) | 50 (17.3%) |
| 45 to 54 Years | 203 (85.7%) | 34 (14.3%) |
| 55 to 64 Years | 353 (90.0%) | 39 (10.0%) |
| 65 to 74 Years | 418 (100.0%) | 0 (0.0%) |
| 75 Years and older | 331 (100.0%) | 0 (0.0%) |
| Total | 2,462 (92.7%) | 193 (7.3%) |
Health Insurance Coverage by Citizenship Status in Brown County
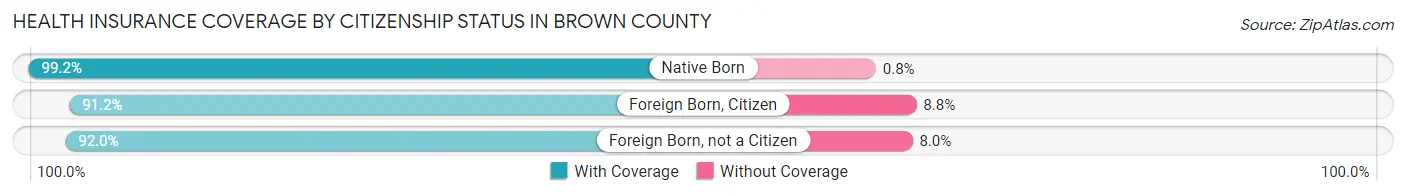
| Citizenship Status | With Coverage | Without Coverage |
| Native Born | 248 (99.2%) | 2 (0.8%) |
| Foreign Born, Citizen | 281 (91.2%) | 27 (8.8%) |
| Foreign Born, not a Citizen | 138 (92.0%) | 12 (8.0%) |
Health Insurance Coverage by Household Income in Brown County
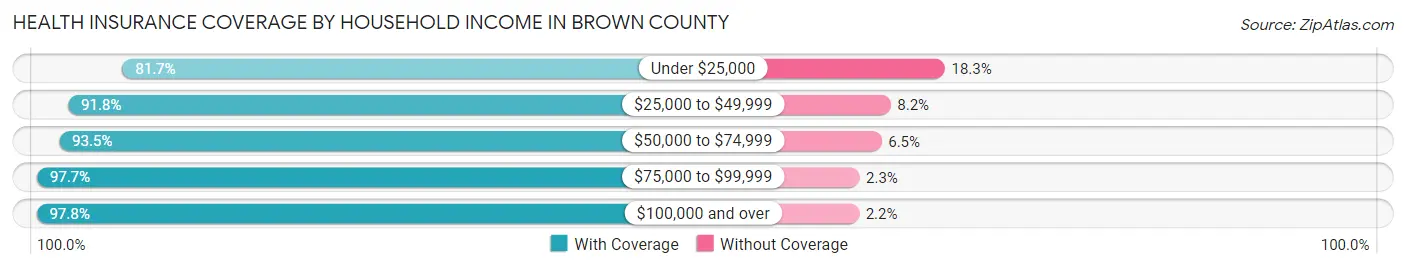
| Household Income | With Coverage | Without Coverage |
| Under $25,000 | 312 (81.7%) | 70 (18.3%) |
| $25,000 to $49,999 | 630 (91.8%) | 56 (8.2%) |
| $50,000 to $74,999 | 695 (93.5%) | 48 (6.5%) |
| $75,000 to $99,999 | 383 (97.7%) | 9 (2.3%) |
| $100,000 and over | 439 (97.8%) | 10 (2.2%) |
Public vs Private Health Insurance Coverage by Age in Brown County
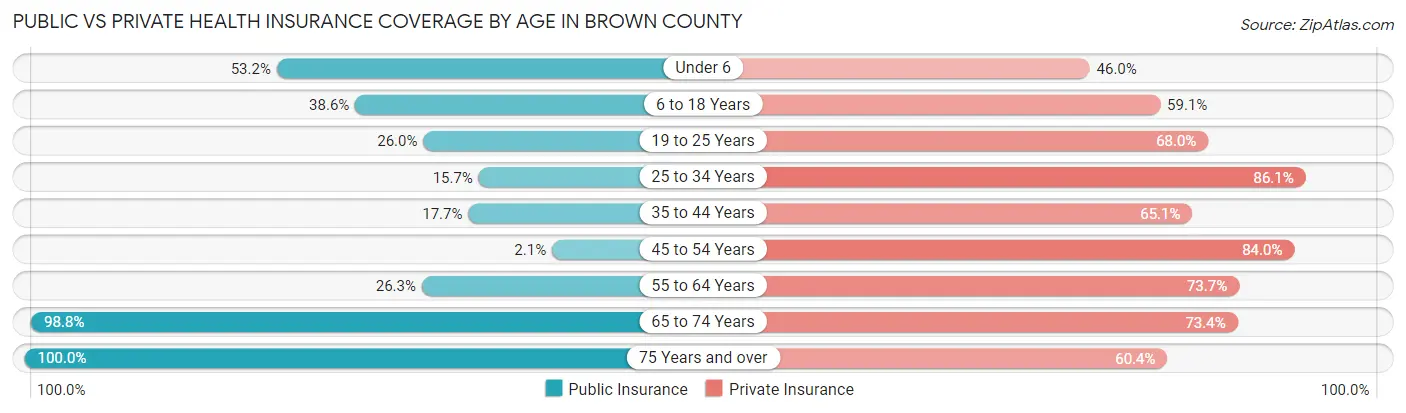
| Age Bracket | Public Insurance | Private Insurance |
| Under 6 | 133 (53.2%) | 115 (46.0%) |
| 6 to 18 Years | 119 (38.6%) | 182 (59.1%) |
| 19 to 25 Years | 39 (26.0%) | 102 (68.0%) |
| 25 to 34 Years | 44 (15.7%) | 241 (86.1%) |
| 35 to 44 Years | 51 (17.6%) | 188 (65.0%) |
| 45 to 54 Years | 5 (2.1%) | 199 (84.0%) |
| 55 to 64 Years | 103 (26.3%) | 289 (73.7%) |
| 65 to 74 Years | 413 (98.8%) | 307 (73.4%) |
| 75 Years and over | 331 (100.0%) | 200 (60.4%) |
| Total | 1,238 (46.6%) | 1,823 (68.7%) |
Disability Status by Sex by Age in Brown County
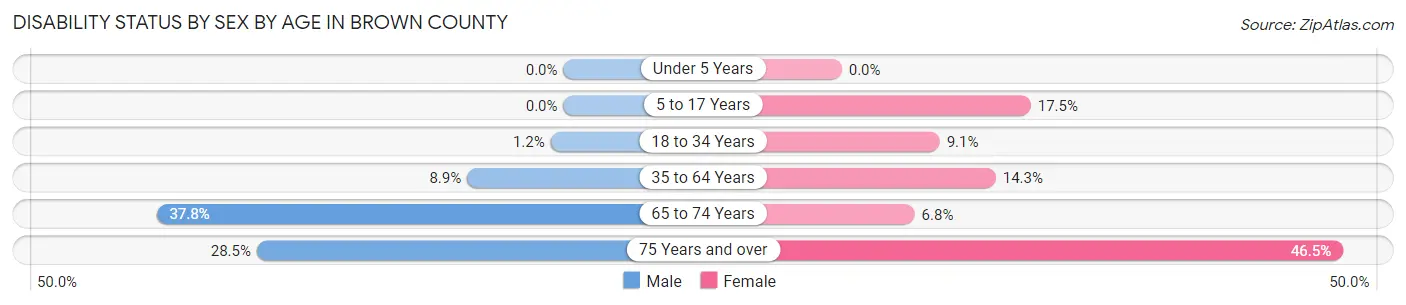
| Age Bracket | Male | Female |
| Under 5 Years | 0 (0.0%) | 0 (0.0%) |
| 5 to 17 Years | 0 (0.0%) | 20 (17.5%) |
| 18 to 34 Years | 3 (1.2%) | 20 (9.1%) |
| 35 to 64 Years | 42 (8.9%) | 64 (14.3%) |
| 65 to 74 Years | 74 (37.8%) | 15 (6.8%) |
| 75 Years and over | 33 (28.4%) | 100 (46.5%) |
Disability Class by Sex by Age in Brown County
Disability Class: Hearing Difficulty
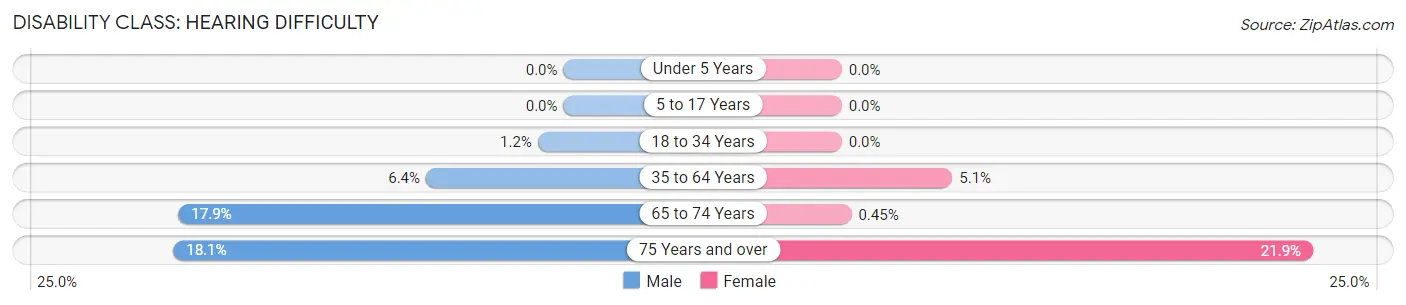
| Age Bracket | Male | Female |
| Under 5 Years | 0 (0.0%) | 0 (0.0%) |
| 5 to 17 Years | 0 (0.0%) | 0 (0.0%) |
| 18 to 34 Years | 3 (1.2%) | 0 (0.0%) |
| 35 to 64 Years | 30 (6.4%) | 23 (5.1%) |
| 65 to 74 Years | 35 (17.9%) | 1 (0.4%) |
| 75 Years and over | 21 (18.1%) | 47 (21.9%) |
Disability Class: Vision Difficulty
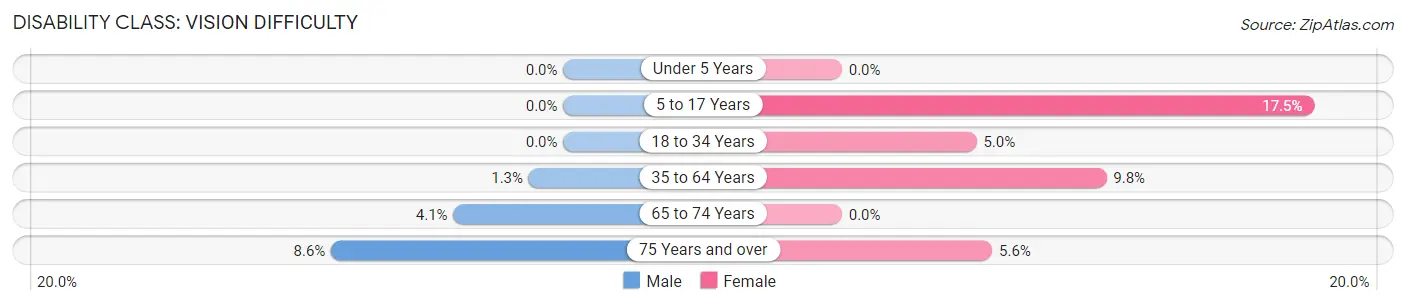
| Age Bracket | Male | Female |
| Under 5 Years | 0 (0.0%) | 0 (0.0%) |
| 5 to 17 Years | 0 (0.0%) | 20 (17.5%) |
| 18 to 34 Years | 0 (0.0%) | 11 (5.0%) |
| 35 to 64 Years | 6 (1.3%) | 44 (9.8%) |
| 65 to 74 Years | 8 (4.1%) | 0 (0.0%) |
| 75 Years and over | 10 (8.6%) | 12 (5.6%) |
Disability Class: Cognitive Difficulty
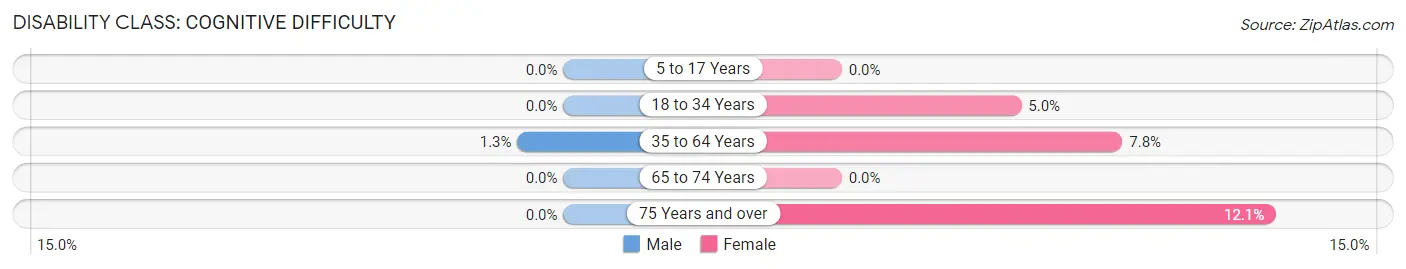
| Age Bracket | Male | Female |
| 5 to 17 Years | 0 (0.0%) | 0 (0.0%) |
| 18 to 34 Years | 0 (0.0%) | 11 (5.0%) |
| 35 to 64 Years | 6 (1.3%) | 35 (7.8%) |
| 65 to 74 Years | 0 (0.0%) | 0 (0.0%) |
| 75 Years and over | 0 (0.0%) | 26 (12.1%) |
Disability Class: Ambulatory Difficulty
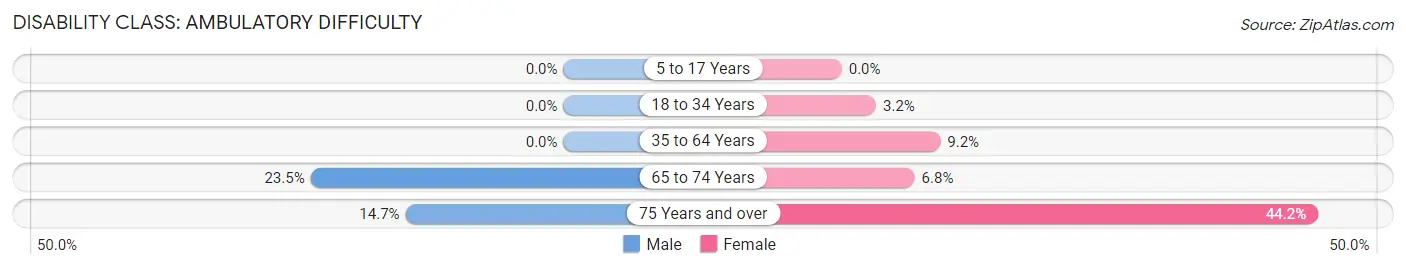
| Age Bracket | Male | Female |
| 5 to 17 Years | 0 (0.0%) | 0 (0.0%) |
| 18 to 34 Years | 0 (0.0%) | 7 (3.2%) |
| 35 to 64 Years | 0 (0.0%) | 41 (9.1%) |
| 65 to 74 Years | 46 (23.5%) | 15 (6.8%) |
| 75 Years and over | 17 (14.7%) | 95 (44.2%) |
Disability Class: Self-Care Difficulty
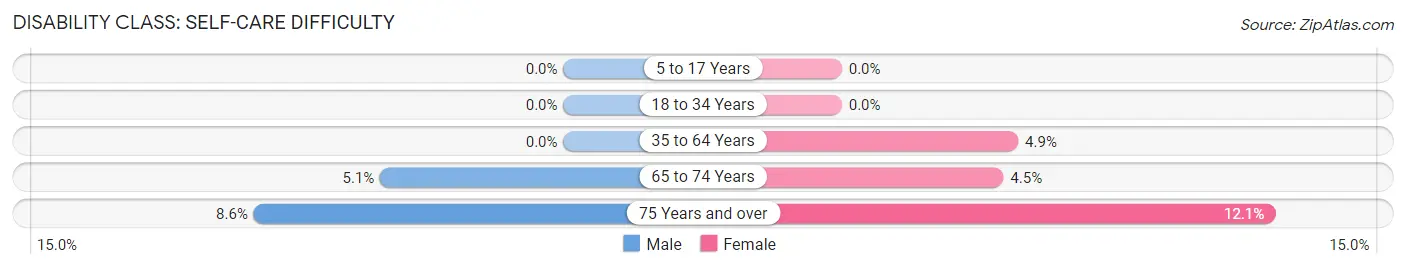
| Age Bracket | Male | Female |
| 5 to 17 Years | 0 (0.0%) | 0 (0.0%) |
| 18 to 34 Years | 0 (0.0%) | 0 (0.0%) |
| 35 to 64 Years | 0 (0.0%) | 22 (4.9%) |
| 65 to 74 Years | 10 (5.1%) | 10 (4.5%) |
| 75 Years and over | 10 (8.6%) | 26 (12.1%) |
Technology Access in Brown County
Computing Device Access in Brown County
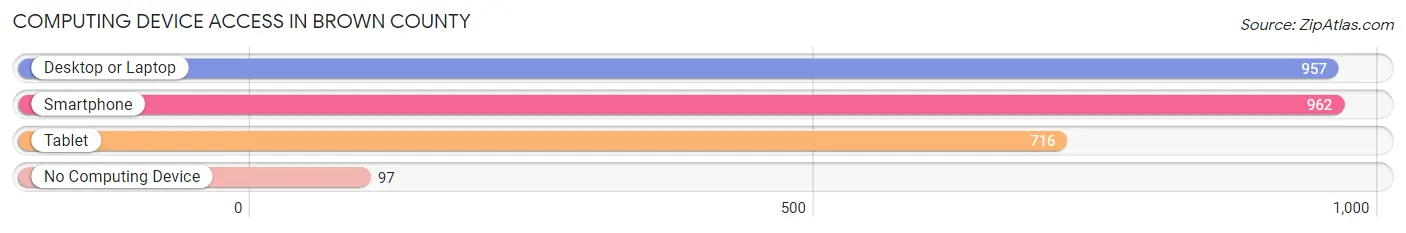
| Device Type | # Households | % Households |
| Desktop or Laptop | 957 | 78.6% |
| Smartphone | 962 | 79.0% |
| Tablet | 716 | 58.8% |
| No Computing Device | 97 | 8.0% |
| Total | 1,217 | 100.0% |
Internet Access in Brown County
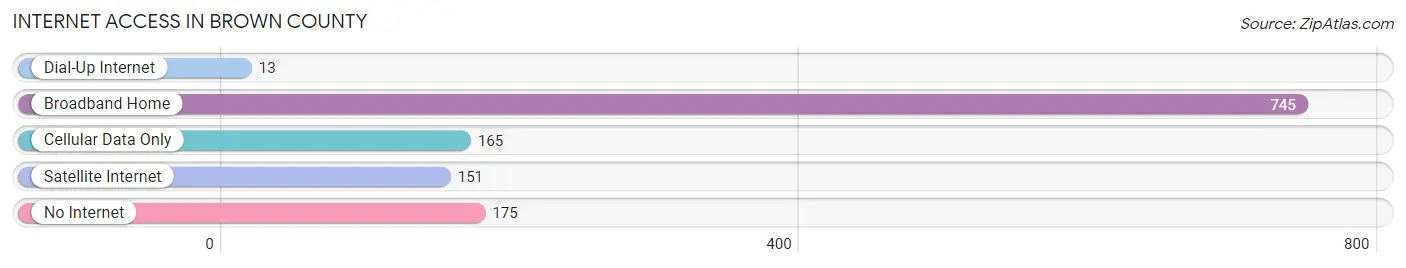
| Internet Type | # Households | % Households |
| Dial-Up Internet | 13 | 1.1% |
| Broadband Home | 745 | 61.2% |
| Cellular Data Only | 165 | 13.6% |
| Satellite Internet | 151 | 12.4% |
| No Internet | 175 | 14.4% |
| Total | 1,217 | 100.0% |
Brown County Summary
Brown County is located in the south-central region of Nebraska, and is bordered by Rock County to the north, Keya Paha County to the east, Cherry County to the south, and Holt County to the west. The county seat is Ainsworth, and the county has a total area of 1,072 square miles, of which 1,068 square miles is land and 4 square miles is water.
History
Brown County was established in 1883 and named after Albert Gallatin Brown, a Mississippi politician and Confederate soldier. The county was originally part of the Dakota Territory, and was later part of the Nebraska Territory. The first settlers arrived in the area in the late 1870s, and the county was officially organized in 1883.
The county was primarily used for ranching and farming, and the first railroad line was built in 1887. The county was also home to several Native American tribes, including the Omaha, Ponca, and Pawnee.
Geography
Brown County is located in the south-central region of Nebraska, and is bordered by Rock County to the north, Keya Paha County to the east, Cherry County to the south, and Holt County to the west. The county has a total area of 1,072 square miles, of which 1,068 square miles is land and 4 square miles is water.
The county is mostly flat, with some rolling hills in the western part of the county. The Niobrara River runs through the county, and there are several small lakes and ponds scattered throughout the area. The county is also home to several state parks, including Fort Niobrara National Wildlife Refuge, Smith Falls State Park, and Niobrara State Park.
Economy
The economy of Brown County is largely based on agriculture, with the majority of the county’s land being used for farming and ranching. The county is also home to several manufacturing and service industries, including food processing, metal fabrication, and health care.
The county’s largest employer is the Ainsworth Community Hospital, which employs over 500 people. Other major employers in the county include the Ainsworth Public Schools, the Ainsworth Community College, and the Brown County Sheriff’s Office.
Demographics
As of the 2010 census, the population of Brown County was 3,811, with a population density of 3.6 people per square mile. The median age in the county was 44.7 years, and the median household income was $41,945.
The racial makeup of the county was 95.2% White, 0.3% African American, 0.7% Native American, 0.2% Asian, 0.1% Pacific Islander, 2.2% from other races, and 1.4% from two or more races. Hispanic or Latino of any race were 4.2% of the population.
The largest ancestry groups in the county were German (37.2%), Irish (17.2%), English (14.2%), and Czech (7.2%). The majority of the population (90.2%) spoke English as their primary language, while 4.2% spoke Spanish and 0.7% spoke German.
Common Questions
What is Per Capita Income in Brown County?
Per Capita income in Brown County is $31,772.
What is the Median Family Income in Brown County?
Median Family Income in Brown County is $61,310.
What is the Median Household income in Brown County?
Median Household Income in Brown County is $44,267.
What is Income or Wage Gap in Brown County?
Income or Wage Gap in Brown County is 22.7%.
Women in Brown County earn 77.3 cents for every dollar earned by a man.
What is Family Income Deficit in Brown County?
Family Income Deficit in Brown County is $10,466.
Families that are below poverty line in Brown County earn $10,466 less on average than the poverty threshold level.
What is Inequality or Gini Index in Brown County?
Inequality or Gini Index in Brown County is 0.48.
What is the Total Population of Brown County?
Total Population of Brown County is 2,691.
What is the Total Male Population of Brown County?
Total Male Population of Brown County is 1,324.
What is the Total Female Population of Brown County?
Total Female Population of Brown County is 1,367.
What is the Ratio of Males per 100 Females in Brown County?
There are 96.85 Males per 100 Females in Brown County.
What is the Ratio of Females per 100 Males in Brown County?
There are 103.25 Females per 100 Males in Brown County.
What is the Median Population Age in Brown County?
Median Population Age in Brown County is 46.9 Years.
What is the Average Family Size in Brown County
Average Family Size in Brown County is 3.0 People.
What is the Average Household Size in Brown County
Average Household Size in Brown County is 2.2 People.
How Large is the Labor Force in Brown County?
There are 1,292 People in the Labor Forcein in Brown County.
What is the Percentage of People in the Labor Force in Brown County?
57.6% of People are in the Labor Force in Brown County.
What is the Unemployment Rate in Brown County?
Unemployment Rate in Brown County is 0.5%.