Boyd County, NE Map & Demographics
Boyd County Map
Boyd County Overview
$35,198
PER CAPITA INCOME
$82,292
AVG FAMILY INCOME
$57,120
AVG HOUSEHOLD INCOME
50.4%
WAGE / INCOME GAP [ % ]
49.6¢/ $1
WAGE / INCOME GAP [ $ ]
0.42
INEQUALITY / GINI INDEX
1,767
TOTAL POPULATION
918
MALE POPULATION
849
FEMALE POPULATION
108.13
MALES / 100 FEMALES
92.48
FEMALES / 100 MALES
55.6
MEDIAN AGE
2.7
AVG FAMILY SIZE
2.1
AVG HOUSEHOLD SIZE
876
LABOR FORCE [ PEOPLE ]
59.9%
PERCENT IN LABOR FORCE
1.8%
UNEMPLOYMENT RATE
Boyd County Area Codes
Income in Boyd County
Income Overview in Boyd County
Per Capita Income in Boyd County is $35,198, while median incomes of families and households are $82,292 and $57,120 respectively.
| Characteristic | Number | Measure |
| Per Capita Income | 1,767 | $35,198 |
| Median Family Income | 520 | $82,292 |
| Mean Family Income | 520 | $91,308 |
| Median Household Income | 807 | $57,120 |
| Mean Household Income | 807 | $75,221 |
| Income Deficit | 520 | $0 |
| Wage / Income Gap (%) | 1,767 | 50.40% |
| Wage / Income Gap ($) | 1,767 | 49.60¢ per $1 |
| Gini / Inequality Index | 1,767 | 0.42 |
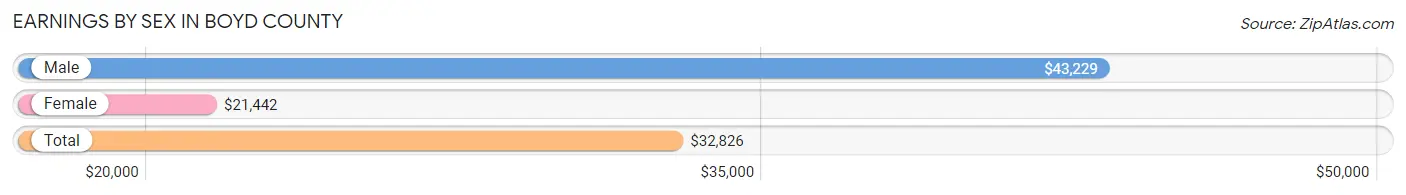
Earnings by Sex in Boyd County
Average Earnings in Boyd County are $32,826, $43,229 for men and $21,442 for women, a difference of 50.4%.
| Sex | Number | Average Earnings |
| Male | 595 (58.6%) | $43,229 |
| Female | 421 (41.4%) | $21,442 |
| Total | 1,016 (100.0%) | $32,826 |
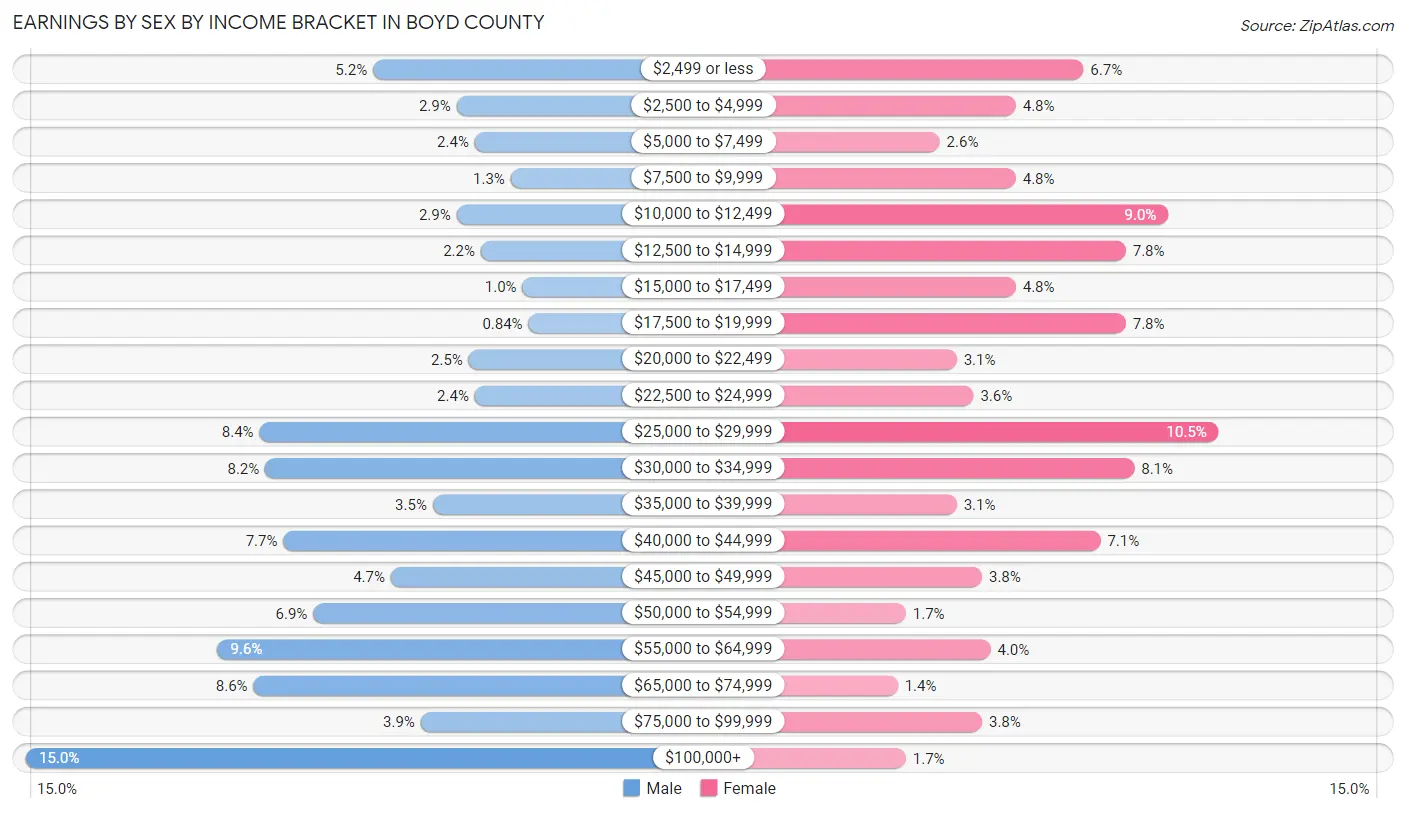
Earnings by Sex by Income Bracket in Boyd County
The most common earnings brackets in Boyd County are $100,000+ for men (89 | 15.0%) and $25,000 to $29,999 for women (44 | 10.4%).
| Income | Male | Female |
| $2,499 or less | 31 (5.2%) | 28 (6.7%) |
| $2,500 to $4,999 | 17 (2.9%) | 20 (4.8%) |
| $5,000 to $7,499 | 14 (2.4%) | 11 (2.6%) |
| $7,500 to $9,999 | 8 (1.3%) | 20 (4.8%) |
| $10,000 to $12,499 | 17 (2.9%) | 38 (9.0%) |
| $12,500 to $14,999 | 13 (2.2%) | 33 (7.8%) |
| $15,000 to $17,499 | 6 (1.0%) | 20 (4.8%) |
| $17,500 to $19,999 | 5 (0.8%) | 33 (7.8%) |
| $20,000 to $22,499 | 15 (2.5%) | 13 (3.1%) |
| $22,500 to $24,999 | 14 (2.4%) | 15 (3.6%) |
| $25,000 to $29,999 | 50 (8.4%) | 44 (10.4%) |
| $30,000 to $34,999 | 49 (8.2%) | 34 (8.1%) |
| $35,000 to $39,999 | 21 (3.5%) | 13 (3.1%) |
| $40,000 to $44,999 | 46 (7.7%) | 30 (7.1%) |
| $45,000 to $49,999 | 28 (4.7%) | 16 (3.8%) |
| $50,000 to $54,999 | 41 (6.9%) | 7 (1.7%) |
| $55,000 to $64,999 | 57 (9.6%) | 17 (4.0%) |
| $65,000 to $74,999 | 51 (8.6%) | 6 (1.4%) |
| $75,000 to $99,999 | 23 (3.9%) | 16 (3.8%) |
| $100,000+ | 89 (15.0%) | 7 (1.7%) |
| Total | 595 (100.0%) | 421 (100.0%) |
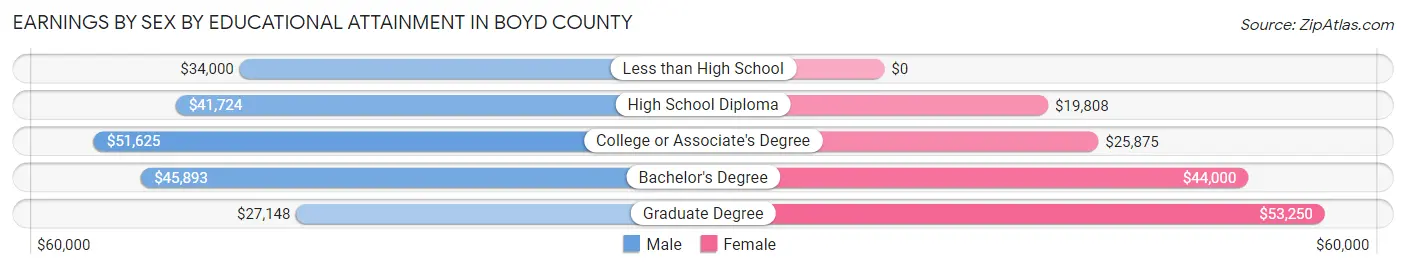
Earnings by Sex by Educational Attainment in Boyd County
Average earnings in Boyd County are $42,604 for men and $25,341 for women, a difference of 40.5%. Men with an educational attainment of college or associate's degree enjoy the highest average annual earnings of $51,625, while those with graduate degree education earn the least with $27,148. Women with an educational attainment of graduate degree earn the most with the average annual earnings of $53,250, while those with high school diploma education have the smallest earnings of $19,808.
| Educational Attainment | Male Income | Female Income |
| Less than High School | $34,000 | $0 |
| High School Diploma | $41,724 | $19,808 |
| College or Associate's Degree | $51,625 | $25,875 |
| Bachelor's Degree | $45,893 | $44,000 |
| Graduate Degree | $27,148 | $53,250 |
| Total | $42,604 | $25,341 |
Family Income in Boyd County
Family Income Brackets in Boyd County
According to the Boyd County family income data, there are 115 families falling into the $100,000 to $149,999 income range, which is the most common income bracket and makes up 22.1% of all families. Conversely, the less than $10,000 income bracket is the least frequent group with only 8 families (1.5%) belonging to this category.
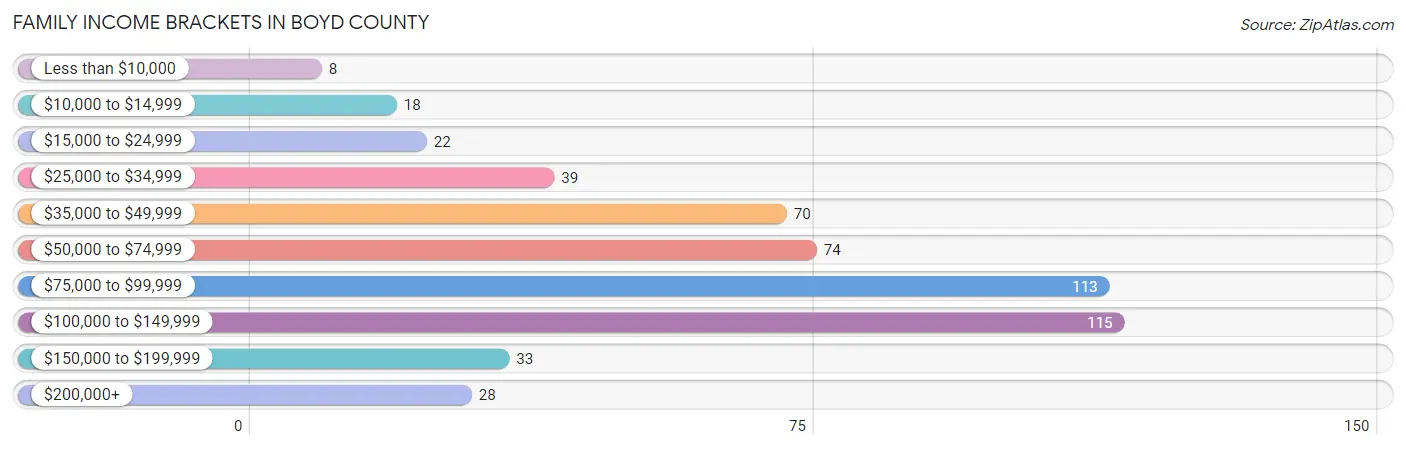
| Income Bracket | # Families | % Families |
| Less than $10,000 | 8 | 1.5% |
| $10,000 to $14,999 | 18 | 3.5% |
| $15,000 to $24,999 | 22 | 4.2% |
| $25,000 to $34,999 | 39 | 7.5% |
| $35,000 to $49,999 | 70 | 13.5% |
| $50,000 to $74,999 | 74 | 14.2% |
| $75,000 to $99,999 | 113 | 21.7% |
| $100,000 to $149,999 | 115 | 22.1% |
| $150,000 to $199,999 | 33 | 6.3% |
| $200,000+ | 28 | 5.4% |
Family Income by Famaliy Size in Boyd County
5-person families (17 | 3.3%) account for the highest median family income in Boyd County with $97,917 per family, while 2-person families (374 | 71.9%) have the highest median income of $39,375 per family member.
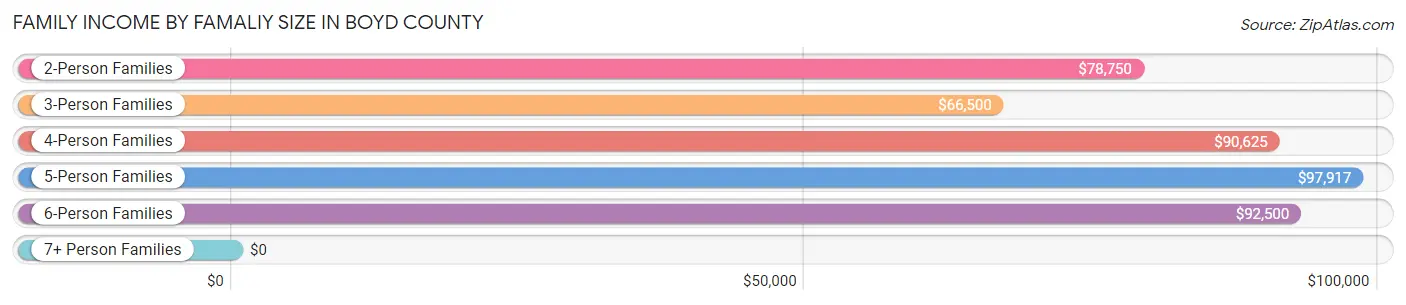
| Income Bracket | # Families | Median Income |
| 2-Person Families | 374 (71.9%) | $78,750 |
| 3-Person Families | 46 (8.8%) | $66,500 |
| 4-Person Families | 70 (13.5%) | $90,625 |
| 5-Person Families | 17 (3.3%) | $97,917 |
| 6-Person Families | 6 (1.1%) | $92,500 |
| 7+ Person Families | 7 (1.3%) | $0 |
| Total | 520 (100.0%) | $82,292 |
Family Income by Number of Earners in Boyd County
The median family income in Boyd County is $82,292, with families comprising 2 earners (252) having the highest median family income of $91,944, while families with no earners (79) have the lowest median family income of $31,750, accounting for 48.5% and 15.2% of families, respectively.
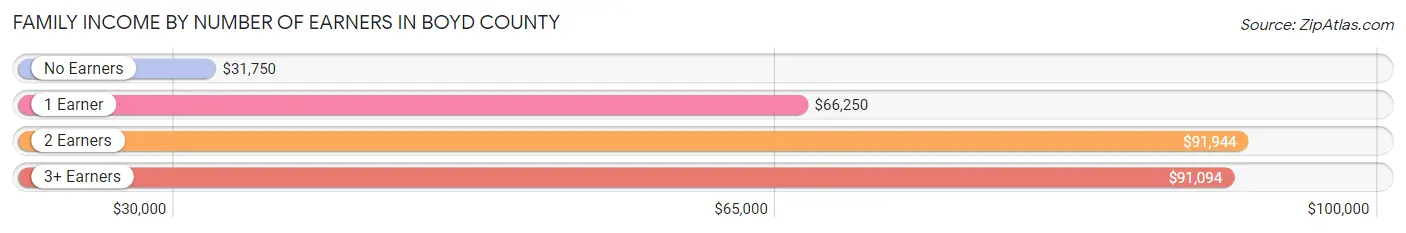
| Number of Earners | # Families | Median Income |
| No Earners | 79 (15.2%) | $31,750 |
| 1 Earner | 148 (28.5%) | $66,250 |
| 2 Earners | 252 (48.5%) | $91,944 |
| 3+ Earners | 41 (7.9%) | $91,094 |
| Total | 520 (100.0%) | $82,292 |
Household Income in Boyd County
Household Income Brackets in Boyd County
With 132 households falling in the category, the $100,000 to $149,999 income range is the most frequent in Boyd County, accounting for 16.4% of all households. In contrast, only 28 households (3.5%) fall into the $200,000+ income bracket, making it the least populous group.
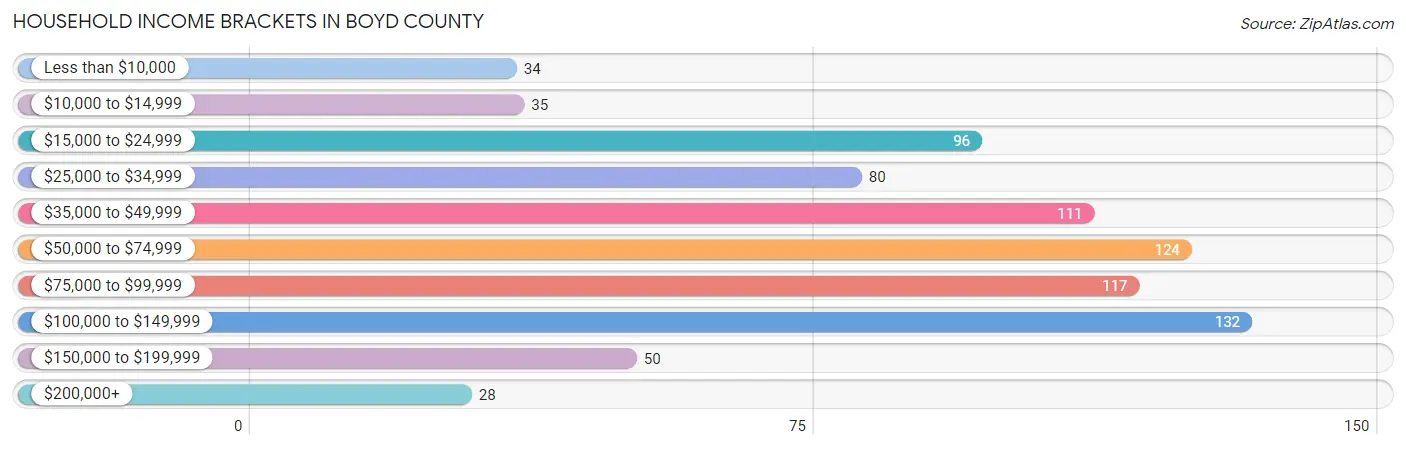
| Income Bracket | # Households | % Households |
| Less than $10,000 | 34 | 4.2% |
| $10,000 to $14,999 | 35 | 4.3% |
| $15,000 to $24,999 | 96 | 11.9% |
| $25,000 to $34,999 | 80 | 9.9% |
| $35,000 to $49,999 | 111 | 13.8% |
| $50,000 to $74,999 | 124 | 15.4% |
| $75,000 to $99,999 | 117 | 14.5% |
| $100,000 to $149,999 | 132 | 16.4% |
| $150,000 to $199,999 | 50 | 6.2% |
| $200,000+ | 28 | 3.5% |
Household Income by Householder Age in Boyd County
The median household income in Boyd County is $57,120, with the highest median household income of $80,250 found in the 45 to 64 years age bracket for the primary householder. A total of 244 households (30.2%) fall into this category. Meanwhile, the 65+ years age bracket for the primary householder has the lowest median household income of $41,184, with 360 households (44.6%) in this group.
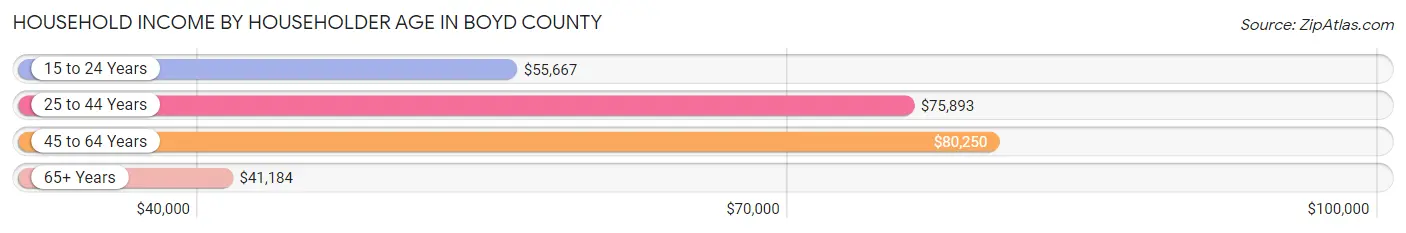
| Income Bracket | # Households | Median Income |
| 15 to 24 Years | 44 (5.4%) | $55,667 |
| 25 to 44 Years | 159 (19.7%) | $75,893 |
| 45 to 64 Years | 244 (30.2%) | $80,250 |
| 65+ Years | 360 (44.6%) | $41,184 |
| Total | 807 (100.0%) | $57,120 |
Poverty in Boyd County
Income Below Poverty by Sex and Age in Boyd County
With 7.1% poverty level for males and 16.5% for females among the residents of Boyd County, under 5 year old males and 16 and 17 year old females are the most vulnerable to poverty, with 17 males (50.0%) and 11 females (84.6%) in their respective age groups living below the poverty level.
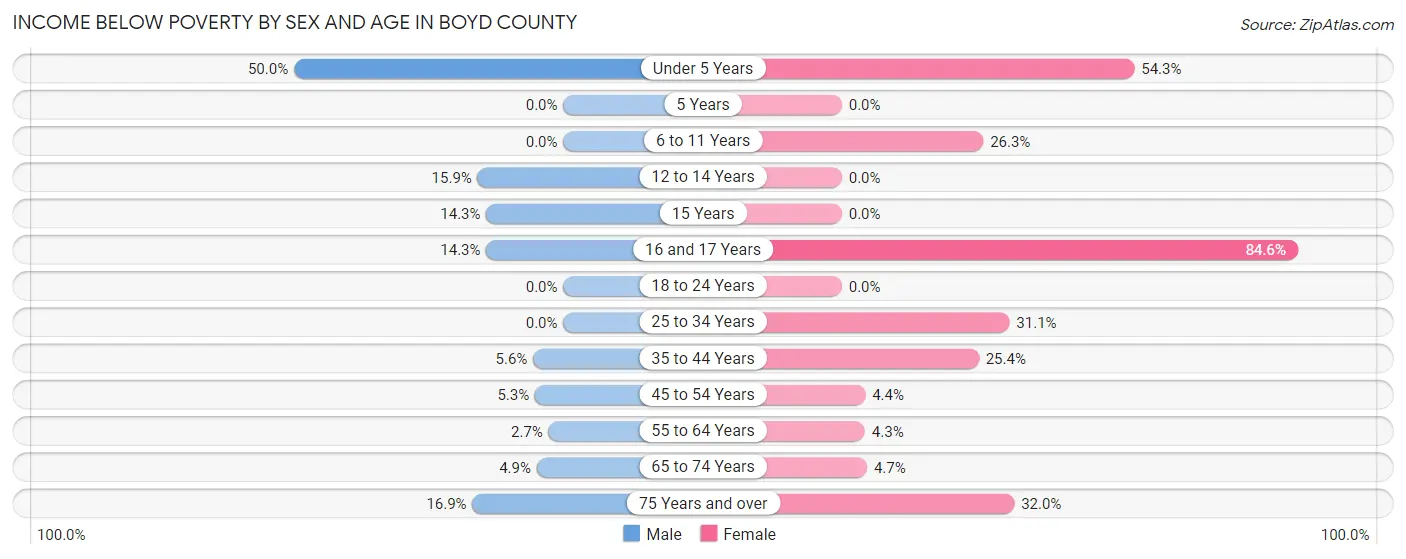
| Age Bracket | Male | Female |
| Under 5 Years | 17 (50.0%) | 19 (54.3%) |
| 5 Years | 0 (0.0%) | 0 (0.0%) |
| 6 to 11 Years | 0 (0.0%) | 21 (26.3%) |
| 12 to 14 Years | 7 (15.9%) | 0 (0.0%) |
| 15 Years | 1 (14.3%) | 0 (0.0%) |
| 16 and 17 Years | 1 (14.3%) | 11 (84.6%) |
| 18 to 24 Years | 0 (0.0%) | 0 (0.0%) |
| 25 to 34 Years | 0 (0.0%) | 14 (31.1%) |
| 35 to 44 Years | 7 (5.6%) | 15 (25.4%) |
| 45 to 54 Years | 4 (5.3%) | 3 (4.3%) |
| 55 to 64 Years | 4 (2.7%) | 7 (4.3%) |
| 65 to 74 Years | 10 (4.9%) | 7 (4.7%) |
| 75 Years and over | 14 (16.9%) | 40 (32.0%) |
| Total | 65 (7.1%) | 137 (16.5%) |
Income Above Poverty by Sex and Age in Boyd County
According to the poverty statistics in Boyd County, males aged 5 years and females aged 12 to 14 years are the age groups that are most secure financially, with 100.0% of males and 100.0% of females in these age groups living above the poverty line.
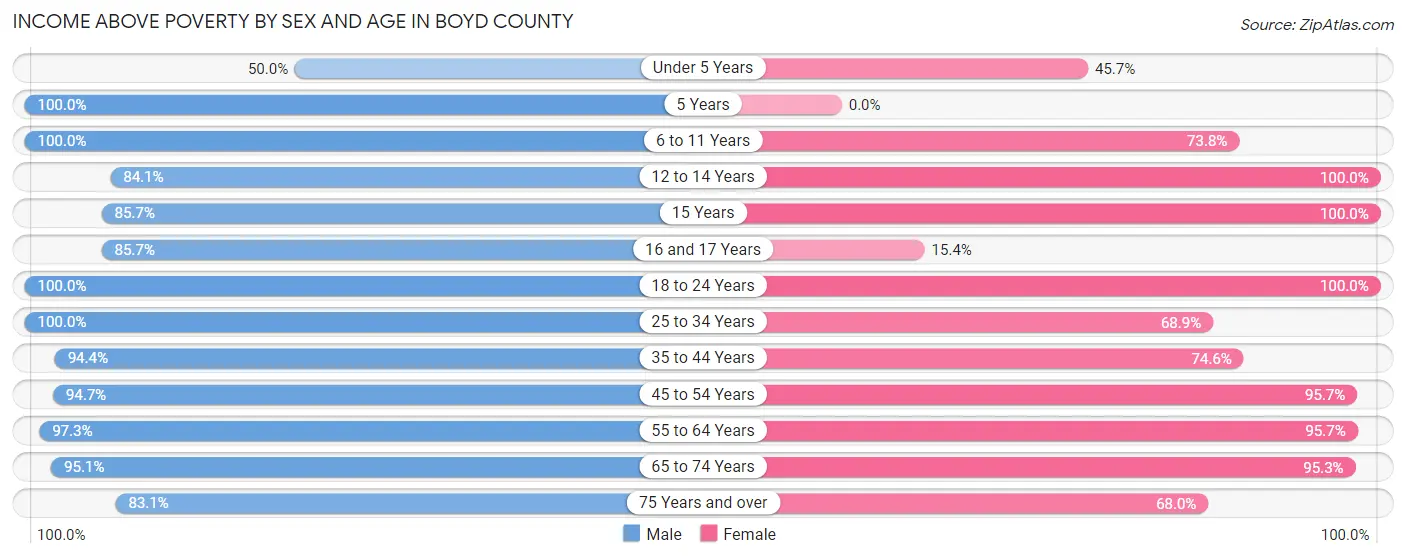
| Age Bracket | Male | Female |
| Under 5 Years | 17 (50.0%) | 16 (45.7%) |
| 5 Years | 15 (100.0%) | 0 (0.0%) |
| 6 to 11 Years | 54 (100.0%) | 59 (73.8%) |
| 12 to 14 Years | 37 (84.1%) | 28 (100.0%) |
| 15 Years | 6 (85.7%) | 7 (100.0%) |
| 16 and 17 Years | 6 (85.7%) | 2 (15.4%) |
| 18 to 24 Years | 44 (100.0%) | 56 (100.0%) |
| 25 to 34 Years | 70 (100.0%) | 31 (68.9%) |
| 35 to 44 Years | 118 (94.4%) | 44 (74.6%) |
| 45 to 54 Years | 72 (94.7%) | 66 (95.7%) |
| 55 to 64 Years | 143 (97.3%) | 156 (95.7%) |
| 65 to 74 Years | 193 (95.1%) | 143 (95.3%) |
| 75 Years and over | 69 (83.1%) | 85 (68.0%) |
| Total | 844 (92.8%) | 693 (83.5%) |
Income Below Poverty Among Married-Couple Families in Boyd County
The poverty statistics for married-couple families in Boyd County show that 3.3% or 15 of the total 458 families live below the poverty line. Families with no children have the highest poverty rate of 3.7%, comprising of 14 families. On the other hand, families with 3 or 4 children have the lowest poverty rate of 0.0%, which includes 0 families.
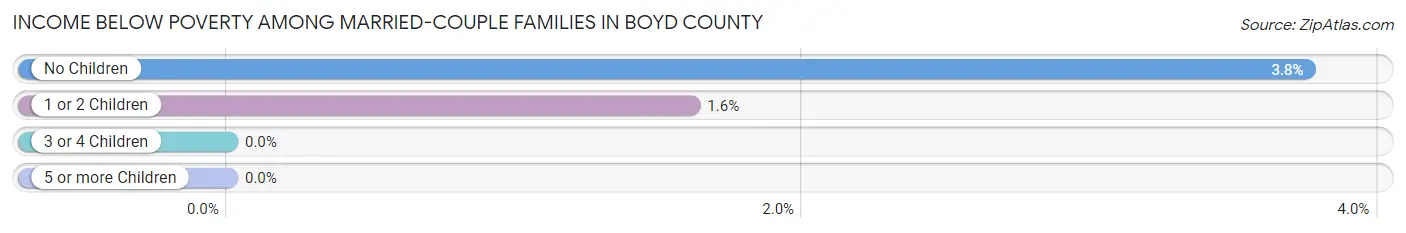
| Children | Above Poverty | Below Poverty |
| No Children | 359 (96.3%) | 14 (3.7%) |
| 1 or 2 Children | 61 (98.4%) | 1 (1.6%) |
| 3 or 4 Children | 23 (100.0%) | 0 (0.0%) |
| 5 or more Children | 0 (0.0%) | 0 (0.0%) |
| Total | 443 (96.7%) | 15 (3.3%) |
Income Below Poverty Among Single-Parent Households in Boyd County
According to the poverty data in Boyd County, 17.9% or 5 single-father households and 50.0% or 17 single-mother households are living below the poverty line. Among single-father households, those with 3 or 4 children have the highest poverty rate, with 5 households (50.0%) experiencing poverty. Likewise, among single-mother households, those with 3 or 4 children have the highest poverty rate, with 11 households (100.0%) falling below the poverty line.
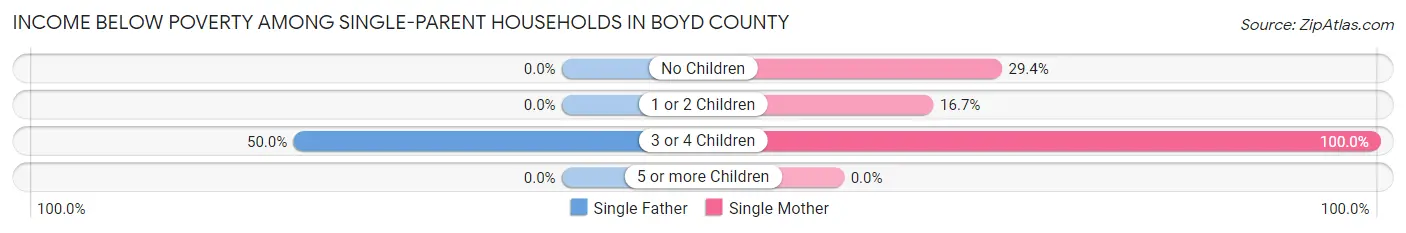
| Children | Single Father | Single Mother |
| No Children | 0 (0.0%) | 5 (29.4%) |
| 1 or 2 Children | 0 (0.0%) | 1 (16.7%) |
| 3 or 4 Children | 5 (50.0%) | 11 (100.0%) |
| 5 or more Children | 0 (0.0%) | 0 (0.0%) |
| Total | 5 (17.9%) | 17 (50.0%) |
Income Below Poverty Among Married-Couple vs Single-Parent Households in Boyd County
The poverty data for Boyd County shows that 15 of the married-couple family households (3.3%) and 22 of the single-parent households (35.5%) are living below the poverty level. Within the married-couple family households, those with no children have the highest poverty rate, with 14 households (3.7%) falling below the poverty line. Among the single-parent households, those with 3 or 4 children have the highest poverty rate, with 16 household (76.2%) living below poverty.
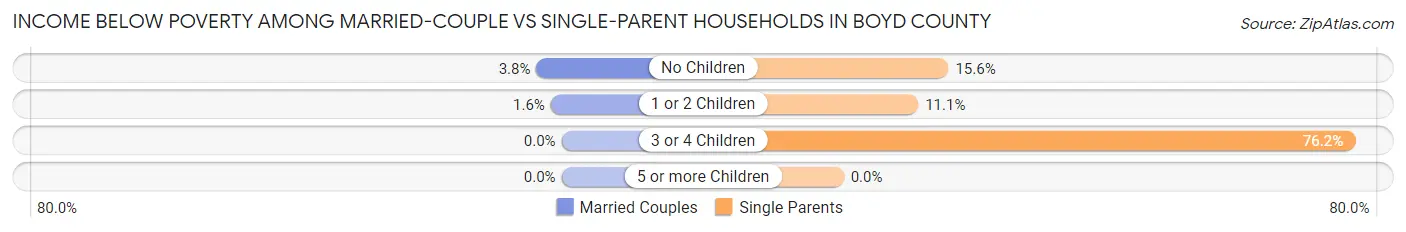
| Children | Married-Couple Families | Single-Parent Households |
| No Children | 14 (3.7%) | 5 (15.6%) |
| 1 or 2 Children | 1 (1.6%) | 1 (11.1%) |
| 3 or 4 Children | 0 (0.0%) | 16 (76.2%) |
| 5 or more Children | 0 (0.0%) | 0 (0.0%) |
| Total | 15 (3.3%) | 22 (35.5%) |
Race in Boyd County
The most populous races in Boyd County are White / Caucasian (1,637 | 92.6%), Hispanic or Latino (57 | 3.2%), and Native / Alaskan (51 | 2.9%).
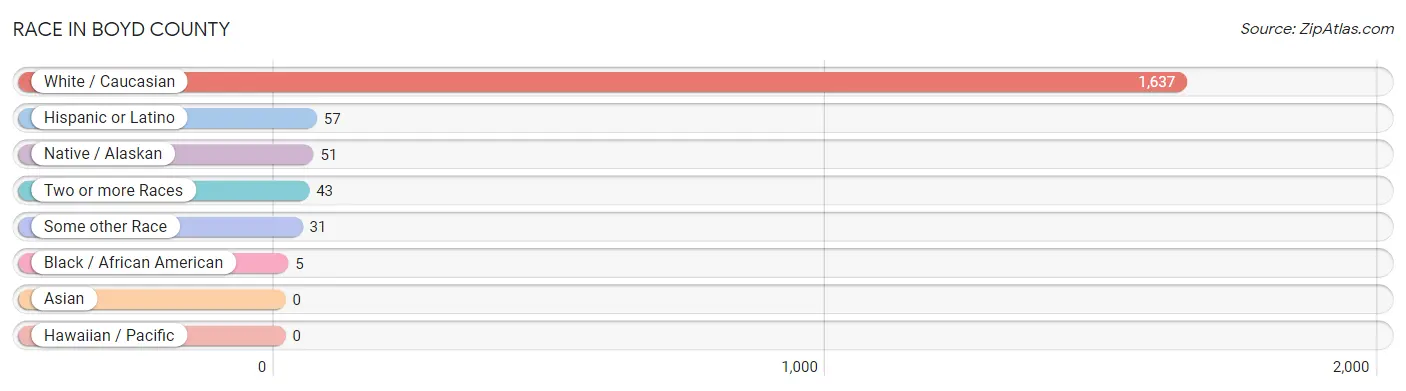
| Race | # Population | % Population |
| Asian | 0 | 0.0% |
| Black / African American | 5 | 0.3% |
| Hawaiian / Pacific | 0 | 0.0% |
| Hispanic or Latino | 57 | 3.2% |
| Native / Alaskan | 51 | 2.9% |
| White / Caucasian | 1,637 | 92.6% |
| Two or more Races | 43 | 2.4% |
| Some other Race | 31 | 1.8% |
| Total | 1,767 | 100.0% |
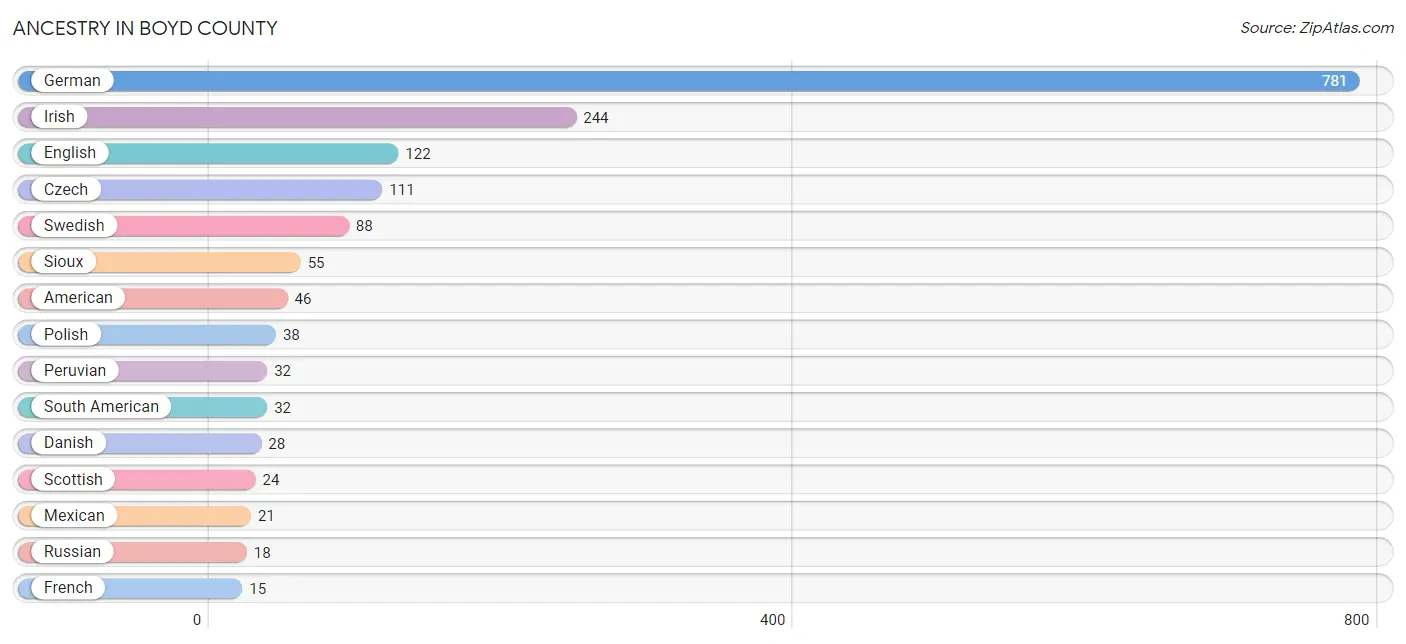
Ancestry in Boyd County
The most populous ancestries reported in Boyd County are German (781 | 44.2%), Irish (244 | 13.8%), English (122 | 6.9%), Czech (111 | 6.3%), and Swedish (88 | 5.0%), together accounting for 76.2% of all Boyd County residents.
| Ancestry | # Population | % Population |
| African | 4 | 0.2% |
| American | 46 | 2.6% |
| Arab | 5 | 0.3% |
| Austrian | 1 | 0.1% |
| Belgian | 1 | 0.1% |
| Bhutanese | 2 | 0.1% |
| British | 5 | 0.3% |
| Celtic | 2 | 0.1% |
| Croatian | 2 | 0.1% |
| Czech | 111 | 6.3% |
| Czechoslovakian | 5 | 0.3% |
| Danish | 28 | 1.6% |
| Dutch | 9 | 0.5% |
| English | 122 | 6.9% |
| European | 8 | 0.4% |
| Finnish | 2 | 0.1% |
| French | 15 | 0.9% |
| French American Indian | 1 | 0.1% |
| German | 781 | 44.2% |
| Irish | 244 | 13.8% |
| Italian | 4 | 0.2% |
| Mexican | 21 | 1.2% |
| Norwegian | 14 | 0.8% |
| Pennsylvania German | 2 | 0.1% |
| Peruvian | 32 | 1.8% |
| Polish | 38 | 2.1% |
| Puerto Rican | 1 | 0.1% |
| Russian | 18 | 1.0% |
| Scotch-Irish | 7 | 0.4% |
| Scottish | 24 | 1.4% |
| Serbian | 1 | 0.1% |
| Sioux | 55 | 3.1% |
| South American | 32 | 1.8% |
| South American Indian | 1 | 0.1% |
| Spaniard | 3 | 0.2% |
| Subsaharan African | 4 | 0.2% |
| Swedish | 88 | 5.0% |
| Swiss | 3 | 0.2% |
| Syrian | 5 | 0.3% |
| Ukrainian | 2 | 0.1% |
| Welsh | 5 | 0.3% | View All 41 Rows |
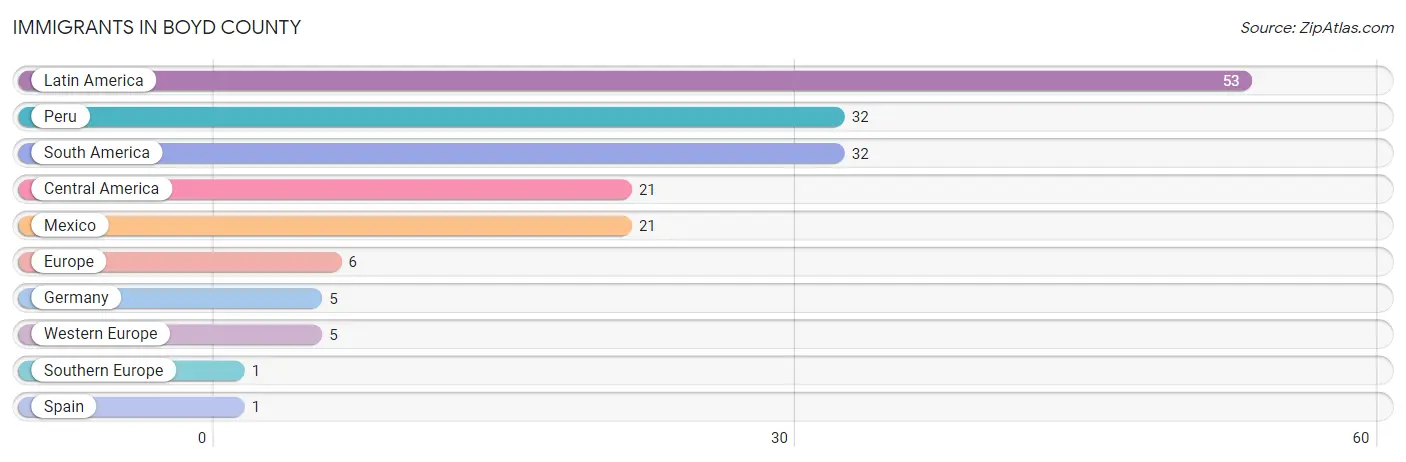
Immigrants in Boyd County
The most numerous immigrant groups reported in Boyd County came from Latin America (53 | 3.0%), Peru (32 | 1.8%), South America (32 | 1.8%), Central America (21 | 1.2%), and Mexico (21 | 1.2%), together accounting for 9.0% of all Boyd County residents.
| Immigration Origin | # Population | % Population |
| Central America | 21 | 1.2% |
| Europe | 6 | 0.3% |
| Germany | 5 | 0.3% |
| Latin America | 53 | 3.0% |
| Mexico | 21 | 1.2% |
| Peru | 32 | 1.8% |
| South America | 32 | 1.8% |
| Southern Europe | 1 | 0.1% |
| Spain | 1 | 0.1% |
| Western Europe | 5 | 0.3% | View All 10 Rows |
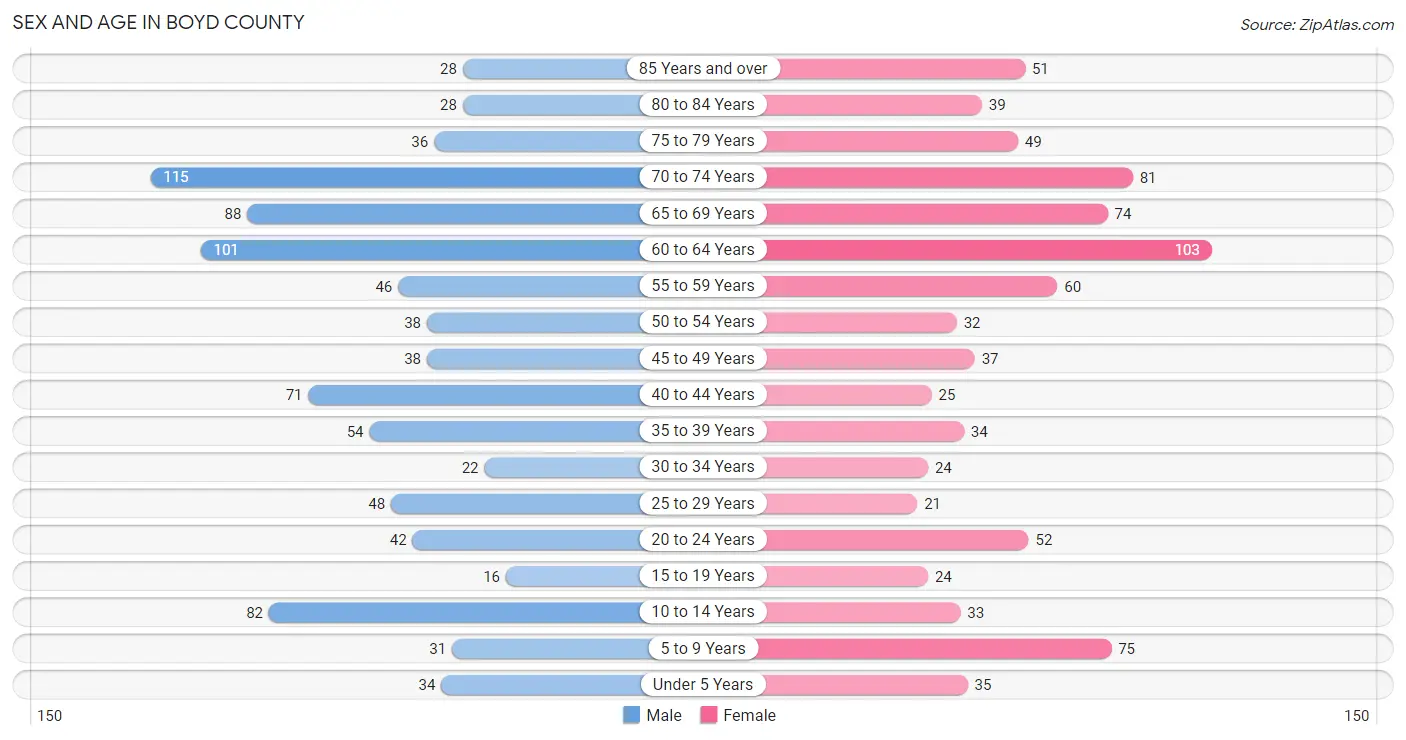
Sex and Age in Boyd County
Sex and Age in Boyd County
The most populous age groups in Boyd County are 70 to 74 Years (115 | 12.5%) for men and 60 to 64 Years (103 | 12.1%) for women.
| Age Bracket | Male | Female |
| Under 5 Years | 34 (3.7%) | 35 (4.1%) |
| 5 to 9 Years | 31 (3.4%) | 75 (8.8%) |
| 10 to 14 Years | 82 (8.9%) | 33 (3.9%) |
| 15 to 19 Years | 16 (1.7%) | 24 (2.8%) |
| 20 to 24 Years | 42 (4.6%) | 52 (6.1%) |
| 25 to 29 Years | 48 (5.2%) | 21 (2.5%) |
| 30 to 34 Years | 22 (2.4%) | 24 (2.8%) |
| 35 to 39 Years | 54 (5.9%) | 34 (4.0%) |
| 40 to 44 Years | 71 (7.7%) | 25 (2.9%) |
| 45 to 49 Years | 38 (4.1%) | 37 (4.4%) |
| 50 to 54 Years | 38 (4.1%) | 32 (3.8%) |
| 55 to 59 Years | 46 (5.0%) | 60 (7.1%) |
| 60 to 64 Years | 101 (11.0%) | 103 (12.1%) |
| 65 to 69 Years | 88 (9.6%) | 74 (8.7%) |
| 70 to 74 Years | 115 (12.5%) | 81 (9.5%) |
| 75 to 79 Years | 36 (3.9%) | 49 (5.8%) |
| 80 to 84 Years | 28 (3.0%) | 39 (4.6%) |
| 85 Years and over | 28 (3.0%) | 51 (6.0%) |
| Total | 918 (100.0%) | 849 (100.0%) |
Families and Households in Boyd County
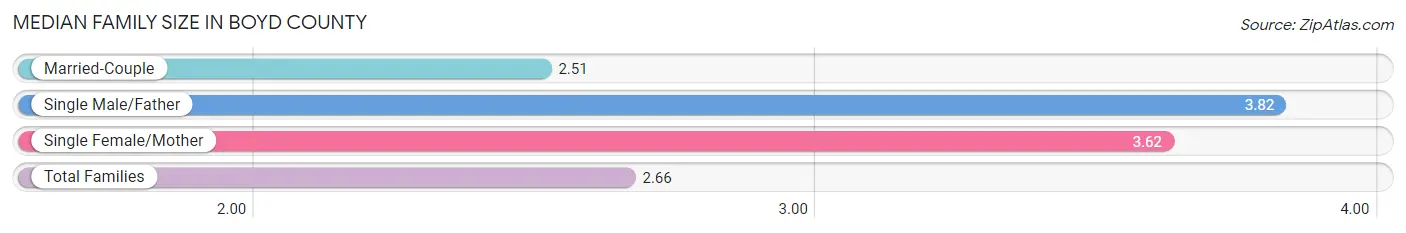
Median Family Size in Boyd County
The median family size in Boyd County is 2.66 persons per family, with single male/father families (28 | 5.4%) accounting for the largest median family size of 3.82 persons per family. On the other hand, married-couple families (458 | 88.1%) represent the smallest median family size with 2.51 persons per family.
| Family Type | # Families | Family Size |
| Married-Couple | 458 (88.1%) | 2.51 |
| Single Male/Father | 28 (5.4%) | 3.82 |
| Single Female/Mother | 34 (6.5%) | 3.62 |
| Total Families | 520 (100.0%) | 2.66 |
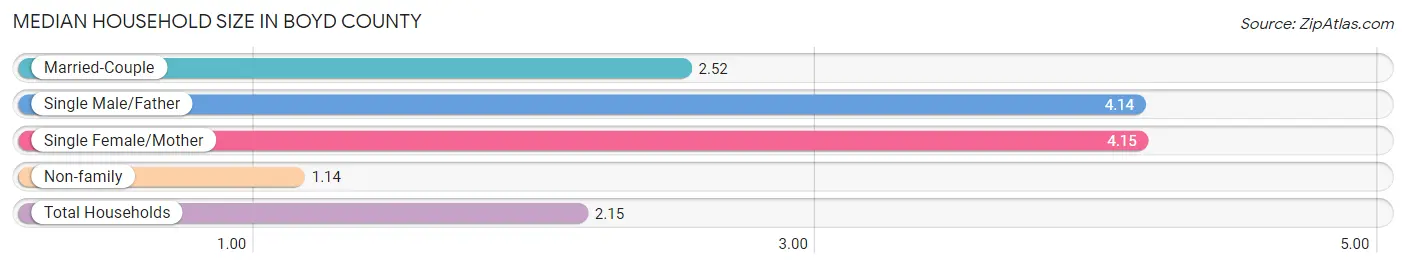
Median Household Size in Boyd County
The median household size in Boyd County is 2.15 persons per household, with single female/mother households (34 | 4.2%) accounting for the largest median household size of 4.15 persons per household. non-family households (287 | 35.6%) represent the smallest median household size with 1.14 persons per household.
| Household Type | # Households | Household Size |
| Married-Couple | 458 (56.8%) | 2.52 |
| Single Male/Father | 28 (3.5%) | 4.14 |
| Single Female/Mother | 34 (4.2%) | 4.15 |
| Non-family | 287 (35.6%) | 1.14 |
| Total Households | 807 (100.0%) | 2.15 |
Household Size by Marriage Status in Boyd County
Out of a total of 807 households in Boyd County, 520 (64.4%) are family households, while 287 (35.6%) are nonfamily households. The most numerous type of family households are 2-person households, comprising 374, and the most common type of nonfamily households are 1-person households, comprising 258.
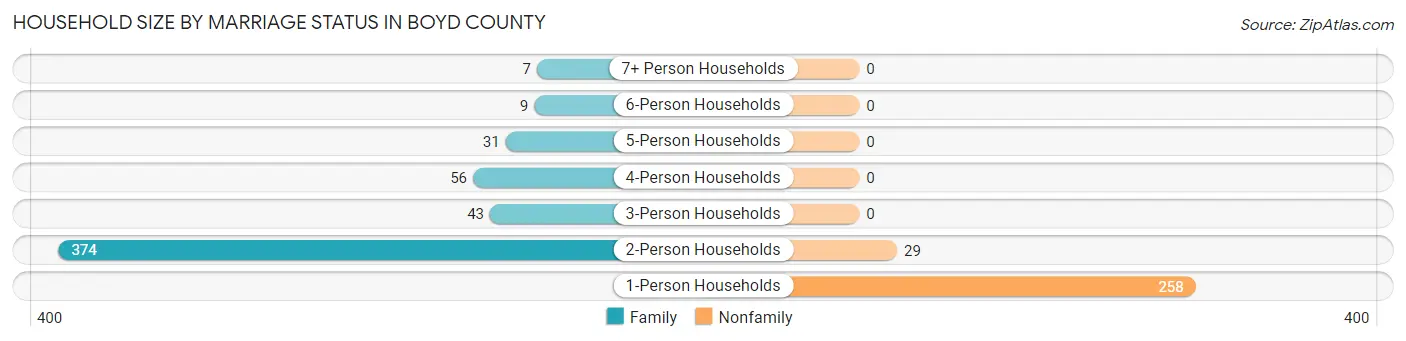
| Household Size | Family Households | Nonfamily Households |
| 1-Person Households | - | 258 (32.0%) |
| 2-Person Households | 374 (46.3%) | 29 (3.6%) |
| 3-Person Households | 43 (5.3%) | 0 (0.0%) |
| 4-Person Households | 56 (6.9%) | 0 (0.0%) |
| 5-Person Households | 31 (3.8%) | 0 (0.0%) |
| 6-Person Households | 9 (1.1%) | 0 (0.0%) |
| 7+ Person Households | 7 (0.9%) | 0 (0.0%) |
| Total | 520 (64.4%) | 287 (35.6%) |
Female Fertility in Boyd County
Fertility by Age in Boyd County
Average fertility rate in Boyd County is 51.0 births per 1,000 women. Women in the age bracket of 20 to 34 years have the highest fertility rate with 113.0 births per 1,000 women. Women in the age bracket of 20 to 34 years acount for 100.0% of all women with births.
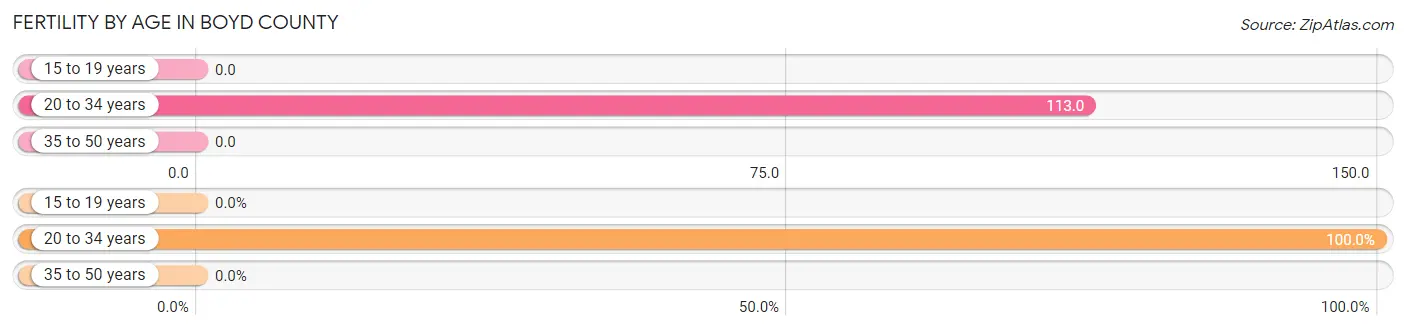
| Age Bracket | Women with Births | Births / 1,000 Women |
| 15 to 19 years | 0 (0.0%) | 0.0 |
| 20 to 34 years | 11 (100.0%) | 113.0 |
| 35 to 50 years | 0 (0.0%) | 0.0 |
| Total | 11 (100.0%) | 51.0 |
Fertility by Age by Marriage Status in Boyd County
18.2% of women with births (11) in Boyd County are married. The highest percentage of unmarried women with births falls into 20 to 34 years age bracket with 81.8% of them unmarried at the time of birth, while the lowest percentage of unmarried women with births belong to 20 to 34 years age bracket with 81.8% of them unmarried.
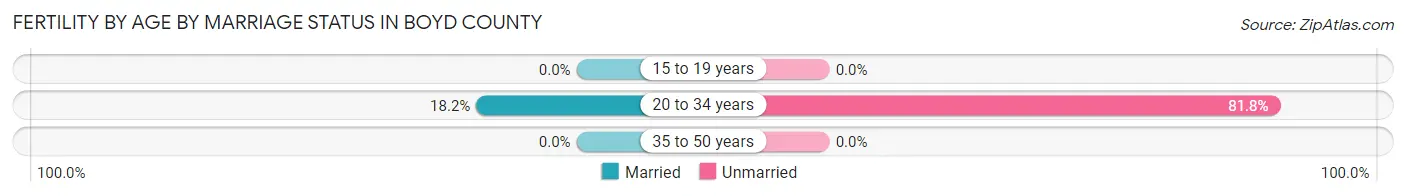
| Age Bracket | Married | Unmarried |
| 15 to 19 years | 0 (0.0%) | 0 (0.0%) |
| 20 to 34 years | 2 (18.2%) | 9 (81.8%) |
| 35 to 50 years | 0 (0.0%) | 0 (0.0%) |
| Total | 2 (18.2%) | 9 (81.8%) |
Fertility by Education in Boyd County
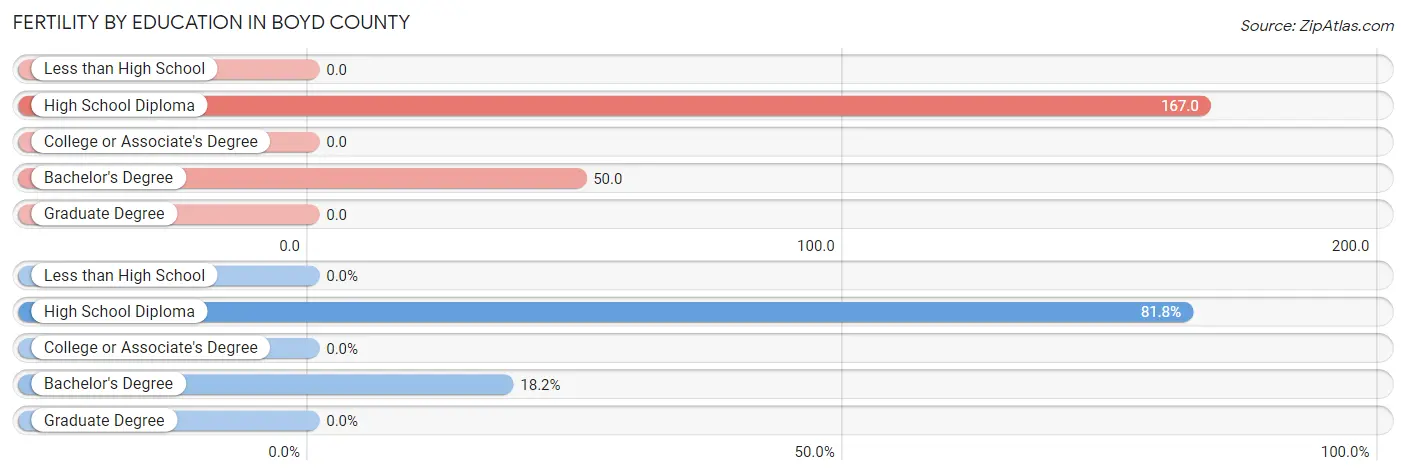
| Educational Attainment | Women with Births | Births / 1,000 Women |
| Less than High School | 0 (0.0%) | 0.0 |
| High School Diploma | 9 (81.8%) | 167.0 |
| College or Associate's Degree | 0 (0.0%) | 0.0 |
| Bachelor's Degree | 2 (18.2%) | 50.0 |
| Graduate Degree | 0 (0.0%) | 0.0 |
| Total | 11 (100.0%) | 51.0 |
Fertility by Education by Marriage Status in Boyd County
81.8% of women with births in Boyd County are unmarried. Women with the educational attainment of bachelor's degree are most likely to be married with 100.0% of them married at childbirth, while women with the educational attainment of high school diploma are least likely to be married with 100.0% of them unmarried at childbirth.
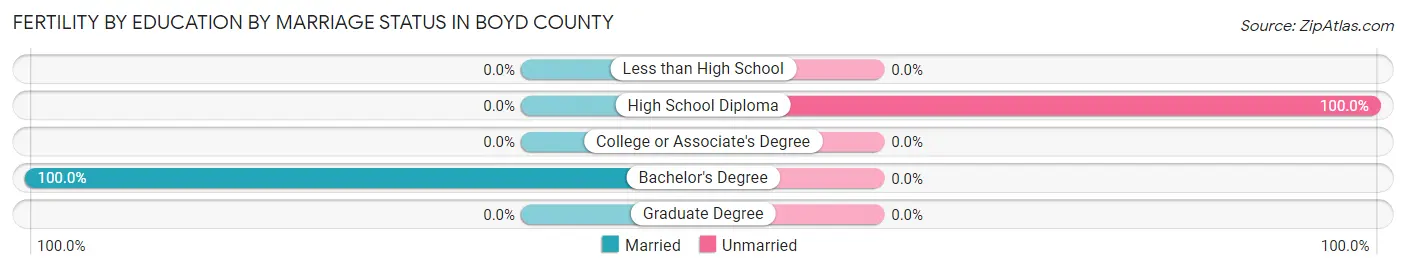
| Educational Attainment | Married | Unmarried |
| Less than High School | 0 (0.0%) | 0 (0.0%) |
| High School Diploma | 0 (0.0%) | 9 (100.0%) |
| College or Associate's Degree | 0 (0.0%) | 0 (0.0%) |
| Bachelor's Degree | 2 (100.0%) | 0 (0.0%) |
| Graduate Degree | 0 (0.0%) | 0 (0.0%) |
| Total | 2 (18.2%) | 9 (81.8%) |
Employment Characteristics in Boyd County
Employment by Class of Employer in Boyd County
Among the 848 employed individuals in Boyd County, private company employees (399 | 47.0%), self-employed (not incorporated) (198 | 23.4%), and local government employees (108 | 12.7%) make up the most common classes of employment.
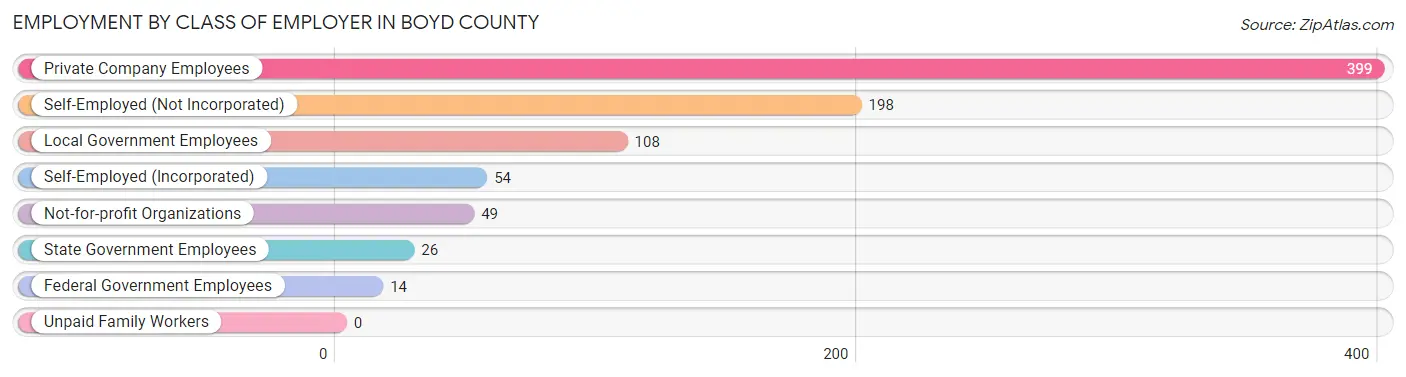
| Employer Class | # Employees | % Employees |
| Private Company Employees | 399 | 47.0% |
| Self-Employed (Incorporated) | 54 | 6.4% |
| Self-Employed (Not Incorporated) | 198 | 23.4% |
| Not-for-profit Organizations | 49 | 5.8% |
| Local Government Employees | 108 | 12.7% |
| State Government Employees | 26 | 3.1% |
| Federal Government Employees | 14 | 1.7% |
| Unpaid Family Workers | 0 | 0.0% |
| Total | 848 | 100.0% |
Employment Status by Age in Boyd County
According to the labor force statistics for Boyd County, out of the total population over 16 years of age (1,463), 59.9% or 876 individuals are in the labor force, with 1.8% or 16 of them unemployed. The age group with the highest labor force participation rate is 25 to 29 years, with 89.9% or 62 individuals in the labor force. Within the labor force, the 55 to 59 years age range has the highest percentage of unemployed individuals, with 7.4% or 7 of them being unemployed.
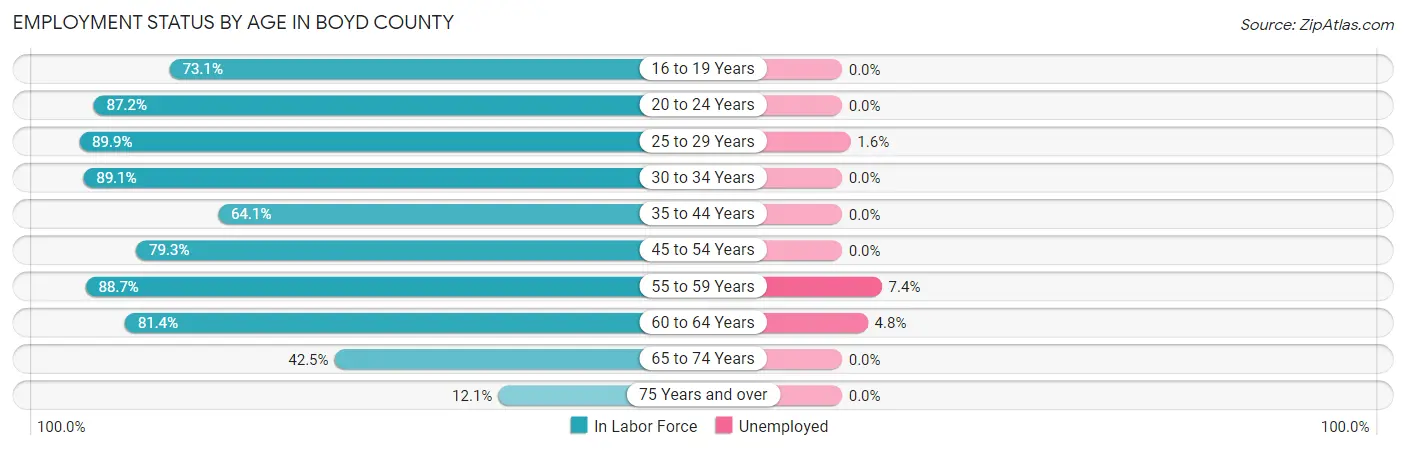
| Age Bracket | In Labor Force | Unemployed |
| 16 to 19 Years | 19 (73.1%) | 0 (0.0%) |
| 20 to 24 Years | 82 (87.2%) | 0 (0.0%) |
| 25 to 29 Years | 62 (89.9%) | 1 (1.6%) |
| 30 to 34 Years | 41 (89.1%) | 0 (0.0%) |
| 35 to 44 Years | 118 (64.1%) | 0 (0.0%) |
| 45 to 54 Years | 115 (79.3%) | 0 (0.0%) |
| 55 to 59 Years | 94 (88.7%) | 7 (7.4%) |
| 60 to 64 Years | 166 (81.4%) | 8 (4.8%) |
| 65 to 74 Years | 152 (42.5%) | 0 (0.0%) |
| 75 Years and over | 28 (12.1%) | 0 (0.0%) |
| Total | 876 (59.9%) | 16 (1.8%) |
Employment Status by Educational Attainment in Boyd County
According to labor force statistics for Boyd County, 79.0% of individuals (596) out of the total population between 25 and 64 years of age (754) are in the labor force, with 2.7% or 16 of them being unemployed. The group with the highest labor force participation rate are those with the educational attainment of bachelor's degree or higher, with 87.2% or 123 individuals in the labor force. Within the labor force, individuals with bachelor's degree or higher education have the highest percentage of unemployment, with 6.5% or 8 of them being unemployed.
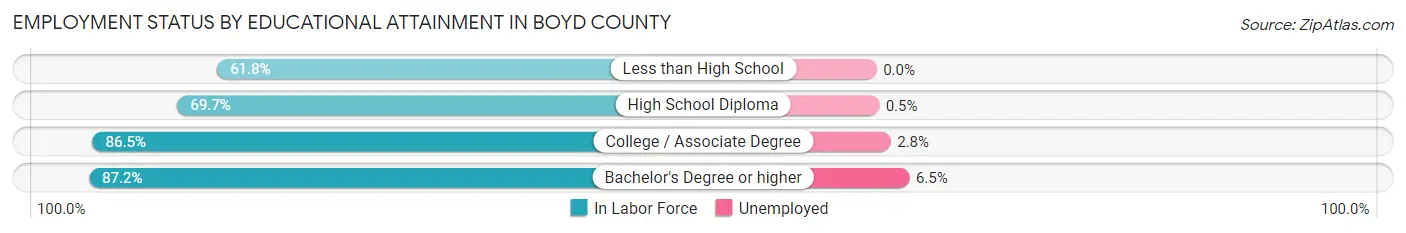
| Educational Attainment | In Labor Force | Unemployed |
| Less than High School | 21 (61.8%) | 0 (0.0%) |
| High School Diploma | 202 (69.7%) | 1 (0.5%) |
| College / Associate Degree | 250 (86.5%) | 8 (2.8%) |
| Bachelor's Degree or higher | 123 (87.2%) | 9 (6.5%) |
| Total | 596 (79.0%) | 20 (2.7%) |
Employment Occupations by Sex in Boyd County
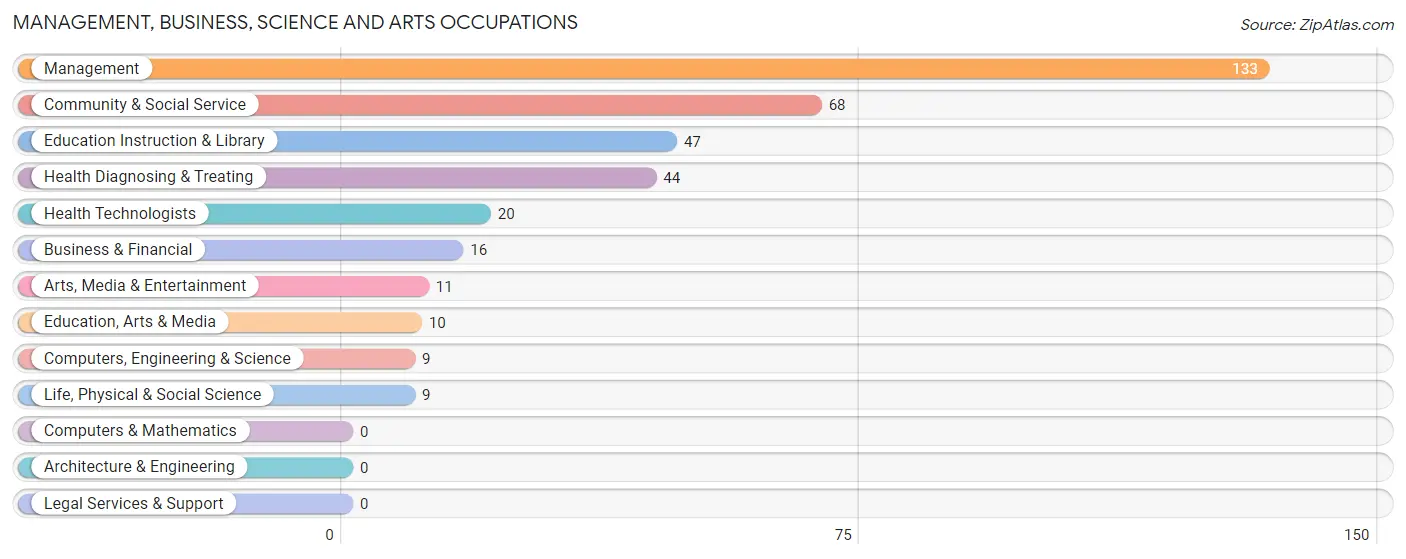
Management, Business, Science and Arts Occupations
The most common Management, Business, Science and Arts occupations in Boyd County are Management (133 | 15.4%), Community & Social Service (68 | 7.9%), Education Instruction & Library (47 | 5.5%), Health Diagnosing & Treating (44 | 5.1%), and Health Technologists (20 | 2.3%).
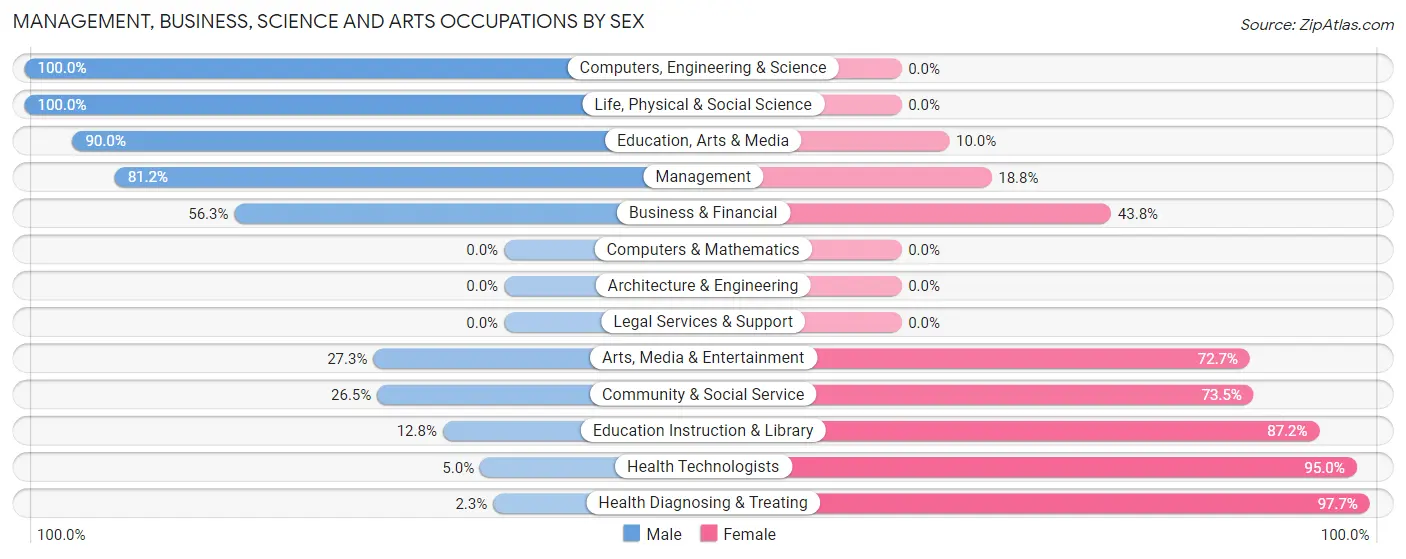
Management, Business, Science and Arts Occupations by Sex
Within the Management, Business, Science and Arts occupations in Boyd County, the most male-oriented occupations are Computers, Engineering & Science (100.0%), Life, Physical & Social Science (100.0%), and Education, Arts & Media (90.0%), while the most female-oriented occupations are Health Diagnosing & Treating (97.7%), Health Technologists (95.0%), and Education Instruction & Library (87.2%).
| Occupation | Male | Female |
| Management | 108 (81.2%) | 25 (18.8%) |
| Business & Financial | 9 (56.2%) | 7 (43.8%) |
| Computers, Engineering & Science | 9 (100.0%) | 0 (0.0%) |
| Computers & Mathematics | 0 (0.0%) | 0 (0.0%) |
| Architecture & Engineering | 0 (0.0%) | 0 (0.0%) |
| Life, Physical & Social Science | 9 (100.0%) | 0 (0.0%) |
| Community & Social Service | 18 (26.5%) | 50 (73.5%) |
| Education, Arts & Media | 9 (90.0%) | 1 (10.0%) |
| Legal Services & Support | 0 (0.0%) | 0 (0.0%) |
| Education Instruction & Library | 6 (12.8%) | 41 (87.2%) |
| Arts, Media & Entertainment | 3 (27.3%) | 8 (72.7%) |
| Health Diagnosing & Treating | 1 (2.3%) | 43 (97.7%) |
| Health Technologists | 1 (5.0%) | 19 (95.0%) |
| Total (Category) | 145 (53.7%) | 125 (46.3%) |
| Total (Overall) | 466 (54.1%) | 395 (45.9%) |
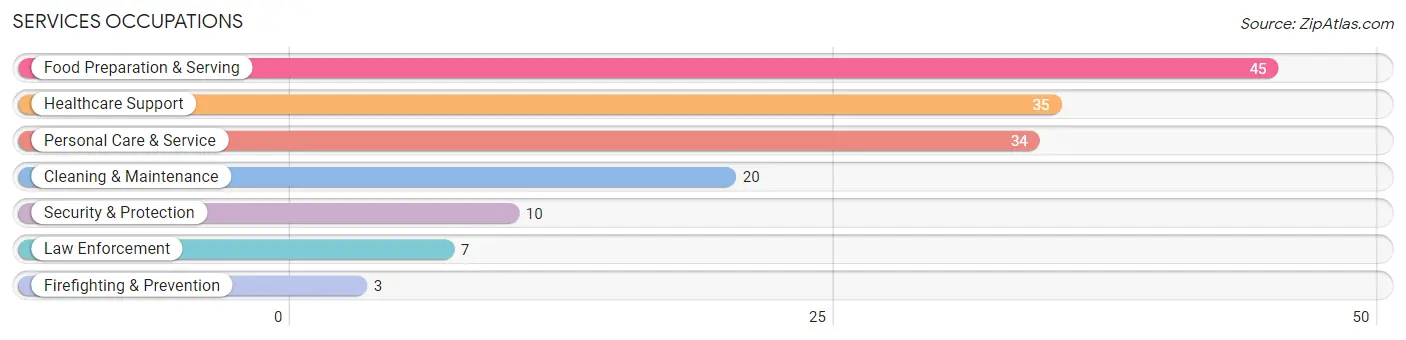
Services Occupations
The most common Services occupations in Boyd County are Food Preparation & Serving (45 | 5.2%), Healthcare Support (35 | 4.1%), Personal Care & Service (34 | 4.0%), Cleaning & Maintenance (20 | 2.3%), and Security & Protection (10 | 1.2%).
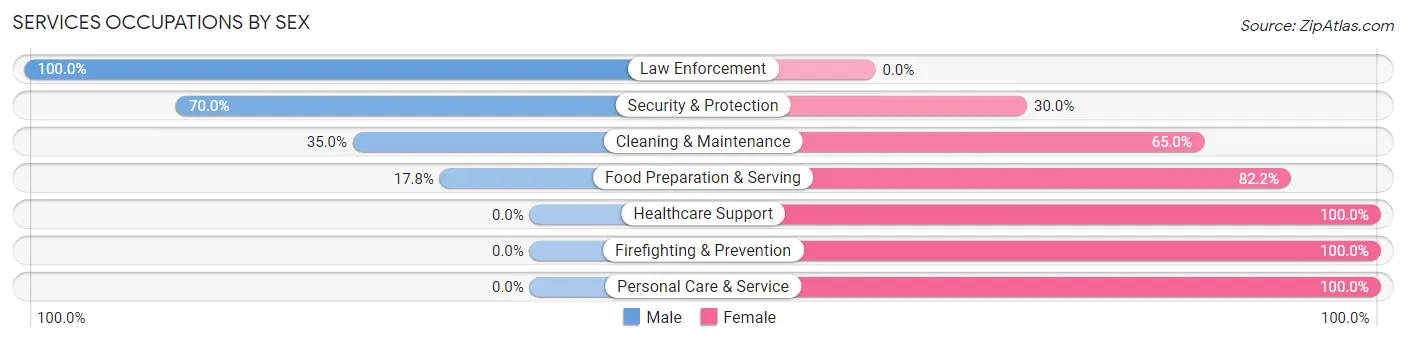
Services Occupations by Sex
Within the Services occupations in Boyd County, the most male-oriented occupations are Law Enforcement (100.0%), Security & Protection (70.0%), and Cleaning & Maintenance (35.0%), while the most female-oriented occupations are Healthcare Support (100.0%), Firefighting & Prevention (100.0%), and Personal Care & Service (100.0%).
| Occupation | Male | Female |
| Healthcare Support | 0 (0.0%) | 35 (100.0%) |
| Security & Protection | 7 (70.0%) | 3 (30.0%) |
| Firefighting & Prevention | 0 (0.0%) | 3 (100.0%) |
| Law Enforcement | 7 (100.0%) | 0 (0.0%) |
| Food Preparation & Serving | 8 (17.8%) | 37 (82.2%) |
| Cleaning & Maintenance | 7 (35.0%) | 13 (65.0%) |
| Personal Care & Service | 0 (0.0%) | 34 (100.0%) |
| Total (Category) | 22 (15.3%) | 122 (84.7%) |
| Total (Overall) | 466 (54.1%) | 395 (45.9%) |
Sales and Office Occupations
The most common Sales and Office occupations in Boyd County are Office & Administration (94 | 10.9%), and Sales & Related (61 | 7.1%).
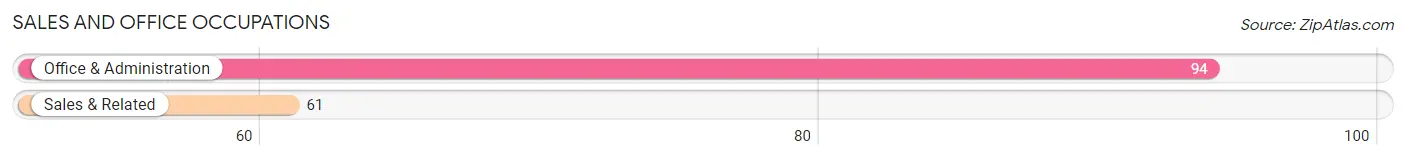
Sales and Office Occupations by Sex
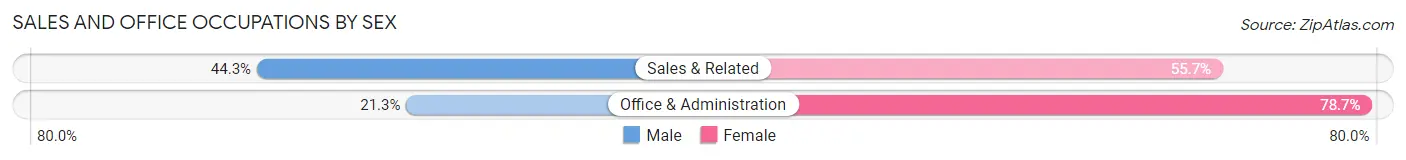
| Occupation | Male | Female |
| Sales & Related | 27 (44.3%) | 34 (55.7%) |
| Office & Administration | 20 (21.3%) | 74 (78.7%) |
| Total (Category) | 47 (30.3%) | 108 (69.7%) |
| Total (Overall) | 466 (54.1%) | 395 (45.9%) |
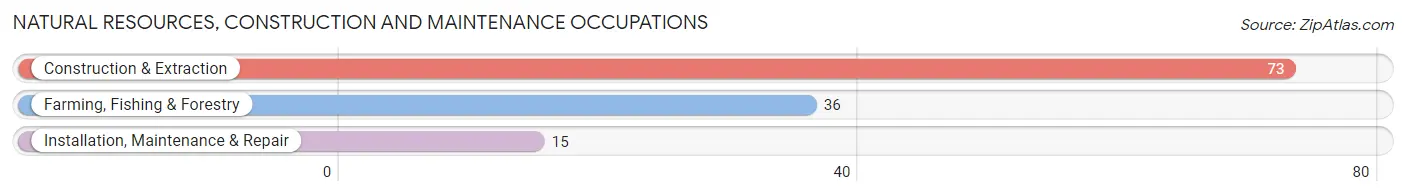
Natural Resources, Construction and Maintenance Occupations
The most common Natural Resources, Construction and Maintenance occupations in Boyd County are Construction & Extraction (73 | 8.5%), Farming, Fishing & Forestry (36 | 4.2%), and Installation, Maintenance & Repair (15 | 1.7%).
Natural Resources, Construction and Maintenance Occupations by Sex
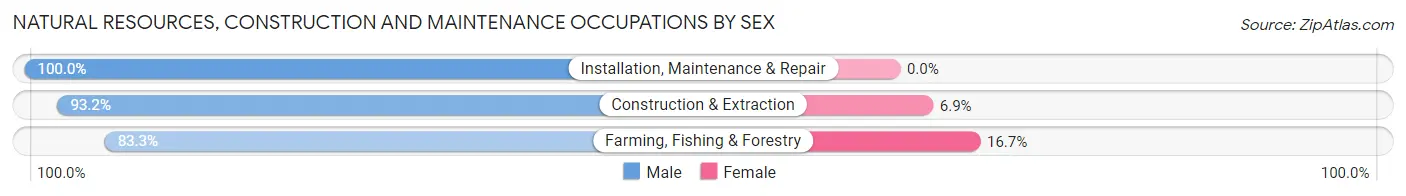
| Occupation | Male | Female |
| Farming, Fishing & Forestry | 30 (83.3%) | 6 (16.7%) |
| Construction & Extraction | 68 (93.1%) | 5 (6.9%) |
| Installation, Maintenance & Repair | 15 (100.0%) | 0 (0.0%) |
| Total (Category) | 113 (91.1%) | 11 (8.9%) |
| Total (Overall) | 466 (54.1%) | 395 (45.9%) |
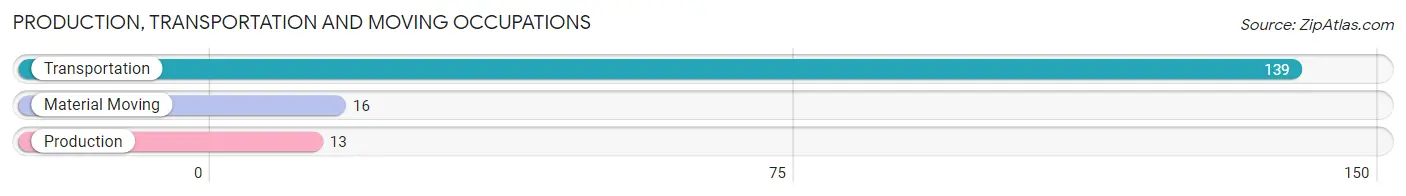
Production, Transportation and Moving Occupations
The most common Production, Transportation and Moving occupations in Boyd County are Transportation (139 | 16.1%), Material Moving (16 | 1.9%), and Production (13 | 1.5%).
Production, Transportation and Moving Occupations by Sex
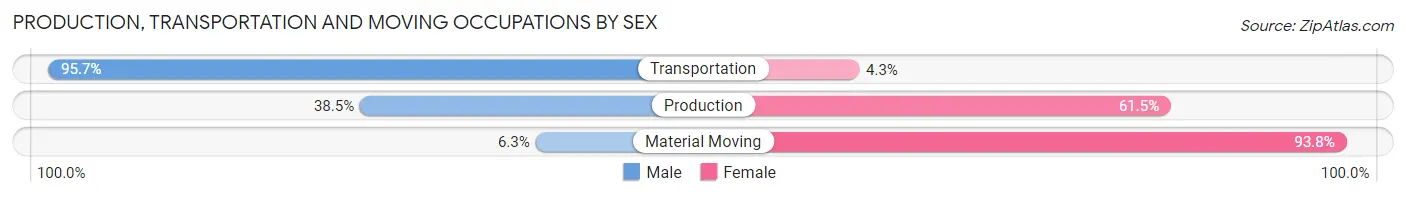
| Occupation | Male | Female |
| Production | 5 (38.5%) | 8 (61.5%) |
| Transportation | 133 (95.7%) | 6 (4.3%) |
| Material Moving | 1 (6.2%) | 15 (93.8%) |
| Total (Category) | 139 (82.7%) | 29 (17.3%) |
| Total (Overall) | 466 (54.1%) | 395 (45.9%) |
Employment Industries by Sex in Boyd County
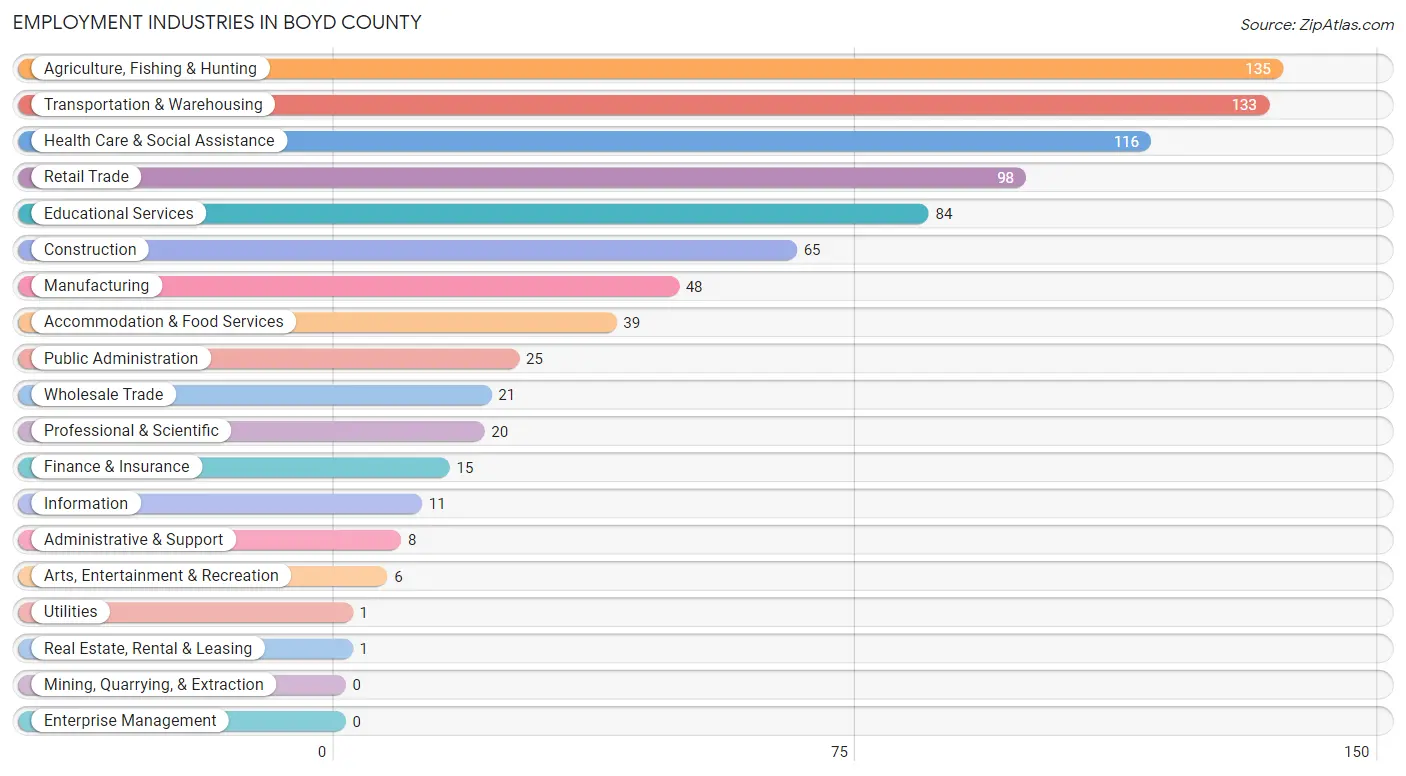
Employment Industries in Boyd County
The major employment industries in Boyd County include Agriculture, Fishing & Hunting (135 | 15.7%), Transportation & Warehousing (133 | 15.4%), Health Care & Social Assistance (116 | 13.5%), Retail Trade (98 | 11.4%), and Educational Services (84 | 9.8%).
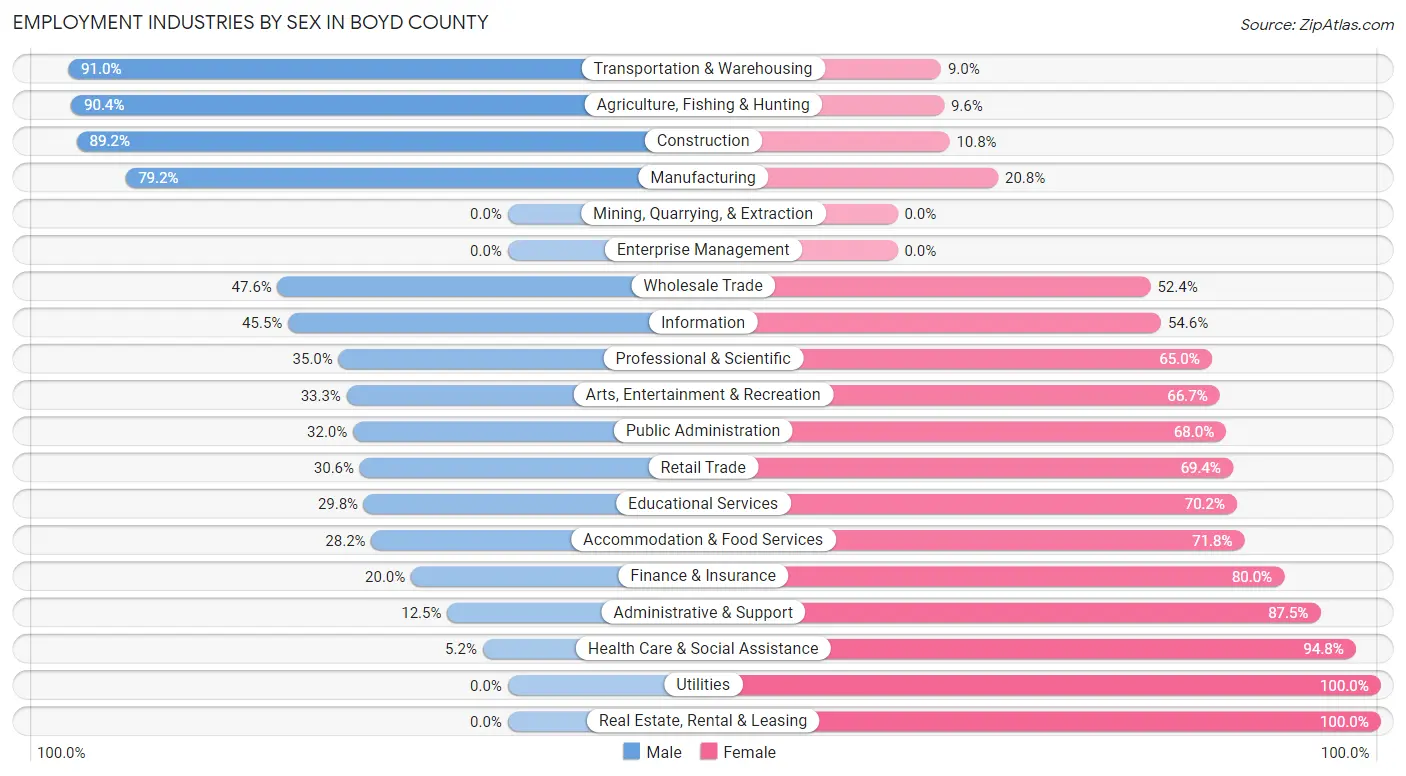
Employment Industries by Sex in Boyd County
The Boyd County industries that see more men than women are Transportation & Warehousing (91.0%), Agriculture, Fishing & Hunting (90.4%), and Construction (89.2%), whereas the industries that tend to have a higher number of women are Utilities (100.0%), Real Estate, Rental & Leasing (100.0%), and Health Care & Social Assistance (94.8%).
| Industry | Male | Female |
| Agriculture, Fishing & Hunting | 122 (90.4%) | 13 (9.6%) |
| Mining, Quarrying, & Extraction | 0 (0.0%) | 0 (0.0%) |
| Construction | 58 (89.2%) | 7 (10.8%) |
| Manufacturing | 38 (79.2%) | 10 (20.8%) |
| Wholesale Trade | 10 (47.6%) | 11 (52.4%) |
| Retail Trade | 30 (30.6%) | 68 (69.4%) |
| Transportation & Warehousing | 121 (91.0%) | 12 (9.0%) |
| Utilities | 0 (0.0%) | 1 (100.0%) |
| Information | 5 (45.5%) | 6 (54.5%) |
| Finance & Insurance | 3 (20.0%) | 12 (80.0%) |
| Real Estate, Rental & Leasing | 0 (0.0%) | 1 (100.0%) |
| Professional & Scientific | 7 (35.0%) | 13 (65.0%) |
| Enterprise Management | 0 (0.0%) | 0 (0.0%) |
| Administrative & Support | 1 (12.5%) | 7 (87.5%) |
| Educational Services | 25 (29.8%) | 59 (70.2%) |
| Health Care & Social Assistance | 6 (5.2%) | 110 (94.8%) |
| Arts, Entertainment & Recreation | 2 (33.3%) | 4 (66.7%) |
| Accommodation & Food Services | 11 (28.2%) | 28 (71.8%) |
| Public Administration | 8 (32.0%) | 17 (68.0%) |
| Total | 466 (54.1%) | 395 (45.9%) |
Education in Boyd County
School Enrollment in Boyd County
The most common levels of schooling among the 282 students in Boyd County are elementary school (97 | 34.4%), middle school (80 | 28.4%), and high school (61 | 21.6%).
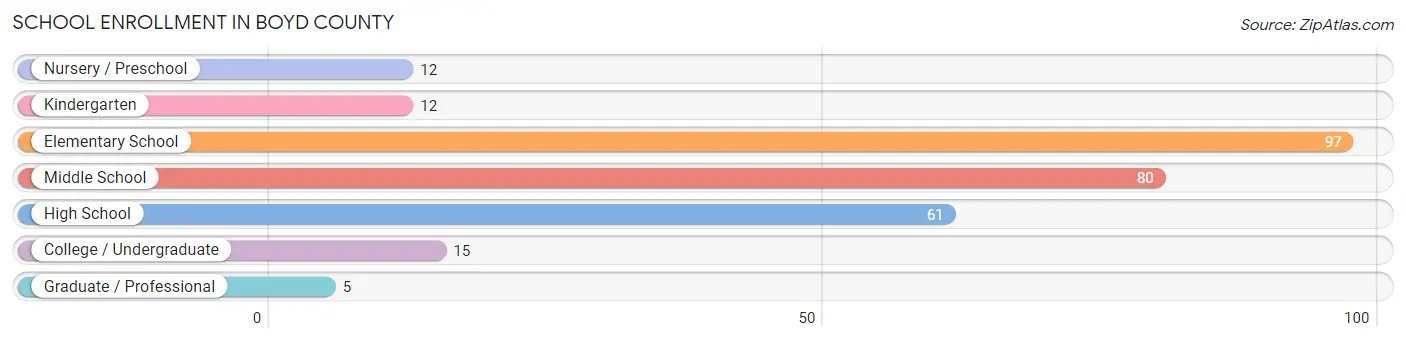
| School Level | # Students | % Students |
| Nursery / Preschool | 12 | 4.3% |
| Kindergarten | 12 | 4.3% |
| Elementary School | 97 | 34.4% |
| Middle School | 80 | 28.4% |
| High School | 61 | 21.6% |
| College / Undergraduate | 15 | 5.3% |
| Graduate / Professional | 5 | 1.8% |
| Total | 282 | 100.0% |
School Enrollment by Age by Funding Source in Boyd County
Out of a total of 282 students who are enrolled in schools in Boyd County, 17 (6.0%) attend a private institution, while the remaining 265 (94.0%) are enrolled in public schools. The age group of 20 to 24 year olds has the highest likelihood of being enrolled in private schools, with 1 (100.0% in the age bracket) enrolled. Conversely, the age group of 3 to 4 year olds has the lowest likelihood of being enrolled in a private school, with 8 (100.0% in the age bracket) attending a public institution.
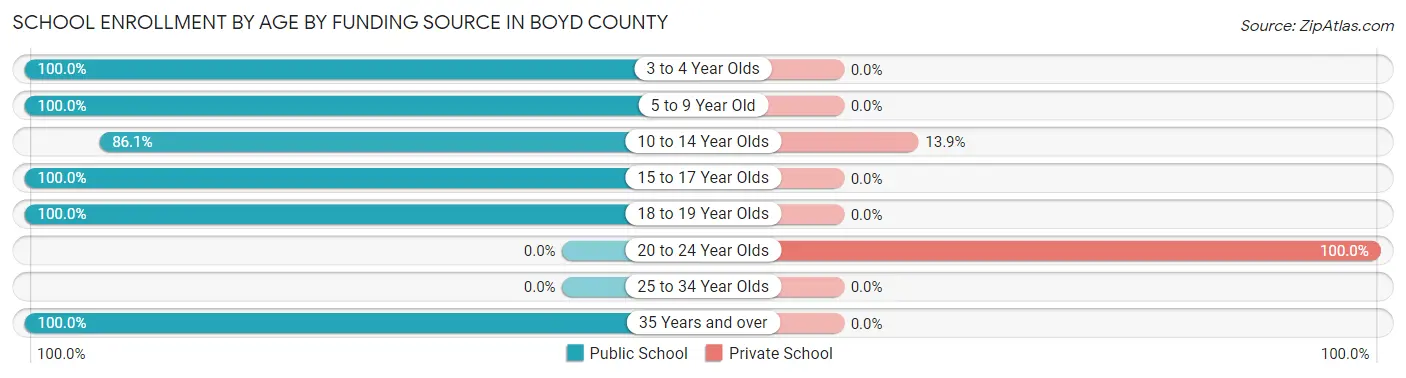
| Age Bracket | Public School | Private School |
| 3 to 4 Year Olds | 8 (100.0%) | 0 (0.0%) |
| 5 to 9 Year Old | 104 (100.0%) | 0 (0.0%) |
| 10 to 14 Year Olds | 99 (86.1%) | 16 (13.9%) |
| 15 to 17 Year Olds | 34 (100.0%) | 0 (0.0%) |
| 18 to 19 Year Olds | 6 (100.0%) | 0 (0.0%) |
| 20 to 24 Year Olds | 0 (0.0%) | 1 (100.0%) |
| 25 to 34 Year Olds | 0 (0.0%) | 0 (0.0%) |
| 35 Years and over | 14 (100.0%) | 0 (0.0%) |
| Total | 265 (94.0%) | 17 (6.0%) |
Educational Attainment by Field of Study in Boyd County
Liberal arts & history (48 | 19.1%), education (41 | 16.3%), business (35 | 13.9%), arts & humanities (25 | 10.0%), and visual & performing arts (23 | 9.2%) are the most common fields of study among 251 individuals in Boyd County who have obtained a bachelor's degree or higher.
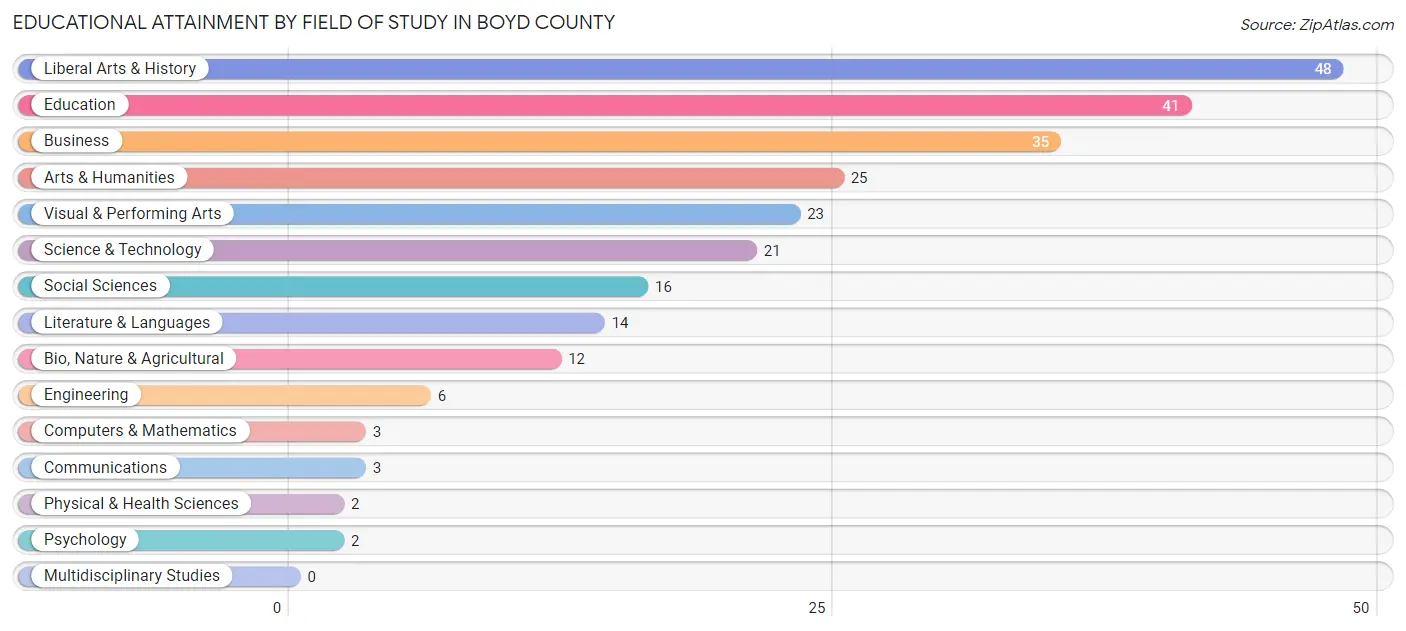
| Field of Study | # Graduates | % Graduates |
| Computers & Mathematics | 3 | 1.2% |
| Bio, Nature & Agricultural | 12 | 4.8% |
| Physical & Health Sciences | 2 | 0.8% |
| Psychology | 2 | 0.8% |
| Social Sciences | 16 | 6.4% |
| Engineering | 6 | 2.4% |
| Multidisciplinary Studies | 0 | 0.0% |
| Science & Technology | 21 | 8.4% |
| Business | 35 | 13.9% |
| Education | 41 | 16.3% |
| Literature & Languages | 14 | 5.6% |
| Liberal Arts & History | 48 | 19.1% |
| Visual & Performing Arts | 23 | 9.2% |
| Communications | 3 | 1.2% |
| Arts & Humanities | 25 | 10.0% |
| Total | 251 | 100.0% |
Transportation & Commute in Boyd County
Vehicle Availability by Sex in Boyd County
The most prevalent vehicle ownership categories in Boyd County are males with 2 vehicles (123, accounting for 26.9%) and females with 2 vehicles (63, making up 31.5%).
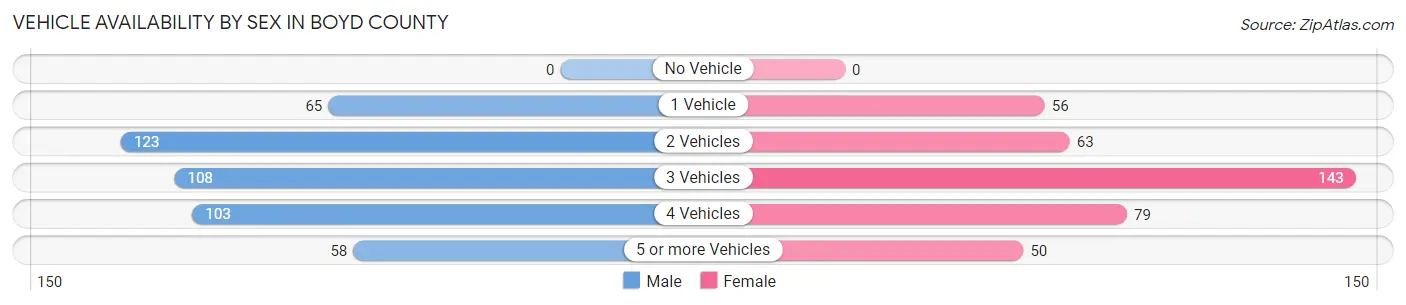
| Vehicles Available | Male | Female |
| No Vehicle | 0 (0.0%) | 0 (0.0%) |
| 1 Vehicle | 65 (14.2%) | 56 (14.3%) |
| 2 Vehicles | 123 (26.9%) | 63 (16.1%) |
| 3 Vehicles | 108 (23.6%) | 143 (36.6%) |
| 4 Vehicles | 103 (22.5%) | 79 (20.2%) |
| 5 or more Vehicles | 58 (12.7%) | 50 (12.8%) |
| Total | 457 (100.0%) | 391 (100.0%) |
Commute Time in Boyd County
The most frequently occuring commute durations in Boyd County are less than 5 minutes (244 commuters, 31.1%), 5 to 9 minutes (175 commuters, 22.3%), and 10 to 14 minutes (64 commuters, 8.2%).
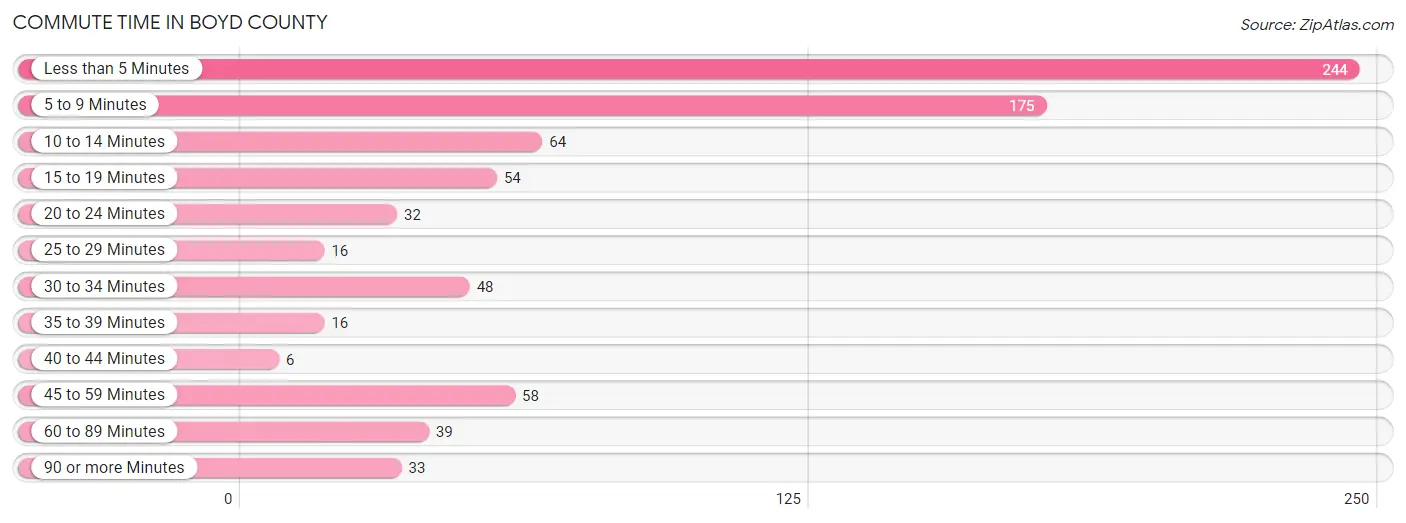
| Commute Time | # Commuters | % Commuters |
| Less than 5 Minutes | 244 | 31.1% |
| 5 to 9 Minutes | 175 | 22.3% |
| 10 to 14 Minutes | 64 | 8.2% |
| 15 to 19 Minutes | 54 | 6.9% |
| 20 to 24 Minutes | 32 | 4.1% |
| 25 to 29 Minutes | 16 | 2.0% |
| 30 to 34 Minutes | 48 | 6.1% |
| 35 to 39 Minutes | 16 | 2.0% |
| 40 to 44 Minutes | 6 | 0.8% |
| 45 to 59 Minutes | 58 | 7.4% |
| 60 to 89 Minutes | 39 | 5.0% |
| 90 or more Minutes | 33 | 4.2% |
Commute Time by Sex in Boyd County
The most common commute times in Boyd County are less than 5 minutes (157 commuters, 36.6%) for males and 5 to 9 minutes (96 commuters, 27.0%) for females.
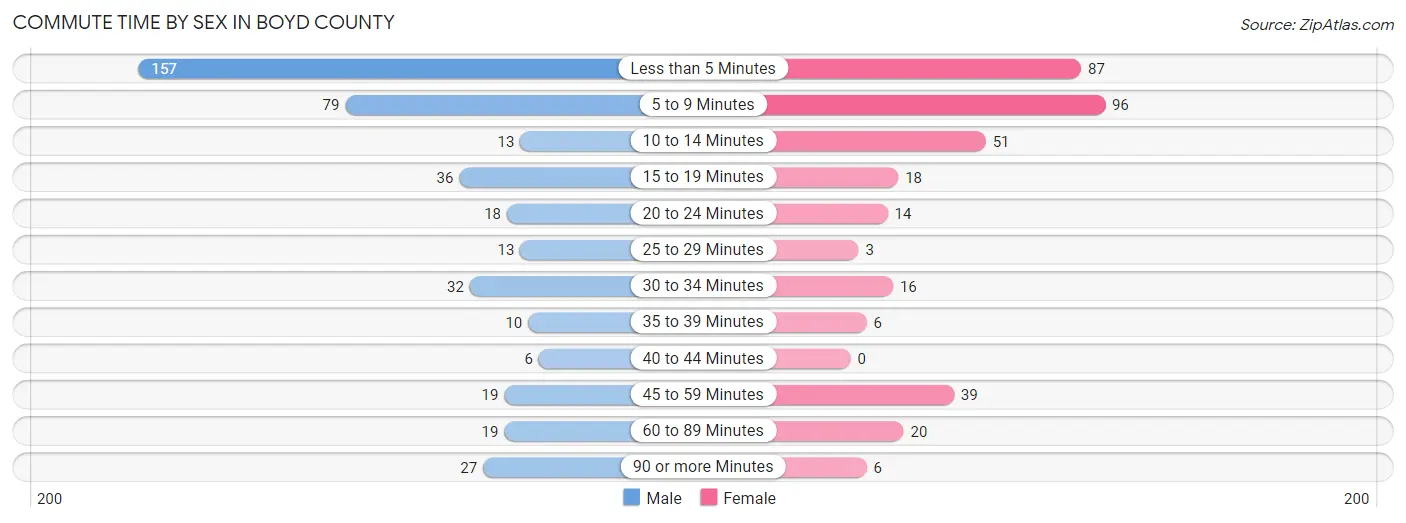
| Commute Time | Male | Female |
| Less than 5 Minutes | 157 (36.6%) | 87 (24.4%) |
| 5 to 9 Minutes | 79 (18.4%) | 96 (27.0%) |
| 10 to 14 Minutes | 13 (3.0%) | 51 (14.3%) |
| 15 to 19 Minutes | 36 (8.4%) | 18 (5.1%) |
| 20 to 24 Minutes | 18 (4.2%) | 14 (3.9%) |
| 25 to 29 Minutes | 13 (3.0%) | 3 (0.8%) |
| 30 to 34 Minutes | 32 (7.5%) | 16 (4.5%) |
| 35 to 39 Minutes | 10 (2.3%) | 6 (1.7%) |
| 40 to 44 Minutes | 6 (1.4%) | 0 (0.0%) |
| 45 to 59 Minutes | 19 (4.4%) | 39 (11.0%) |
| 60 to 89 Minutes | 19 (4.4%) | 20 (5.6%) |
| 90 or more Minutes | 27 (6.3%) | 6 (1.7%) |
Time of Departure to Work by Sex in Boyd County
The most frequent times of departure to work in Boyd County are 8:00 AM to 8:29 AM (63, 14.7%) for males and 7:00 AM to 7:29 AM (67, 18.8%) for females.
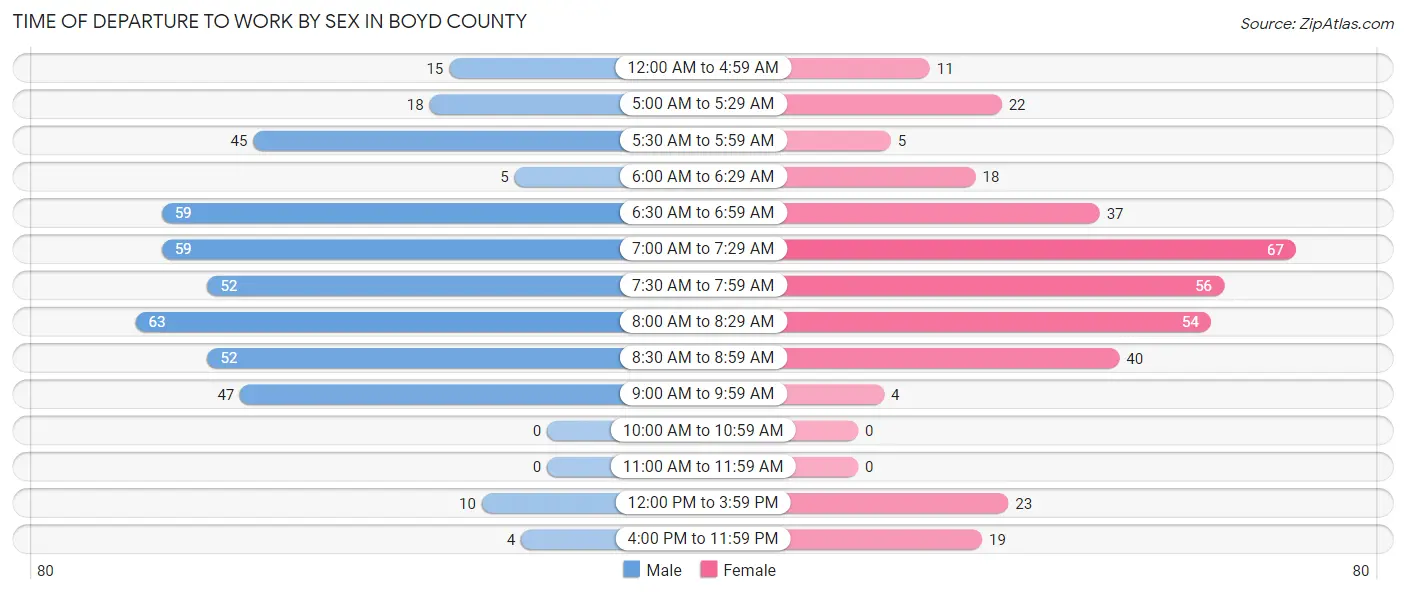
| Time of Departure | Male | Female |
| 12:00 AM to 4:59 AM | 15 (3.5%) | 11 (3.1%) |
| 5:00 AM to 5:29 AM | 18 (4.2%) | 22 (6.2%) |
| 5:30 AM to 5:59 AM | 45 (10.5%) | 5 (1.4%) |
| 6:00 AM to 6:29 AM | 5 (1.2%) | 18 (5.1%) |
| 6:30 AM to 6:59 AM | 59 (13.8%) | 37 (10.4%) |
| 7:00 AM to 7:29 AM | 59 (13.8%) | 67 (18.8%) |
| 7:30 AM to 7:59 AM | 52 (12.1%) | 56 (15.7%) |
| 8:00 AM to 8:29 AM | 63 (14.7%) | 54 (15.2%) |
| 8:30 AM to 8:59 AM | 52 (12.1%) | 40 (11.2%) |
| 9:00 AM to 9:59 AM | 47 (11.0%) | 4 (1.1%) |
| 10:00 AM to 10:59 AM | 0 (0.0%) | 0 (0.0%) |
| 11:00 AM to 11:59 AM | 0 (0.0%) | 0 (0.0%) |
| 12:00 PM to 3:59 PM | 10 (2.3%) | 23 (6.5%) |
| 4:00 PM to 11:59 PM | 4 (0.9%) | 19 (5.3%) |
| Total | 429 (100.0%) | 356 (100.0%) |
Housing Occupancy in Boyd County
Occupancy by Ownership in Boyd County
Of the total 807 dwellings in Boyd County, owner-occupied units account for 669 (82.9%), while renter-occupied units make up 138 (17.1%).
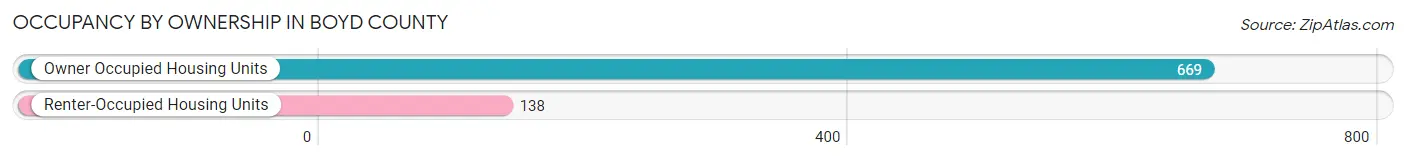
| Occupancy | # Housing Units | % Housing Units |
| Owner Occupied Housing Units | 669 | 82.9% |
| Renter-Occupied Housing Units | 138 | 17.1% |
| Total Occupied Housing Units | 807 | 100.0% |
Occupancy by Household Size in Boyd County
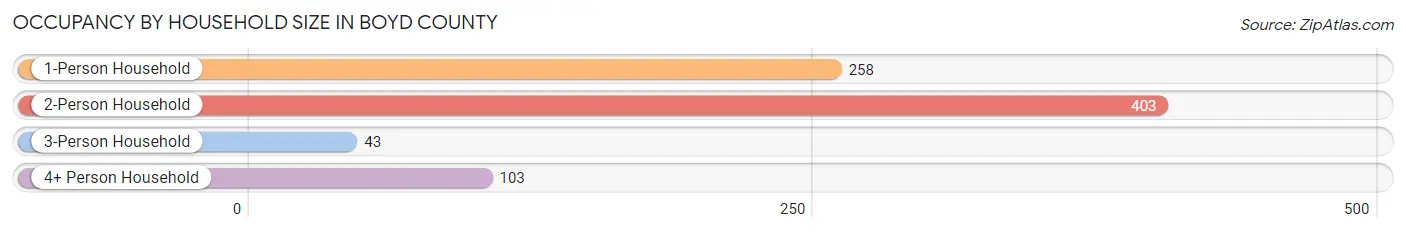
| Household Size | # Housing Units | % Housing Units |
| 1-Person Household | 258 | 32.0% |
| 2-Person Household | 403 | 49.9% |
| 3-Person Household | 43 | 5.3% |
| 4+ Person Household | 103 | 12.8% |
| Total Housing Units | 807 | 100.0% |
Occupancy by Ownership by Household Size in Boyd County

| Household Size | Owner-occupied | Renter-occupied |
| 1-Person Household | 181 (70.2%) | 77 (29.8%) |
| 2-Person Household | 368 (91.3%) | 35 (8.7%) |
| 3-Person Household | 33 (76.7%) | 10 (23.3%) |
| 4+ Person Household | 87 (84.5%) | 16 (15.5%) |
| Total Housing Units | 669 (82.9%) | 138 (17.1%) |
Occupancy by Educational Attainment in Boyd County
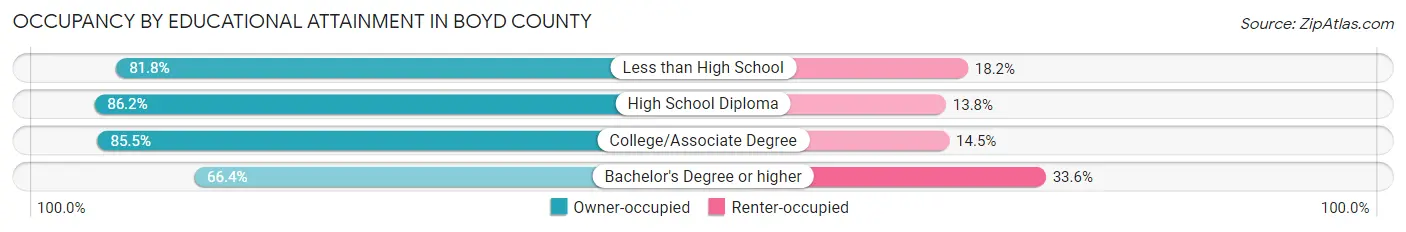
| Household Size | Owner-occupied | Renter-occupied |
| Less than High School | 27 (81.8%) | 6 (18.2%) |
| High School Diploma | 293 (86.2%) | 47 (13.8%) |
| College/Associate Degree | 272 (85.5%) | 46 (14.5%) |
| Bachelor's Degree or higher | 77 (66.4%) | 39 (33.6%) |
Occupancy by Age of Householder in Boyd County
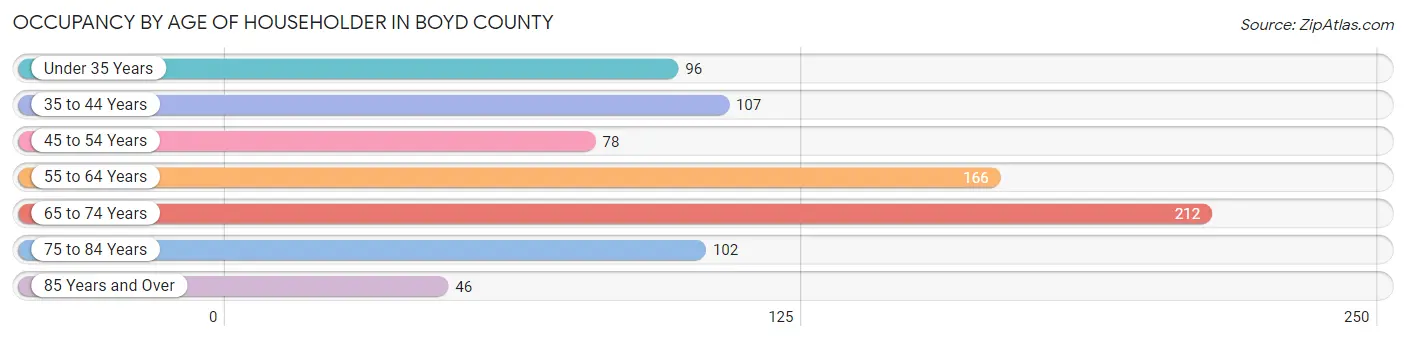
| Age Bracket | # Households | % Households |
| Under 35 Years | 96 | 11.9% |
| 35 to 44 Years | 107 | 13.3% |
| 45 to 54 Years | 78 | 9.7% |
| 55 to 64 Years | 166 | 20.6% |
| 65 to 74 Years | 212 | 26.3% |
| 75 to 84 Years | 102 | 12.6% |
| 85 Years and Over | 46 | 5.7% |
| Total | 807 | 100.0% |
Housing Finances in Boyd County
Median Income by Occupancy in Boyd County
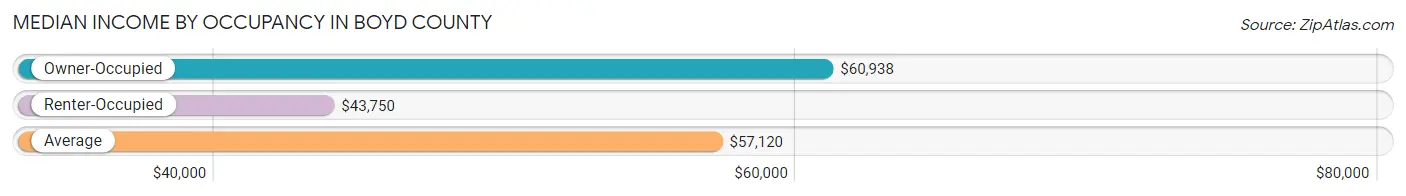
| Occupancy Type | # Households | Median Income |
| Owner-Occupied | 669 (82.9%) | $60,938 |
| Renter-Occupied | 138 (17.1%) | $43,750 |
| Average | 807 (100.0%) | $57,120 |
Occupancy by Householder Income Bracket in Boyd County
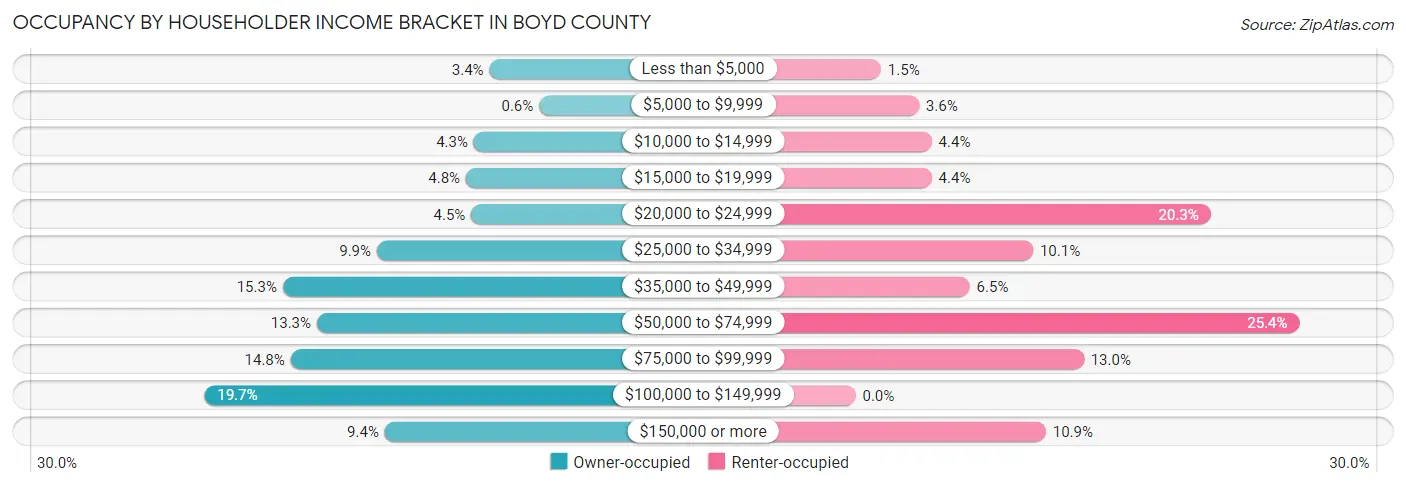
| Income Bracket | Owner-occupied | Renter-occupied |
| Less than $5,000 | 23 (3.4%) | 2 (1.5%) |
| $5,000 to $9,999 | 4 (0.6%) | 5 (3.6%) |
| $10,000 to $14,999 | 29 (4.3%) | 6 (4.3%) |
| $15,000 to $19,999 | 32 (4.8%) | 6 (4.3%) |
| $20,000 to $24,999 | 30 (4.5%) | 28 (20.3%) |
| $25,000 to $34,999 | 66 (9.9%) | 14 (10.1%) |
| $35,000 to $49,999 | 102 (15.2%) | 9 (6.5%) |
| $50,000 to $74,999 | 89 (13.3%) | 35 (25.4%) |
| $75,000 to $99,999 | 99 (14.8%) | 18 (13.0%) |
| $100,000 to $149,999 | 132 (19.7%) | 0 (0.0%) |
| $150,000 or more | 63 (9.4%) | 15 (10.9%) |
| Total | 669 (100.0%) | 138 (100.0%) |
Monthly Housing Cost Tiers in Boyd County
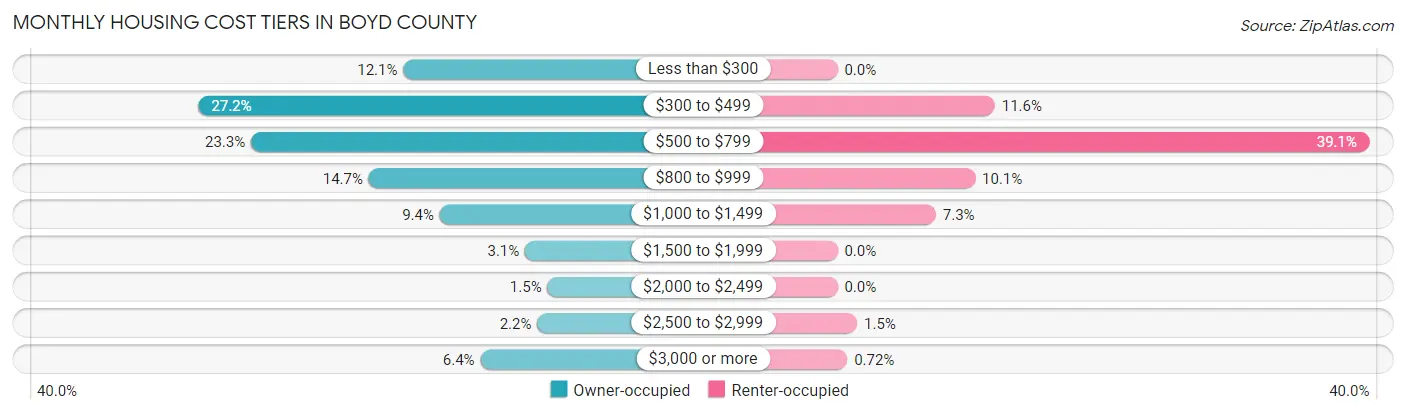
| Monthly Cost | Owner-occupied | Renter-occupied |
| Less than $300 | 81 (12.1%) | 0 (0.0%) |
| $300 to $499 | 182 (27.2%) | 16 (11.6%) |
| $500 to $799 | 156 (23.3%) | 54 (39.1%) |
| $800 to $999 | 98 (14.6%) | 14 (10.1%) |
| $1,000 to $1,499 | 63 (9.4%) | 10 (7.2%) |
| $1,500 to $1,999 | 21 (3.1%) | 0 (0.0%) |
| $2,000 to $2,499 | 10 (1.5%) | 0 (0.0%) |
| $2,500 to $2,999 | 15 (2.2%) | 2 (1.5%) |
| $3,000 or more | 43 (6.4%) | 1 (0.7%) |
| Total | 669 (100.0%) | 138 (100.0%) |
Physical Housing Characteristics in Boyd County
Housing Structures in Boyd County
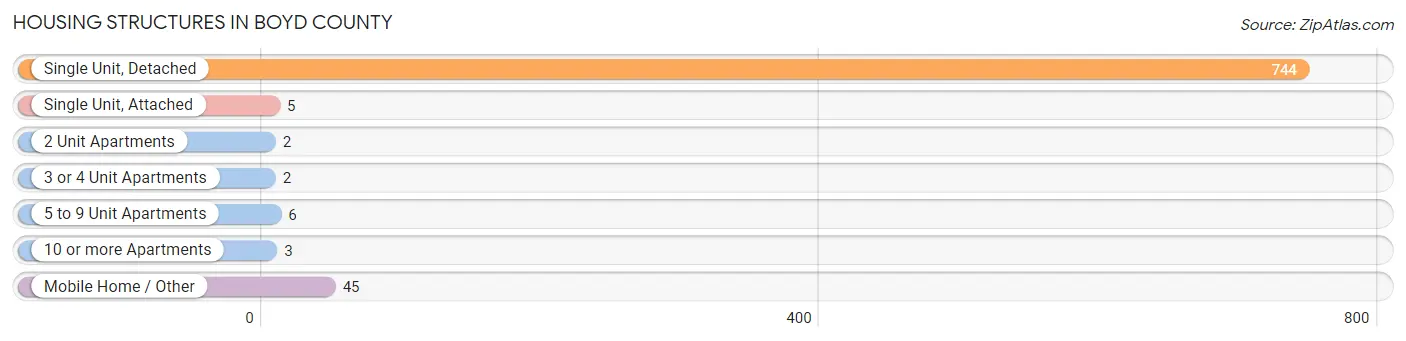
| Structure Type | # Housing Units | % Housing Units |
| Single Unit, Detached | 744 | 92.2% |
| Single Unit, Attached | 5 | 0.6% |
| 2 Unit Apartments | 2 | 0.3% |
| 3 or 4 Unit Apartments | 2 | 0.3% |
| 5 to 9 Unit Apartments | 6 | 0.7% |
| 10 or more Apartments | 3 | 0.4% |
| Mobile Home / Other | 45 | 5.6% |
| Total | 807 | 100.0% |
Housing Structures by Occupancy in Boyd County
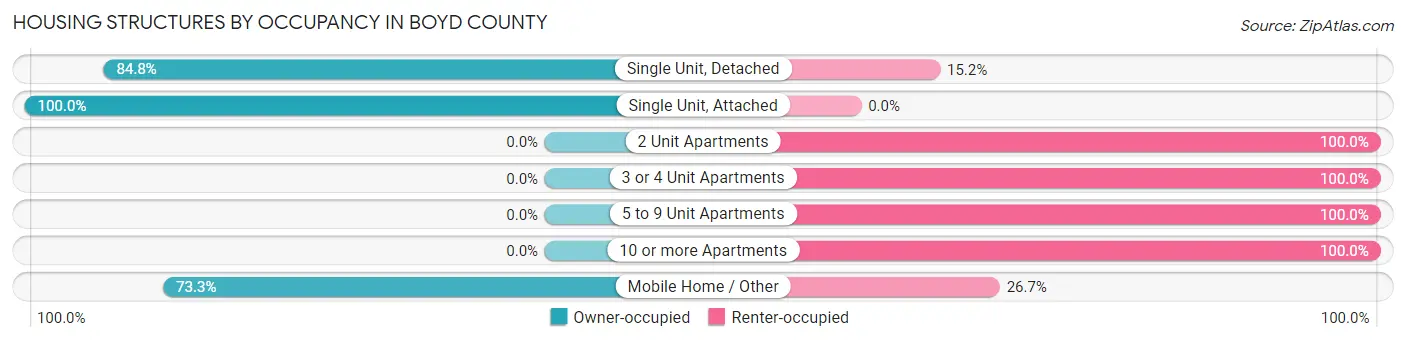
| Structure Type | Owner-occupied | Renter-occupied |
| Single Unit, Detached | 631 (84.8%) | 113 (15.2%) |
| Single Unit, Attached | 5 (100.0%) | 0 (0.0%) |
| 2 Unit Apartments | 0 (0.0%) | 2 (100.0%) |
| 3 or 4 Unit Apartments | 0 (0.0%) | 2 (100.0%) |
| 5 to 9 Unit Apartments | 0 (0.0%) | 6 (100.0%) |
| 10 or more Apartments | 0 (0.0%) | 3 (100.0%) |
| Mobile Home / Other | 33 (73.3%) | 12 (26.7%) |
| Total | 669 (82.9%) | 138 (17.1%) |
Housing Structures by Number of Rooms in Boyd County
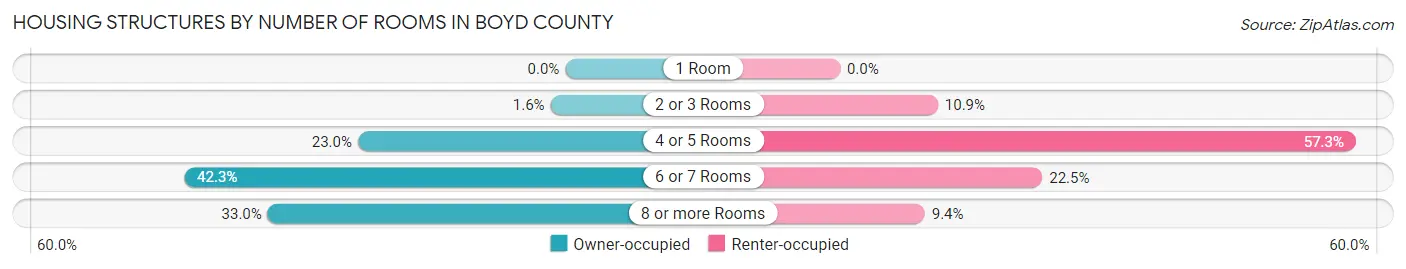
| Number of Rooms | Owner-occupied | Renter-occupied |
| 1 Room | 0 (0.0%) | 0 (0.0%) |
| 2 or 3 Rooms | 11 (1.6%) | 15 (10.9%) |
| 4 or 5 Rooms | 154 (23.0%) | 79 (57.3%) |
| 6 or 7 Rooms | 283 (42.3%) | 31 (22.5%) |
| 8 or more Rooms | 221 (33.0%) | 13 (9.4%) |
| Total | 669 (100.0%) | 138 (100.0%) |
Housing Structure by Heating Type in Boyd County
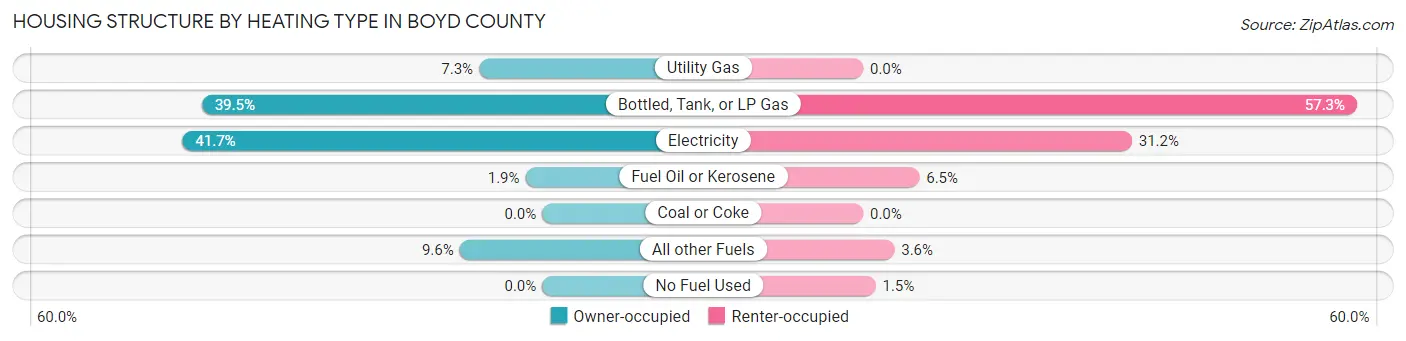
| Heating Type | Owner-occupied | Renter-occupied |
| Utility Gas | 49 (7.3%) | 0 (0.0%) |
| Bottled, Tank, or LP Gas | 264 (39.5%) | 79 (57.3%) |
| Electricity | 279 (41.7%) | 43 (31.2%) |
| Fuel Oil or Kerosene | 13 (1.9%) | 9 (6.5%) |
| Coal or Coke | 0 (0.0%) | 0 (0.0%) |
| All other Fuels | 64 (9.6%) | 5 (3.6%) |
| No Fuel Used | 0 (0.0%) | 2 (1.5%) |
| Total | 669 (100.0%) | 138 (100.0%) |
Household Vehicle Usage in Boyd County
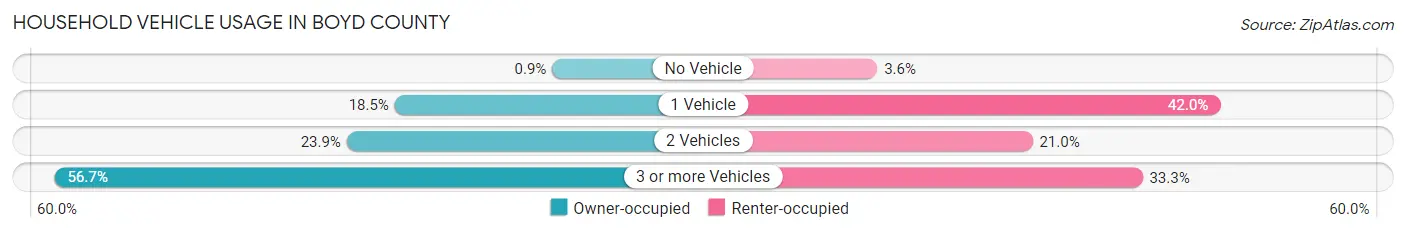
| Vehicles per Household | Owner-occupied | Renter-occupied |
| No Vehicle | 6 (0.9%) | 5 (3.6%) |
| 1 Vehicle | 124 (18.5%) | 58 (42.0%) |
| 2 Vehicles | 160 (23.9%) | 29 (21.0%) |
| 3 or more Vehicles | 379 (56.7%) | 46 (33.3%) |
| Total | 669 (100.0%) | 138 (100.0%) |
Real Estate & Mortgages in Boyd County
Real Estate and Mortgage Overview in Boyd County
| Characteristic | Without Mortgage | With Mortgage |
| Housing Units | 502 | 167 |
| Median Property Value | $82,600 | $154,200 |
| Median Household Income | $52,500 | $6 |
| Monthly Housing Costs | $496 | $40 |
| Real Estate Taxes | $944 | $3 |
Property Value by Mortgage Status in Boyd County
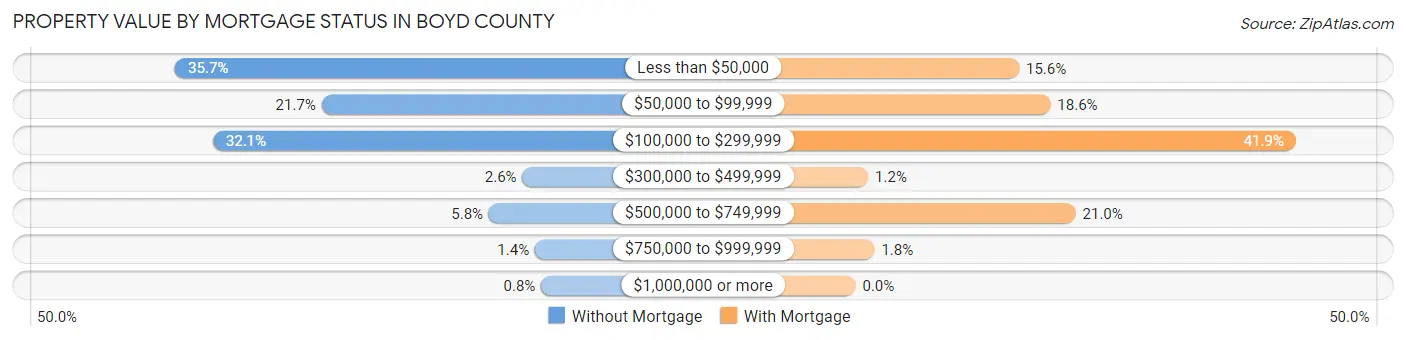
| Property Value | Without Mortgage | With Mortgage |
| Less than $50,000 | 179 (35.7%) | 26 (15.6%) |
| $50,000 to $99,999 | 109 (21.7%) | 31 (18.6%) |
| $100,000 to $299,999 | 161 (32.1%) | 70 (41.9%) |
| $300,000 to $499,999 | 13 (2.6%) | 2 (1.2%) |
| $500,000 to $749,999 | 29 (5.8%) | 35 (21.0%) |
| $750,000 to $999,999 | 7 (1.4%) | 3 (1.8%) |
| $1,000,000 or more | 4 (0.8%) | 0 (0.0%) |
| Total | 502 (100.0%) | 167 (100.0%) |
Household Income by Mortgage Status in Boyd County
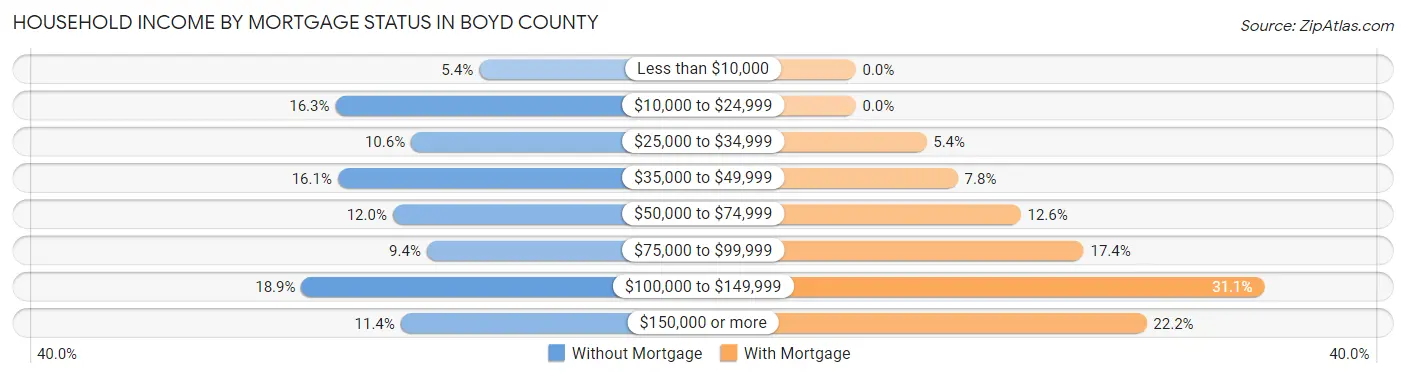
| Household Income | Without Mortgage | With Mortgage |
| Less than $10,000 | 27 (5.4%) | 0 (0.0%) |
| $10,000 to $24,999 | 82 (16.3%) | 0 (0.0%) |
| $25,000 to $34,999 | 53 (10.6%) | 9 (5.4%) |
| $35,000 to $49,999 | 81 (16.1%) | 13 (7.8%) |
| $50,000 to $74,999 | 60 (11.9%) | 21 (12.6%) |
| $75,000 to $99,999 | 47 (9.4%) | 29 (17.4%) |
| $100,000 to $149,999 | 95 (18.9%) | 52 (31.1%) |
| $150,000 or more | 57 (11.4%) | 37 (22.2%) |
| Total | 502 (100.0%) | 167 (100.0%) |
Property Value to Household Income Ratio in Boyd County
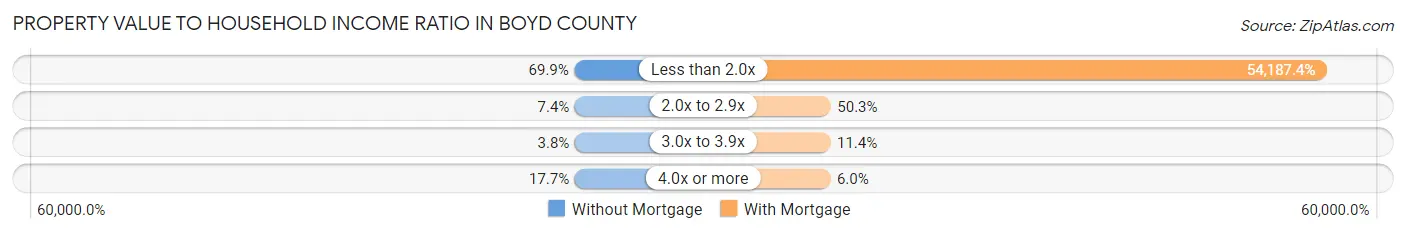
| Value-to-Income Ratio | Without Mortgage | With Mortgage |
| Less than 2.0x | 351 (69.9%) | 90,493 (54,187.4%) |
| 2.0x to 2.9x | 37 (7.4%) | 84 (50.3%) |
| 3.0x to 3.9x | 19 (3.8%) | 19 (11.4%) |
| 4.0x or more | 89 (17.7%) | 10 (6.0%) |
| Total | 502 (100.0%) | 167 (100.0%) |
Real Estate Taxes by Mortgage Status in Boyd County
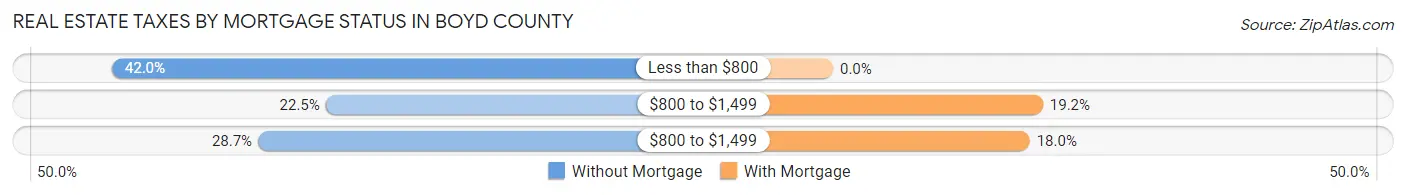
| Property Taxes | Without Mortgage | With Mortgage |
| Less than $800 | 211 (42.0%) | 0 (0.0%) |
| $800 to $1,499 | 113 (22.5%) | 32 (19.2%) |
| $800 to $1,499 | 144 (28.7%) | 30 (18.0%) |
| Total | 502 (100.0%) | 167 (100.0%) |
Health & Disability in Boyd County
Health Insurance Coverage by Age in Boyd County
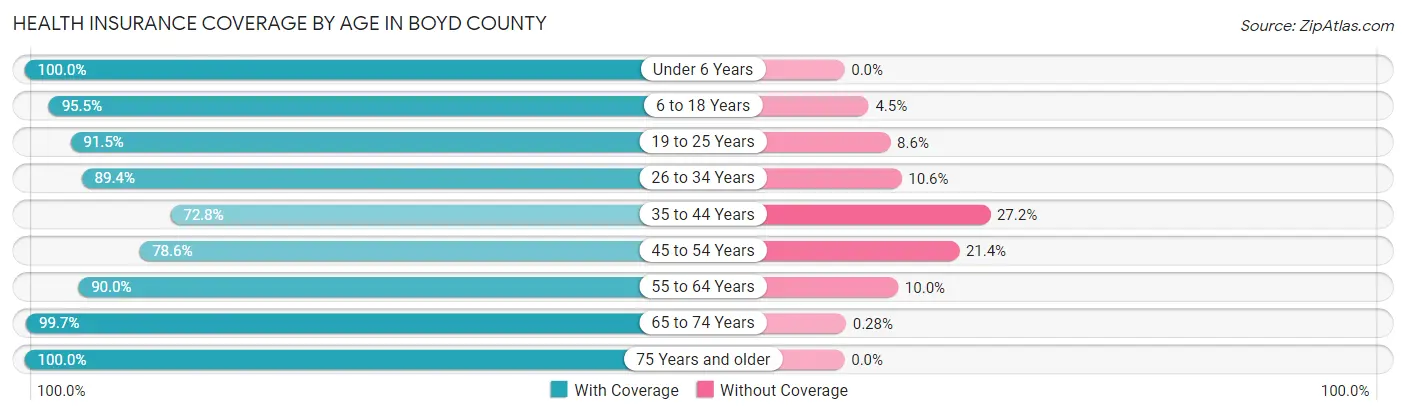
| Age Bracket | With Coverage | Without Coverage |
| Under 6 Years | 84 (100.0%) | 0 (0.0%) |
| 6 to 18 Years | 233 (95.5%) | 11 (4.5%) |
| 19 to 25 Years | 107 (91.4%) | 10 (8.6%) |
| 26 to 34 Years | 84 (89.4%) | 10 (10.6%) |
| 35 to 44 Years | 134 (72.8%) | 50 (27.2%) |
| 45 to 54 Years | 114 (78.6%) | 31 (21.4%) |
| 55 to 64 Years | 279 (90.0%) | 31 (10.0%) |
| 65 to 74 Years | 352 (99.7%) | 1 (0.3%) |
| 75 Years and older | 208 (100.0%) | 0 (0.0%) |
| Total | 1,595 (91.7%) | 144 (8.3%) |
Health Insurance Coverage by Citizenship Status in Boyd County
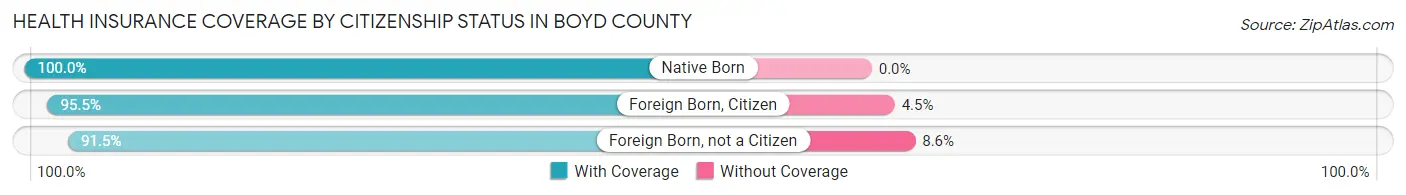
| Citizenship Status | With Coverage | Without Coverage |
| Native Born | 84 (100.0%) | 0 (0.0%) |
| Foreign Born, Citizen | 233 (95.5%) | 11 (4.5%) |
| Foreign Born, not a Citizen | 107 (91.4%) | 10 (8.6%) |
Health Insurance Coverage by Household Income in Boyd County
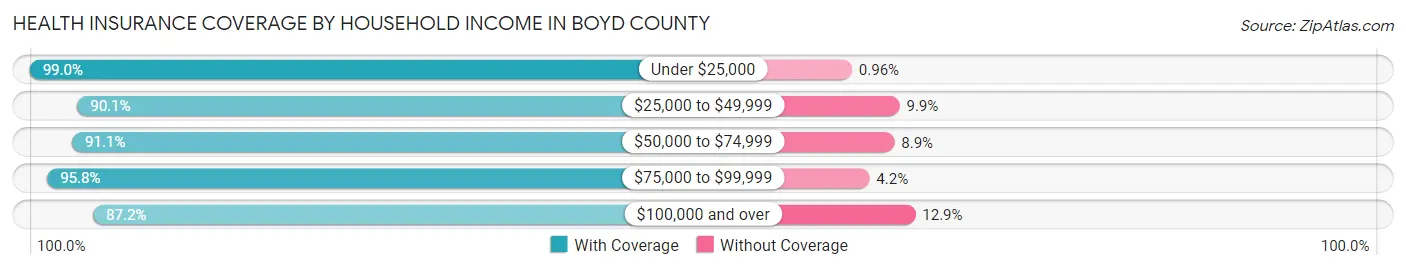
| Household Income | With Coverage | Without Coverage |
| Under $25,000 | 207 (99.0%) | 2 (1.0%) |
| $25,000 to $49,999 | 310 (90.1%) | 34 (9.9%) |
| $50,000 to $74,999 | 317 (91.1%) | 31 (8.9%) |
| $75,000 to $99,999 | 361 (95.8%) | 16 (4.2%) |
| $100,000 and over | 400 (87.2%) | 59 (12.9%) |
Public vs Private Health Insurance Coverage by Age in Boyd County
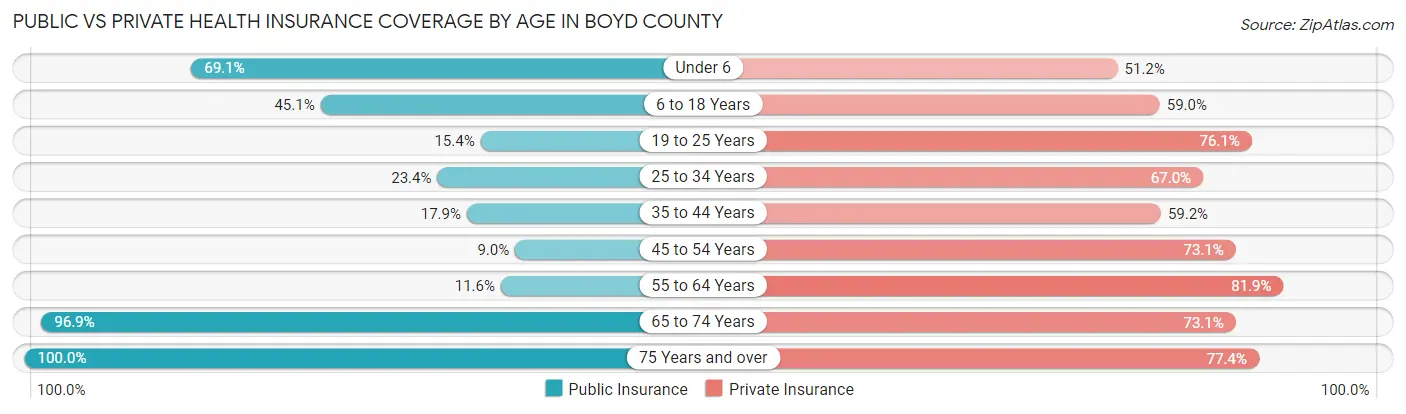
| Age Bracket | Public Insurance | Private Insurance |
| Under 6 | 58 (69.1%) | 43 (51.2%) |
| 6 to 18 Years | 110 (45.1%) | 144 (59.0%) |
| 19 to 25 Years | 18 (15.4%) | 89 (76.1%) |
| 25 to 34 Years | 22 (23.4%) | 63 (67.0%) |
| 35 to 44 Years | 33 (17.9%) | 109 (59.2%) |
| 45 to 54 Years | 13 (9.0%) | 106 (73.1%) |
| 55 to 64 Years | 36 (11.6%) | 254 (81.9%) |
| 65 to 74 Years | 342 (96.9%) | 258 (73.1%) |
| 75 Years and over | 208 (100.0%) | 161 (77.4%) |
| Total | 840 (48.3%) | 1,227 (70.6%) |
Disability Status by Sex by Age in Boyd County
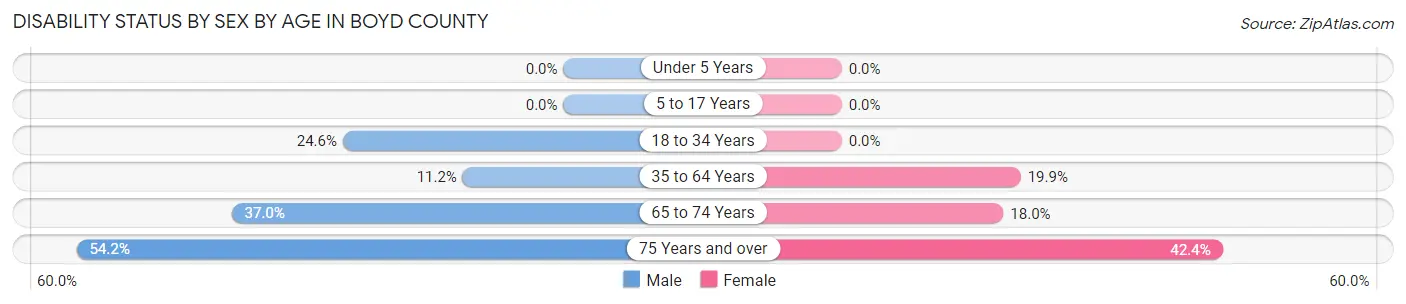
| Age Bracket | Male | Female |
| Under 5 Years | 0 (0.0%) | 0 (0.0%) |
| 5 to 17 Years | 0 (0.0%) | 0 (0.0%) |
| 18 to 34 Years | 28 (24.6%) | 0 (0.0%) |
| 35 to 64 Years | 39 (11.2%) | 58 (19.9%) |
| 65 to 74 Years | 75 (36.9%) | 27 (18.0%) |
| 75 Years and over | 45 (54.2%) | 53 (42.4%) |
Disability Class by Sex by Age in Boyd County
Disability Class: Hearing Difficulty
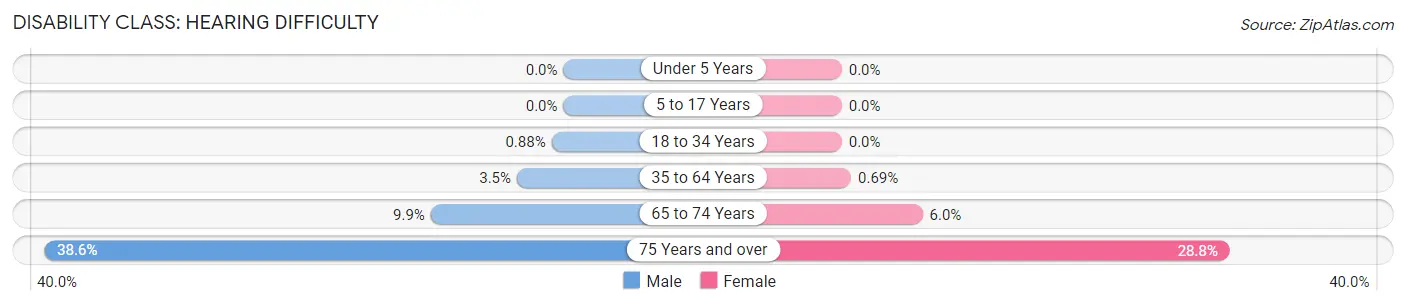
| Age Bracket | Male | Female |
| Under 5 Years | 0 (0.0%) | 0 (0.0%) |
| 5 to 17 Years | 0 (0.0%) | 0 (0.0%) |
| 18 to 34 Years | 1 (0.9%) | 0 (0.0%) |
| 35 to 64 Years | 12 (3.5%) | 2 (0.7%) |
| 65 to 74 Years | 20 (9.9%) | 9 (6.0%) |
| 75 Years and over | 32 (38.6%) | 36 (28.8%) |
Disability Class: Vision Difficulty
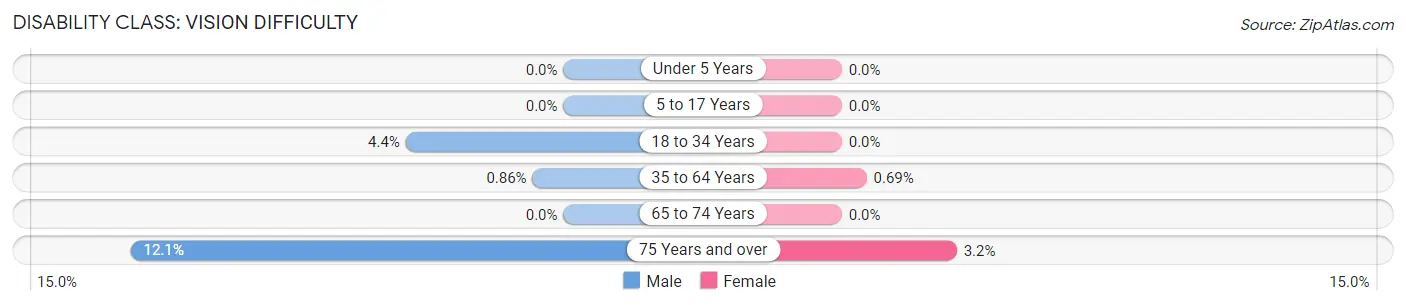
| Age Bracket | Male | Female |
| Under 5 Years | 0 (0.0%) | 0 (0.0%) |
| 5 to 17 Years | 0 (0.0%) | 0 (0.0%) |
| 18 to 34 Years | 5 (4.4%) | 0 (0.0%) |
| 35 to 64 Years | 3 (0.9%) | 2 (0.7%) |
| 65 to 74 Years | 0 (0.0%) | 0 (0.0%) |
| 75 Years and over | 10 (12.0%) | 4 (3.2%) |
Disability Class: Cognitive Difficulty
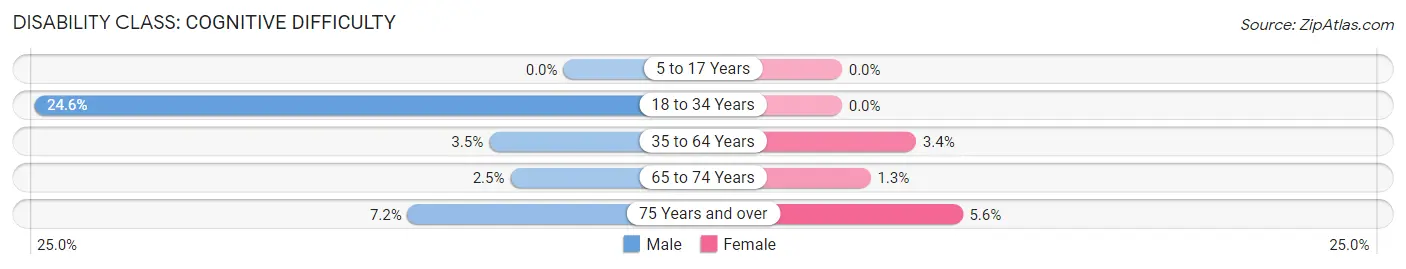
| Age Bracket | Male | Female |
| 5 to 17 Years | 0 (0.0%) | 0 (0.0%) |
| 18 to 34 Years | 28 (24.6%) | 0 (0.0%) |
| 35 to 64 Years | 12 (3.5%) | 10 (3.4%) |
| 65 to 74 Years | 5 (2.5%) | 2 (1.3%) |
| 75 Years and over | 6 (7.2%) | 7 (5.6%) |
Disability Class: Ambulatory Difficulty
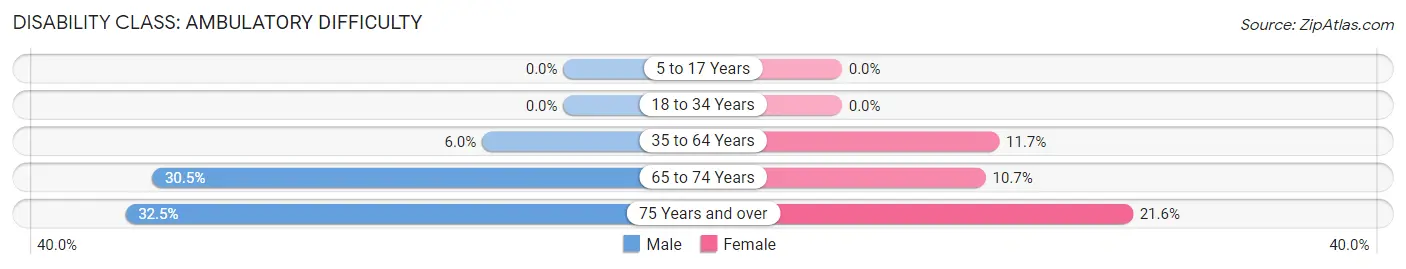
| Age Bracket | Male | Female |
| 5 to 17 Years | 0 (0.0%) | 0 (0.0%) |
| 18 to 34 Years | 0 (0.0%) | 0 (0.0%) |
| 35 to 64 Years | 21 (6.0%) | 34 (11.7%) |
| 65 to 74 Years | 62 (30.5%) | 16 (10.7%) |
| 75 Years and over | 27 (32.5%) | 27 (21.6%) |
Disability Class: Self-Care Difficulty
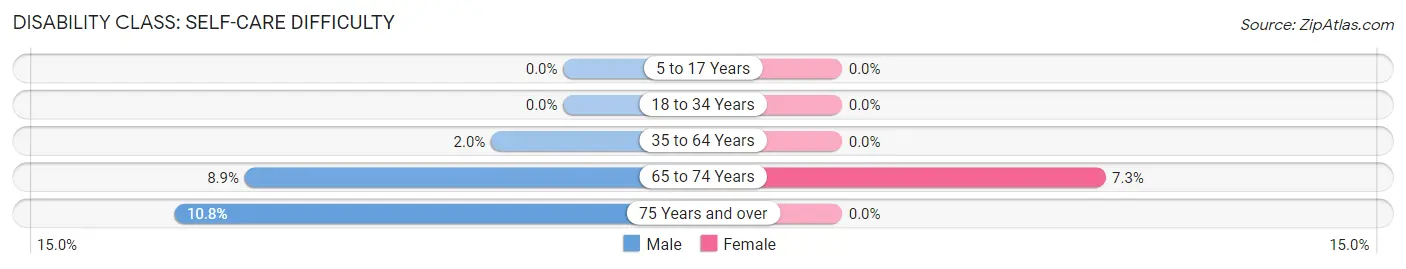
| Age Bracket | Male | Female |
| 5 to 17 Years | 0 (0.0%) | 0 (0.0%) |
| 18 to 34 Years | 0 (0.0%) | 0 (0.0%) |
| 35 to 64 Years | 7 (2.0%) | 0 (0.0%) |
| 65 to 74 Years | 18 (8.9%) | 11 (7.3%) |
| 75 Years and over | 9 (10.8%) | 0 (0.0%) |
Technology Access in Boyd County
Computing Device Access in Boyd County
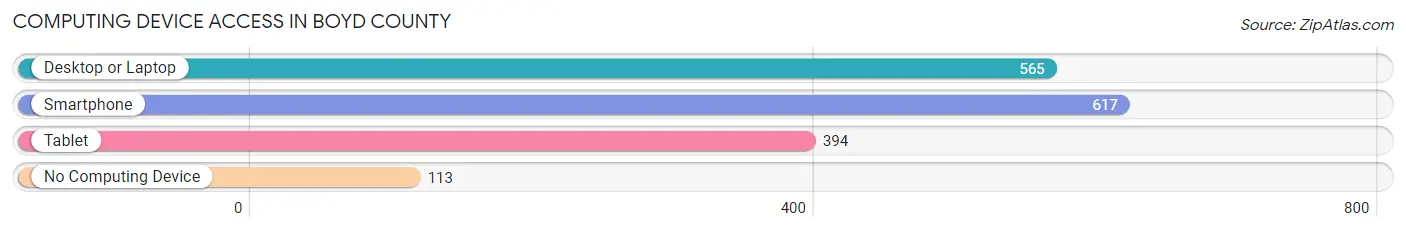
| Device Type | # Households | % Households |
| Desktop or Laptop | 565 | 70.0% |
| Smartphone | 617 | 76.5% |
| Tablet | 394 | 48.8% |
| No Computing Device | 113 | 14.0% |
| Total | 807 | 100.0% |
Internet Access in Boyd County
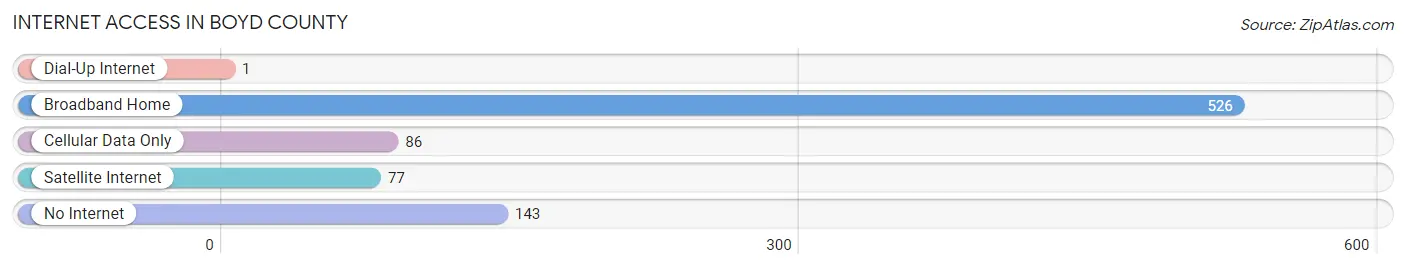
| Internet Type | # Households | % Households |
| Dial-Up Internet | 1 | 0.1% |
| Broadband Home | 526 | 65.2% |
| Cellular Data Only | 86 | 10.7% |
| Satellite Internet | 77 | 9.5% |
| No Internet | 143 | 17.7% |
| Total | 807 | 100.0% |
Boyd County Summary
Boyd County is located in the northeastern corner of Nebraska, and is bordered by South Dakota to the north, Cedar County to the east, Holt County to the south, and Keya Paha County to the west. The county seat is Spencer, and the county was named after former Nebraska Governor Charles H. Boyd. Boyd County has a total area of 576 square miles, of which 575 square miles is land and 1 square mile is water.
Geography
Boyd County is located in the Sandhills region of Nebraska, and is characterized by rolling hills and grasslands. The terrain is generally flat, with elevations ranging from 1,800 to 2,400 feet above sea level. The county is drained by the Niobrara River, which flows through the northern part of the county. The county is also home to several small lakes, including Lake Alice, Lake McConaughy, and Lake Ogallala.
Climate
Boyd County has a semi-arid climate, with hot summers and cold winters. The average annual temperature is 50°F, and the average annual precipitation is 20 inches.
Demographics
As of the 2010 census, Boyd County had a population of 5,541. The racial makeup of the county was 95.2% White, 0.3% African American, 0.7% Native American, 0.2% Asian, 0.1% Pacific Islander, 2.2% from other races, and 1.4% from two or more races. Hispanic or Latino of any race were 4.2% of the population.
Economy
Boyd County is primarily an agricultural county, with the majority of the population employed in farming and ranching. The county is also home to several small businesses, including a lumber yard, a feed store, and a hardware store. The county is also home to several wind farms, which provide a significant source of income for the county.
Education
Boyd County is served by the Boyd County Public Schools, which includes two elementary schools, one middle school, and one high school. The county is also home to several private schools, including a Catholic school and a Lutheran school.
Conclusion
Boyd County is a rural county located in the northeastern corner of Nebraska. The county is characterized by rolling hills and grasslands, and is primarily an agricultural county. The county has a population of 5,541, and is served by the Boyd County Public Schools. The county is also home to several small businesses and wind farms, which provide a significant source of income for the county.
Common Questions
What is Per Capita Income in Boyd County?
Per Capita income in Boyd County is $35,198.
What is the Median Family Income in Boyd County?
Median Family Income in Boyd County is $82,292.
What is the Median Household income in Boyd County?
Median Household Income in Boyd County is $57,120.
What is Income or Wage Gap in Boyd County?
Income or Wage Gap in Boyd County is 50.4%.
Women in Boyd County earn 49.6 cents for every dollar earned by a man.
What is Inequality or Gini Index in Boyd County?
Inequality or Gini Index in Boyd County is 0.42.
What is the Total Population of Boyd County?
Total Population of Boyd County is 1,767.
What is the Total Male Population of Boyd County?
Total Male Population of Boyd County is 918.
What is the Total Female Population of Boyd County?
Total Female Population of Boyd County is 849.
What is the Ratio of Males per 100 Females in Boyd County?
There are 108.13 Males per 100 Females in Boyd County.
What is the Ratio of Females per 100 Males in Boyd County?
There are 92.48 Females per 100 Males in Boyd County.
What is the Median Population Age in Boyd County?
Median Population Age in Boyd County is 55.6 Years.
What is the Average Family Size in Boyd County
Average Family Size in Boyd County is 2.7 People.
What is the Average Household Size in Boyd County
Average Household Size in Boyd County is 2.1 People.
How Large is the Labor Force in Boyd County?
There are 876 People in the Labor Forcein in Boyd County.
What is the Percentage of People in the Labor Force in Boyd County?
59.9% of People are in the Labor Force in Boyd County.
What is the Unemployment Rate in Boyd County?
Unemployment Rate in Boyd County is 1.8%.