Blaine County, NE Map & Demographics
Blaine County Map
Blaine County Overview
$40,093
PER CAPITA INCOME
$56,000
AVG FAMILY INCOME
$52,083
AVG HOUSEHOLD INCOME
19.2%
WAGE / INCOME GAP [ % ]
80.8¢/ $1
WAGE / INCOME GAP [ $ ]
0.51
INEQUALITY / GINI INDEX
384
TOTAL POPULATION
204
MALE POPULATION
180
FEMALE POPULATION
113.33
MALES / 100 FEMALES
88.24
FEMALES / 100 MALES
57.7
MEDIAN AGE
2.5
AVG FAMILY SIZE
1.9
AVG HOUSEHOLD SIZE
210
LABOR FORCE [ PEOPLE ]
64.2%
PERCENT IN LABOR FORCE
1.9%
UNEMPLOYMENT RATE
Blaine County Area Codes
Income in Blaine County
Income Overview in Blaine County
Per Capita Income in Blaine County is $40,093, while median incomes of families and households are $56,000 and $52,083 respectively.
| Characteristic | Number | Measure |
| Per Capita Income | 384 | $40,093 |
| Median Family Income | 122 | $56,000 |
| Mean Family Income | 122 | $69,948 |
| Median Household Income | 201 | $52,083 |
| Mean Household Income | 201 | $77,028 |
| Income Deficit | 122 | $0 |
| Wage / Income Gap (%) | 384 | 19.23% |
| Wage / Income Gap ($) | 384 | 80.77¢ per $1 |
| Gini / Inequality Index | 384 | 0.51 |
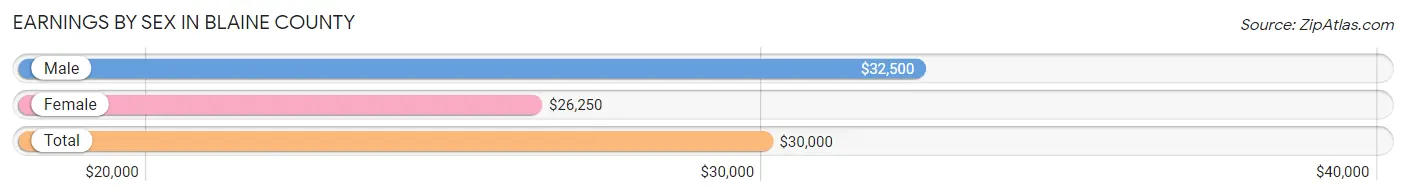
Earnings by Sex in Blaine County
Average Earnings in Blaine County are $30,000, $32,500 for men and $26,250 for women, a difference of 19.2%.
| Sex | Number | Average Earnings |
| Male | 136 (64.1%) | $32,500 |
| Female | 76 (35.8%) | $26,250 |
| Total | 212 (100.0%) | $30,000 |
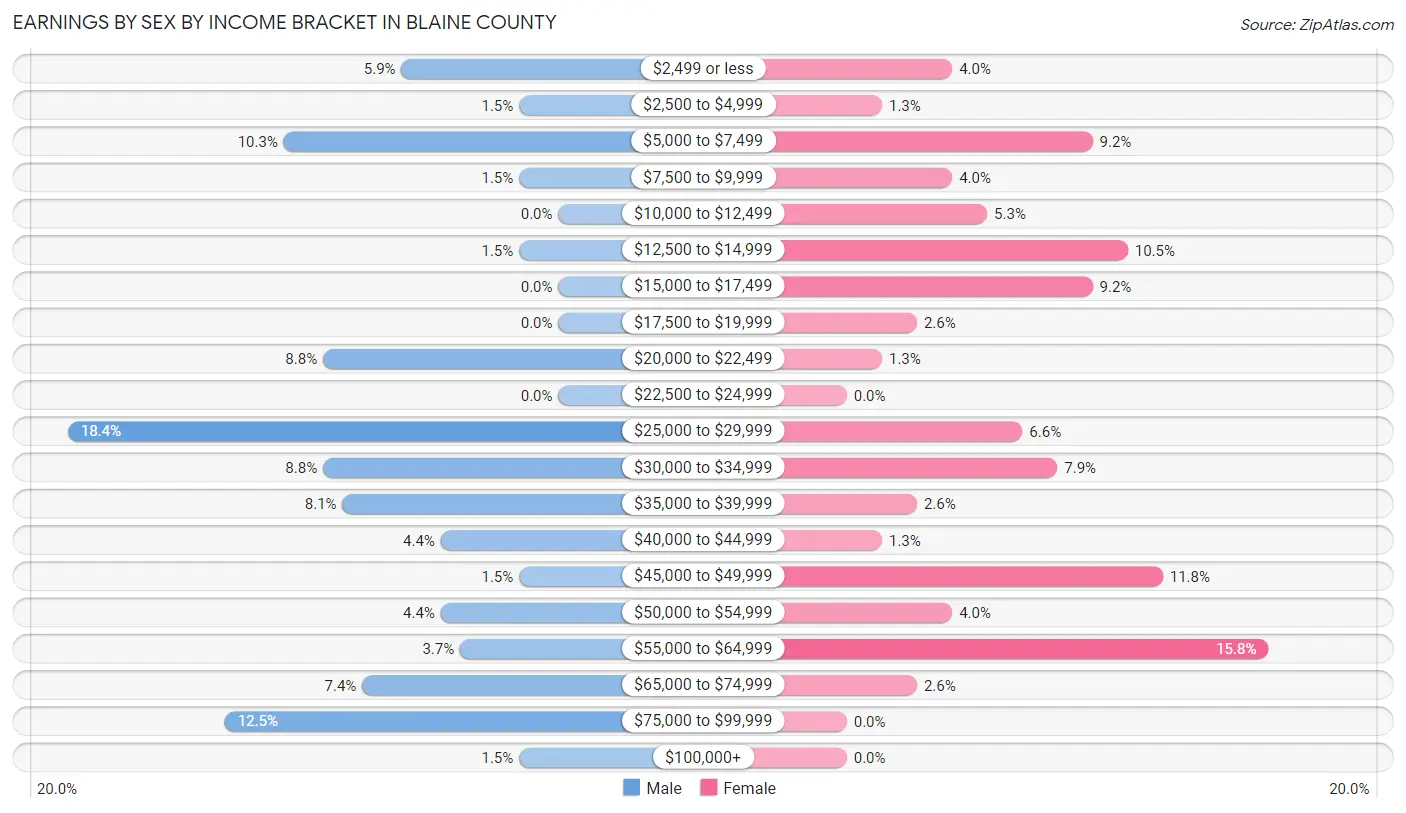
Earnings by Sex by Income Bracket in Blaine County
The most common earnings brackets in Blaine County are $25,000 to $29,999 for men (25 | 18.4%) and $55,000 to $64,999 for women (12 | 15.8%).
| Income | Male | Female |
| $2,499 or less | 8 (5.9%) | 3 (4.0%) |
| $2,500 to $4,999 | 2 (1.5%) | 1 (1.3%) |
| $5,000 to $7,499 | 14 (10.3%) | 7 (9.2%) |
| $7,500 to $9,999 | 2 (1.5%) | 3 (4.0%) |
| $10,000 to $12,499 | 0 (0.0%) | 4 (5.3%) |
| $12,500 to $14,999 | 2 (1.5%) | 8 (10.5%) |
| $15,000 to $17,499 | 0 (0.0%) | 7 (9.2%) |
| $17,500 to $19,999 | 0 (0.0%) | 2 (2.6%) |
| $20,000 to $22,499 | 12 (8.8%) | 1 (1.3%) |
| $22,500 to $24,999 | 0 (0.0%) | 0 (0.0%) |
| $25,000 to $29,999 | 25 (18.4%) | 5 (6.6%) |
| $30,000 to $34,999 | 12 (8.8%) | 6 (7.9%) |
| $35,000 to $39,999 | 11 (8.1%) | 2 (2.6%) |
| $40,000 to $44,999 | 6 (4.4%) | 1 (1.3%) |
| $45,000 to $49,999 | 2 (1.5%) | 9 (11.8%) |
| $50,000 to $54,999 | 6 (4.4%) | 3 (4.0%) |
| $55,000 to $64,999 | 5 (3.7%) | 12 (15.8%) |
| $65,000 to $74,999 | 10 (7.3%) | 2 (2.6%) |
| $75,000 to $99,999 | 17 (12.5%) | 0 (0.0%) |
| $100,000+ | 2 (1.5%) | 0 (0.0%) |
| Total | 136 (100.0%) | 76 (100.0%) |
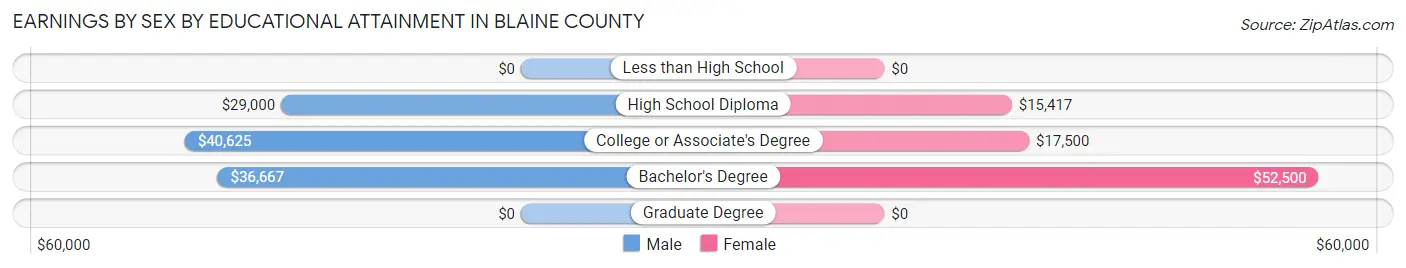
Earnings by Sex by Educational Attainment in Blaine County
Average earnings in Blaine County are $32,500 for men and $25,938 for women, a difference of 20.2%. Men with an educational attainment of college or associate's degree enjoy the highest average annual earnings of $40,625, while those with high school diploma education earn the least with $29,000. Women with an educational attainment of bachelor's degree earn the most with the average annual earnings of $52,500, while those with high school diploma education have the smallest earnings of $15,417.
| Educational Attainment | Male Income | Female Income |
| Less than High School | - | - |
| High School Diploma | $29,000 | $15,417 |
| College or Associate's Degree | $40,625 | $17,500 |
| Bachelor's Degree | $36,667 | $52,500 |
| Graduate Degree | - | - |
| Total | $32,500 | $25,938 |
Family Income in Blaine County
Family Income Brackets in Blaine County
According to the Blaine County family income data, there are 40 families falling into the $50,000 to $74,999 income range, which is the most common income bracket and makes up 32.8% of all families.
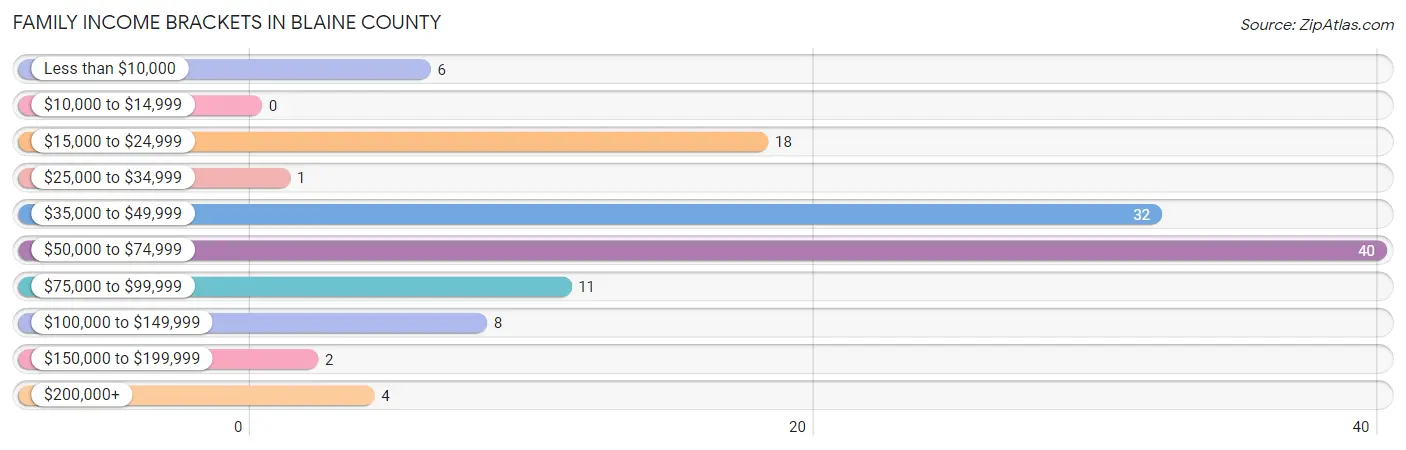
| Income Bracket | # Families | % Families |
| Less than $10,000 | 6 | 4.9% |
| $10,000 to $14,999 | 0 | 0.0% |
| $15,000 to $24,999 | 18 | 14.8% |
| $25,000 to $34,999 | 1 | 0.8% |
| $35,000 to $49,999 | 32 | 26.2% |
| $50,000 to $74,999 | 40 | 32.8% |
| $75,000 to $99,999 | 11 | 9.0% |
| $100,000 to $149,999 | 8 | 6.6% |
| $150,000 to $199,999 | 2 | 1.6% |
| $200,000+ | 4 | 3.3% |
Family Income by Famaliy Size in Blaine County
3-person families (13 | 10.7%) account for the highest median family income in Blaine County with $67,188 per family, while 2-person families (98 | 80.3%) have the highest median income of $23,618 per family member.
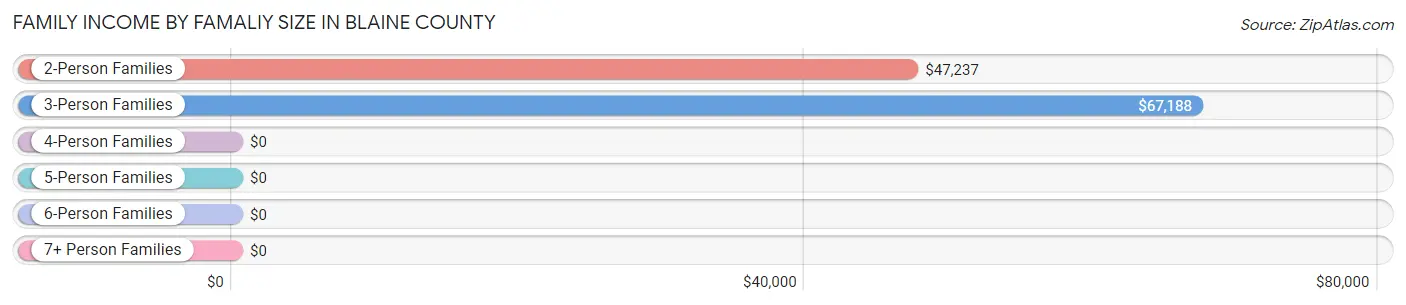
| Income Bracket | # Families | Median Income |
| 2-Person Families | 98 (80.3%) | $47,237 |
| 3-Person Families | 13 (10.7%) | $67,188 |
| 4-Person Families | 3 (2.5%) | $0 |
| 5-Person Families | 7 (5.7%) | $0 |
| 6-Person Families | 1 (0.8%) | $0 |
| 7+ Person Families | 0 (0.0%) | $0 |
| Total | 122 (100.0%) | $56,000 |
Family Income by Number of Earners in Blaine County
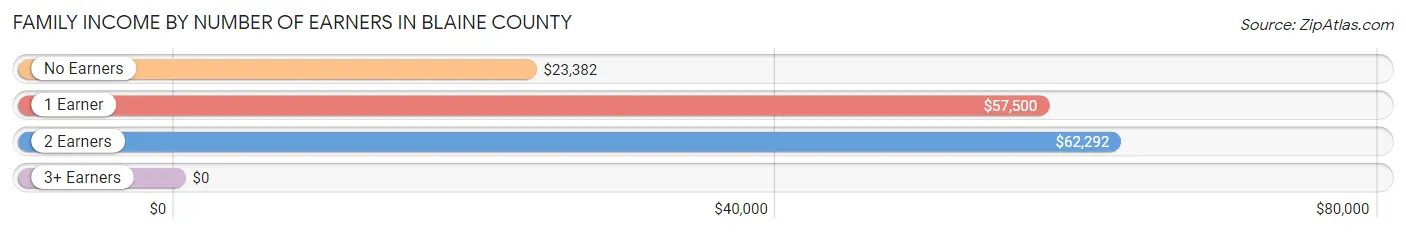
| Number of Earners | # Families | Median Income |
| No Earners | 24 (19.7%) | $23,382 |
| 1 Earner | 42 (34.4%) | $57,500 |
| 2 Earners | 53 (43.4%) | $62,292 |
| 3+ Earners | 3 (2.5%) | $0 |
| Total | 122 (100.0%) | $56,000 |
Household Income in Blaine County
Household Income Brackets in Blaine County
With 65 households falling in the category, the $50,000 to $74,999 income range is the most frequent in Blaine County, accounting for 32.3% of all households. In contrast, only 2 households (1.0%) fall into the $150,000 to $199,999 income bracket, making it the least populous group.
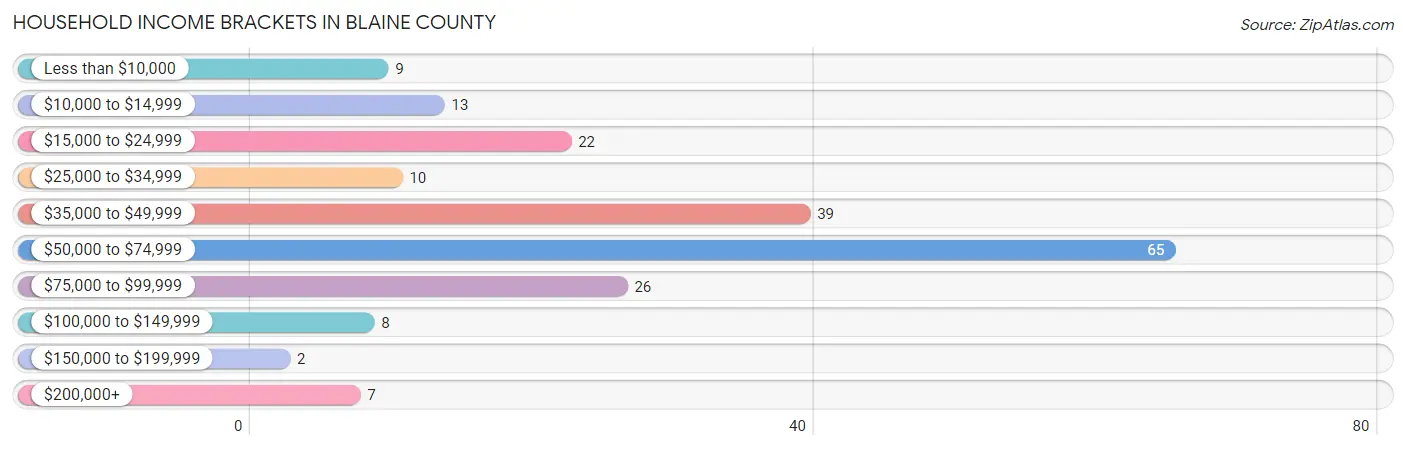
| Income Bracket | # Households | % Households |
| Less than $10,000 | 9 | 4.5% |
| $10,000 to $14,999 | 13 | 6.5% |
| $15,000 to $24,999 | 22 | 10.9% |
| $25,000 to $34,999 | 10 | 5.0% |
| $35,000 to $49,999 | 39 | 19.4% |
| $50,000 to $74,999 | 65 | 32.3% |
| $75,000 to $99,999 | 26 | 12.9% |
| $100,000 to $149,999 | 8 | 4.0% |
| $150,000 to $199,999 | 2 | 1.0% |
| $200,000+ | 7 | 3.5% |
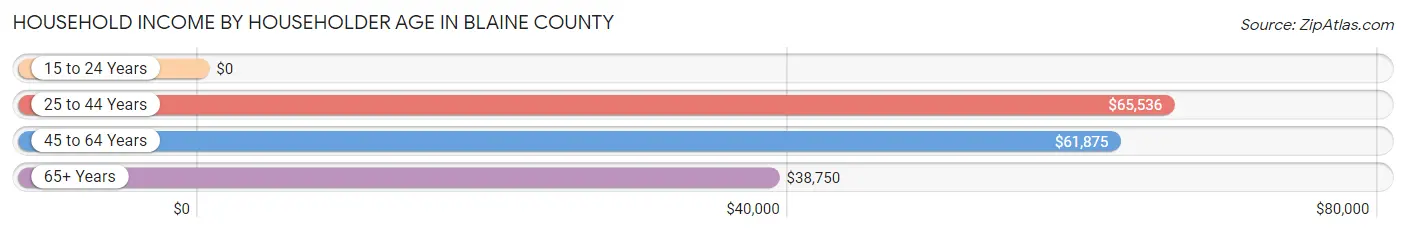
Household Income by Householder Age in Blaine County
The median household income in Blaine County is $52,083, with the highest median household income of $65,536 found in the 25 to 44 years age bracket for the primary householder. A total of 25 households (12.4%) fall into this category. Meanwhile, the 15 to 24 years age bracket for the primary householder has the lowest median household income of $0, with 5 households (2.5%) in this group.
| Income Bracket | # Households | Median Income |
| 15 to 24 Years | 5 (2.5%) | $0 |
| 25 to 44 Years | 25 (12.4%) | $65,536 |
| 45 to 64 Years | 72 (35.8%) | $61,875 |
| 65+ Years | 99 (49.2%) | $38,750 |
| Total | 201 (100.0%) | $52,083 |
Poverty in Blaine County
Income Below Poverty by Sex and Age in Blaine County
With 10.8% poverty level for males and 12.2% for females among the residents of Blaine County, 5 year old males and 18 to 24 year old females are the most vulnerable to poverty, with 3 males (100.0%) and 2 females (40.0%) in their respective age groups living below the poverty level.
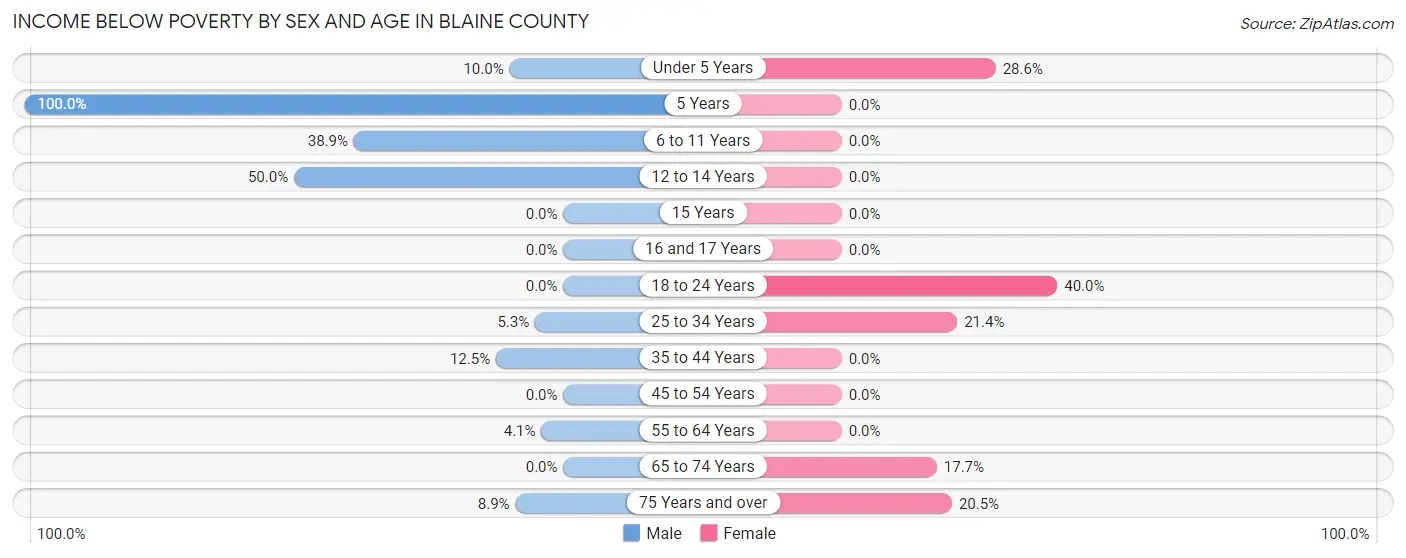
| Age Bracket | Male | Female |
| Under 5 Years | 1 (10.0%) | 2 (28.6%) |
| 5 Years | 3 (100.0%) | 0 (0.0%) |
| 6 to 11 Years | 7 (38.9%) | 0 (0.0%) |
| 12 to 14 Years | 2 (50.0%) | 0 (0.0%) |
| 15 Years | 0 (0.0%) | 0 (0.0%) |
| 16 and 17 Years | 0 (0.0%) | 0 (0.0%) |
| 18 to 24 Years | 0 (0.0%) | 2 (40.0%) |
| 25 to 34 Years | 1 (5.3%) | 3 (21.4%) |
| 35 to 44 Years | 2 (12.5%) | 0 (0.0%) |
| 45 to 54 Years | 0 (0.0%) | 0 (0.0%) |
| 55 to 64 Years | 2 (4.1%) | 0 (0.0%) |
| 65 to 74 Years | 0 (0.0%) | 6 (17.6%) |
| 75 Years and over | 4 (8.9%) | 9 (20.4%) |
| Total | 22 (10.8%) | 22 (12.2%) |
Income Above Poverty by Sex and Age in Blaine County
According to the poverty statistics in Blaine County, males aged 45 to 54 years and females aged 6 to 11 years are the age groups that are most secure financially, with 100.0% of males and 100.0% of females in these age groups living above the poverty line.
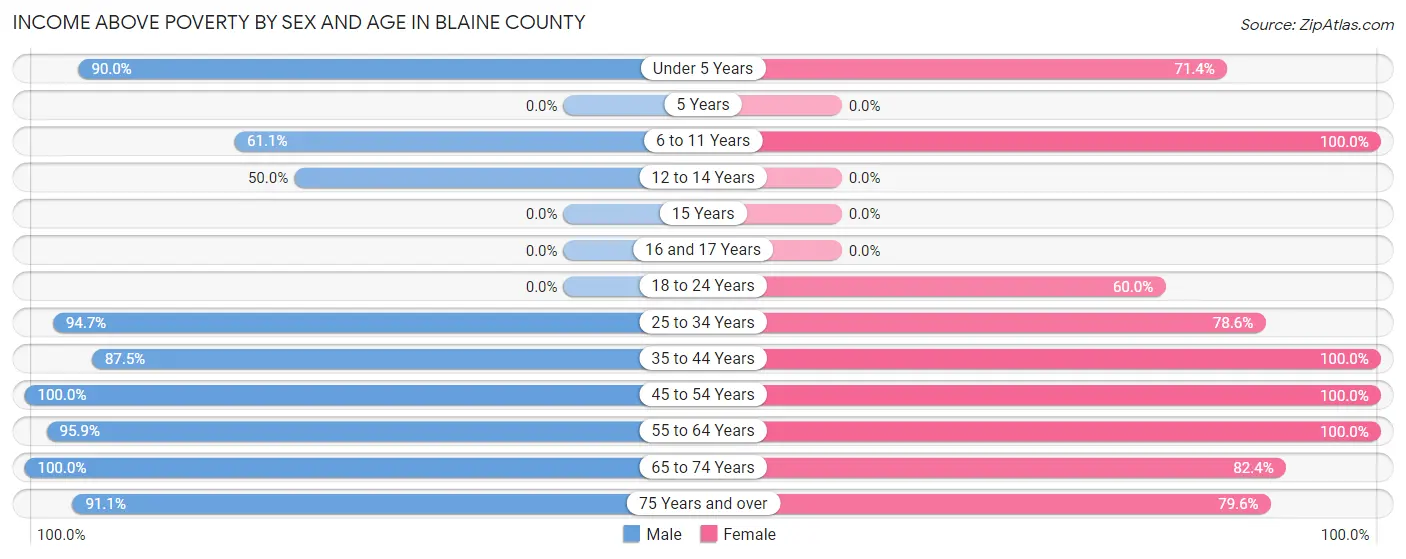
| Age Bracket | Male | Female |
| Under 5 Years | 9 (90.0%) | 5 (71.4%) |
| 5 Years | 0 (0.0%) | 0 (0.0%) |
| 6 to 11 Years | 11 (61.1%) | 15 (100.0%) |
| 12 to 14 Years | 2 (50.0%) | 0 (0.0%) |
| 15 Years | 0 (0.0%) | 0 (0.0%) |
| 16 and 17 Years | 0 (0.0%) | 0 (0.0%) |
| 18 to 24 Years | 0 (0.0%) | 3 (60.0%) |
| 25 to 34 Years | 18 (94.7%) | 11 (78.6%) |
| 35 to 44 Years | 14 (87.5%) | 15 (100.0%) |
| 45 to 54 Years | 19 (100.0%) | 18 (100.0%) |
| 55 to 64 Years | 47 (95.9%) | 28 (100.0%) |
| 65 to 74 Years | 21 (100.0%) | 28 (82.4%) |
| 75 Years and over | 41 (91.1%) | 35 (79.5%) |
| Total | 182 (89.2%) | 158 (87.8%) |
Income Below Poverty Among Married-Couple Families in Blaine County
The poverty statistics for married-couple families in Blaine County show that 4.2% or 5 of the total 120 families live below the poverty line. Families with 3 or 4 children have the highest poverty rate of 12.5%, comprising of 1 families. On the other hand, families with 1 or 2 children have the lowest poverty rate of 0.0%, which includes 0 families.
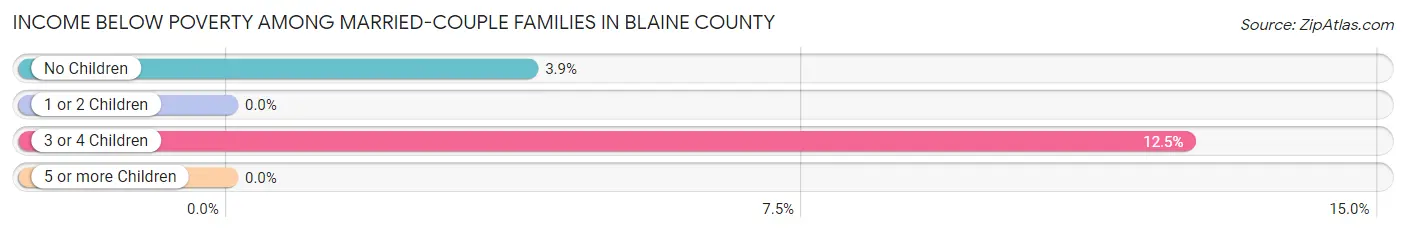
| Children | Above Poverty | Below Poverty |
| No Children | 98 (96.1%) | 4 (3.9%) |
| 1 or 2 Children | 10 (100.0%) | 0 (0.0%) |
| 3 or 4 Children | 7 (87.5%) | 1 (12.5%) |
| 5 or more Children | 0 (0.0%) | 0 (0.0%) |
| Total | 115 (95.8%) | 5 (4.2%) |
Income Below Poverty Among Single-Parent Households in Blaine County
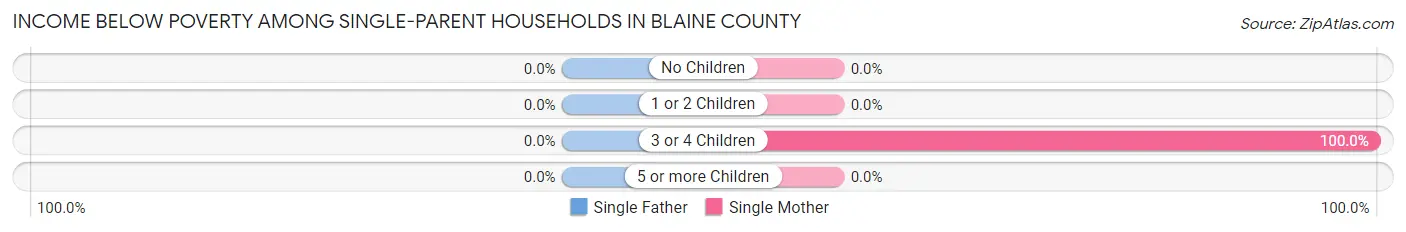
| Children | Single Father | Single Mother |
| No Children | 0 (0.0%) | 0 (0.0%) |
| 1 or 2 Children | 0 (0.0%) | 0 (0.0%) |
| 3 or 4 Children | 0 (0.0%) | 2 (100.0%) |
| 5 or more Children | 0 (0.0%) | 0 (0.0%) |
| Total | 0 (0.0%) | 2 (100.0%) |
Income Below Poverty Among Married-Couple vs Single-Parent Households in Blaine County
The poverty data for Blaine County shows that 5 of the married-couple family households (4.2%) and 2 of the single-parent households (100.0%) are living below the poverty level. Within the married-couple family households, those with 3 or 4 children have the highest poverty rate, with 1 households (12.5%) falling below the poverty line. Among the single-parent households, those with 3 or 4 children have the highest poverty rate, with 2 household (100.0%) living below poverty.
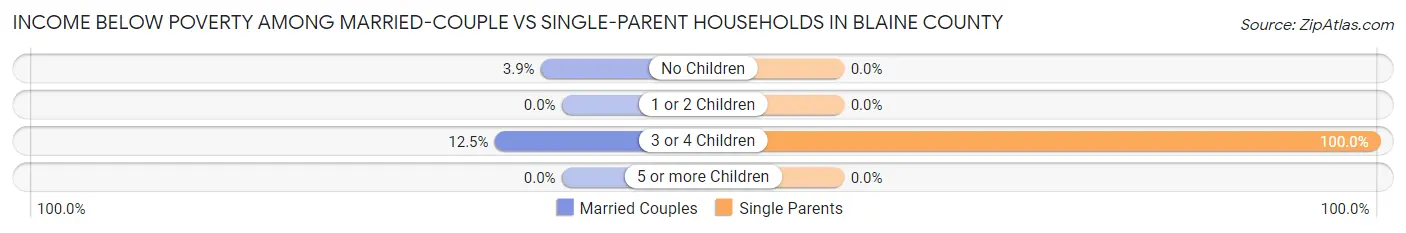
| Children | Married-Couple Families | Single-Parent Households |
| No Children | 4 (3.9%) | 0 (0.0%) |
| 1 or 2 Children | 0 (0.0%) | 0 (0.0%) |
| 3 or 4 Children | 1 (12.5%) | 2 (100.0%) |
| 5 or more Children | 0 (0.0%) | 0 (0.0%) |
| Total | 5 (4.2%) | 2 (100.0%) |
Race in Blaine County
The most populous races in Blaine County are , and White / Caucasian (384 | 100.0%).
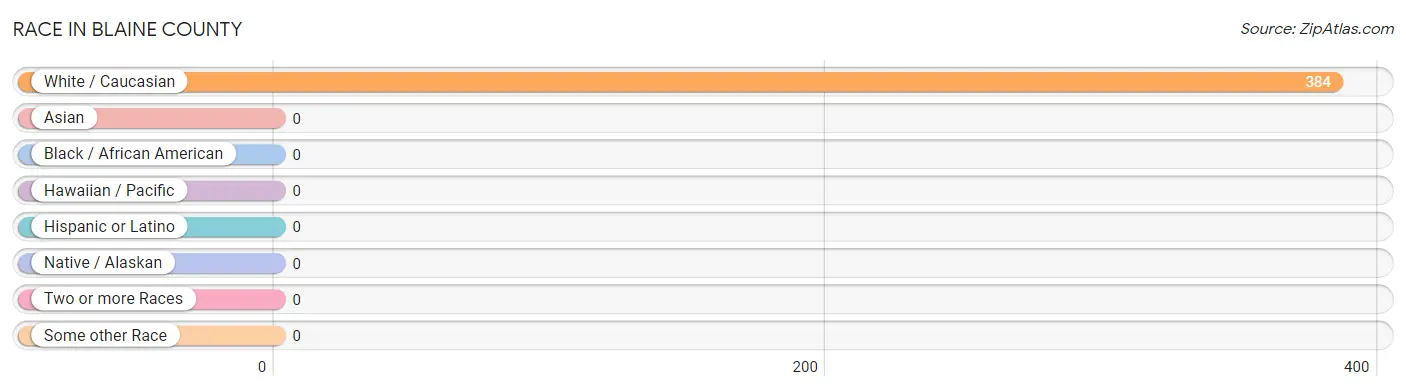
| Race | # Population | % Population |
| Asian | 0 | 0.0% |
| Black / African American | 0 | 0.0% |
| Hawaiian / Pacific | 0 | 0.0% |
| Hispanic or Latino | 0 | 0.0% |
| Native / Alaskan | 0 | 0.0% |
| White / Caucasian | 384 | 100.0% |
| Two or more Races | 0 | 0.0% |
| Some other Race | 0 | 0.0% |
| Total | 384 | 100.0% |
Ancestry in Blaine County
The most populous ancestries reported in Blaine County are German (172 | 44.8%), English (68 | 17.7%), Irish (40 | 10.4%), Scotch-Irish (30 | 7.8%), and Swedish (23 | 6.0%), together accounting for 86.7% of all Blaine County residents.
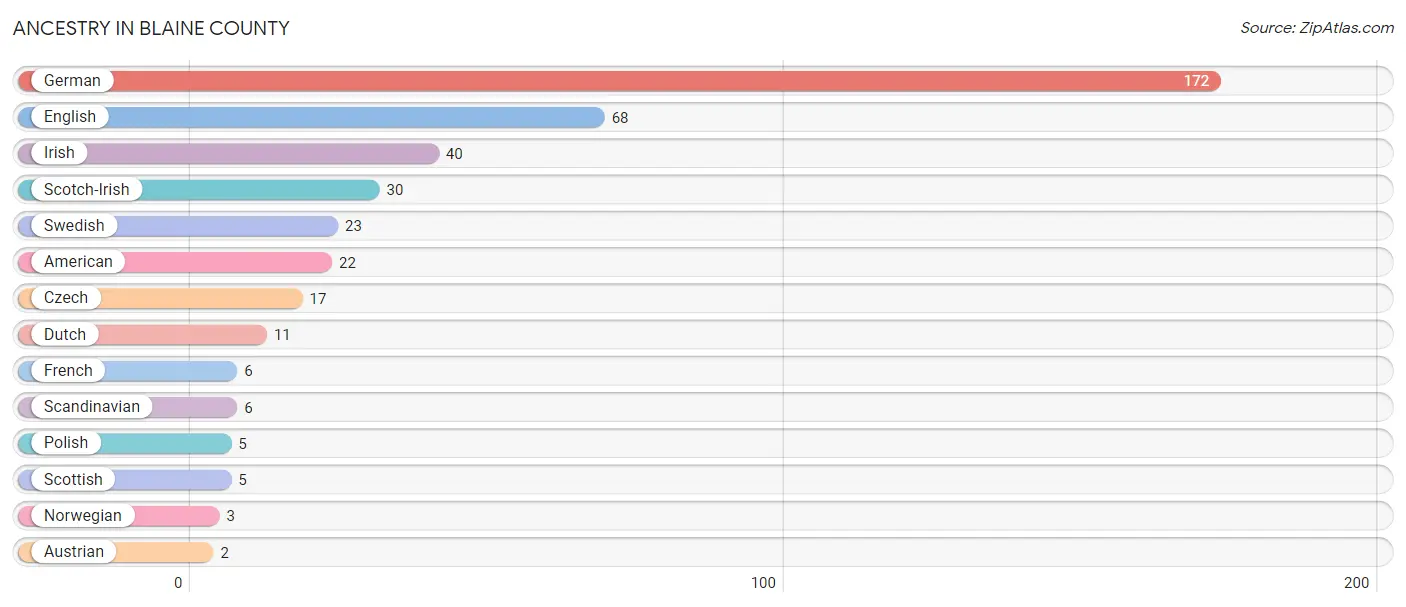
| Ancestry | # Population | % Population |
| American | 22 | 5.7% |
| Austrian | 2 | 0.5% |
| Czech | 17 | 4.4% |
| Dutch | 11 | 2.9% |
| English | 68 | 17.7% |
| French | 6 | 1.6% |
| German | 172 | 44.8% |
| Irish | 40 | 10.4% |
| Norwegian | 3 | 0.8% |
| Polish | 5 | 1.3% |
| Scandinavian | 6 | 1.6% |
| Scotch-Irish | 30 | 7.8% |
| Scottish | 5 | 1.3% |
| Swedish | 23 | 6.0% | View All 14 Rows |
Immigrants in Blaine County

| Immigration Origin | # Population | % Population | View All 0 Rows |
Sex and Age in Blaine County
Sex and Age in Blaine County
The most populous age groups in Blaine County are 55 to 59 Years (34 | 16.7%) for men and 65 to 69 Years (22 | 12.2%) for women.
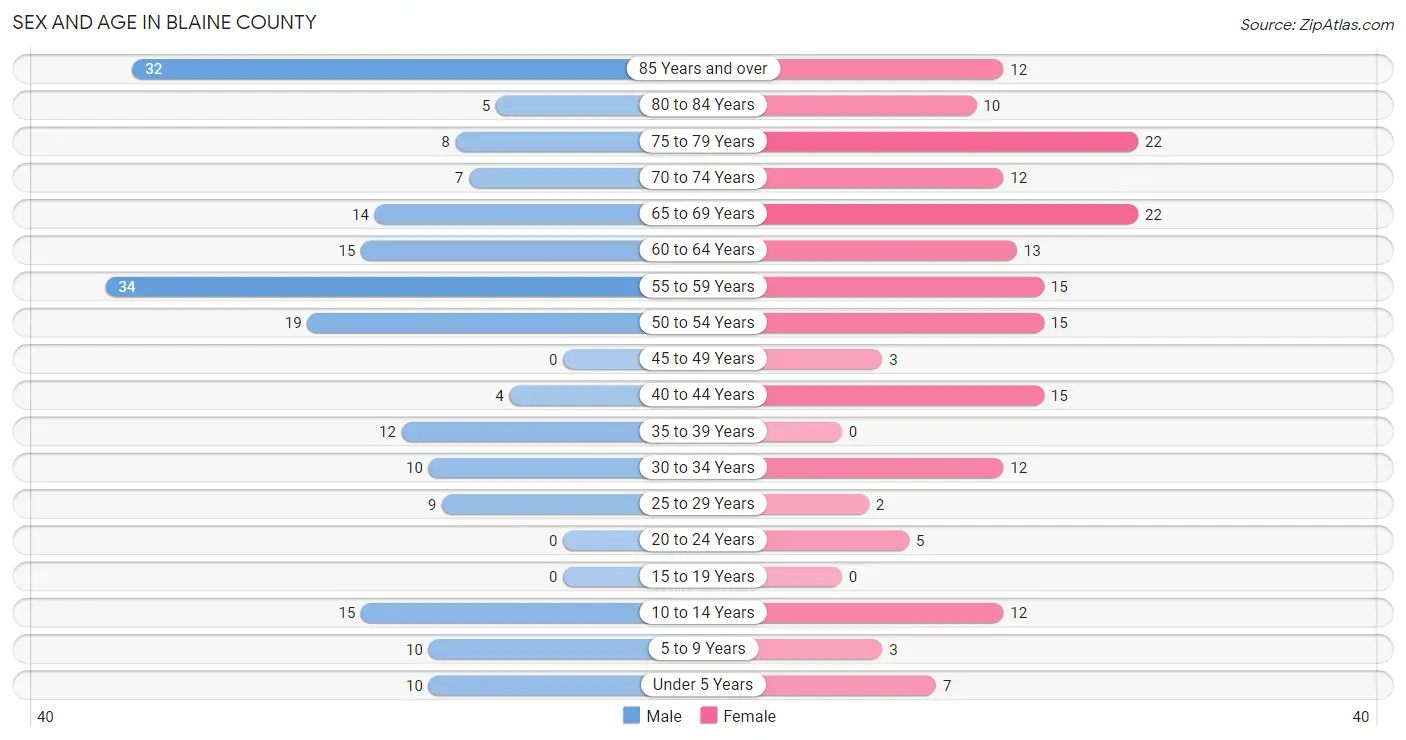
| Age Bracket | Male | Female |
| Under 5 Years | 10 (4.9%) | 7 (3.9%) |
| 5 to 9 Years | 10 (4.9%) | 3 (1.7%) |
| 10 to 14 Years | 15 (7.3%) | 12 (6.7%) |
| 15 to 19 Years | 0 (0.0%) | 0 (0.0%) |
| 20 to 24 Years | 0 (0.0%) | 5 (2.8%) |
| 25 to 29 Years | 9 (4.4%) | 2 (1.1%) |
| 30 to 34 Years | 10 (4.9%) | 12 (6.7%) |
| 35 to 39 Years | 12 (5.9%) | 0 (0.0%) |
| 40 to 44 Years | 4 (2.0%) | 15 (8.3%) |
| 45 to 49 Years | 0 (0.0%) | 3 (1.7%) |
| 50 to 54 Years | 19 (9.3%) | 15 (8.3%) |
| 55 to 59 Years | 34 (16.7%) | 15 (8.3%) |
| 60 to 64 Years | 15 (7.3%) | 13 (7.2%) |
| 65 to 69 Years | 14 (6.9%) | 22 (12.2%) |
| 70 to 74 Years | 7 (3.4%) | 12 (6.7%) |
| 75 to 79 Years | 8 (3.9%) | 22 (12.2%) |
| 80 to 84 Years | 5 (2.5%) | 10 (5.6%) |
| 85 Years and over | 32 (15.7%) | 12 (6.7%) |
| Total | 204 (100.0%) | 180 (100.0%) |
Families and Households in Blaine County
Median Family Size in Blaine County
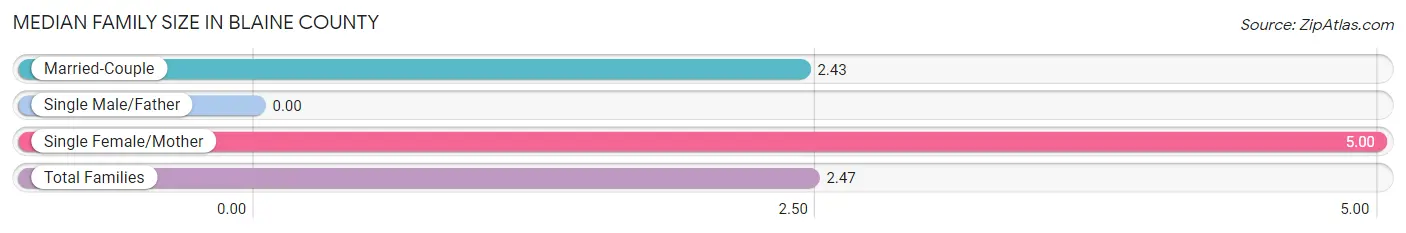
| Family Type | # Families | Family Size |
| Married-Couple | 120 (98.4%) | 2.43 |
| Single Male/Father | 0 (0.0%) | - |
| Single Female/Mother | 2 (1.6%) | 5.00 |
| Total Families | 122 (100.0%) | 2.47 |
Median Household Size in Blaine County
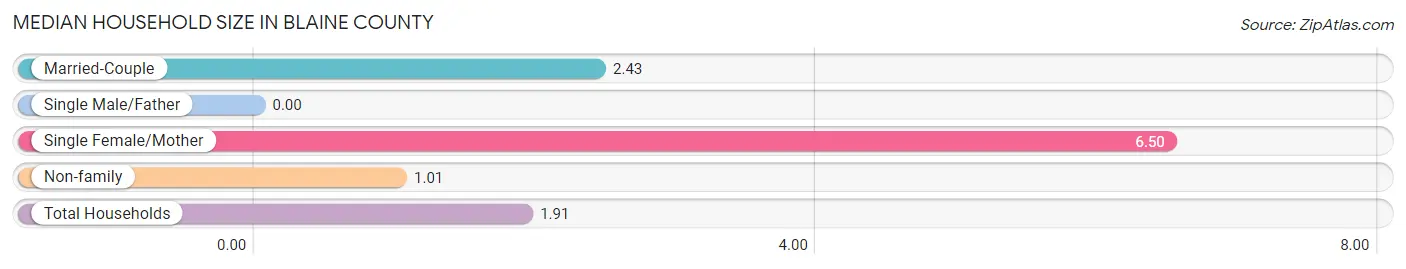
| Household Type | # Households | Household Size |
| Married-Couple | 120 (59.7%) | 2.43 |
| Single Male/Father | 0 (0.0%) | - |
| Single Female/Mother | 2 (1.0%) | 6.50 |
| Non-family | 79 (39.3%) | 1.01 |
| Total Households | 201 (100.0%) | 1.91 |
Household Size by Marriage Status in Blaine County
Out of a total of 201 households in Blaine County, 122 (60.7%) are family households, while 79 (39.3%) are nonfamily households. The most numerous type of family households are 2-person households, comprising 98, and the most common type of nonfamily households are 1-person households, comprising 76.
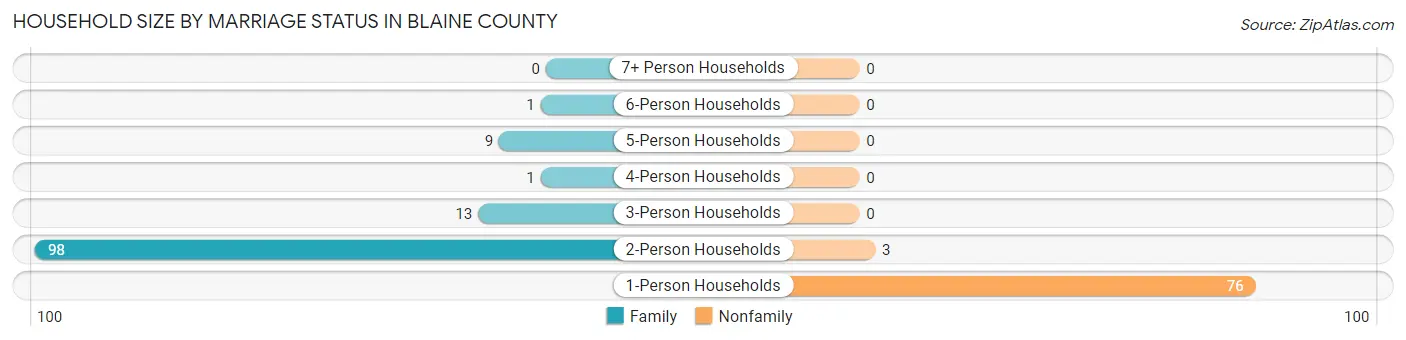
| Household Size | Family Households | Nonfamily Households |
| 1-Person Households | - | 76 (37.8%) |
| 2-Person Households | 98 (48.8%) | 3 (1.5%) |
| 3-Person Households | 13 (6.5%) | 0 (0.0%) |
| 4-Person Households | 1 (0.5%) | 0 (0.0%) |
| 5-Person Households | 9 (4.5%) | 0 (0.0%) |
| 6-Person Households | 1 (0.5%) | 0 (0.0%) |
| 7+ Person Households | 0 (0.0%) | 0 (0.0%) |
| Total | 122 (60.7%) | 79 (39.3%) |
Female Fertility in Blaine County
Fertility by Age in Blaine County
Average fertility rate in Blaine County is 26.0 births per 1,000 women. Women in the age bracket of 20 to 34 years have the highest fertility rate with 53.0 births per 1,000 women. Women in the age bracket of 20 to 34 years acount for 100.0% of all women with births.
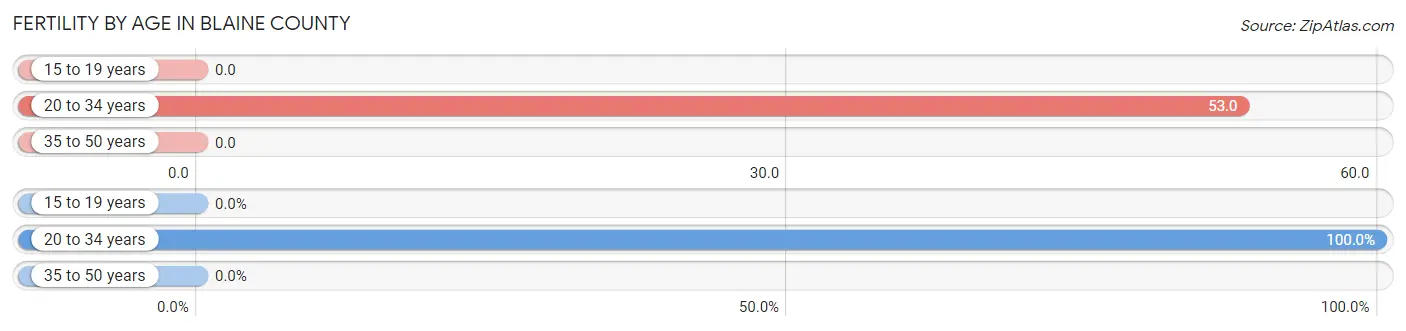
| Age Bracket | Women with Births | Births / 1,000 Women |
| 15 to 19 years | 0 (0.0%) | 0.0 |
| 20 to 34 years | 1 (100.0%) | 53.0 |
| 35 to 50 years | 0 (0.0%) | 0.0 |
| Total | 1 (100.0%) | 26.0 |
Fertility by Age by Marriage Status in Blaine County
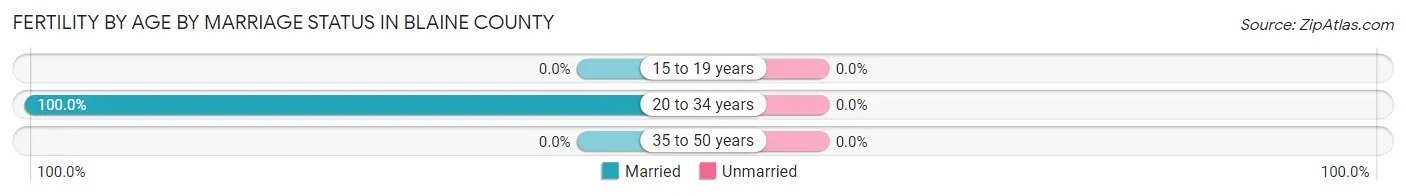
| Age Bracket | Married | Unmarried |
| 15 to 19 years | 0 (0.0%) | 0 (0.0%) |
| 20 to 34 years | 1 (100.0%) | 0 (0.0%) |
| 35 to 50 years | 0 (0.0%) | 0 (0.0%) |
| Total | 1 (100.0%) | 0 (0.0%) |
Fertility by Education in Blaine County
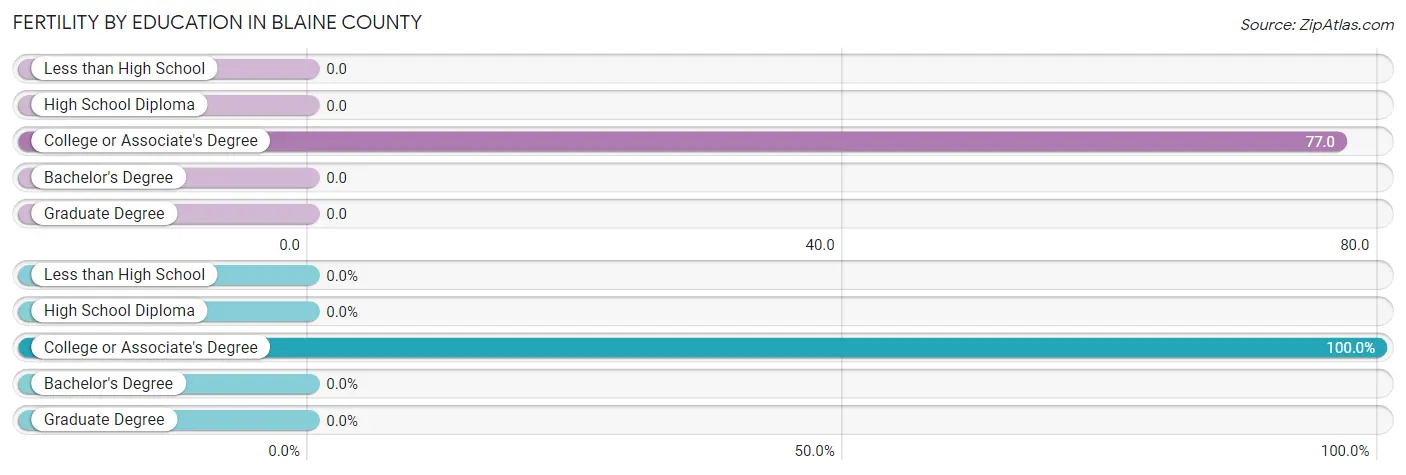
| Educational Attainment | Women with Births | Births / 1,000 Women |
| Less than High School | 0 (0.0%) | 0.0 |
| High School Diploma | 0 (0.0%) | 0.0 |
| College or Associate's Degree | 1 (100.0%) | 77.0 |
| Bachelor's Degree | 0 (0.0%) | 0.0 |
| Graduate Degree | 0 (0.0%) | 0.0 |
| Total | 1 (100.0%) | 26.0 |
Fertility by Education by Marriage Status in Blaine County
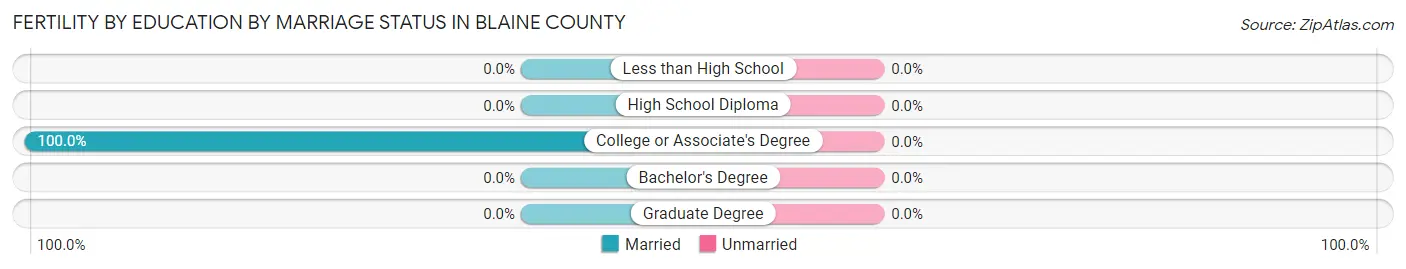
| Educational Attainment | Married | Unmarried |
| Less than High School | 0 (0.0%) | 0 (0.0%) |
| High School Diploma | 0 (0.0%) | 0 (0.0%) |
| College or Associate's Degree | 1 (100.0%) | 0 (0.0%) |
| Bachelor's Degree | 0 (0.0%) | 0 (0.0%) |
| Graduate Degree | 0 (0.0%) | 0 (0.0%) |
| Total | 1 (100.0%) | 0 (0.0%) |
Employment Characteristics in Blaine County
Employment by Class of Employer in Blaine County
Among the 200 employed individuals in Blaine County, self-employed (not incorporated) (66 | 33.0%), private company employees (55 | 27.5%), and local government employees (34 | 17.0%) make up the most common classes of employment.
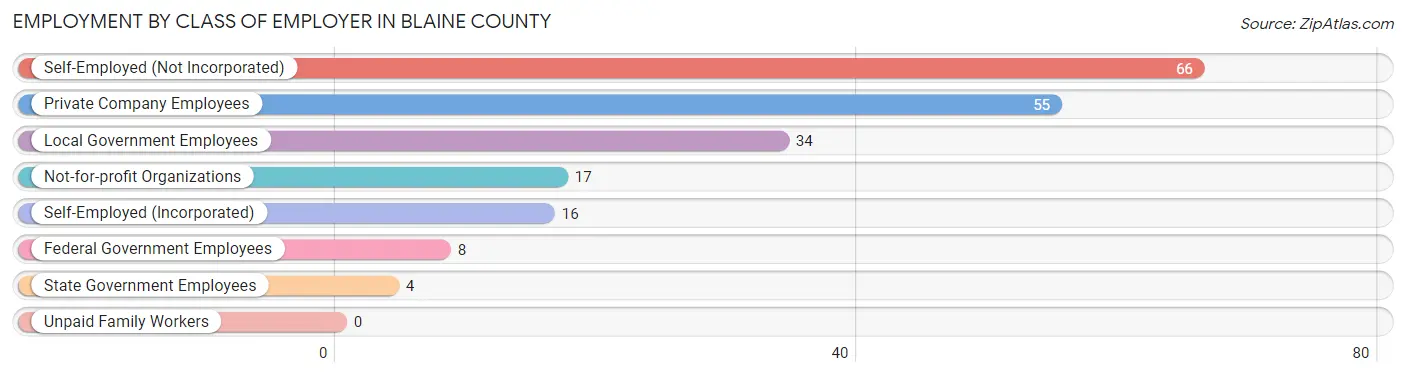
| Employer Class | # Employees | % Employees |
| Private Company Employees | 55 | 27.5% |
| Self-Employed (Incorporated) | 16 | 8.0% |
| Self-Employed (Not Incorporated) | 66 | 33.0% |
| Not-for-profit Organizations | 17 | 8.5% |
| Local Government Employees | 34 | 17.0% |
| State Government Employees | 4 | 2.0% |
| Federal Government Employees | 8 | 4.0% |
| Unpaid Family Workers | 0 | 0.0% |
| Total | 200 | 100.0% |
Employment Status by Age in Blaine County
According to the labor force statistics for Blaine County, out of the total population over 16 years of age (327), 64.2% or 210 individuals are in the labor force, with 1.9% or 4 of them unemployed. The age group with the highest labor force participation rate is 20 to 24 years, with 100.0% or 5 individuals in the labor force. Within the labor force, the 25 to 29 years age range has the highest percentage of unemployed individuals, with 18.2% or 2 of them being unemployed.
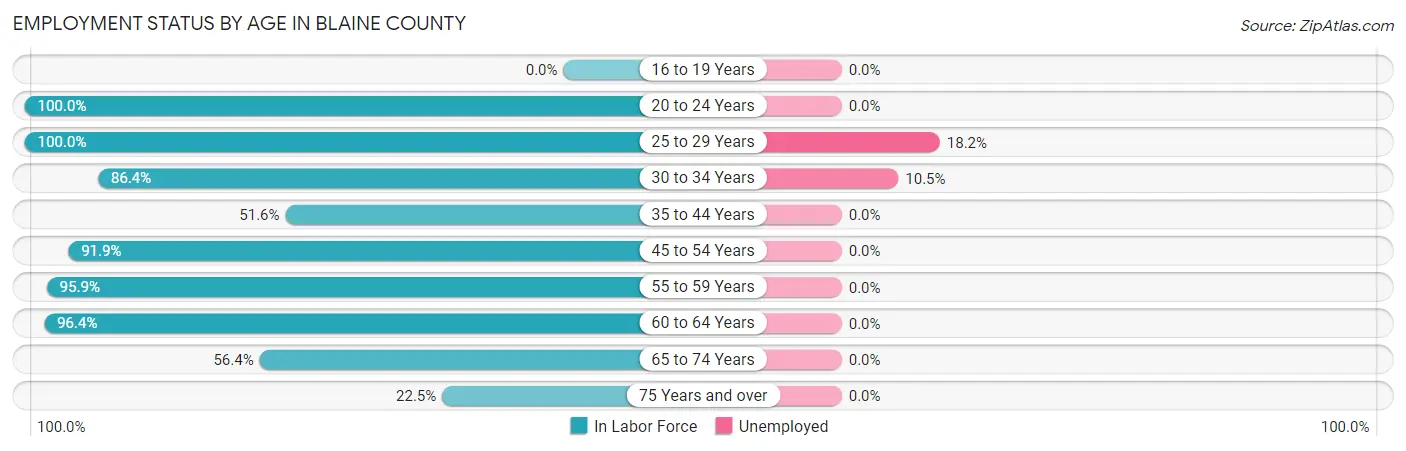
| Age Bracket | In Labor Force | Unemployed |
| 16 to 19 Years | 0 (0.0%) | 0 (0.0%) |
| 20 to 24 Years | 5 (100.0%) | 0 (0.0%) |
| 25 to 29 Years | 11 (100.0%) | 2 (18.2%) |
| 30 to 34 Years | 19 (86.4%) | 2 (10.5%) |
| 35 to 44 Years | 16 (51.6%) | 0 (0.0%) |
| 45 to 54 Years | 34 (91.9%) | 0 (0.0%) |
| 55 to 59 Years | 47 (95.9%) | 0 (0.0%) |
| 60 to 64 Years | 27 (96.4%) | 0 (0.0%) |
| 65 to 74 Years | 31 (56.4%) | 0 (0.0%) |
| 75 Years and over | 20 (22.5%) | 0 (0.0%) |
| Total | 210 (64.2%) | 4 (1.9%) |
Employment Status by Educational Attainment in Blaine County
According to labor force statistics for Blaine County, 86.5% of individuals (154) out of the total population between 25 and 64 years of age (178) are in the labor force, with 2.6% or 4 of them being unemployed. The group with the highest labor force participation rate are those with the educational attainment of less than high school, with 100.0% or 11 individuals in the labor force. Within the labor force, individuals with less than high school education have the highest percentage of unemployment, with 18.2% or 2 of them being unemployed.
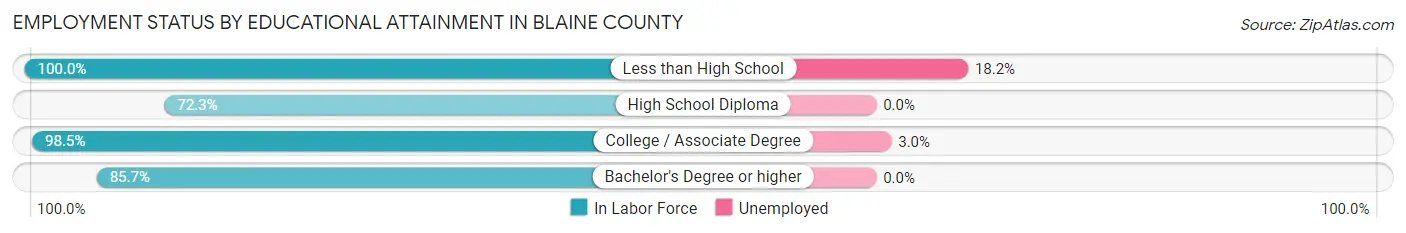
| Educational Attainment | In Labor Force | Unemployed |
| Less than High School | 11 (100.0%) | 2 (18.2%) |
| High School Diploma | 47 (72.3%) | 0 (0.0%) |
| College / Associate Degree | 66 (98.5%) | 2 (3.0%) |
| Bachelor's Degree or higher | 30 (85.7%) | 0 (0.0%) |
| Total | 154 (86.5%) | 5 (2.6%) |
Employment Occupations by Sex in Blaine County
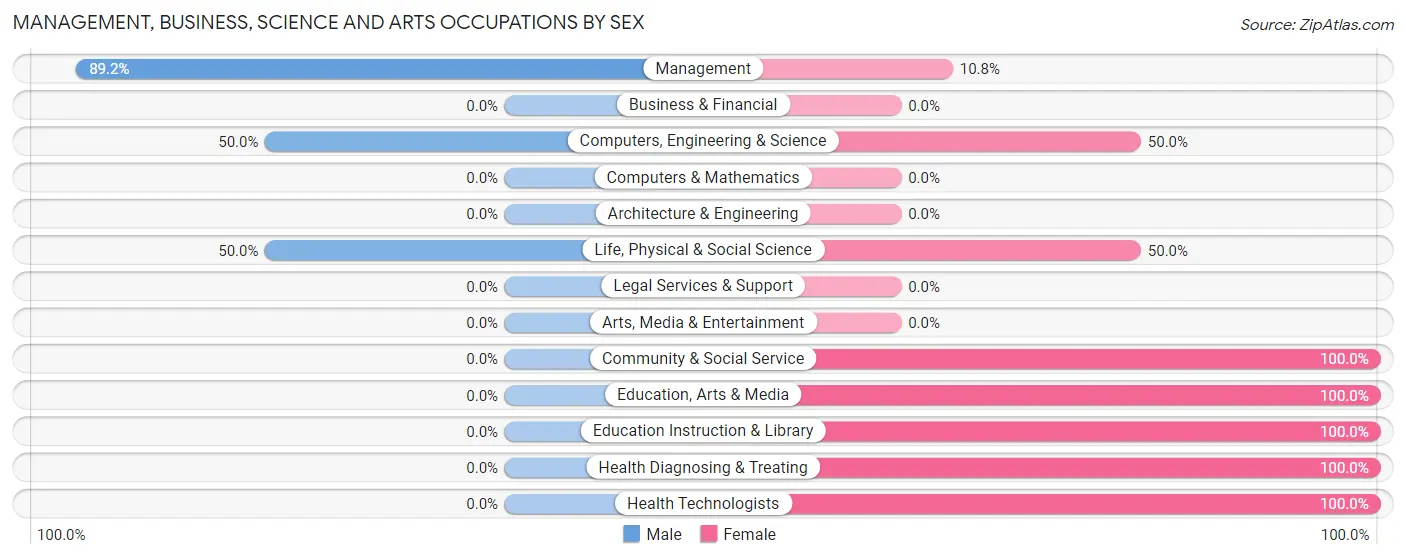
Management, Business, Science and Arts Occupations
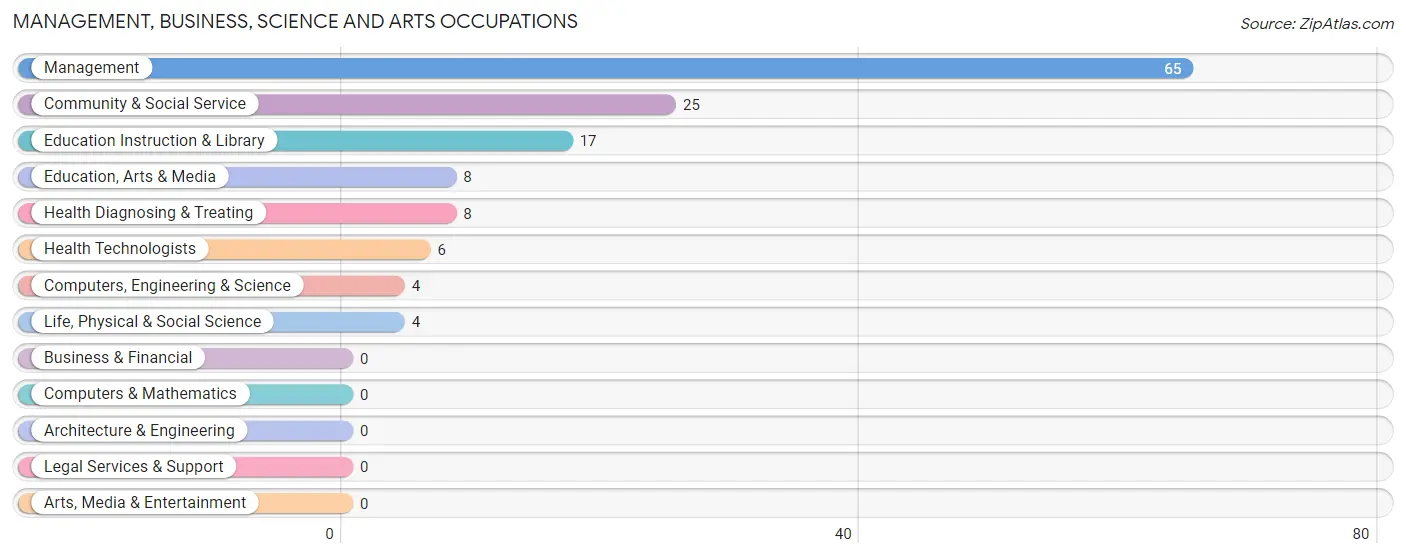
The most common Management, Business, Science and Arts occupations in Blaine County are Management (65 | 31.6%), Community & Social Service (25 | 12.1%), Education Instruction & Library (17 | 8.3%), Education, Arts & Media (8 | 3.9%), and Health Diagnosing & Treating (8 | 3.9%).
Management, Business, Science and Arts Occupations by Sex
Within the Management, Business, Science and Arts occupations in Blaine County, the most male-oriented occupations are Management (89.2%), Computers, Engineering & Science (50.0%), and Life, Physical & Social Science (50.0%), while the most female-oriented occupations are Community & Social Service (100.0%), Education, Arts & Media (100.0%), and Education Instruction & Library (100.0%).
| Occupation | Male | Female |
| Management | 58 (89.2%) | 7 (10.8%) |
| Business & Financial | 0 (0.0%) | 0 (0.0%) |
| Computers, Engineering & Science | 2 (50.0%) | 2 (50.0%) |
| Computers & Mathematics | 0 (0.0%) | 0 (0.0%) |
| Architecture & Engineering | 0 (0.0%) | 0 (0.0%) |
| Life, Physical & Social Science | 2 (50.0%) | 2 (50.0%) |
| Community & Social Service | 0 (0.0%) | 25 (100.0%) |
| Education, Arts & Media | 0 (0.0%) | 8 (100.0%) |
| Legal Services & Support | 0 (0.0%) | 0 (0.0%) |
| Education Instruction & Library | 0 (0.0%) | 17 (100.0%) |
| Arts, Media & Entertainment | 0 (0.0%) | 0 (0.0%) |
| Health Diagnosing & Treating | 0 (0.0%) | 8 (100.0%) |
| Health Technologists | 0 (0.0%) | 6 (100.0%) |
| Total (Category) | 60 (58.8%) | 42 (41.2%) |
| Total (Overall) | 133 (64.6%) | 73 (35.4%) |
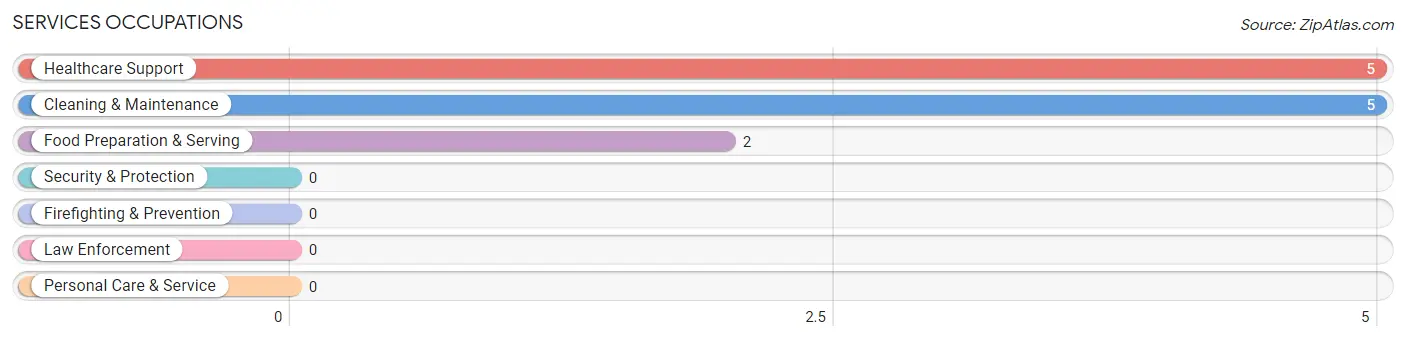
Services Occupations
The most common Services occupations in Blaine County are Healthcare Support (5 | 2.4%), Cleaning & Maintenance (5 | 2.4%), and Food Preparation & Serving (2 | 1.0%).
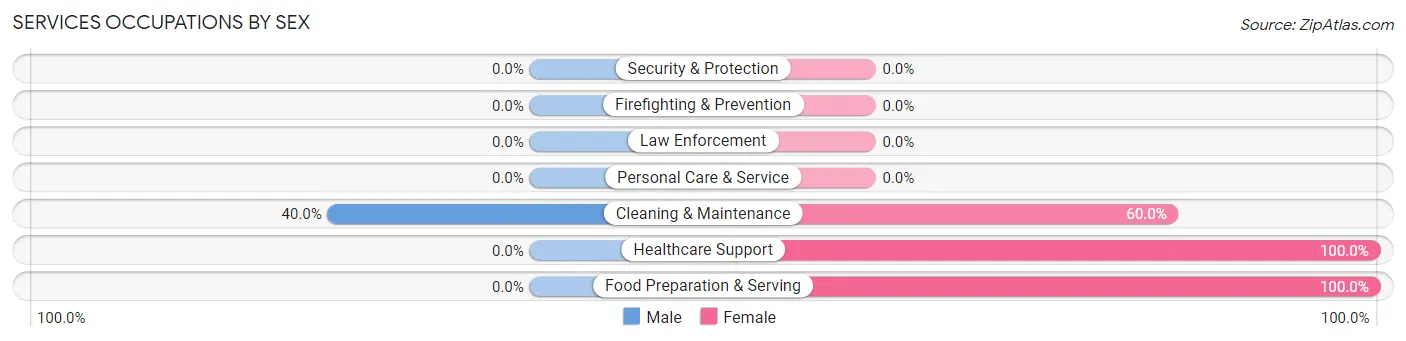
Services Occupations by Sex
| Occupation | Male | Female |
| Healthcare Support | 0 (0.0%) | 5 (100.0%) |
| Security & Protection | 0 (0.0%) | 0 (0.0%) |
| Firefighting & Prevention | 0 (0.0%) | 0 (0.0%) |
| Law Enforcement | 0 (0.0%) | 0 (0.0%) |
| Food Preparation & Serving | 0 (0.0%) | 2 (100.0%) |
| Cleaning & Maintenance | 2 (40.0%) | 3 (60.0%) |
| Personal Care & Service | 0 (0.0%) | 0 (0.0%) |
| Total (Category) | 2 (16.7%) | 10 (83.3%) |
| Total (Overall) | 133 (64.6%) | 73 (35.4%) |
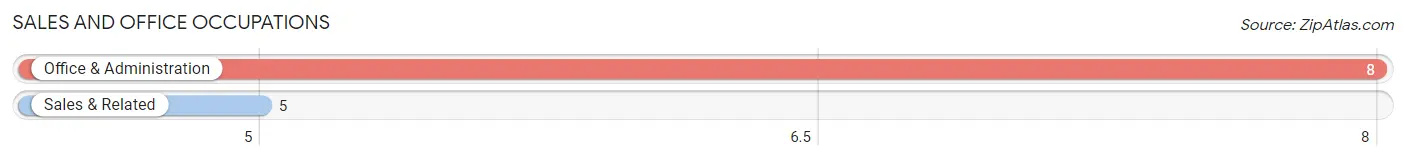
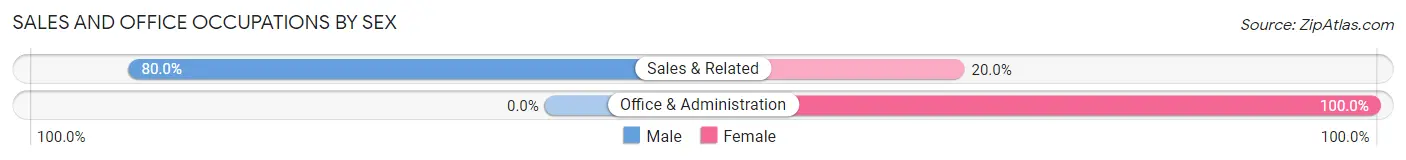
Sales and Office Occupations
The most common Sales and Office occupations in Blaine County are Office & Administration (8 | 3.9%), and Sales & Related (5 | 2.4%).
Sales and Office Occupations by Sex
| Occupation | Male | Female |
| Sales & Related | 4 (80.0%) | 1 (20.0%) |
| Office & Administration | 0 (0.0%) | 8 (100.0%) |
| Total (Category) | 4 (30.8%) | 9 (69.2%) |
| Total (Overall) | 133 (64.6%) | 73 (35.4%) |
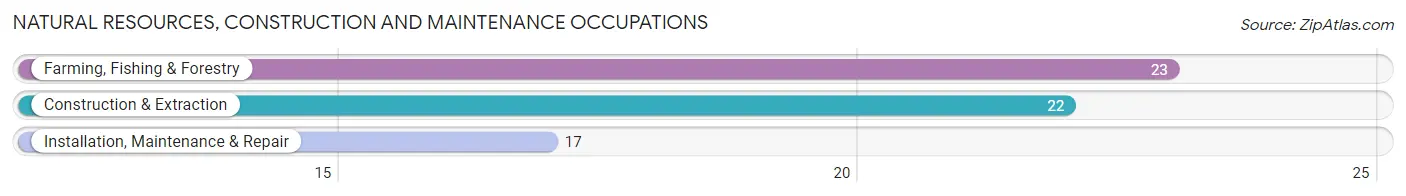
Natural Resources, Construction and Maintenance Occupations
The most common Natural Resources, Construction and Maintenance occupations in Blaine County are Farming, Fishing & Forestry (23 | 11.2%), Construction & Extraction (22 | 10.7%), and Installation, Maintenance & Repair (17 | 8.3%).
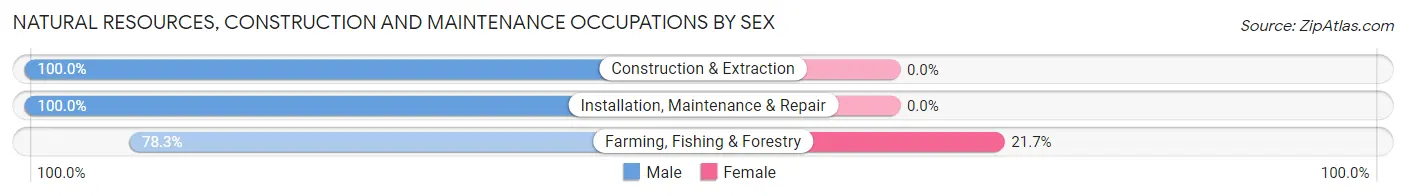
Natural Resources, Construction and Maintenance Occupations by Sex
| Occupation | Male | Female |
| Farming, Fishing & Forestry | 18 (78.3%) | 5 (21.7%) |
| Construction & Extraction | 22 (100.0%) | 0 (0.0%) |
| Installation, Maintenance & Repair | 17 (100.0%) | 0 (0.0%) |
| Total (Category) | 57 (91.9%) | 5 (8.1%) |
| Total (Overall) | 133 (64.6%) | 73 (35.4%) |
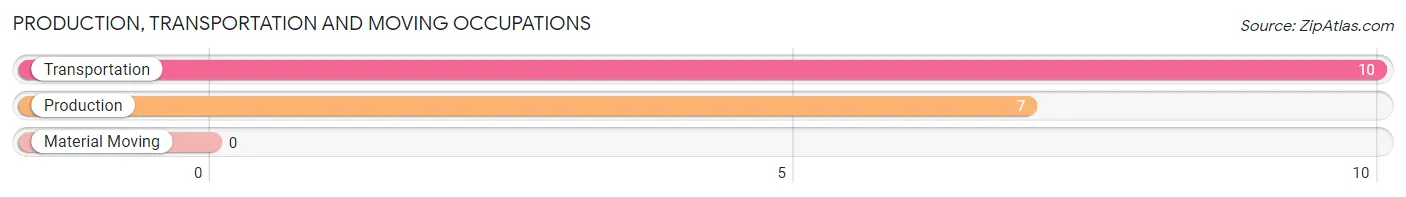
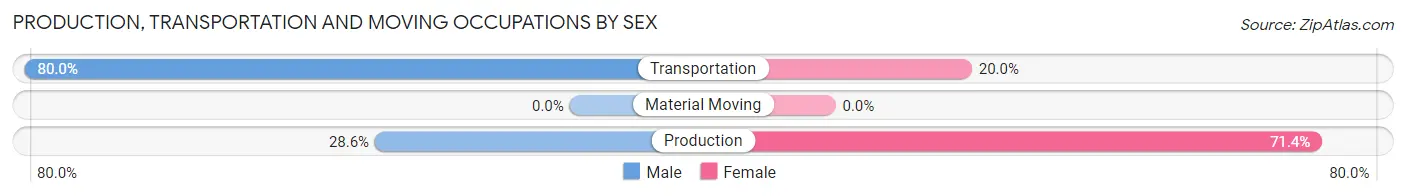
Production, Transportation and Moving Occupations
The most common Production, Transportation and Moving occupations in Blaine County are Transportation (10 | 4.9%), and Production (7 | 3.4%).
Production, Transportation and Moving Occupations by Sex
| Occupation | Male | Female |
| Production | 2 (28.6%) | 5 (71.4%) |
| Transportation | 8 (80.0%) | 2 (20.0%) |
| Material Moving | 0 (0.0%) | 0 (0.0%) |
| Total (Category) | 10 (58.8%) | 7 (41.2%) |
| Total (Overall) | 133 (64.6%) | 73 (35.4%) |
Employment Industries by Sex in Blaine County
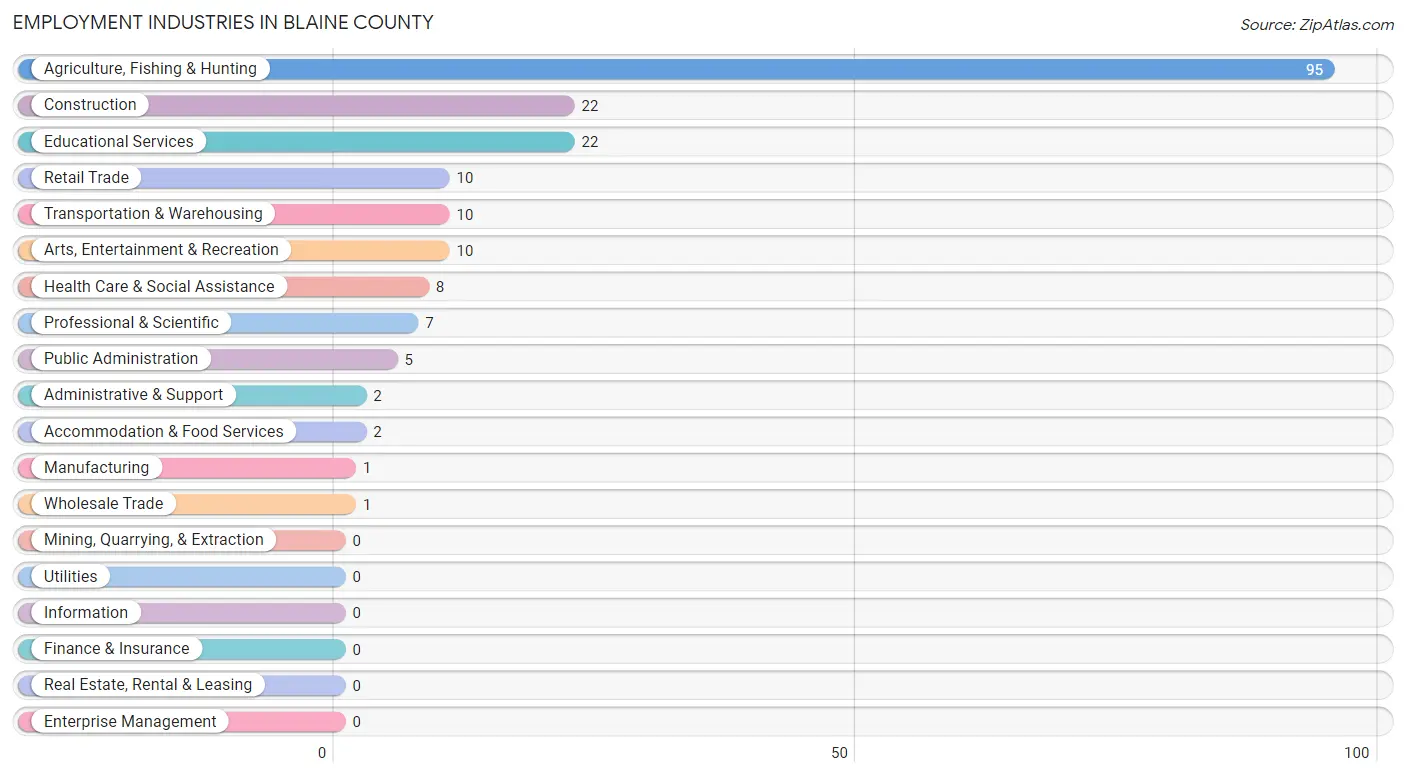
Employment Industries in Blaine County
The major employment industries in Blaine County include Agriculture, Fishing & Hunting (95 | 46.1%), Construction (22 | 10.7%), Educational Services (22 | 10.7%), Retail Trade (10 | 4.9%), and Transportation & Warehousing (10 | 4.9%).
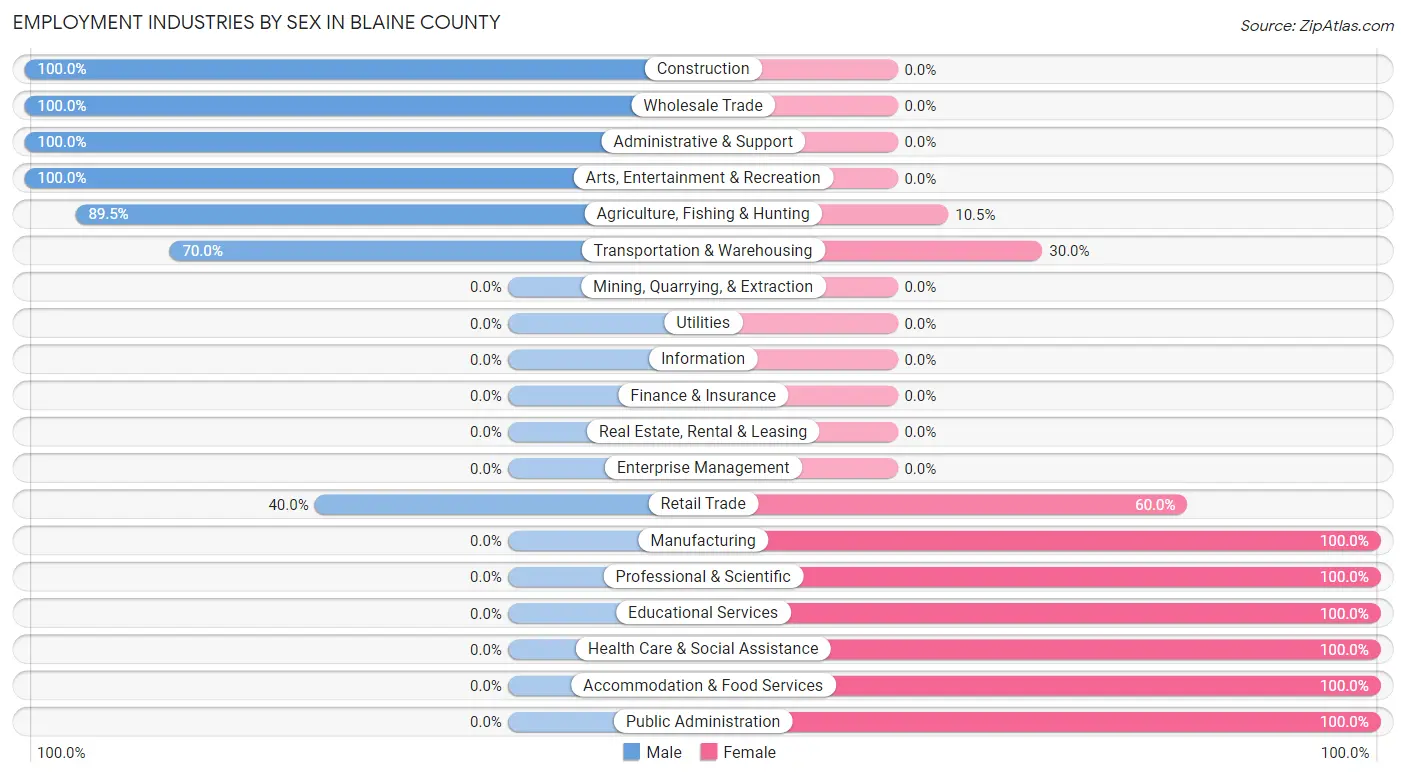
Employment Industries by Sex in Blaine County
The Blaine County industries that see more men than women are Construction (100.0%), Wholesale Trade (100.0%), and Administrative & Support (100.0%), whereas the industries that tend to have a higher number of women are Manufacturing (100.0%), Professional & Scientific (100.0%), and Educational Services (100.0%).
| Industry | Male | Female |
| Agriculture, Fishing & Hunting | 85 (89.5%) | 10 (10.5%) |
| Mining, Quarrying, & Extraction | 0 (0.0%) | 0 (0.0%) |
| Construction | 22 (100.0%) | 0 (0.0%) |
| Manufacturing | 0 (0.0%) | 1 (100.0%) |
| Wholesale Trade | 1 (100.0%) | 0 (0.0%) |
| Retail Trade | 4 (40.0%) | 6 (60.0%) |
| Transportation & Warehousing | 7 (70.0%) | 3 (30.0%) |
| Utilities | 0 (0.0%) | 0 (0.0%) |
| Information | 0 (0.0%) | 0 (0.0%) |
| Finance & Insurance | 0 (0.0%) | 0 (0.0%) |
| Real Estate, Rental & Leasing | 0 (0.0%) | 0 (0.0%) |
| Professional & Scientific | 0 (0.0%) | 7 (100.0%) |
| Enterprise Management | 0 (0.0%) | 0 (0.0%) |
| Administrative & Support | 2 (100.0%) | 0 (0.0%) |
| Educational Services | 0 (0.0%) | 22 (100.0%) |
| Health Care & Social Assistance | 0 (0.0%) | 8 (100.0%) |
| Arts, Entertainment & Recreation | 10 (100.0%) | 0 (0.0%) |
| Accommodation & Food Services | 0 (0.0%) | 2 (100.0%) |
| Public Administration | 0 (0.0%) | 5 (100.0%) |
| Total | 133 (64.6%) | 73 (35.4%) |
Education in Blaine County
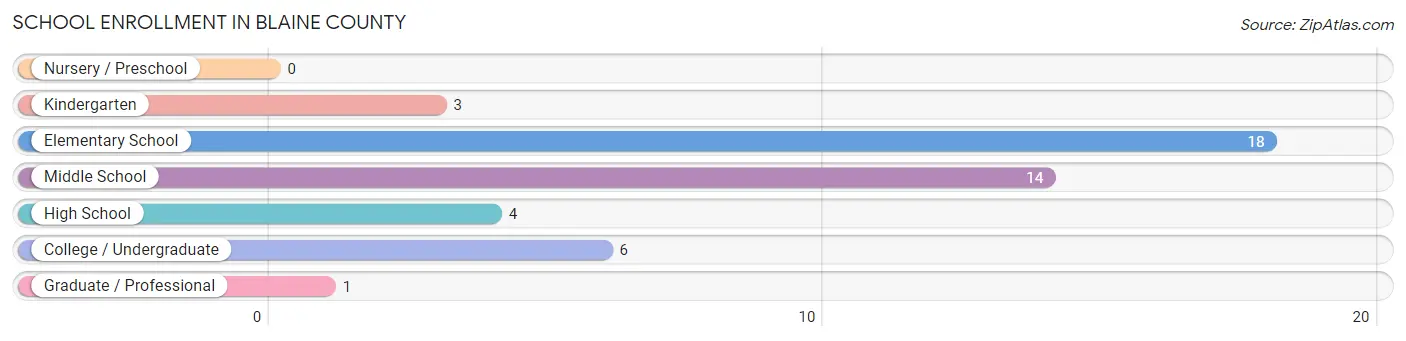
School Enrollment in Blaine County
The most common levels of schooling among the 46 students in Blaine County are elementary school (18 | 39.1%), middle school (14 | 30.4%), and college / undergraduate (6 | 13.0%).
| School Level | # Students | % Students |
| Nursery / Preschool | 0 | 0.0% |
| Kindergarten | 3 | 6.5% |
| Elementary School | 18 | 39.1% |
| Middle School | 14 | 30.4% |
| High School | 4 | 8.7% |
| College / Undergraduate | 6 | 13.0% |
| Graduate / Professional | 1 | 2.2% |
| Total | 46 | 100.0% |
School Enrollment by Age by Funding Source in Blaine County
Out of a total of 46 students who are enrolled in schools in Blaine County, 16 (34.8%) attend a private institution, while the remaining 30 (65.2%) are enrolled in public schools. The age group of 10 to 14 year olds has the highest likelihood of being enrolled in private schools, with 14 (51.8% in the age bracket) enrolled. Conversely, the age group of 5 to 9 year old has the lowest likelihood of being enrolled in a private school, with 10 (100.0% in the age bracket) attending a public institution.
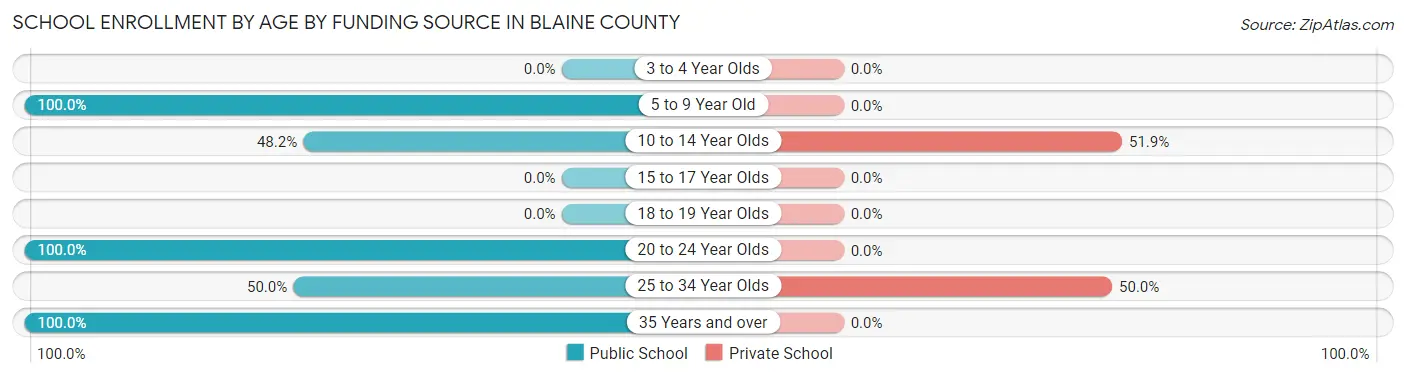
| Age Bracket | Public School | Private School |
| 3 to 4 Year Olds | 0 (0.0%) | 0 (0.0%) |
| 5 to 9 Year Old | 10 (100.0%) | 0 (0.0%) |
| 10 to 14 Year Olds | 13 (48.1%) | 14 (51.8%) |
| 15 to 17 Year Olds | 0 (0.0%) | 0 (0.0%) |
| 18 to 19 Year Olds | 0 (0.0%) | 0 (0.0%) |
| 20 to 24 Year Olds | 2 (100.0%) | 0 (0.0%) |
| 25 to 34 Year Olds | 2 (50.0%) | 2 (50.0%) |
| 35 Years and over | 3 (100.0%) | 0 (0.0%) |
| Total | 30 (65.2%) | 16 (34.8%) |
Educational Attainment by Field of Study in Blaine County
Education (28 | 39.4%), bio, nature & agricultural (13 | 18.3%), liberal arts & history (9 | 12.7%), engineering (6 | 8.5%), and science & technology (4 | 5.6%) are the most common fields of study among 71 individuals in Blaine County who have obtained a bachelor's degree or higher.
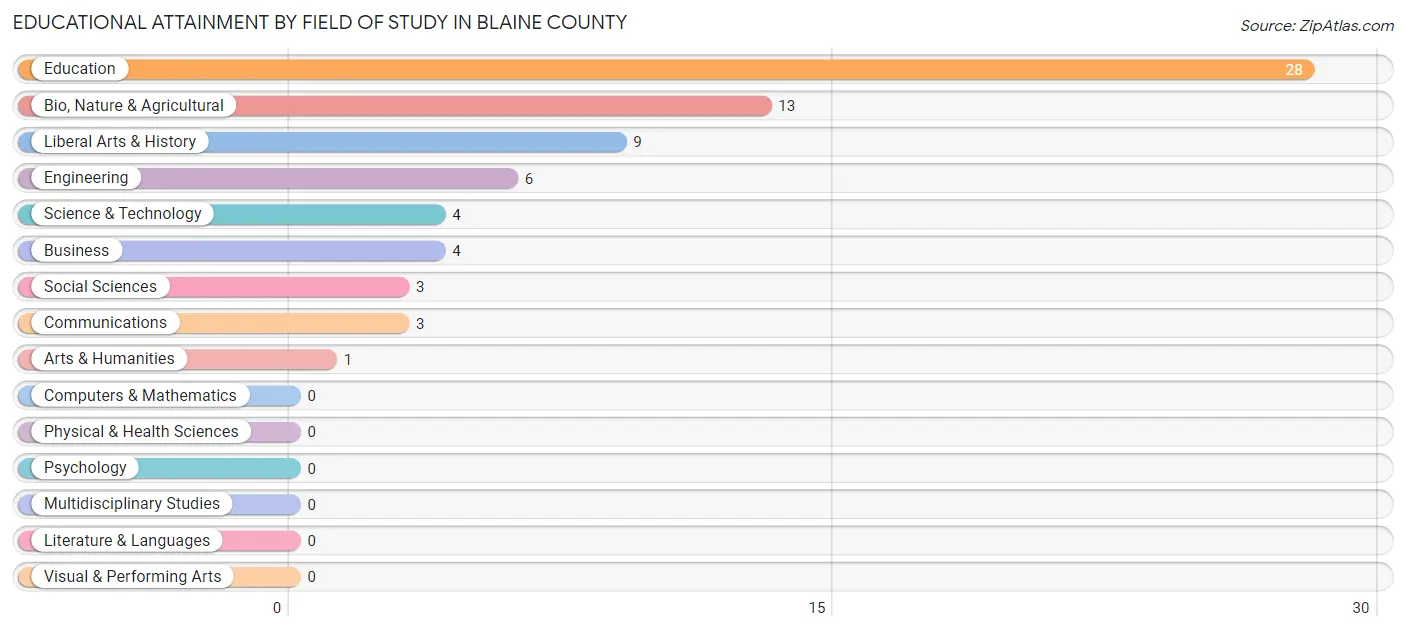
| Field of Study | # Graduates | % Graduates |
| Computers & Mathematics | 0 | 0.0% |
| Bio, Nature & Agricultural | 13 | 18.3% |
| Physical & Health Sciences | 0 | 0.0% |
| Psychology | 0 | 0.0% |
| Social Sciences | 3 | 4.2% |
| Engineering | 6 | 8.5% |
| Multidisciplinary Studies | 0 | 0.0% |
| Science & Technology | 4 | 5.6% |
| Business | 4 | 5.6% |
| Education | 28 | 39.4% |
| Literature & Languages | 0 | 0.0% |
| Liberal Arts & History | 9 | 12.7% |
| Visual & Performing Arts | 0 | 0.0% |
| Communications | 3 | 4.2% |
| Arts & Humanities | 1 | 1.4% |
| Total | 71 | 100.0% |
Transportation & Commute in Blaine County
Vehicle Availability by Sex in Blaine County
The most prevalent vehicle ownership categories in Blaine County are males with 3 vehicles (40, accounting for 31.5%) and females with 3 vehicles (16, making up 54.8%).
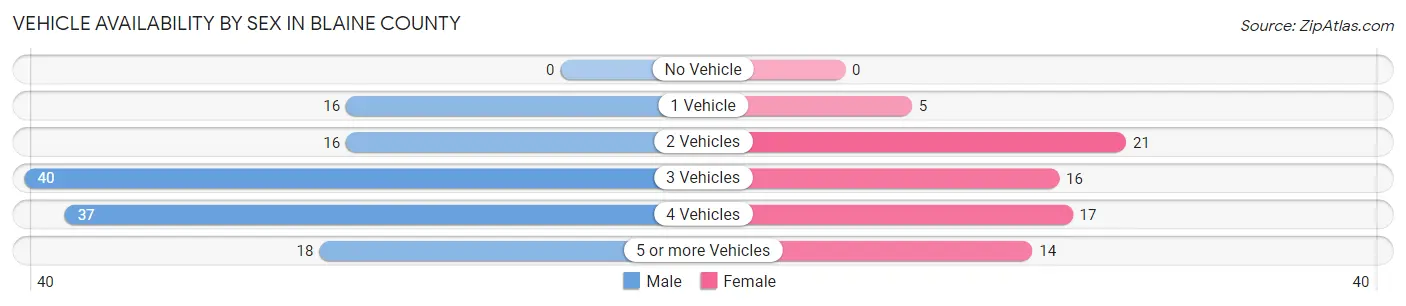
| Vehicles Available | Male | Female |
| No Vehicle | 0 (0.0%) | 0 (0.0%) |
| 1 Vehicle | 16 (12.6%) | 5 (6.9%) |
| 2 Vehicles | 16 (12.6%) | 21 (28.8%) |
| 3 Vehicles | 40 (31.5%) | 16 (21.9%) |
| 4 Vehicles | 37 (29.1%) | 17 (23.3%) |
| 5 or more Vehicles | 18 (14.2%) | 14 (19.2%) |
| Total | 127 (100.0%) | 73 (100.0%) |
Commute Time in Blaine County
The most frequently occuring commute durations in Blaine County are less than 5 minutes (37 commuters, 23.6%), 15 to 19 minutes (30 commuters, 19.1%), and 5 to 9 minutes (28 commuters, 17.8%).
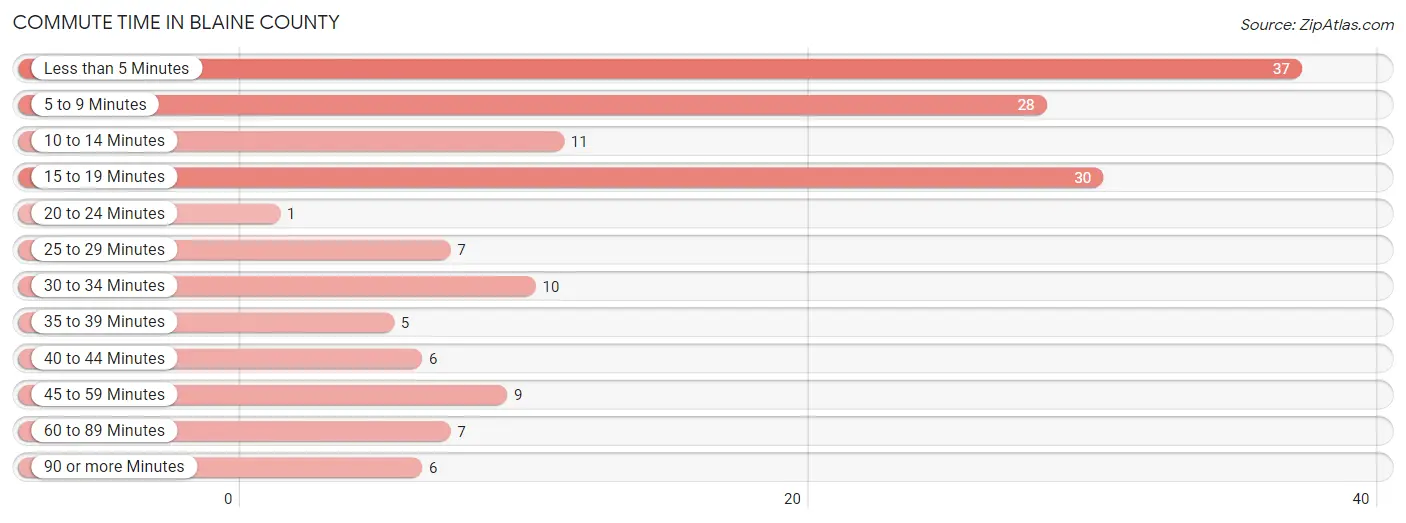
| Commute Time | # Commuters | % Commuters |
| Less than 5 Minutes | 37 | 23.6% |
| 5 to 9 Minutes | 28 | 17.8% |
| 10 to 14 Minutes | 11 | 7.0% |
| 15 to 19 Minutes | 30 | 19.1% |
| 20 to 24 Minutes | 1 | 0.6% |
| 25 to 29 Minutes | 7 | 4.5% |
| 30 to 34 Minutes | 10 | 6.4% |
| 35 to 39 Minutes | 5 | 3.2% |
| 40 to 44 Minutes | 6 | 3.8% |
| 45 to 59 Minutes | 9 | 5.7% |
| 60 to 89 Minutes | 7 | 4.5% |
| 90 or more Minutes | 6 | 3.8% |
Commute Time by Sex in Blaine County
The most common commute times in Blaine County are 15 to 19 minutes (27 commuters, 29.3%) for males and less than 5 minutes (16 commuters, 24.6%) for females.
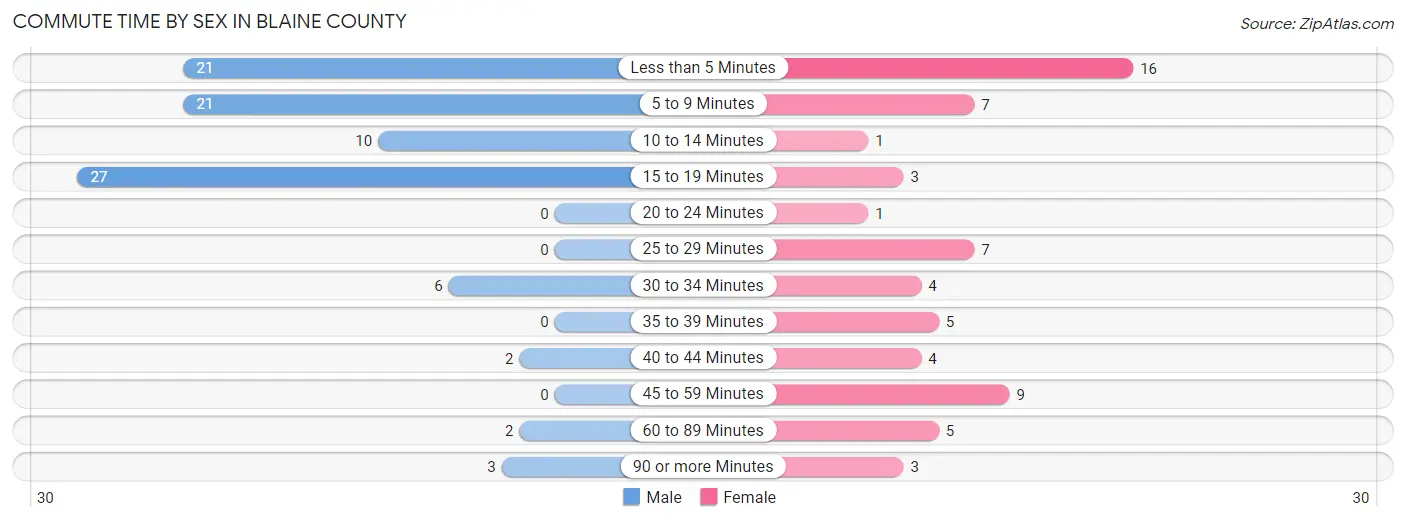
| Commute Time | Male | Female |
| Less than 5 Minutes | 21 (22.8%) | 16 (24.6%) |
| 5 to 9 Minutes | 21 (22.8%) | 7 (10.8%) |
| 10 to 14 Minutes | 10 (10.9%) | 1 (1.5%) |
| 15 to 19 Minutes | 27 (29.3%) | 3 (4.6%) |
| 20 to 24 Minutes | 0 (0.0%) | 1 (1.5%) |
| 25 to 29 Minutes | 0 (0.0%) | 7 (10.8%) |
| 30 to 34 Minutes | 6 (6.5%) | 4 (6.1%) |
| 35 to 39 Minutes | 0 (0.0%) | 5 (7.7%) |
| 40 to 44 Minutes | 2 (2.2%) | 4 (6.1%) |
| 45 to 59 Minutes | 0 (0.0%) | 9 (13.9%) |
| 60 to 89 Minutes | 2 (2.2%) | 5 (7.7%) |
| 90 or more Minutes | 3 (3.3%) | 3 (4.6%) |
Time of Departure to Work by Sex in Blaine County
The most frequent times of departure to work in Blaine County are 7:30 AM to 7:59 AM (33, 35.9%) for males and 7:00 AM to 7:29 AM (20, 30.8%) for females.
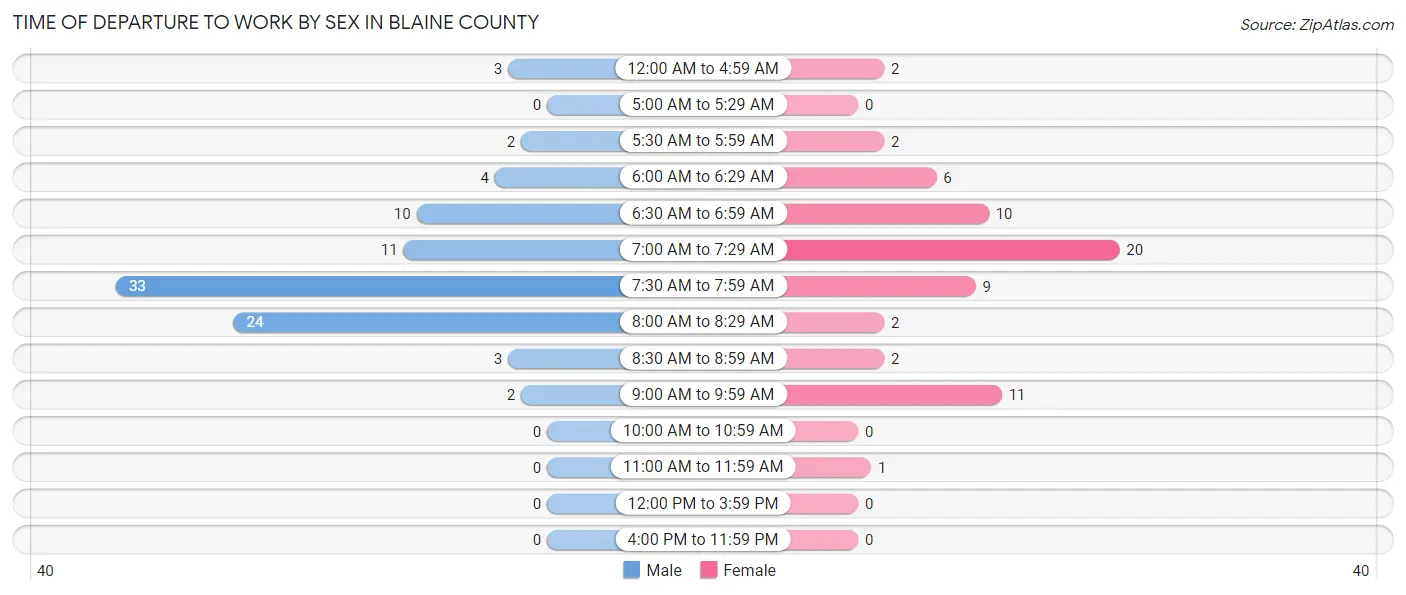
| Time of Departure | Male | Female |
| 12:00 AM to 4:59 AM | 3 (3.3%) | 2 (3.1%) |
| 5:00 AM to 5:29 AM | 0 (0.0%) | 0 (0.0%) |
| 5:30 AM to 5:59 AM | 2 (2.2%) | 2 (3.1%) |
| 6:00 AM to 6:29 AM | 4 (4.3%) | 6 (9.2%) |
| 6:30 AM to 6:59 AM | 10 (10.9%) | 10 (15.4%) |
| 7:00 AM to 7:29 AM | 11 (12.0%) | 20 (30.8%) |
| 7:30 AM to 7:59 AM | 33 (35.9%) | 9 (13.9%) |
| 8:00 AM to 8:29 AM | 24 (26.1%) | 2 (3.1%) |
| 8:30 AM to 8:59 AM | 3 (3.3%) | 2 (3.1%) |
| 9:00 AM to 9:59 AM | 2 (2.2%) | 11 (16.9%) |
| 10:00 AM to 10:59 AM | 0 (0.0%) | 0 (0.0%) |
| 11:00 AM to 11:59 AM | 0 (0.0%) | 1 (1.5%) |
| 12:00 PM to 3:59 PM | 0 (0.0%) | 0 (0.0%) |
| 4:00 PM to 11:59 PM | 0 (0.0%) | 0 (0.0%) |
| Total | 92 (100.0%) | 65 (100.0%) |
Housing Occupancy in Blaine County
Occupancy by Ownership in Blaine County
Of the total 201 dwellings in Blaine County, owner-occupied units account for 156 (77.6%), while renter-occupied units make up 45 (22.4%).
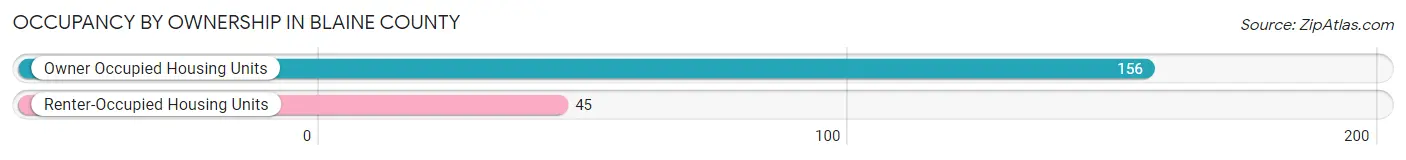
| Occupancy | # Housing Units | % Housing Units |
| Owner Occupied Housing Units | 156 | 77.6% |
| Renter-Occupied Housing Units | 45 | 22.4% |
| Total Occupied Housing Units | 201 | 100.0% |
Occupancy by Household Size in Blaine County
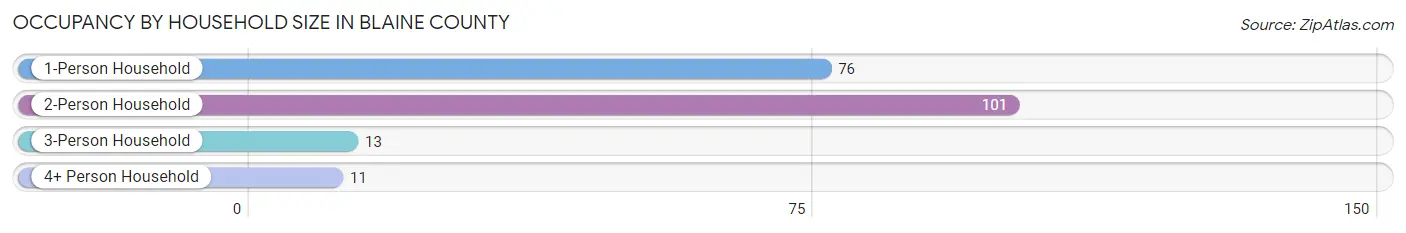
| Household Size | # Housing Units | % Housing Units |
| 1-Person Household | 76 | 37.8% |
| 2-Person Household | 101 | 50.2% |
| 3-Person Household | 13 | 6.5% |
| 4+ Person Household | 11 | 5.5% |
| Total Housing Units | 201 | 100.0% |
Occupancy by Ownership by Household Size in Blaine County
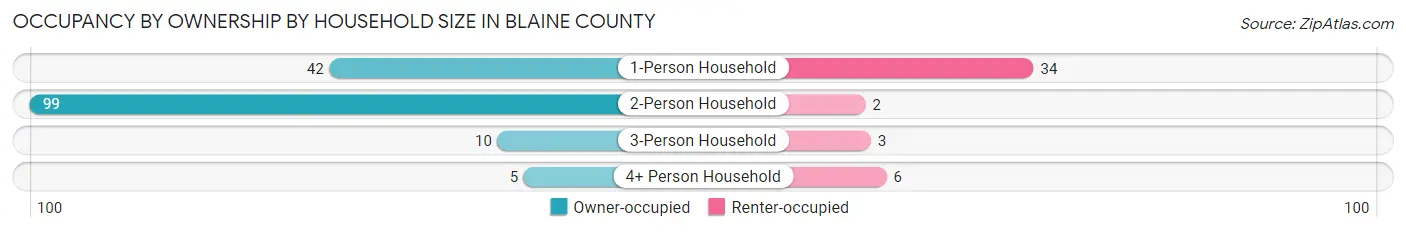
| Household Size | Owner-occupied | Renter-occupied |
| 1-Person Household | 42 (55.3%) | 34 (44.7%) |
| 2-Person Household | 99 (98.0%) | 2 (2.0%) |
| 3-Person Household | 10 (76.9%) | 3 (23.1%) |
| 4+ Person Household | 5 (45.5%) | 6 (54.5%) |
| Total Housing Units | 156 (77.6%) | 45 (22.4%) |
Occupancy by Educational Attainment in Blaine County
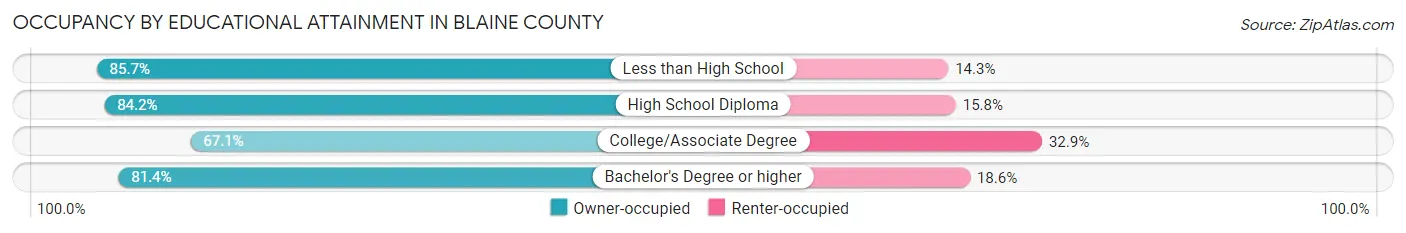
| Household Size | Owner-occupied | Renter-occupied |
| Less than High School | 24 (85.7%) | 4 (14.3%) |
| High School Diploma | 48 (84.2%) | 9 (15.8%) |
| College/Associate Degree | 49 (67.1%) | 24 (32.9%) |
| Bachelor's Degree or higher | 35 (81.4%) | 8 (18.6%) |
Occupancy by Age of Householder in Blaine County
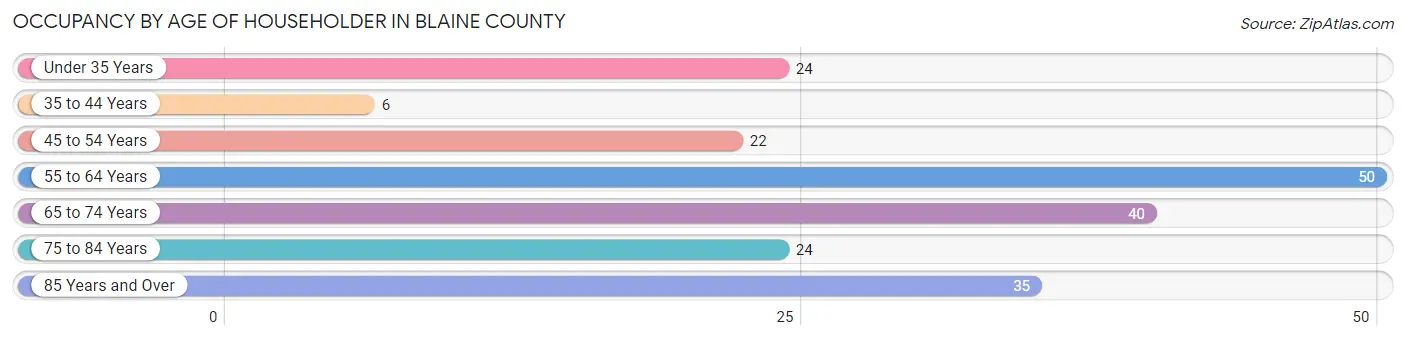
| Age Bracket | # Households | % Households |
| Under 35 Years | 24 | 11.9% |
| 35 to 44 Years | 6 | 3.0% |
| 45 to 54 Years | 22 | 11.0% |
| 55 to 64 Years | 50 | 24.9% |
| 65 to 74 Years | 40 | 19.9% |
| 75 to 84 Years | 24 | 11.9% |
| 85 Years and Over | 35 | 17.4% |
| Total | 201 | 100.0% |
Housing Finances in Blaine County
Median Income by Occupancy in Blaine County
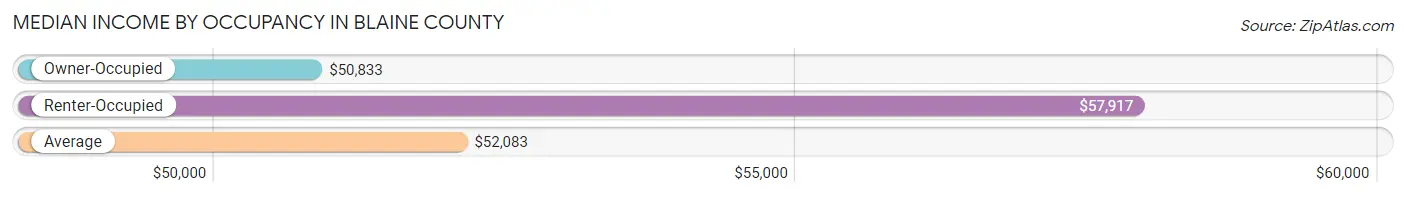
| Occupancy Type | # Households | Median Income |
| Owner-Occupied | 156 (77.6%) | $50,833 |
| Renter-Occupied | 45 (22.4%) | $57,917 |
| Average | 201 (100.0%) | $52,083 |
Occupancy by Householder Income Bracket in Blaine County
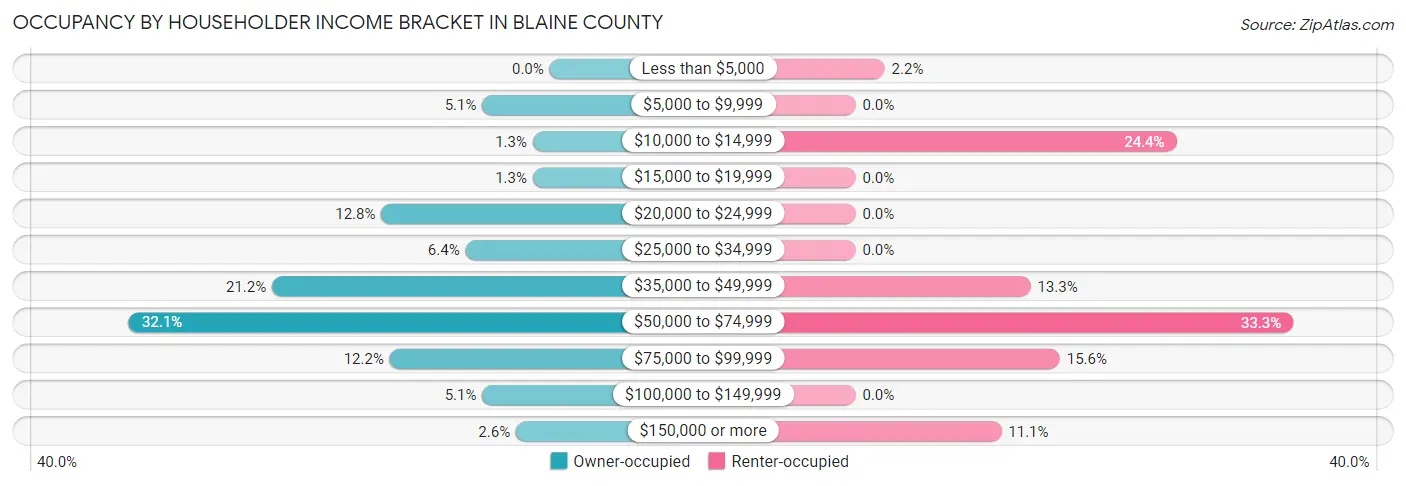
| Income Bracket | Owner-occupied | Renter-occupied |
| Less than $5,000 | 0 (0.0%) | 1 (2.2%) |
| $5,000 to $9,999 | 8 (5.1%) | 0 (0.0%) |
| $10,000 to $14,999 | 2 (1.3%) | 11 (24.4%) |
| $15,000 to $19,999 | 2 (1.3%) | 0 (0.0%) |
| $20,000 to $24,999 | 20 (12.8%) | 0 (0.0%) |
| $25,000 to $34,999 | 10 (6.4%) | 0 (0.0%) |
| $35,000 to $49,999 | 33 (21.1%) | 6 (13.3%) |
| $50,000 to $74,999 | 50 (32.1%) | 15 (33.3%) |
| $75,000 to $99,999 | 19 (12.2%) | 7 (15.6%) |
| $100,000 to $149,999 | 8 (5.1%) | 0 (0.0%) |
| $150,000 or more | 4 (2.6%) | 5 (11.1%) |
| Total | 156 (100.0%) | 45 (100.0%) |
Monthly Housing Cost Tiers in Blaine County
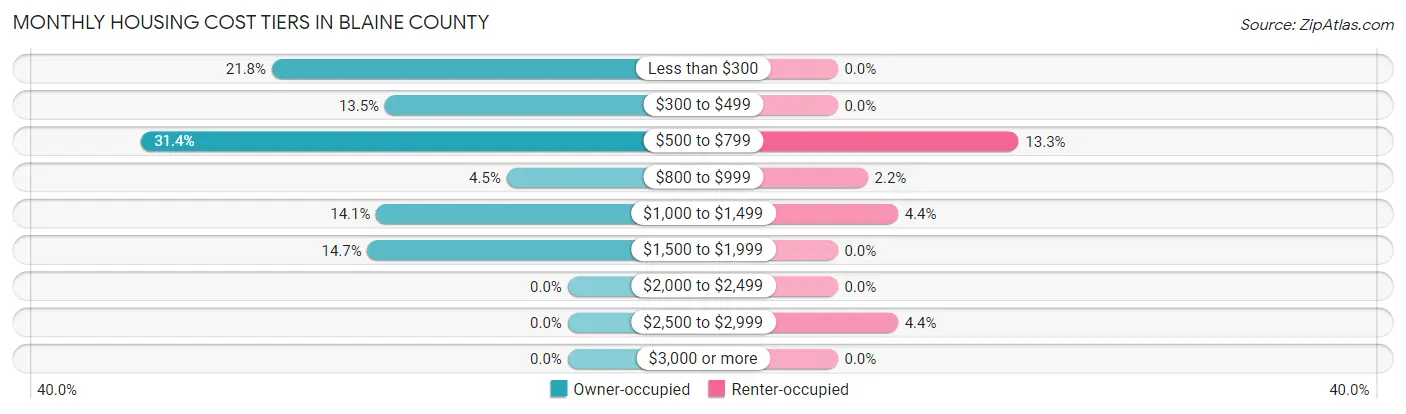
| Monthly Cost | Owner-occupied | Renter-occupied |
| Less than $300 | 34 (21.8%) | 0 (0.0%) |
| $300 to $499 | 21 (13.5%) | 0 (0.0%) |
| $500 to $799 | 49 (31.4%) | 6 (13.3%) |
| $800 to $999 | 7 (4.5%) | 1 (2.2%) |
| $1,000 to $1,499 | 22 (14.1%) | 2 (4.4%) |
| $1,500 to $1,999 | 23 (14.7%) | 0 (0.0%) |
| $2,000 to $2,499 | 0 (0.0%) | 0 (0.0%) |
| $2,500 to $2,999 | 0 (0.0%) | 2 (4.4%) |
| $3,000 or more | 0 (0.0%) | 0 (0.0%) |
| Total | 156 (100.0%) | 45 (100.0%) |
Physical Housing Characteristics in Blaine County
Housing Structures in Blaine County
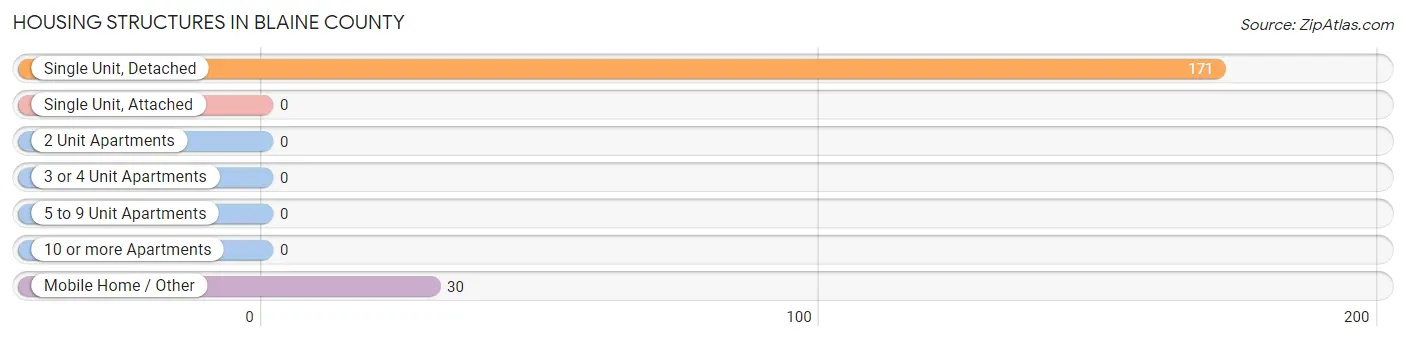
| Structure Type | # Housing Units | % Housing Units |
| Single Unit, Detached | 171 | 85.1% |
| Single Unit, Attached | 0 | 0.0% |
| 2 Unit Apartments | 0 | 0.0% |
| 3 or 4 Unit Apartments | 0 | 0.0% |
| 5 to 9 Unit Apartments | 0 | 0.0% |
| 10 or more Apartments | 0 | 0.0% |
| Mobile Home / Other | 30 | 14.9% |
| Total | 201 | 100.0% |
Housing Structures by Occupancy in Blaine County
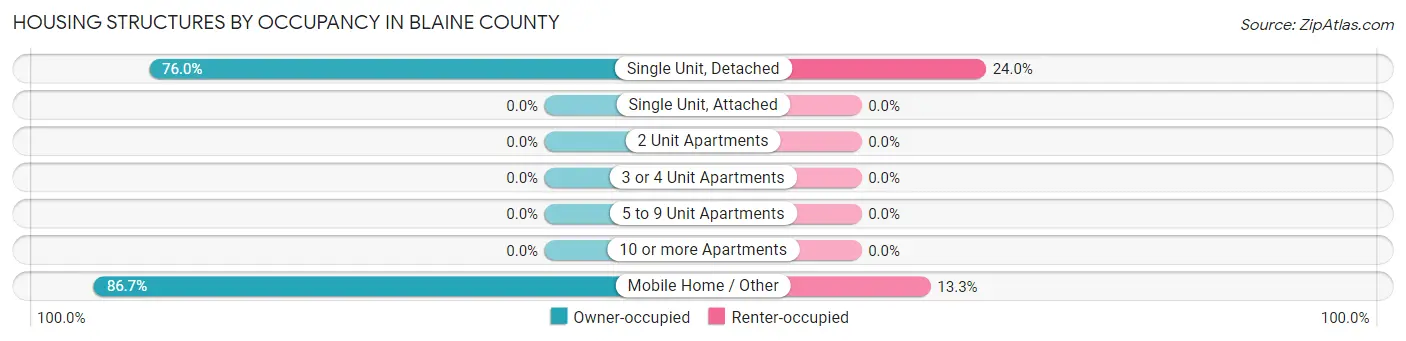
| Structure Type | Owner-occupied | Renter-occupied |
| Single Unit, Detached | 130 (76.0%) | 41 (24.0%) |
| Single Unit, Attached | 0 (0.0%) | 0 (0.0%) |
| 2 Unit Apartments | 0 (0.0%) | 0 (0.0%) |
| 3 or 4 Unit Apartments | 0 (0.0%) | 0 (0.0%) |
| 5 to 9 Unit Apartments | 0 (0.0%) | 0 (0.0%) |
| 10 or more Apartments | 0 (0.0%) | 0 (0.0%) |
| Mobile Home / Other | 26 (86.7%) | 4 (13.3%) |
| Total | 156 (77.6%) | 45 (22.4%) |
Housing Structures by Number of Rooms in Blaine County
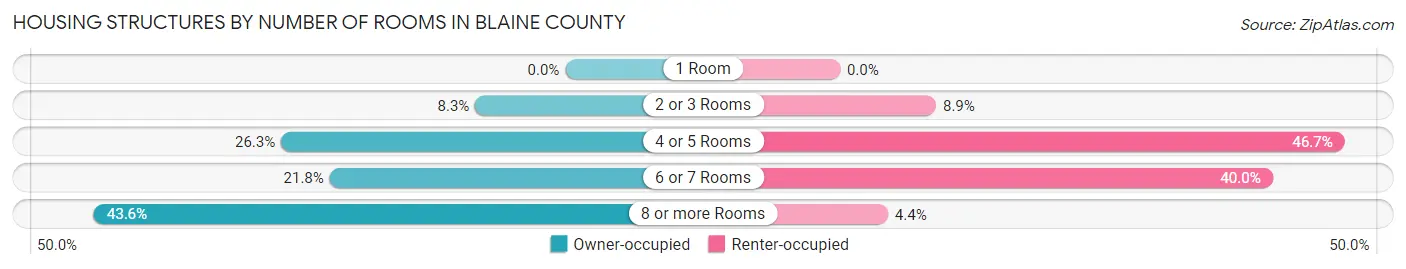
| Number of Rooms | Owner-occupied | Renter-occupied |
| 1 Room | 0 (0.0%) | 0 (0.0%) |
| 2 or 3 Rooms | 13 (8.3%) | 4 (8.9%) |
| 4 or 5 Rooms | 41 (26.3%) | 21 (46.7%) |
| 6 or 7 Rooms | 34 (21.8%) | 18 (40.0%) |
| 8 or more Rooms | 68 (43.6%) | 2 (4.4%) |
| Total | 156 (100.0%) | 45 (100.0%) |
Housing Structure by Heating Type in Blaine County
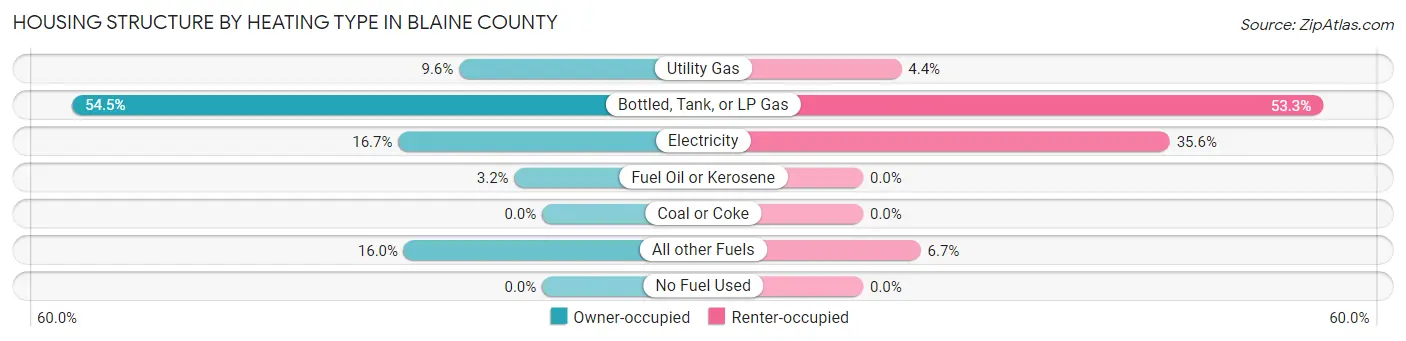
| Heating Type | Owner-occupied | Renter-occupied |
| Utility Gas | 15 (9.6%) | 2 (4.4%) |
| Bottled, Tank, or LP Gas | 85 (54.5%) | 24 (53.3%) |
| Electricity | 26 (16.7%) | 16 (35.6%) |
| Fuel Oil or Kerosene | 5 (3.2%) | 0 (0.0%) |
| Coal or Coke | 0 (0.0%) | 0 (0.0%) |
| All other Fuels | 25 (16.0%) | 3 (6.7%) |
| No Fuel Used | 0 (0.0%) | 0 (0.0%) |
| Total | 156 (100.0%) | 45 (100.0%) |
Household Vehicle Usage in Blaine County
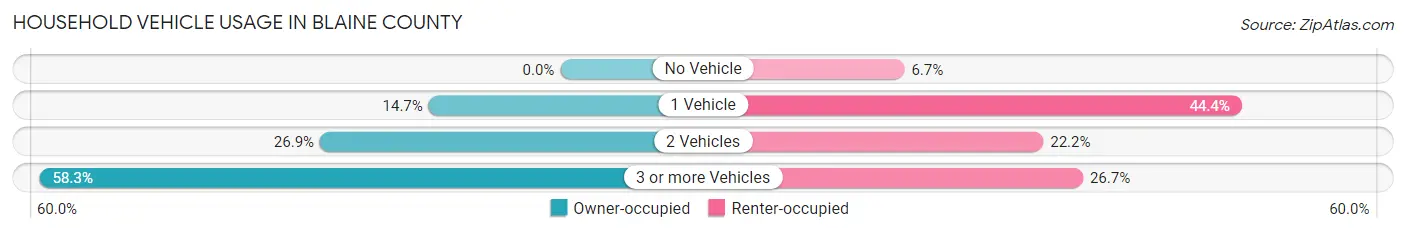
| Vehicles per Household | Owner-occupied | Renter-occupied |
| No Vehicle | 0 (0.0%) | 3 (6.7%) |
| 1 Vehicle | 23 (14.7%) | 20 (44.4%) |
| 2 Vehicles | 42 (26.9%) | 10 (22.2%) |
| 3 or more Vehicles | 91 (58.3%) | 12 (26.7%) |
| Total | 156 (100.0%) | 45 (100.0%) |
Real Estate & Mortgages in Blaine County
Real Estate and Mortgage Overview in Blaine County
| Characteristic | Without Mortgage | With Mortgage |
| Housing Units | 105 | 51 |
| Median Property Value | $68,100 | $130,200 |
| Median Household Income | $50,417 | $0 |
| Monthly Housing Costs | $510 | $0 |
| Real Estate Taxes | $1,090 | $1 |
Property Value by Mortgage Status in Blaine County
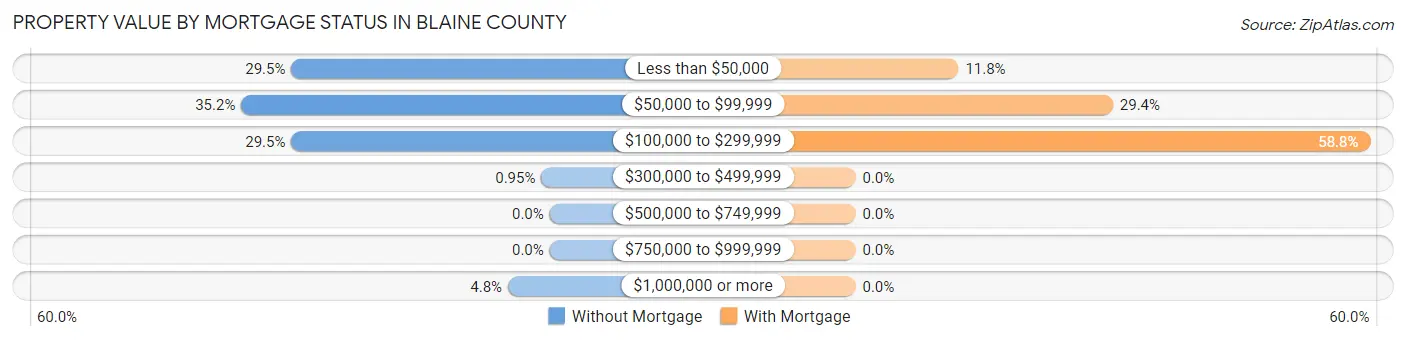
| Property Value | Without Mortgage | With Mortgage |
| Less than $50,000 | 31 (29.5%) | 6 (11.8%) |
| $50,000 to $99,999 | 37 (35.2%) | 15 (29.4%) |
| $100,000 to $299,999 | 31 (29.5%) | 30 (58.8%) |
| $300,000 to $499,999 | 1 (0.9%) | 0 (0.0%) |
| $500,000 to $749,999 | 0 (0.0%) | 0 (0.0%) |
| $750,000 to $999,999 | 0 (0.0%) | 0 (0.0%) |
| $1,000,000 or more | 5 (4.8%) | 0 (0.0%) |
| Total | 105 (100.0%) | 51 (100.0%) |
Household Income by Mortgage Status in Blaine County
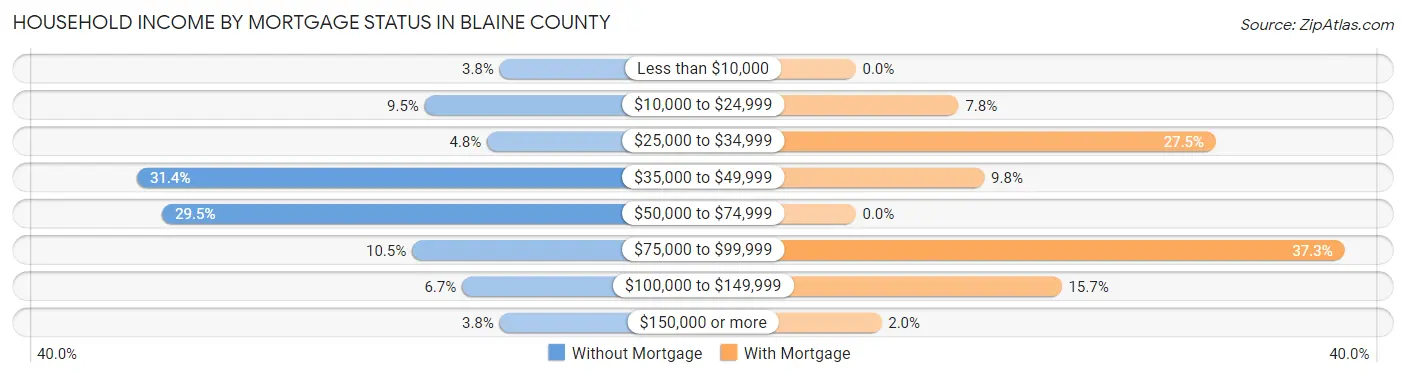
| Household Income | Without Mortgage | With Mortgage |
| Less than $10,000 | 4 (3.8%) | 0 (0.0%) |
| $10,000 to $24,999 | 10 (9.5%) | 4 (7.8%) |
| $25,000 to $34,999 | 5 (4.8%) | 14 (27.5%) |
| $35,000 to $49,999 | 33 (31.4%) | 5 (9.8%) |
| $50,000 to $74,999 | 31 (29.5%) | 0 (0.0%) |
| $75,000 to $99,999 | 11 (10.5%) | 19 (37.2%) |
| $100,000 to $149,999 | 7 (6.7%) | 8 (15.7%) |
| $150,000 or more | 4 (3.8%) | 1 (2.0%) |
| Total | 105 (100.0%) | 51 (100.0%) |
Property Value to Household Income Ratio in Blaine County
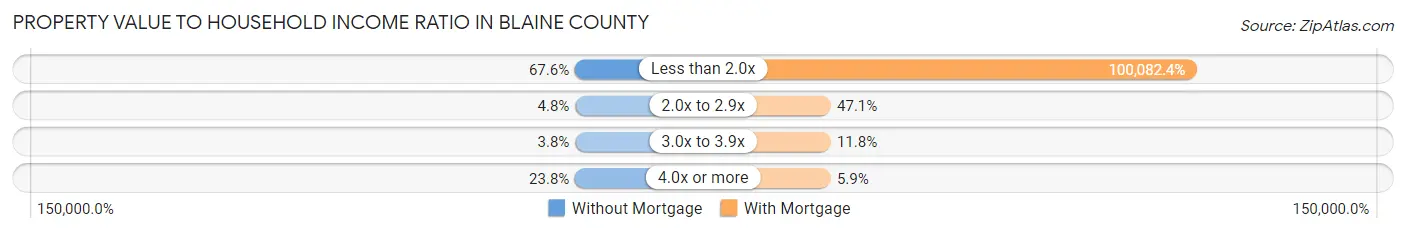
| Value-to-Income Ratio | Without Mortgage | With Mortgage |
| Less than 2.0x | 71 (67.6%) | 51,042 (100,082.3%) |
| 2.0x to 2.9x | 5 (4.8%) | 24 (47.1%) |
| 3.0x to 3.9x | 4 (3.8%) | 6 (11.8%) |
| 4.0x or more | 25 (23.8%) | 3 (5.9%) |
| Total | 105 (100.0%) | 51 (100.0%) |
Real Estate Taxes by Mortgage Status in Blaine County
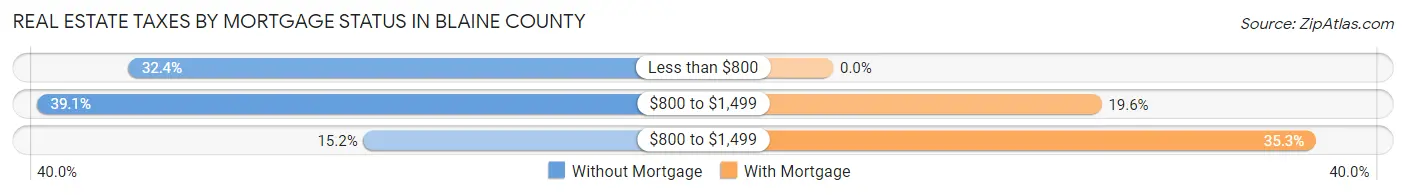
| Property Taxes | Without Mortgage | With Mortgage |
| Less than $800 | 34 (32.4%) | 0 (0.0%) |
| $800 to $1,499 | 41 (39.1%) | 10 (19.6%) |
| $800 to $1,499 | 16 (15.2%) | 18 (35.3%) |
| Total | 105 (100.0%) | 51 (100.0%) |
Health & Disability in Blaine County
Health Insurance Coverage by Age in Blaine County
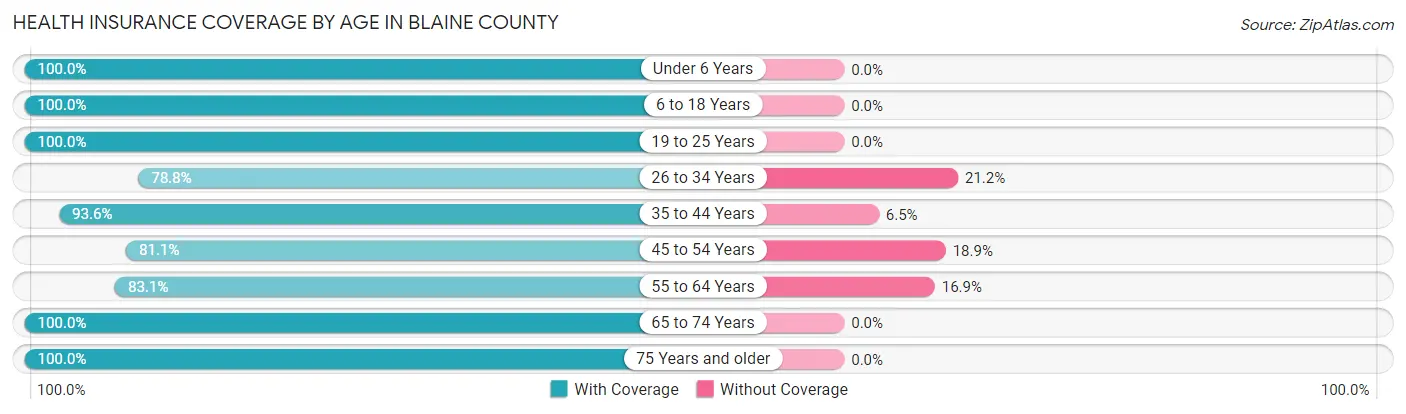
| Age Bracket | With Coverage | Without Coverage |
| Under 6 Years | 20 (100.0%) | 0 (0.0%) |
| 6 to 18 Years | 37 (100.0%) | 0 (0.0%) |
| 19 to 25 Years | 5 (100.0%) | 0 (0.0%) |
| 26 to 34 Years | 26 (78.8%) | 7 (21.2%) |
| 35 to 44 Years | 29 (93.5%) | 2 (6.5%) |
| 45 to 54 Years | 30 (81.1%) | 7 (18.9%) |
| 55 to 64 Years | 64 (83.1%) | 13 (16.9%) |
| 65 to 74 Years | 55 (100.0%) | 0 (0.0%) |
| 75 Years and older | 89 (100.0%) | 0 (0.0%) |
| Total | 355 (92.4%) | 29 (7.5%) |
Health Insurance Coverage by Citizenship Status in Blaine County
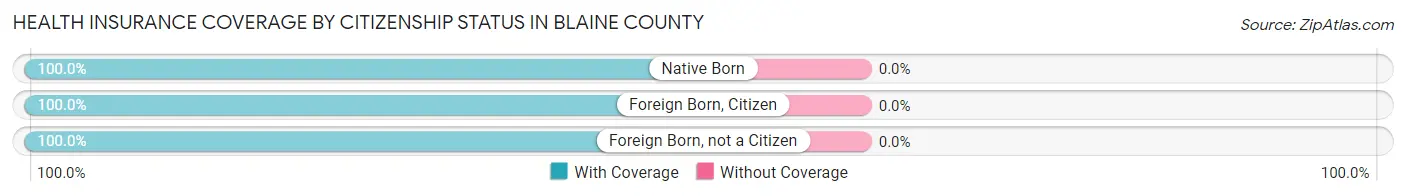
| Citizenship Status | With Coverage | Without Coverage |
| Native Born | 20 (100.0%) | 0 (0.0%) |
| Foreign Born, Citizen | 37 (100.0%) | 0 (0.0%) |
| Foreign Born, not a Citizen | 5 (100.0%) | 0 (0.0%) |
Health Insurance Coverage by Household Income in Blaine County
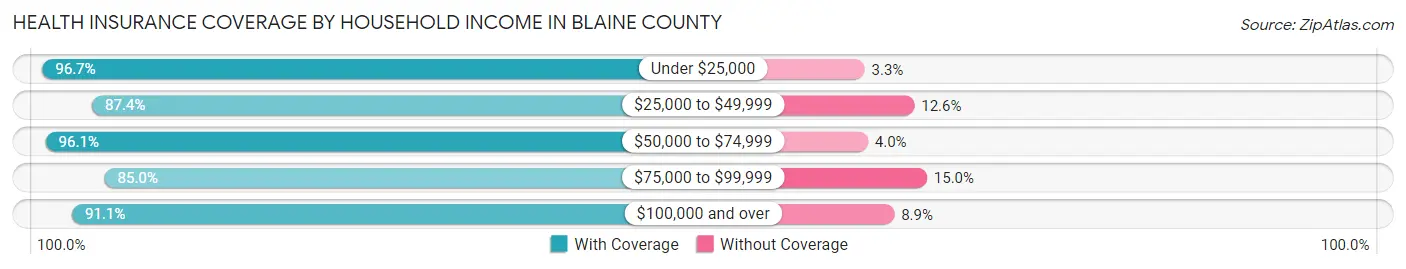
| Household Income | With Coverage | Without Coverage |
| Under $25,000 | 58 (96.7%) | 2 (3.3%) |
| $25,000 to $49,999 | 76 (87.4%) | 11 (12.6%) |
| $50,000 to $74,999 | 146 (96.1%) | 6 (4.0%) |
| $75,000 to $99,999 | 34 (85.0%) | 6 (15.0%) |
| $100,000 and over | 41 (91.1%) | 4 (8.9%) |
Public vs Private Health Insurance Coverage by Age in Blaine County
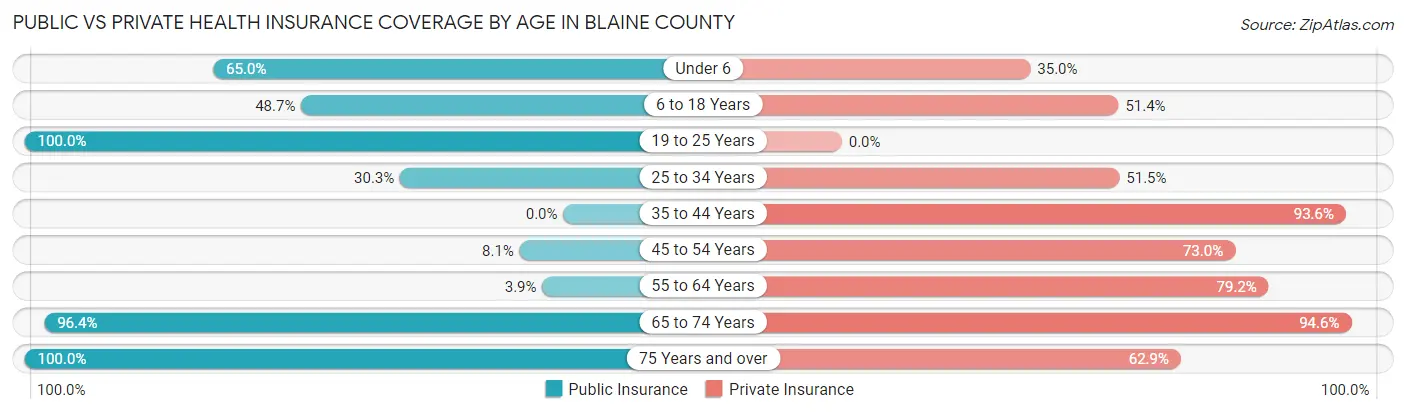
| Age Bracket | Public Insurance | Private Insurance |
| Under 6 | 13 (65.0%) | 7 (35.0%) |
| 6 to 18 Years | 18 (48.6%) | 19 (51.3%) |
| 19 to 25 Years | 5 (100.0%) | 0 (0.0%) |
| 25 to 34 Years | 10 (30.3%) | 17 (51.5%) |
| 35 to 44 Years | 0 (0.0%) | 29 (93.5%) |
| 45 to 54 Years | 3 (8.1%) | 27 (73.0%) |
| 55 to 64 Years | 3 (3.9%) | 61 (79.2%) |
| 65 to 74 Years | 53 (96.4%) | 52 (94.6%) |
| 75 Years and over | 89 (100.0%) | 56 (62.9%) |
| Total | 194 (50.5%) | 268 (69.8%) |
Disability Status by Sex by Age in Blaine County
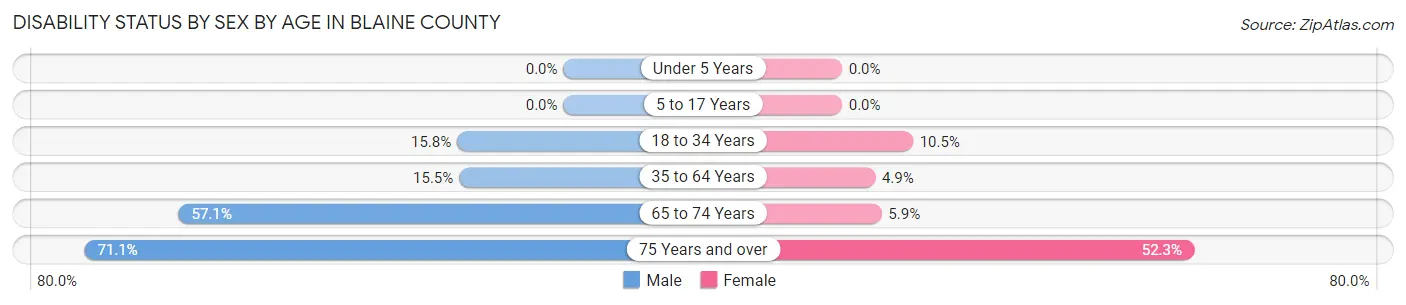
| Age Bracket | Male | Female |
| Under 5 Years | 0 (0.0%) | 0 (0.0%) |
| 5 to 17 Years | 0 (0.0%) | 0 (0.0%) |
| 18 to 34 Years | 3 (15.8%) | 2 (10.5%) |
| 35 to 64 Years | 13 (15.5%) | 3 (4.9%) |
| 65 to 74 Years | 12 (57.1%) | 2 (5.9%) |
| 75 Years and over | 32 (71.1%) | 23 (52.3%) |
Disability Class by Sex by Age in Blaine County
Disability Class: Hearing Difficulty
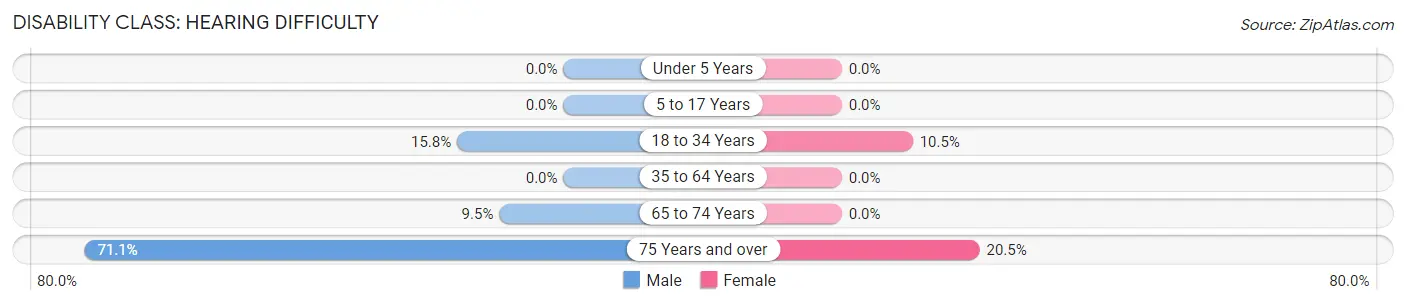
| Age Bracket | Male | Female |
| Under 5 Years | 0 (0.0%) | 0 (0.0%) |
| 5 to 17 Years | 0 (0.0%) | 0 (0.0%) |
| 18 to 34 Years | 3 (15.8%) | 2 (10.5%) |
| 35 to 64 Years | 0 (0.0%) | 0 (0.0%) |
| 65 to 74 Years | 2 (9.5%) | 0 (0.0%) |
| 75 Years and over | 32 (71.1%) | 9 (20.4%) |
Disability Class: Vision Difficulty
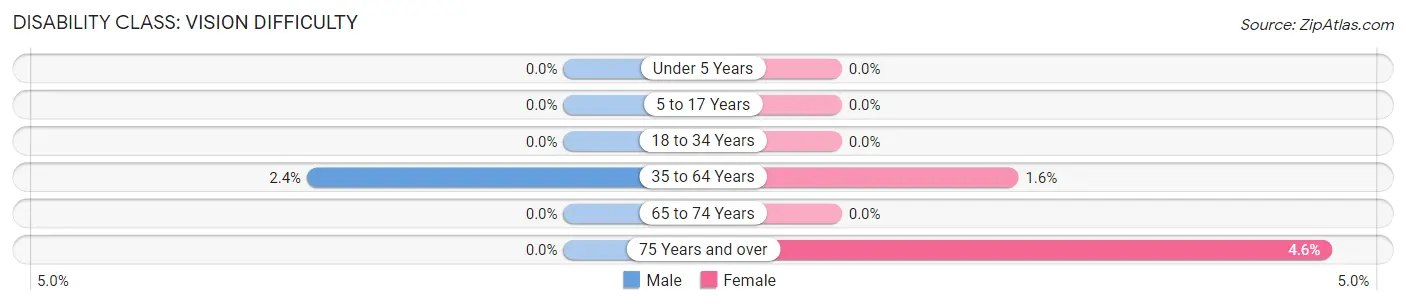
| Age Bracket | Male | Female |
| Under 5 Years | 0 (0.0%) | 0 (0.0%) |
| 5 to 17 Years | 0 (0.0%) | 0 (0.0%) |
| 18 to 34 Years | 0 (0.0%) | 0 (0.0%) |
| 35 to 64 Years | 2 (2.4%) | 1 (1.6%) |
| 65 to 74 Years | 0 (0.0%) | 0 (0.0%) |
| 75 Years and over | 0 (0.0%) | 2 (4.5%) |
Disability Class: Cognitive Difficulty
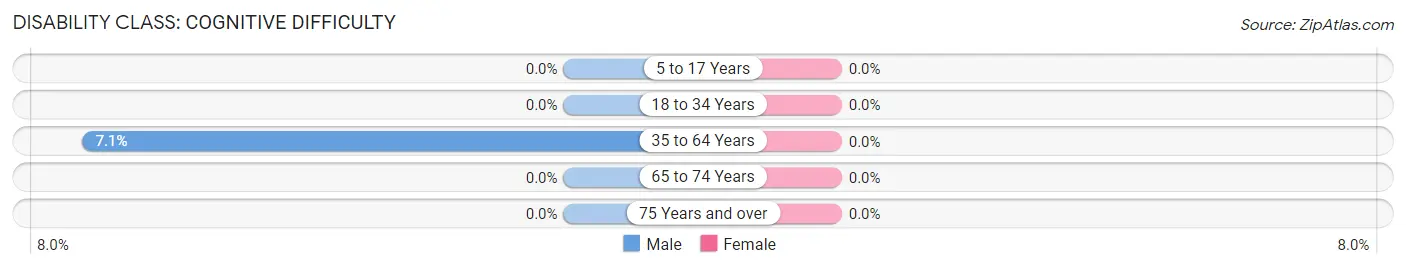
| Age Bracket | Male | Female |
| 5 to 17 Years | 0 (0.0%) | 0 (0.0%) |
| 18 to 34 Years | 0 (0.0%) | 0 (0.0%) |
| 35 to 64 Years | 6 (7.1%) | 0 (0.0%) |
| 65 to 74 Years | 0 (0.0%) | 0 (0.0%) |
| 75 Years and over | 0 (0.0%) | 0 (0.0%) |
Disability Class: Ambulatory Difficulty
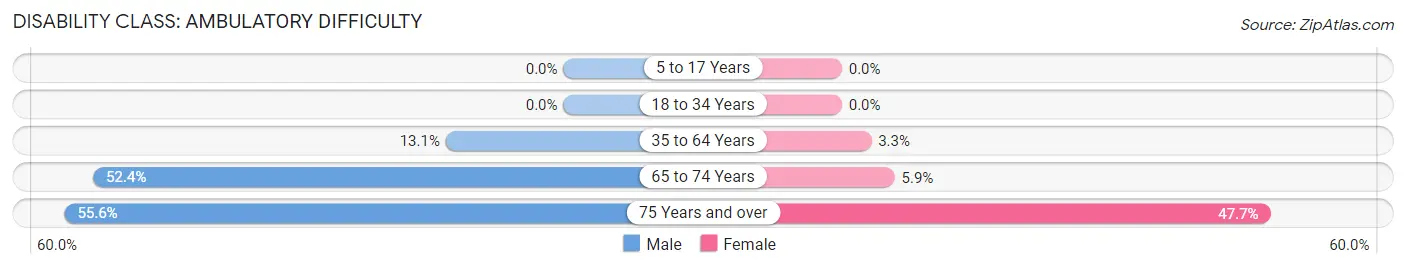
| Age Bracket | Male | Female |
| 5 to 17 Years | 0 (0.0%) | 0 (0.0%) |
| 18 to 34 Years | 0 (0.0%) | 0 (0.0%) |
| 35 to 64 Years | 11 (13.1%) | 2 (3.3%) |
| 65 to 74 Years | 11 (52.4%) | 2 (5.9%) |
| 75 Years and over | 25 (55.6%) | 21 (47.7%) |
Disability Class: Self-Care Difficulty
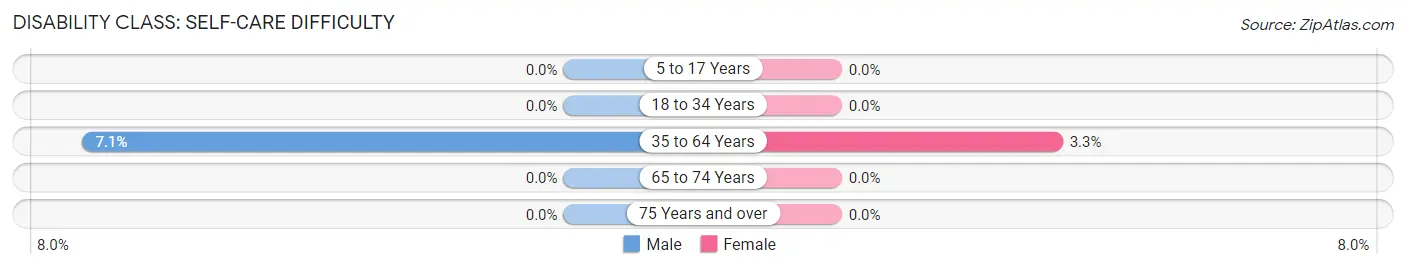
| Age Bracket | Male | Female |
| 5 to 17 Years | 0 (0.0%) | 0 (0.0%) |
| 18 to 34 Years | 0 (0.0%) | 0 (0.0%) |
| 35 to 64 Years | 6 (7.1%) | 2 (3.3%) |
| 65 to 74 Years | 0 (0.0%) | 0 (0.0%) |
| 75 Years and over | 0 (0.0%) | 0 (0.0%) |
Technology Access in Blaine County
Computing Device Access in Blaine County
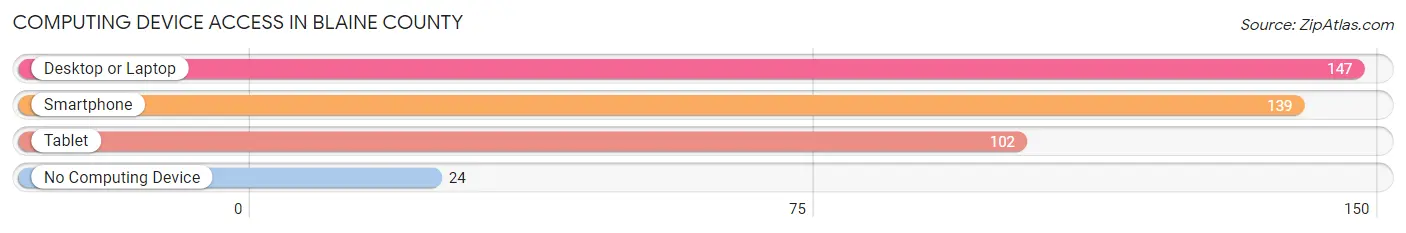
| Device Type | # Households | % Households |
| Desktop or Laptop | 147 | 73.1% |
| Smartphone | 139 | 69.2% |
| Tablet | 102 | 50.7% |
| No Computing Device | 24 | 11.9% |
| Total | 201 | 100.0% |
Internet Access in Blaine County
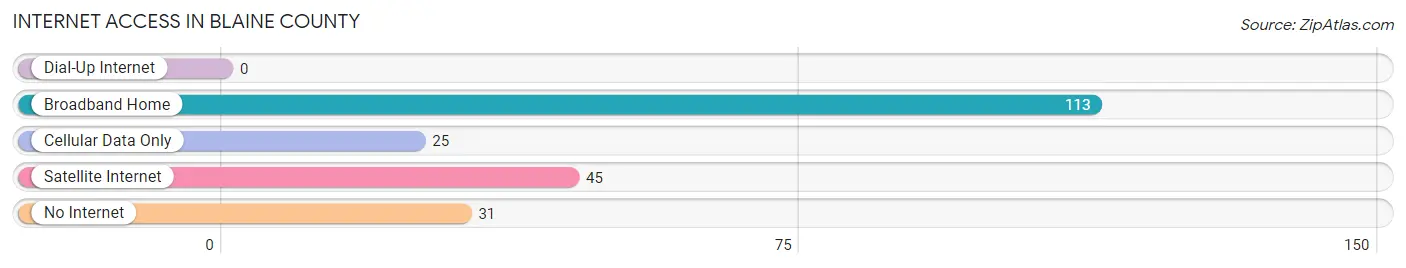
| Internet Type | # Households | % Households |
| Dial-Up Internet | 0 | 0.0% |
| Broadband Home | 113 | 56.2% |
| Cellular Data Only | 25 | 12.4% |
| Satellite Internet | 45 | 22.4% |
| No Internet | 31 | 15.4% |
| Total | 201 | 100.0% |
Blaine County Summary
Blaine County is located in the state of Nebraska, in the Midwestern United States. It is bordered by Custer County to the north, Thomas County to the east, and Garfield County to the south. The county seat is Brewster, and the largest city is Dunning. The county was established in 1885 and named after James G. Blaine, a former United States Secretary of State.
Geography
Blaine County covers an area of 1,072 square miles, making it the fourth-largest county in Nebraska. The county is located in the Sandhills region of the state, and is mostly flat with rolling hills. The terrain is mostly grassland, with some areas of sandhills and wooded areas. The county is drained by the Middle Loup River and its tributaries. The highest point in the county is located in the northwest corner, at an elevation of 2,890 feet.
Climate
Blaine County has a semi-arid climate, with hot summers and cold winters. The average annual temperature is 52°F, and the average annual precipitation is 20 inches.
Demographics
As of the 2010 United States Census, there were 1,945 people, 790 households, and 545 families living in Blaine County. The population density was 1.8 people per square mile. The racial makeup of the county was 97.2% White, 0.2% African American, 0.2% Native American, 0.2% Asian, 0.1% Pacific Islander, 0.7% from other races, and 1.0% from two or more races. Hispanic or Latino of any race were 1.7% of the population.
The median income for a household in the county was $37,500, and the median income for a family was $45,000. The per capita income for the county was $18,000. About 11.2% of families and 14.2% of the population were below the poverty line, including 17.2% of those under age 18 and 8.3% of those age 65 or over.
Economy
Agriculture is the main economic activity in Blaine County. The county is home to several large farms, and the main crops grown are corn, soybeans, and wheat. Cattle ranching is also an important part of the local economy.
The county is also home to several small businesses, including a few restaurants, a grocery store, and a few retail stores. The county is served by two airports, the Brewster Municipal Airport and the Dunning Airport.
Blaine County is home to several recreational activities, including hunting, fishing, camping, and hiking. The county is also home to several state parks, including the Fort Robinson State Park and the Niobrara State Park.
Conclusion
Blaine County is a rural county located in the state of Nebraska. It is mostly flat with rolling hills, and is home to several large farms and ranches. The main economic activity in the county is agriculture, and the county is also home to several small businesses. The county is also home to several recreational activities, including hunting, fishing, camping, and hiking.
Common Questions
What is Per Capita Income in Blaine County?
Per Capita income in Blaine County is $40,093.
What is the Median Family Income in Blaine County?
Median Family Income in Blaine County is $56,000.
What is the Median Household income in Blaine County?
Median Household Income in Blaine County is $52,083.
What is Income or Wage Gap in Blaine County?
Income or Wage Gap in Blaine County is 19.2%.
Women in Blaine County earn 80.8 cents for every dollar earned by a man.
What is Inequality or Gini Index in Blaine County?
Inequality or Gini Index in Blaine County is 0.51.
What is the Total Population of Blaine County?
Total Population of Blaine County is 384.
What is the Total Male Population of Blaine County?
Total Male Population of Blaine County is 204.
What is the Total Female Population of Blaine County?
Total Female Population of Blaine County is 180.
What is the Ratio of Males per 100 Females in Blaine County?
There are 113.33 Males per 100 Females in Blaine County.
What is the Ratio of Females per 100 Males in Blaine County?
There are 88.24 Females per 100 Males in Blaine County.
What is the Median Population Age in Blaine County?
Median Population Age in Blaine County is 57.7 Years.
What is the Average Family Size in Blaine County
Average Family Size in Blaine County is 2.5 People.
What is the Average Household Size in Blaine County
Average Household Size in Blaine County is 1.9 People.
How Large is the Labor Force in Blaine County?
There are 210 People in the Labor Forcein in Blaine County.
What is the Percentage of People in the Labor Force in Blaine County?
64.2% of People are in the Labor Force in Blaine County.
What is the Unemployment Rate in Blaine County?
Unemployment Rate in Blaine County is 1.9%.