Burwell, NE Map & Demographics
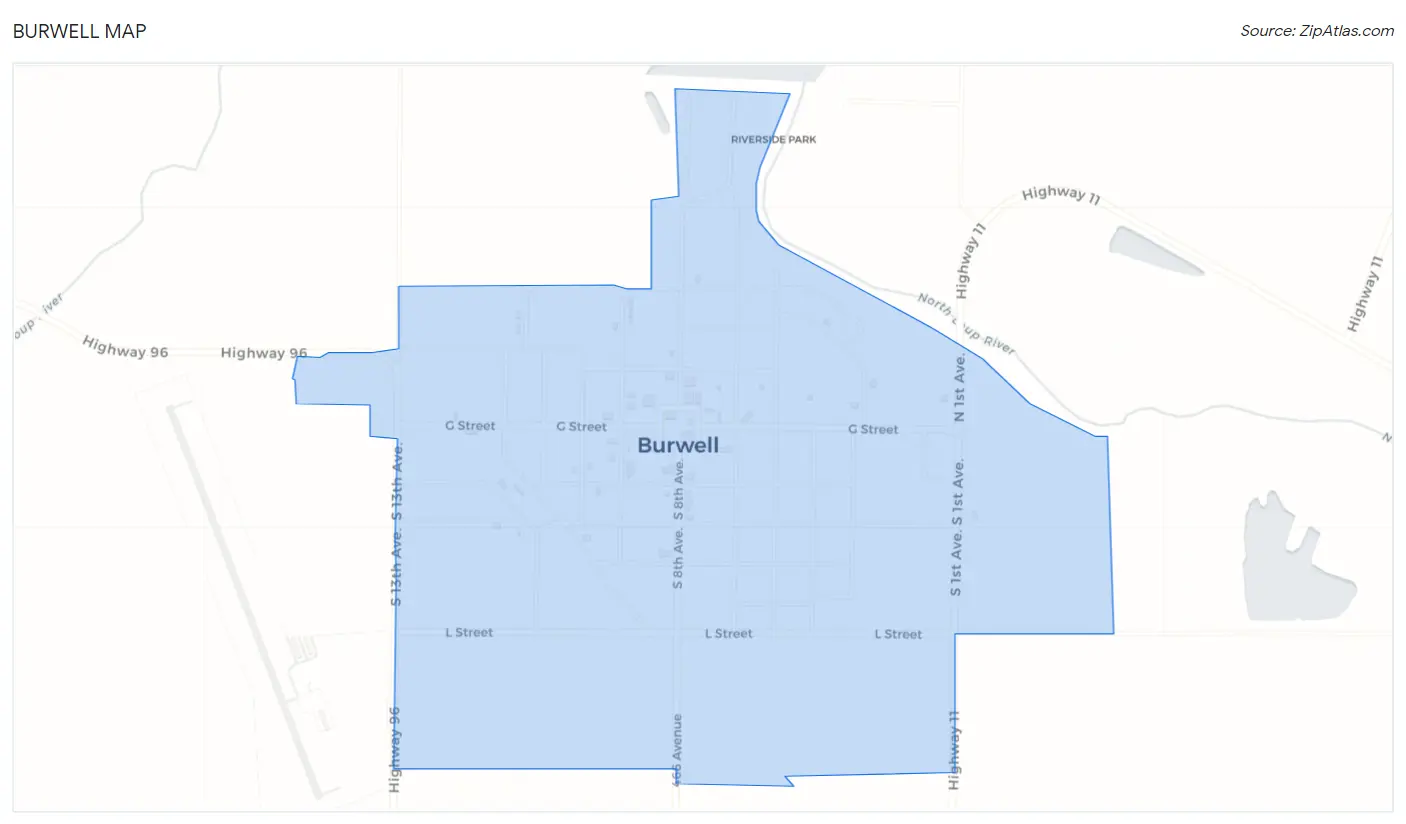
Burwell Map
Burwell Overview
$29,847
PER CAPITA INCOME
$76,731
AVG FAMILY INCOME
$65,313
AVG HOUSEHOLD INCOME
47.2%
WAGE / INCOME GAP [ % ]
52.8¢/ $1
WAGE / INCOME GAP [ $ ]
0.37
INEQUALITY / GINI INDEX
938
TOTAL POPULATION
468
MALE POPULATION
470
FEMALE POPULATION
99.57
MALES / 100 FEMALES
100.43
FEMALES / 100 MALES
50.5
MEDIAN AGE
2.7
AVG FAMILY SIZE
2.2
AVG HOUSEHOLD SIZE
457
LABOR FORCE [ PEOPLE ]
59.1%
PERCENT IN LABOR FORCE
2.4%
UNEMPLOYMENT RATE
Burwell Zip Codes
Burwell Area Codes
Income in Burwell
Income Overview in Burwell
Per Capita Income in Burwell is $29,847, while median incomes of families and households are $76,731 and $65,313 respectively.
| Characteristic | Number | Measure |
| Per Capita Income | 938 | $29,847 |
| Median Family Income | 250 | $76,731 |
| Mean Family Income | 250 | $82,847 |
| Median Household Income | 406 | $65,313 |
| Mean Household Income | 406 | $64,721 |
| Income Deficit | 250 | $0 |
| Wage / Income Gap (%) | 938 | 47.20% |
| Wage / Income Gap ($) | 938 | 52.80¢ per $1 |
| Gini / Inequality Index | 938 | 0.37 |
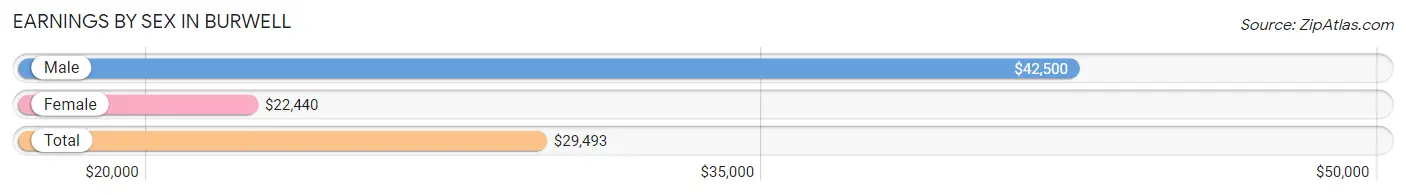
Earnings by Sex in Burwell
Average Earnings in Burwell are $29,493, $42,500 for men and $22,440 for women, a difference of 47.2%.
| Sex | Number | Average Earnings |
| Male | 288 (54.4%) | $42,500 |
| Female | 241 (45.6%) | $22,440 |
| Total | 529 (100.0%) | $29,493 |
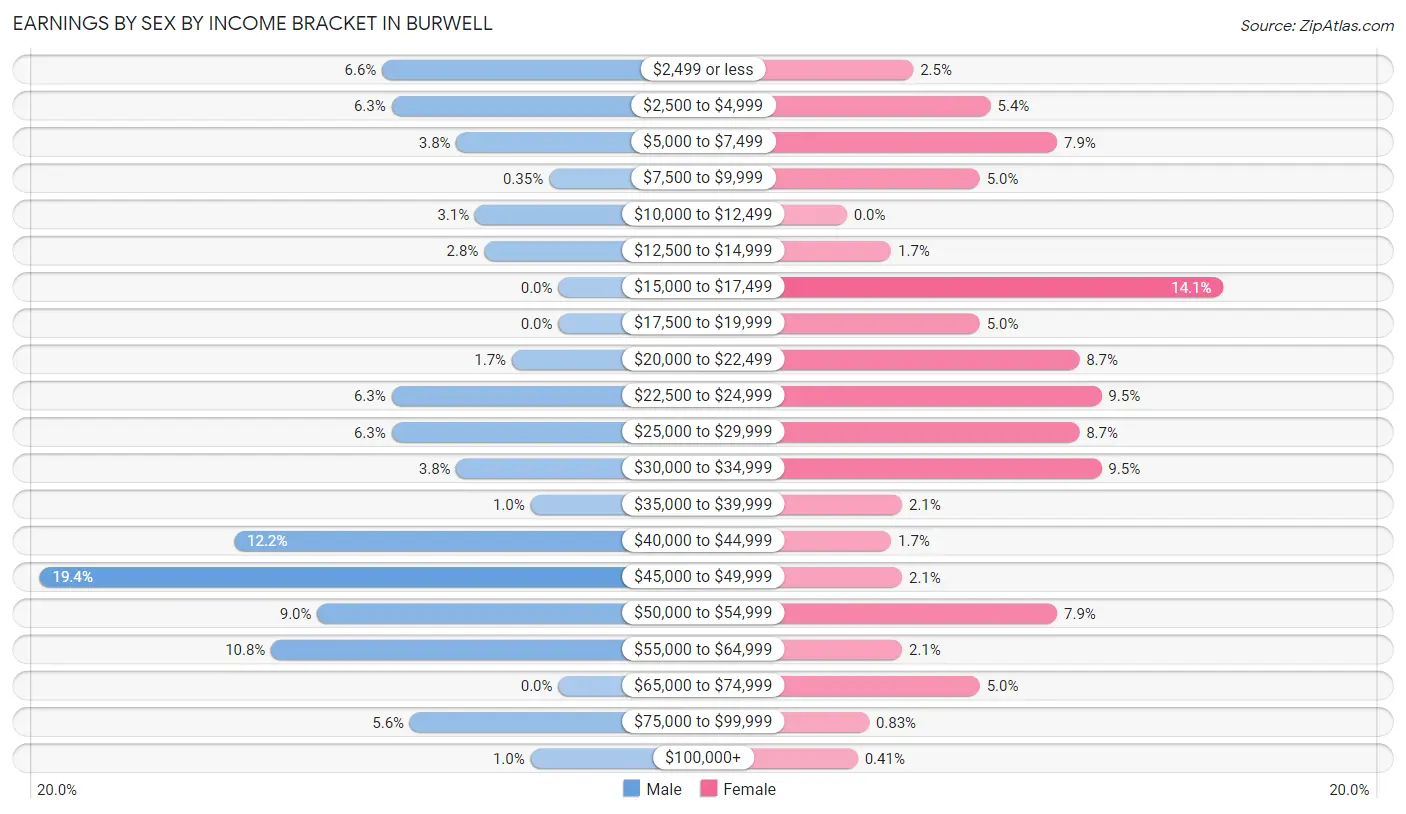
Earnings by Sex by Income Bracket in Burwell
The most common earnings brackets in Burwell are $45,000 to $49,999 for men (56 | 19.4%) and $15,000 to $17,499 for women (34 | 14.1%).
| Income | Male | Female |
| $2,499 or less | 19 (6.6%) | 6 (2.5%) |
| $2,500 to $4,999 | 18 (6.2%) | 13 (5.4%) |
| $5,000 to $7,499 | 11 (3.8%) | 19 (7.9%) |
| $7,500 to $9,999 | 1 (0.4%) | 12 (5.0%) |
| $10,000 to $12,499 | 9 (3.1%) | 0 (0.0%) |
| $12,500 to $14,999 | 8 (2.8%) | 4 (1.7%) |
| $15,000 to $17,499 | 0 (0.0%) | 34 (14.1%) |
| $17,500 to $19,999 | 0 (0.0%) | 12 (5.0%) |
| $20,000 to $22,499 | 5 (1.7%) | 21 (8.7%) |
| $22,500 to $24,999 | 18 (6.2%) | 23 (9.5%) |
| $25,000 to $29,999 | 18 (6.2%) | 21 (8.7%) |
| $30,000 to $34,999 | 11 (3.8%) | 23 (9.5%) |
| $35,000 to $39,999 | 3 (1.0%) | 5 (2.1%) |
| $40,000 to $44,999 | 35 (12.1%) | 4 (1.7%) |
| $45,000 to $49,999 | 56 (19.4%) | 5 (2.1%) |
| $50,000 to $54,999 | 26 (9.0%) | 19 (7.9%) |
| $55,000 to $64,999 | 31 (10.8%) | 5 (2.1%) |
| $65,000 to $74,999 | 0 (0.0%) | 12 (5.0%) |
| $75,000 to $99,999 | 16 (5.6%) | 2 (0.8%) |
| $100,000+ | 3 (1.0%) | 1 (0.4%) |
| Total | 288 (100.0%) | 241 (100.0%) |
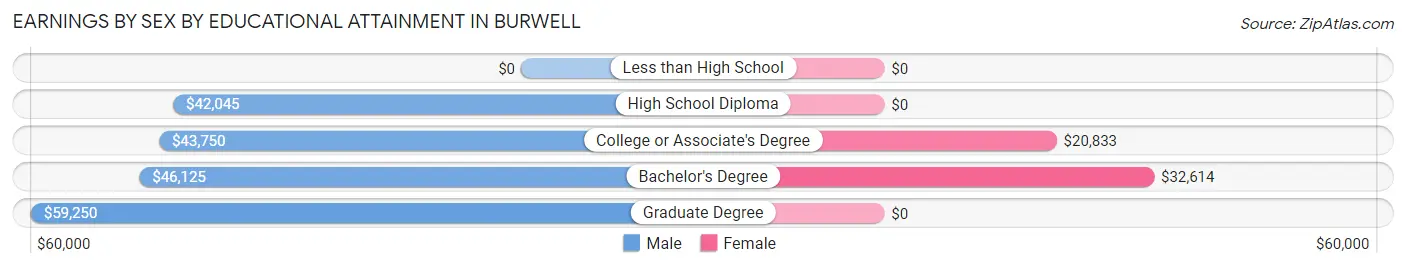
Earnings by Sex by Educational Attainment in Burwell
Average earnings in Burwell are $45,880 for men and $22,663 for women, a difference of 50.6%. Men with an educational attainment of graduate degree enjoy the highest average annual earnings of $59,250, while those with high school diploma education earn the least with $42,045. Women with an educational attainment of bachelor's degree earn the most with the average annual earnings of $32,614, while those with college or associate's degree education have the smallest earnings of $20,833.
| Educational Attainment | Male Income | Female Income |
| Less than High School | - | - |
| High School Diploma | $42,045 | $0 |
| College or Associate's Degree | $43,750 | $20,833 |
| Bachelor's Degree | $46,125 | $32,614 |
| Graduate Degree | $59,250 | $0 |
| Total | $45,880 | $22,663 |
Family Income in Burwell
Family Income Brackets in Burwell
According to the Burwell family income data, there are 94 families falling into the $75,000 to $99,999 income range, which is the most common income bracket and makes up 37.6% of all families.
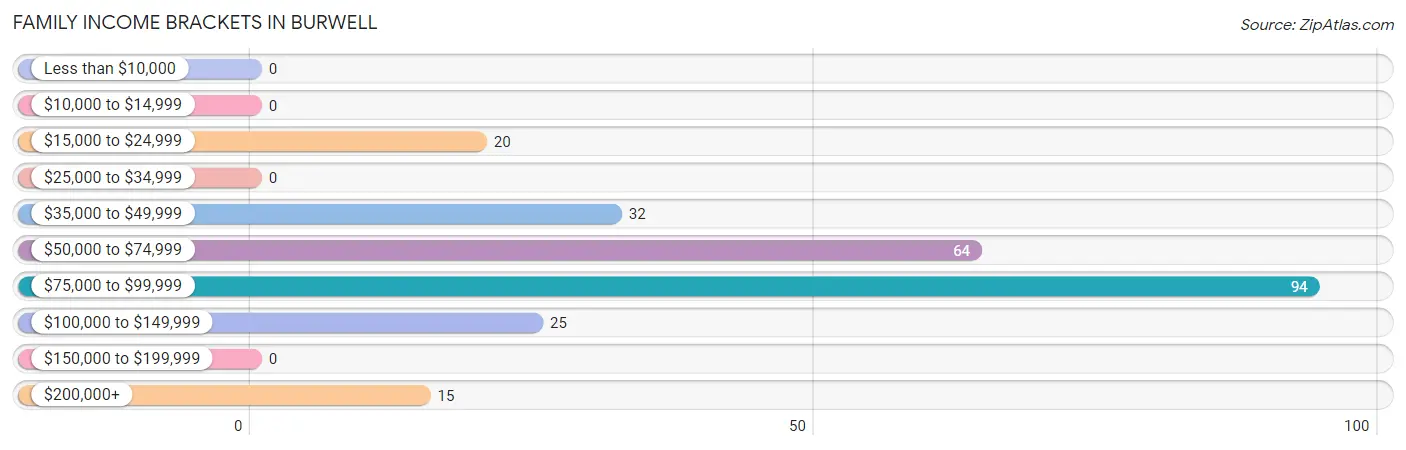
| Income Bracket | # Families | % Families |
| Less than $10,000 | 0 | 0.0% |
| $10,000 to $14,999 | 0 | 0.0% |
| $15,000 to $24,999 | 20 | 8.0% |
| $25,000 to $34,999 | 0 | 0.0% |
| $35,000 to $49,999 | 32 | 12.8% |
| $50,000 to $74,999 | 64 | 25.6% |
| $75,000 to $99,999 | 94 | 37.6% |
| $100,000 to $149,999 | 25 | 10.0% |
| $150,000 to $199,999 | 0 | 0.0% |
| $200,000+ | 15 | 6.0% |
Family Income by Famaliy Size in Burwell
2-person families (150 | 60.0%) account for the highest median family income in Burwell with $80,909 per family, while 2-person families (150 | 60.0%) have the highest median income of $40,454 per family member.
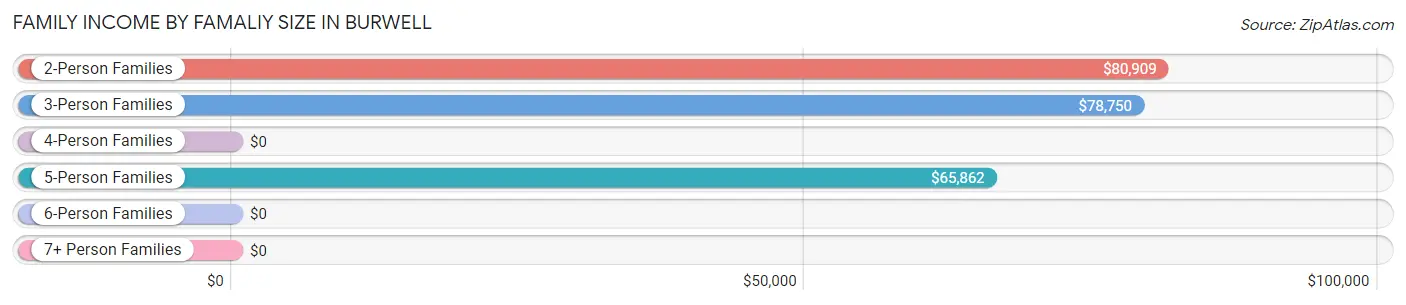
| Income Bracket | # Families | Median Income |
| 2-Person Families | 150 (60.0%) | $80,909 |
| 3-Person Families | 62 (24.8%) | $78,750 |
| 4-Person Families | 0 (0.0%) | $0 |
| 5-Person Families | 38 (15.2%) | $65,862 |
| 6-Person Families | 0 (0.0%) | $0 |
| 7+ Person Families | 0 (0.0%) | $0 |
| Total | 250 (100.0%) | $76,731 |
Family Income by Number of Earners in Burwell
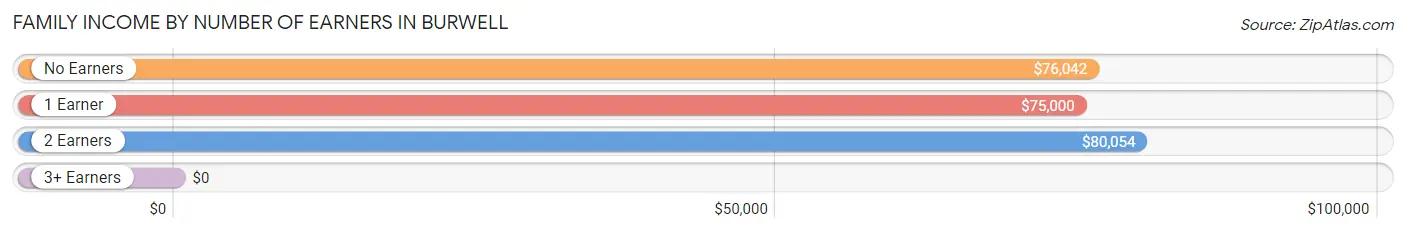
| Number of Earners | # Families | Median Income |
| No Earners | 27 (10.8%) | $76,042 |
| 1 Earner | 58 (23.2%) | $75,000 |
| 2 Earners | 151 (60.4%) | $80,054 |
| 3+ Earners | 14 (5.6%) | $0 |
| Total | 250 (100.0%) | $76,731 |
Household Income in Burwell
Household Income Brackets in Burwell
With 103 households falling in the category, the $75,000 to $99,999 income range is the most frequent in Burwell, accounting for 25.4% of all households.
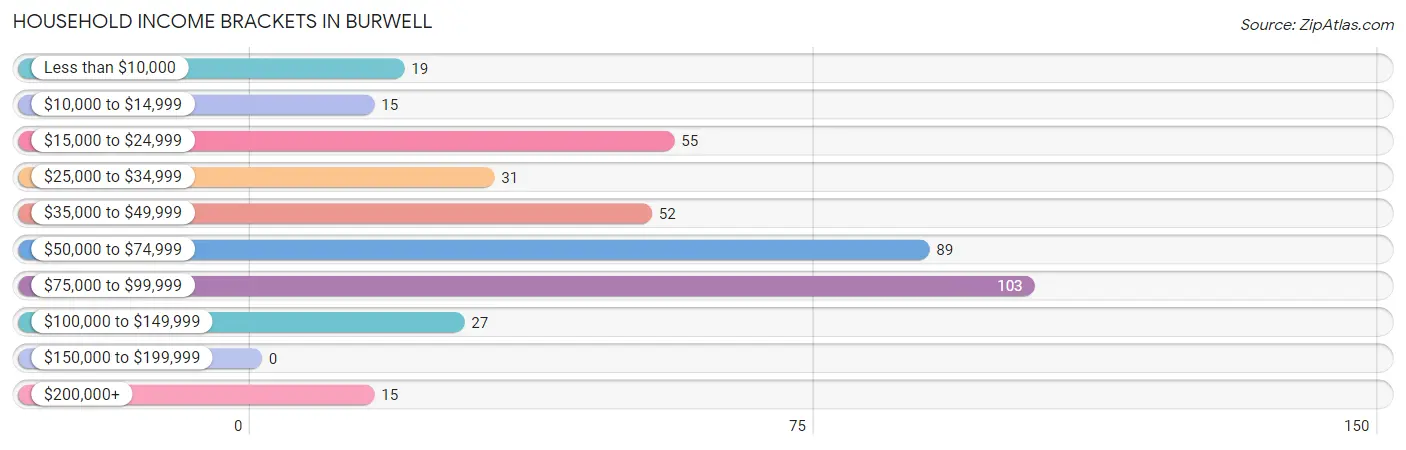
| Income Bracket | # Households | % Households |
| Less than $10,000 | 19 | 4.7% |
| $10,000 to $14,999 | 15 | 3.7% |
| $15,000 to $24,999 | 55 | 13.5% |
| $25,000 to $34,999 | 31 | 7.6% |
| $35,000 to $49,999 | 52 | 12.8% |
| $50,000 to $74,999 | 89 | 21.9% |
| $75,000 to $99,999 | 103 | 25.4% |
| $100,000 to $149,999 | 27 | 6.7% |
| $150,000 to $199,999 | 0 | 0.0% |
| $200,000+ | 15 | 3.7% |
Household Income by Householder Age in Burwell
The median household income in Burwell is $65,313, with the highest median household income of $71,786 found in the 45 to 64 years age bracket for the primary householder. A total of 108 households (26.6%) fall into this category. Meanwhile, the 15 to 24 years age bracket for the primary householder has the lowest median household income of $0, with 10 households (2.5%) in this group.
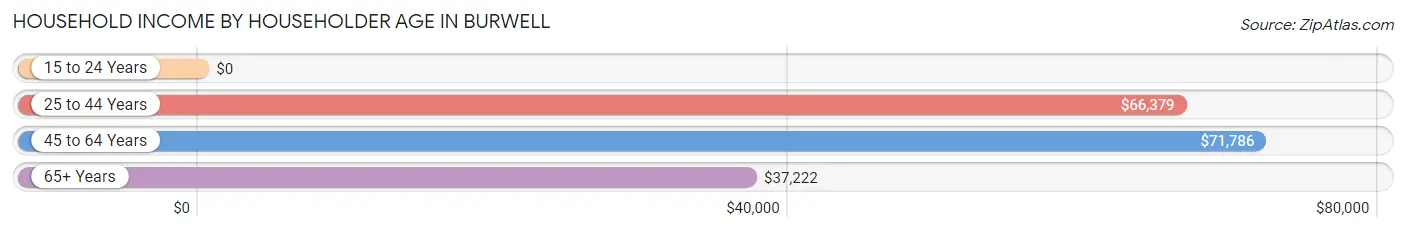
| Income Bracket | # Households | Median Income |
| 15 to 24 Years | 10 (2.5%) | $0 |
| 25 to 44 Years | 122 (30.0%) | $66,379 |
| 45 to 64 Years | 108 (26.6%) | $71,786 |
| 65+ Years | 166 (40.9%) | $37,222 |
| Total | 406 (100.0%) | $65,313 |
Poverty in Burwell
Income Below Poverty by Sex and Age in Burwell
With 9.5% poverty level for males and 7.8% for females among the residents of Burwell, 6 to 11 year old males and 35 to 44 year old females are the most vulnerable to poverty, with 20 males (80.0%) and 9 females (28.1%) in their respective age groups living below the poverty level.
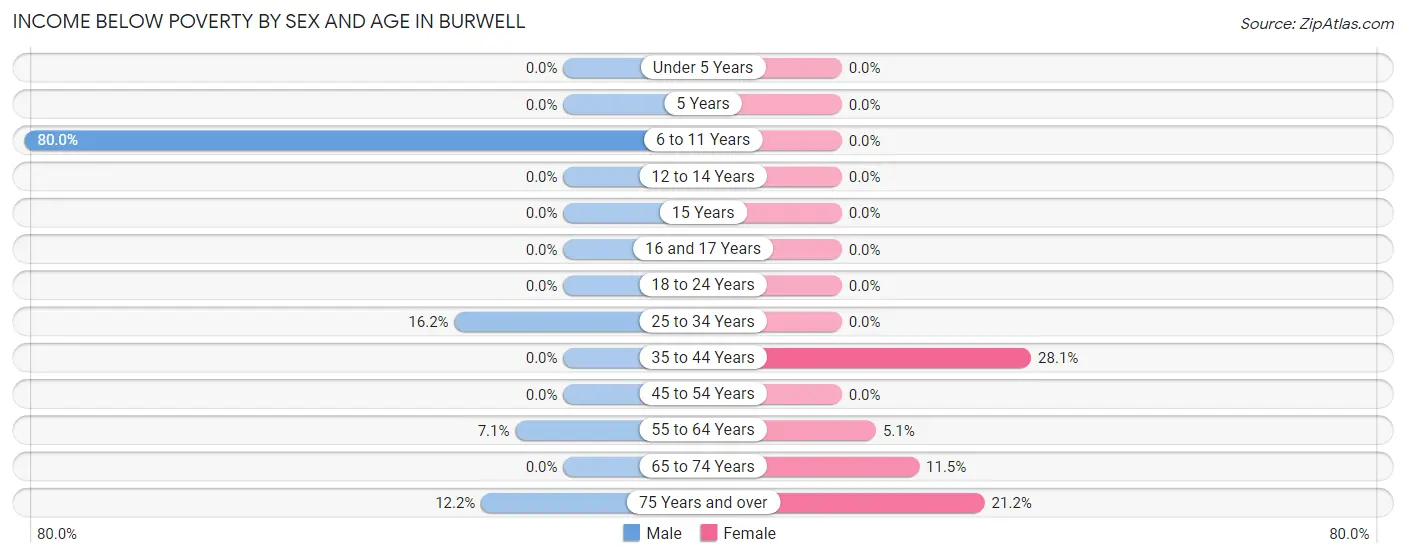
| Age Bracket | Male | Female |
| Under 5 Years | 0 (0.0%) | 0 (0.0%) |
| 5 Years | 0 (0.0%) | 0 (0.0%) |
| 6 to 11 Years | 20 (80.0%) | 0 (0.0%) |
| 12 to 14 Years | 0 (0.0%) | 0 (0.0%) |
| 15 Years | 0 (0.0%) | 0 (0.0%) |
| 16 and 17 Years | 0 (0.0%) | 0 (0.0%) |
| 18 to 24 Years | 0 (0.0%) | 0 (0.0%) |
| 25 to 34 Years | 11 (16.2%) | 0 (0.0%) |
| 35 to 44 Years | 0 (0.0%) | 9 (28.1%) |
| 45 to 54 Years | 0 (0.0%) | 0 (0.0%) |
| 55 to 64 Years | 5 (7.1%) | 3 (5.1%) |
| 65 to 74 Years | 0 (0.0%) | 7 (11.5%) |
| 75 Years and over | 5 (12.2%) | 14 (21.2%) |
| Total | 41 (9.5%) | 33 (7.8%) |
Income Above Poverty by Sex and Age in Burwell
According to the poverty statistics in Burwell, males aged under 5 years and females aged under 5 years are the age groups that are most secure financially, with 100.0% of males and 100.0% of females in these age groups living above the poverty line.
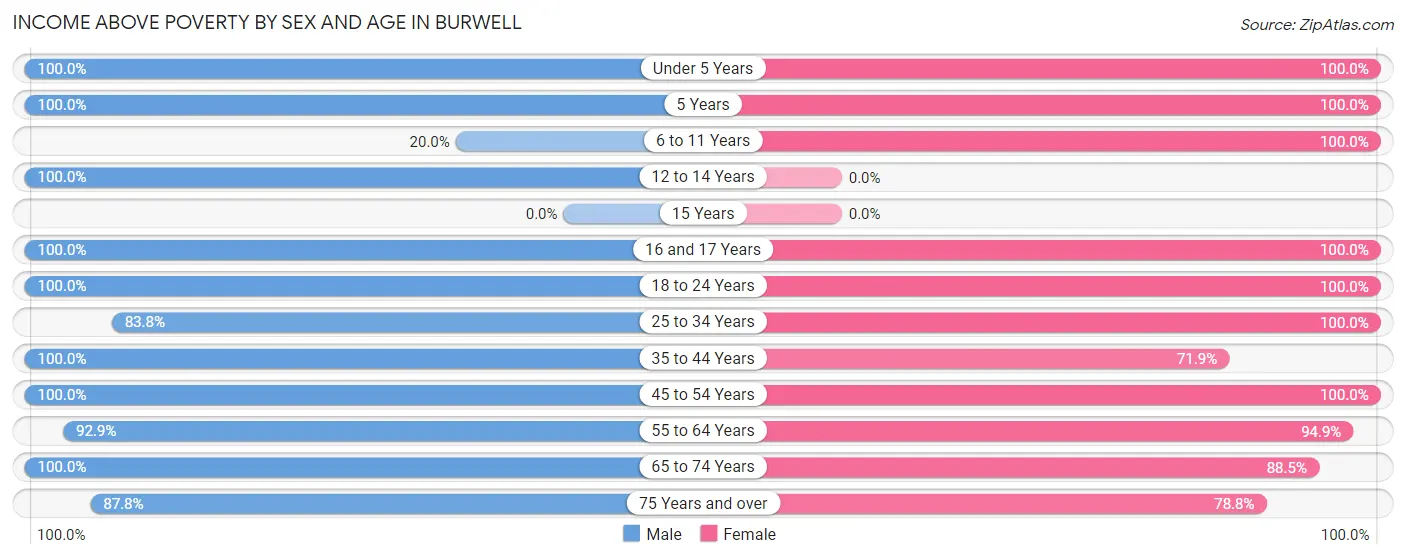
| Age Bracket | Male | Female |
| Under 5 Years | 6 (100.0%) | 10 (100.0%) |
| 5 Years | 5 (100.0%) | 32 (100.0%) |
| 6 to 11 Years | 5 (20.0%) | 37 (100.0%) |
| 12 to 14 Years | 30 (100.0%) | 0 (0.0%) |
| 15 Years | 0 (0.0%) | 0 (0.0%) |
| 16 and 17 Years | 19 (100.0%) | 20 (100.0%) |
| 18 to 24 Years | 24 (100.0%) | 16 (100.0%) |
| 25 to 34 Years | 57 (83.8%) | 58 (100.0%) |
| 35 to 44 Years | 25 (100.0%) | 23 (71.9%) |
| 45 to 54 Years | 30 (100.0%) | 34 (100.0%) |
| 55 to 64 Years | 65 (92.9%) | 56 (94.9%) |
| 65 to 74 Years | 89 (100.0%) | 54 (88.5%) |
| 75 Years and over | 36 (87.8%) | 52 (78.8%) |
| Total | 391 (90.5%) | 392 (92.2%) |
Income Below Poverty Among Married-Couple Families in Burwell
| Children | Above Poverty | Below Poverty |
| No Children | 153 (100.0%) | 0 (0.0%) |
| 1 or 2 Children | 37 (100.0%) | 0 (0.0%) |
| 3 or 4 Children | 29 (100.0%) | 0 (0.0%) |
| 5 or more Children | 0 (0.0%) | 0 (0.0%) |
| Total | 219 (100.0%) | 0 (0.0%) |
Income Below Poverty Among Single-Parent Households in Burwell
According to the poverty data in Burwell, 100.0% or 11 single-father households and 45.0% or 9 single-mother households are living below the poverty line. Among single-father households, those with 1 or 2 children have the highest poverty rate, with 11 households (100.0%) experiencing poverty. Likewise, among single-mother households, those with 1 or 2 children have the highest poverty rate, with 9 households (81.8%) falling below the poverty line.
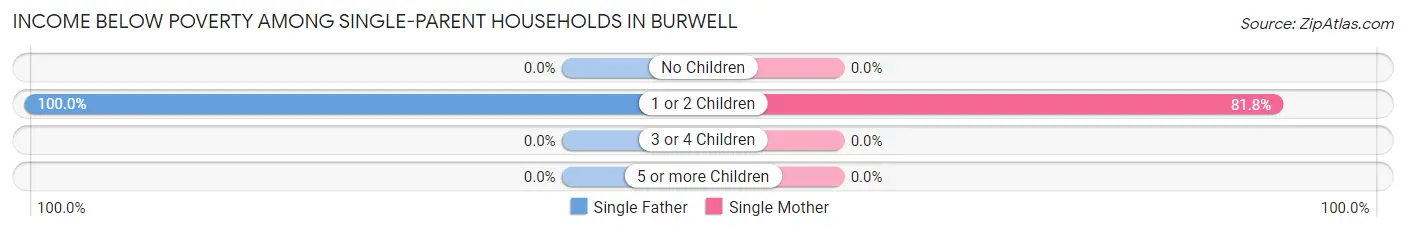
| Children | Single Father | Single Mother |
| No Children | 0 (0.0%) | 0 (0.0%) |
| 1 or 2 Children | 11 (100.0%) | 9 (81.8%) |
| 3 or 4 Children | 0 (0.0%) | 0 (0.0%) |
| 5 or more Children | 0 (0.0%) | 0 (0.0%) |
| Total | 11 (100.0%) | 9 (45.0%) |
Income Below Poverty Among Married-Couple vs Single-Parent Households in Burwell
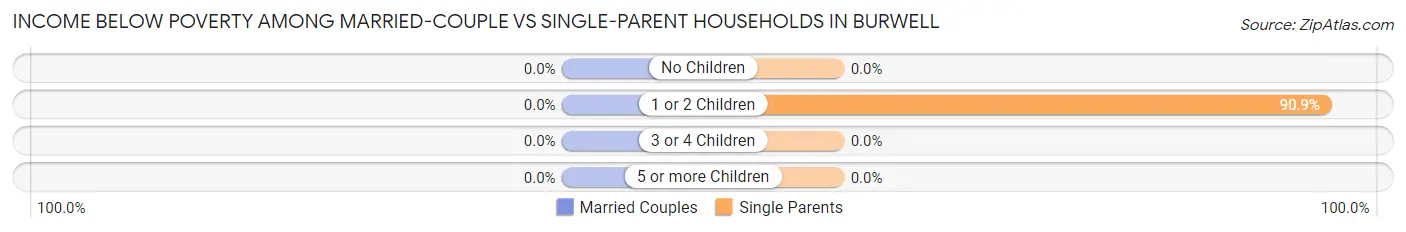
| Children | Married-Couple Families | Single-Parent Households |
| No Children | 0 (0.0%) | 0 (0.0%) |
| 1 or 2 Children | 0 (0.0%) | 20 (90.9%) |
| 3 or 4 Children | 0 (0.0%) | 0 (0.0%) |
| 5 or more Children | 0 (0.0%) | 0 (0.0%) |
| Total | 0 (0.0%) | 20 (64.5%) |
Race in Burwell
The most populous races in Burwell are White / Caucasian (878 | 93.6%), Hispanic or Latino (39 | 4.2%), and Some other Race (39 | 4.2%).
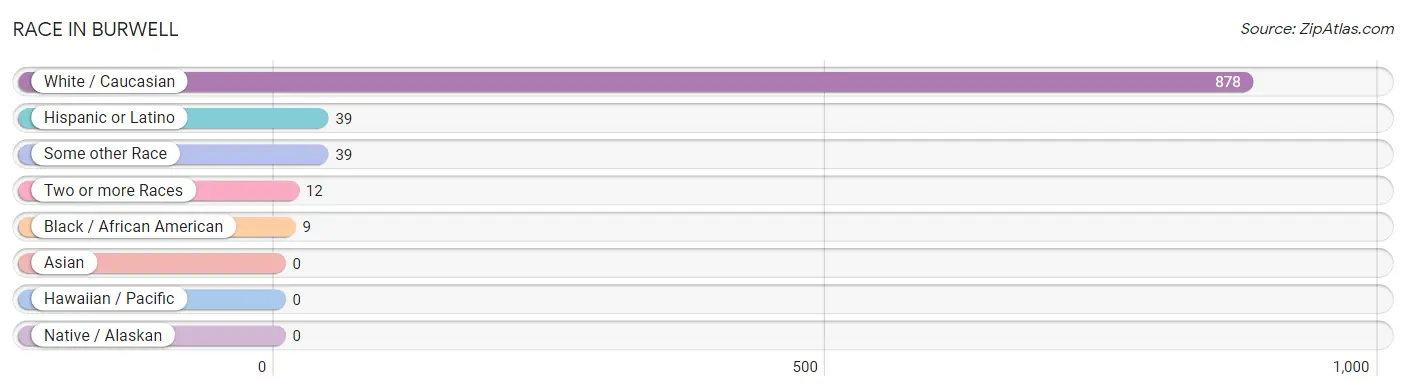
| Race | # Population | % Population |
| Asian | 0 | 0.0% |
| Black / African American | 9 | 1.0% |
| Hawaiian / Pacific | 0 | 0.0% |
| Hispanic or Latino | 39 | 4.2% |
| Native / Alaskan | 0 | 0.0% |
| White / Caucasian | 878 | 93.6% |
| Two or more Races | 12 | 1.3% |
| Some other Race | 39 | 4.2% |
| Total | 938 | 100.0% |
Ancestry in Burwell
The most populous ancestries reported in Burwell are German (315 | 33.6%), Irish (126 | 13.4%), English (112 | 11.9%), Mexican (39 | 4.2%), and Norwegian (32 | 3.4%), together accounting for 66.5% of all Burwell residents.
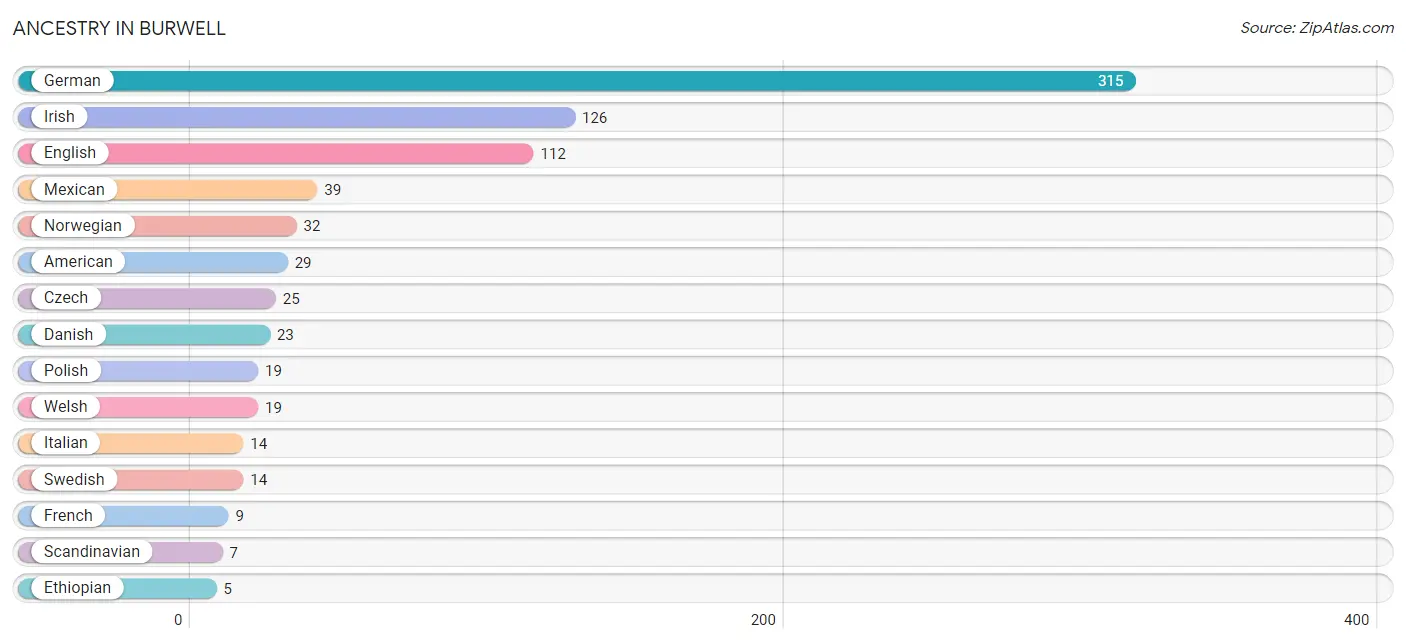
| Ancestry | # Population | % Population |
| American | 29 | 3.1% |
| Belgian | 4 | 0.4% |
| Cherokee | 1 | 0.1% |
| Czech | 25 | 2.7% |
| Danish | 23 | 2.5% |
| Eastern European | 3 | 0.3% |
| English | 112 | 11.9% |
| Ethiopian | 5 | 0.5% |
| European | 3 | 0.3% |
| French | 9 | 1.0% |
| German | 315 | 33.6% |
| Irish | 126 | 13.4% |
| Italian | 14 | 1.5% |
| Mexican | 39 | 4.2% |
| Norwegian | 32 | 3.4% |
| Polish | 19 | 2.0% |
| Scandinavian | 7 | 0.7% |
| Scottish | 3 | 0.3% |
| Subsaharan African | 5 | 0.5% |
| Swedish | 14 | 1.5% |
| Swiss | 5 | 0.5% |
| Welsh | 19 | 2.0% | View All 22 Rows |
Immigrants in Burwell
The most numerous immigrant groups reported in Burwell came from Africa (5 | 0.5%), Eastern Africa (5 | 0.5%), and Ethiopia (5 | 0.5%), together accounting for 1.6% of all Burwell residents.
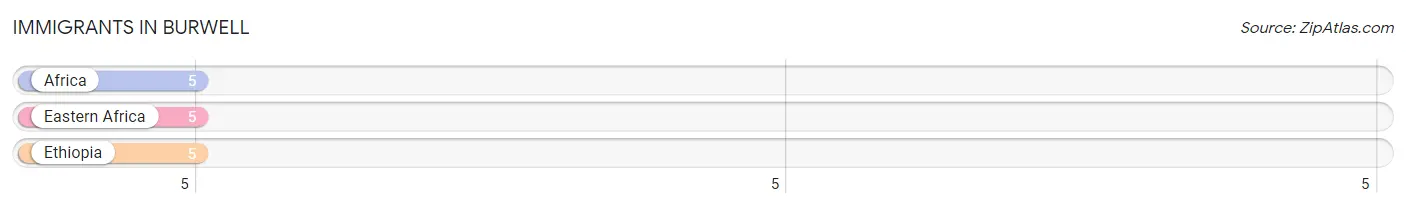
| Immigration Origin | # Population | % Population |
| Africa | 5 | 0.5% |
| Eastern Africa | 5 | 0.5% |
| Ethiopia | 5 | 0.5% | View All 3 Rows |
Sex and Age in Burwell
Sex and Age in Burwell
The most populous age groups in Burwell are 10 to 14 Years (63 | 13.5%) for men and 5 to 9 Years (51 | 10.8%) for women.
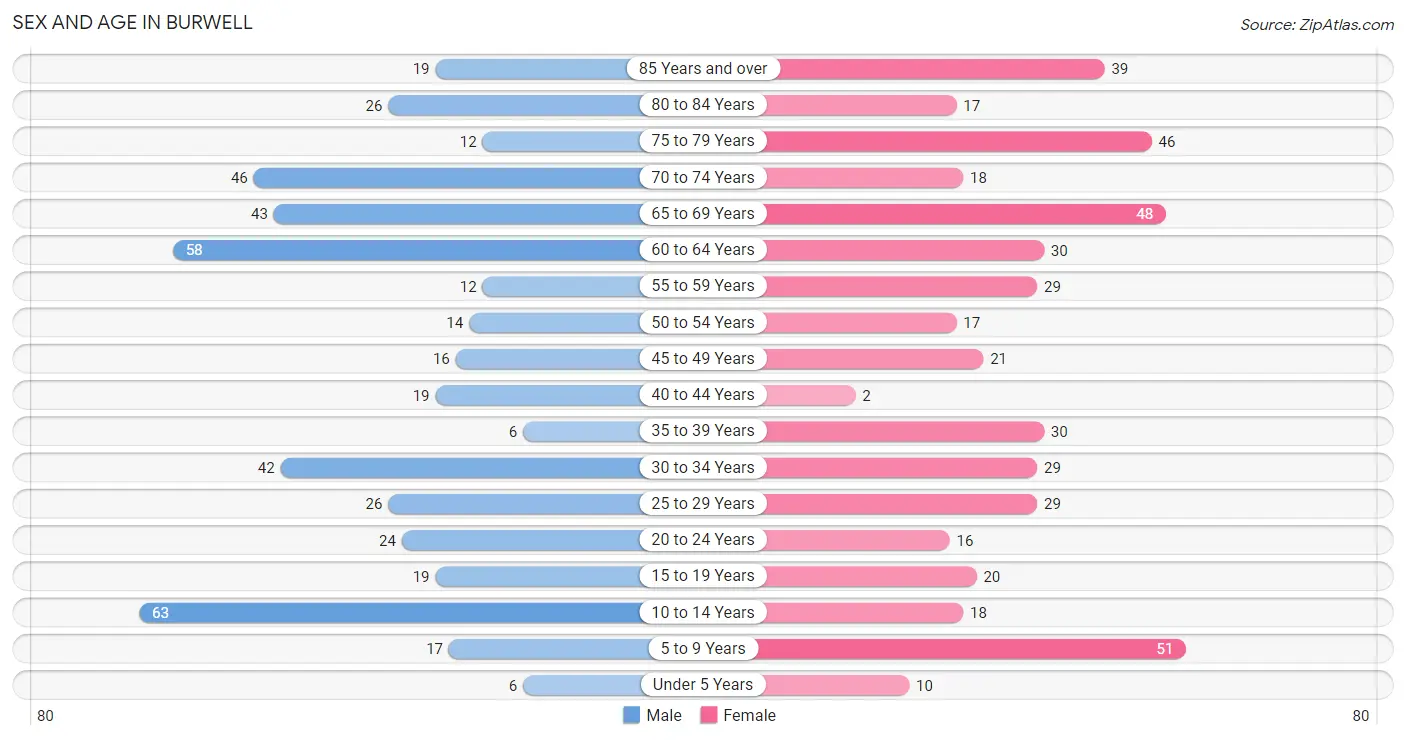
| Age Bracket | Male | Female |
| Under 5 Years | 6 (1.3%) | 10 (2.1%) |
| 5 to 9 Years | 17 (3.6%) | 51 (10.8%) |
| 10 to 14 Years | 63 (13.5%) | 18 (3.8%) |
| 15 to 19 Years | 19 (4.1%) | 20 (4.3%) |
| 20 to 24 Years | 24 (5.1%) | 16 (3.4%) |
| 25 to 29 Years | 26 (5.6%) | 29 (6.2%) |
| 30 to 34 Years | 42 (9.0%) | 29 (6.2%) |
| 35 to 39 Years | 6 (1.3%) | 30 (6.4%) |
| 40 to 44 Years | 19 (4.1%) | 2 (0.4%) |
| 45 to 49 Years | 16 (3.4%) | 21 (4.5%) |
| 50 to 54 Years | 14 (3.0%) | 17 (3.6%) |
| 55 to 59 Years | 12 (2.6%) | 29 (6.2%) |
| 60 to 64 Years | 58 (12.4%) | 30 (6.4%) |
| 65 to 69 Years | 43 (9.2%) | 48 (10.2%) |
| 70 to 74 Years | 46 (9.8%) | 18 (3.8%) |
| 75 to 79 Years | 12 (2.6%) | 46 (9.8%) |
| 80 to 84 Years | 26 (5.6%) | 17 (3.6%) |
| 85 Years and over | 19 (4.1%) | 39 (8.3%) |
| Total | 468 (100.0%) | 470 (100.0%) |
Families and Households in Burwell
Median Family Size in Burwell
The median family size in Burwell is 2.66 persons per family, with single female/mother families (20 | 8.0%) accounting for the largest median family size of 4.65 persons per family. On the other hand, single male/father families (11 | 4.4%) represent the smallest median family size with 1.27 persons per family.
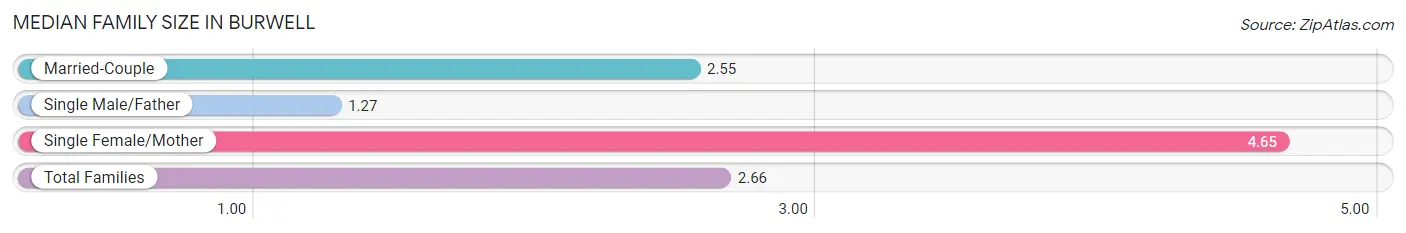
| Family Type | # Families | Family Size |
| Married-Couple | 219 (87.6%) | 2.55 |
| Single Male/Father | 11 (4.4%) | 1.27 |
| Single Female/Mother | 20 (8.0%) | 4.65 |
| Total Families | 250 (100.0%) | 2.66 |
Median Household Size in Burwell
The median household size in Burwell is 2.16 persons per household, with single female/mother households (20 | 4.9%) accounting for the largest median household size of 4.85 persons per household. non-family households (156 | 38.4%) represent the smallest median household size with 1.20 persons per household.
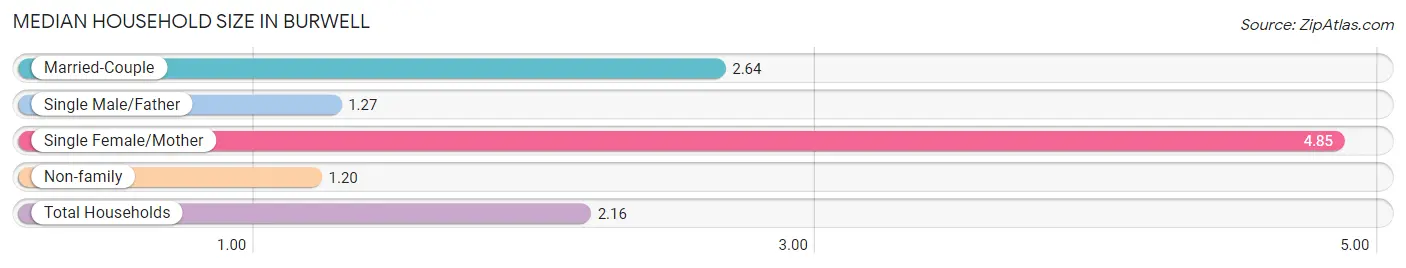
| Household Type | # Households | Household Size |
| Married-Couple | 219 (53.9%) | 2.64 |
| Single Male/Father | 11 (2.7%) | 1.27 |
| Single Female/Mother | 20 (4.9%) | 4.85 |
| Non-family | 156 (38.4%) | 1.20 |
| Total Households | 406 (100.0%) | 2.16 |
Household Size by Marriage Status in Burwell
Out of a total of 406 households in Burwell, 250 (61.6%) are family households, while 156 (38.4%) are nonfamily households. The most numerous type of family households are 2-person households, comprising 150, and the most common type of nonfamily households are 1-person households, comprising 126.
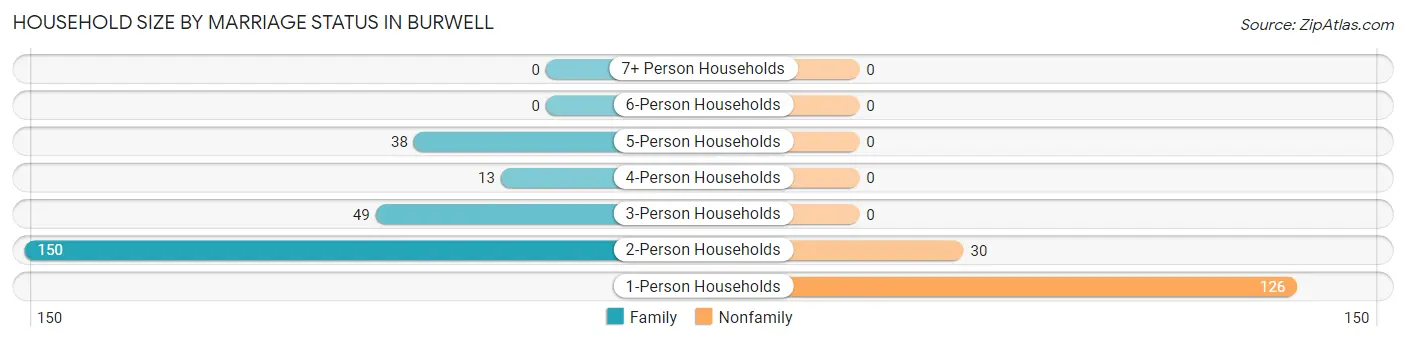
| Household Size | Family Households | Nonfamily Households |
| 1-Person Households | - | 126 (31.0%) |
| 2-Person Households | 150 (36.9%) | 30 (7.4%) |
| 3-Person Households | 49 (12.1%) | 0 (0.0%) |
| 4-Person Households | 13 (3.2%) | 0 (0.0%) |
| 5-Person Households | 38 (9.4%) | 0 (0.0%) |
| 6-Person Households | 0 (0.0%) | 0 (0.0%) |
| 7+ Person Households | 0 (0.0%) | 0 (0.0%) |
| Total | 250 (61.6%) | 156 (38.4%) |
Female Fertility in Burwell
Fertility by Age in Burwell
Average fertility rate in Burwell is 34.0 births per 1,000 women. Women in the age bracket of 20 to 34 years have the highest fertility rate with 68.0 births per 1,000 women. Women in the age bracket of 20 to 34 years acount for 100.0% of all women with births.
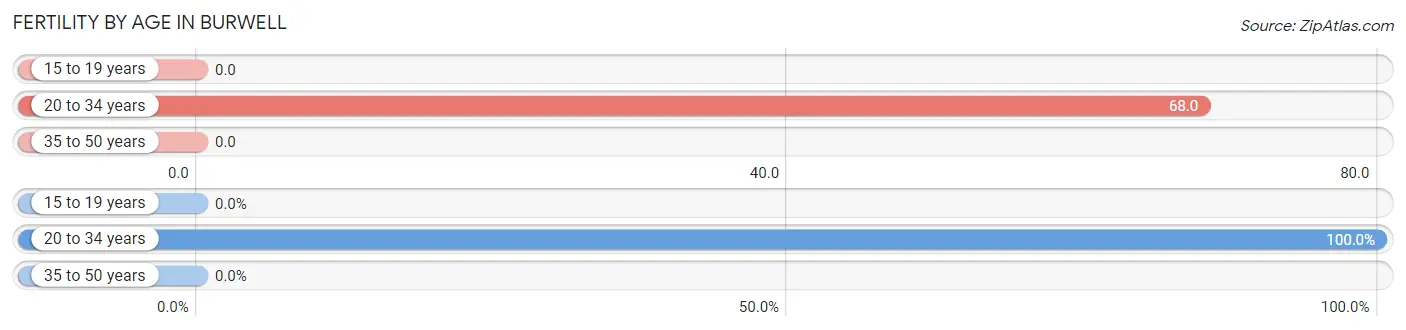
| Age Bracket | Women with Births | Births / 1,000 Women |
| 15 to 19 years | 0 (0.0%) | 0.0 |
| 20 to 34 years | 5 (100.0%) | 68.0 |
| 35 to 50 years | 0 (0.0%) | 0.0 |
| Total | 5 (100.0%) | 34.0 |
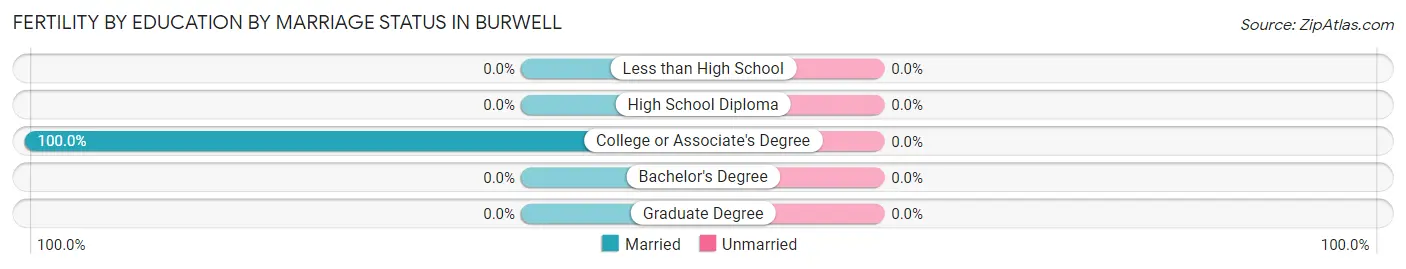
Fertility by Age by Marriage Status in Burwell
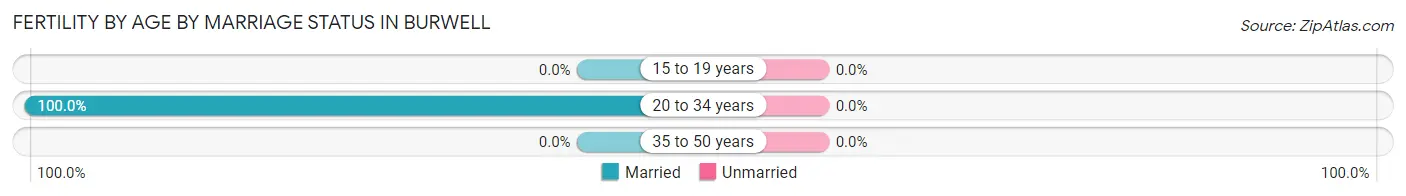
| Age Bracket | Married | Unmarried |
| 15 to 19 years | 0 (0.0%) | 0 (0.0%) |
| 20 to 34 years | 5 (100.0%) | 0 (0.0%) |
| 35 to 50 years | 0 (0.0%) | 0 (0.0%) |
| Total | 5 (100.0%) | 0 (0.0%) |
Fertility by Education in Burwell
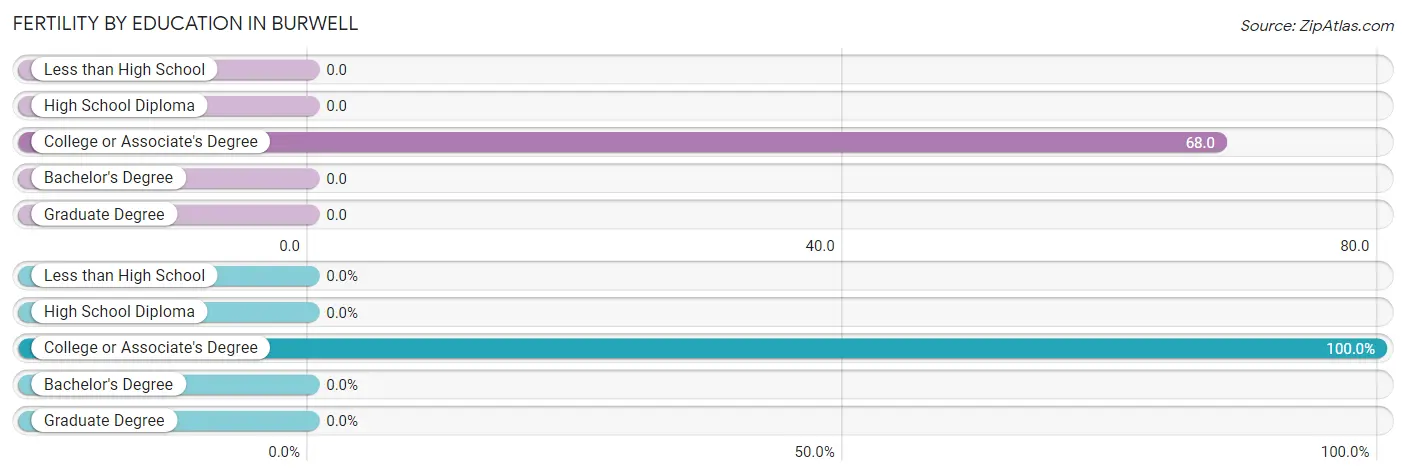
| Educational Attainment | Women with Births | Births / 1,000 Women |
| Less than High School | 0 (0.0%) | 0.0 |
| High School Diploma | 0 (0.0%) | 0.0 |
| College or Associate's Degree | 5 (100.0%) | 68.0 |
| Bachelor's Degree | 0 (0.0%) | 0.0 |
| Graduate Degree | 0 (0.0%) | 0.0 |
| Total | 5 (100.0%) | 34.0 |
Fertility by Education by Marriage Status in Burwell
| Educational Attainment | Married | Unmarried |
| Less than High School | 0 (0.0%) | 0 (0.0%) |
| High School Diploma | 0 (0.0%) | 0 (0.0%) |
| College or Associate's Degree | 5 (100.0%) | 0 (0.0%) |
| Bachelor's Degree | 0 (0.0%) | 0 (0.0%) |
| Graduate Degree | 0 (0.0%) | 0 (0.0%) |
| Total | 5 (100.0%) | 0 (0.0%) |
Employment Characteristics in Burwell
Employment by Class of Employer in Burwell
Among the 434 employed individuals in Burwell, private company employees (251 | 57.8%), self-employed (not incorporated) (63 | 14.5%), and local government employees (60 | 13.8%) make up the most common classes of employment.
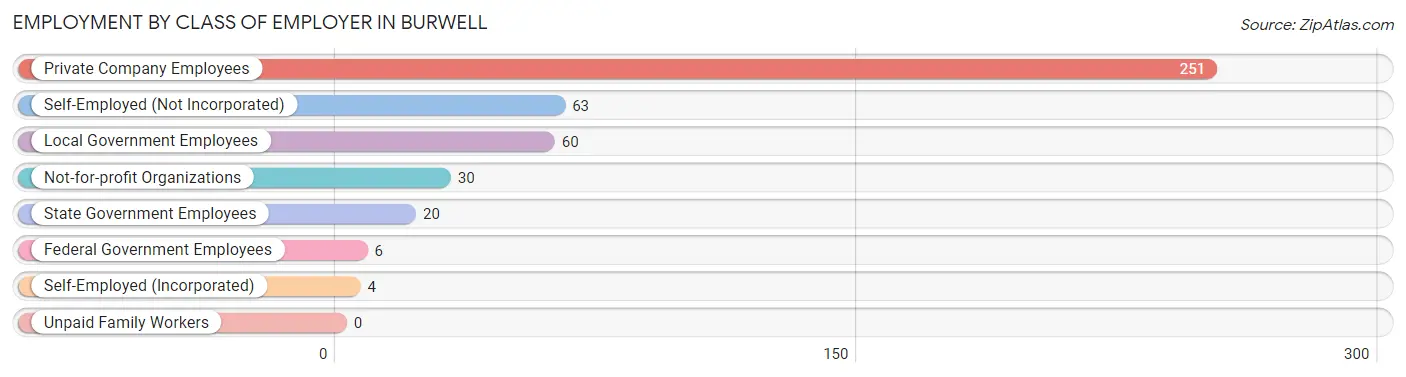
| Employer Class | # Employees | % Employees |
| Private Company Employees | 251 | 57.8% |
| Self-Employed (Incorporated) | 4 | 0.9% |
| Self-Employed (Not Incorporated) | 63 | 14.5% |
| Not-for-profit Organizations | 30 | 6.9% |
| Local Government Employees | 60 | 13.8% |
| State Government Employees | 20 | 4.6% |
| Federal Government Employees | 6 | 1.4% |
| Unpaid Family Workers | 0 | 0.0% |
| Total | 434 | 100.0% |
Employment Status by Age in Burwell
According to the labor force statistics for Burwell, out of the total population over 16 years of age (773), 59.1% or 457 individuals are in the labor force, with 2.4% or 11 of them unemployed. The age group with the highest labor force participation rate is 25 to 29 years, with 100.0% or 55 individuals in the labor force. Within the labor force, the 65 to 74 years age range has the highest percentage of unemployed individuals, with 15.1% or 11 of them being unemployed.
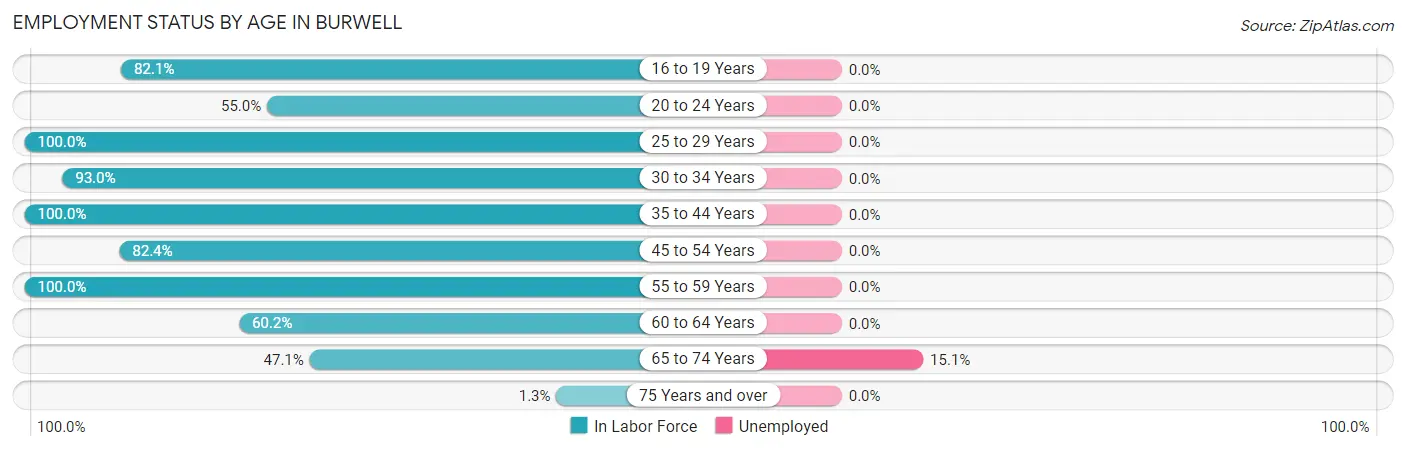
| Age Bracket | In Labor Force | Unemployed |
| 16 to 19 Years | 32 (82.1%) | 0 (0.0%) |
| 20 to 24 Years | 22 (55.0%) | 0 (0.0%) |
| 25 to 29 Years | 55 (100.0%) | 0 (0.0%) |
| 30 to 34 Years | 66 (93.0%) | 0 (0.0%) |
| 35 to 44 Years | 57 (100.0%) | 0 (0.0%) |
| 45 to 54 Years | 56 (82.4%) | 0 (0.0%) |
| 55 to 59 Years | 41 (100.0%) | 0 (0.0%) |
| 60 to 64 Years | 53 (60.2%) | 0 (0.0%) |
| 65 to 74 Years | 73 (47.1%) | 11 (15.1%) |
| 75 Years and over | 2 (1.3%) | 0 (0.0%) |
| Total | 457 (59.1%) | 11 (2.4%) |
Employment Status by Educational Attainment in Burwell
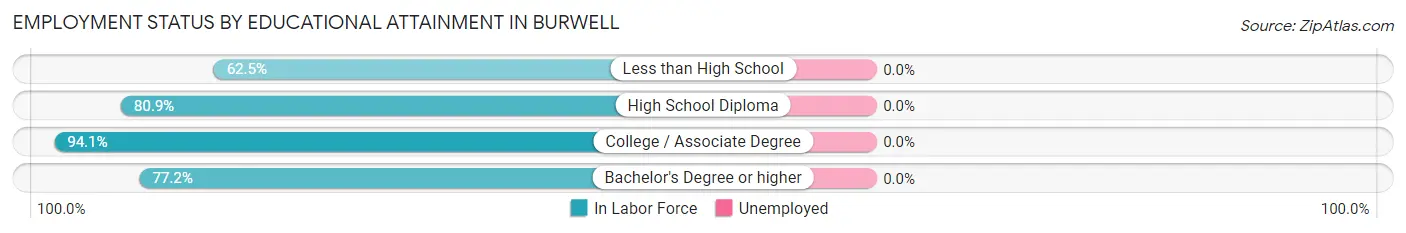
| Educational Attainment | In Labor Force | Unemployed |
| Less than High School | 5 (62.5%) | 0 (0.0%) |
| High School Diploma | 38 (80.9%) | 0 (0.0%) |
| College / Associate Degree | 190 (94.1%) | 0 (0.0%) |
| Bachelor's Degree or higher | 95 (77.2%) | 0 (0.0%) |
| Total | 328 (86.3%) | 0 (0.0%) |
Employment Occupations by Sex in Burwell
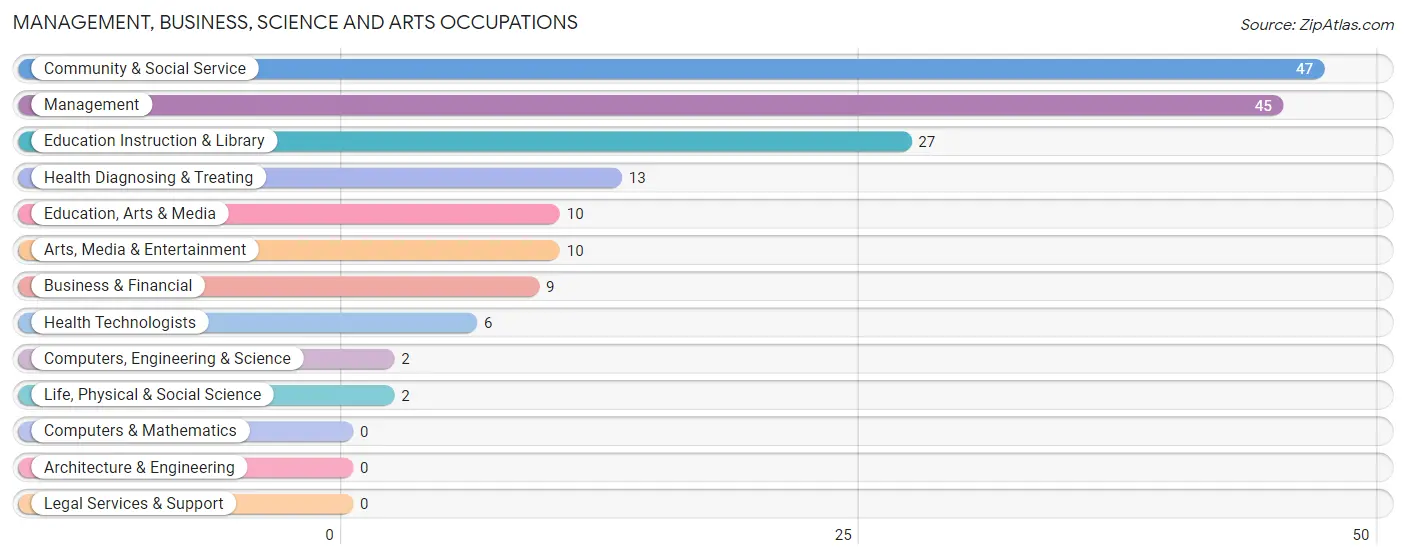
Management, Business, Science and Arts Occupations
The most common Management, Business, Science and Arts occupations in Burwell are Community & Social Service (47 | 10.5%), Management (45 | 10.1%), Education Instruction & Library (27 | 6.0%), Health Diagnosing & Treating (13 | 2.9%), and Education, Arts & Media (10 | 2.2%).
Management, Business, Science and Arts Occupations by Sex
Within the Management, Business, Science and Arts occupations in Burwell, the most male-oriented occupations are Education, Arts & Media (100.0%), Management (64.4%), and Health Technologists (50.0%), while the most female-oriented occupations are Computers, Engineering & Science (100.0%), Life, Physical & Social Science (100.0%), and Arts, Media & Entertainment (100.0%).
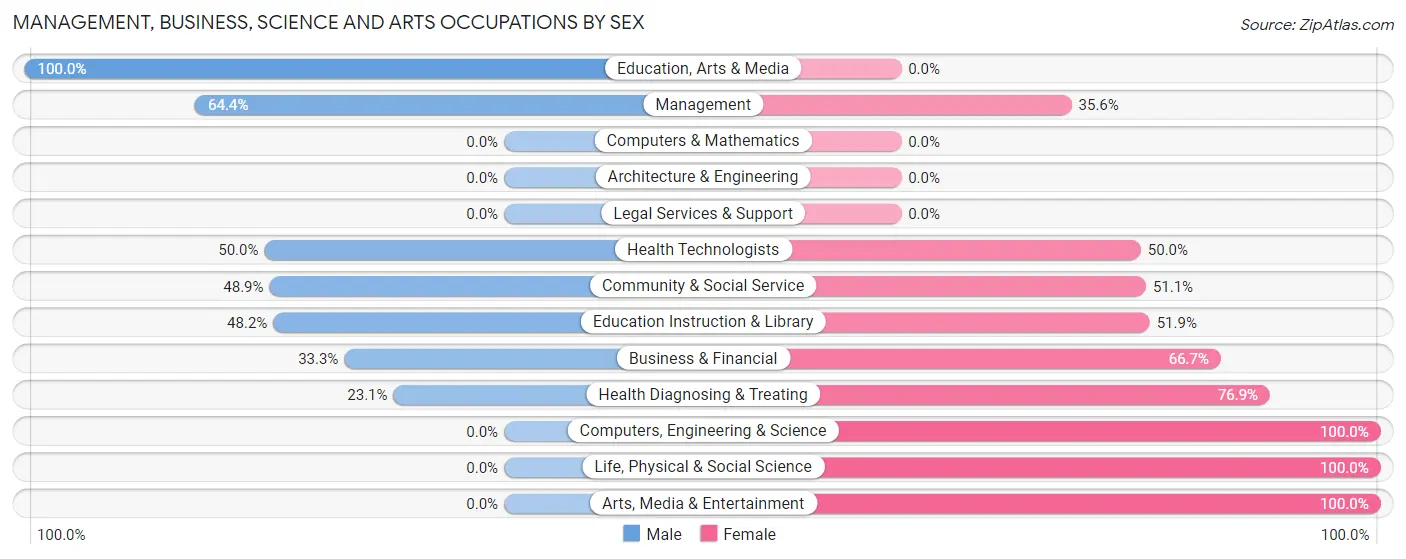
| Occupation | Male | Female |
| Management | 29 (64.4%) | 16 (35.6%) |
| Business & Financial | 3 (33.3%) | 6 (66.7%) |
| Computers, Engineering & Science | 0 (0.0%) | 2 (100.0%) |
| Computers & Mathematics | 0 (0.0%) | 0 (0.0%) |
| Architecture & Engineering | 0 (0.0%) | 0 (0.0%) |
| Life, Physical & Social Science | 0 (0.0%) | 2 (100.0%) |
| Community & Social Service | 23 (48.9%) | 24 (51.1%) |
| Education, Arts & Media | 10 (100.0%) | 0 (0.0%) |
| Legal Services & Support | 0 (0.0%) | 0 (0.0%) |
| Education Instruction & Library | 13 (48.1%) | 14 (51.8%) |
| Arts, Media & Entertainment | 0 (0.0%) | 10 (100.0%) |
| Health Diagnosing & Treating | 3 (23.1%) | 10 (76.9%) |
| Health Technologists | 3 (50.0%) | 3 (50.0%) |
| Total (Category) | 58 (50.0%) | 58 (50.0%) |
| Total (Overall) | 229 (51.3%) | 217 (48.6%) |
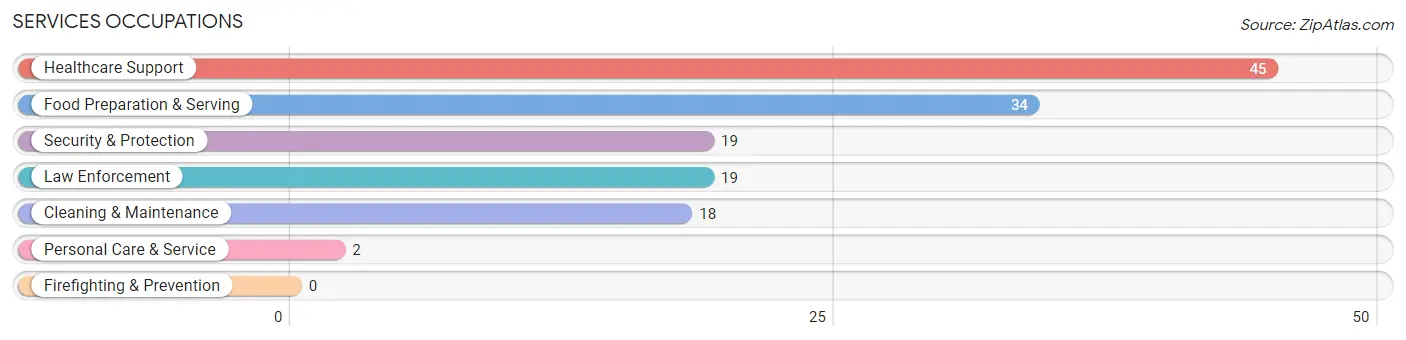
Services Occupations
The most common Services occupations in Burwell are Healthcare Support (45 | 10.1%), Food Preparation & Serving (34 | 7.6%), Security & Protection (19 | 4.3%), Law Enforcement (19 | 4.3%), and Cleaning & Maintenance (18 | 4.0%).
Services Occupations by Sex
Within the Services occupations in Burwell, the most male-oriented occupations are Security & Protection (100.0%), Law Enforcement (100.0%), and Cleaning & Maintenance (100.0%), while the most female-oriented occupations are Healthcare Support (100.0%), Personal Care & Service (100.0%), and Food Preparation & Serving (85.3%).
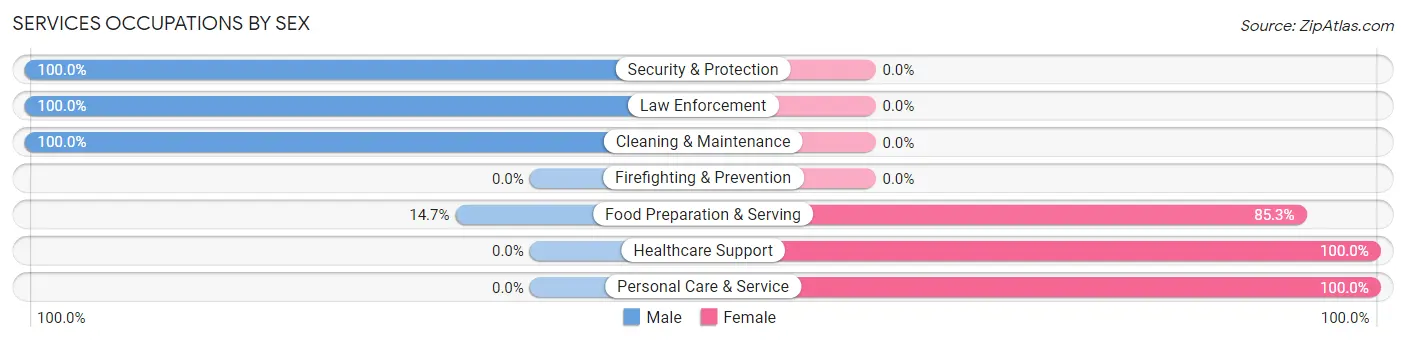
| Occupation | Male | Female |
| Healthcare Support | 0 (0.0%) | 45 (100.0%) |
| Security & Protection | 19 (100.0%) | 0 (0.0%) |
| Firefighting & Prevention | 0 (0.0%) | 0 (0.0%) |
| Law Enforcement | 19 (100.0%) | 0 (0.0%) |
| Food Preparation & Serving | 5 (14.7%) | 29 (85.3%) |
| Cleaning & Maintenance | 18 (100.0%) | 0 (0.0%) |
| Personal Care & Service | 0 (0.0%) | 2 (100.0%) |
| Total (Category) | 42 (35.6%) | 76 (64.4%) |
| Total (Overall) | 229 (51.3%) | 217 (48.6%) |
Sales and Office Occupations
The most common Sales and Office occupations in Burwell are Office & Administration (54 | 12.1%), and Sales & Related (42 | 9.4%).

Sales and Office Occupations by Sex

| Occupation | Male | Female |
| Sales & Related | 11 (26.2%) | 31 (73.8%) |
| Office & Administration | 6 (11.1%) | 48 (88.9%) |
| Total (Category) | 17 (17.7%) | 79 (82.3%) |
| Total (Overall) | 229 (51.3%) | 217 (48.6%) |
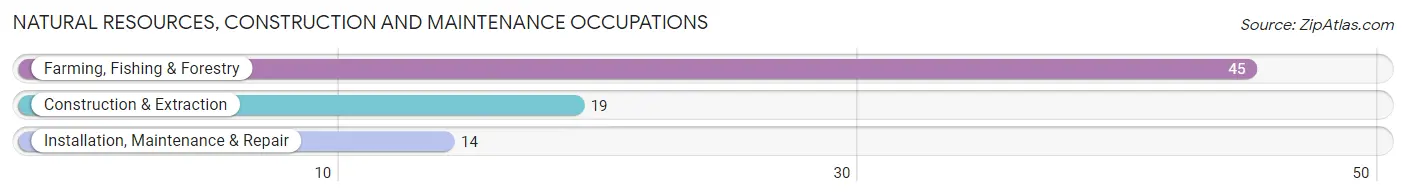
Natural Resources, Construction and Maintenance Occupations
The most common Natural Resources, Construction and Maintenance occupations in Burwell are Farming, Fishing & Forestry (45 | 10.1%), Construction & Extraction (19 | 4.3%), and Installation, Maintenance & Repair (14 | 3.1%).
Natural Resources, Construction and Maintenance Occupations by Sex
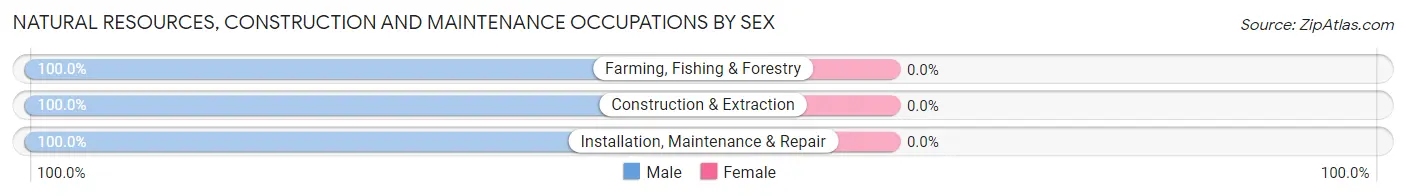
| Occupation | Male | Female |
| Farming, Fishing & Forestry | 45 (100.0%) | 0 (0.0%) |
| Construction & Extraction | 19 (100.0%) | 0 (0.0%) |
| Installation, Maintenance & Repair | 14 (100.0%) | 0 (0.0%) |
| Total (Category) | 78 (100.0%) | 0 (0.0%) |
| Total (Overall) | 229 (51.3%) | 217 (48.6%) |
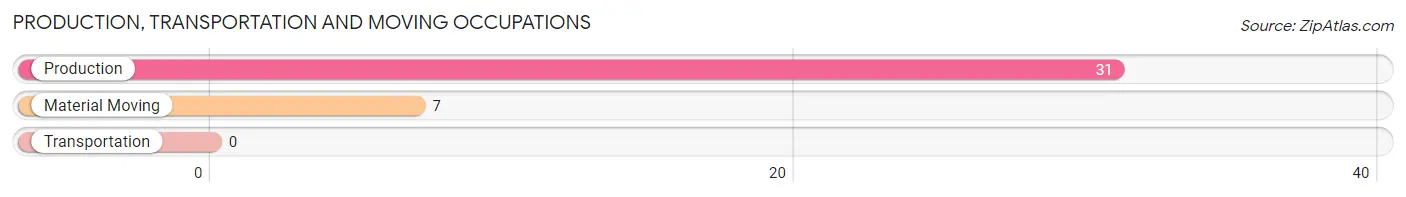
Production, Transportation and Moving Occupations
The most common Production, Transportation and Moving occupations in Burwell are Production (31 | 7.0%), and Material Moving (7 | 1.6%).
Production, Transportation and Moving Occupations by Sex
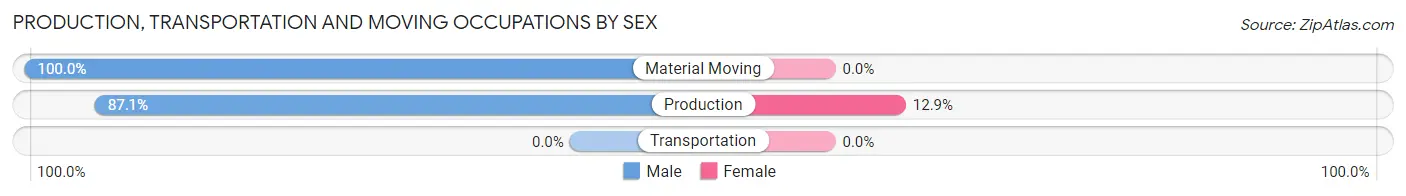
| Occupation | Male | Female |
| Production | 27 (87.1%) | 4 (12.9%) |
| Transportation | 0 (0.0%) | 0 (0.0%) |
| Material Moving | 7 (100.0%) | 0 (0.0%) |
| Total (Category) | 34 (89.5%) | 4 (10.5%) |
| Total (Overall) | 229 (51.3%) | 217 (48.6%) |
Employment Industries by Sex in Burwell
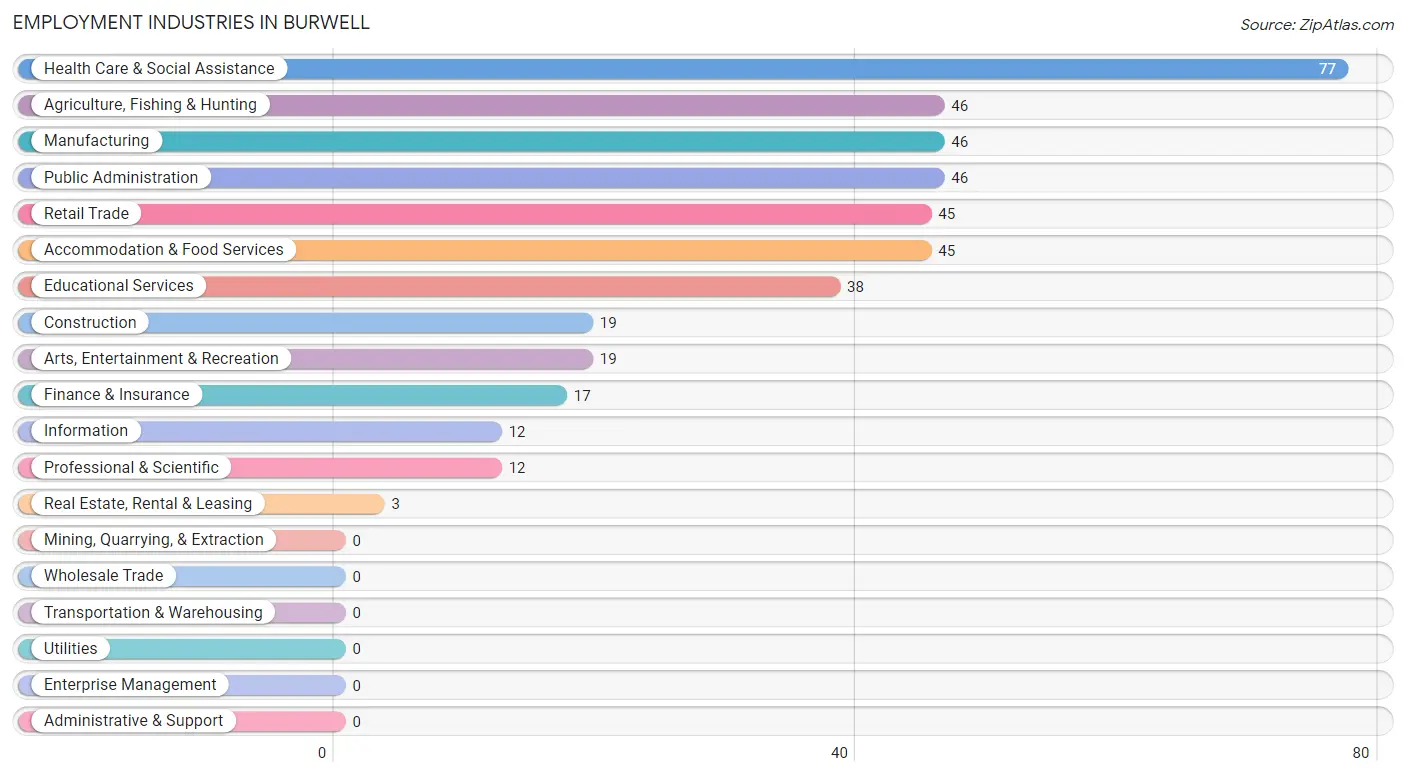
Employment Industries in Burwell
The major employment industries in Burwell include Health Care & Social Assistance (77 | 17.3%), Agriculture, Fishing & Hunting (46 | 10.3%), Manufacturing (46 | 10.3%), Public Administration (46 | 10.3%), and Retail Trade (45 | 10.1%).
Employment Industries by Sex in Burwell
The Burwell industries that see more men than women are Agriculture, Fishing & Hunting (100.0%), Construction (100.0%), and Finance & Insurance (100.0%), whereas the industries that tend to have a higher number of women are Information (100.0%), Professional & Scientific (100.0%), and Health Care & Social Assistance (100.0%).
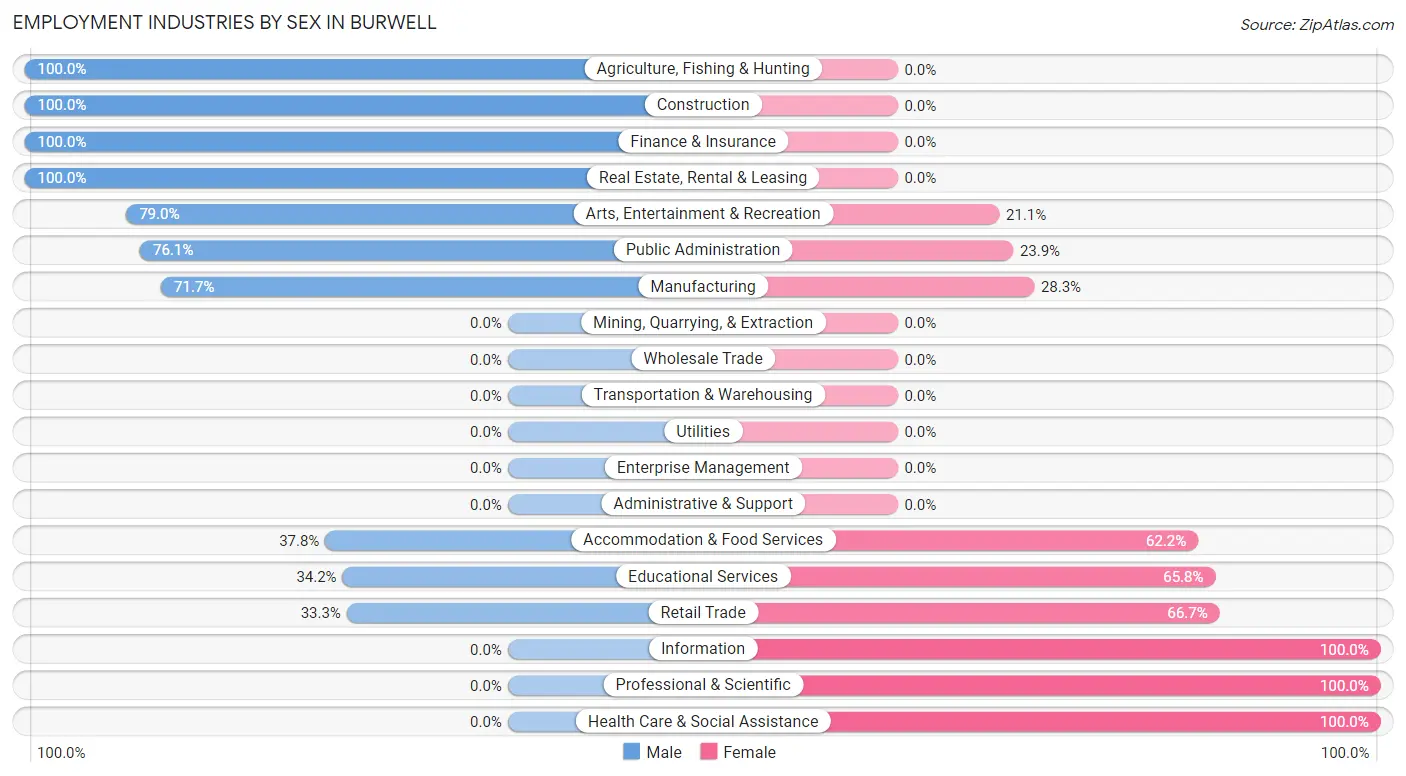
| Industry | Male | Female |
| Agriculture, Fishing & Hunting | 46 (100.0%) | 0 (0.0%) |
| Mining, Quarrying, & Extraction | 0 (0.0%) | 0 (0.0%) |
| Construction | 19 (100.0%) | 0 (0.0%) |
| Manufacturing | 33 (71.7%) | 13 (28.3%) |
| Wholesale Trade | 0 (0.0%) | 0 (0.0%) |
| Retail Trade | 15 (33.3%) | 30 (66.7%) |
| Transportation & Warehousing | 0 (0.0%) | 0 (0.0%) |
| Utilities | 0 (0.0%) | 0 (0.0%) |
| Information | 0 (0.0%) | 12 (100.0%) |
| Finance & Insurance | 17 (100.0%) | 0 (0.0%) |
| Real Estate, Rental & Leasing | 3 (100.0%) | 0 (0.0%) |
| Professional & Scientific | 0 (0.0%) | 12 (100.0%) |
| Enterprise Management | 0 (0.0%) | 0 (0.0%) |
| Administrative & Support | 0 (0.0%) | 0 (0.0%) |
| Educational Services | 13 (34.2%) | 25 (65.8%) |
| Health Care & Social Assistance | 0 (0.0%) | 77 (100.0%) |
| Arts, Entertainment & Recreation | 15 (78.9%) | 4 (21.0%) |
| Accommodation & Food Services | 17 (37.8%) | 28 (62.2%) |
| Public Administration | 35 (76.1%) | 11 (23.9%) |
| Total | 229 (51.3%) | 217 (48.6%) |
Education in Burwell
School Enrollment in Burwell
The most common levels of schooling among the 204 students in Burwell are elementary school (52 | 25.5%), middle school (52 | 25.5%), and high school (51 | 25.0%).
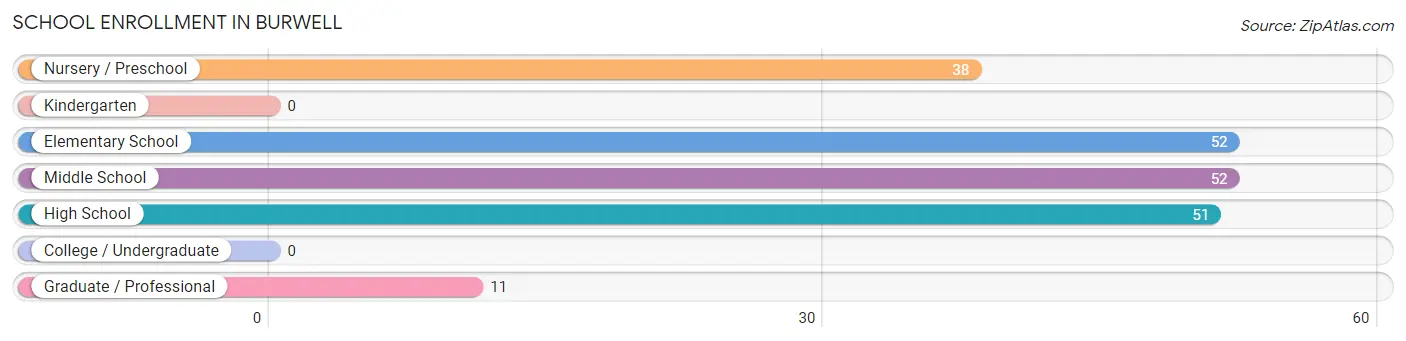
| School Level | # Students | % Students |
| Nursery / Preschool | 38 | 18.6% |
| Kindergarten | 0 | 0.0% |
| Elementary School | 52 | 25.5% |
| Middle School | 52 | 25.5% |
| High School | 51 | 25.0% |
| College / Undergraduate | 0 | 0.0% |
| Graduate / Professional | 11 | 5.4% |
| Total | 204 | 100.0% |
School Enrollment by Age by Funding Source in Burwell
Out of a total of 204 students who are enrolled in schools in Burwell, 8 (3.9%) attend a private institution, while the remaining 196 (96.1%) are enrolled in public schools. The age group of 10 to 14 year olds has the highest likelihood of being enrolled in private schools, with 8 (9.9% in the age bracket) enrolled. Conversely, the age group of 3 to 4 year olds has the lowest likelihood of being enrolled in a private school, with 6 (100.0% in the age bracket) attending a public institution.
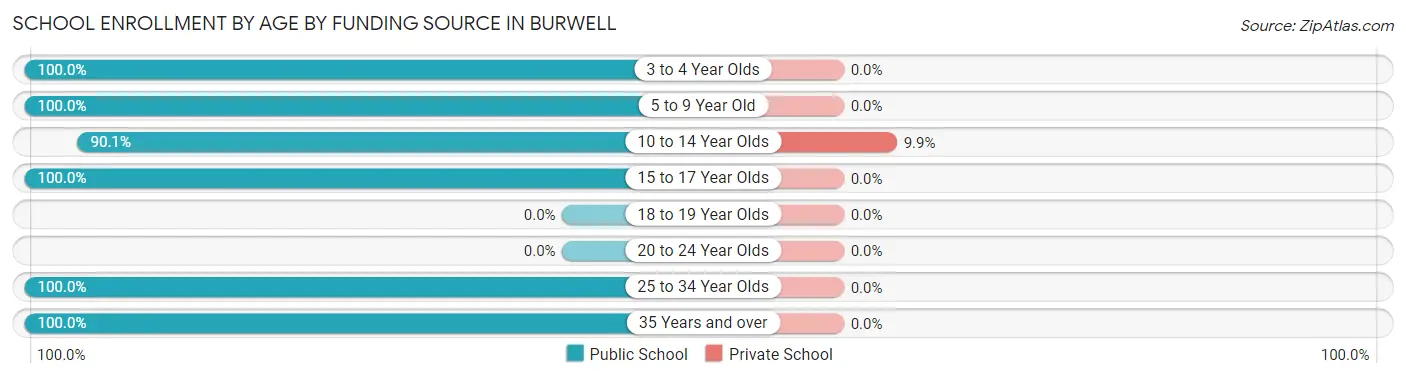
| Age Bracket | Public School | Private School |
| 3 to 4 Year Olds | 6 (100.0%) | 0 (0.0%) |
| 5 to 9 Year Old | 63 (100.0%) | 0 (0.0%) |
| 10 to 14 Year Olds | 73 (90.1%) | 8 (9.9%) |
| 15 to 17 Year Olds | 39 (100.0%) | 0 (0.0%) |
| 18 to 19 Year Olds | 0 (0.0%) | 0 (0.0%) |
| 20 to 24 Year Olds | 0 (0.0%) | 0 (0.0%) |
| 25 to 34 Year Olds | 11 (100.0%) | 0 (0.0%) |
| 35 Years and over | 4 (100.0%) | 0 (0.0%) |
| Total | 196 (96.1%) | 8 (3.9%) |
Educational Attainment by Field of Study in Burwell
Education (70 | 34.8%), business (67 | 33.3%), science & technology (30 | 14.9%), bio, nature & agricultural (15 | 7.5%), and engineering (7 | 3.5%) are the most common fields of study among 201 individuals in Burwell who have obtained a bachelor's degree or higher.
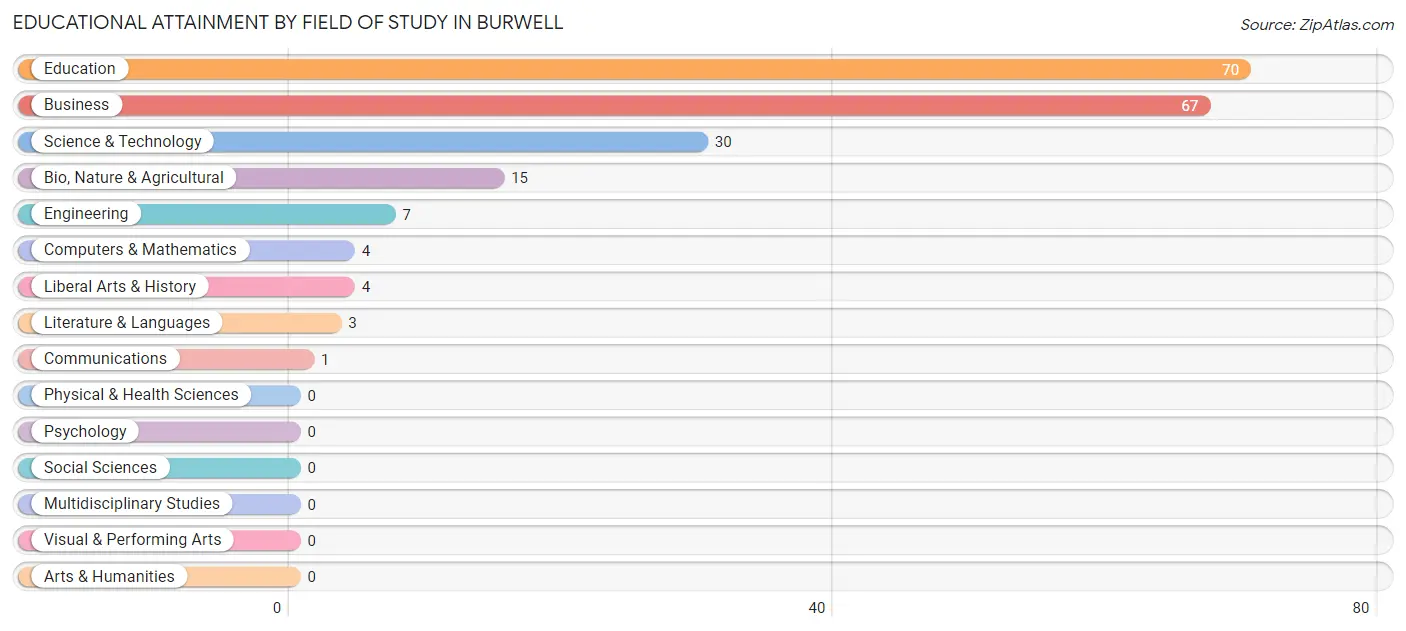
| Field of Study | # Graduates | % Graduates |
| Computers & Mathematics | 4 | 2.0% |
| Bio, Nature & Agricultural | 15 | 7.5% |
| Physical & Health Sciences | 0 | 0.0% |
| Psychology | 0 | 0.0% |
| Social Sciences | 0 | 0.0% |
| Engineering | 7 | 3.5% |
| Multidisciplinary Studies | 0 | 0.0% |
| Science & Technology | 30 | 14.9% |
| Business | 67 | 33.3% |
| Education | 70 | 34.8% |
| Literature & Languages | 3 | 1.5% |
| Liberal Arts & History | 4 | 2.0% |
| Visual & Performing Arts | 0 | 0.0% |
| Communications | 1 | 0.5% |
| Arts & Humanities | 0 | 0.0% |
| Total | 201 | 100.0% |
Transportation & Commute in Burwell
Vehicle Availability by Sex in Burwell
The most prevalent vehicle ownership categories in Burwell are males with 2 vehicles (108, accounting for 47.2%) and females with 2 vehicles (103, making up 52.7%).
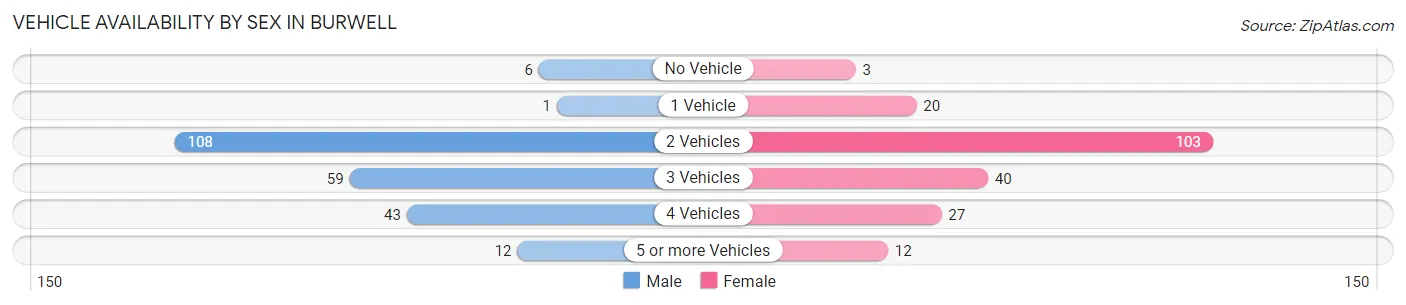
| Vehicles Available | Male | Female |
| No Vehicle | 6 (2.6%) | 3 (1.5%) |
| 1 Vehicle | 1 (0.4%) | 20 (9.8%) |
| 2 Vehicles | 108 (47.2%) | 103 (50.2%) |
| 3 Vehicles | 59 (25.8%) | 40 (19.5%) |
| 4 Vehicles | 43 (18.8%) | 27 (13.2%) |
| 5 or more Vehicles | 12 (5.2%) | 12 (5.9%) |
| Total | 229 (100.0%) | 205 (100.0%) |
Commute Time in Burwell
The most frequently occuring commute durations in Burwell are less than 5 minutes (248 commuters, 57.9%), 5 to 9 minutes (46 commuters, 10.7%), and 10 to 14 minutes (35 commuters, 8.2%).
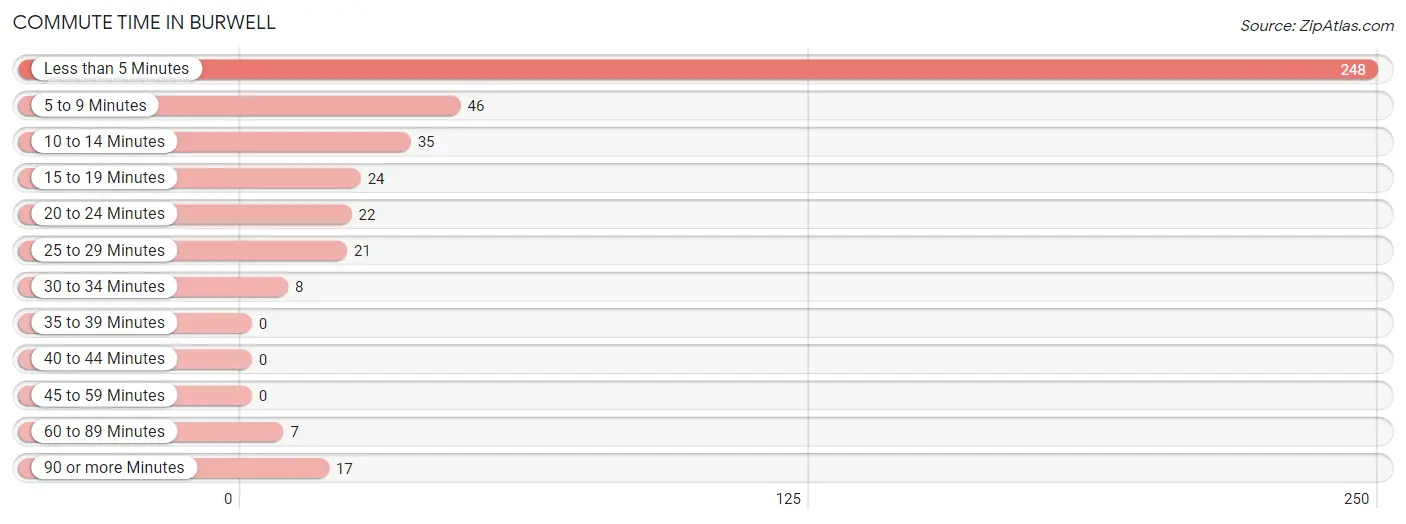
| Commute Time | # Commuters | % Commuters |
| Less than 5 Minutes | 248 | 57.9% |
| 5 to 9 Minutes | 46 | 10.7% |
| 10 to 14 Minutes | 35 | 8.2% |
| 15 to 19 Minutes | 24 | 5.6% |
| 20 to 24 Minutes | 22 | 5.1% |
| 25 to 29 Minutes | 21 | 4.9% |
| 30 to 34 Minutes | 8 | 1.9% |
| 35 to 39 Minutes | 0 | 0.0% |
| 40 to 44 Minutes | 0 | 0.0% |
| 45 to 59 Minutes | 0 | 0.0% |
| 60 to 89 Minutes | 7 | 1.6% |
| 90 or more Minutes | 17 | 4.0% |
Commute Time by Sex in Burwell
The most common commute times in Burwell are less than 5 minutes (147 commuters, 64.8%) for males and less than 5 minutes (101 commuters, 50.2%) for females.
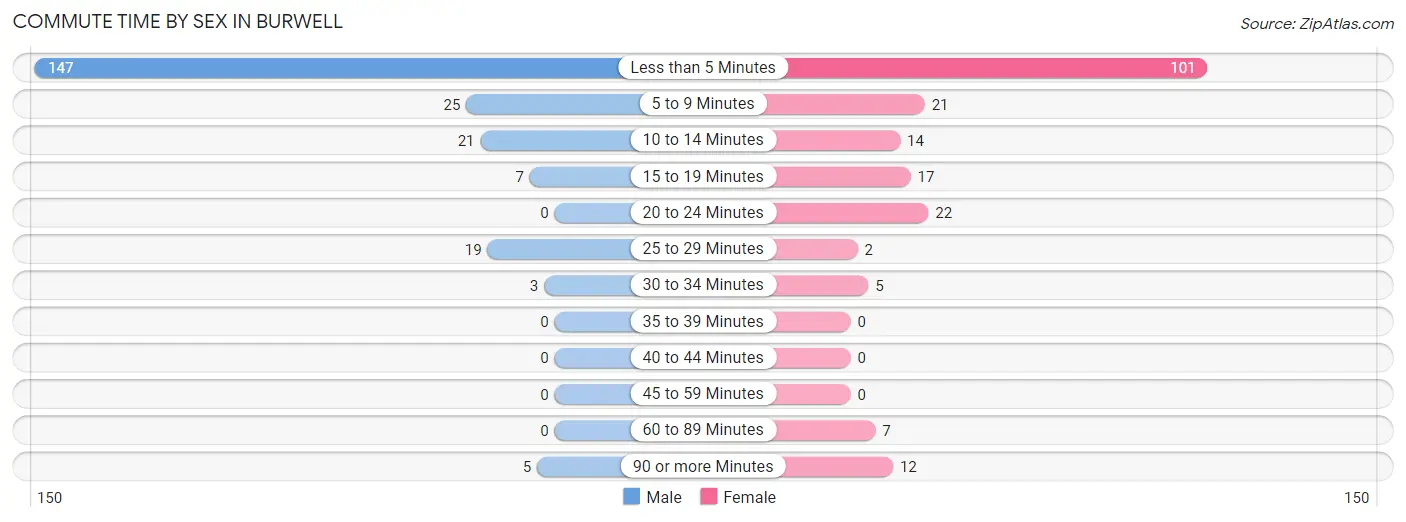
| Commute Time | Male | Female |
| Less than 5 Minutes | 147 (64.8%) | 101 (50.2%) |
| 5 to 9 Minutes | 25 (11.0%) | 21 (10.4%) |
| 10 to 14 Minutes | 21 (9.2%) | 14 (7.0%) |
| 15 to 19 Minutes | 7 (3.1%) | 17 (8.5%) |
| 20 to 24 Minutes | 0 (0.0%) | 22 (11.0%) |
| 25 to 29 Minutes | 19 (8.4%) | 2 (1.0%) |
| 30 to 34 Minutes | 3 (1.3%) | 5 (2.5%) |
| 35 to 39 Minutes | 0 (0.0%) | 0 (0.0%) |
| 40 to 44 Minutes | 0 (0.0%) | 0 (0.0%) |
| 45 to 59 Minutes | 0 (0.0%) | 0 (0.0%) |
| 60 to 89 Minutes | 0 (0.0%) | 7 (3.5%) |
| 90 or more Minutes | 5 (2.2%) | 12 (6.0%) |
Time of Departure to Work by Sex in Burwell
The most frequent times of departure to work in Burwell are 9:00 AM to 9:59 AM (59, 26.0%) for males and 7:30 AM to 7:59 AM (44, 21.9%) for females.
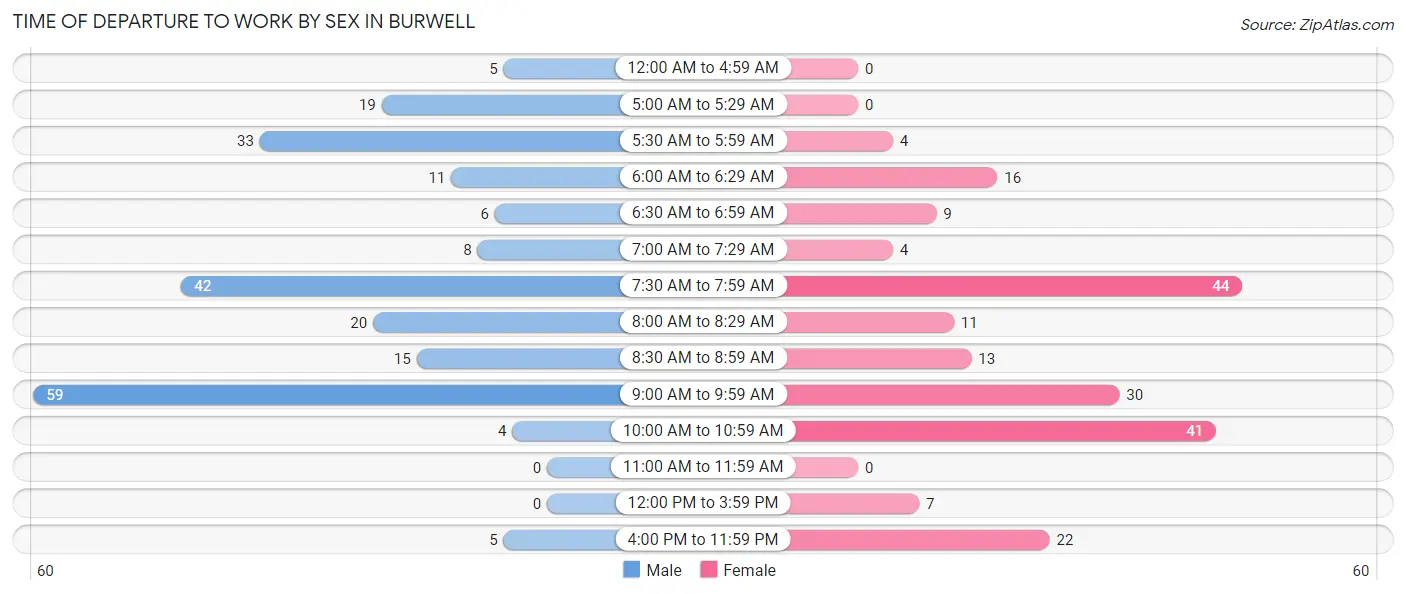
| Time of Departure | Male | Female |
| 12:00 AM to 4:59 AM | 5 (2.2%) | 0 (0.0%) |
| 5:00 AM to 5:29 AM | 19 (8.4%) | 0 (0.0%) |
| 5:30 AM to 5:59 AM | 33 (14.5%) | 4 (2.0%) |
| 6:00 AM to 6:29 AM | 11 (4.9%) | 16 (8.0%) |
| 6:30 AM to 6:59 AM | 6 (2.6%) | 9 (4.5%) |
| 7:00 AM to 7:29 AM | 8 (3.5%) | 4 (2.0%) |
| 7:30 AM to 7:59 AM | 42 (18.5%) | 44 (21.9%) |
| 8:00 AM to 8:29 AM | 20 (8.8%) | 11 (5.5%) |
| 8:30 AM to 8:59 AM | 15 (6.6%) | 13 (6.5%) |
| 9:00 AM to 9:59 AM | 59 (26.0%) | 30 (14.9%) |
| 10:00 AM to 10:59 AM | 4 (1.8%) | 41 (20.4%) |
| 11:00 AM to 11:59 AM | 0 (0.0%) | 0 (0.0%) |
| 12:00 PM to 3:59 PM | 0 (0.0%) | 7 (3.5%) |
| 4:00 PM to 11:59 PM | 5 (2.2%) | 22 (11.0%) |
| Total | 227 (100.0%) | 201 (100.0%) |
Housing Occupancy in Burwell
Occupancy by Ownership in Burwell
Of the total 406 dwellings in Burwell, owner-occupied units account for 310 (76.3%), while renter-occupied units make up 96 (23.6%).
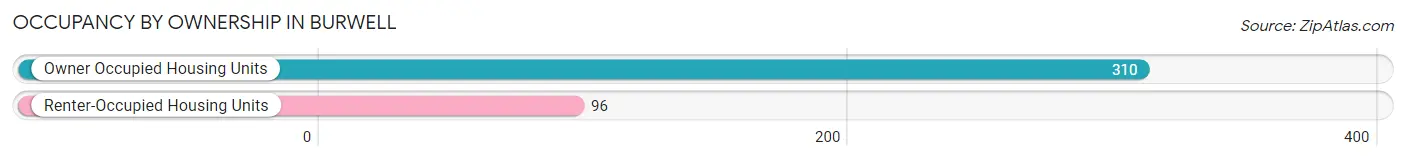
| Occupancy | # Housing Units | % Housing Units |
| Owner Occupied Housing Units | 310 | 76.3% |
| Renter-Occupied Housing Units | 96 | 23.6% |
| Total Occupied Housing Units | 406 | 100.0% |
Occupancy by Household Size in Burwell
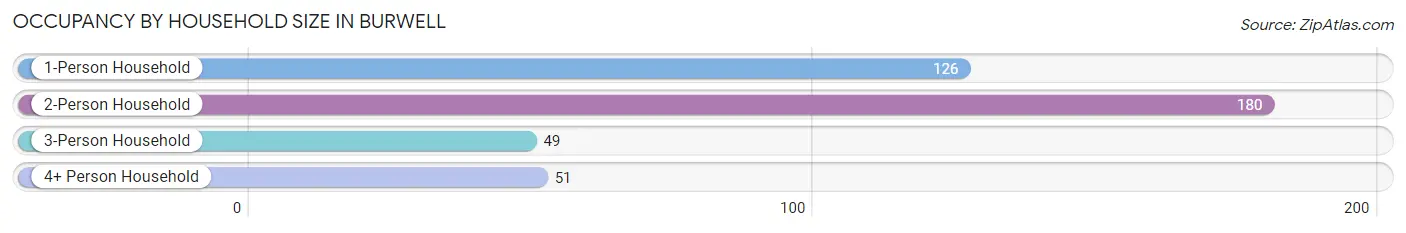
| Household Size | # Housing Units | % Housing Units |
| 1-Person Household | 126 | 31.0% |
| 2-Person Household | 180 | 44.3% |
| 3-Person Household | 49 | 12.1% |
| 4+ Person Household | 51 | 12.6% |
| Total Housing Units | 406 | 100.0% |
Occupancy by Ownership by Household Size in Burwell
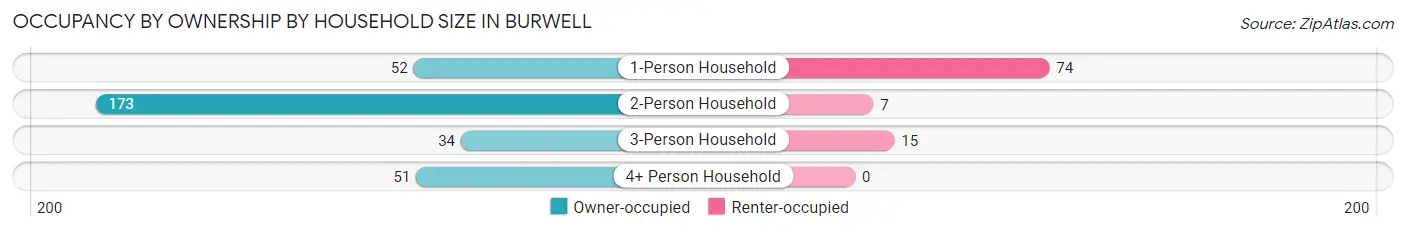
| Household Size | Owner-occupied | Renter-occupied |
| 1-Person Household | 52 (41.3%) | 74 (58.7%) |
| 2-Person Household | 173 (96.1%) | 7 (3.9%) |
| 3-Person Household | 34 (69.4%) | 15 (30.6%) |
| 4+ Person Household | 51 (100.0%) | 0 (0.0%) |
| Total Housing Units | 310 (76.3%) | 96 (23.6%) |
Occupancy by Educational Attainment in Burwell
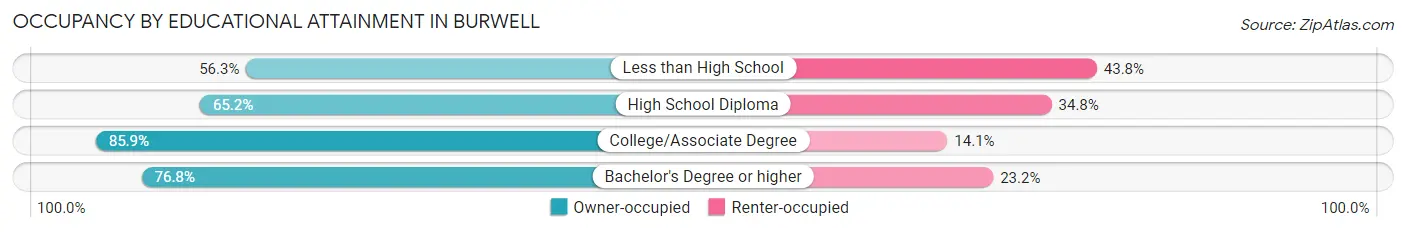
| Household Size | Owner-occupied | Renter-occupied |
| Less than High School | 18 (56.2%) | 14 (43.8%) |
| High School Diploma | 60 (65.2%) | 32 (34.8%) |
| College/Associate Degree | 146 (85.9%) | 24 (14.1%) |
| Bachelor's Degree or higher | 86 (76.8%) | 26 (23.2%) |
Occupancy by Age of Householder in Burwell
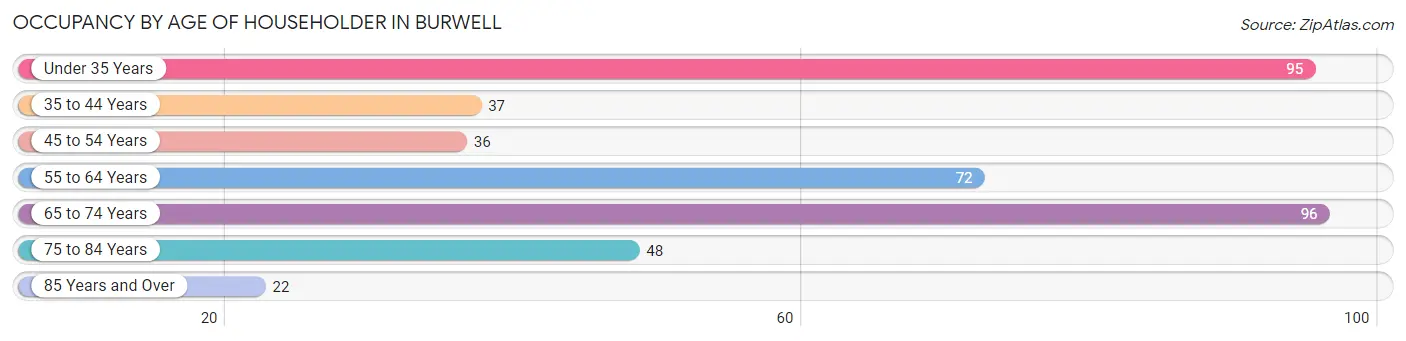
| Age Bracket | # Households | % Households |
| Under 35 Years | 95 | 23.4% |
| 35 to 44 Years | 37 | 9.1% |
| 45 to 54 Years | 36 | 8.9% |
| 55 to 64 Years | 72 | 17.7% |
| 65 to 74 Years | 96 | 23.6% |
| 75 to 84 Years | 48 | 11.8% |
| 85 Years and Over | 22 | 5.4% |
| Total | 406 | 100.0% |
Housing Finances in Burwell
Median Income by Occupancy in Burwell
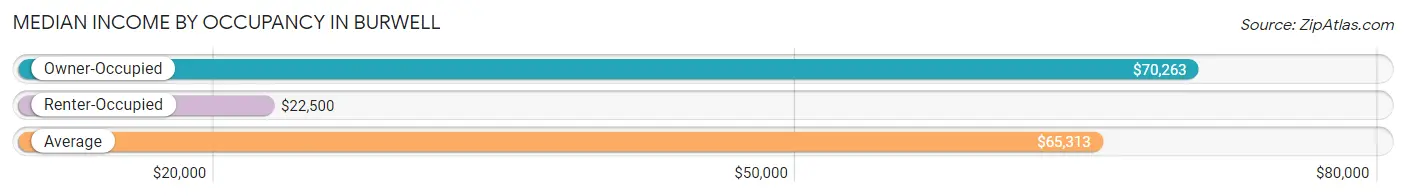
| Occupancy Type | # Households | Median Income |
| Owner-Occupied | 310 (76.3%) | $70,263 |
| Renter-Occupied | 96 (23.6%) | $22,500 |
| Average | 406 (100.0%) | $65,313 |
Occupancy by Householder Income Bracket in Burwell
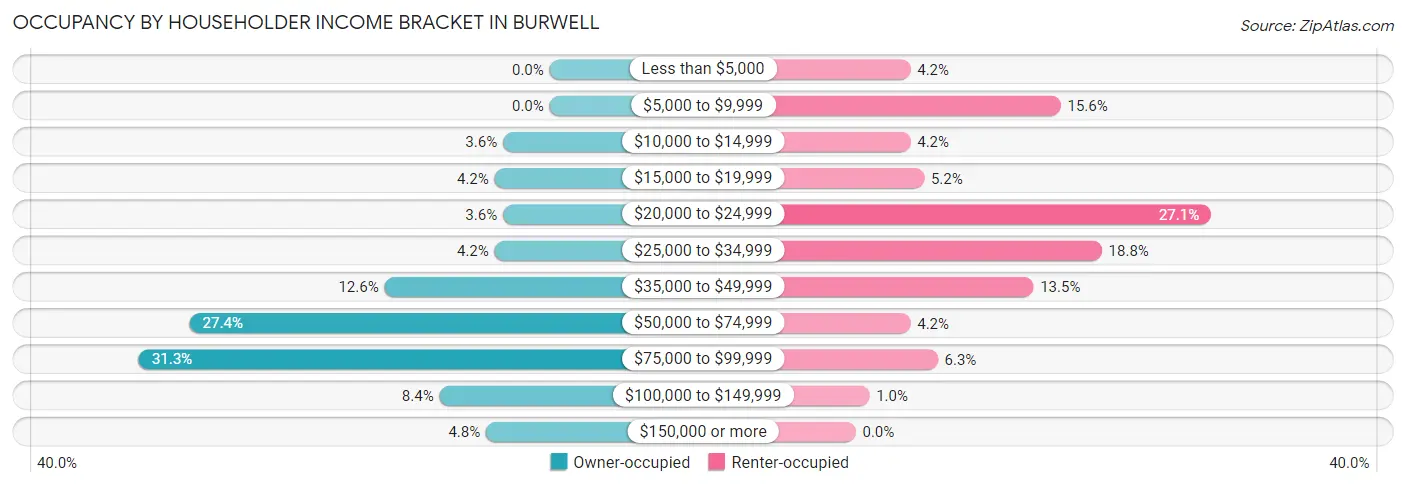
| Income Bracket | Owner-occupied | Renter-occupied |
| Less than $5,000 | 0 (0.0%) | 4 (4.2%) |
| $5,000 to $9,999 | 0 (0.0%) | 15 (15.6%) |
| $10,000 to $14,999 | 11 (3.5%) | 4 (4.2%) |
| $15,000 to $19,999 | 13 (4.2%) | 5 (5.2%) |
| $20,000 to $24,999 | 11 (3.5%) | 26 (27.1%) |
| $25,000 to $34,999 | 13 (4.2%) | 18 (18.8%) |
| $35,000 to $49,999 | 39 (12.6%) | 13 (13.5%) |
| $50,000 to $74,999 | 85 (27.4%) | 4 (4.2%) |
| $75,000 to $99,999 | 97 (31.3%) | 6 (6.2%) |
| $100,000 to $149,999 | 26 (8.4%) | 1 (1.0%) |
| $150,000 or more | 15 (4.8%) | 0 (0.0%) |
| Total | 310 (100.0%) | 96 (100.0%) |
Monthly Housing Cost Tiers in Burwell
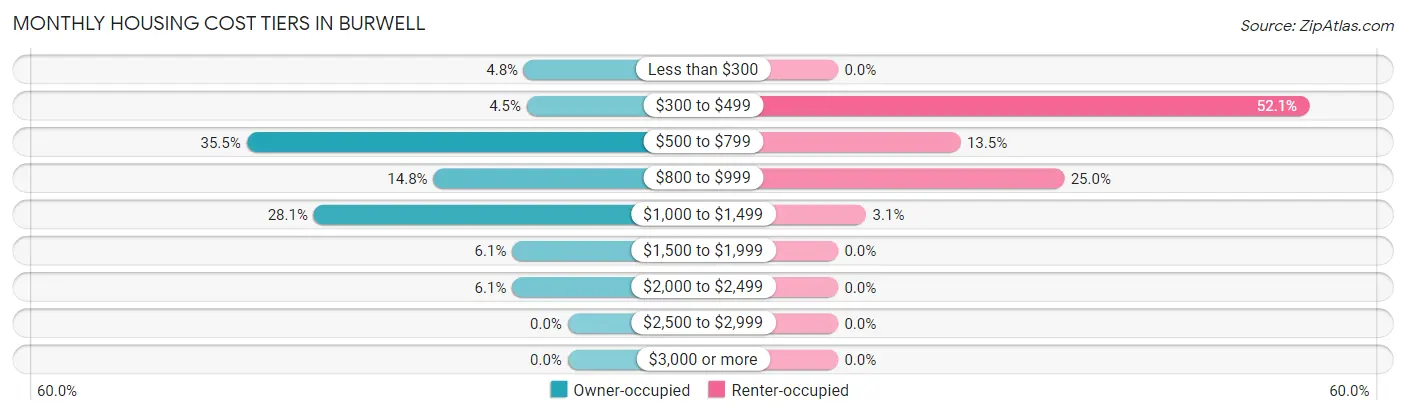
| Monthly Cost | Owner-occupied | Renter-occupied |
| Less than $300 | 15 (4.8%) | 0 (0.0%) |
| $300 to $499 | 14 (4.5%) | 50 (52.1%) |
| $500 to $799 | 110 (35.5%) | 13 (13.5%) |
| $800 to $999 | 46 (14.8%) | 24 (25.0%) |
| $1,000 to $1,499 | 87 (28.1%) | 3 (3.1%) |
| $1,500 to $1,999 | 19 (6.1%) | 0 (0.0%) |
| $2,000 to $2,499 | 19 (6.1%) | 0 (0.0%) |
| $2,500 to $2,999 | 0 (0.0%) | 0 (0.0%) |
| $3,000 or more | 0 (0.0%) | 0 (0.0%) |
| Total | 310 (100.0%) | 96 (100.0%) |
Physical Housing Characteristics in Burwell
Housing Structures in Burwell
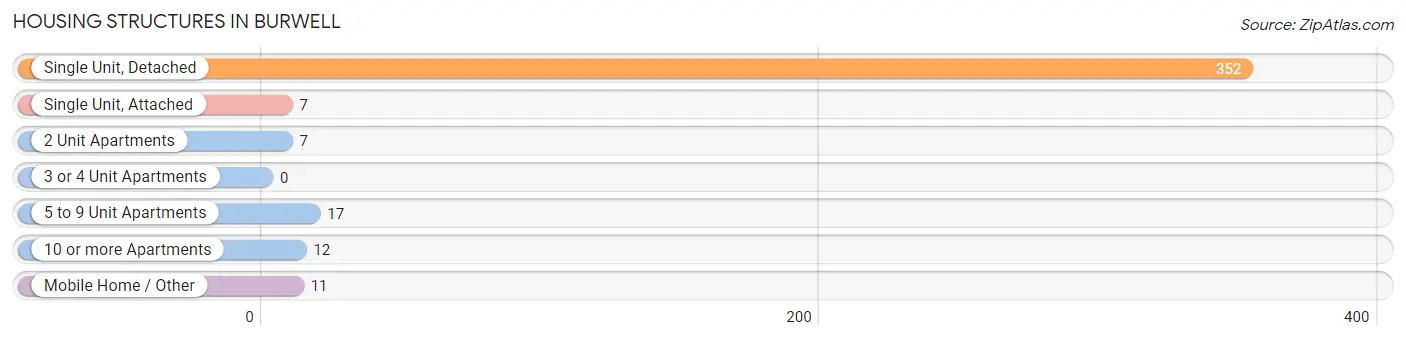
| Structure Type | # Housing Units | % Housing Units |
| Single Unit, Detached | 352 | 86.7% |
| Single Unit, Attached | 7 | 1.7% |
| 2 Unit Apartments | 7 | 1.7% |
| 3 or 4 Unit Apartments | 0 | 0.0% |
| 5 to 9 Unit Apartments | 17 | 4.2% |
| 10 or more Apartments | 12 | 3.0% |
| Mobile Home / Other | 11 | 2.7% |
| Total | 406 | 100.0% |
Housing Structures by Occupancy in Burwell
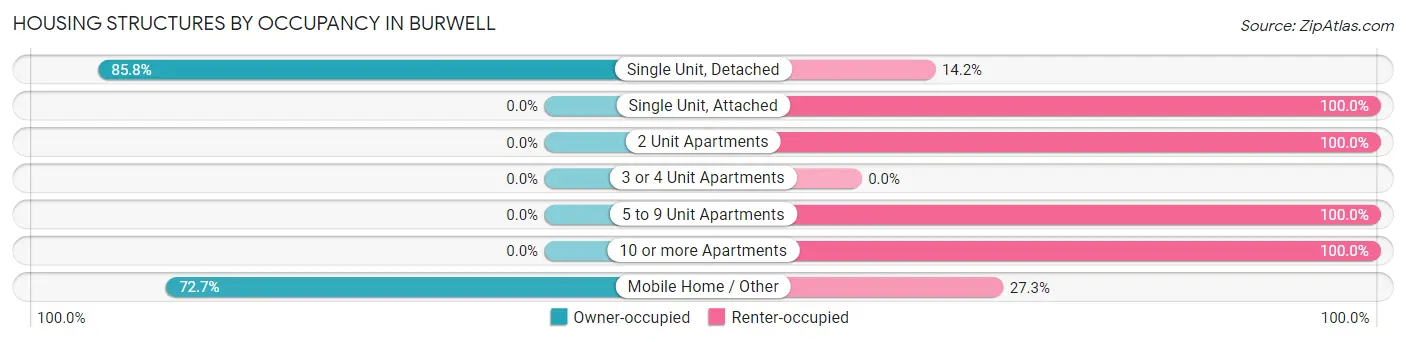
| Structure Type | Owner-occupied | Renter-occupied |
| Single Unit, Detached | 302 (85.8%) | 50 (14.2%) |
| Single Unit, Attached | 0 (0.0%) | 7 (100.0%) |
| 2 Unit Apartments | 0 (0.0%) | 7 (100.0%) |
| 3 or 4 Unit Apartments | 0 (0.0%) | 0 (0.0%) |
| 5 to 9 Unit Apartments | 0 (0.0%) | 17 (100.0%) |
| 10 or more Apartments | 0 (0.0%) | 12 (100.0%) |
| Mobile Home / Other | 8 (72.7%) | 3 (27.3%) |
| Total | 310 (76.3%) | 96 (23.6%) |
Housing Structures by Number of Rooms in Burwell
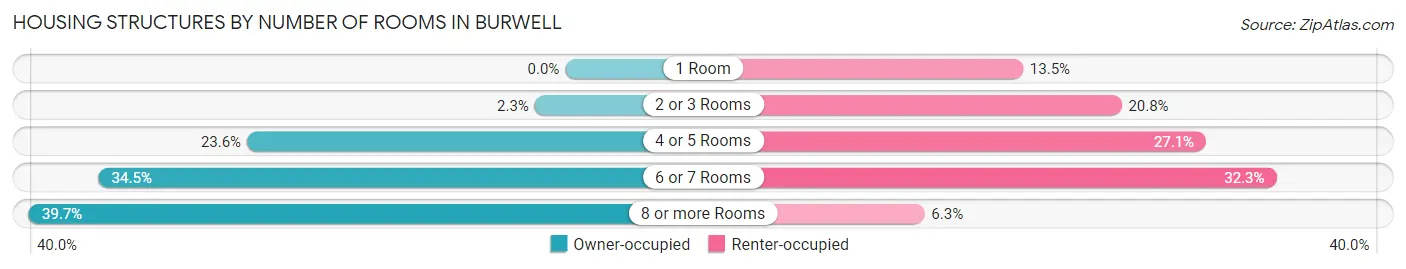
| Number of Rooms | Owner-occupied | Renter-occupied |
| 1 Room | 0 (0.0%) | 13 (13.5%) |
| 2 or 3 Rooms | 7 (2.3%) | 20 (20.8%) |
| 4 or 5 Rooms | 73 (23.5%) | 26 (27.1%) |
| 6 or 7 Rooms | 107 (34.5%) | 31 (32.3%) |
| 8 or more Rooms | 123 (39.7%) | 6 (6.2%) |
| Total | 310 (100.0%) | 96 (100.0%) |
Housing Structure by Heating Type in Burwell
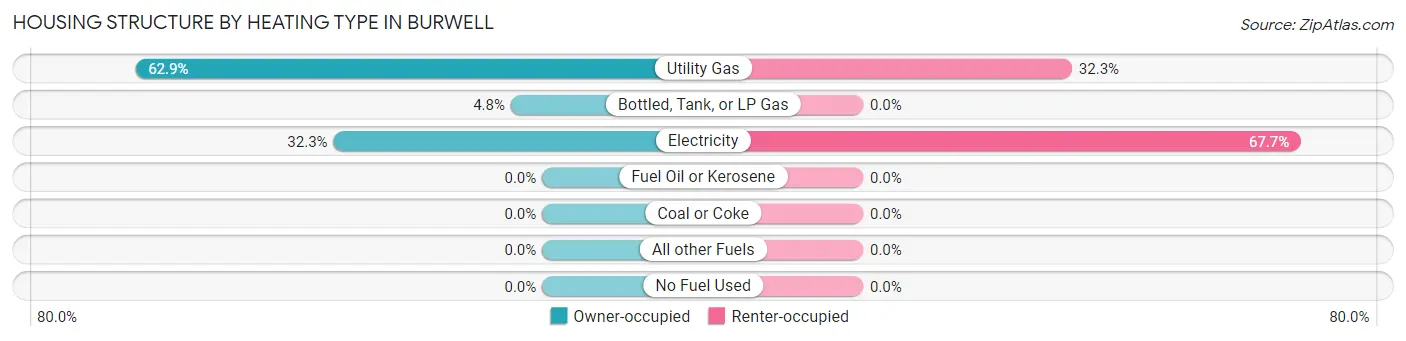
| Heating Type | Owner-occupied | Renter-occupied |
| Utility Gas | 195 (62.9%) | 31 (32.3%) |
| Bottled, Tank, or LP Gas | 15 (4.8%) | 0 (0.0%) |
| Electricity | 100 (32.3%) | 65 (67.7%) |
| Fuel Oil or Kerosene | 0 (0.0%) | 0 (0.0%) |
| Coal or Coke | 0 (0.0%) | 0 (0.0%) |
| All other Fuels | 0 (0.0%) | 0 (0.0%) |
| No Fuel Used | 0 (0.0%) | 0 (0.0%) |
| Total | 310 (100.0%) | 96 (100.0%) |
Household Vehicle Usage in Burwell
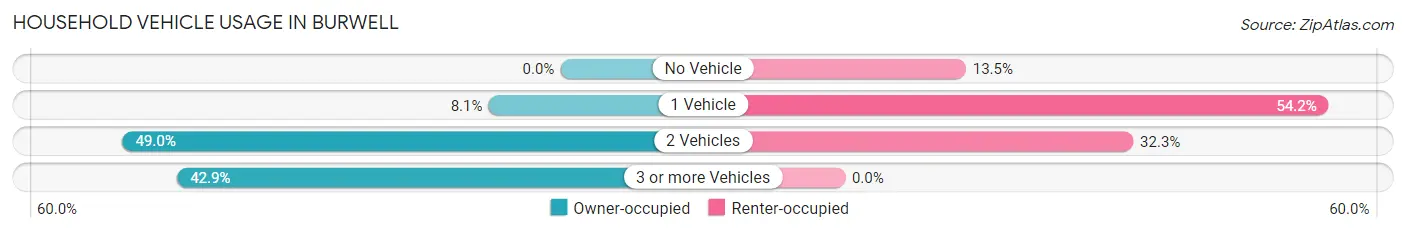
| Vehicles per Household | Owner-occupied | Renter-occupied |
| No Vehicle | 0 (0.0%) | 13 (13.5%) |
| 1 Vehicle | 25 (8.1%) | 52 (54.2%) |
| 2 Vehicles | 152 (49.0%) | 31 (32.3%) |
| 3 or more Vehicles | 133 (42.9%) | 0 (0.0%) |
| Total | 310 (100.0%) | 96 (100.0%) |
Real Estate & Mortgages in Burwell
Real Estate and Mortgage Overview in Burwell
| Characteristic | Without Mortgage | With Mortgage |
| Housing Units | 156 | 154 |
| Median Property Value | $90,000 | $123,600 |
| Median Household Income | $62,778 | $12 |
| Monthly Housing Costs | $569 | $0 |
| Real Estate Taxes | $1,349 | $0 |
Property Value by Mortgage Status in Burwell
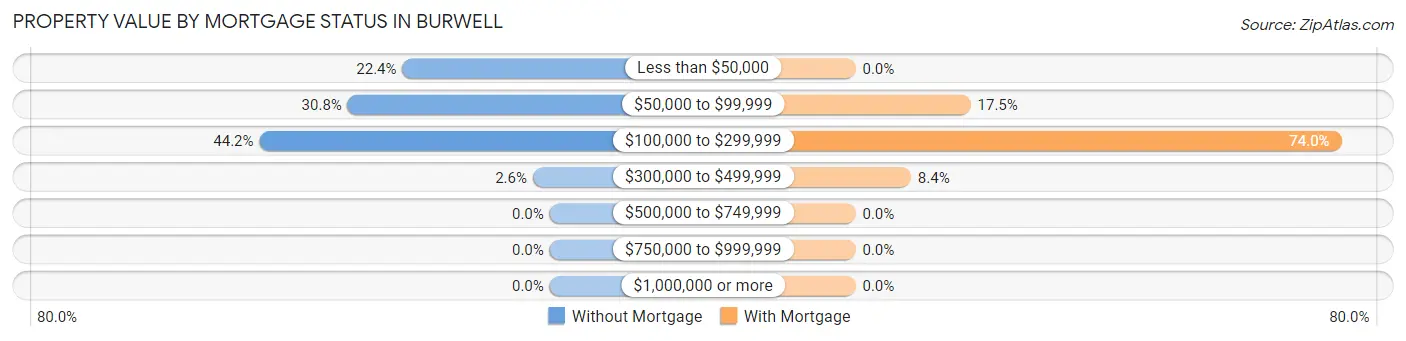
| Property Value | Without Mortgage | With Mortgage |
| Less than $50,000 | 35 (22.4%) | 0 (0.0%) |
| $50,000 to $99,999 | 48 (30.8%) | 27 (17.5%) |
| $100,000 to $299,999 | 69 (44.2%) | 114 (74.0%) |
| $300,000 to $499,999 | 4 (2.6%) | 13 (8.4%) |
| $500,000 to $749,999 | 0 (0.0%) | 0 (0.0%) |
| $750,000 to $999,999 | 0 (0.0%) | 0 (0.0%) |
| $1,000,000 or more | 0 (0.0%) | 0 (0.0%) |
| Total | 156 (100.0%) | 154 (100.0%) |
Household Income by Mortgage Status in Burwell
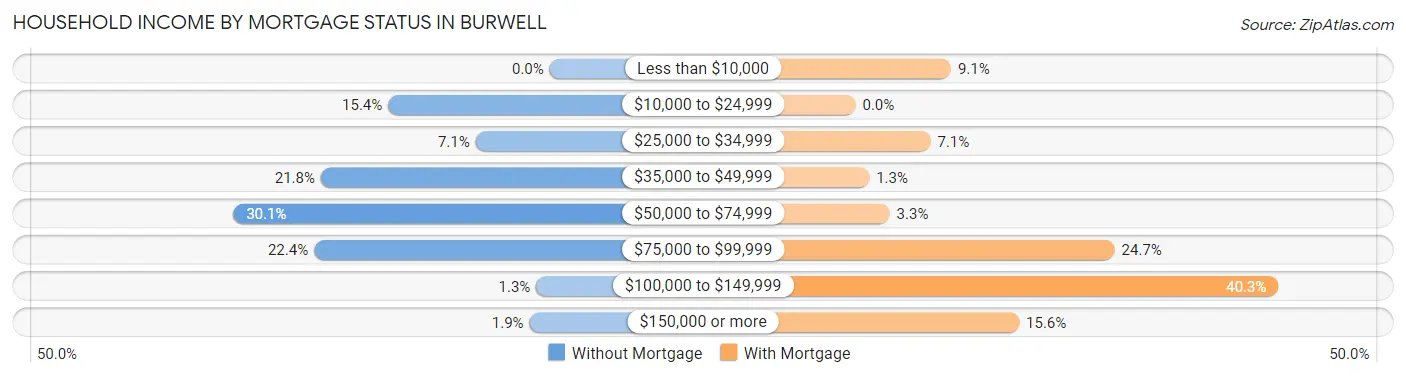
| Household Income | Without Mortgage | With Mortgage |
| Less than $10,000 | 0 (0.0%) | 14 (9.1%) |
| $10,000 to $24,999 | 24 (15.4%) | 0 (0.0%) |
| $25,000 to $34,999 | 11 (7.0%) | 11 (7.1%) |
| $35,000 to $49,999 | 34 (21.8%) | 2 (1.3%) |
| $50,000 to $74,999 | 47 (30.1%) | 5 (3.3%) |
| $75,000 to $99,999 | 35 (22.4%) | 38 (24.7%) |
| $100,000 to $149,999 | 2 (1.3%) | 62 (40.3%) |
| $150,000 or more | 3 (1.9%) | 24 (15.6%) |
| Total | 156 (100.0%) | 154 (100.0%) |
Property Value to Household Income Ratio in Burwell
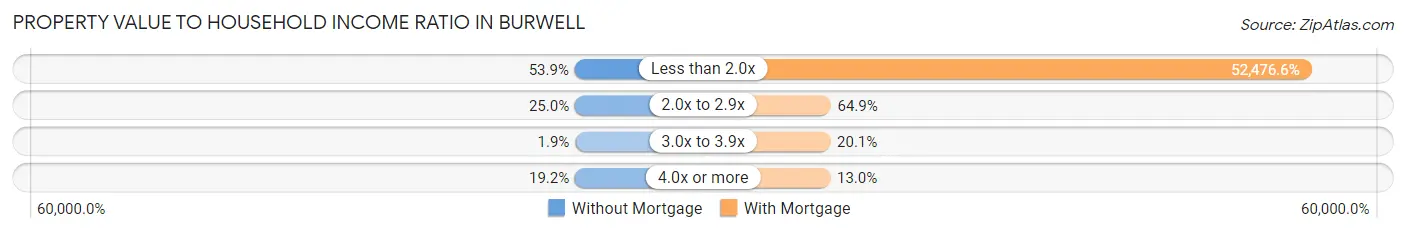
| Value-to-Income Ratio | Without Mortgage | With Mortgage |
| Less than 2.0x | 84 (53.8%) | 80,814 (52,476.6%) |
| 2.0x to 2.9x | 39 (25.0%) | 100 (64.9%) |
| 3.0x to 3.9x | 3 (1.9%) | 31 (20.1%) |
| 4.0x or more | 30 (19.2%) | 20 (13.0%) |
| Total | 156 (100.0%) | 154 (100.0%) |
Real Estate Taxes by Mortgage Status in Burwell
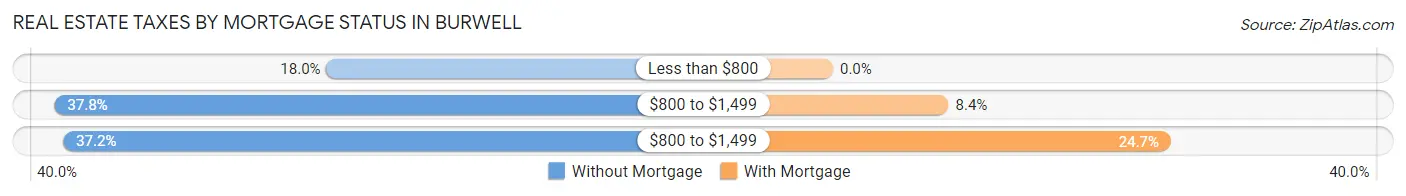
| Property Taxes | Without Mortgage | With Mortgage |
| Less than $800 | 28 (17.9%) | 0 (0.0%) |
| $800 to $1,499 | 59 (37.8%) | 13 (8.4%) |
| $800 to $1,499 | 58 (37.2%) | 38 (24.7%) |
| Total | 156 (100.0%) | 154 (100.0%) |
Health & Disability in Burwell
Health Insurance Coverage by Age in Burwell
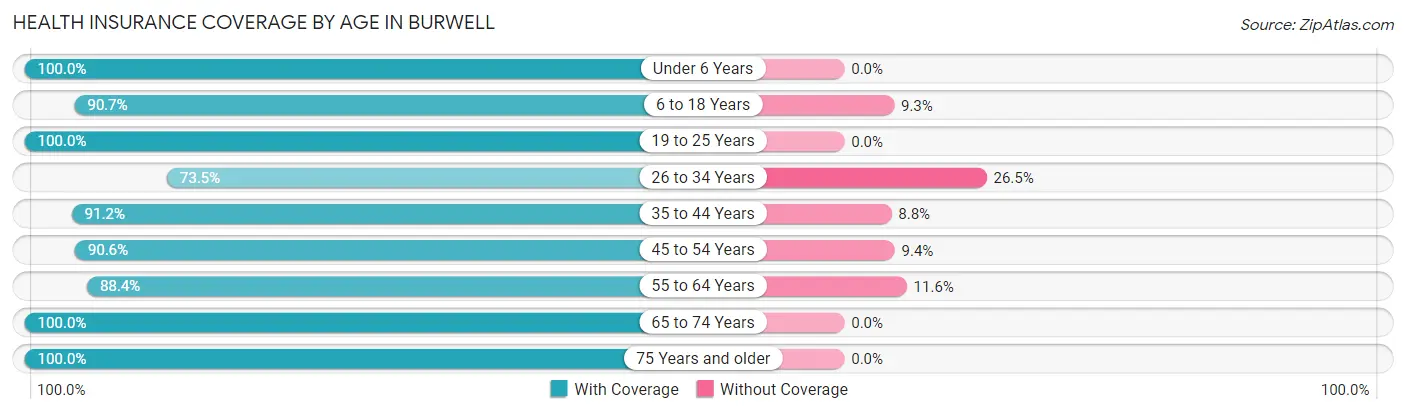
| Age Bracket | With Coverage | Without Coverage |
| Under 6 Years | 53 (100.0%) | 0 (0.0%) |
| 6 to 18 Years | 137 (90.7%) | 14 (9.3%) |
| 19 to 25 Years | 68 (100.0%) | 0 (0.0%) |
| 26 to 34 Years | 72 (73.5%) | 26 (26.5%) |
| 35 to 44 Years | 52 (91.2%) | 5 (8.8%) |
| 45 to 54 Years | 58 (90.6%) | 6 (9.4%) |
| 55 to 64 Years | 114 (88.4%) | 15 (11.6%) |
| 65 to 74 Years | 150 (100.0%) | 0 (0.0%) |
| 75 Years and older | 107 (100.0%) | 0 (0.0%) |
| Total | 811 (92.5%) | 66 (7.5%) |
Health Insurance Coverage by Citizenship Status in Burwell

| Citizenship Status | With Coverage | Without Coverage |
| Native Born | 53 (100.0%) | 0 (0.0%) |
| Foreign Born, Citizen | 137 (90.7%) | 14 (9.3%) |
| Foreign Born, not a Citizen | 68 (100.0%) | 0 (0.0%) |
Health Insurance Coverage by Household Income in Burwell
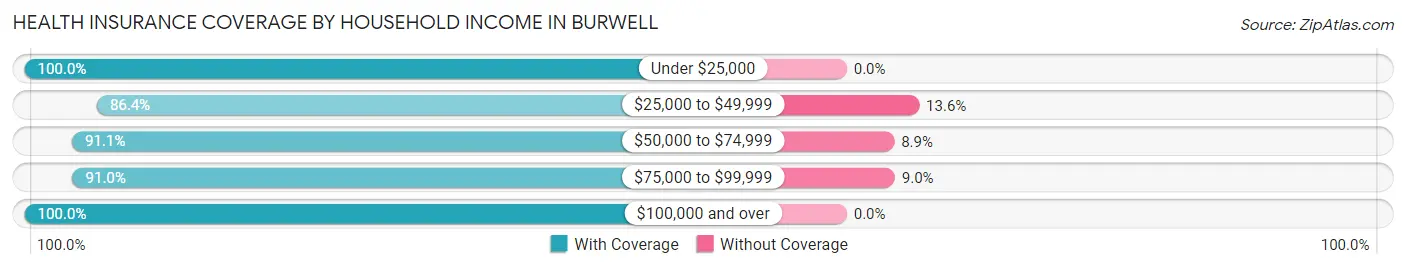
| Household Income | With Coverage | Without Coverage |
| Under $25,000 | 109 (100.0%) | 0 (0.0%) |
| $25,000 to $49,999 | 102 (86.4%) | 16 (13.6%) |
| $50,000 to $74,999 | 246 (91.1%) | 24 (8.9%) |
| $75,000 to $99,999 | 263 (91.0%) | 26 (9.0%) |
| $100,000 and over | 91 (100.0%) | 0 (0.0%) |
Public vs Private Health Insurance Coverage by Age in Burwell
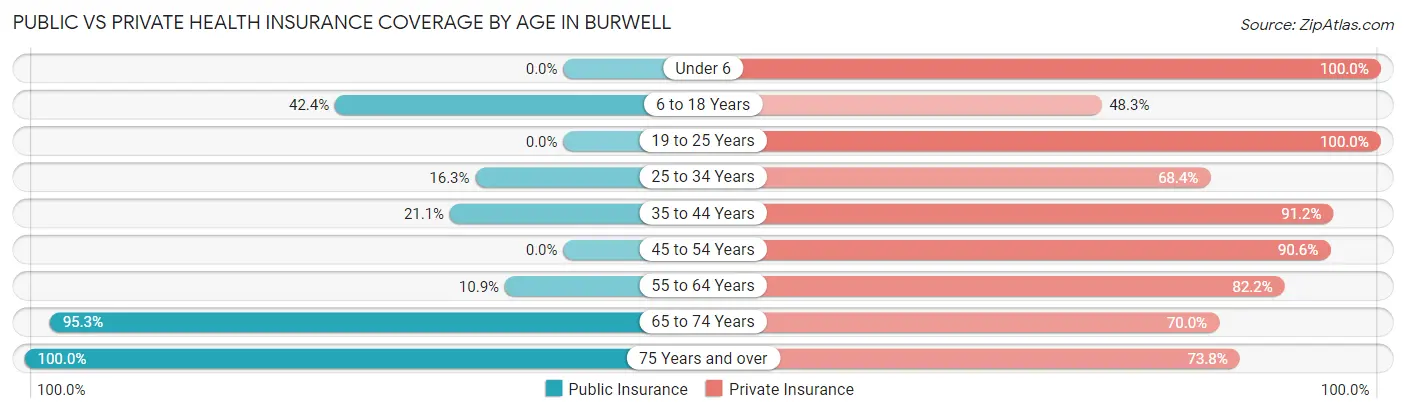
| Age Bracket | Public Insurance | Private Insurance |
| Under 6 | 0 (0.0%) | 53 (100.0%) |
| 6 to 18 Years | 64 (42.4%) | 73 (48.3%) |
| 19 to 25 Years | 0 (0.0%) | 68 (100.0%) |
| 25 to 34 Years | 16 (16.3%) | 67 (68.4%) |
| 35 to 44 Years | 12 (21.0%) | 52 (91.2%) |
| 45 to 54 Years | 0 (0.0%) | 58 (90.6%) |
| 55 to 64 Years | 14 (10.8%) | 106 (82.2%) |
| 65 to 74 Years | 143 (95.3%) | 105 (70.0%) |
| 75 Years and over | 107 (100.0%) | 79 (73.8%) |
| Total | 356 (40.6%) | 661 (75.4%) |
Disability Status by Sex by Age in Burwell
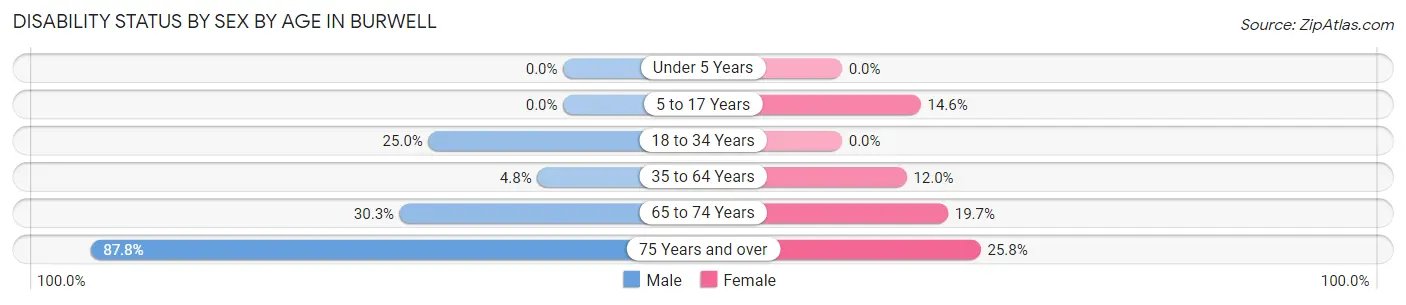
| Age Bracket | Male | Female |
| Under 5 Years | 0 (0.0%) | 0 (0.0%) |
| 5 to 17 Years | 0 (0.0%) | 13 (14.6%) |
| 18 to 34 Years | 23 (25.0%) | 0 (0.0%) |
| 35 to 64 Years | 6 (4.8%) | 15 (12.0%) |
| 65 to 74 Years | 27 (30.3%) | 12 (19.7%) |
| 75 Years and over | 36 (87.8%) | 17 (25.8%) |
Disability Class by Sex by Age in Burwell
Disability Class: Hearing Difficulty
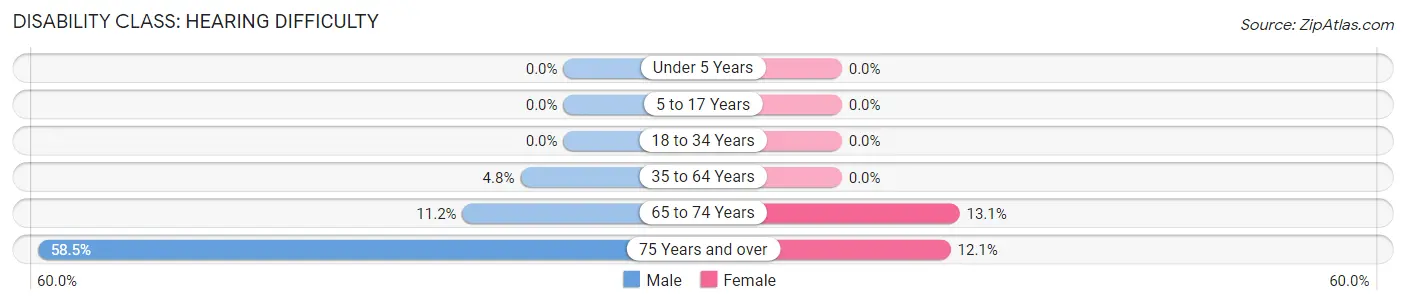
| Age Bracket | Male | Female |
| Under 5 Years | 0 (0.0%) | 0 (0.0%) |
| 5 to 17 Years | 0 (0.0%) | 0 (0.0%) |
| 18 to 34 Years | 0 (0.0%) | 0 (0.0%) |
| 35 to 64 Years | 6 (4.8%) | 0 (0.0%) |
| 65 to 74 Years | 10 (11.2%) | 8 (13.1%) |
| 75 Years and over | 24 (58.5%) | 8 (12.1%) |
Disability Class: Vision Difficulty
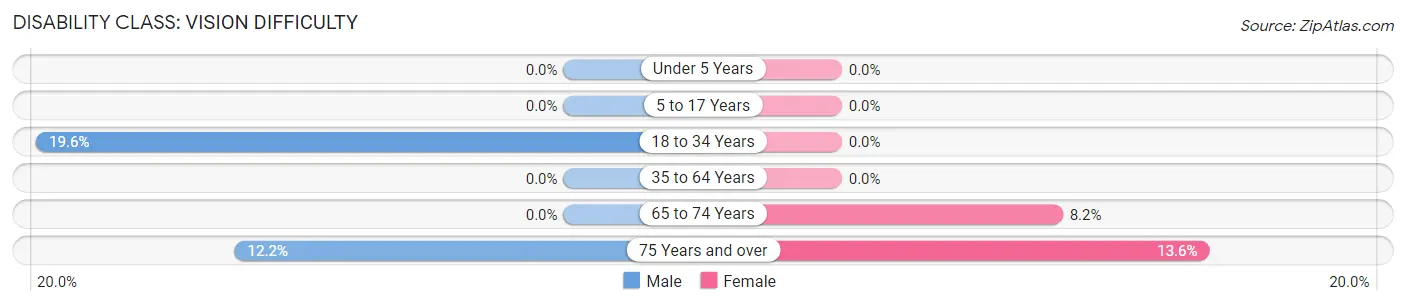
| Age Bracket | Male | Female |
| Under 5 Years | 0 (0.0%) | 0 (0.0%) |
| 5 to 17 Years | 0 (0.0%) | 0 (0.0%) |
| 18 to 34 Years | 18 (19.6%) | 0 (0.0%) |
| 35 to 64 Years | 0 (0.0%) | 0 (0.0%) |
| 65 to 74 Years | 0 (0.0%) | 5 (8.2%) |
| 75 Years and over | 5 (12.2%) | 9 (13.6%) |
Disability Class: Cognitive Difficulty
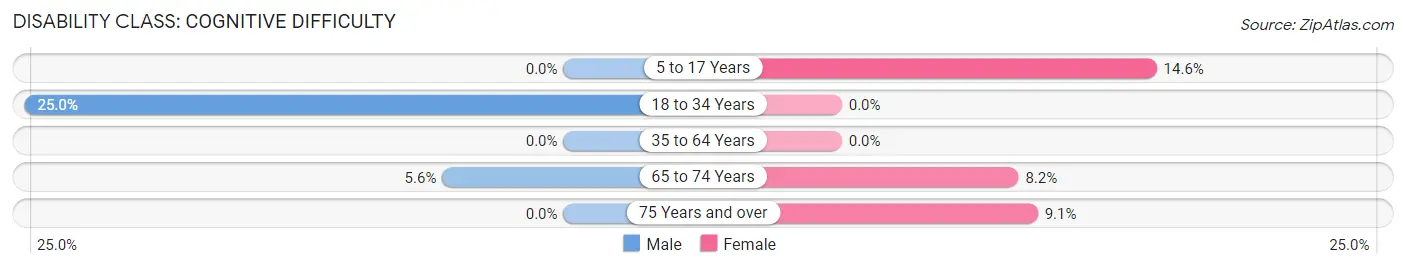
| Age Bracket | Male | Female |
| 5 to 17 Years | 0 (0.0%) | 13 (14.6%) |
| 18 to 34 Years | 23 (25.0%) | 0 (0.0%) |
| 35 to 64 Years | 0 (0.0%) | 0 (0.0%) |
| 65 to 74 Years | 5 (5.6%) | 5 (8.2%) |
| 75 Years and over | 0 (0.0%) | 6 (9.1%) |
Disability Class: Ambulatory Difficulty
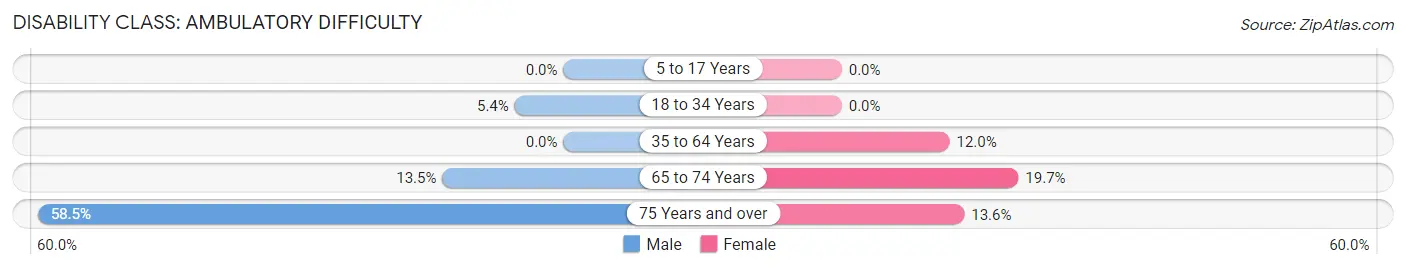
| Age Bracket | Male | Female |
| 5 to 17 Years | 0 (0.0%) | 0 (0.0%) |
| 18 to 34 Years | 5 (5.4%) | 0 (0.0%) |
| 35 to 64 Years | 0 (0.0%) | 15 (12.0%) |
| 65 to 74 Years | 12 (13.5%) | 12 (19.7%) |
| 75 Years and over | 24 (58.5%) | 9 (13.6%) |
Disability Class: Self-Care Difficulty
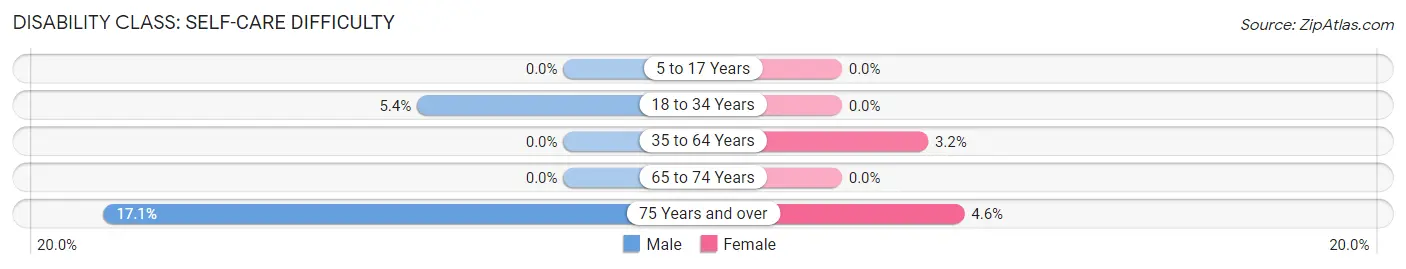
| Age Bracket | Male | Female |
| 5 to 17 Years | 0 (0.0%) | 0 (0.0%) |
| 18 to 34 Years | 5 (5.4%) | 0 (0.0%) |
| 35 to 64 Years | 0 (0.0%) | 4 (3.2%) |
| 65 to 74 Years | 0 (0.0%) | 0 (0.0%) |
| 75 Years and over | 7 (17.1%) | 3 (4.5%) |
Technology Access in Burwell
Computing Device Access in Burwell
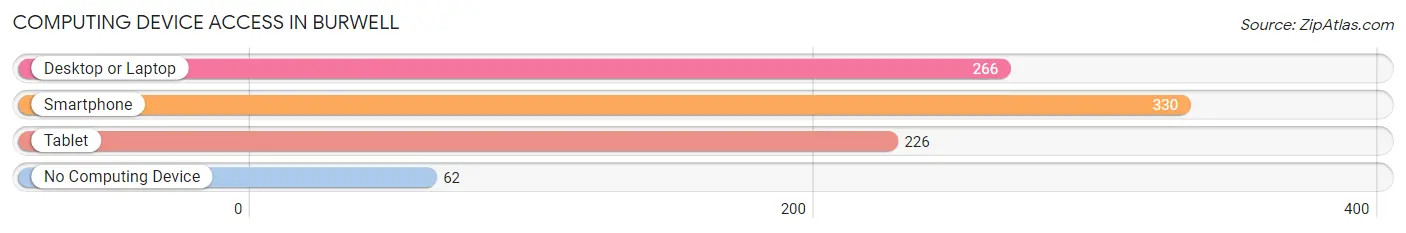
| Device Type | # Households | % Households |
| Desktop or Laptop | 266 | 65.5% |
| Smartphone | 330 | 81.3% |
| Tablet | 226 | 55.7% |
| No Computing Device | 62 | 15.3% |
| Total | 406 | 100.0% |
Internet Access in Burwell
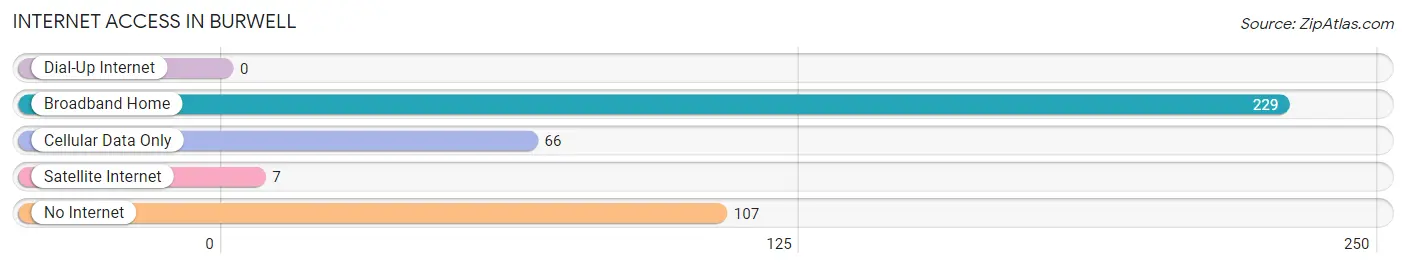
| Internet Type | # Households | % Households |
| Dial-Up Internet | 0 | 0.0% |
| Broadband Home | 229 | 56.4% |
| Cellular Data Only | 66 | 16.3% |
| Satellite Internet | 7 | 1.7% |
| No Internet | 107 | 26.4% |
| Total | 406 | 100.0% |
Burwell Summary
Burwell, Nebraska is a small town located in the Sandhills region of the state. It is the county seat of Garfield County and is located in the north-central part of the state. The town was founded in 1887 and has a population of 1,072 as of the 2020 census.
History
Burwell was founded in 1887 by the Union Pacific Railroad. The town was named after a railroad official, William Burwell. The town was originally a stop on the railroad and was used as a supply point for the surrounding area. The town grew quickly and by 1890, it had a population of over 500.
The town was incorporated in 1891 and the first mayor was elected in 1892. The town continued to grow and by 1900, it had a population of 1,000. The town was a major center for the cattle industry and was home to several large ranches.
In the early 1900s, the town was a major center for the lumber industry. Several sawmills were located in the area and the town was home to several lumber yards. The town also had a large number of stores and businesses.
In the 1920s, the town was a major center for the oil industry. Several oil wells were located in the area and the town was home to several oil refineries. The town also had a large number of stores and businesses.
In the 1950s, the town was a major center for the agricultural industry. Several large farms were located in the area and the town was home to several grain elevators. The town also had a large number of stores and businesses.
Geography
Burwell is located in the Sandhills region of Nebraska. The town is located in the north-central part of the state and is the county seat of Garfield County. The town is located on the banks of the Loup River and is surrounded by rolling hills and grasslands.
The town is located at an elevation of 2,400 feet and has a total area of 1.2 square miles. The town has a humid continental climate with hot summers and cold winters. The average temperature in the summer is around 80 degrees Fahrenheit and the average temperature in the winter is around 20 degrees Fahrenheit.
Economy
The economy of Burwell is largely based on agriculture and tourism. The town is home to several large farms and ranches and is a major center for the cattle industry. The town is also home to several grain elevators and is a major center for the grain industry.
The town is also home to several stores and businesses. The town is home to several restaurants, bars, and hotels. The town is also home to several retail stores and is a major center for the retail industry.
Demographics
As of the 2020 census, the population of Burwell was 1,072. The town has a population density of 890 people per square mile. The median age of the population is 44.7 years and the median household income is $45,000.
The town is predominantly white with a small Hispanic population. The town is also home to a small Native American population. The town is home to several churches and is a major center for the religious community.
Conclusion
Burwell, Nebraska is a small town located in the Sandhills region of the state. The town was founded in 1887 and has a population of 1,072 as of the 2020 census. The town is a major center for the agricultural and retail industries and is home to several stores and businesses. The town is predominantly white with a small Hispanic population and is home to several churches.
Common Questions
What is Per Capita Income in Burwell?
Per Capita income in Burwell is $29,847.
What is the Median Family Income in Burwell?
Median Family Income in Burwell is $76,731.
What is the Median Household income in Burwell?
Median Household Income in Burwell is $65,313.
What is Income or Wage Gap in Burwell?
Income or Wage Gap in Burwell is 47.2%.
Women in Burwell earn 52.8 cents for every dollar earned by a man.
What is Inequality or Gini Index in Burwell?
Inequality or Gini Index in Burwell is 0.37.
What is the Total Population of Burwell?
Total Population of Burwell is 938.
What is the Total Male Population of Burwell?
Total Male Population of Burwell is 468.
What is the Total Female Population of Burwell?
Total Female Population of Burwell is 470.
What is the Ratio of Males per 100 Females in Burwell?
There are 99.57 Males per 100 Females in Burwell.
What is the Ratio of Females per 100 Males in Burwell?
There are 100.43 Females per 100 Males in Burwell.
What is the Median Population Age in Burwell?
Median Population Age in Burwell is 50.5 Years.
What is the Average Family Size in Burwell
Average Family Size in Burwell is 2.7 People.
What is the Average Household Size in Burwell
Average Household Size in Burwell is 2.2 People.
How Large is the Labor Force in Burwell?
There are 457 People in the Labor Forcein in Burwell.
What is the Percentage of People in the Labor Force in Burwell?
59.1% of People are in the Labor Force in Burwell.
What is the Unemployment Rate in Burwell?
Unemployment Rate in Burwell is 2.4%.