Bradshaw, NE Map & Demographics
Bradshaw Map
Bradshaw Overview
$24,995
PER CAPITA INCOME
$69,375
AVG FAMILY INCOME
$68,417
AVG HOUSEHOLD INCOME
52.8%
WAGE / INCOME GAP [ % ]
47.2¢/ $1
WAGE / INCOME GAP [ $ ]
0.30
INEQUALITY / GINI INDEX
397
TOTAL POPULATION
221
MALE POPULATION
176
FEMALE POPULATION
125.57
MALES / 100 FEMALES
79.64
FEMALES / 100 MALES
30.1
MEDIAN AGE
3.2
AVG FAMILY SIZE
2.8
AVG HOUSEHOLD SIZE
153
LABOR FORCE [ PEOPLE ]
64.0%
PERCENT IN LABOR FORCE
9.2%
UNEMPLOYMENT RATE
Bradshaw Zip Codes
Bradshaw Area Codes
Income in Bradshaw
Income Overview in Bradshaw
Per Capita Income in Bradshaw is $24,995, while median incomes of families and households are $69,375 and $68,417 respectively.
| Characteristic | Number | Measure |
| Per Capita Income | 397 | $24,995 |
| Median Family Income | 114 | $69,375 |
| Mean Family Income | 114 | $82,088 |
| Median Household Income | 144 | $68,417 |
| Mean Household Income | 144 | $72,675 |
| Income Deficit | 114 | $0 |
| Wage / Income Gap (%) | 397 | 52.78% |
| Wage / Income Gap ($) | 397 | 47.22¢ per $1 |
| Gini / Inequality Index | 397 | 0.30 |
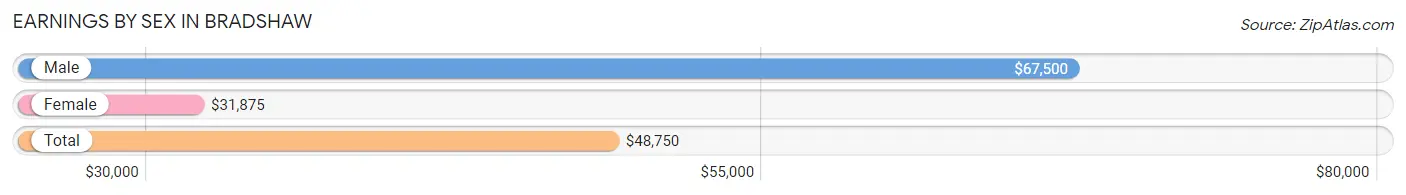
Earnings by Sex in Bradshaw
Average Earnings in Bradshaw are $48,750, $67,500 for men and $31,875 for women, a difference of 52.8%.
| Sex | Number | Average Earnings |
| Male | 106 (68.8%) | $67,500 |
| Female | 48 (31.2%) | $31,875 |
| Total | 154 (100.0%) | $48,750 |
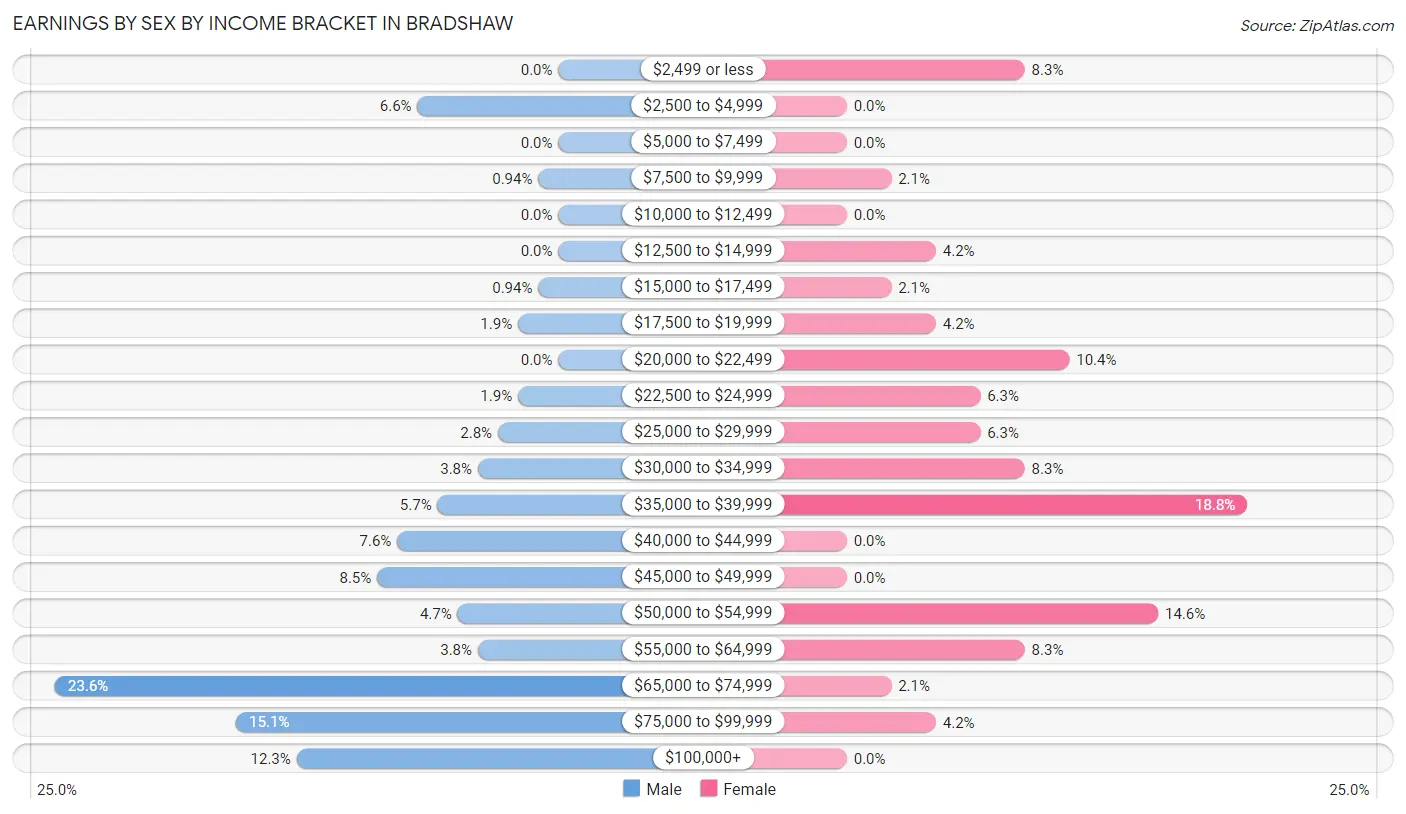
Earnings by Sex by Income Bracket in Bradshaw
The most common earnings brackets in Bradshaw are $65,000 to $74,999 for men (25 | 23.6%) and $35,000 to $39,999 for women (9 | 18.8%).
| Income | Male | Female |
| $2,499 or less | 0 (0.0%) | 4 (8.3%) |
| $2,500 to $4,999 | 7 (6.6%) | 0 (0.0%) |
| $5,000 to $7,499 | 0 (0.0%) | 0 (0.0%) |
| $7,500 to $9,999 | 1 (0.9%) | 1 (2.1%) |
| $10,000 to $12,499 | 0 (0.0%) | 0 (0.0%) |
| $12,500 to $14,999 | 0 (0.0%) | 2 (4.2%) |
| $15,000 to $17,499 | 1 (0.9%) | 1 (2.1%) |
| $17,500 to $19,999 | 2 (1.9%) | 2 (4.2%) |
| $20,000 to $22,499 | 0 (0.0%) | 5 (10.4%) |
| $22,500 to $24,999 | 2 (1.9%) | 3 (6.2%) |
| $25,000 to $29,999 | 3 (2.8%) | 3 (6.2%) |
| $30,000 to $34,999 | 4 (3.8%) | 4 (8.3%) |
| $35,000 to $39,999 | 6 (5.7%) | 9 (18.8%) |
| $40,000 to $44,999 | 8 (7.5%) | 0 (0.0%) |
| $45,000 to $49,999 | 9 (8.5%) | 0 (0.0%) |
| $50,000 to $54,999 | 5 (4.7%) | 7 (14.6%) |
| $55,000 to $64,999 | 4 (3.8%) | 4 (8.3%) |
| $65,000 to $74,999 | 25 (23.6%) | 1 (2.1%) |
| $75,000 to $99,999 | 16 (15.1%) | 2 (4.2%) |
| $100,000+ | 13 (12.3%) | 0 (0.0%) |
| Total | 106 (100.0%) | 48 (100.0%) |
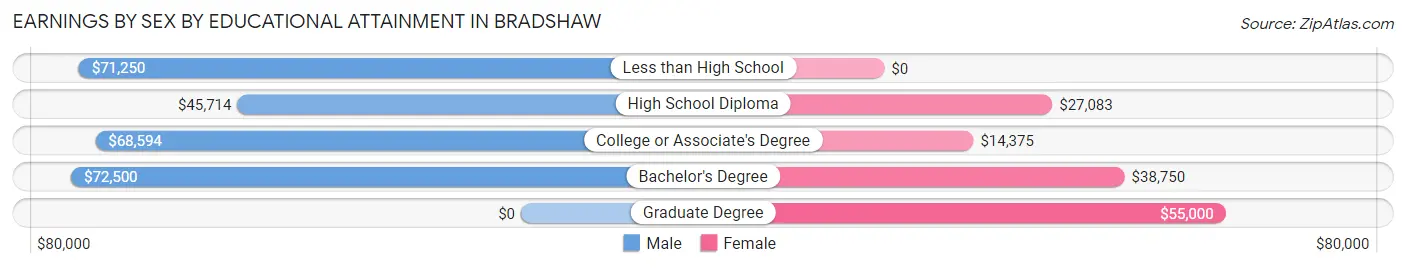
Earnings by Sex by Educational Attainment in Bradshaw
Average earnings in Bradshaw are $67,625 for men and $31,875 for women, a difference of 52.9%. Men with an educational attainment of bachelor's degree enjoy the highest average annual earnings of $72,500, while those with high school diploma education earn the least with $45,714. Women with an educational attainment of graduate degree earn the most with the average annual earnings of $55,000, while those with college or associate's degree education have the smallest earnings of $14,375.
| Educational Attainment | Male Income | Female Income |
| Less than High School | $71,250 | $0 |
| High School Diploma | $45,714 | $27,083 |
| College or Associate's Degree | $68,594 | $14,375 |
| Bachelor's Degree | $72,500 | $38,750 |
| Graduate Degree | - | - |
| Total | $67,625 | $31,875 |
Family Income in Bradshaw
Family Income Brackets in Bradshaw
According to the Bradshaw family income data, there are 56 families falling into the $50,000 to $74,999 income range, which is the most common income bracket and makes up 49.1% of all families.
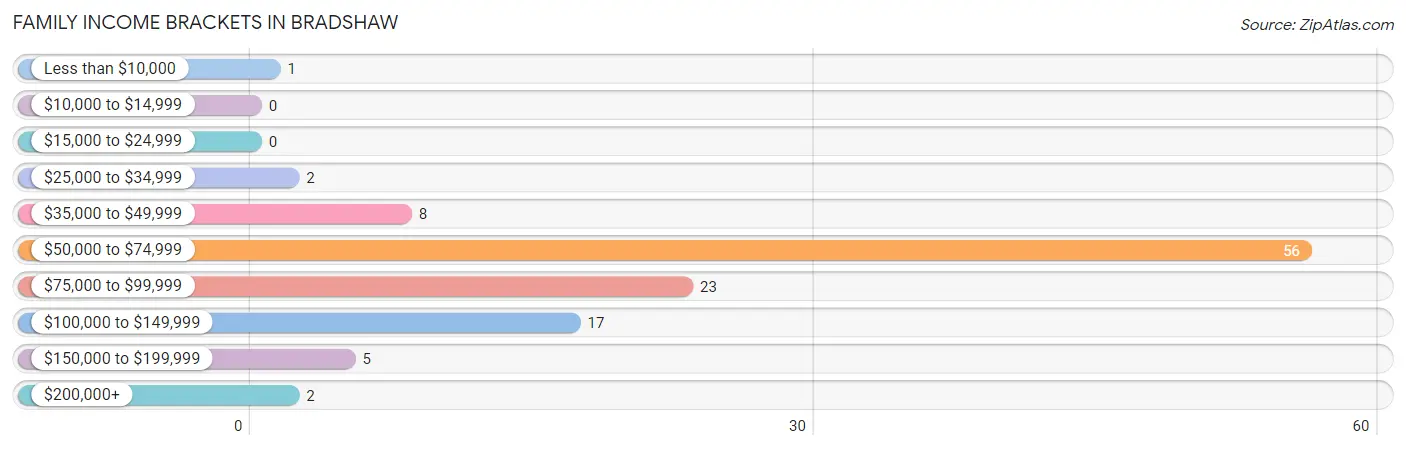
| Income Bracket | # Families | % Families |
| Less than $10,000 | 1 | 0.9% |
| $10,000 to $14,999 | 0 | 0.0% |
| $15,000 to $24,999 | 0 | 0.0% |
| $25,000 to $34,999 | 2 | 1.8% |
| $35,000 to $49,999 | 8 | 7.0% |
| $50,000 to $74,999 | 56 | 49.1% |
| $75,000 to $99,999 | 23 | 20.2% |
| $100,000 to $149,999 | 17 | 14.9% |
| $150,000 to $199,999 | 5 | 4.4% |
| $200,000+ | 2 | 1.8% |
Family Income by Famaliy Size in Bradshaw
3-person families (15 | 13.2%) account for the highest median family income in Bradshaw with $85,208 per family, while 3-person families (15 | 13.2%) have the highest median income of $28,403 per family member.
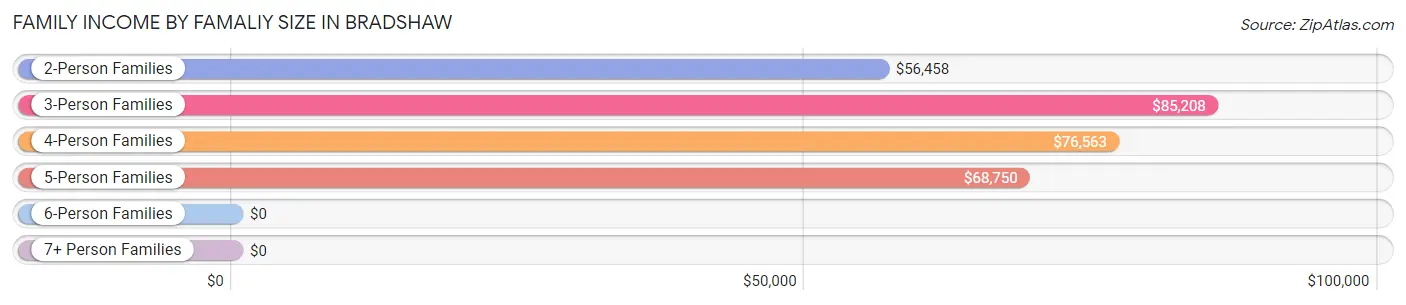
| Income Bracket | # Families | Median Income |
| 2-Person Families | 37 (32.5%) | $56,458 |
| 3-Person Families | 15 (13.2%) | $85,208 |
| 4-Person Families | 19 (16.7%) | $76,563 |
| 5-Person Families | 34 (29.8%) | $68,750 |
| 6-Person Families | 2 (1.8%) | $0 |
| 7+ Person Families | 7 (6.1%) | $0 |
| Total | 114 (100.0%) | $69,375 |
Family Income by Number of Earners in Bradshaw
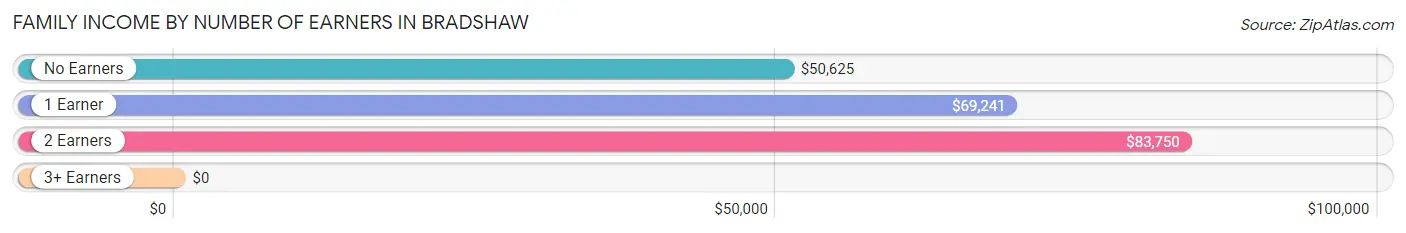
| Number of Earners | # Families | Median Income |
| No Earners | 7 (6.1%) | $50,625 |
| 1 Earner | 75 (65.8%) | $69,241 |
| 2 Earners | 30 (26.3%) | $83,750 |
| 3+ Earners | 2 (1.8%) | $0 |
| Total | 114 (100.0%) | $69,375 |
Household Income in Bradshaw
Household Income Brackets in Bradshaw
With 58 households falling in the category, the $50,000 to $74,999 income range is the most frequent in Bradshaw, accounting for 40.3% of all households. In contrast, only 2 households (1.4%) fall into the $200,000+ income bracket, making it the least populous group.
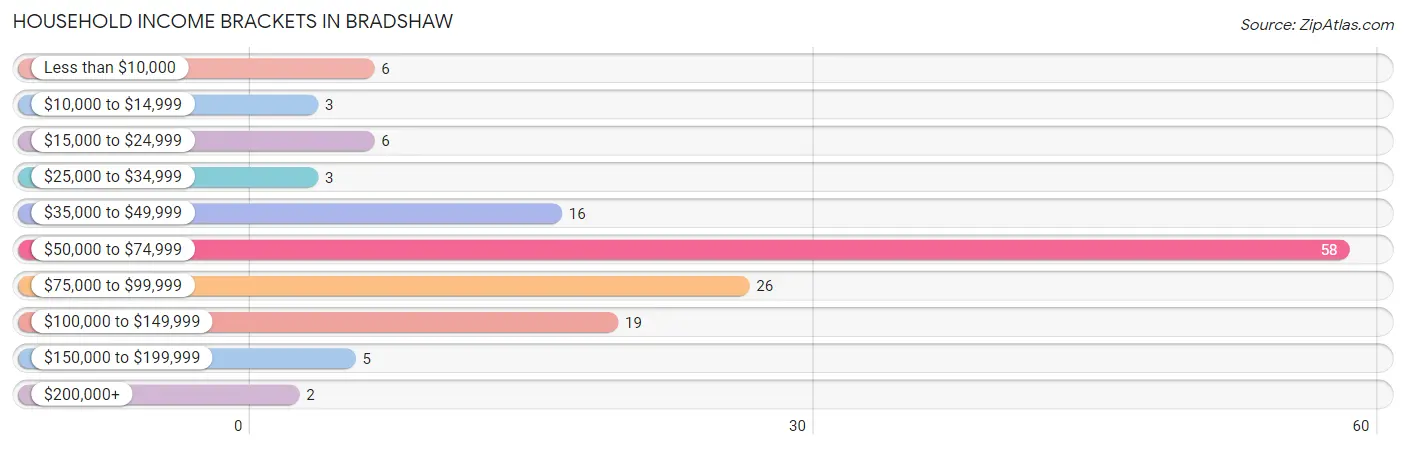
| Income Bracket | # Households | % Households |
| Less than $10,000 | 6 | 4.2% |
| $10,000 to $14,999 | 3 | 2.1% |
| $15,000 to $24,999 | 6 | 4.2% |
| $25,000 to $34,999 | 3 | 2.1% |
| $35,000 to $49,999 | 16 | 11.1% |
| $50,000 to $74,999 | 58 | 40.3% |
| $75,000 to $99,999 | 26 | 18.1% |
| $100,000 to $149,999 | 19 | 13.2% |
| $150,000 to $199,999 | 5 | 3.5% |
| $200,000+ | 2 | 1.4% |
Household Income by Householder Age in Bradshaw
The median household income in Bradshaw is $68,417, with the highest median household income of $69,464 found in the 25 to 44 years age bracket for the primary householder. A total of 68 households (47.2%) fall into this category.
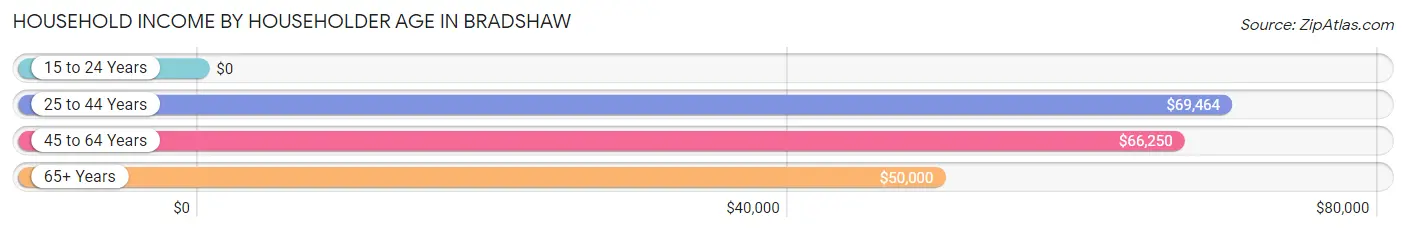
| Income Bracket | # Households | Median Income |
| 15 to 24 Years | 0 (0.0%) | $0 |
| 25 to 44 Years | 68 (47.2%) | $69,464 |
| 45 to 64 Years | 46 (31.9%) | $66,250 |
| 65+ Years | 30 (20.8%) | $50,000 |
| Total | 144 (100.0%) | $68,417 |
Poverty in Bradshaw
Income Below Poverty by Sex and Age in Bradshaw
With 2.3% poverty level for males and 2.3% for females among the residents of Bradshaw, 65 to 74 year old males and 55 to 64 year old females are the most vulnerable to poverty, with 2 males (16.7%) and 3 females (16.7%) in their respective age groups living below the poverty level.
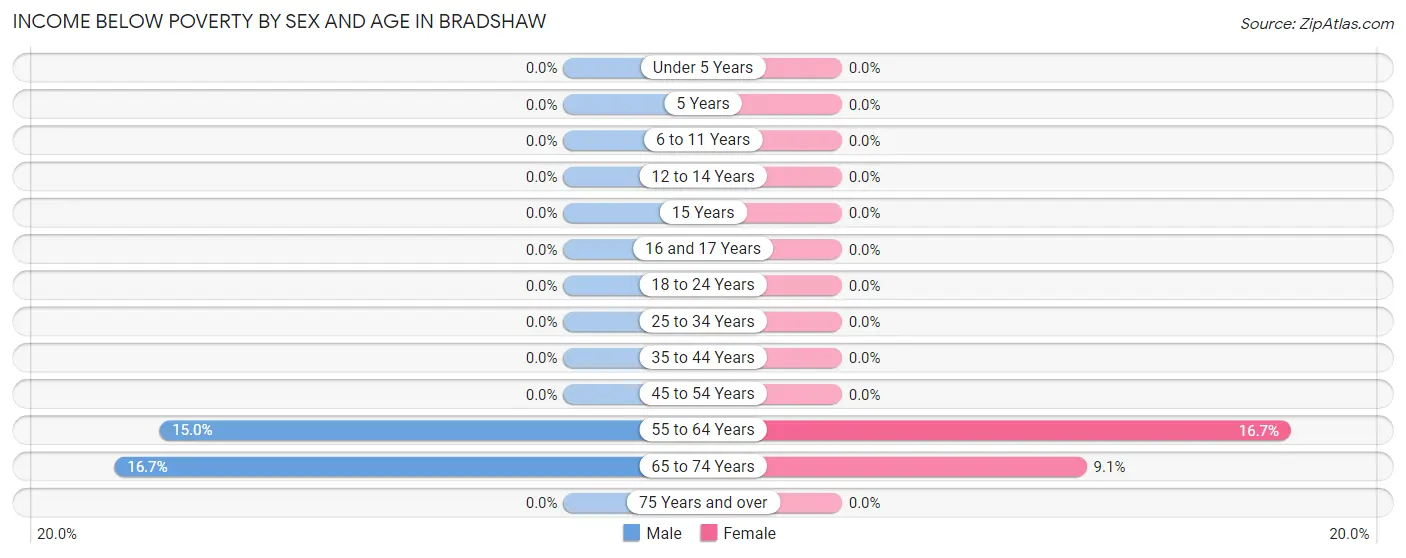
| Age Bracket | Male | Female |
| Under 5 Years | 0 (0.0%) | 0 (0.0%) |
| 5 Years | 0 (0.0%) | 0 (0.0%) |
| 6 to 11 Years | 0 (0.0%) | 0 (0.0%) |
| 12 to 14 Years | 0 (0.0%) | 0 (0.0%) |
| 15 Years | 0 (0.0%) | 0 (0.0%) |
| 16 and 17 Years | 0 (0.0%) | 0 (0.0%) |
| 18 to 24 Years | 0 (0.0%) | 0 (0.0%) |
| 25 to 34 Years | 0 (0.0%) | 0 (0.0%) |
| 35 to 44 Years | 0 (0.0%) | 0 (0.0%) |
| 45 to 54 Years | 0 (0.0%) | 0 (0.0%) |
| 55 to 64 Years | 3 (15.0%) | 3 (16.7%) |
| 65 to 74 Years | 2 (16.7%) | 1 (9.1%) |
| 75 Years and over | 0 (0.0%) | 0 (0.0%) |
| Total | 5 (2.3%) | 4 (2.3%) |
Income Above Poverty by Sex and Age in Bradshaw
According to the poverty statistics in Bradshaw, males aged under 5 years and females aged under 5 years are the age groups that are most secure financially, with 100.0% of males and 100.0% of females in these age groups living above the poverty line.
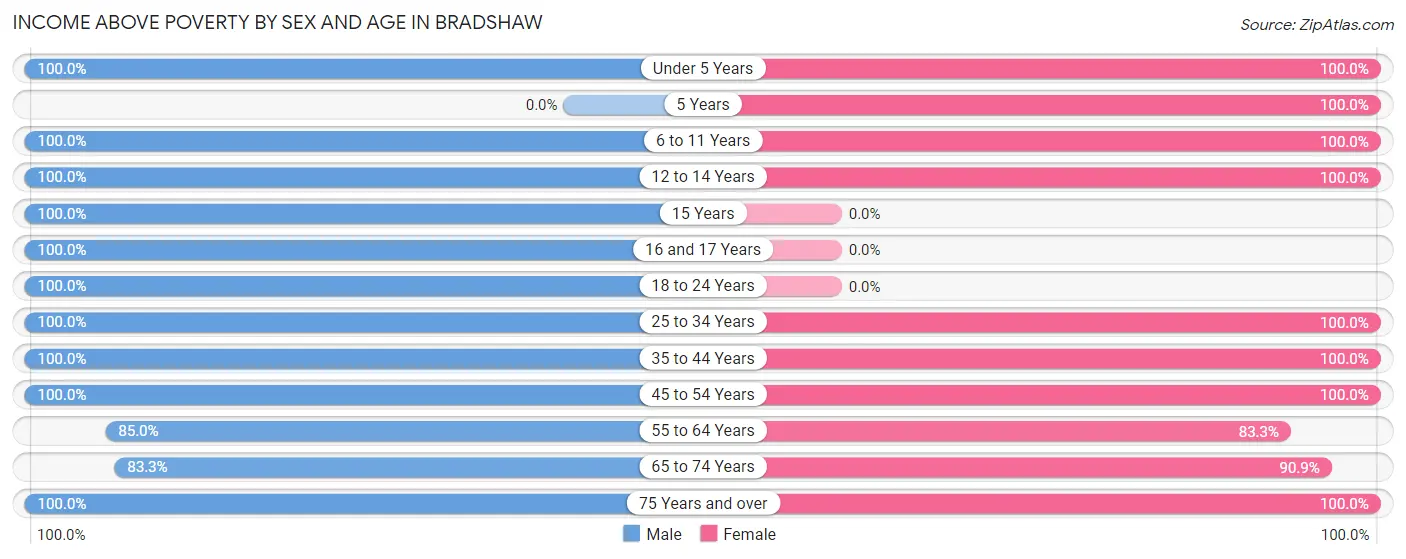
| Age Bracket | Male | Female |
| Under 5 Years | 59 (100.0%) | 33 (100.0%) |
| 5 Years | 0 (0.0%) | 2 (100.0%) |
| 6 to 11 Years | 14 (100.0%) | 16 (100.0%) |
| 12 to 14 Years | 18 (100.0%) | 14 (100.0%) |
| 15 Years | 2 (100.0%) | 0 (0.0%) |
| 16 and 17 Years | 2 (100.0%) | 0 (0.0%) |
| 18 to 24 Years | 4 (100.0%) | 0 (0.0%) |
| 25 to 34 Years | 45 (100.0%) | 44 (100.0%) |
| 35 to 44 Years | 14 (100.0%) | 9 (100.0%) |
| 45 to 54 Years | 20 (100.0%) | 14 (100.0%) |
| 55 to 64 Years | 17 (85.0%) | 15 (83.3%) |
| 65 to 74 Years | 10 (83.3%) | 10 (90.9%) |
| 75 Years and over | 11 (100.0%) | 15 (100.0%) |
| Total | 216 (97.7%) | 172 (97.7%) |
Income Below Poverty Among Married-Couple Families in Bradshaw
The poverty statistics for married-couple families in Bradshaw show that 1.2% or 1 of the total 85 families live below the poverty line. Families with no children have the highest poverty rate of 3.5%, comprising of 1 families. On the other hand, families with 1 or 2 children have the lowest poverty rate of 0.0%, which includes 0 families.
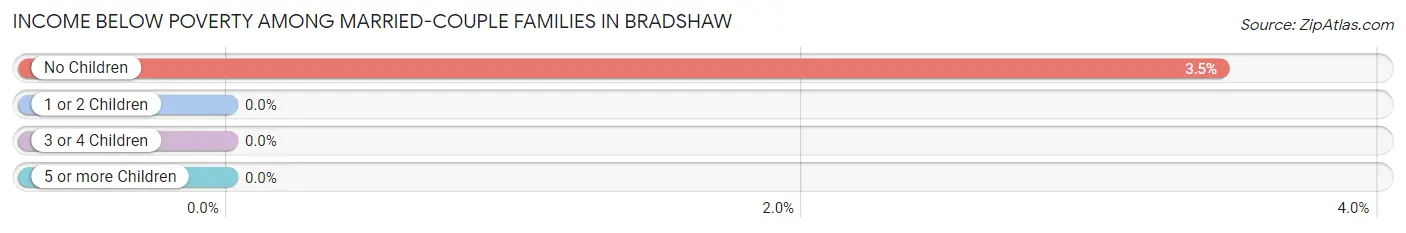
| Children | Above Poverty | Below Poverty |
| No Children | 28 (96.6%) | 1 (3.5%) |
| 1 or 2 Children | 14 (100.0%) | 0 (0.0%) |
| 3 or 4 Children | 35 (100.0%) | 0 (0.0%) |
| 5 or more Children | 7 (100.0%) | 0 (0.0%) |
| Total | 84 (98.8%) | 1 (1.2%) |
Income Below Poverty Among Single-Parent Households in Bradshaw
| Children | Single Father | Single Mother |
| No Children | 0 (0.0%) | 0 (0.0%) |
| 1 or 2 Children | 0 (0.0%) | 0 (0.0%) |
| 3 or 4 Children | 0 (0.0%) | 0 (0.0%) |
| 5 or more Children | 0 (0.0%) | 0 (0.0%) |
| Total | 0 (0.0%) | 0 (0.0%) |
Income Below Poverty Among Married-Couple vs Single-Parent Households in Bradshaw
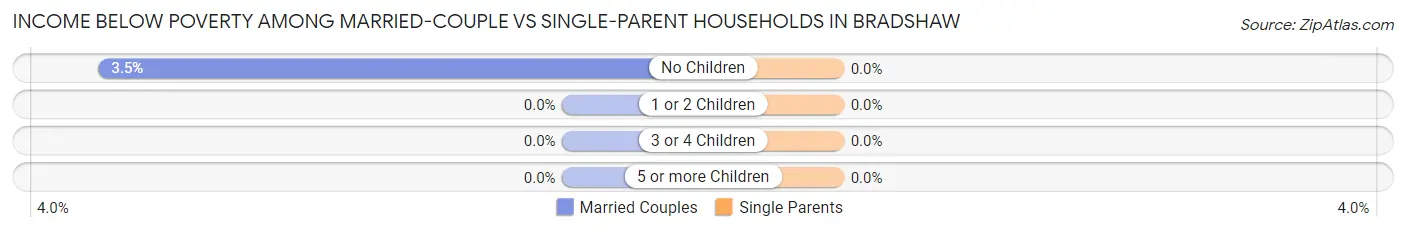
| Children | Married-Couple Families | Single-Parent Households |
| No Children | 1 (3.5%) | 0 (0.0%) |
| 1 or 2 Children | 0 (0.0%) | 0 (0.0%) |
| 3 or 4 Children | 0 (0.0%) | 0 (0.0%) |
| 5 or more Children | 0 (0.0%) | 0 (0.0%) |
| Total | 1 (1.2%) | 0 (0.0%) |
Race in Bradshaw
The most populous races in Bradshaw are White / Caucasian (291 | 73.3%), Hispanic or Latino (125 | 31.5%), and Two or more Races (78 | 19.7%).
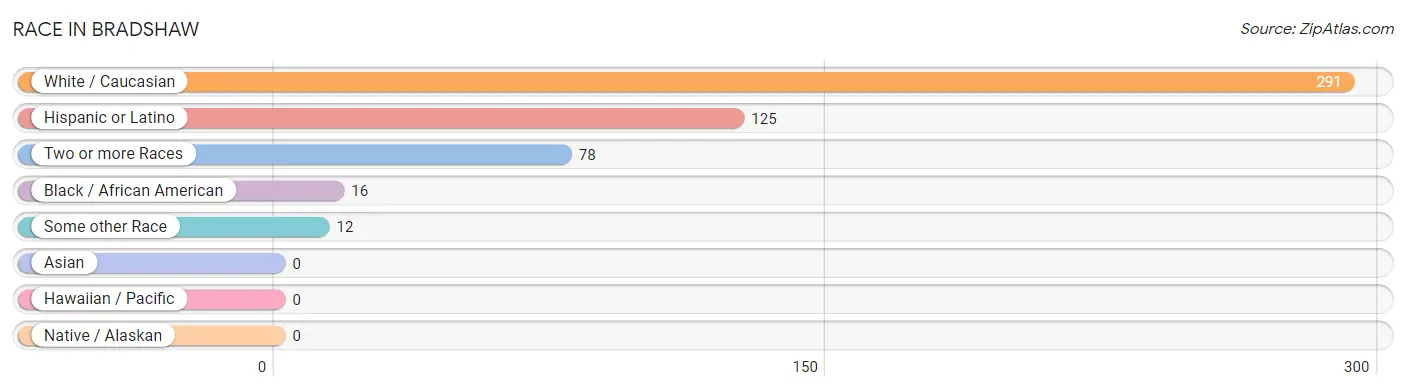
| Race | # Population | % Population |
| Asian | 0 | 0.0% |
| Black / African American | 16 | 4.0% |
| Hawaiian / Pacific | 0 | 0.0% |
| Hispanic or Latino | 125 | 31.5% |
| Native / Alaskan | 0 | 0.0% |
| White / Caucasian | 291 | 73.3% |
| Two or more Races | 78 | 19.7% |
| Some other Race | 12 | 3.0% |
| Total | 397 | 100.0% |
Ancestry in Bradshaw
The most populous ancestries reported in Bradshaw are German (123 | 31.0%), Mexican (113 | 28.5%), Irish (35 | 8.8%), English (25 | 6.3%), and Scandinavian (20 | 5.0%), together accounting for 79.6% of all Bradshaw residents.
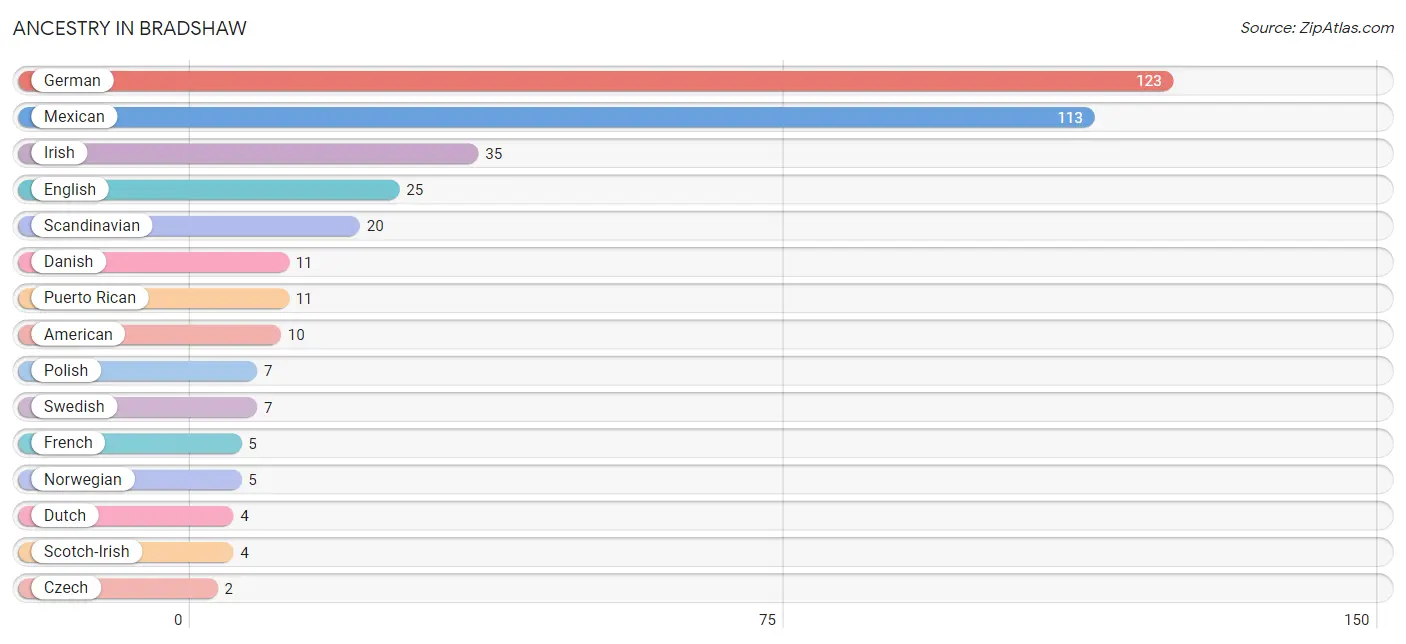
| Ancestry | # Population | % Population |
| American | 10 | 2.5% |
| British | 1 | 0.3% |
| Central American | 1 | 0.3% |
| Czech | 2 | 0.5% |
| Czechoslovakian | 2 | 0.5% |
| Danish | 11 | 2.8% |
| Dutch | 4 | 1.0% |
| English | 25 | 6.3% |
| European | 1 | 0.3% |
| French | 5 | 1.3% |
| German | 123 | 31.0% |
| Irish | 35 | 8.8% |
| Italian | 1 | 0.3% |
| Mexican | 113 | 28.5% |
| Norwegian | 5 | 1.3% |
| Panamanian | 1 | 0.3% |
| Polish | 7 | 1.8% |
| Puerto Rican | 11 | 2.8% |
| Scandinavian | 20 | 5.0% |
| Scotch-Irish | 4 | 1.0% |
| Scottish | 1 | 0.3% |
| Swedish | 7 | 1.8% |
| Welsh | 1 | 0.3% | View All 23 Rows |
Immigrants in Bradshaw
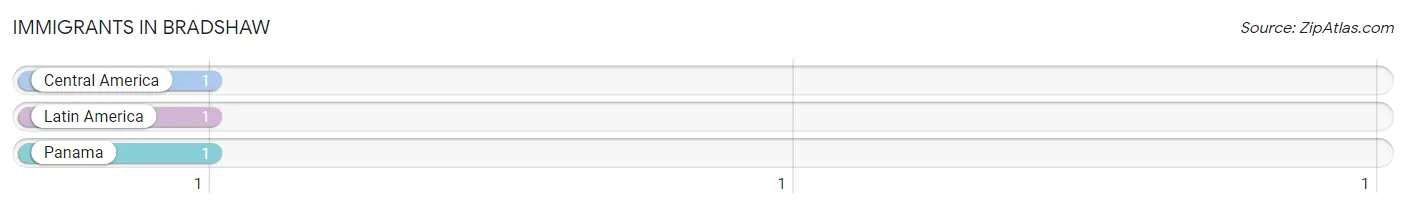
The most numerous immigrant groups reported in Bradshaw came from Central America (1 | 0.3%), Latin America (1 | 0.3%), and Panama (1 | 0.3%), together accounting for 0.7% of all Bradshaw residents.
| Immigration Origin | # Population | % Population |
| Central America | 1 | 0.3% |
| Latin America | 1 | 0.3% |
| Panama | 1 | 0.3% | View All 3 Rows |
Sex and Age in Bradshaw
Sex and Age in Bradshaw
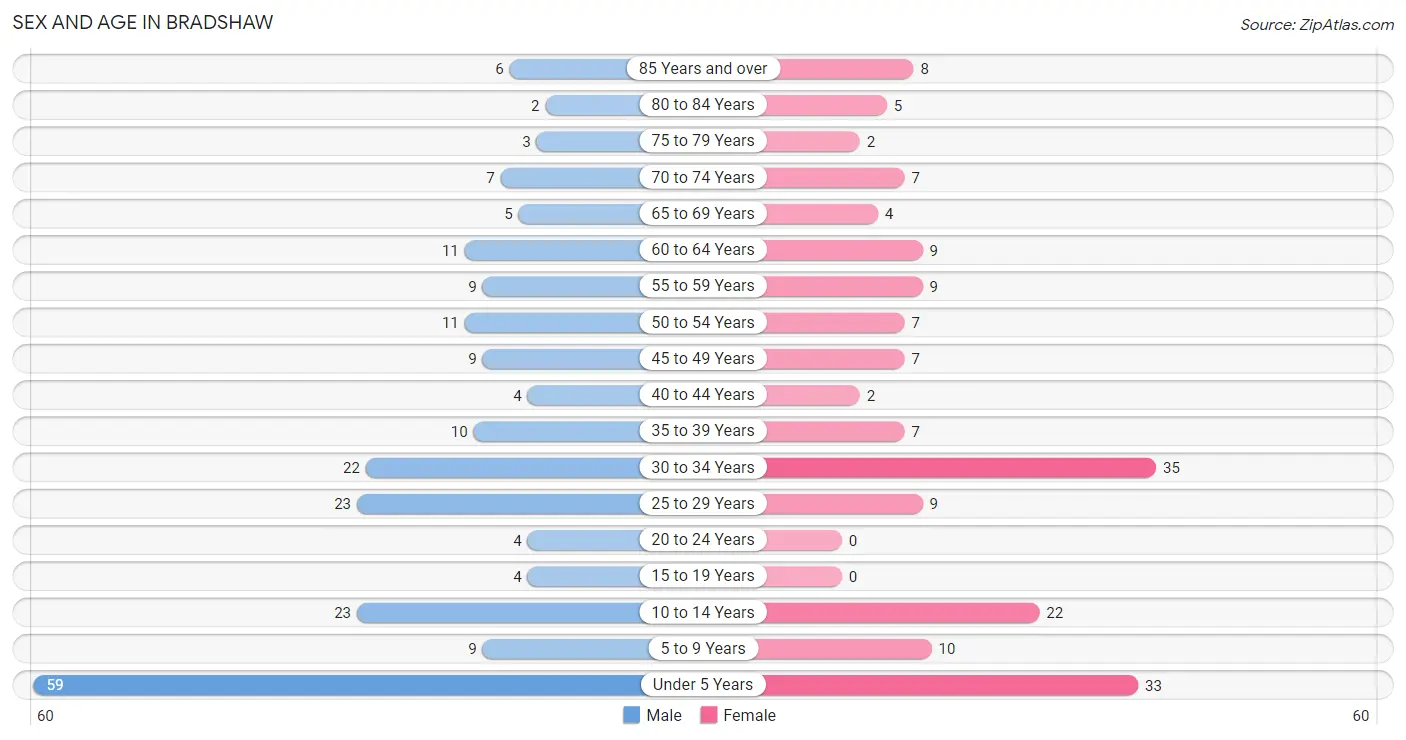
The most populous age groups in Bradshaw are Under 5 Years (59 | 26.7%) for men and 30 to 34 Years (35 | 19.9%) for women.
| Age Bracket | Male | Female |
| Under 5 Years | 59 (26.7%) | 33 (18.8%) |
| 5 to 9 Years | 9 (4.1%) | 10 (5.7%) |
| 10 to 14 Years | 23 (10.4%) | 22 (12.5%) |
| 15 to 19 Years | 4 (1.8%) | 0 (0.0%) |
| 20 to 24 Years | 4 (1.8%) | 0 (0.0%) |
| 25 to 29 Years | 23 (10.4%) | 9 (5.1%) |
| 30 to 34 Years | 22 (10.0%) | 35 (19.9%) |
| 35 to 39 Years | 10 (4.5%) | 7 (4.0%) |
| 40 to 44 Years | 4 (1.8%) | 2 (1.1%) |
| 45 to 49 Years | 9 (4.1%) | 7 (4.0%) |
| 50 to 54 Years | 11 (5.0%) | 7 (4.0%) |
| 55 to 59 Years | 9 (4.1%) | 9 (5.1%) |
| 60 to 64 Years | 11 (5.0%) | 9 (5.1%) |
| 65 to 69 Years | 5 (2.3%) | 4 (2.3%) |
| 70 to 74 Years | 7 (3.2%) | 7 (4.0%) |
| 75 to 79 Years | 3 (1.4%) | 2 (1.1%) |
| 80 to 84 Years | 2 (0.9%) | 5 (2.8%) |
| 85 Years and over | 6 (2.7%) | 8 (4.5%) |
| Total | 221 (100.0%) | 176 (100.0%) |
Families and Households in Bradshaw
Median Family Size in Bradshaw
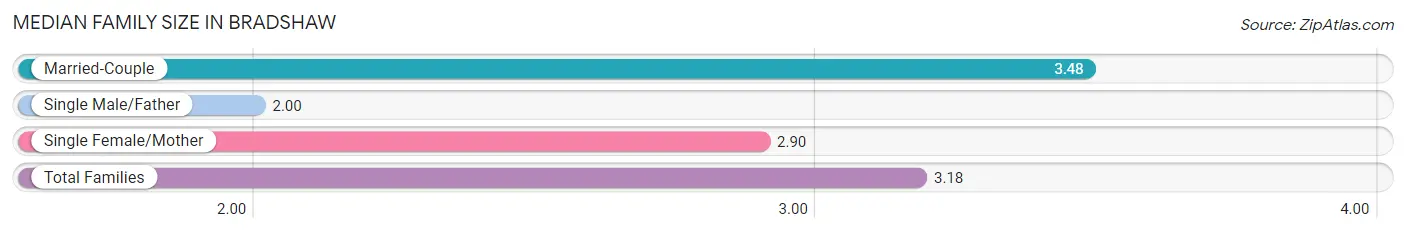
The median family size in Bradshaw is 3.18 persons per family, with married-couple families (85 | 74.6%) accounting for the largest median family size of 3.48 persons per family. On the other hand, single male/father families (19 | 16.7%) represent the smallest median family size with 2.00 persons per family.
| Family Type | # Families | Family Size |
| Married-Couple | 85 (74.6%) | 3.48 |
| Single Male/Father | 19 (16.7%) | 2.00 |
| Single Female/Mother | 10 (8.8%) | 2.90 |
| Total Families | 114 (100.0%) | 3.18 |
Median Household Size in Bradshaw
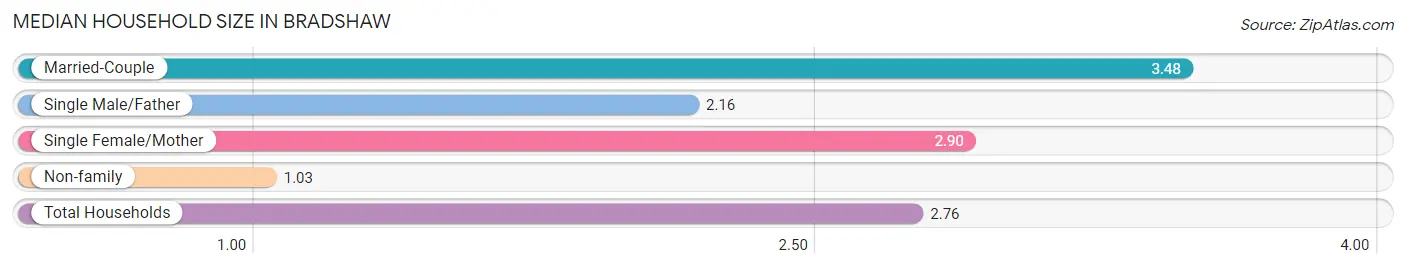
The median household size in Bradshaw is 2.76 persons per household, with married-couple households (85 | 59.0%) accounting for the largest median household size of 3.48 persons per household. non-family households (30 | 20.8%) represent the smallest median household size with 1.03 persons per household.
| Household Type | # Households | Household Size |
| Married-Couple | 85 (59.0%) | 3.48 |
| Single Male/Father | 19 (13.2%) | 2.16 |
| Single Female/Mother | 10 (6.9%) | 2.90 |
| Non-family | 30 (20.8%) | 1.03 |
| Total Households | 144 (100.0%) | 2.76 |
Household Size by Marriage Status in Bradshaw
Out of a total of 144 households in Bradshaw, 114 (79.2%) are family households, while 30 (20.8%) are nonfamily households. The most numerous type of family households are 2-person households, comprising 37, and the most common type of nonfamily households are 1-person households, comprising 29.
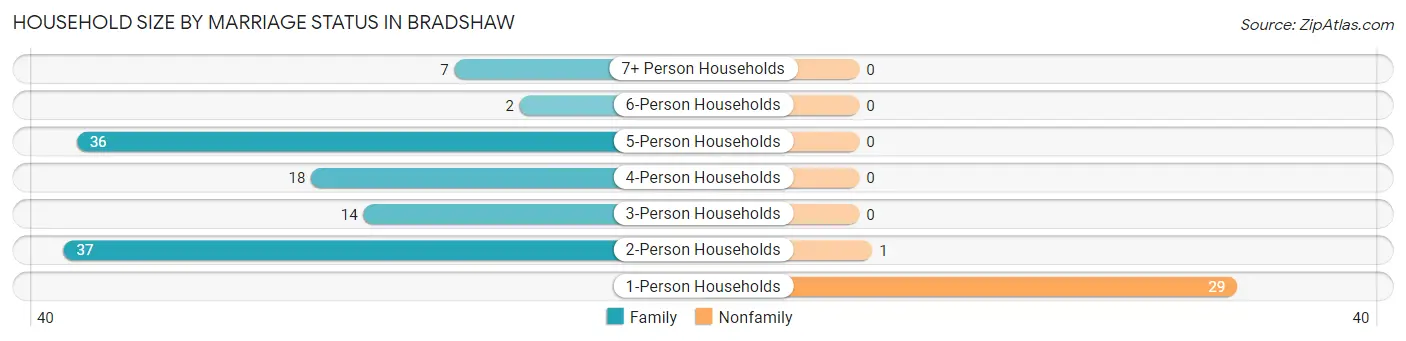
| Household Size | Family Households | Nonfamily Households |
| 1-Person Households | - | 29 (20.1%) |
| 2-Person Households | 37 (25.7%) | 1 (0.7%) |
| 3-Person Households | 14 (9.7%) | 0 (0.0%) |
| 4-Person Households | 18 (12.5%) | 0 (0.0%) |
| 5-Person Households | 36 (25.0%) | 0 (0.0%) |
| 6-Person Households | 2 (1.4%) | 0 (0.0%) |
| 7+ Person Households | 7 (4.9%) | 0 (0.0%) |
| Total | 114 (79.2%) | 30 (20.8%) |
Female Fertility in Bradshaw
Fertility by Age in Bradshaw
| Age Bracket | Women with Births | Births / 1,000 Women |
| 15 to 19 years | 0 (0.0%) | 0.0 |
| 20 to 34 years | 0 (0.0%) | 0.0 |
| 35 to 50 years | 0 (0.0%) | 0.0 |
| Total | 0 (0.0%) | 0.0 |
Fertility by Age by Marriage Status in Bradshaw
| Age Bracket | Married | Unmarried |
| 15 to 19 years | 0 (0.0%) | 0 (0.0%) |
| 20 to 34 years | 0 (0.0%) | 0 (0.0%) |
| 35 to 50 years | 0 (0.0%) | 0 (0.0%) |
| Total | 0 (0.0%) | 0 (0.0%) |
Fertility by Education in Bradshaw
| Educational Attainment | Women with Births | Births / 1,000 Women |
| Less than High School | 0 (0.0%) | 0.0 |
| High School Diploma | 0 (0.0%) | 0.0 |
| College or Associate's Degree | 0 (0.0%) | 0.0 |
| Bachelor's Degree | 0 (0.0%) | 0.0 |
| Graduate Degree | 0 (0.0%) | 0.0 |
| Total | 0 (0.0%) | 0.0 |
Fertility by Education by Marriage Status in Bradshaw
| Educational Attainment | Married | Unmarried |
| Less than High School | 0 (0.0%) | 0 (0.0%) |
| High School Diploma | 0 (0.0%) | 0 (0.0%) |
| College or Associate's Degree | 0 (0.0%) | 0 (0.0%) |
| Bachelor's Degree | 0 (0.0%) | 0 (0.0%) |
| Graduate Degree | 0 (0.0%) | 0 (0.0%) |
| Total | 0 (0.0%) | 0 (0.0%) |
Employment Characteristics in Bradshaw
Employment by Class of Employer in Bradshaw
Among the 135 employed individuals in Bradshaw, private company employees (88 | 65.2%), not-for-profit organizations (13 | 9.6%), and state government employees (9 | 6.7%) make up the most common classes of employment.
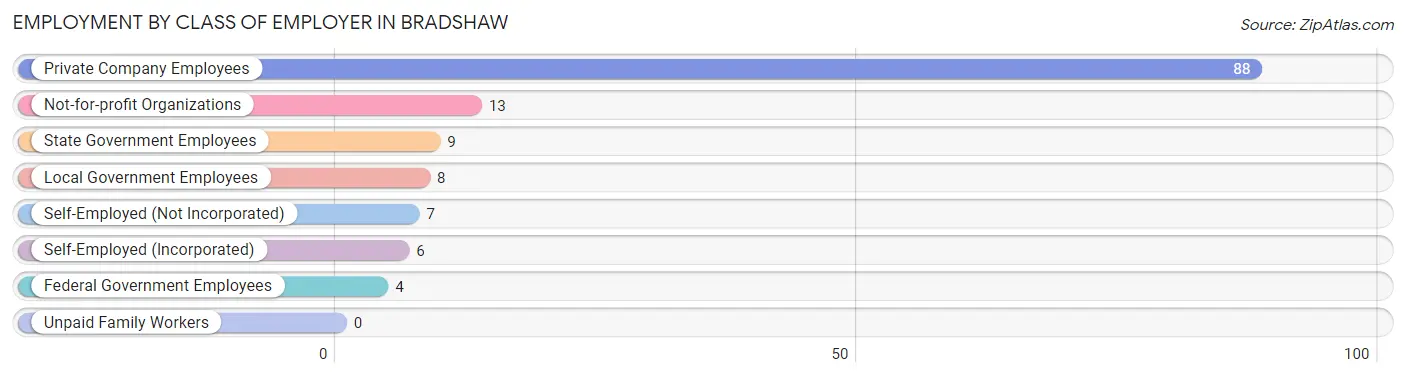
| Employer Class | # Employees | % Employees |
| Private Company Employees | 88 | 65.2% |
| Self-Employed (Incorporated) | 6 | 4.4% |
| Self-Employed (Not Incorporated) | 7 | 5.2% |
| Not-for-profit Organizations | 13 | 9.6% |
| Local Government Employees | 8 | 5.9% |
| State Government Employees | 9 | 6.7% |
| Federal Government Employees | 4 | 3.0% |
| Unpaid Family Workers | 0 | 0.0% |
| Total | 135 | 100.0% |
Employment Status by Age in Bradshaw
According to the labor force statistics for Bradshaw, out of the total population over 16 years of age (239), 64.0% or 153 individuals are in the labor force, with 9.2% or 14 of them unemployed. The age group with the highest labor force participation rate is 45 to 54 years, with 100.0% or 34 individuals in the labor force. Within the labor force, the 30 to 34 years age range has the highest percentage of unemployed individuals, with 44.4% or 12 of them being unemployed.
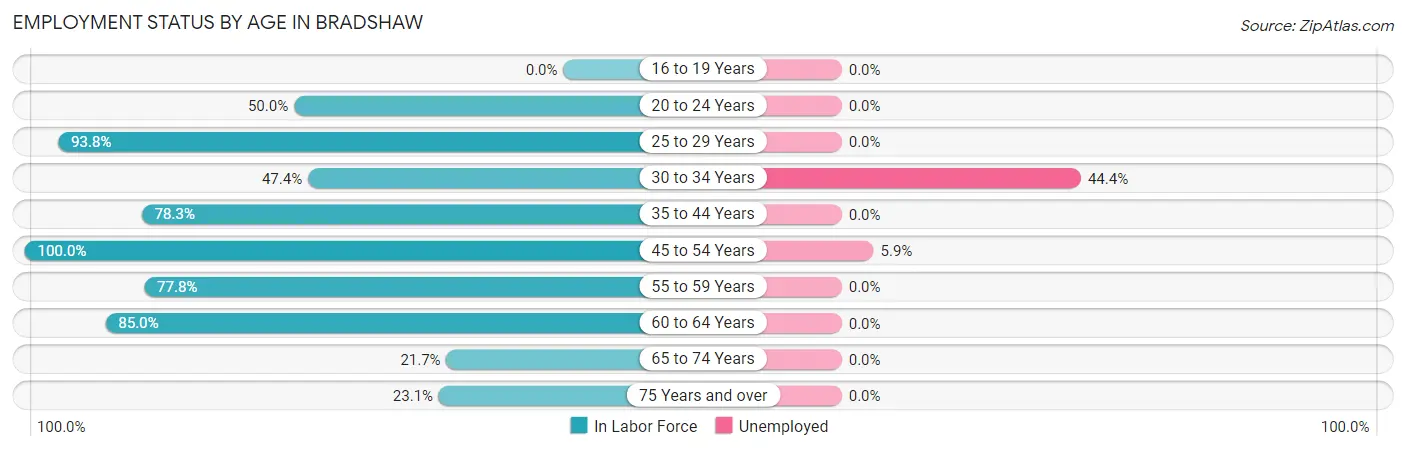
| Age Bracket | In Labor Force | Unemployed |
| 16 to 19 Years | 0 (0.0%) | 0 (0.0%) |
| 20 to 24 Years | 2 (50.0%) | 0 (0.0%) |
| 25 to 29 Years | 30 (93.8%) | 0 (0.0%) |
| 30 to 34 Years | 27 (47.4%) | 12 (44.4%) |
| 35 to 44 Years | 18 (78.3%) | 0 (0.0%) |
| 45 to 54 Years | 34 (100.0%) | 2 (5.9%) |
| 55 to 59 Years | 14 (77.8%) | 0 (0.0%) |
| 60 to 64 Years | 17 (85.0%) | 0 (0.0%) |
| 65 to 74 Years | 5 (21.7%) | 0 (0.0%) |
| 75 Years and over | 6 (23.1%) | 0 (0.0%) |
| Total | 153 (64.0%) | 14 (9.2%) |
Employment Status by Educational Attainment in Bradshaw
According to labor force statistics for Bradshaw, 76.1% of individuals (140) out of the total population between 25 and 64 years of age (184) are in the labor force, with 10.0% or 14 of them being unemployed. The group with the highest labor force participation rate are those with the educational attainment of high school diploma, with 92.2% or 47 individuals in the labor force. Within the labor force, individuals with bachelor's degree or higher education have the highest percentage of unemployment, with 26.1% or 12 of them being unemployed.
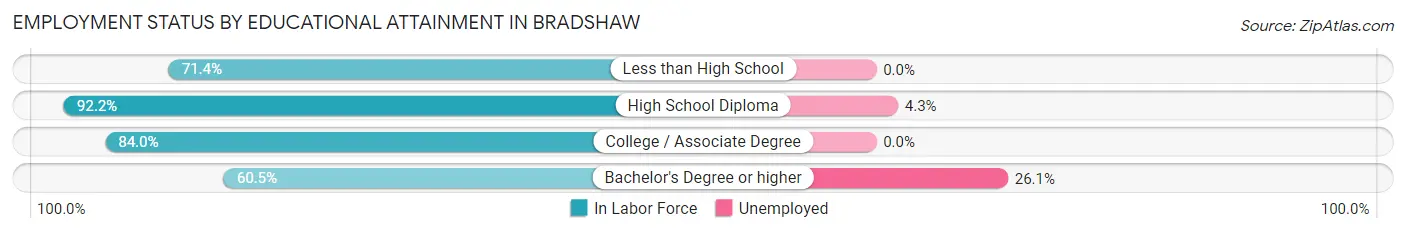
| Educational Attainment | In Labor Force | Unemployed |
| Less than High School | 5 (71.4%) | 0 (0.0%) |
| High School Diploma | 47 (92.2%) | 2 (4.3%) |
| College / Associate Degree | 42 (84.0%) | 0 (0.0%) |
| Bachelor's Degree or higher | 46 (60.5%) | 20 (26.1%) |
| Total | 140 (76.1%) | 18 (10.0%) |
Employment Occupations by Sex in Bradshaw
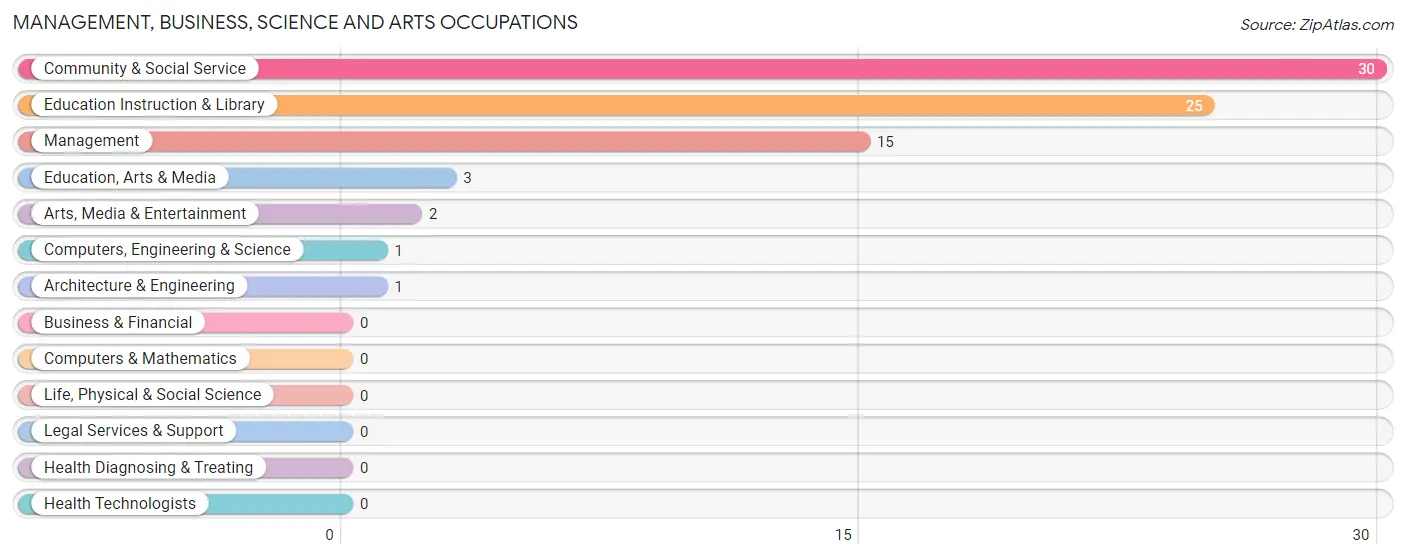
Management, Business, Science and Arts Occupations
The most common Management, Business, Science and Arts occupations in Bradshaw are Community & Social Service (30 | 21.6%), Education Instruction & Library (25 | 18.0%), Management (15 | 10.8%), Education, Arts & Media (3 | 2.2%), and Arts, Media & Entertainment (2 | 1.4%).
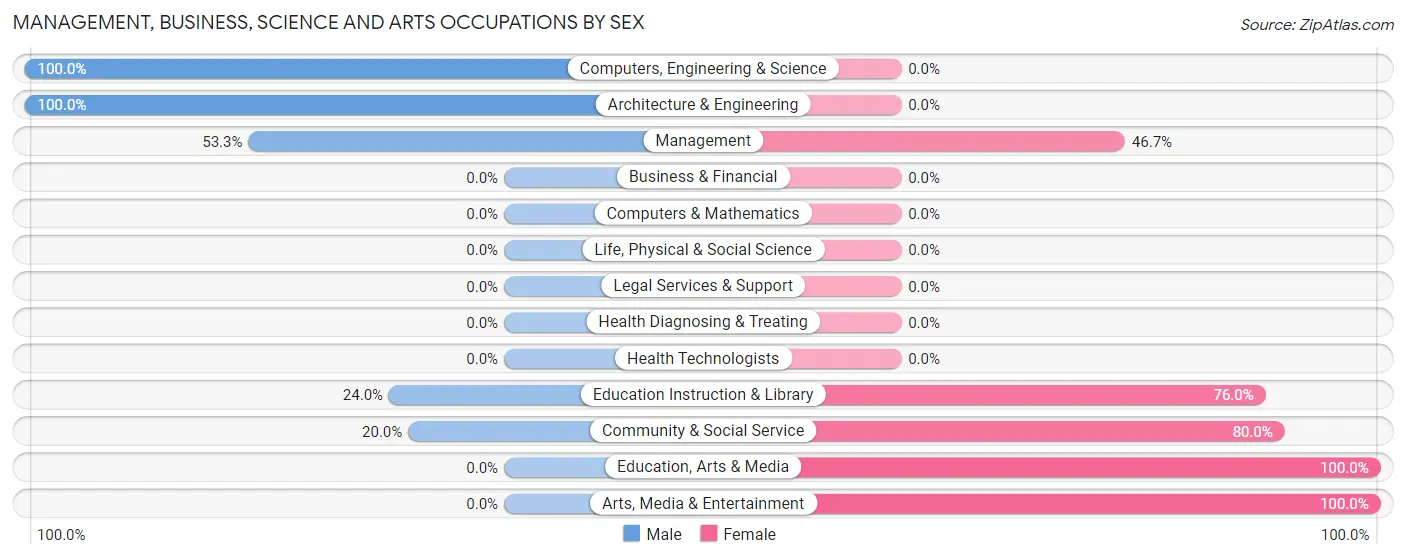
Management, Business, Science and Arts Occupations by Sex
Within the Management, Business, Science and Arts occupations in Bradshaw, the most male-oriented occupations are Computers, Engineering & Science (100.0%), Architecture & Engineering (100.0%), and Management (53.3%), while the most female-oriented occupations are Education, Arts & Media (100.0%), Arts, Media & Entertainment (100.0%), and Community & Social Service (80.0%).
| Occupation | Male | Female |
| Management | 8 (53.3%) | 7 (46.7%) |
| Business & Financial | 0 (0.0%) | 0 (0.0%) |
| Computers, Engineering & Science | 1 (100.0%) | 0 (0.0%) |
| Computers & Mathematics | 0 (0.0%) | 0 (0.0%) |
| Architecture & Engineering | 1 (100.0%) | 0 (0.0%) |
| Life, Physical & Social Science | 0 (0.0%) | 0 (0.0%) |
| Community & Social Service | 6 (20.0%) | 24 (80.0%) |
| Education, Arts & Media | 0 (0.0%) | 3 (100.0%) |
| Legal Services & Support | 0 (0.0%) | 0 (0.0%) |
| Education Instruction & Library | 6 (24.0%) | 19 (76.0%) |
| Arts, Media & Entertainment | 0 (0.0%) | 2 (100.0%) |
| Health Diagnosing & Treating | 0 (0.0%) | 0 (0.0%) |
| Health Technologists | 0 (0.0%) | 0 (0.0%) |
| Total (Category) | 15 (32.6%) | 31 (67.4%) |
| Total (Overall) | 92 (66.2%) | 47 (33.8%) |
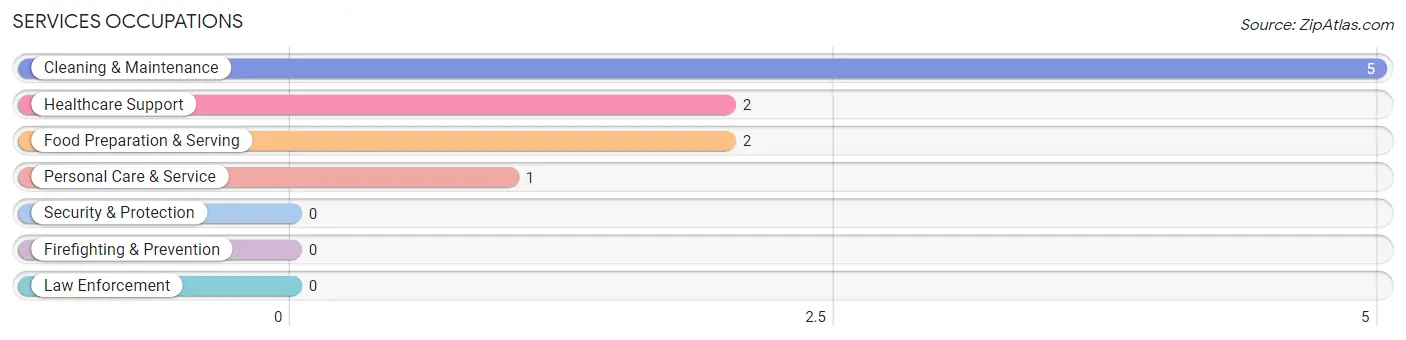
Services Occupations
The most common Services occupations in Bradshaw are Cleaning & Maintenance (5 | 3.6%), Healthcare Support (2 | 1.4%), Food Preparation & Serving (2 | 1.4%), and Personal Care & Service (1 | 0.7%).
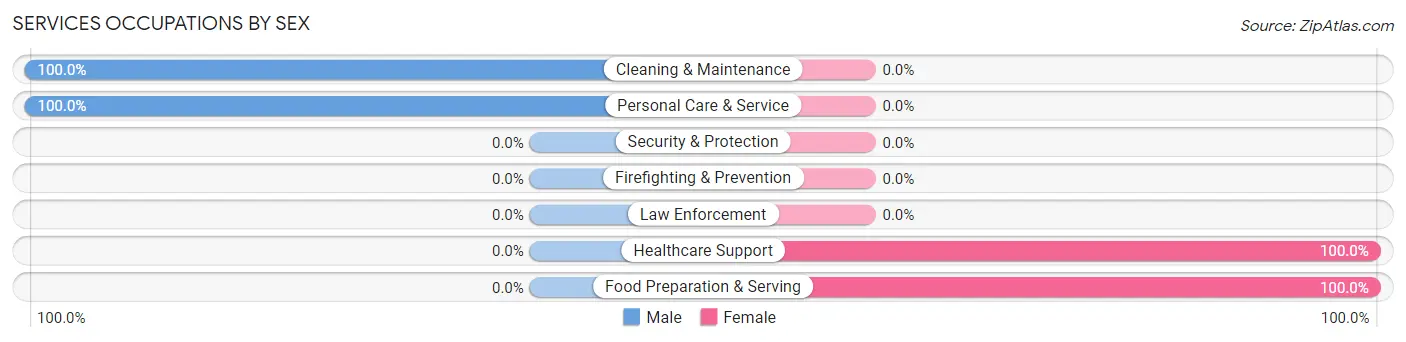
Services Occupations by Sex
Within the Services occupations in Bradshaw, the most male-oriented occupations are Cleaning & Maintenance (100.0%), and Personal Care & Service (100.0%), while the most female-oriented occupations are Healthcare Support (100.0%), and Food Preparation & Serving (100.0%).
| Occupation | Male | Female |
| Healthcare Support | 0 (0.0%) | 2 (100.0%) |
| Security & Protection | 0 (0.0%) | 0 (0.0%) |
| Firefighting & Prevention | 0 (0.0%) | 0 (0.0%) |
| Law Enforcement | 0 (0.0%) | 0 (0.0%) |
| Food Preparation & Serving | 0 (0.0%) | 2 (100.0%) |
| Cleaning & Maintenance | 5 (100.0%) | 0 (0.0%) |
| Personal Care & Service | 1 (100.0%) | 0 (0.0%) |
| Total (Category) | 6 (60.0%) | 4 (40.0%) |
| Total (Overall) | 92 (66.2%) | 47 (33.8%) |
Sales and Office Occupations
The most common Sales and Office occupations in Bradshaw are Sales & Related (17 | 12.2%), and Office & Administration (8 | 5.8%).
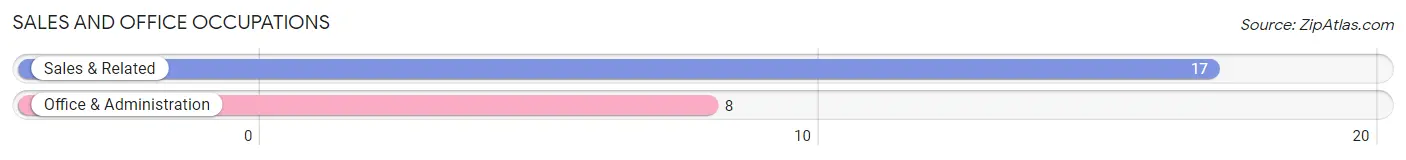
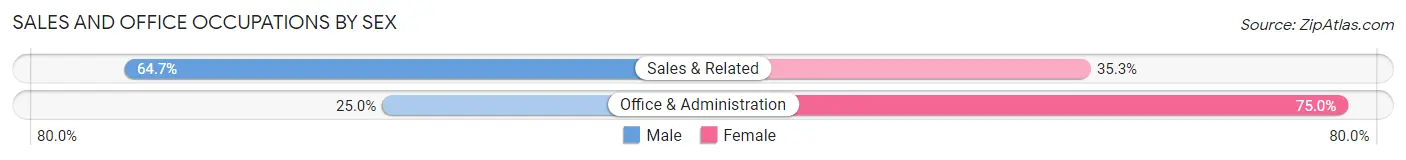
Sales and Office Occupations by Sex
| Occupation | Male | Female |
| Sales & Related | 11 (64.7%) | 6 (35.3%) |
| Office & Administration | 2 (25.0%) | 6 (75.0%) |
| Total (Category) | 13 (52.0%) | 12 (48.0%) |
| Total (Overall) | 92 (66.2%) | 47 (33.8%) |
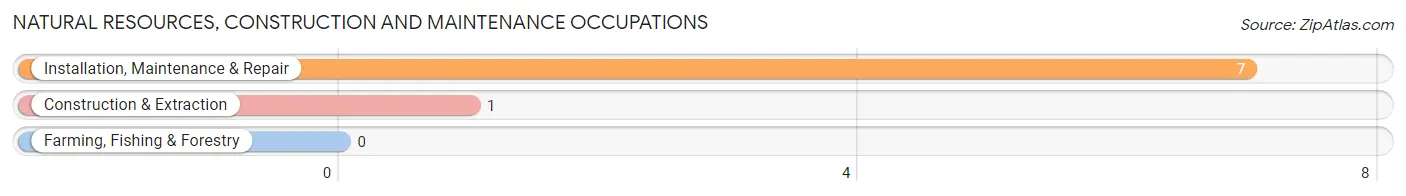
Natural Resources, Construction and Maintenance Occupations
The most common Natural Resources, Construction and Maintenance occupations in Bradshaw are Installation, Maintenance & Repair (7 | 5.0%), and Construction & Extraction (1 | 0.7%).
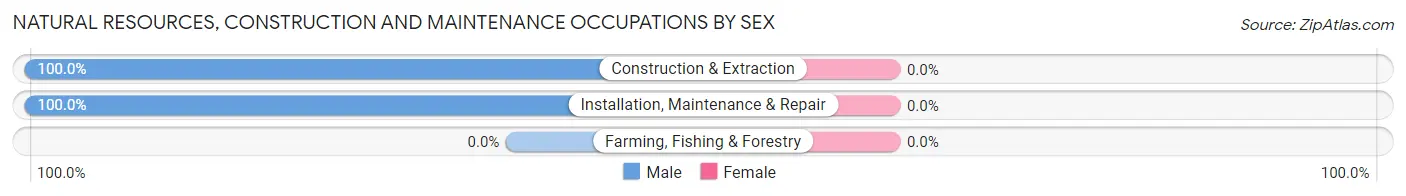
Natural Resources, Construction and Maintenance Occupations by Sex
| Occupation | Male | Female |
| Farming, Fishing & Forestry | 0 (0.0%) | 0 (0.0%) |
| Construction & Extraction | 1 (100.0%) | 0 (0.0%) |
| Installation, Maintenance & Repair | 7 (100.0%) | 0 (0.0%) |
| Total (Category) | 8 (100.0%) | 0 (0.0%) |
| Total (Overall) | 92 (66.2%) | 47 (33.8%) |
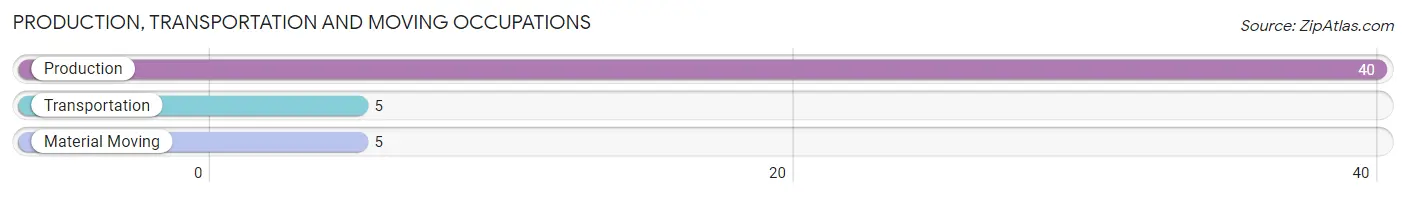
Production, Transportation and Moving Occupations
The most common Production, Transportation and Moving occupations in Bradshaw are Production (40 | 28.8%), Transportation (5 | 3.6%), and Material Moving (5 | 3.6%).
Production, Transportation and Moving Occupations by Sex
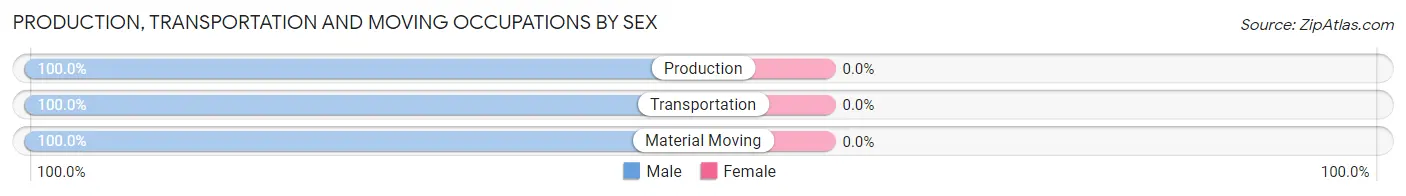
| Occupation | Male | Female |
| Production | 40 (100.0%) | 0 (0.0%) |
| Transportation | 5 (100.0%) | 0 (0.0%) |
| Material Moving | 5 (100.0%) | 0 (0.0%) |
| Total (Category) | 50 (100.0%) | 0 (0.0%) |
| Total (Overall) | 92 (66.2%) | 47 (33.8%) |
Employment Industries by Sex in Bradshaw
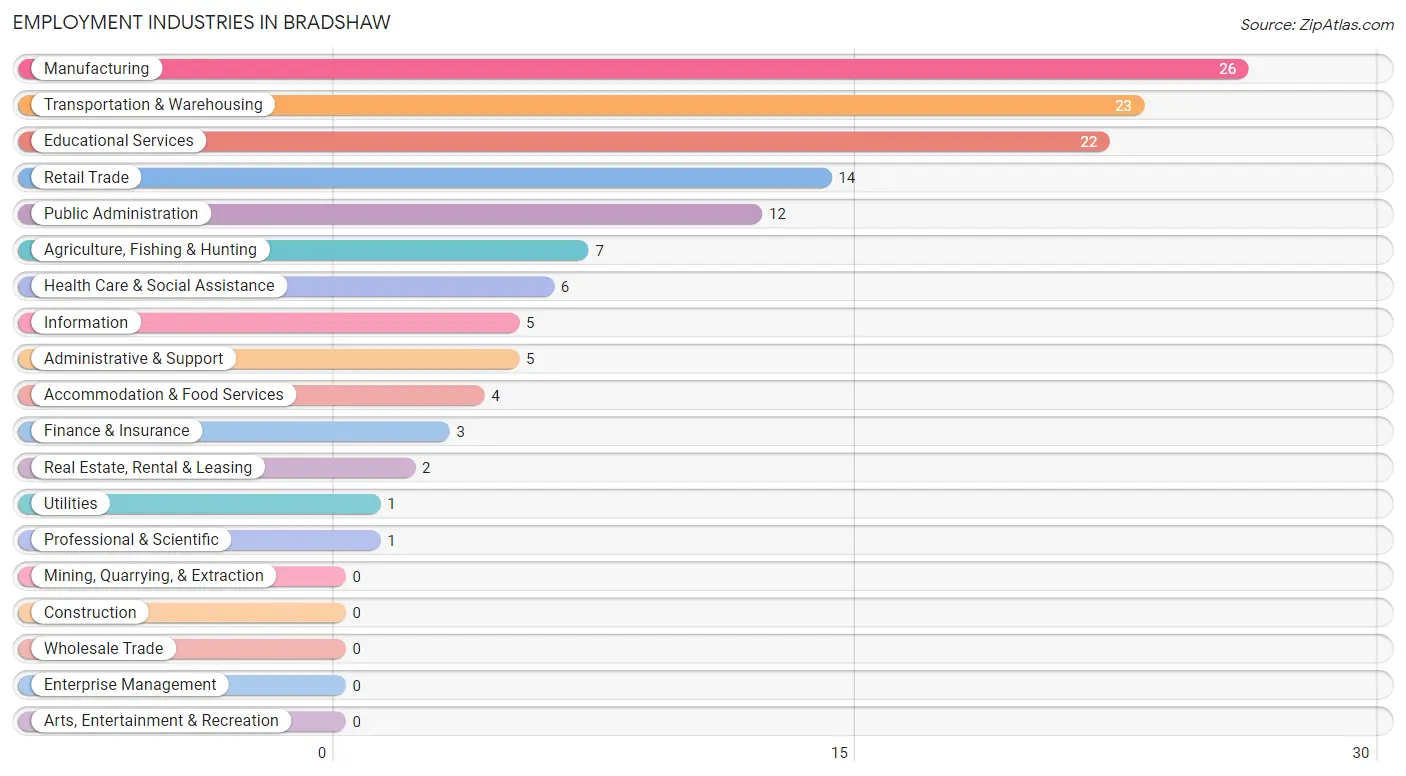
Employment Industries in Bradshaw
The major employment industries in Bradshaw include Manufacturing (26 | 18.7%), Transportation & Warehousing (23 | 16.6%), Educational Services (22 | 15.8%), Retail Trade (14 | 10.1%), and Public Administration (12 | 8.6%).
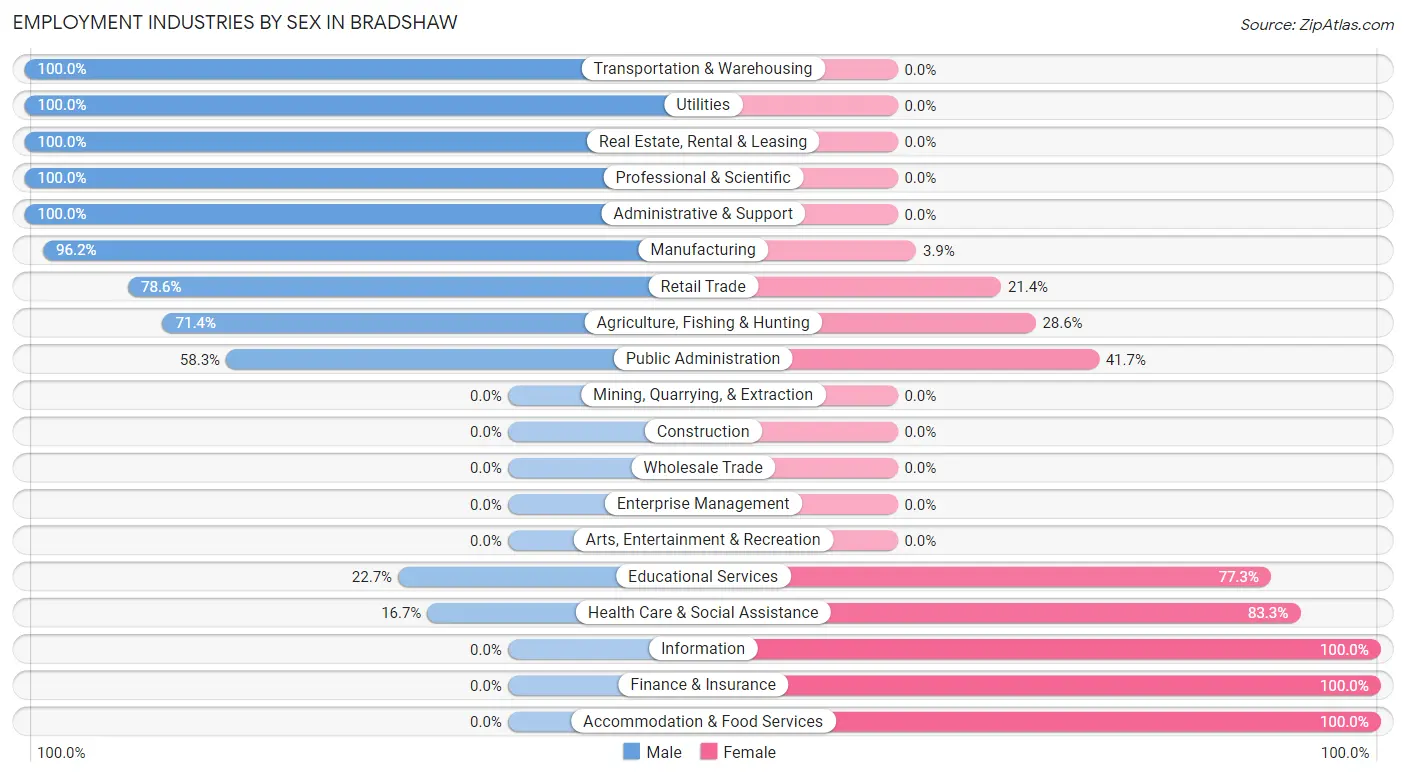
Employment Industries by Sex in Bradshaw
The Bradshaw industries that see more men than women are Transportation & Warehousing (100.0%), Utilities (100.0%), and Real Estate, Rental & Leasing (100.0%), whereas the industries that tend to have a higher number of women are Information (100.0%), Finance & Insurance (100.0%), and Accommodation & Food Services (100.0%).
| Industry | Male | Female |
| Agriculture, Fishing & Hunting | 5 (71.4%) | 2 (28.6%) |
| Mining, Quarrying, & Extraction | 0 (0.0%) | 0 (0.0%) |
| Construction | 0 (0.0%) | 0 (0.0%) |
| Manufacturing | 25 (96.2%) | 1 (3.8%) |
| Wholesale Trade | 0 (0.0%) | 0 (0.0%) |
| Retail Trade | 11 (78.6%) | 3 (21.4%) |
| Transportation & Warehousing | 23 (100.0%) | 0 (0.0%) |
| Utilities | 1 (100.0%) | 0 (0.0%) |
| Information | 0 (0.0%) | 5 (100.0%) |
| Finance & Insurance | 0 (0.0%) | 3 (100.0%) |
| Real Estate, Rental & Leasing | 2 (100.0%) | 0 (0.0%) |
| Professional & Scientific | 1 (100.0%) | 0 (0.0%) |
| Enterprise Management | 0 (0.0%) | 0 (0.0%) |
| Administrative & Support | 5 (100.0%) | 0 (0.0%) |
| Educational Services | 5 (22.7%) | 17 (77.3%) |
| Health Care & Social Assistance | 1 (16.7%) | 5 (83.3%) |
| Arts, Entertainment & Recreation | 0 (0.0%) | 0 (0.0%) |
| Accommodation & Food Services | 0 (0.0%) | 4 (100.0%) |
| Public Administration | 7 (58.3%) | 5 (41.7%) |
| Total | 92 (66.2%) | 47 (33.8%) |
Education in Bradshaw
School Enrollment in Bradshaw
The most common levels of schooling among the 101 students in Bradshaw are middle school (40 | 39.6%), nursery / preschool (24 | 23.8%), and elementary school (20 | 19.8%).
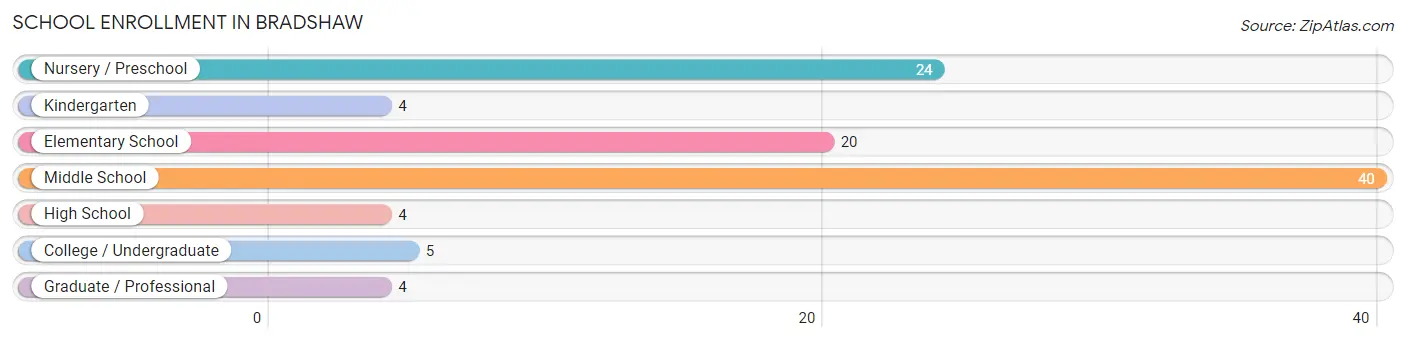
| School Level | # Students | % Students |
| Nursery / Preschool | 24 | 23.8% |
| Kindergarten | 4 | 4.0% |
| Elementary School | 20 | 19.8% |
| Middle School | 40 | 39.6% |
| High School | 4 | 4.0% |
| College / Undergraduate | 5 | 5.0% |
| Graduate / Professional | 4 | 4.0% |
| Total | 101 | 100.0% |
School Enrollment by Age by Funding Source in Bradshaw
Out of a total of 101 students who are enrolled in schools in Bradshaw, 11 (10.9%) attend a private institution, while the remaining 90 (89.1%) are enrolled in public schools. The age group of 25 to 34 year olds has the highest likelihood of being enrolled in private schools, with 2 (28.6% in the age bracket) enrolled. Conversely, the age group of 3 to 4 year olds has the lowest likelihood of being enrolled in a private school, with 24 (100.0% in the age bracket) attending a public institution.
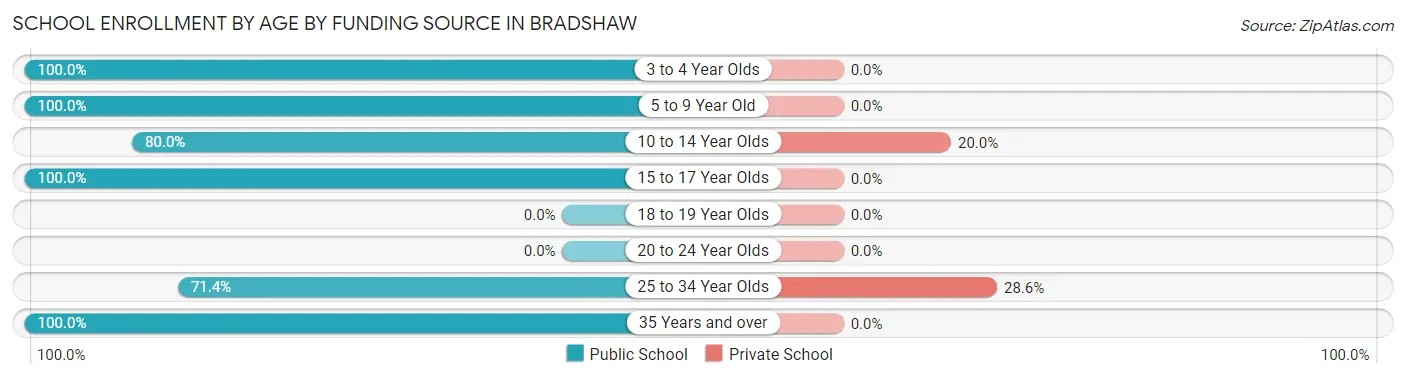
| Age Bracket | Public School | Private School |
| 3 to 4 Year Olds | 24 (100.0%) | 0 (0.0%) |
| 5 to 9 Year Old | 19 (100.0%) | 0 (0.0%) |
| 10 to 14 Year Olds | 36 (80.0%) | 9 (20.0%) |
| 15 to 17 Year Olds | 4 (100.0%) | 0 (0.0%) |
| 18 to 19 Year Olds | 0 (0.0%) | 0 (0.0%) |
| 20 to 24 Year Olds | 0 (0.0%) | 0 (0.0%) |
| 25 to 34 Year Olds | 5 (71.4%) | 2 (28.6%) |
| 35 Years and over | 2 (100.0%) | 0 (0.0%) |
| Total | 90 (89.1%) | 11 (10.9%) |
Educational Attainment by Field of Study in Bradshaw
Business (50 | 60.2%), psychology (8 | 9.6%), education (6 | 7.2%), visual & performing arts (5 | 6.0%), and physical & health sciences (3 | 3.6%) are the most common fields of study among 83 individuals in Bradshaw who have obtained a bachelor's degree or higher.
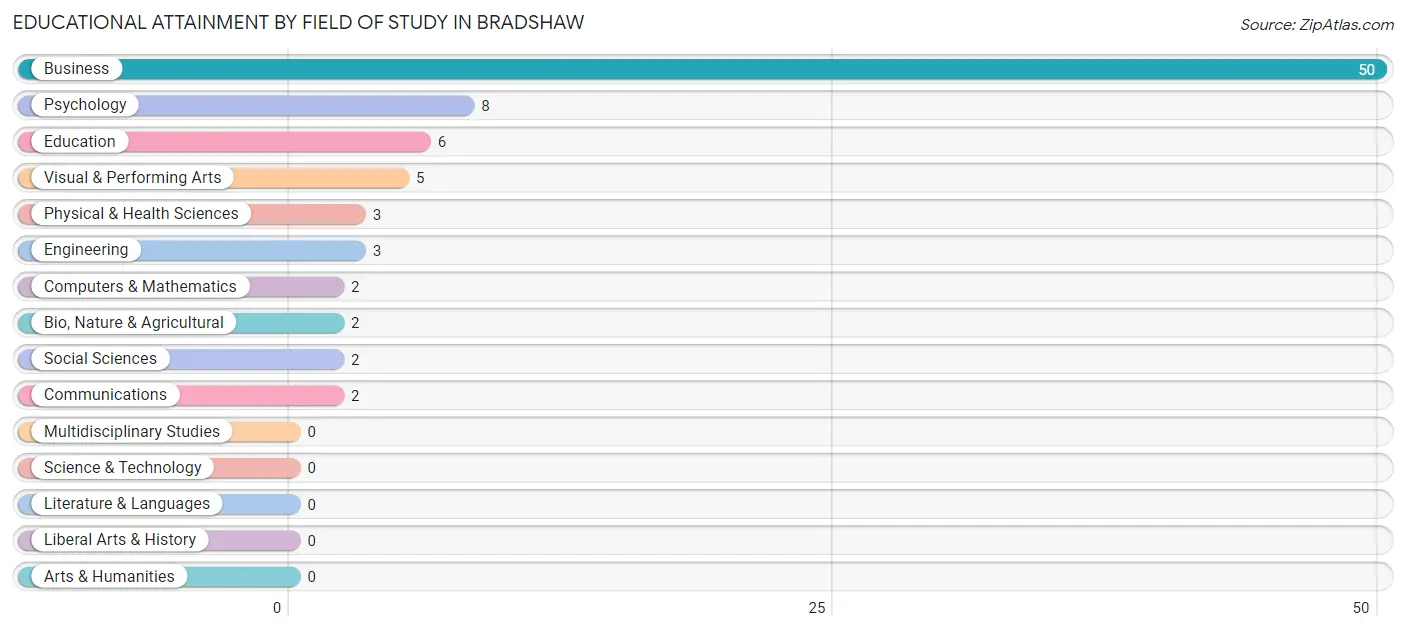
| Field of Study | # Graduates | % Graduates |
| Computers & Mathematics | 2 | 2.4% |
| Bio, Nature & Agricultural | 2 | 2.4% |
| Physical & Health Sciences | 3 | 3.6% |
| Psychology | 8 | 9.6% |
| Social Sciences | 2 | 2.4% |
| Engineering | 3 | 3.6% |
| Multidisciplinary Studies | 0 | 0.0% |
| Science & Technology | 0 | 0.0% |
| Business | 50 | 60.2% |
| Education | 6 | 7.2% |
| Literature & Languages | 0 | 0.0% |
| Liberal Arts & History | 0 | 0.0% |
| Visual & Performing Arts | 5 | 6.0% |
| Communications | 2 | 2.4% |
| Arts & Humanities | 0 | 0.0% |
| Total | 83 | 100.0% |
Transportation & Commute in Bradshaw
Vehicle Availability by Sex in Bradshaw
The most prevalent vehicle ownership categories in Bradshaw are males with 2 vehicles (56, accounting for 60.9%) and females with 2 vehicles (16, making up 130.2%).
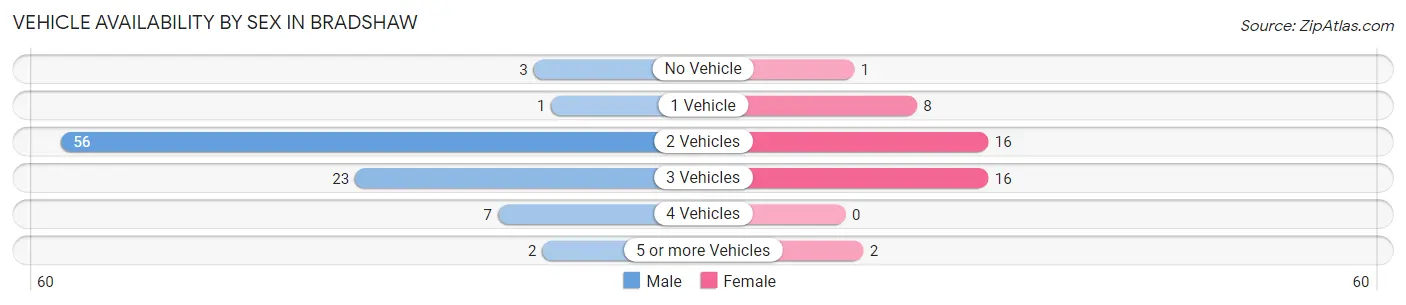
| Vehicles Available | Male | Female |
| No Vehicle | 3 (3.3%) | 1 (2.3%) |
| 1 Vehicle | 1 (1.1%) | 8 (18.6%) |
| 2 Vehicles | 56 (60.9%) | 16 (37.2%) |
| 3 Vehicles | 23 (25.0%) | 16 (37.2%) |
| 4 Vehicles | 7 (7.6%) | 0 (0.0%) |
| 5 or more Vehicles | 2 (2.2%) | 2 (4.6%) |
| Total | 92 (100.0%) | 43 (100.0%) |
Commute Time in Bradshaw
The most frequently occuring commute durations in Bradshaw are 15 to 19 minutes (49 commuters, 37.1%), 20 to 24 minutes (24 commuters, 18.2%), and less than 5 minutes (13 commuters, 9.9%).
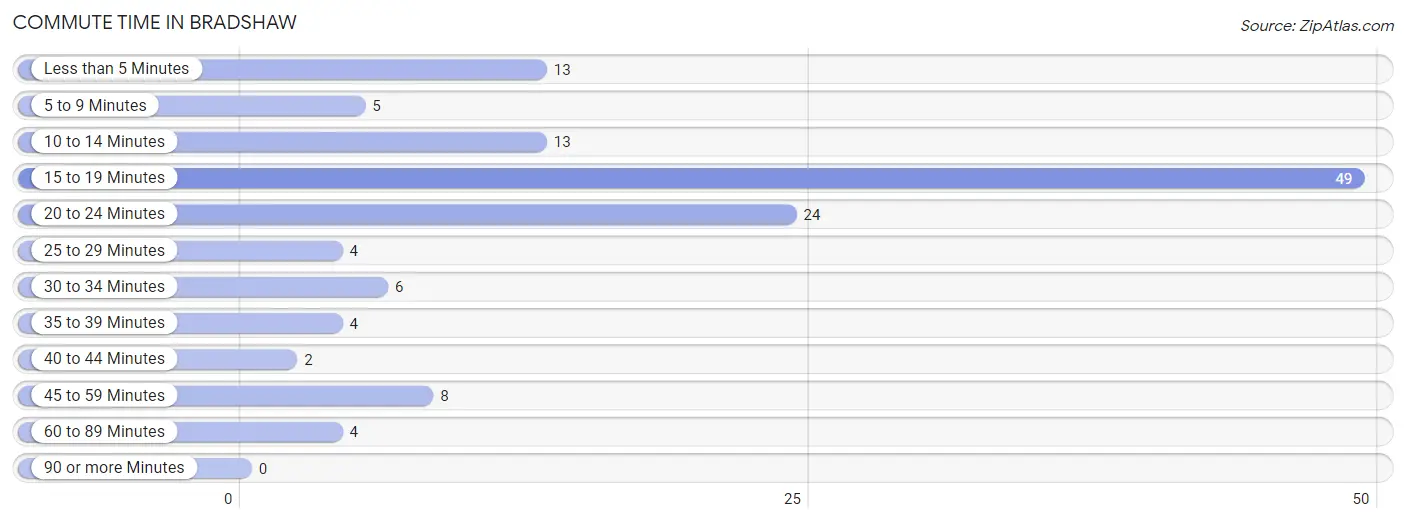
| Commute Time | # Commuters | % Commuters |
| Less than 5 Minutes | 13 | 9.9% |
| 5 to 9 Minutes | 5 | 3.8% |
| 10 to 14 Minutes | 13 | 9.9% |
| 15 to 19 Minutes | 49 | 37.1% |
| 20 to 24 Minutes | 24 | 18.2% |
| 25 to 29 Minutes | 4 | 3.0% |
| 30 to 34 Minutes | 6 | 4.5% |
| 35 to 39 Minutes | 4 | 3.0% |
| 40 to 44 Minutes | 2 | 1.5% |
| 45 to 59 Minutes | 8 | 6.1% |
| 60 to 89 Minutes | 4 | 3.0% |
| 90 or more Minutes | 0 | 0.0% |
Commute Time by Sex in Bradshaw
The most common commute times in Bradshaw are 15 to 19 minutes (31 commuters, 34.8%) for males and 15 to 19 minutes (18 commuters, 41.9%) for females.
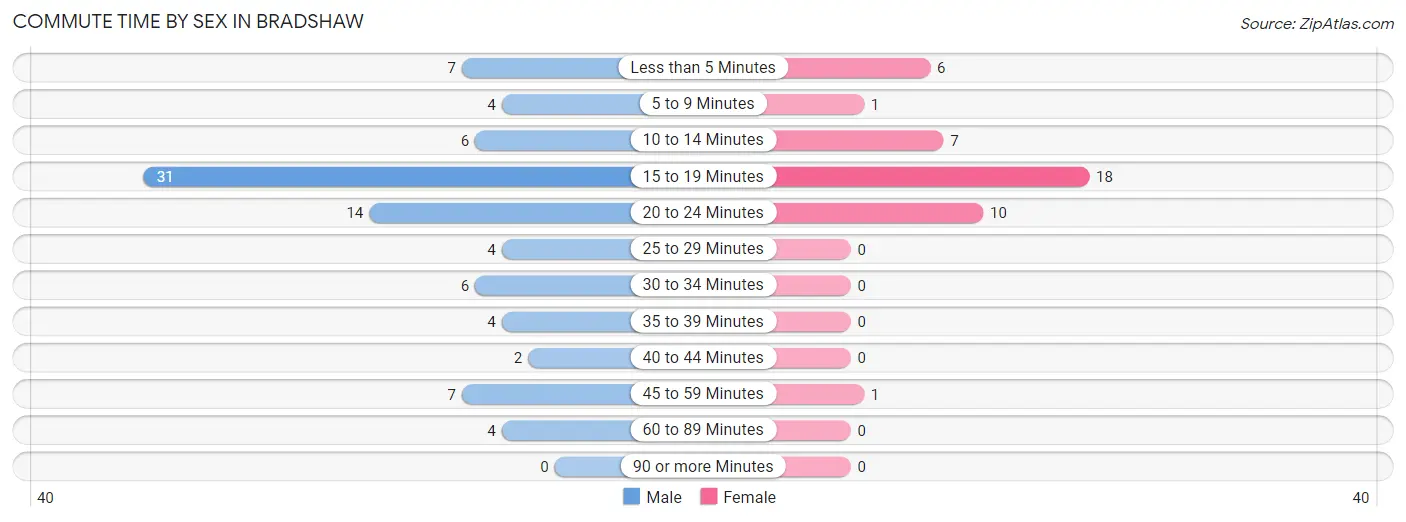
| Commute Time | Male | Female |
| Less than 5 Minutes | 7 (7.9%) | 6 (14.0%) |
| 5 to 9 Minutes | 4 (4.5%) | 1 (2.3%) |
| 10 to 14 Minutes | 6 (6.7%) | 7 (16.3%) |
| 15 to 19 Minutes | 31 (34.8%) | 18 (41.9%) |
| 20 to 24 Minutes | 14 (15.7%) | 10 (23.3%) |
| 25 to 29 Minutes | 4 (4.5%) | 0 (0.0%) |
| 30 to 34 Minutes | 6 (6.7%) | 0 (0.0%) |
| 35 to 39 Minutes | 4 (4.5%) | 0 (0.0%) |
| 40 to 44 Minutes | 2 (2.2%) | 0 (0.0%) |
| 45 to 59 Minutes | 7 (7.9%) | 1 (2.3%) |
| 60 to 89 Minutes | 4 (4.5%) | 0 (0.0%) |
| 90 or more Minutes | 0 (0.0%) | 0 (0.0%) |
Time of Departure to Work by Sex in Bradshaw
The most frequent times of departure to work in Bradshaw are 7:00 AM to 7:29 AM (29, 32.6%) for males and 7:00 AM to 7:29 AM (20, 46.5%) for females.
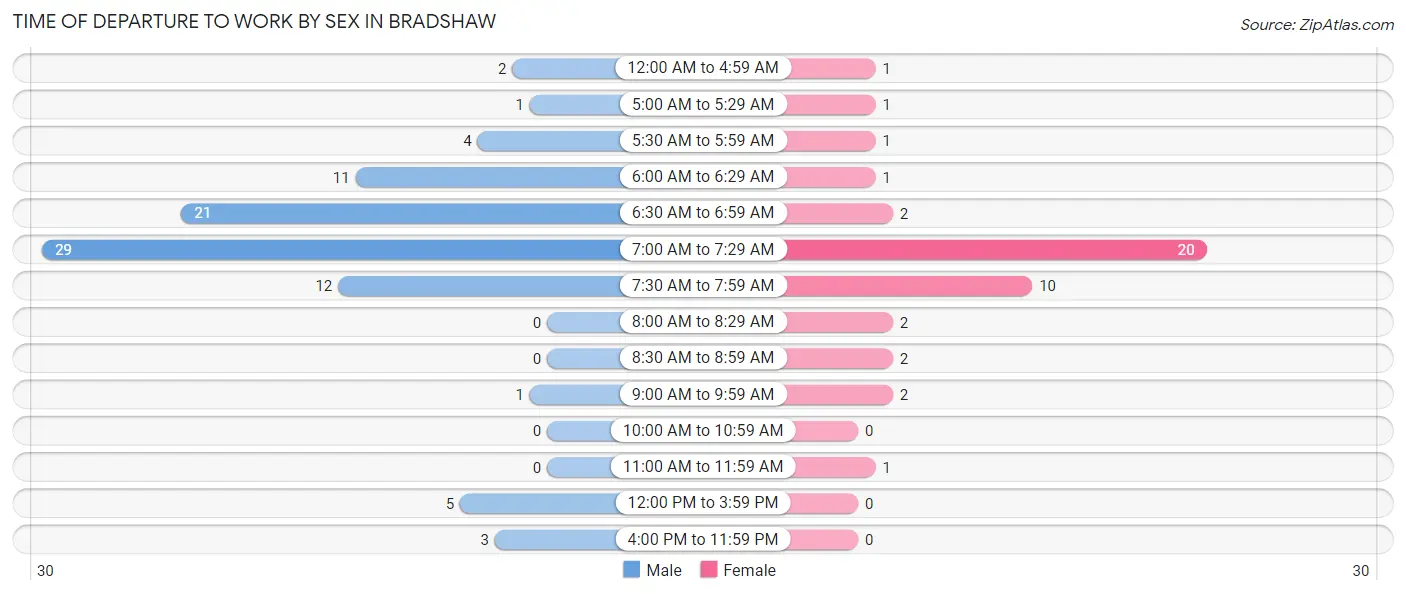
| Time of Departure | Male | Female |
| 12:00 AM to 4:59 AM | 2 (2.2%) | 1 (2.3%) |
| 5:00 AM to 5:29 AM | 1 (1.1%) | 1 (2.3%) |
| 5:30 AM to 5:59 AM | 4 (4.5%) | 1 (2.3%) |
| 6:00 AM to 6:29 AM | 11 (12.4%) | 1 (2.3%) |
| 6:30 AM to 6:59 AM | 21 (23.6%) | 2 (4.6%) |
| 7:00 AM to 7:29 AM | 29 (32.6%) | 20 (46.5%) |
| 7:30 AM to 7:59 AM | 12 (13.5%) | 10 (23.3%) |
| 8:00 AM to 8:29 AM | 0 (0.0%) | 2 (4.6%) |
| 8:30 AM to 8:59 AM | 0 (0.0%) | 2 (4.6%) |
| 9:00 AM to 9:59 AM | 1 (1.1%) | 2 (4.6%) |
| 10:00 AM to 10:59 AM | 0 (0.0%) | 0 (0.0%) |
| 11:00 AM to 11:59 AM | 0 (0.0%) | 1 (2.3%) |
| 12:00 PM to 3:59 PM | 5 (5.6%) | 0 (0.0%) |
| 4:00 PM to 11:59 PM | 3 (3.4%) | 0 (0.0%) |
| Total | 89 (100.0%) | 43 (100.0%) |
Housing Occupancy in Bradshaw
Occupancy by Ownership in Bradshaw
Of the total 144 dwellings in Bradshaw, owner-occupied units account for 100 (69.4%), while renter-occupied units make up 44 (30.6%).
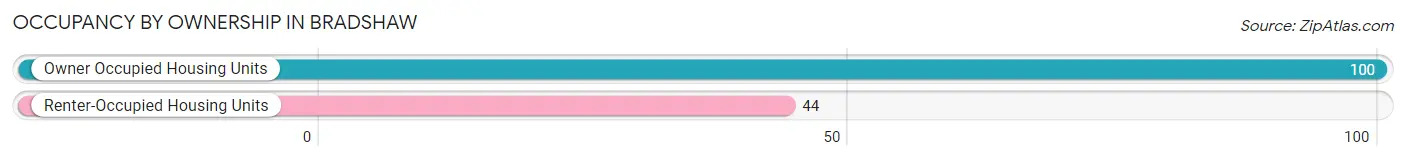
| Occupancy | # Housing Units | % Housing Units |
| Owner Occupied Housing Units | 100 | 69.4% |
| Renter-Occupied Housing Units | 44 | 30.6% |
| Total Occupied Housing Units | 144 | 100.0% |
Occupancy by Household Size in Bradshaw
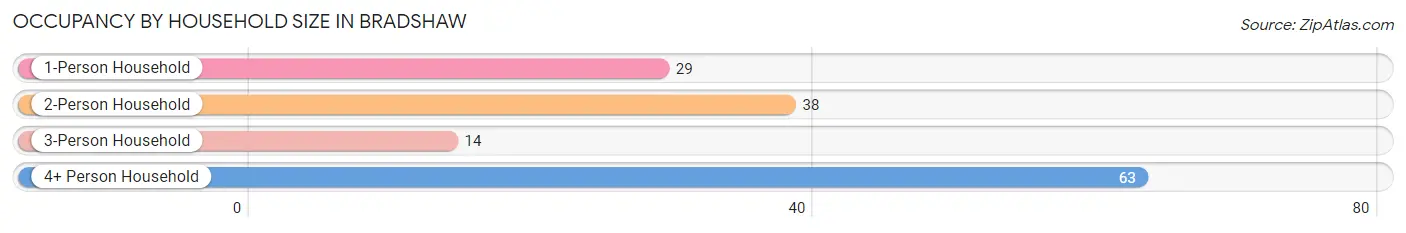
| Household Size | # Housing Units | % Housing Units |
| 1-Person Household | 29 | 20.1% |
| 2-Person Household | 38 | 26.4% |
| 3-Person Household | 14 | 9.7% |
| 4+ Person Household | 63 | 43.8% |
| Total Housing Units | 144 | 100.0% |
Occupancy by Ownership by Household Size in Bradshaw
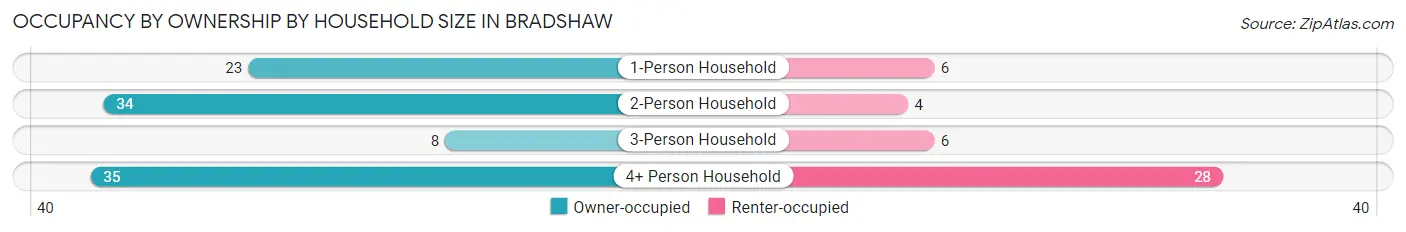
| Household Size | Owner-occupied | Renter-occupied |
| 1-Person Household | 23 (79.3%) | 6 (20.7%) |
| 2-Person Household | 34 (89.5%) | 4 (10.5%) |
| 3-Person Household | 8 (57.1%) | 6 (42.9%) |
| 4+ Person Household | 35 (55.6%) | 28 (44.4%) |
| Total Housing Units | 100 (69.4%) | 44 (30.6%) |
Occupancy by Educational Attainment in Bradshaw
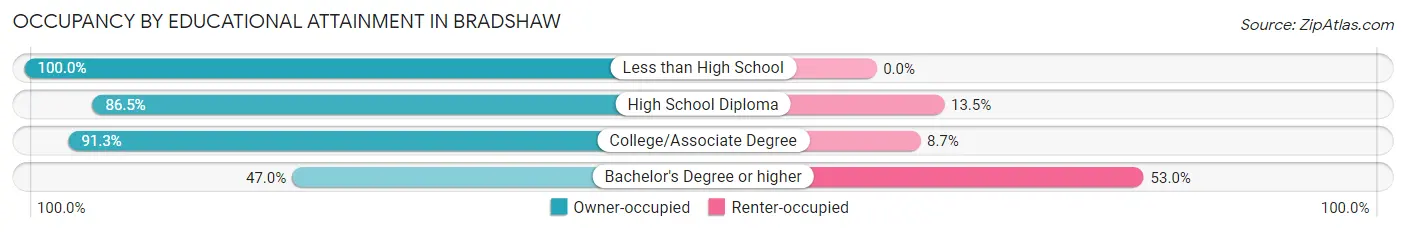
| Household Size | Owner-occupied | Renter-occupied |
| Less than High School | 3 (100.0%) | 0 (0.0%) |
| High School Diploma | 45 (86.5%) | 7 (13.5%) |
| College/Associate Degree | 21 (91.3%) | 2 (8.7%) |
| Bachelor's Degree or higher | 31 (47.0%) | 35 (53.0%) |
Occupancy by Age of Householder in Bradshaw
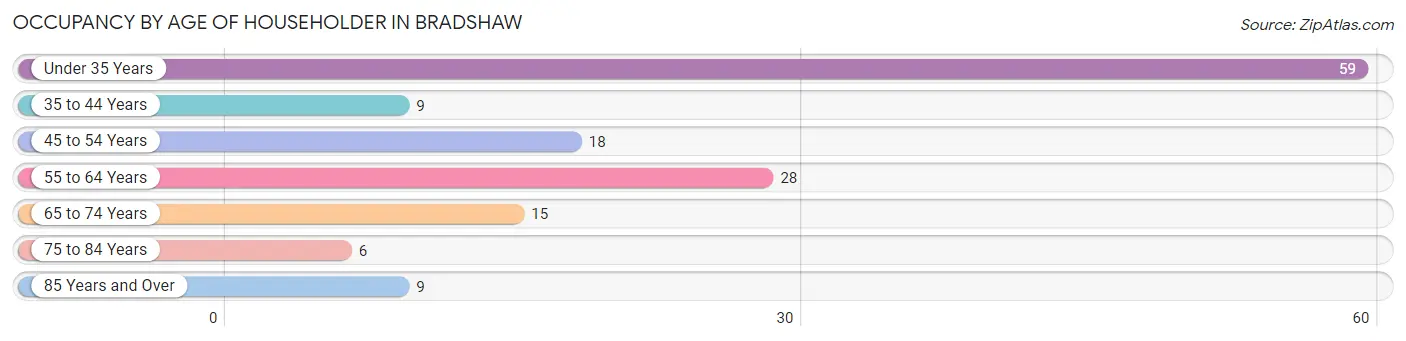
| Age Bracket | # Households | % Households |
| Under 35 Years | 59 | 41.0% |
| 35 to 44 Years | 9 | 6.2% |
| 45 to 54 Years | 18 | 12.5% |
| 55 to 64 Years | 28 | 19.4% |
| 65 to 74 Years | 15 | 10.4% |
| 75 to 84 Years | 6 | 4.2% |
| 85 Years and Over | 9 | 6.2% |
| Total | 144 | 100.0% |
Housing Finances in Bradshaw
Median Income by Occupancy in Bradshaw
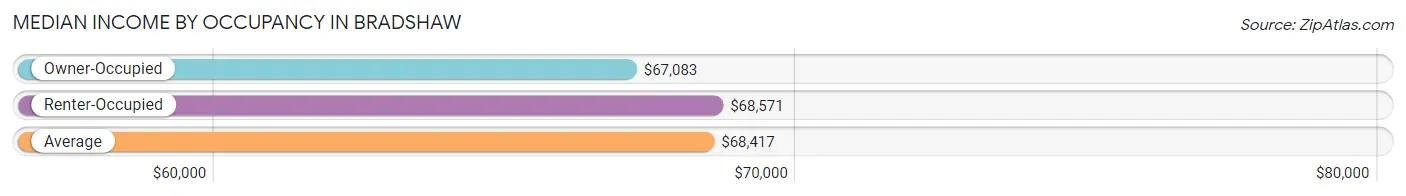
| Occupancy Type | # Households | Median Income |
| Owner-Occupied | 100 (69.4%) | $67,083 |
| Renter-Occupied | 44 (30.6%) | $68,571 |
| Average | 144 (100.0%) | $68,417 |
Occupancy by Householder Income Bracket in Bradshaw
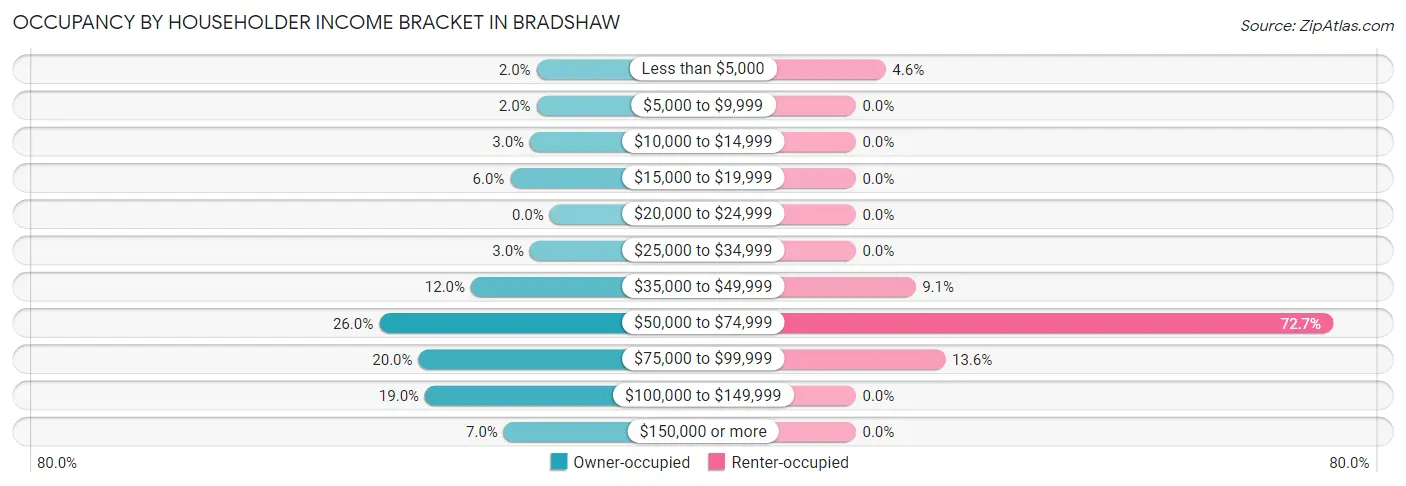
| Income Bracket | Owner-occupied | Renter-occupied |
| Less than $5,000 | 2 (2.0%) | 2 (4.5%) |
| $5,000 to $9,999 | 2 (2.0%) | 0 (0.0%) |
| $10,000 to $14,999 | 3 (3.0%) | 0 (0.0%) |
| $15,000 to $19,999 | 6 (6.0%) | 0 (0.0%) |
| $20,000 to $24,999 | 0 (0.0%) | 0 (0.0%) |
| $25,000 to $34,999 | 3 (3.0%) | 0 (0.0%) |
| $35,000 to $49,999 | 12 (12.0%) | 4 (9.1%) |
| $50,000 to $74,999 | 26 (26.0%) | 32 (72.7%) |
| $75,000 to $99,999 | 20 (20.0%) | 6 (13.6%) |
| $100,000 to $149,999 | 19 (19.0%) | 0 (0.0%) |
| $150,000 or more | 7 (7.0%) | 0 (0.0%) |
| Total | 100 (100.0%) | 44 (100.0%) |
Monthly Housing Cost Tiers in Bradshaw
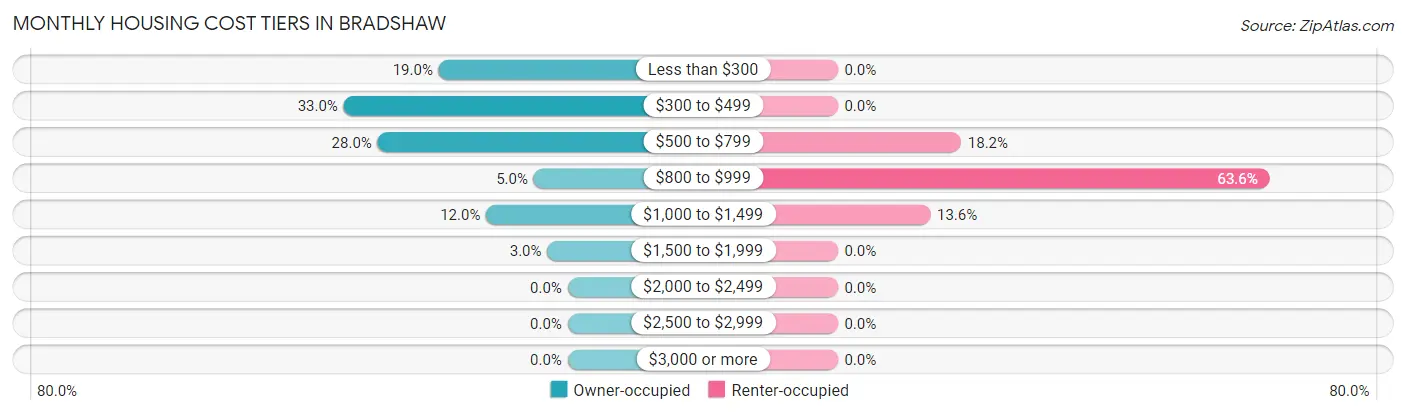
| Monthly Cost | Owner-occupied | Renter-occupied |
| Less than $300 | 19 (19.0%) | 0 (0.0%) |
| $300 to $499 | 33 (33.0%) | 0 (0.0%) |
| $500 to $799 | 28 (28.0%) | 8 (18.2%) |
| $800 to $999 | 5 (5.0%) | 28 (63.6%) |
| $1,000 to $1,499 | 12 (12.0%) | 6 (13.6%) |
| $1,500 to $1,999 | 3 (3.0%) | 0 (0.0%) |
| $2,000 to $2,499 | 0 (0.0%) | 0 (0.0%) |
| $2,500 to $2,999 | 0 (0.0%) | 0 (0.0%) |
| $3,000 or more | 0 (0.0%) | 0 (0.0%) |
| Total | 100 (100.0%) | 44 (100.0%) |
Physical Housing Characteristics in Bradshaw
Housing Structures in Bradshaw
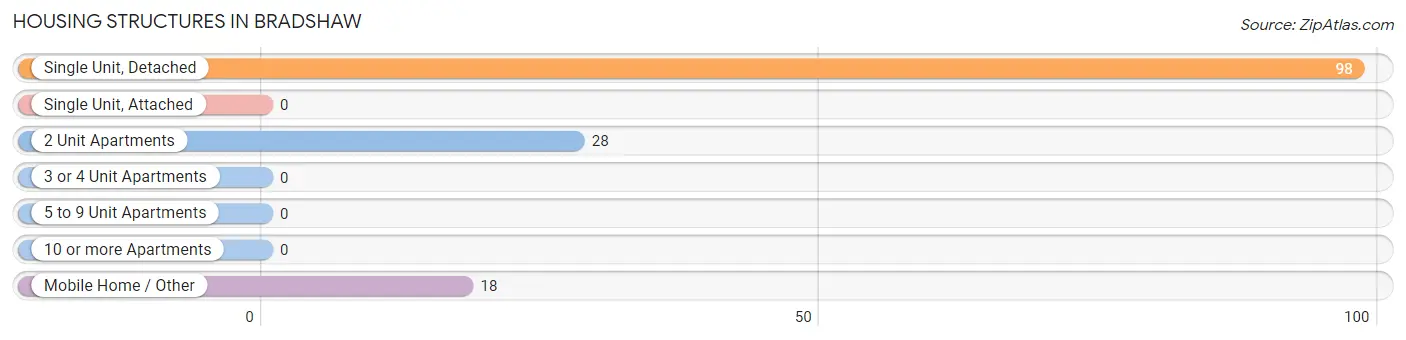
| Structure Type | # Housing Units | % Housing Units |
| Single Unit, Detached | 98 | 68.1% |
| Single Unit, Attached | 0 | 0.0% |
| 2 Unit Apartments | 28 | 19.4% |
| 3 or 4 Unit Apartments | 0 | 0.0% |
| 5 to 9 Unit Apartments | 0 | 0.0% |
| 10 or more Apartments | 0 | 0.0% |
| Mobile Home / Other | 18 | 12.5% |
| Total | 144 | 100.0% |
Housing Structures by Occupancy in Bradshaw
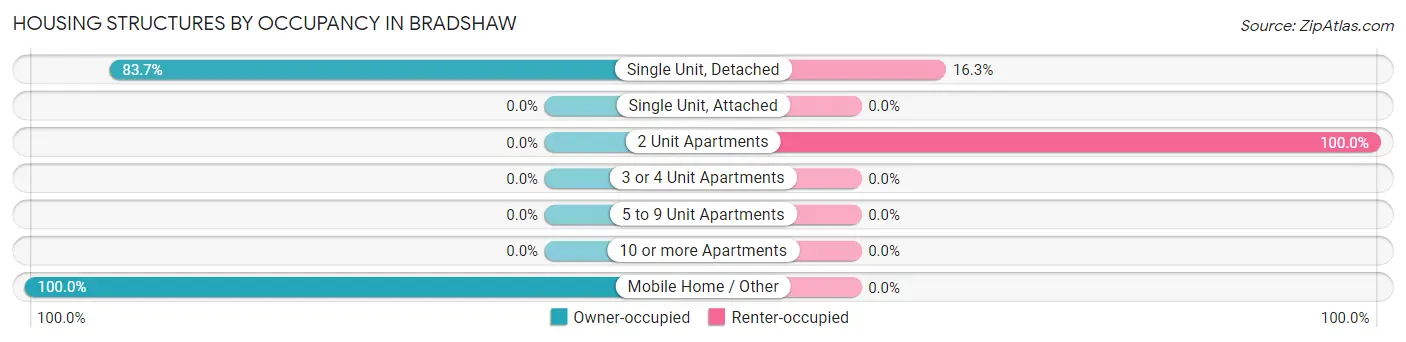
| Structure Type | Owner-occupied | Renter-occupied |
| Single Unit, Detached | 82 (83.7%) | 16 (16.3%) |
| Single Unit, Attached | 0 (0.0%) | 0 (0.0%) |
| 2 Unit Apartments | 0 (0.0%) | 28 (100.0%) |
| 3 or 4 Unit Apartments | 0 (0.0%) | 0 (0.0%) |
| 5 to 9 Unit Apartments | 0 (0.0%) | 0 (0.0%) |
| 10 or more Apartments | 0 (0.0%) | 0 (0.0%) |
| Mobile Home / Other | 18 (100.0%) | 0 (0.0%) |
| Total | 100 (69.4%) | 44 (30.6%) |
Housing Structures by Number of Rooms in Bradshaw
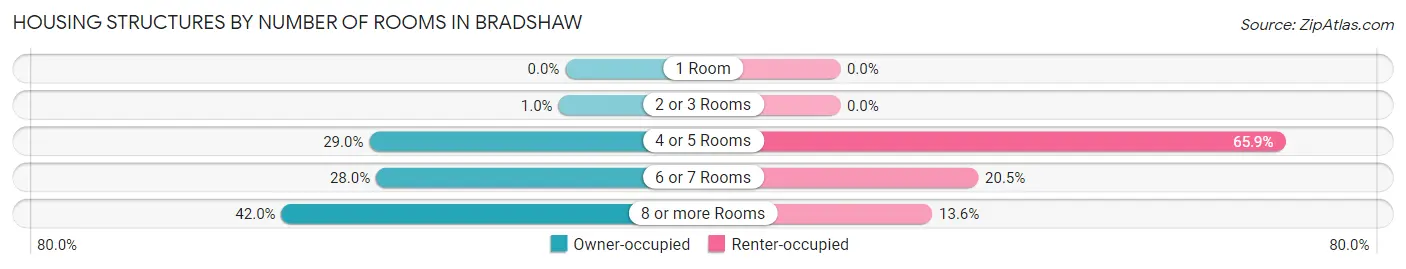
| Number of Rooms | Owner-occupied | Renter-occupied |
| 1 Room | 0 (0.0%) | 0 (0.0%) |
| 2 or 3 Rooms | 1 (1.0%) | 0 (0.0%) |
| 4 or 5 Rooms | 29 (29.0%) | 29 (65.9%) |
| 6 or 7 Rooms | 28 (28.0%) | 9 (20.4%) |
| 8 or more Rooms | 42 (42.0%) | 6 (13.6%) |
| Total | 100 (100.0%) | 44 (100.0%) |
Housing Structure by Heating Type in Bradshaw
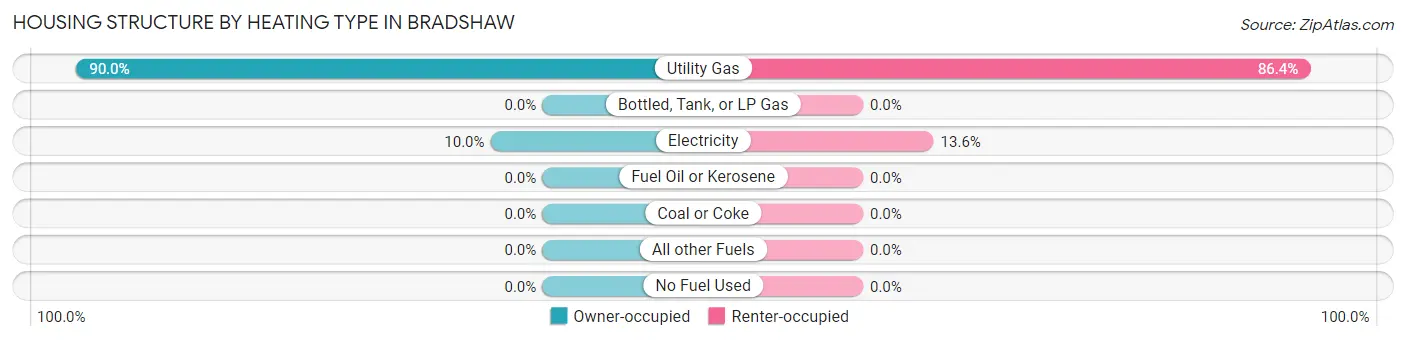
| Heating Type | Owner-occupied | Renter-occupied |
| Utility Gas | 90 (90.0%) | 38 (86.4%) |
| Bottled, Tank, or LP Gas | 0 (0.0%) | 0 (0.0%) |
| Electricity | 10 (10.0%) | 6 (13.6%) |
| Fuel Oil or Kerosene | 0 (0.0%) | 0 (0.0%) |
| Coal or Coke | 0 (0.0%) | 0 (0.0%) |
| All other Fuels | 0 (0.0%) | 0 (0.0%) |
| No Fuel Used | 0 (0.0%) | 0 (0.0%) |
| Total | 100 (100.0%) | 44 (100.0%) |
Household Vehicle Usage in Bradshaw
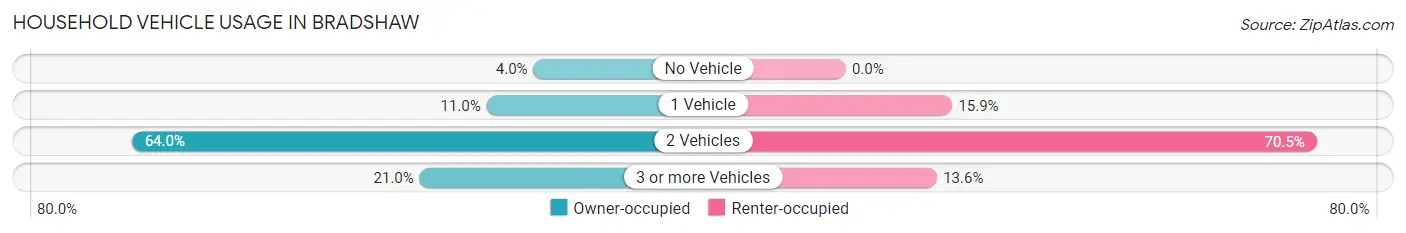
| Vehicles per Household | Owner-occupied | Renter-occupied |
| No Vehicle | 4 (4.0%) | 0 (0.0%) |
| 1 Vehicle | 11 (11.0%) | 7 (15.9%) |
| 2 Vehicles | 64 (64.0%) | 31 (70.5%) |
| 3 or more Vehicles | 21 (21.0%) | 6 (13.6%) |
| Total | 100 (100.0%) | 44 (100.0%) |
Real Estate & Mortgages in Bradshaw
Real Estate and Mortgage Overview in Bradshaw
| Characteristic | Without Mortgage | With Mortgage |
| Housing Units | 75 | 25 |
| Median Property Value | $93,800 | $147,900 |
| Median Household Income | $56,406 | $5 |
| Monthly Housing Costs | $389 | $0 |
| Real Estate Taxes | $906 | $0 |
Property Value by Mortgage Status in Bradshaw
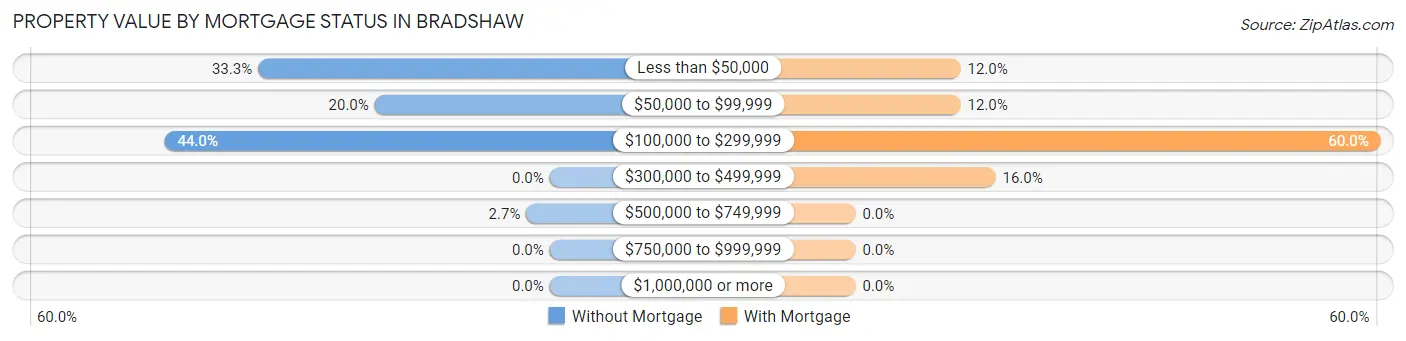
| Property Value | Without Mortgage | With Mortgage |
| Less than $50,000 | 25 (33.3%) | 3 (12.0%) |
| $50,000 to $99,999 | 15 (20.0%) | 3 (12.0%) |
| $100,000 to $299,999 | 33 (44.0%) | 15 (60.0%) |
| $300,000 to $499,999 | 0 (0.0%) | 4 (16.0%) |
| $500,000 to $749,999 | 2 (2.7%) | 0 (0.0%) |
| $750,000 to $999,999 | 0 (0.0%) | 0 (0.0%) |
| $1,000,000 or more | 0 (0.0%) | 0 (0.0%) |
| Total | 75 (100.0%) | 25 (100.0%) |
Household Income by Mortgage Status in Bradshaw
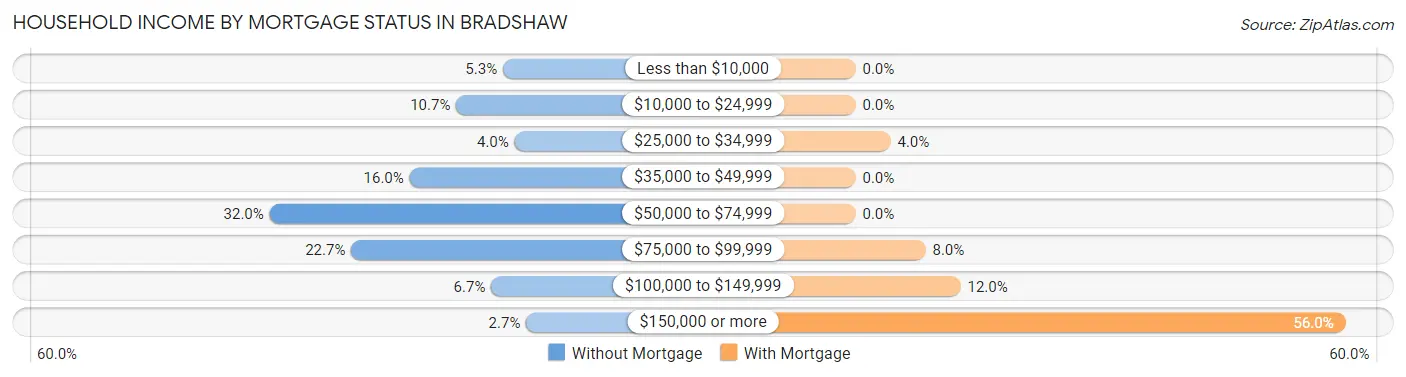
| Household Income | Without Mortgage | With Mortgage |
| Less than $10,000 | 4 (5.3%) | 0 (0.0%) |
| $10,000 to $24,999 | 8 (10.7%) | 0 (0.0%) |
| $25,000 to $34,999 | 3 (4.0%) | 1 (4.0%) |
| $35,000 to $49,999 | 12 (16.0%) | 0 (0.0%) |
| $50,000 to $74,999 | 24 (32.0%) | 0 (0.0%) |
| $75,000 to $99,999 | 17 (22.7%) | 2 (8.0%) |
| $100,000 to $149,999 | 5 (6.7%) | 3 (12.0%) |
| $150,000 or more | 2 (2.7%) | 14 (56.0%) |
| Total | 75 (100.0%) | 25 (100.0%) |
Property Value to Household Income Ratio in Bradshaw
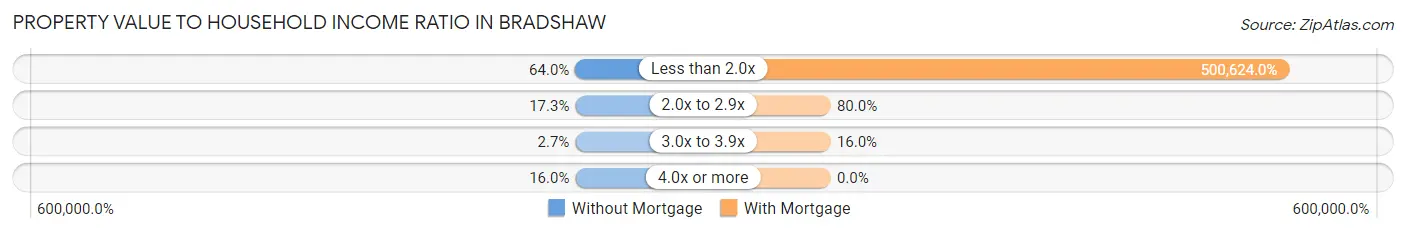
| Value-to-Income Ratio | Without Mortgage | With Mortgage |
| Less than 2.0x | 48 (64.0%) | 125,156 (500,624.0%) |
| 2.0x to 2.9x | 13 (17.3%) | 20 (80.0%) |
| 3.0x to 3.9x | 2 (2.7%) | 4 (16.0%) |
| 4.0x or more | 12 (16.0%) | 0 (0.0%) |
| Total | 75 (100.0%) | 25 (100.0%) |
Real Estate Taxes by Mortgage Status in Bradshaw
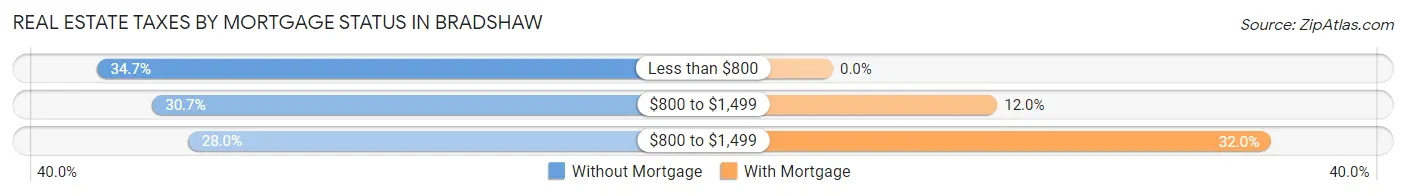
| Property Taxes | Without Mortgage | With Mortgage |
| Less than $800 | 26 (34.7%) | 0 (0.0%) |
| $800 to $1,499 | 23 (30.7%) | 3 (12.0%) |
| $800 to $1,499 | 21 (28.0%) | 8 (32.0%) |
| Total | 75 (100.0%) | 25 (100.0%) |
Health & Disability in Bradshaw
Health Insurance Coverage by Age in Bradshaw
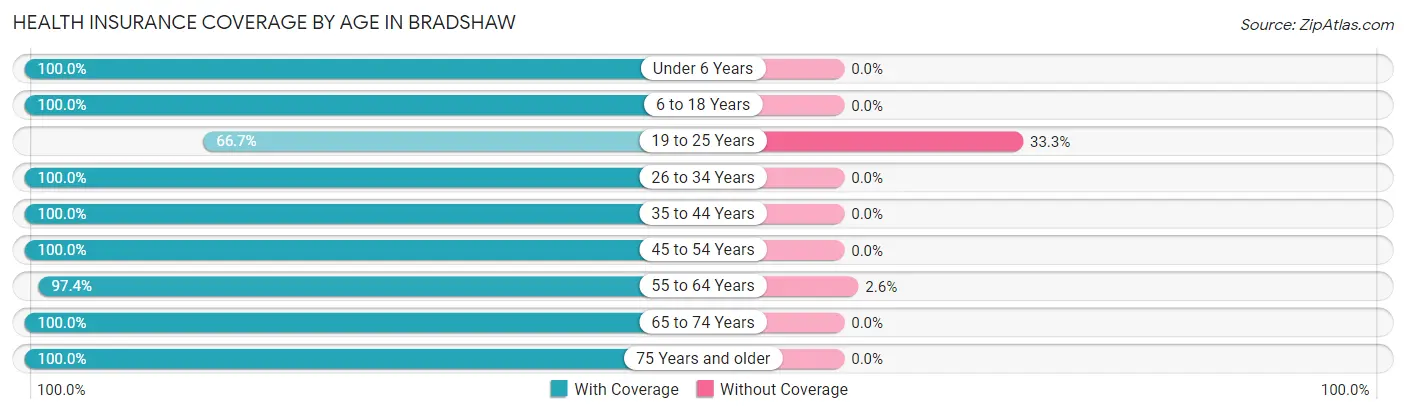
| Age Bracket | With Coverage | Without Coverage |
| Under 6 Years | 94 (100.0%) | 0 (0.0%) |
| 6 to 18 Years | 66 (100.0%) | 0 (0.0%) |
| 19 to 25 Years | 4 (66.7%) | 2 (33.3%) |
| 26 to 34 Years | 87 (100.0%) | 0 (0.0%) |
| 35 to 44 Years | 23 (100.0%) | 0 (0.0%) |
| 45 to 54 Years | 34 (100.0%) | 0 (0.0%) |
| 55 to 64 Years | 37 (97.4%) | 1 (2.6%) |
| 65 to 74 Years | 23 (100.0%) | 0 (0.0%) |
| 75 Years and older | 26 (100.0%) | 0 (0.0%) |
| Total | 394 (99.2%) | 3 (0.8%) |
Health Insurance Coverage by Citizenship Status in Bradshaw
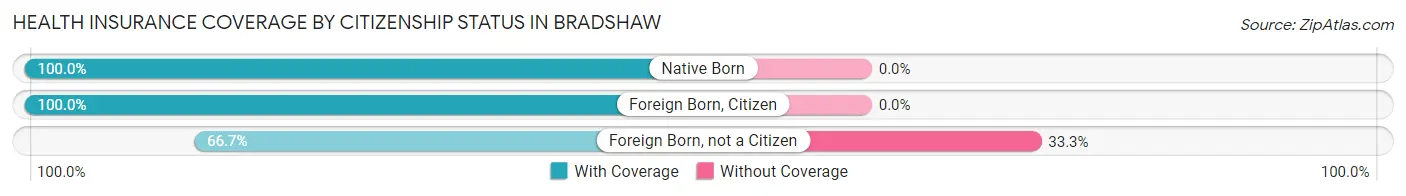
| Citizenship Status | With Coverage | Without Coverage |
| Native Born | 94 (100.0%) | 0 (0.0%) |
| Foreign Born, Citizen | 66 (100.0%) | 0 (0.0%) |
| Foreign Born, not a Citizen | 4 (66.7%) | 2 (33.3%) |
Health Insurance Coverage by Household Income in Bradshaw
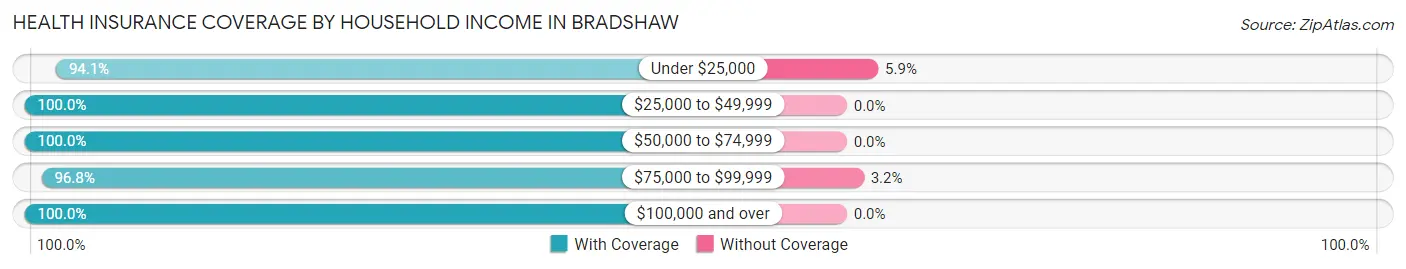
| Household Income | With Coverage | Without Coverage |
| Under $25,000 | 16 (94.1%) | 1 (5.9%) |
| $25,000 to $49,999 | 30 (100.0%) | 0 (0.0%) |
| $50,000 to $74,999 | 175 (100.0%) | 0 (0.0%) |
| $75,000 to $99,999 | 61 (96.8%) | 2 (3.2%) |
| $100,000 and over | 112 (100.0%) | 0 (0.0%) |
Public vs Private Health Insurance Coverage by Age in Bradshaw
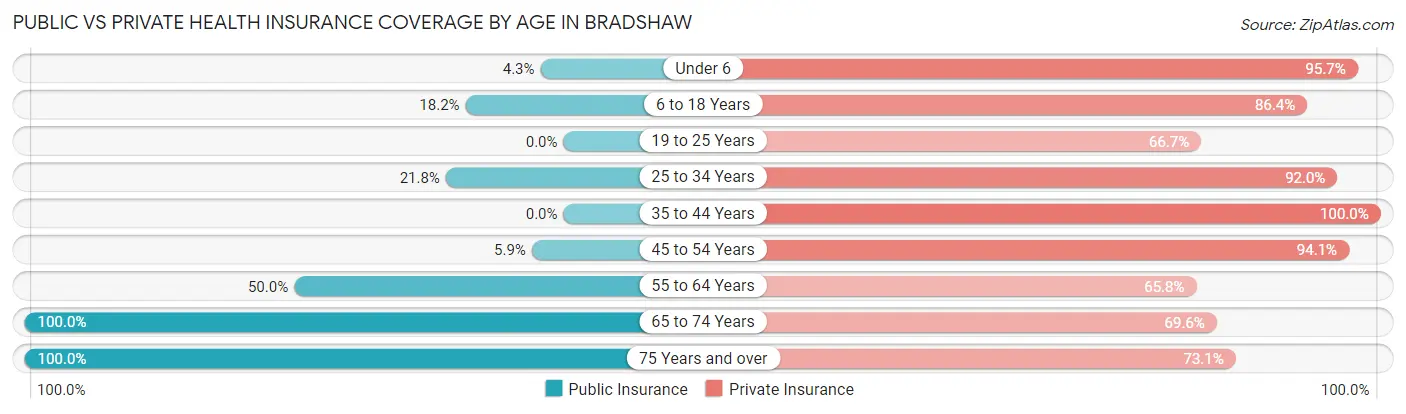
| Age Bracket | Public Insurance | Private Insurance |
| Under 6 | 4 (4.3%) | 90 (95.7%) |
| 6 to 18 Years | 12 (18.2%) | 57 (86.4%) |
| 19 to 25 Years | 0 (0.0%) | 4 (66.7%) |
| 25 to 34 Years | 19 (21.8%) | 80 (91.9%) |
| 35 to 44 Years | 0 (0.0%) | 23 (100.0%) |
| 45 to 54 Years | 2 (5.9%) | 32 (94.1%) |
| 55 to 64 Years | 19 (50.0%) | 25 (65.8%) |
| 65 to 74 Years | 23 (100.0%) | 16 (69.6%) |
| 75 Years and over | 26 (100.0%) | 19 (73.1%) |
| Total | 105 (26.5%) | 346 (87.2%) |
Disability Status by Sex by Age in Bradshaw
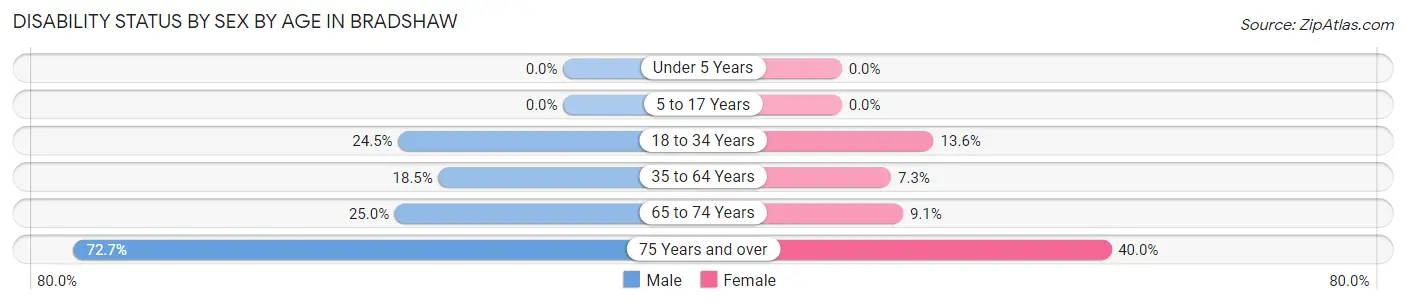
| Age Bracket | Male | Female |
| Under 5 Years | 0 (0.0%) | 0 (0.0%) |
| 5 to 17 Years | 0 (0.0%) | 0 (0.0%) |
| 18 to 34 Years | 12 (24.5%) | 6 (13.6%) |
| 35 to 64 Years | 10 (18.5%) | 3 (7.3%) |
| 65 to 74 Years | 3 (25.0%) | 1 (9.1%) |
| 75 Years and over | 8 (72.7%) | 6 (40.0%) |
Disability Class by Sex by Age in Bradshaw
Disability Class: Hearing Difficulty
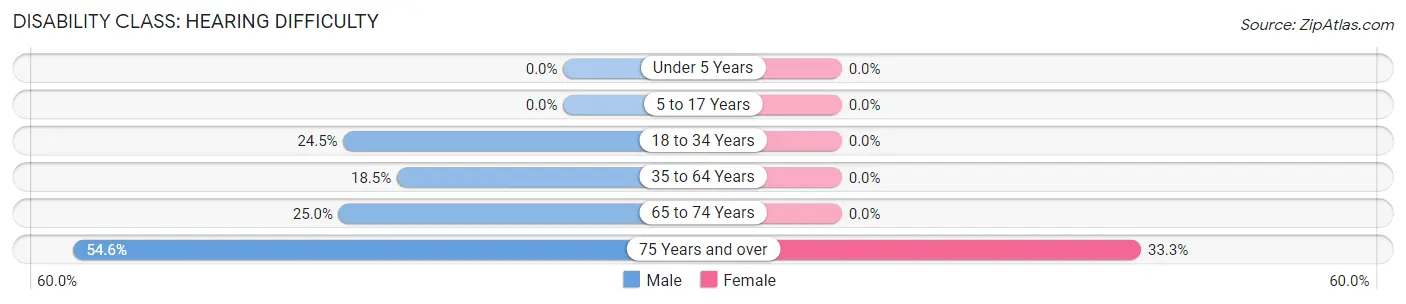
| Age Bracket | Male | Female |
| Under 5 Years | 0 (0.0%) | 0 (0.0%) |
| 5 to 17 Years | 0 (0.0%) | 0 (0.0%) |
| 18 to 34 Years | 12 (24.5%) | 0 (0.0%) |
| 35 to 64 Years | 10 (18.5%) | 0 (0.0%) |
| 65 to 74 Years | 3 (25.0%) | 0 (0.0%) |
| 75 Years and over | 6 (54.5%) | 5 (33.3%) |
Disability Class: Vision Difficulty
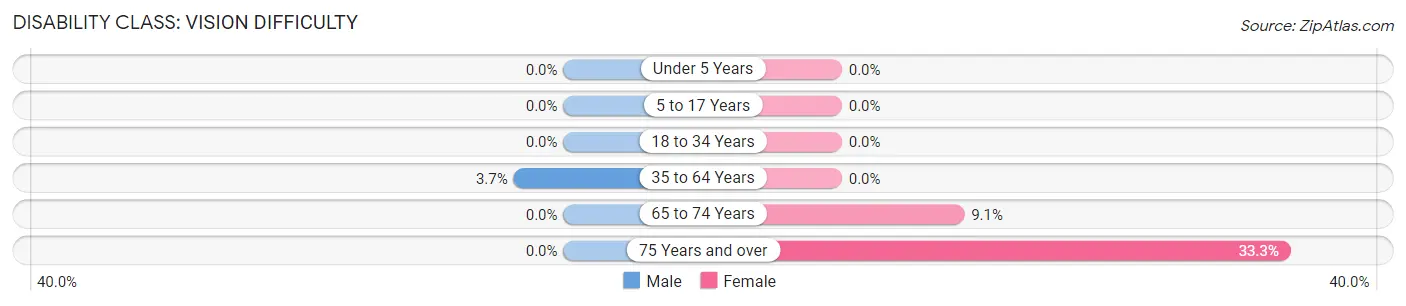
| Age Bracket | Male | Female |
| Under 5 Years | 0 (0.0%) | 0 (0.0%) |
| 5 to 17 Years | 0 (0.0%) | 0 (0.0%) |
| 18 to 34 Years | 0 (0.0%) | 0 (0.0%) |
| 35 to 64 Years | 2 (3.7%) | 0 (0.0%) |
| 65 to 74 Years | 0 (0.0%) | 1 (9.1%) |
| 75 Years and over | 0 (0.0%) | 5 (33.3%) |
Disability Class: Cognitive Difficulty
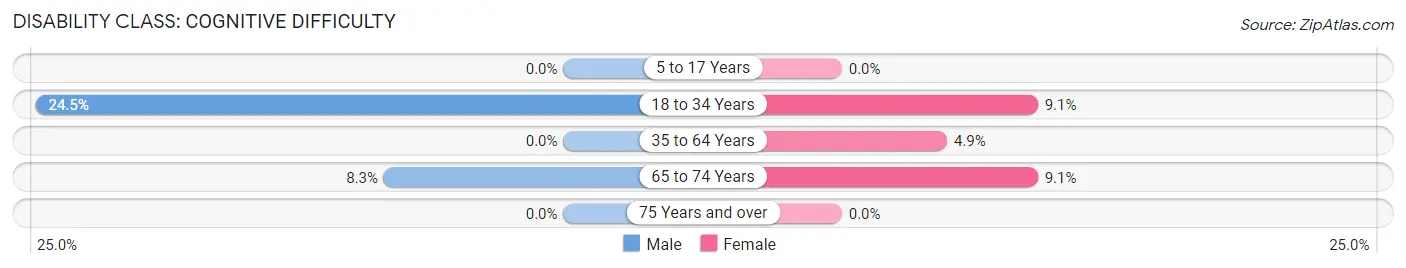
| Age Bracket | Male | Female |
| 5 to 17 Years | 0 (0.0%) | 0 (0.0%) |
| 18 to 34 Years | 12 (24.5%) | 4 (9.1%) |
| 35 to 64 Years | 0 (0.0%) | 2 (4.9%) |
| 65 to 74 Years | 1 (8.3%) | 1 (9.1%) |
| 75 Years and over | 0 (0.0%) | 0 (0.0%) |
Disability Class: Ambulatory Difficulty
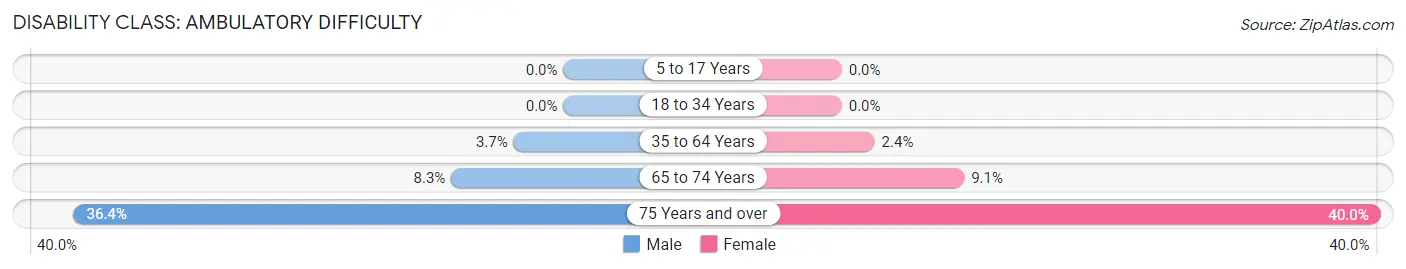
| Age Bracket | Male | Female |
| 5 to 17 Years | 0 (0.0%) | 0 (0.0%) |
| 18 to 34 Years | 0 (0.0%) | 0 (0.0%) |
| 35 to 64 Years | 2 (3.7%) | 1 (2.4%) |
| 65 to 74 Years | 1 (8.3%) | 1 (9.1%) |
| 75 Years and over | 4 (36.4%) | 6 (40.0%) |
Disability Class: Self-Care Difficulty
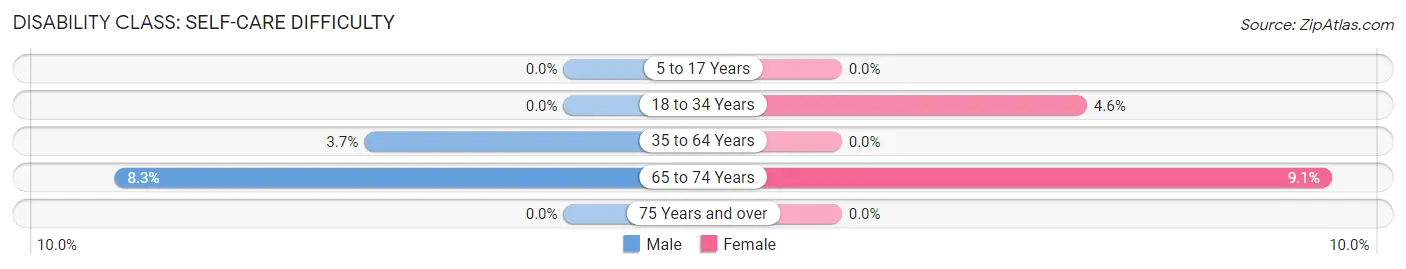
| Age Bracket | Male | Female |
| 5 to 17 Years | 0 (0.0%) | 0 (0.0%) |
| 18 to 34 Years | 0 (0.0%) | 2 (4.5%) |
| 35 to 64 Years | 2 (3.7%) | 0 (0.0%) |
| 65 to 74 Years | 1 (8.3%) | 1 (9.1%) |
| 75 Years and over | 0 (0.0%) | 0 (0.0%) |
Technology Access in Bradshaw
Computing Device Access in Bradshaw
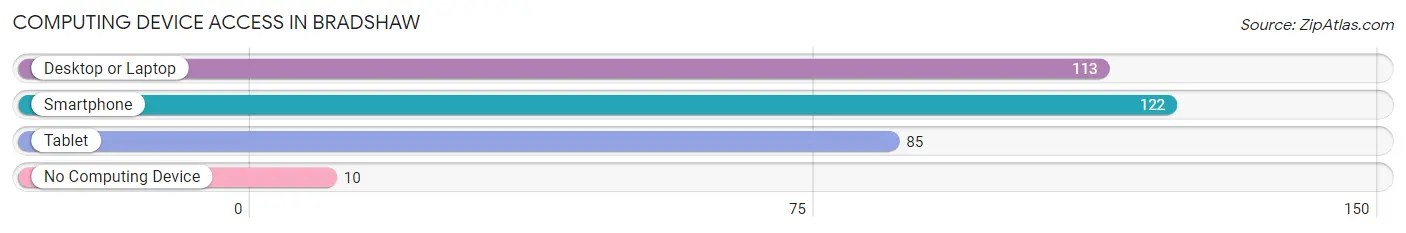
| Device Type | # Households | % Households |
| Desktop or Laptop | 113 | 78.5% |
| Smartphone | 122 | 84.7% |
| Tablet | 85 | 59.0% |
| No Computing Device | 10 | 6.9% |
| Total | 144 | 100.0% |
Internet Access in Bradshaw
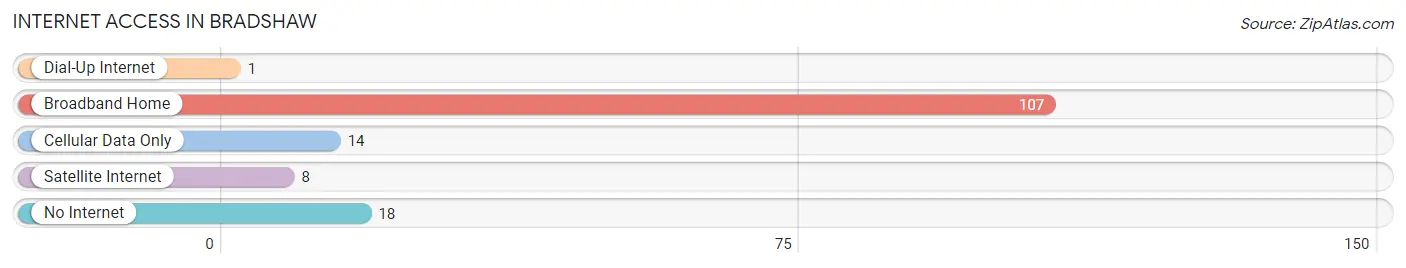
| Internet Type | # Households | % Households |
| Dial-Up Internet | 1 | 0.7% |
| Broadband Home | 107 | 74.3% |
| Cellular Data Only | 14 | 9.7% |
| Satellite Internet | 8 | 5.6% |
| No Internet | 18 | 12.5% |
| Total | 144 | 100.0% |
Bradshaw Summary
Bradshaw is a small village located in the county of Lincolnshire, England. It is situated on the River Witham, approximately 8 miles south of Lincoln. The village has a population of around 500 people and is part of the North Kesteven district.
History
The earliest known reference to Bradshaw dates back to the Domesday Book of 1086, where it is listed as ‘Bradesho’. The name is thought to derive from the Old English words ‘brad’ and ‘sceaga’, meaning ‘broad wood’.
The village was once part of the ancient parish of Branston, which was divided into two parishes in 1866. The village of Bradshaw was then formed from the northern part of the parish.
The village was once home to a number of industries, including a brickworks, a flour mill, a brewery and a tannery. The brickworks closed in the early 20th century, while the flour mill and brewery closed in the late 20th century. The tannery is still in operation today.
Geography
Bradshaw is located in the county of Lincolnshire, England. It is situated on the River Witham, approximately 8 miles south of Lincoln. The village is surrounded by rolling hills and farmland, and is close to the Lincolnshire Wolds, an Area of Outstanding Natural Beauty.
The village is served by the A15 road, which runs through the village and connects it to the nearby towns of Lincoln and Sleaford.
Economy
The economy of Bradshaw is largely based on agriculture and tourism. The village is home to a number of small businesses, including a pub, a post office, a shop and a garage.
The village is also home to a number of small-scale industries, including a tannery, a sawmill and a brickworks.
Demographics
According to the 2011 census, the population of Bradshaw was 498. The majority of the population (90%) is white British, with the remaining 10% being of other ethnic backgrounds.
The median age of the population is 44, with the majority of the population (60%) being aged between 45 and 64. The village has a higher than average proportion of retired people (25%), compared to the national average (17%).
The village has a higher than average proportion of people with no qualifications (25%), compared to the national average (17%). The majority of the population (90%) is Christian, with the remaining 10% being of other religions or having no religion.
Conclusion
Bradshaw is a small village located in the county of Lincolnshire, England. It has a population of around 500 people and is part of the North Kesteven district. The village has a long history, dating back to the Domesday Book of 1086. The economy of the village is largely based on agriculture and tourism, and it is home to a number of small businesses and industries. The population of Bradshaw is predominantly white British, with the majority of the population being aged between 45 and 64. The village has a higher than average proportion of retired people and people with no qualifications.
Common Questions
What is Per Capita Income in Bradshaw?
Per Capita income in Bradshaw is $24,995.
What is the Median Family Income in Bradshaw?
Median Family Income in Bradshaw is $69,375.
What is the Median Household income in Bradshaw?
Median Household Income in Bradshaw is $68,417.
What is Income or Wage Gap in Bradshaw?
Income or Wage Gap in Bradshaw is 52.8%.
Women in Bradshaw earn 47.2 cents for every dollar earned by a man.
What is Inequality or Gini Index in Bradshaw?
Inequality or Gini Index in Bradshaw is 0.30.
What is the Total Population of Bradshaw?
Total Population of Bradshaw is 397.
What is the Total Male Population of Bradshaw?
Total Male Population of Bradshaw is 221.
What is the Total Female Population of Bradshaw?
Total Female Population of Bradshaw is 176.
What is the Ratio of Males per 100 Females in Bradshaw?
There are 125.57 Males per 100 Females in Bradshaw.
What is the Ratio of Females per 100 Males in Bradshaw?
There are 79.64 Females per 100 Males in Bradshaw.
What is the Median Population Age in Bradshaw?
Median Population Age in Bradshaw is 30.1 Years.
What is the Average Family Size in Bradshaw
Average Family Size in Bradshaw is 3.2 People.
What is the Average Household Size in Bradshaw
Average Household Size in Bradshaw is 2.8 People.
How Large is the Labor Force in Bradshaw?
There are 153 People in the Labor Forcein in Bradshaw.
What is the Percentage of People in the Labor Force in Bradshaw?
64.0% of People are in the Labor Force in Bradshaw.
What is the Unemployment Rate in Bradshaw?
Unemployment Rate in Bradshaw is 9.2%.