Zip Codes with the Highest Percentage of Households Heated by Utility Gas in Bellevue, NE
RELATED REPORTS & OPTIONS
Utility Gas Heating
Bellevue
Compare Zip Codes
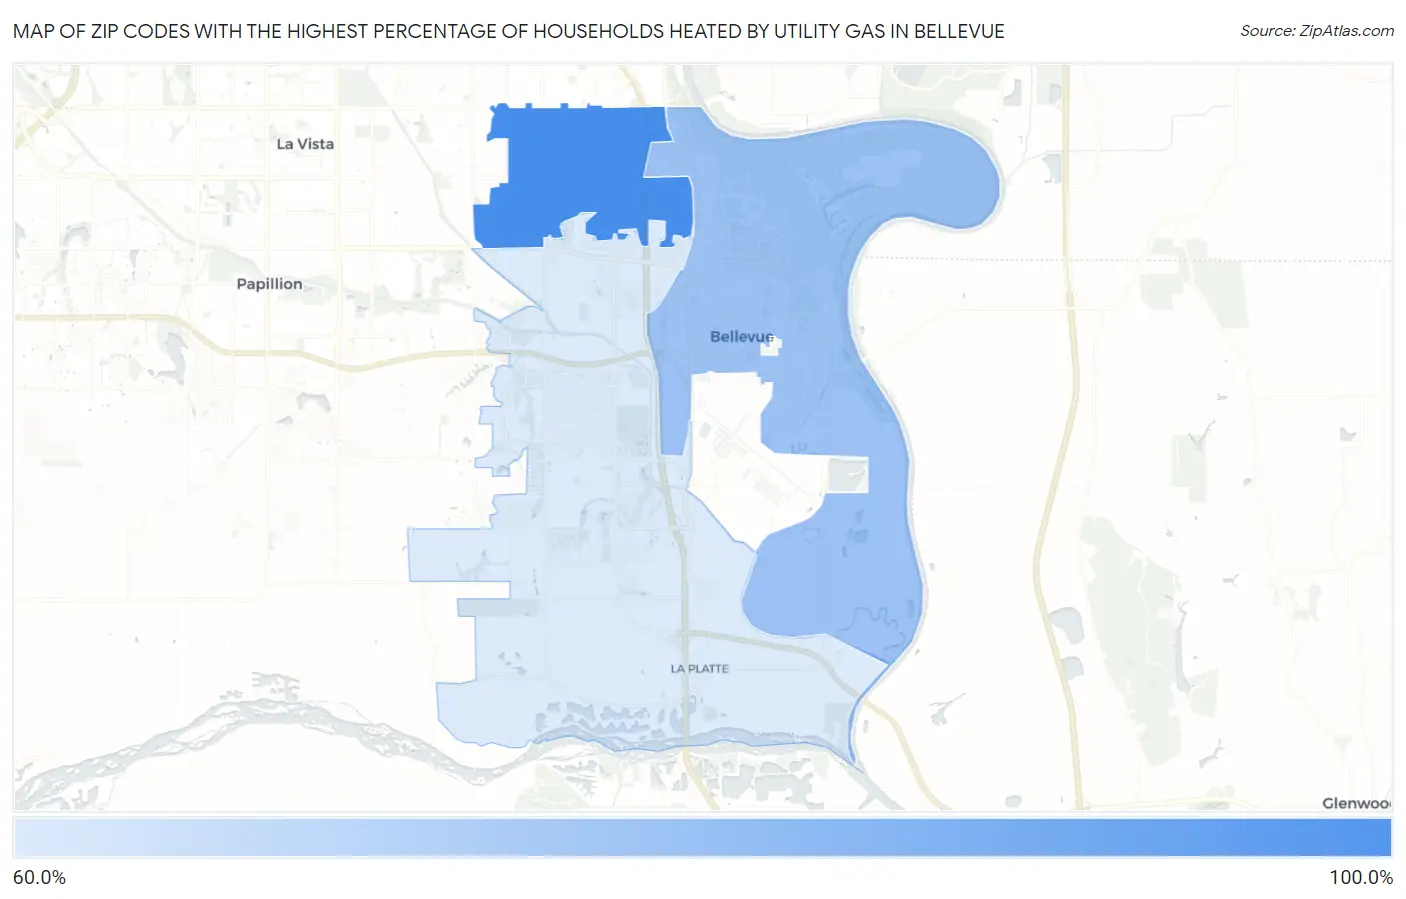
Map of Zip Codes with the Highest Percentage of Households Heated by Utility Gas in Bellevue
0.0%
100.0%
Zip Codes with the Highest Percentage of Households Heated by Utility Gas in Bellevue, NE
| Zip Code | Utility Gas Heating | vs State | vs National | |
| 1. | 68147 | 82.9% | 59.6%(+23.3)#3 | 47.1%(+35.8)#1,693 |
| 2. | 68005 | 74.2% | 59.6%(+14.6)#32 | 47.1%(+27.1)#3,596 |
| 3. | 68123 | 67.8% | 59.6%(+8.20)#55 | 47.1%(+20.7)#5,219 |
1
Common Questions
What are the Top Zip Codes with the Highest Percentage of Households Heated by Utility Gas in Bellevue, NE?
Top Zip Codes with the Highest Percentage of Households Heated by Utility Gas in Bellevue, NE are:
What zip code has the Highest Percentage of Households Heated by Utility Gas in Bellevue, NE?
68147 has the Highest Percentage of Households Heated by Utility Gas in Bellevue, NE with 82.9%.
What is the Percentage of Households Heated by Utility Gas in Bellevue, NE?
Percentage of Households Heated by Utility Gas in Bellevue is 75.6%.
What is the Percentage of Households Heated by Utility Gas in Nebraska?
Percentage of Households Heated by Utility Gas in Nebraska is 59.6%.
What is the Percentage of Households Heated by Utility Gas in the United States?
Percentage of Households Heated by Utility Gas in the United States is 47.1%.