Zip Codes with the Highest Percentage of Population Employed in Farming, Fishing & Forestry in Bellevue, NE
RELATED REPORTS & OPTIONS
Farming, Fishing & Forestry
Bellevue
Compare Zip Codes
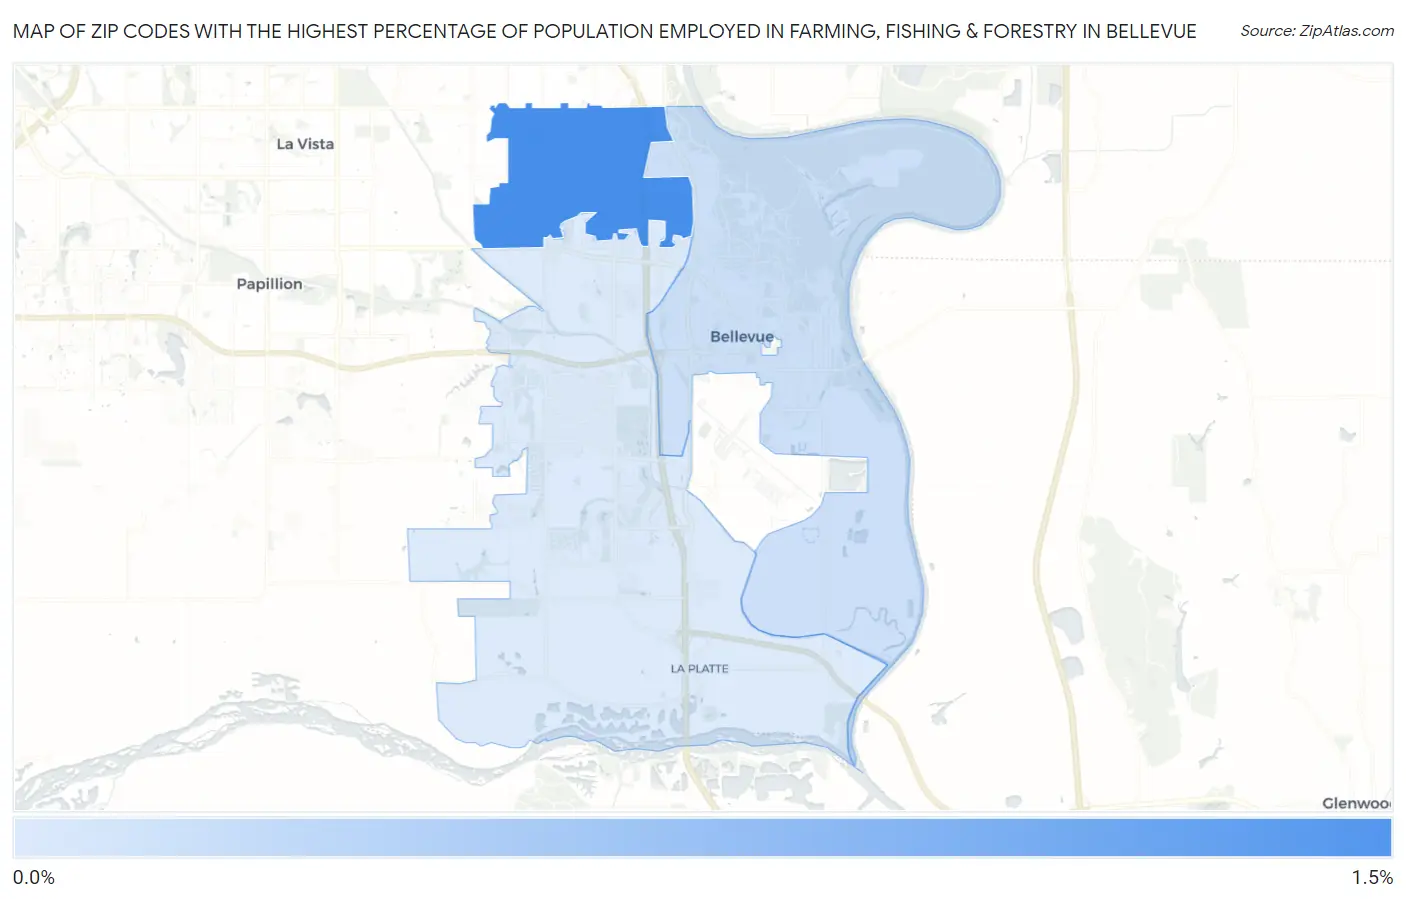
Map of Zip Codes with the Highest Percentage of Population Employed in Farming, Fishing & Forestry in Bellevue
0.0%
1.5%
Zip Codes with the Highest Percentage of Population Employed in Farming, Fishing & Forestry in Bellevue, NE
| Zip Code | % Employed | vs State | vs National | |
| 1. | 68147 | 1.3% | 1.3%(-0.017)#356 | 0.61%(+0.698)#8,561 |
| 2. | 68005 | 0.22% | 1.3%(-1.10)#452 | 0.61%(-0.388)#15,886 |
| 3. | 68123 | 0.092% | 1.3%(-1.23)#467 | 0.61%(-0.513)#17,883 |
1
Common Questions
What are the Top Zip Codes with the Highest Percentage of Population Employed in Farming, Fishing & Forestry in Bellevue, NE?
Top Zip Codes with the Highest Percentage of Population Employed in Farming, Fishing & Forestry in Bellevue, NE are:
What zip code has the Highest Percentage of Population Employed in Farming, Fishing & Forestry in Bellevue, NE?
68147 has the Highest Percentage of Population Employed in Farming, Fishing & Forestry in Bellevue, NE with 1.3%.
What is the Percentage of Population Employed in Farming, Fishing & Forestry in Bellevue, NE?
Percentage of Population Employed in Farming, Fishing & Forestry in Bellevue is 0.37%.
What is the Percentage of Population Employed in Farming, Fishing & Forestry in Nebraska?
Percentage of Population Employed in Farming, Fishing & Forestry in Nebraska is 1.3%.
What is the Percentage of Population Employed in Farming, Fishing & Forestry in the United States?
Percentage of Population Employed in Farming, Fishing & Forestry in the United States is 0.61%.