Atlanta, NE Map & Demographics
Atlanta Map
Atlanta Overview
$34,347
PER CAPITA INCOME
$77,250
AVG FAMILY INCOME
$75,500
AVG HOUSEHOLD INCOME
29.7%
WAGE / INCOME GAP [ % ]
70.3¢/ $1
WAGE / INCOME GAP [ $ ]
0.33
INEQUALITY / GINI INDEX
124
TOTAL POPULATION
60
MALE POPULATION
64
FEMALE POPULATION
93.75
MALES / 100 FEMALES
106.67
FEMALES / 100 MALES
33.3
MEDIAN AGE
3.1
AVG FAMILY SIZE
2.7
AVG HOUSEHOLD SIZE
60
LABOR FORCE [ PEOPLE ]
69.8%
PERCENT IN LABOR FORCE
Atlanta Zip Codes
Atlanta Area Codes
Income in Atlanta
Income Overview in Atlanta
Per Capita Income in Atlanta is $34,347, while median incomes of families and households are $77,250 and $75,500 respectively.
| Characteristic | Number | Measure |
| Per Capita Income | 124 | $34,347 |
| Median Family Income | 37 | $77,250 |
| Mean Family Income | 37 | $95,405 |
| Median Household Income | 46 | $75,500 |
| Mean Household Income | 46 | $84,091 |
| Income Deficit | 37 | $0 |
| Wage / Income Gap (%) | 124 | 29.71% |
| Wage / Income Gap ($) | 124 | 70.29¢ per $1 |
| Gini / Inequality Index | 124 | 0.33 |
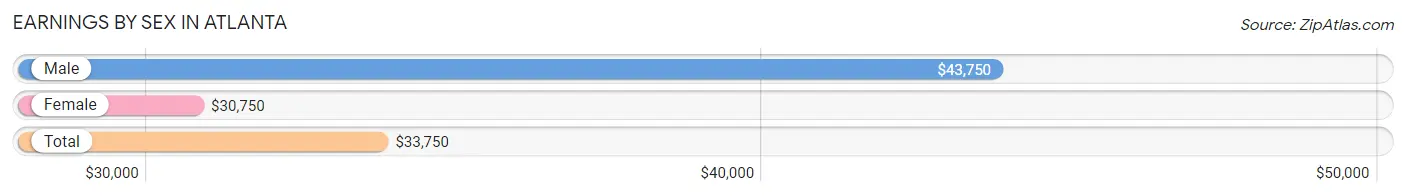
Earnings by Sex in Atlanta
Average Earnings in Atlanta are $33,750, $43,750 for men and $30,750 for women, a difference of 29.7%.
| Sex | Number | Average Earnings |
| Male | 29 (40.3%) | $43,750 |
| Female | 43 (59.7%) | $30,750 |
| Total | 72 (100.0%) | $33,750 |
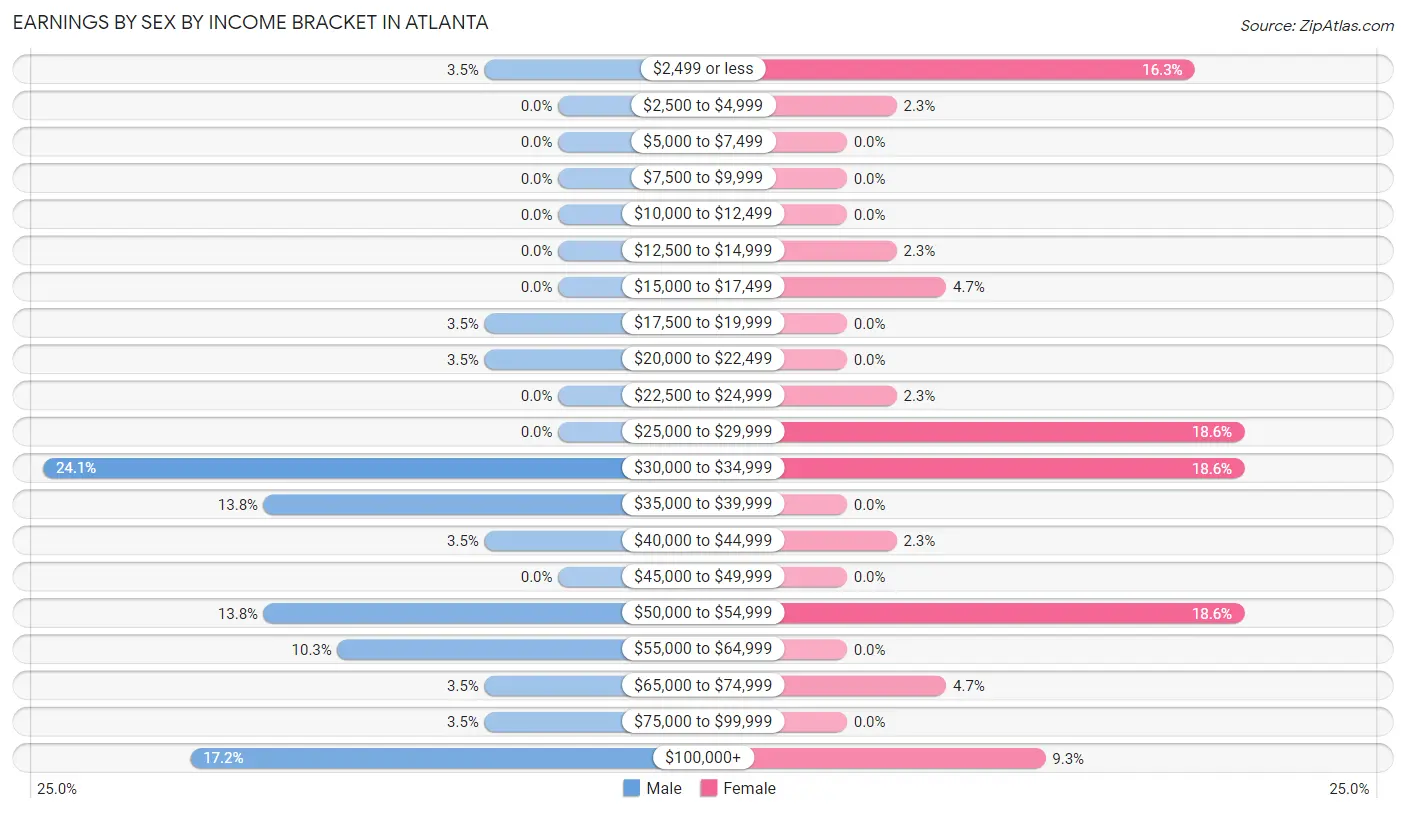
Earnings by Sex by Income Bracket in Atlanta
The most common earnings brackets in Atlanta are $30,000 to $34,999 for men (7 | 24.1%) and $25,000 to $29,999 for women (8 | 18.6%).
| Income | Male | Female |
| $2,499 or less | 1 (3.5%) | 7 (16.3%) |
| $2,500 to $4,999 | 0 (0.0%) | 1 (2.3%) |
| $5,000 to $7,499 | 0 (0.0%) | 0 (0.0%) |
| $7,500 to $9,999 | 0 (0.0%) | 0 (0.0%) |
| $10,000 to $12,499 | 0 (0.0%) | 0 (0.0%) |
| $12,500 to $14,999 | 0 (0.0%) | 1 (2.3%) |
| $15,000 to $17,499 | 0 (0.0%) | 2 (4.6%) |
| $17,500 to $19,999 | 1 (3.5%) | 0 (0.0%) |
| $20,000 to $22,499 | 1 (3.5%) | 0 (0.0%) |
| $22,500 to $24,999 | 0 (0.0%) | 1 (2.3%) |
| $25,000 to $29,999 | 0 (0.0%) | 8 (18.6%) |
| $30,000 to $34,999 | 7 (24.1%) | 8 (18.6%) |
| $35,000 to $39,999 | 4 (13.8%) | 0 (0.0%) |
| $40,000 to $44,999 | 1 (3.5%) | 1 (2.3%) |
| $45,000 to $49,999 | 0 (0.0%) | 0 (0.0%) |
| $50,000 to $54,999 | 4 (13.8%) | 8 (18.6%) |
| $55,000 to $64,999 | 3 (10.3%) | 0 (0.0%) |
| $65,000 to $74,999 | 1 (3.5%) | 2 (4.6%) |
| $75,000 to $99,999 | 1 (3.5%) | 0 (0.0%) |
| $100,000+ | 5 (17.2%) | 4 (9.3%) |
| Total | 29 (100.0%) | 43 (100.0%) |
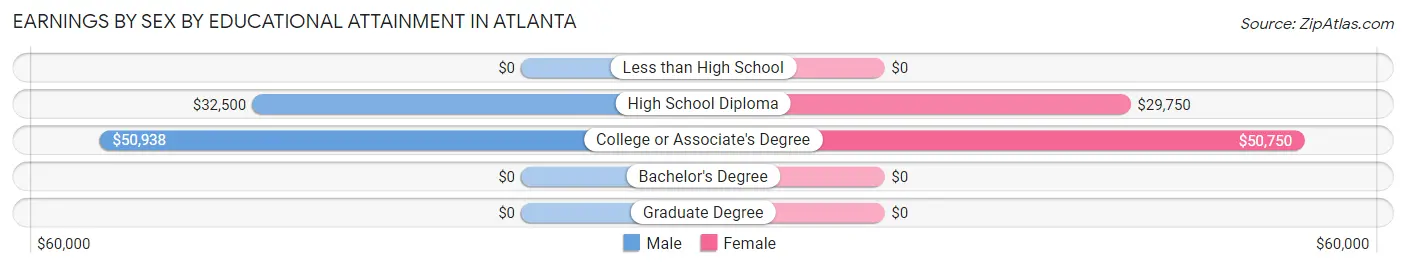
Earnings by Sex by Educational Attainment in Atlanta
Average earnings in Atlanta are $43,750 for men and $32,250 for women, a difference of 26.3%. Men with an educational attainment of college or associate's degree enjoy the highest average annual earnings of $50,938, while those with high school diploma education earn the least with $32,500. Women with an educational attainment of college or associate's degree earn the most with the average annual earnings of $50,750, while those with high school diploma education have the smallest earnings of $29,750.
| Educational Attainment | Male Income | Female Income |
| Less than High School | - | - |
| High School Diploma | $32,500 | $29,750 |
| College or Associate's Degree | $50,938 | $50,750 |
| Bachelor's Degree | - | - |
| Graduate Degree | - | - |
| Total | $43,750 | $32,250 |
Family Income in Atlanta
Family Income Brackets in Atlanta
According to the Atlanta family income data, there are 10 families falling into the $100,000 to $149,999 income range, which is the most common income bracket and makes up 27.0% of all families.
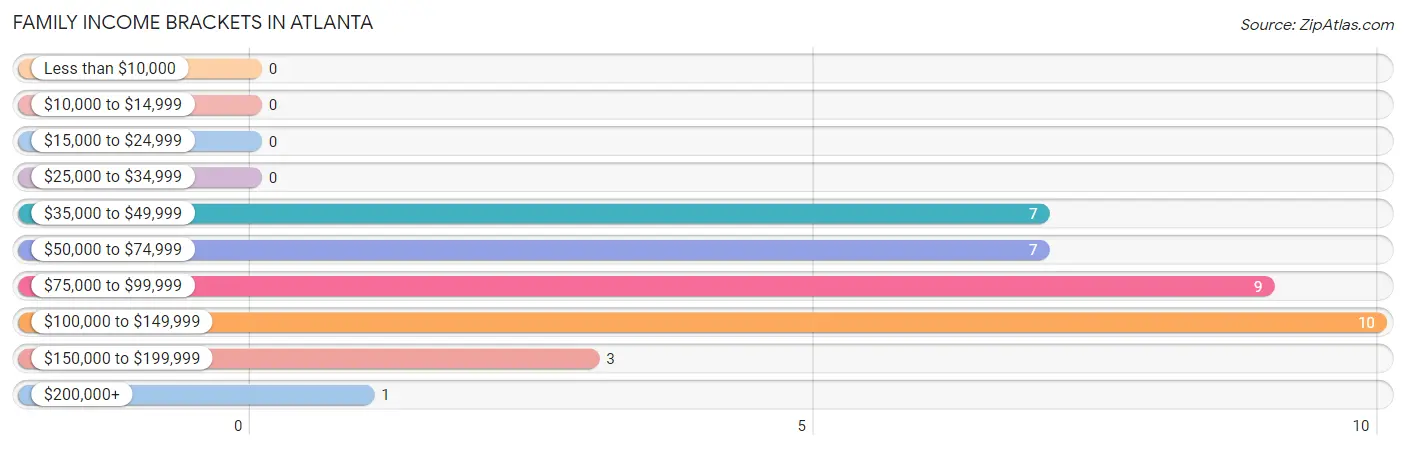
| Income Bracket | # Families | % Families |
| Less than $10,000 | 0 | 0.0% |
| $10,000 to $14,999 | 0 | 0.0% |
| $15,000 to $24,999 | 0 | 0.0% |
| $25,000 to $34,999 | 0 | 0.0% |
| $35,000 to $49,999 | 7 | 18.9% |
| $50,000 to $74,999 | 7 | 18.9% |
| $75,000 to $99,999 | 9 | 24.3% |
| $100,000 to $149,999 | 10 | 27.0% |
| $150,000 to $199,999 | 3 | 8.1% |
| $200,000+ | 1 | 2.7% |
Family Income by Famaliy Size in Atlanta
5-person families (11 | 29.7%) account for the highest median family income in Atlanta with $107,750 per family, while 2-person families (21 | 56.8%) have the highest median income of $30,875 per family member.
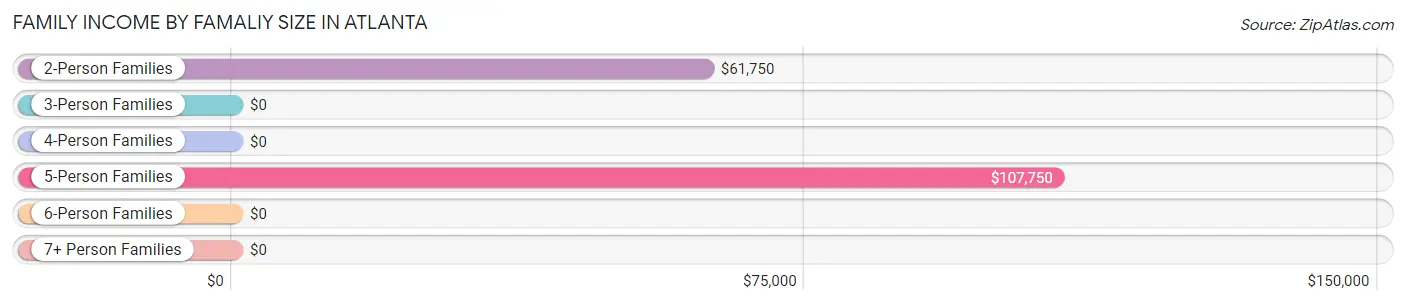
| Income Bracket | # Families | Median Income |
| 2-Person Families | 21 (56.8%) | $61,750 |
| 3-Person Families | 3 (8.1%) | $0 |
| 4-Person Families | 2 (5.4%) | $0 |
| 5-Person Families | 11 (29.7%) | $107,750 |
| 6-Person Families | 0 (0.0%) | $0 |
| 7+ Person Families | 0 (0.0%) | $0 |
| Total | 37 (100.0%) | $77,250 |
Family Income by Number of Earners in Atlanta
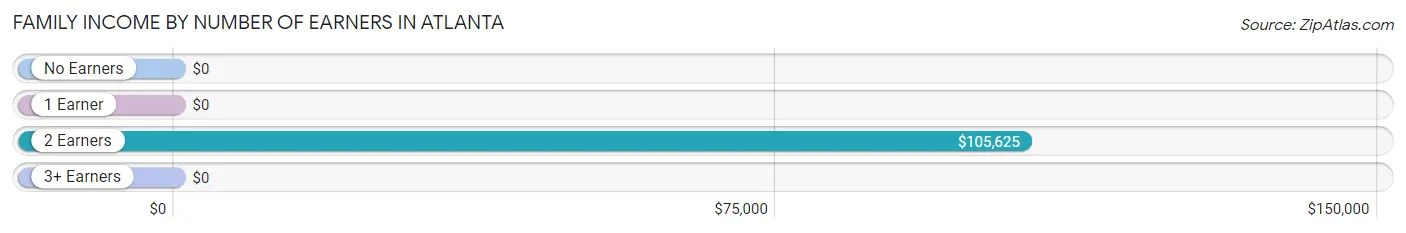
| Number of Earners | # Families | Median Income |
| No Earners | 0 (0.0%) | $0 |
| 1 Earner | 12 (32.4%) | $0 |
| 2 Earners | 21 (56.8%) | $105,625 |
| 3+ Earners | 4 (10.8%) | $0 |
| Total | 37 (100.0%) | $77,250 |
Household Income in Atlanta
Household Income Brackets in Atlanta
With 10 households falling in the category, the $75,000 to $99,999 income range is the most frequent in Atlanta, accounting for 21.7% of all households.
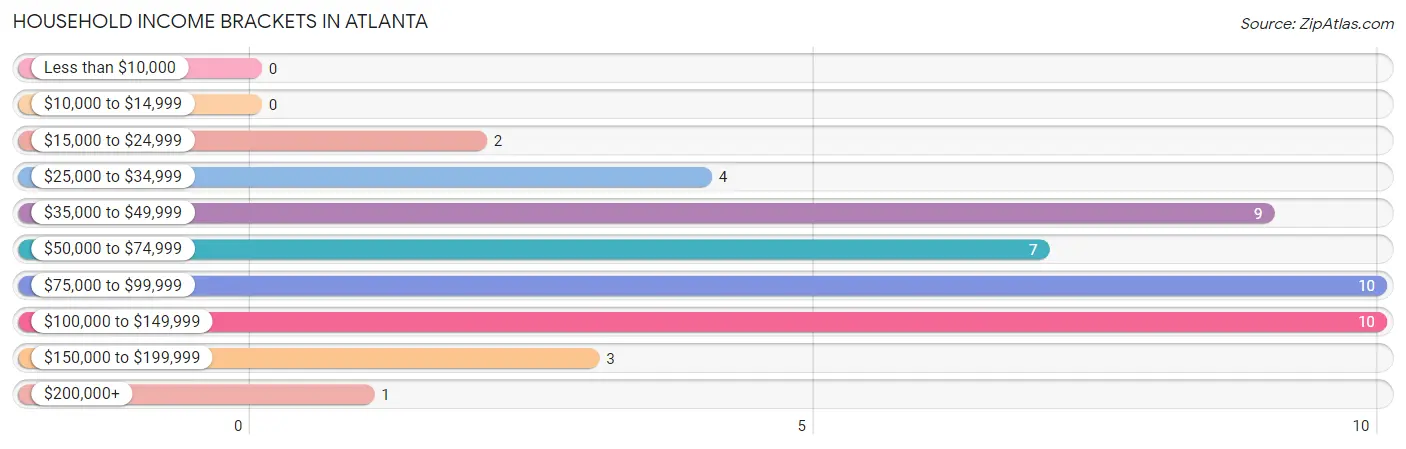
| Income Bracket | # Households | % Households |
| Less than $10,000 | 0 | 0.0% |
| $10,000 to $14,999 | 0 | 0.0% |
| $15,000 to $24,999 | 2 | 4.3% |
| $25,000 to $34,999 | 4 | 8.7% |
| $35,000 to $49,999 | 9 | 19.6% |
| $50,000 to $74,999 | 7 | 15.2% |
| $75,000 to $99,999 | 10 | 21.7% |
| $100,000 to $149,999 | 10 | 21.7% |
| $150,000 to $199,999 | 3 | 6.5% |
| $200,000+ | 1 | 2.2% |
Household Income by Householder Age in Atlanta
The median household income in Atlanta is $75,500, with the highest median household income of $75,500 found in the 25 to 44 years age bracket for the primary householder. A total of 22 households (47.8%) fall into this category. Meanwhile, the 15 to 24 years age bracket for the primary householder has the lowest median household income of $0, with 1 households (2.2%) in this group.
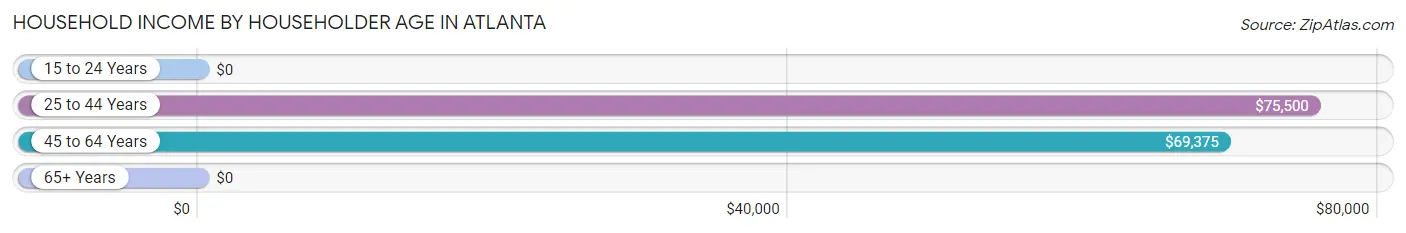
| Income Bracket | # Households | Median Income |
| 15 to 24 Years | 1 (2.2%) | $0 |
| 25 to 44 Years | 22 (47.8%) | $75,500 |
| 45 to 64 Years | 15 (32.6%) | $69,375 |
| 65+ Years | 8 (17.4%) | $0 |
| Total | 46 (100.0%) | $75,500 |
Poverty in Atlanta
Income Below Poverty by Sex and Age in Atlanta
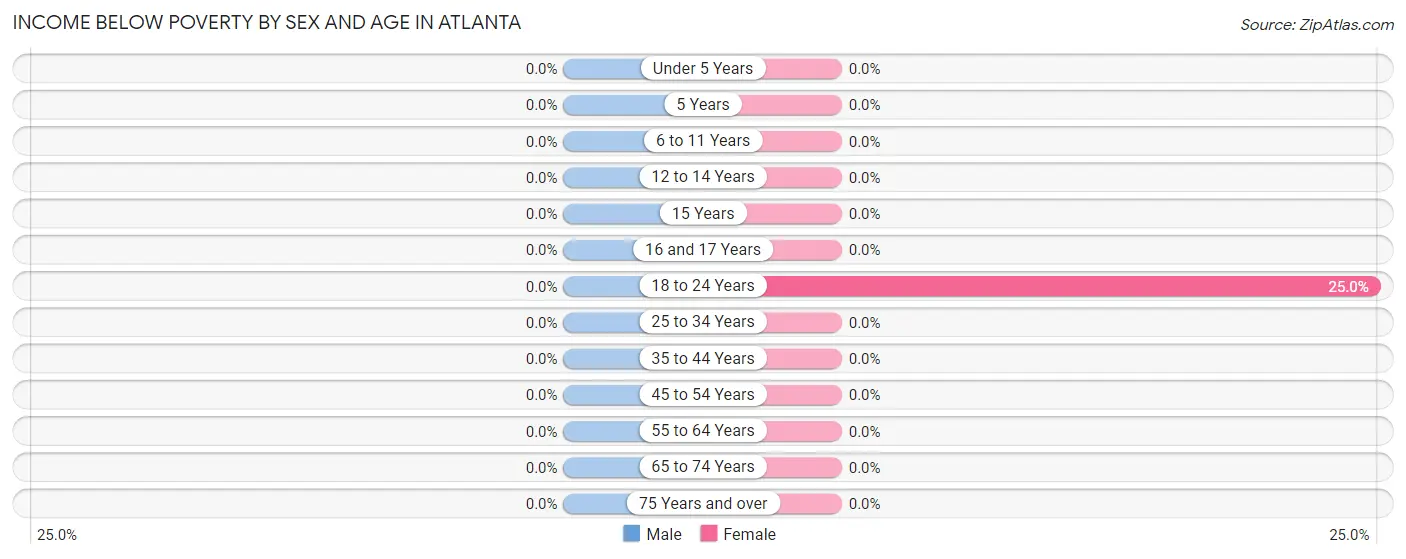
| Age Bracket | Male | Female |
| Under 5 Years | 0 (0.0%) | 0 (0.0%) |
| 5 Years | 0 (0.0%) | 0 (0.0%) |
| 6 to 11 Years | 0 (0.0%) | 0 (0.0%) |
| 12 to 14 Years | 0 (0.0%) | 0 (0.0%) |
| 15 Years | 0 (0.0%) | 0 (0.0%) |
| 16 and 17 Years | 0 (0.0%) | 0 (0.0%) |
| 18 to 24 Years | 0 (0.0%) | 1 (25.0%) |
| 25 to 34 Years | 0 (0.0%) | 0 (0.0%) |
| 35 to 44 Years | 0 (0.0%) | 0 (0.0%) |
| 45 to 54 Years | 0 (0.0%) | 0 (0.0%) |
| 55 to 64 Years | 0 (0.0%) | 0 (0.0%) |
| 65 to 74 Years | 0 (0.0%) | 0 (0.0%) |
| 75 Years and over | 0 (0.0%) | 0 (0.0%) |
| Total | 0 (0.0%) | 1 (1.6%) |
Income Above Poverty by Sex and Age in Atlanta
According to the poverty statistics in Atlanta, males aged under 5 years and females aged under 5 years are the age groups that are most secure financially, with 100.0% of males and 100.0% of females in these age groups living above the poverty line.
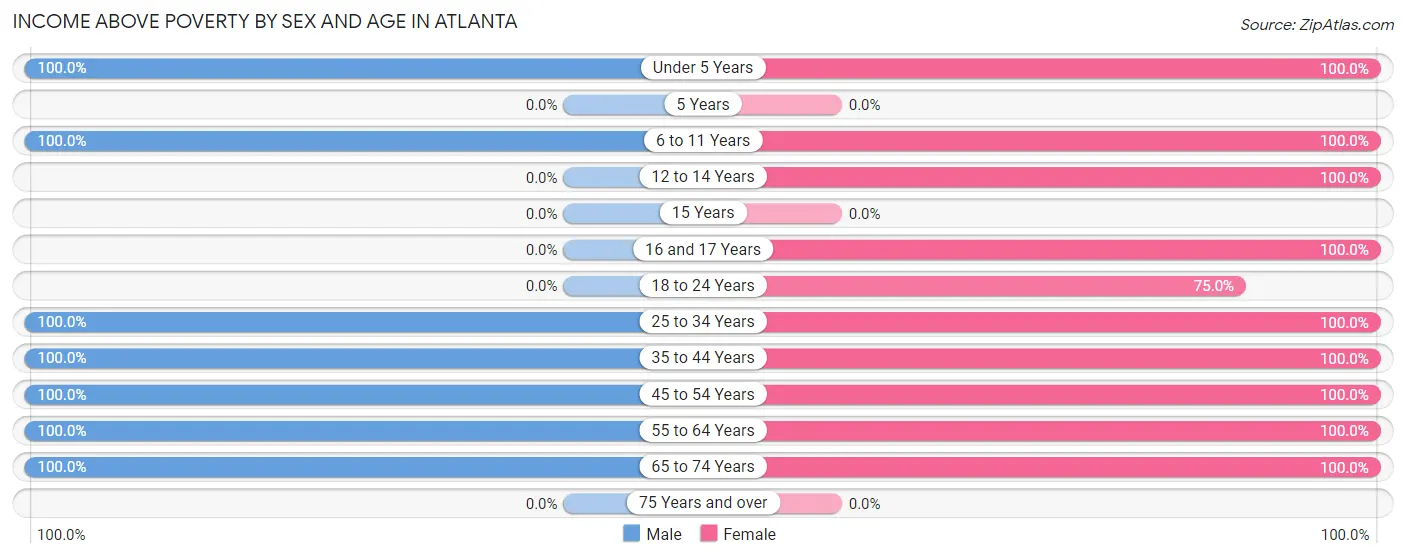
| Age Bracket | Male | Female |
| Under 5 Years | 1 (100.0%) | 11 (100.0%) |
| 5 Years | 0 (0.0%) | 0 (0.0%) |
| 6 to 11 Years | 16 (100.0%) | 9 (100.0%) |
| 12 to 14 Years | 0 (0.0%) | 1 (100.0%) |
| 15 Years | 0 (0.0%) | 0 (0.0%) |
| 16 and 17 Years | 0 (0.0%) | 2 (100.0%) |
| 18 to 24 Years | 0 (0.0%) | 3 (75.0%) |
| 25 to 34 Years | 13 (100.0%) | 13 (100.0%) |
| 35 to 44 Years | 8 (100.0%) | 3 (100.0%) |
| 45 to 54 Years | 2 (100.0%) | 10 (100.0%) |
| 55 to 64 Years | 9 (100.0%) | 7 (100.0%) |
| 65 to 74 Years | 11 (100.0%) | 4 (100.0%) |
| 75 Years and over | 0 (0.0%) | 0 (0.0%) |
| Total | 60 (100.0%) | 63 (98.4%) |
Income Below Poverty Among Married-Couple Families in Atlanta
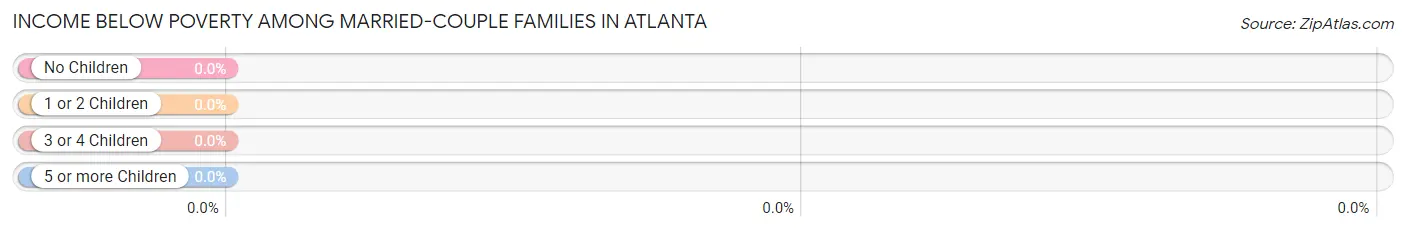
| Children | Above Poverty | Below Poverty |
| No Children | 17 (100.0%) | 0 (0.0%) |
| 1 or 2 Children | 2 (100.0%) | 0 (0.0%) |
| 3 or 4 Children | 11 (100.0%) | 0 (0.0%) |
| 5 or more Children | 0 (0.0%) | 0 (0.0%) |
| Total | 30 (100.0%) | 0 (0.0%) |
Income Below Poverty Among Single-Parent Households in Atlanta
| Children | Single Father | Single Mother |
| No Children | 0 (0.0%) | 0 (0.0%) |
| 1 or 2 Children | 0 (0.0%) | 0 (0.0%) |
| 3 or 4 Children | 0 (0.0%) | 0 (0.0%) |
| 5 or more Children | 0 (0.0%) | 0 (0.0%) |
| Total | 0 (0.0%) | 0 (0.0%) |
Income Below Poverty Among Married-Couple vs Single-Parent Households in Atlanta
| Children | Married-Couple Families | Single-Parent Households |
| No Children | 0 (0.0%) | 0 (0.0%) |
| 1 or 2 Children | 0 (0.0%) | 0 (0.0%) |
| 3 or 4 Children | 0 (0.0%) | 0 (0.0%) |
| 5 or more Children | 0 (0.0%) | 0 (0.0%) |
| Total | 0 (0.0%) | 0 (0.0%) |
Race in Atlanta
The most populous races in Atlanta are White / Caucasian (121 | 97.6%), Two or more Races (3 | 2.4%), and Hispanic or Latino (1 | 0.8%).
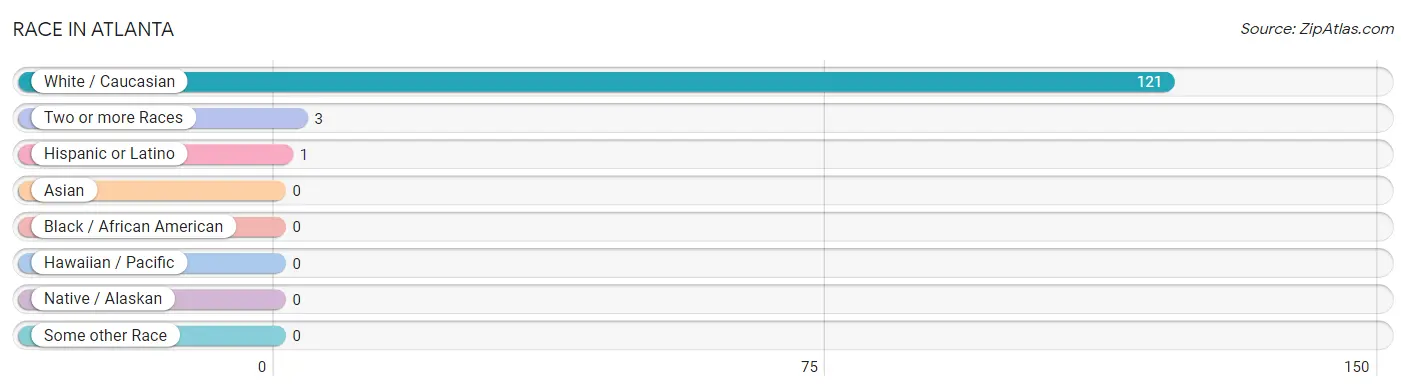
| Race | # Population | % Population |
| Asian | 0 | 0.0% |
| Black / African American | 0 | 0.0% |
| Hawaiian / Pacific | 0 | 0.0% |
| Hispanic or Latino | 1 | 0.8% |
| Native / Alaskan | 0 | 0.0% |
| White / Caucasian | 121 | 97.6% |
| Two or more Races | 3 | 2.4% |
| Some other Race | 0 | 0.0% |
| Total | 124 | 100.0% |
Ancestry in Atlanta
The most populous ancestries reported in Atlanta are German (23 | 18.5%), Irish (12 | 9.7%), American (9 | 7.3%), Swedish (8 | 6.5%), and Danish (4 | 3.2%), together accounting for 45.2% of all Atlanta residents.
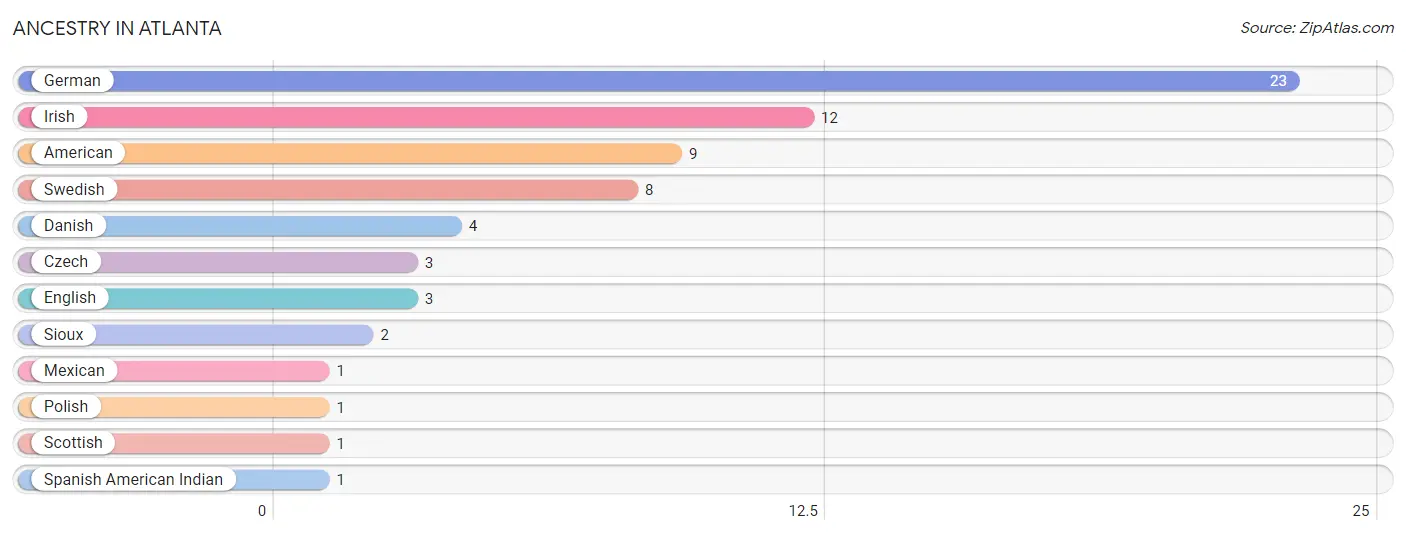
| Ancestry | # Population | % Population |
| American | 9 | 7.3% |
| Czech | 3 | 2.4% |
| Danish | 4 | 3.2% |
| English | 3 | 2.4% |
| German | 23 | 18.5% |
| Irish | 12 | 9.7% |
| Mexican | 1 | 0.8% |
| Polish | 1 | 0.8% |
| Scottish | 1 | 0.8% |
| Sioux | 2 | 1.6% |
| Spanish American Indian | 1 | 0.8% |
| Swedish | 8 | 6.5% | View All 12 Rows |
Immigrants in Atlanta

| Immigration Origin | # Population | % Population | View All 0 Rows |
Sex and Age in Atlanta
Sex and Age in Atlanta
The most populous age groups in Atlanta are 30 to 34 Years (12 | 20.0%) for men and 30 to 34 Years (13 | 20.3%) for women.
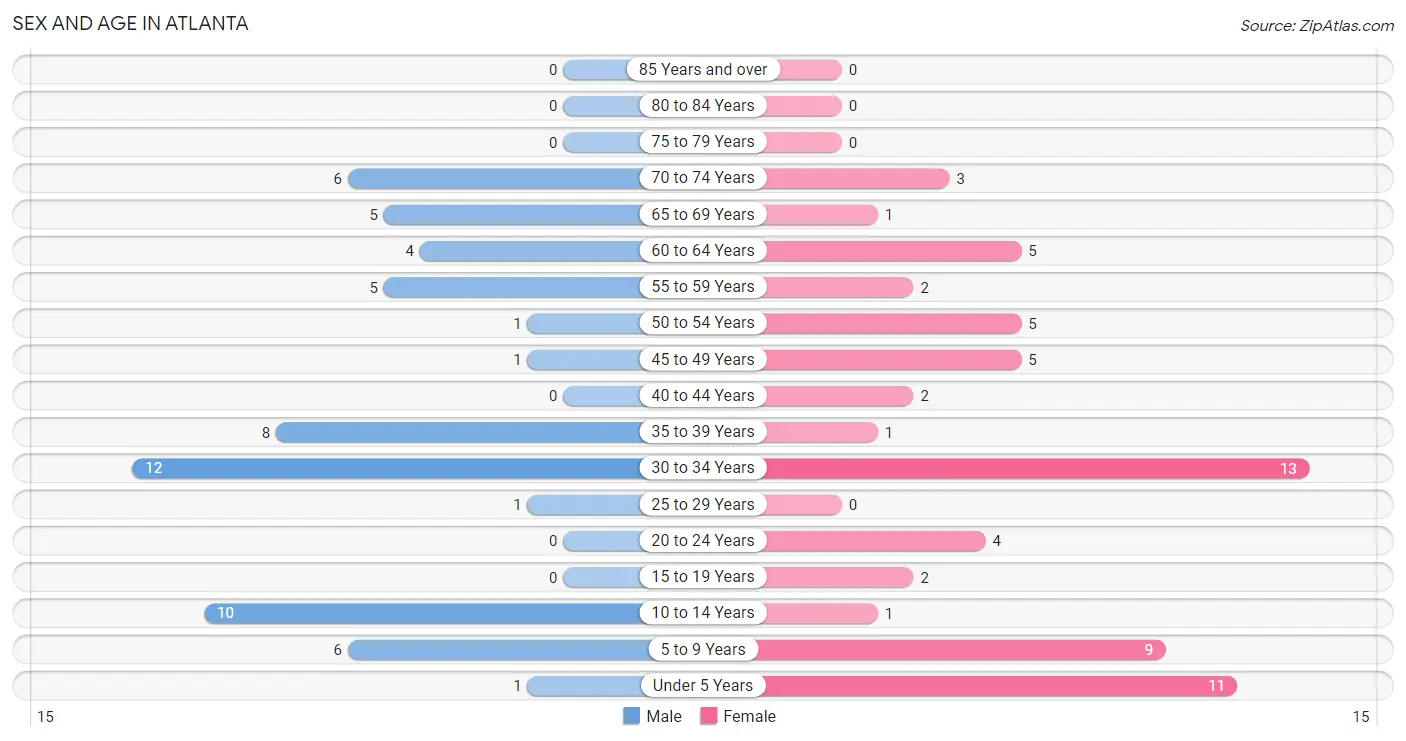
| Age Bracket | Male | Female |
| Under 5 Years | 1 (1.7%) | 11 (17.2%) |
| 5 to 9 Years | 6 (10.0%) | 9 (14.1%) |
| 10 to 14 Years | 10 (16.7%) | 1 (1.6%) |
| 15 to 19 Years | 0 (0.0%) | 2 (3.1%) |
| 20 to 24 Years | 0 (0.0%) | 4 (6.2%) |
| 25 to 29 Years | 1 (1.7%) | 0 (0.0%) |
| 30 to 34 Years | 12 (20.0%) | 13 (20.3%) |
| 35 to 39 Years | 8 (13.3%) | 1 (1.6%) |
| 40 to 44 Years | 0 (0.0%) | 2 (3.1%) |
| 45 to 49 Years | 1 (1.7%) | 5 (7.8%) |
| 50 to 54 Years | 1 (1.7%) | 5 (7.8%) |
| 55 to 59 Years | 5 (8.3%) | 2 (3.1%) |
| 60 to 64 Years | 4 (6.7%) | 5 (7.8%) |
| 65 to 69 Years | 5 (8.3%) | 1 (1.6%) |
| 70 to 74 Years | 6 (10.0%) | 3 (4.7%) |
| 75 to 79 Years | 0 (0.0%) | 0 (0.0%) |
| 80 to 84 Years | 0 (0.0%) | 0 (0.0%) |
| 85 Years and over | 0 (0.0%) | 0 (0.0%) |
| Total | 60 (100.0%) | 64 (100.0%) |
Families and Households in Atlanta
Median Family Size in Atlanta
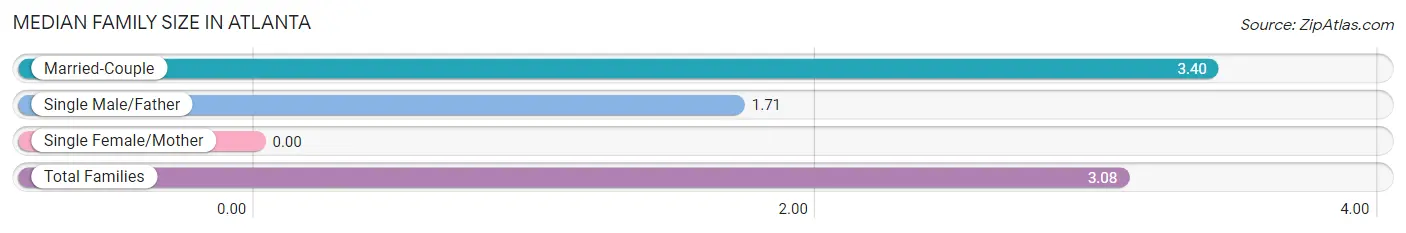
| Family Type | # Families | Family Size |
| Married-Couple | 30 (81.1%) | 3.40 |
| Single Male/Father | 7 (18.9%) | 1.71 |
| Single Female/Mother | 0 (0.0%) | - |
| Total Families | 37 (100.0%) | 3.08 |
Median Household Size in Atlanta
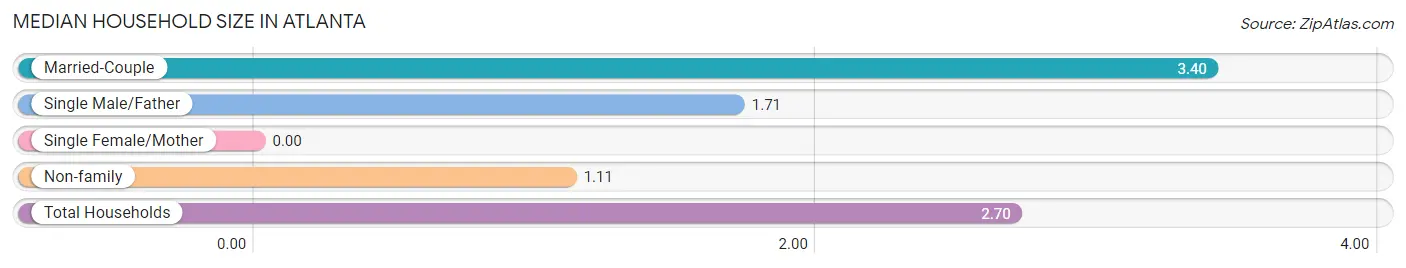
| Household Type | # Households | Household Size |
| Married-Couple | 30 (65.2%) | 3.40 |
| Single Male/Father | 7 (15.2%) | 1.71 |
| Single Female/Mother | 0 (0.0%) | - |
| Non-family | 9 (19.6%) | 1.11 |
| Total Households | 46 (100.0%) | 2.70 |
Household Size by Marriage Status in Atlanta
Out of a total of 46 households in Atlanta, 37 (80.4%) are family households, while 9 (19.6%) are nonfamily households. The most numerous type of family households are 2-person households, comprising 21, and the most common type of nonfamily households are 1-person households, comprising 8.
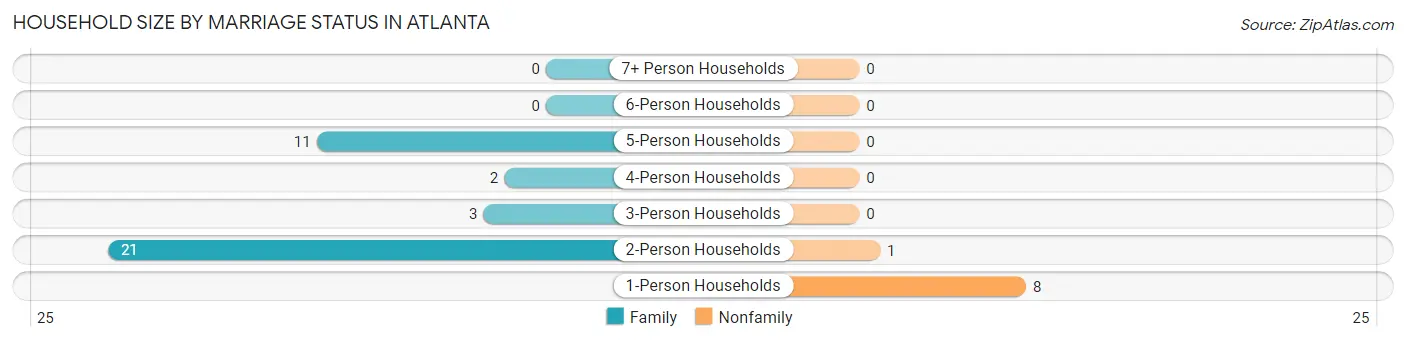
| Household Size | Family Households | Nonfamily Households |
| 1-Person Households | - | 8 (17.4%) |
| 2-Person Households | 21 (45.7%) | 1 (2.2%) |
| 3-Person Households | 3 (6.5%) | 0 (0.0%) |
| 4-Person Households | 2 (4.3%) | 0 (0.0%) |
| 5-Person Households | 11 (23.9%) | 0 (0.0%) |
| 6-Person Households | 0 (0.0%) | 0 (0.0%) |
| 7+ Person Households | 0 (0.0%) | 0 (0.0%) |
| Total | 37 (80.4%) | 9 (19.6%) |
Female Fertility in Atlanta
Fertility by Age in Atlanta
Average fertility rate in Atlanta is 36.0 births per 1,000 women. Women in the age bracket of 35 to 50 years have the highest fertility rate with 111.0 births per 1,000 women. Women in the age bracket of 35 to 50 years acount for 100.0% of all women with births.
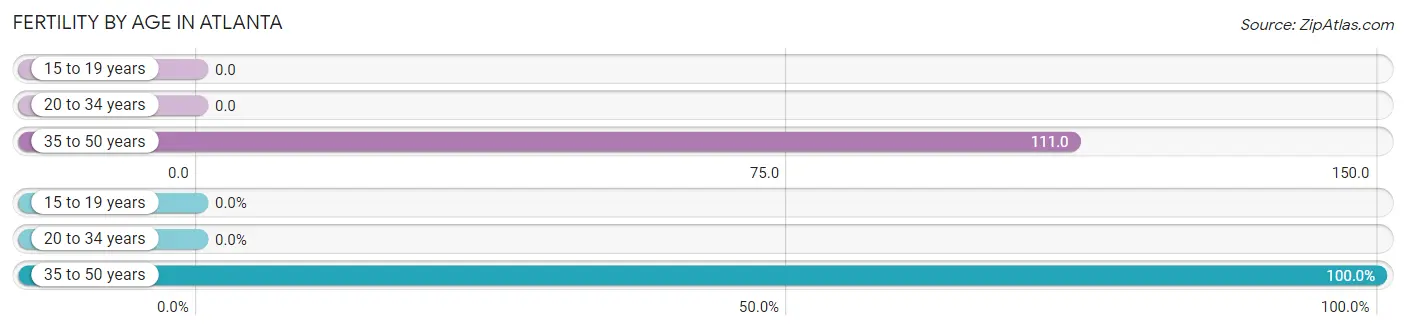
| Age Bracket | Women with Births | Births / 1,000 Women |
| 15 to 19 years | 0 (0.0%) | 0.0 |
| 20 to 34 years | 0 (0.0%) | 0.0 |
| 35 to 50 years | 1 (100.0%) | 111.0 |
| Total | 1 (100.0%) | 36.0 |
Fertility by Age by Marriage Status in Atlanta
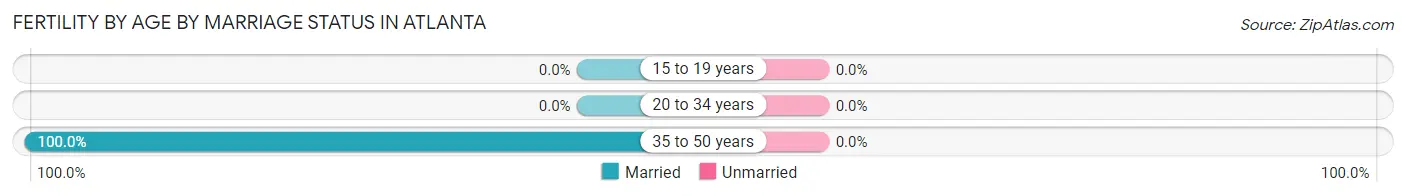
| Age Bracket | Married | Unmarried |
| 15 to 19 years | 0 (0.0%) | 0 (0.0%) |
| 20 to 34 years | 0 (0.0%) | 0 (0.0%) |
| 35 to 50 years | 1 (100.0%) | 0 (0.0%) |
| Total | 1 (100.0%) | 0 (0.0%) |
Fertility by Education in Atlanta
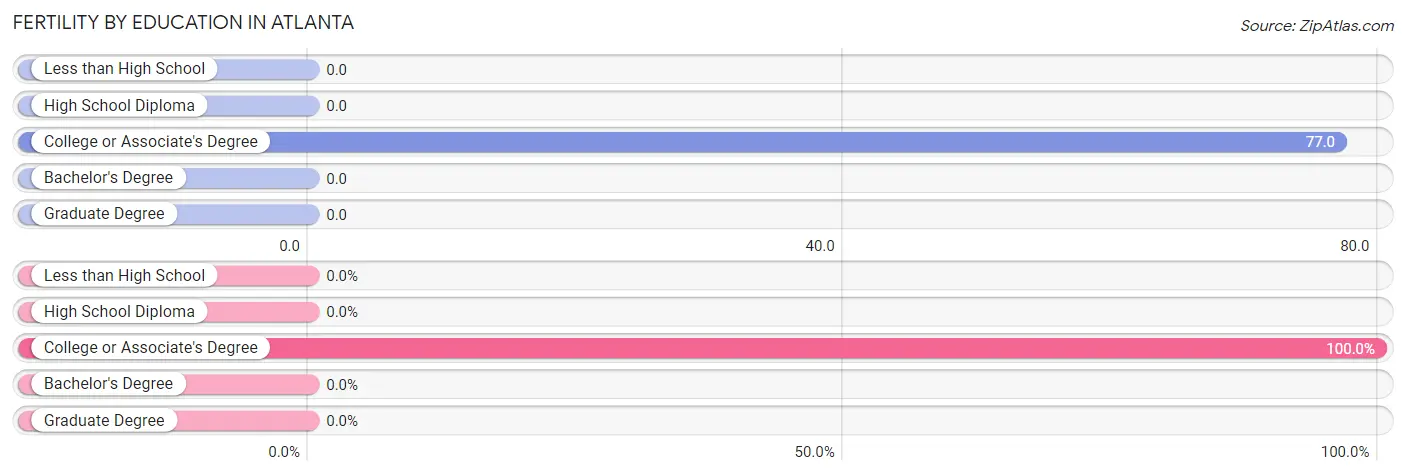
| Educational Attainment | Women with Births | Births / 1,000 Women |
| Less than High School | 0 (0.0%) | 0.0 |
| High School Diploma | 0 (0.0%) | 0.0 |
| College or Associate's Degree | 1 (100.0%) | 77.0 |
| Bachelor's Degree | 0 (0.0%) | 0.0 |
| Graduate Degree | 0 (0.0%) | 0.0 |
| Total | 1 (100.0%) | 36.0 |
Fertility by Education by Marriage Status in Atlanta
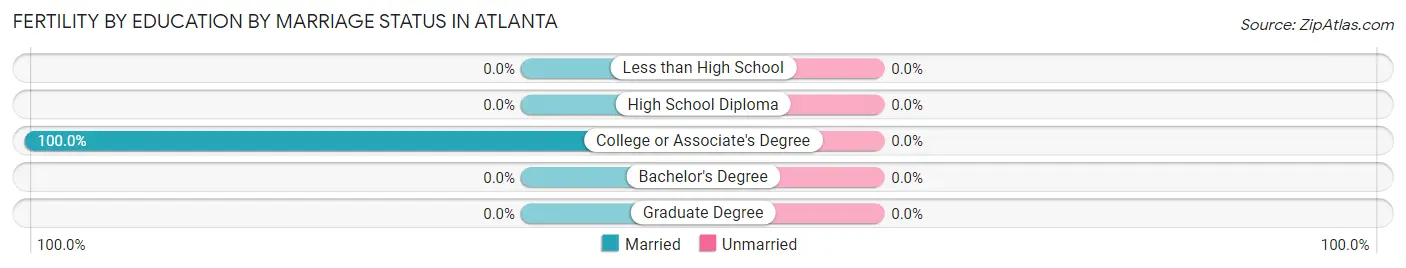
| Educational Attainment | Married | Unmarried |
| Less than High School | 0 (0.0%) | 0 (0.0%) |
| High School Diploma | 0 (0.0%) | 0 (0.0%) |
| College or Associate's Degree | 1 (100.0%) | 0 (0.0%) |
| Bachelor's Degree | 0 (0.0%) | 0 (0.0%) |
| Graduate Degree | 0 (0.0%) | 0 (0.0%) |
| Total | 1 (100.0%) | 0 (0.0%) |
Employment Characteristics in Atlanta
Employment by Class of Employer in Atlanta
Among the 59 employed individuals in Atlanta, private company employees (50 | 84.8%), self-employed (not incorporated) (4 | 6.8%), and self-employed (incorporated) (2 | 3.4%) make up the most common classes of employment.
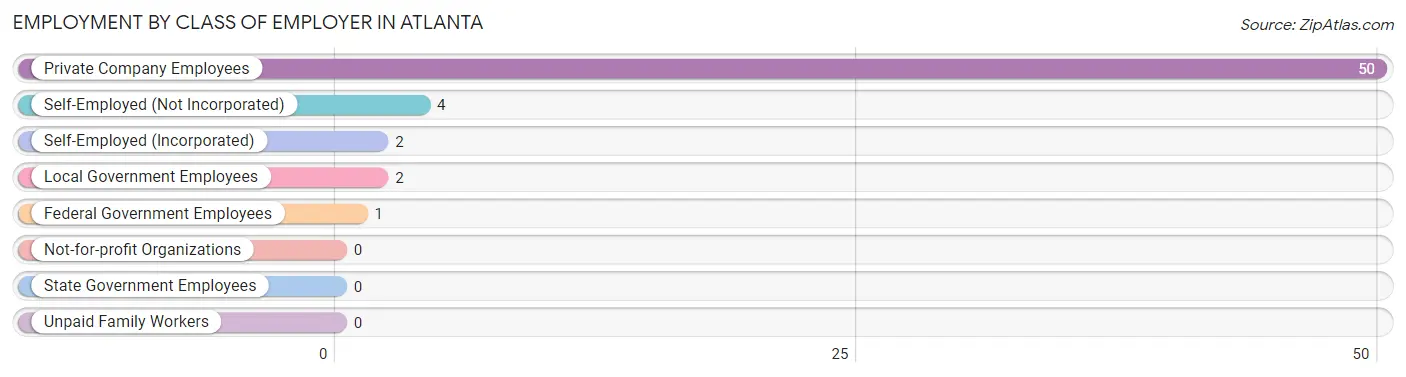
| Employer Class | # Employees | % Employees |
| Private Company Employees | 50 | 84.8% |
| Self-Employed (Incorporated) | 2 | 3.4% |
| Self-Employed (Not Incorporated) | 4 | 6.8% |
| Not-for-profit Organizations | 0 | 0.0% |
| Local Government Employees | 2 | 3.4% |
| State Government Employees | 0 | 0.0% |
| Federal Government Employees | 1 | 1.7% |
| Unpaid Family Workers | 0 | 0.0% |
| Total | 59 | 100.0% |
Employment Status by Age in Atlanta
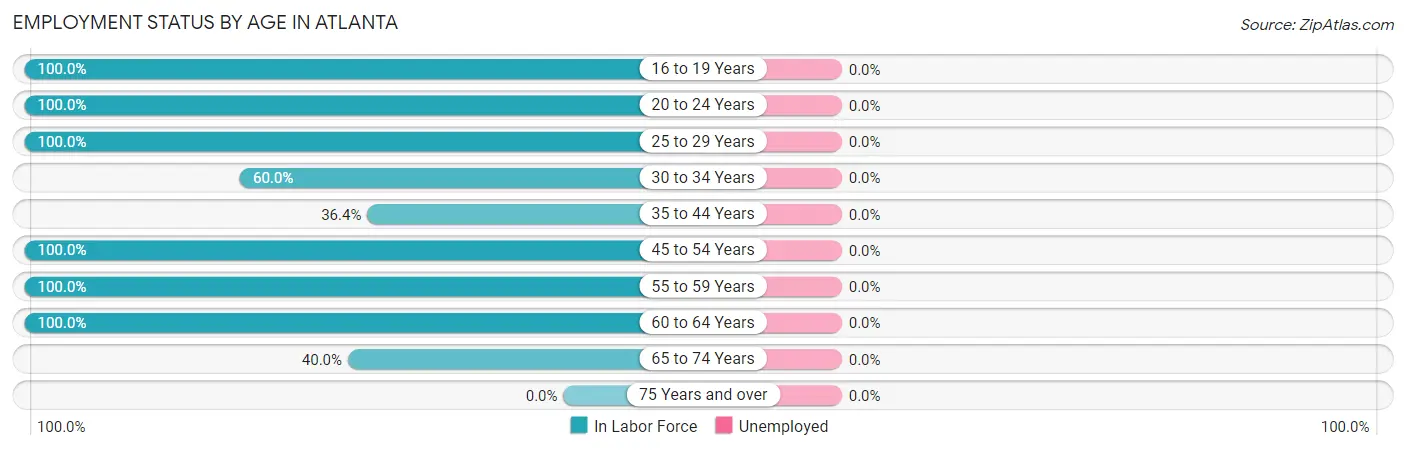
| Age Bracket | In Labor Force | Unemployed |
| 16 to 19 Years | 2 (100.0%) | 0 (0.0%) |
| 20 to 24 Years | 4 (100.0%) | 0 (0.0%) |
| 25 to 29 Years | 1 (100.0%) | 0 (0.0%) |
| 30 to 34 Years | 15 (60.0%) | 0 (0.0%) |
| 35 to 44 Years | 4 (36.4%) | 0 (0.0%) |
| 45 to 54 Years | 12 (100.0%) | 0 (0.0%) |
| 55 to 59 Years | 7 (100.0%) | 0 (0.0%) |
| 60 to 64 Years | 9 (100.0%) | 0 (0.0%) |
| 65 to 74 Years | 6 (40.0%) | 0 (0.0%) |
| 75 Years and over | 0 (0.0%) | 0 (0.0%) |
| Total | 60 (69.8%) | 0 (0.0%) |
Employment Status by Educational Attainment in Atlanta
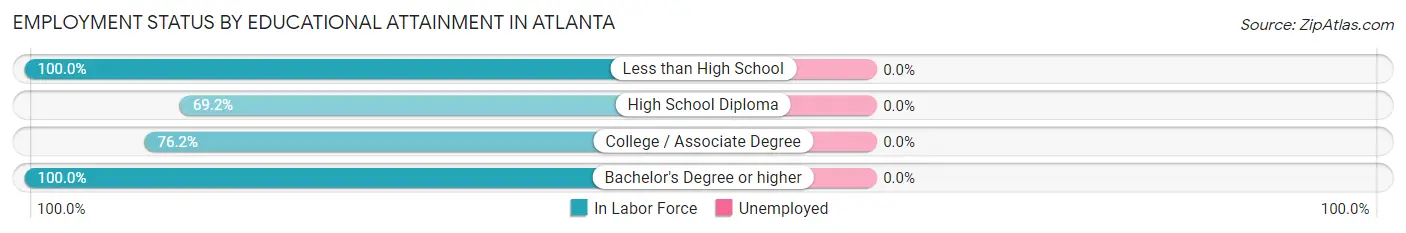
| Educational Attainment | In Labor Force | Unemployed |
| Less than High School | 2 (100.0%) | 0 (0.0%) |
| High School Diploma | 27 (69.2%) | 0 (0.0%) |
| College / Associate Degree | 16 (76.2%) | 0 (0.0%) |
| Bachelor's Degree or higher | 3 (100.0%) | 0 (0.0%) |
| Total | 48 (73.8%) | 0 (0.0%) |
Employment Occupations by Sex in Atlanta
Management, Business, Science and Arts Occupations
The most common Management, Business, Science and Arts occupations in Atlanta are Management (10 | 16.7%), Health Diagnosing & Treating (5 | 8.3%), Health Technologists (4 | 6.7%), Business & Financial (3 | 5.0%), and Computers, Engineering & Science (1 | 1.7%).
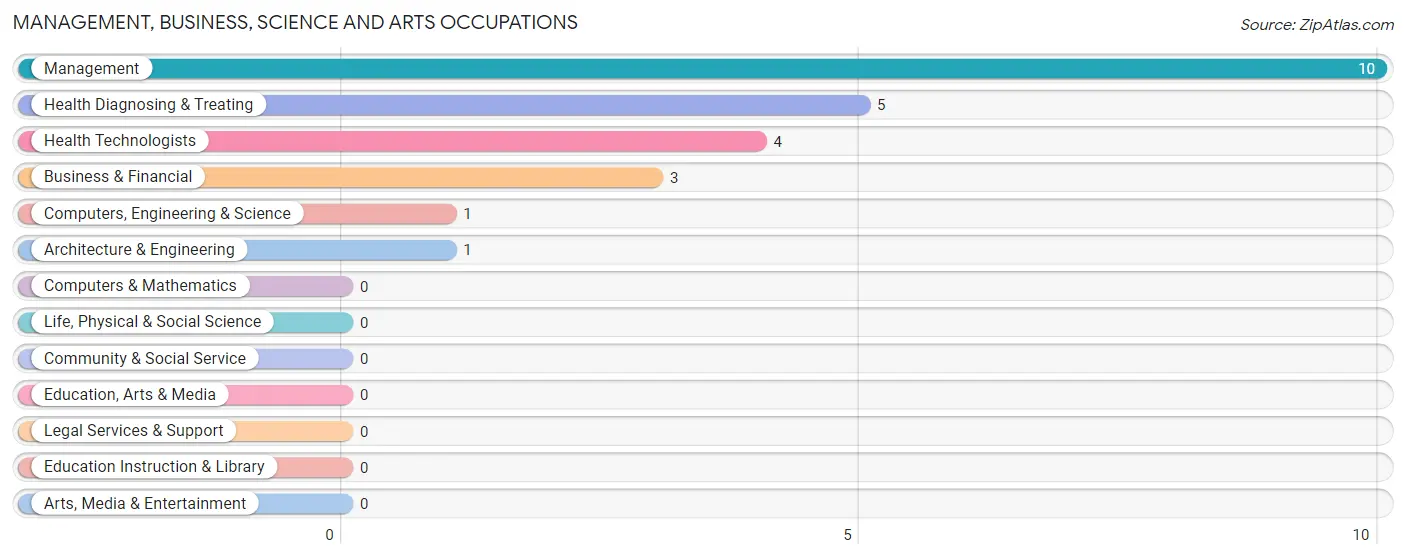
Management, Business, Science and Arts Occupations by Sex
Within the Management, Business, Science and Arts occupations in Atlanta, the most male-oriented occupations are Computers, Engineering & Science (100.0%), Architecture & Engineering (100.0%), and Management (60.0%), while the most female-oriented occupations are Business & Financial (100.0%), Health Diagnosing & Treating (100.0%), and Health Technologists (100.0%).
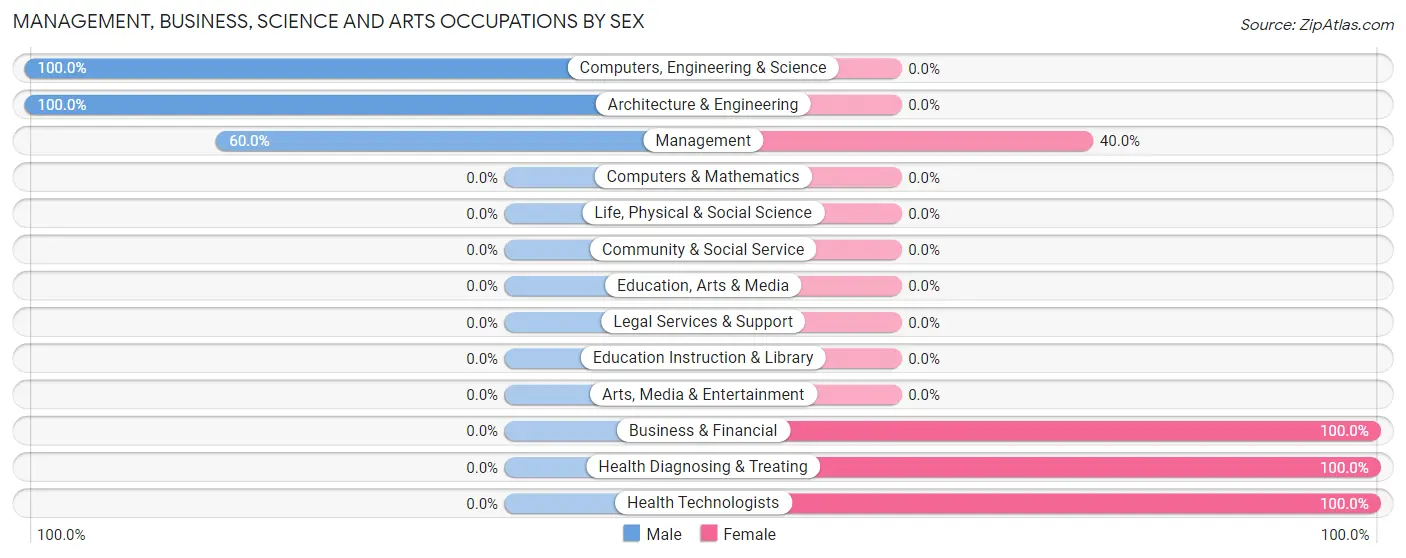
| Occupation | Male | Female |
| Management | 6 (60.0%) | 4 (40.0%) |
| Business & Financial | 0 (0.0%) | 3 (100.0%) |
| Computers, Engineering & Science | 1 (100.0%) | 0 (0.0%) |
| Computers & Mathematics | 0 (0.0%) | 0 (0.0%) |
| Architecture & Engineering | 1 (100.0%) | 0 (0.0%) |
| Life, Physical & Social Science | 0 (0.0%) | 0 (0.0%) |
| Community & Social Service | 0 (0.0%) | 0 (0.0%) |
| Education, Arts & Media | 0 (0.0%) | 0 (0.0%) |
| Legal Services & Support | 0 (0.0%) | 0 (0.0%) |
| Education Instruction & Library | 0 (0.0%) | 0 (0.0%) |
| Arts, Media & Entertainment | 0 (0.0%) | 0 (0.0%) |
| Health Diagnosing & Treating | 0 (0.0%) | 5 (100.0%) |
| Health Technologists | 0 (0.0%) | 4 (100.0%) |
| Total (Category) | 7 (36.8%) | 12 (63.2%) |
| Total (Overall) | 27 (45.0%) | 33 (55.0%) |
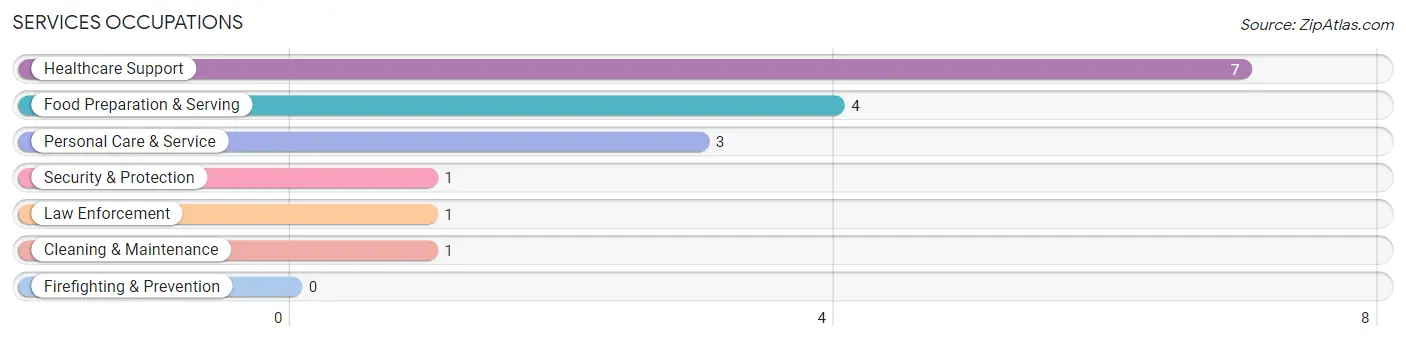
Services Occupations
The most common Services occupations in Atlanta are Healthcare Support (7 | 11.7%), Food Preparation & Serving (4 | 6.7%), Personal Care & Service (3 | 5.0%), Security & Protection (1 | 1.7%), and Law Enforcement (1 | 1.7%).
Services Occupations by Sex
Within the Services occupations in Atlanta, the most male-oriented occupations are Cleaning & Maintenance (100.0%), and Food Preparation & Serving (25.0%), while the most female-oriented occupations are Healthcare Support (100.0%), Security & Protection (100.0%), and Law Enforcement (100.0%).
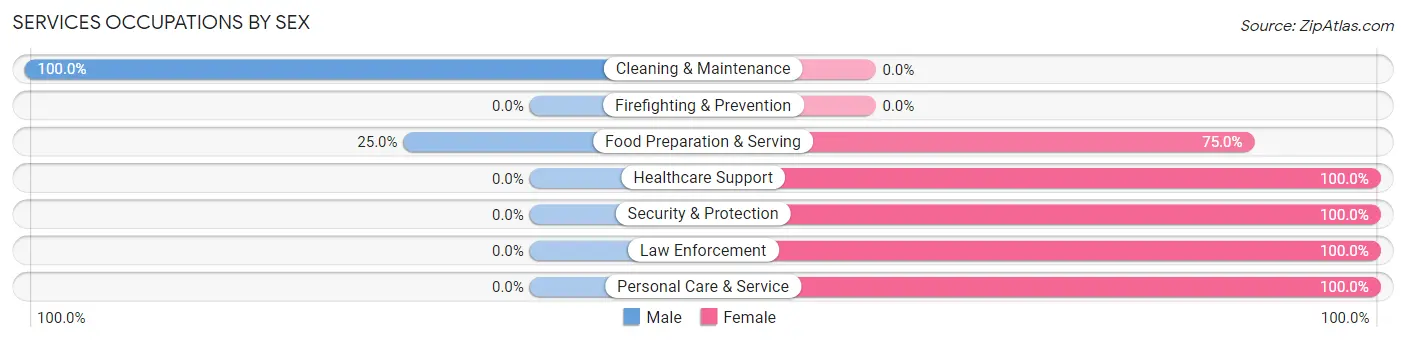
| Occupation | Male | Female |
| Healthcare Support | 0 (0.0%) | 7 (100.0%) |
| Security & Protection | 0 (0.0%) | 1 (100.0%) |
| Firefighting & Prevention | 0 (0.0%) | 0 (0.0%) |
| Law Enforcement | 0 (0.0%) | 1 (100.0%) |
| Food Preparation & Serving | 1 (25.0%) | 3 (75.0%) |
| Cleaning & Maintenance | 1 (100.0%) | 0 (0.0%) |
| Personal Care & Service | 0 (0.0%) | 3 (100.0%) |
| Total (Category) | 2 (12.5%) | 14 (87.5%) |
| Total (Overall) | 27 (45.0%) | 33 (55.0%) |
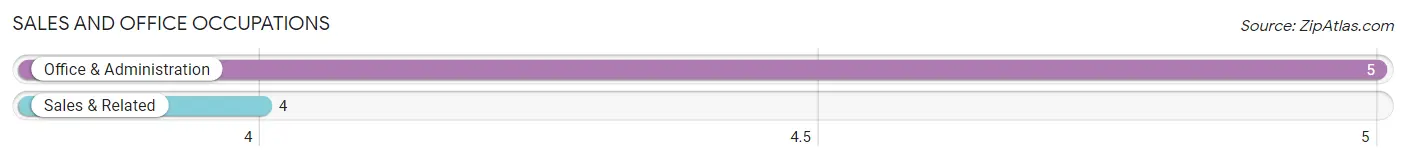
Sales and Office Occupations
The most common Sales and Office occupations in Atlanta are Office & Administration (5 | 8.3%), and Sales & Related (4 | 6.7%).
Sales and Office Occupations by Sex

| Occupation | Male | Female |
| Sales & Related | 2 (50.0%) | 2 (50.0%) |
| Office & Administration | 0 (0.0%) | 5 (100.0%) |
| Total (Category) | 2 (22.2%) | 7 (77.8%) |
| Total (Overall) | 27 (45.0%) | 33 (55.0%) |
Natural Resources, Construction and Maintenance Occupations
The most common Natural Resources, Construction and Maintenance occupations in Atlanta are Installation, Maintenance & Repair (4 | 6.7%), and Farming, Fishing & Forestry (2 | 3.3%).

Natural Resources, Construction and Maintenance Occupations by Sex
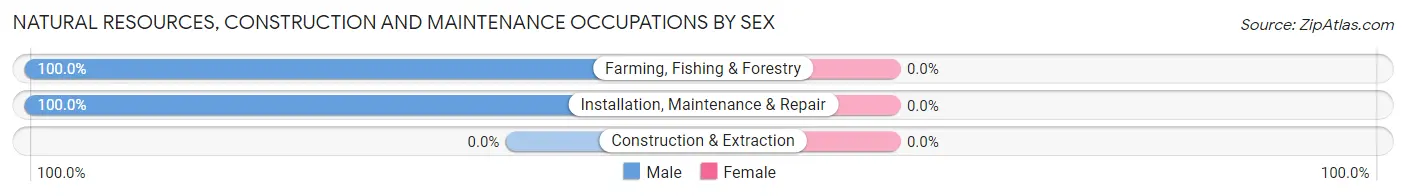
| Occupation | Male | Female |
| Farming, Fishing & Forestry | 2 (100.0%) | 0 (0.0%) |
| Construction & Extraction | 0 (0.0%) | 0 (0.0%) |
| Installation, Maintenance & Repair | 4 (100.0%) | 0 (0.0%) |
| Total (Category) | 6 (100.0%) | 0 (0.0%) |
| Total (Overall) | 27 (45.0%) | 33 (55.0%) |
Production, Transportation and Moving Occupations
The most common Production, Transportation and Moving occupations in Atlanta are Production (5 | 8.3%), Material Moving (3 | 5.0%), and Transportation (2 | 3.3%).
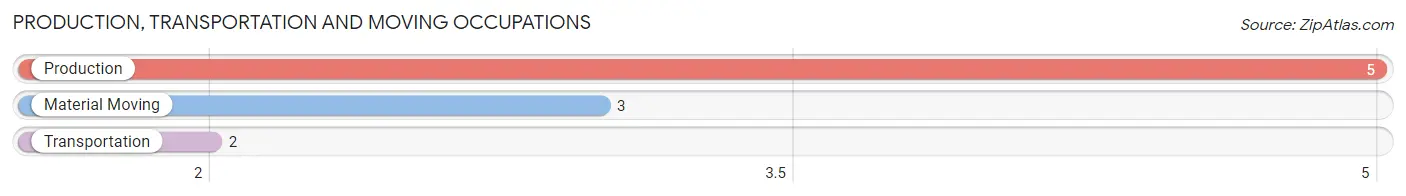
Production, Transportation and Moving Occupations by Sex
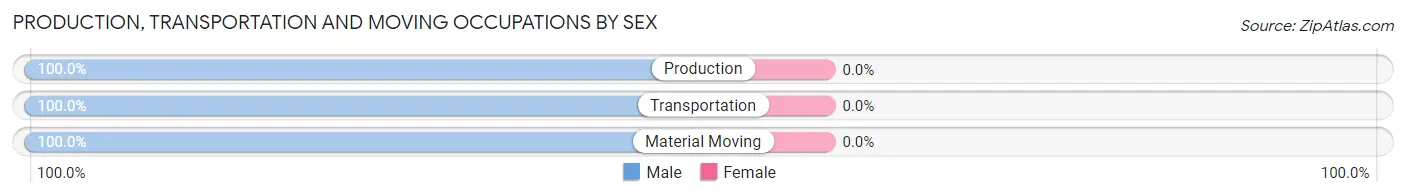
| Occupation | Male | Female |
| Production | 5 (100.0%) | 0 (0.0%) |
| Transportation | 2 (100.0%) | 0 (0.0%) |
| Material Moving | 3 (100.0%) | 0 (0.0%) |
| Total (Category) | 10 (100.0%) | 0 (0.0%) |
| Total (Overall) | 27 (45.0%) | 33 (55.0%) |
Employment Industries by Sex in Atlanta
Employment Industries in Atlanta
The major employment industries in Atlanta include Health Care & Social Assistance (14 | 23.3%), Manufacturing (10 | 16.7%), Wholesale Trade (9 | 15.0%), Agriculture, Fishing & Hunting (6 | 10.0%), and Finance & Insurance (6 | 10.0%).
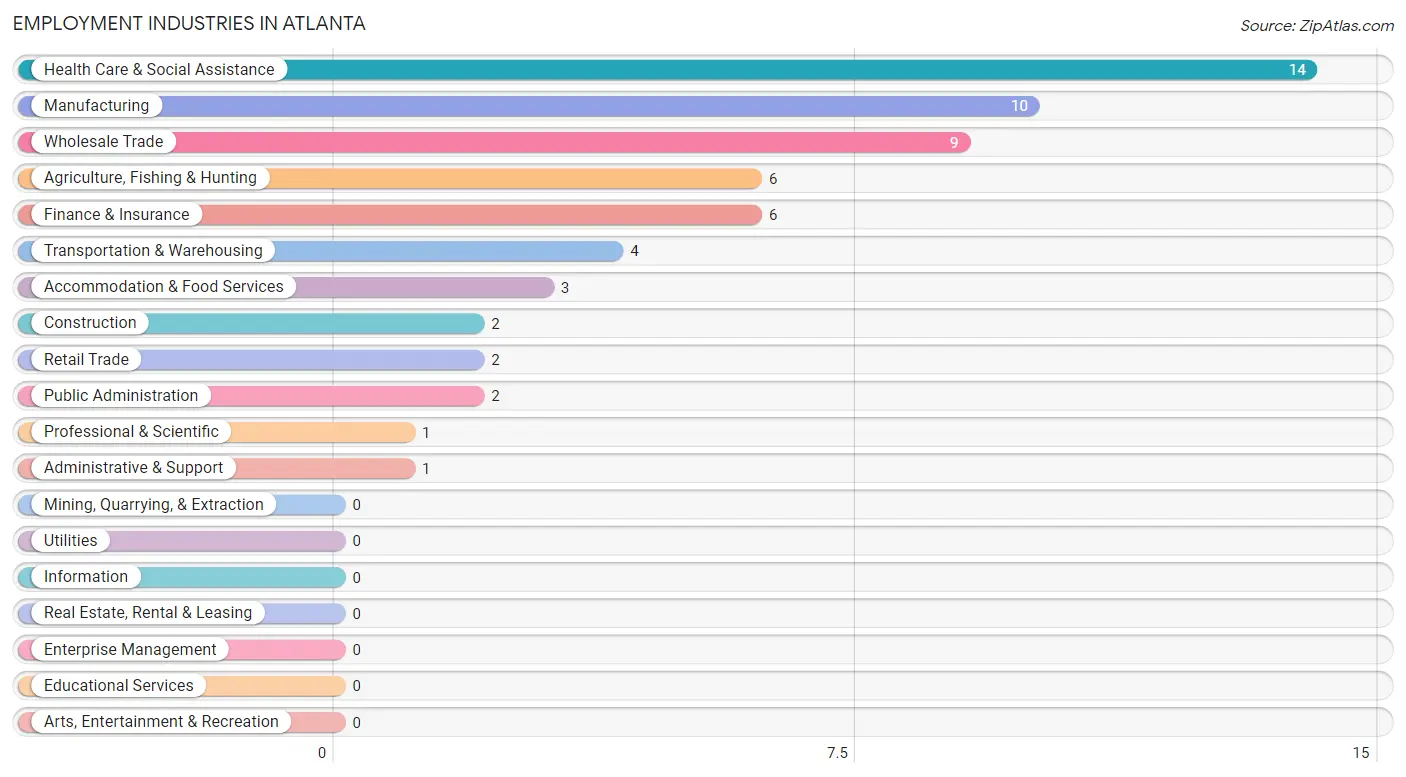
Employment Industries by Sex in Atlanta
The Atlanta industries that see more men than women are Transportation & Warehousing (100.0%), Administrative & Support (100.0%), and Wholesale Trade (88.9%), whereas the industries that tend to have a higher number of women are Construction (100.0%), Finance & Insurance (100.0%), and Professional & Scientific (100.0%).
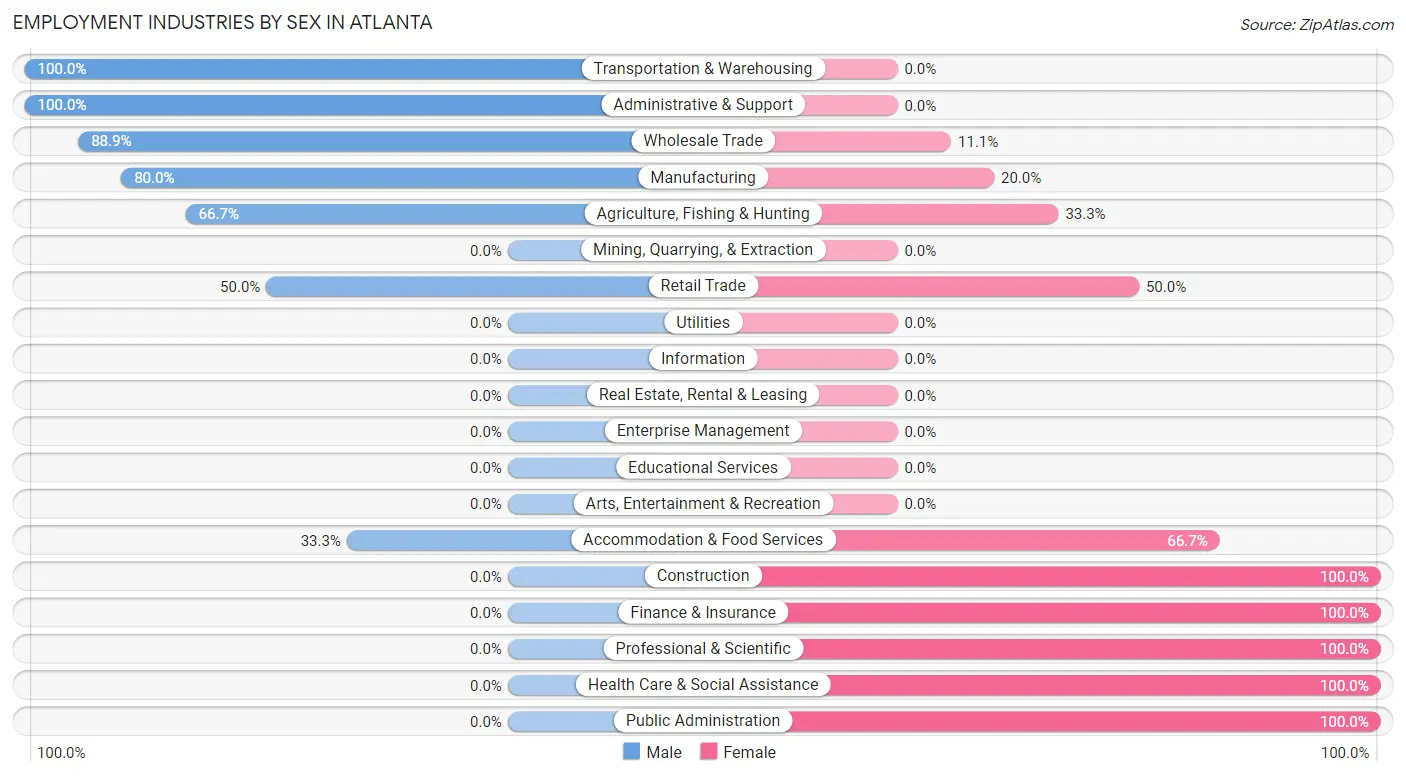
| Industry | Male | Female |
| Agriculture, Fishing & Hunting | 4 (66.7%) | 2 (33.3%) |
| Mining, Quarrying, & Extraction | 0 (0.0%) | 0 (0.0%) |
| Construction | 0 (0.0%) | 2 (100.0%) |
| Manufacturing | 8 (80.0%) | 2 (20.0%) |
| Wholesale Trade | 8 (88.9%) | 1 (11.1%) |
| Retail Trade | 1 (50.0%) | 1 (50.0%) |
| Transportation & Warehousing | 4 (100.0%) | 0 (0.0%) |
| Utilities | 0 (0.0%) | 0 (0.0%) |
| Information | 0 (0.0%) | 0 (0.0%) |
| Finance & Insurance | 0 (0.0%) | 6 (100.0%) |
| Real Estate, Rental & Leasing | 0 (0.0%) | 0 (0.0%) |
| Professional & Scientific | 0 (0.0%) | 1 (100.0%) |
| Enterprise Management | 0 (0.0%) | 0 (0.0%) |
| Administrative & Support | 1 (100.0%) | 0 (0.0%) |
| Educational Services | 0 (0.0%) | 0 (0.0%) |
| Health Care & Social Assistance | 0 (0.0%) | 14 (100.0%) |
| Arts, Entertainment & Recreation | 0 (0.0%) | 0 (0.0%) |
| Accommodation & Food Services | 1 (33.3%) | 2 (66.7%) |
| Public Administration | 0 (0.0%) | 2 (100.0%) |
| Total | 27 (45.0%) | 33 (55.0%) |
Education in Atlanta
School Enrollment in Atlanta
The most common levels of schooling among the 26 students in Atlanta are elementary school (17 | 65.4%), middle school (5 | 19.2%), and kindergarten (2 | 7.7%).

| School Level | # Students | % Students |
| Nursery / Preschool | 0 | 0.0% |
| Kindergarten | 2 | 7.7% |
| Elementary School | 17 | 65.4% |
| Middle School | 5 | 19.2% |
| High School | 2 | 7.7% |
| College / Undergraduate | 0 | 0.0% |
| Graduate / Professional | 0 | 0.0% |
| Total | 26 | 100.0% |
School Enrollment by Age by Funding Source in Atlanta
Out of a total of 26 students who are enrolled in schools in Atlanta, 2 (7.7%) attend a private institution, while the remaining 24 (92.3%) are enrolled in public schools. The age group of 5 to 9 year old has the highest likelihood of being enrolled in private schools, with 2 (15.4% in the age bracket) enrolled. Conversely, the age group of 10 to 14 year olds has the lowest likelihood of being enrolled in a private school, with 11 (100.0% in the age bracket) attending a public institution.
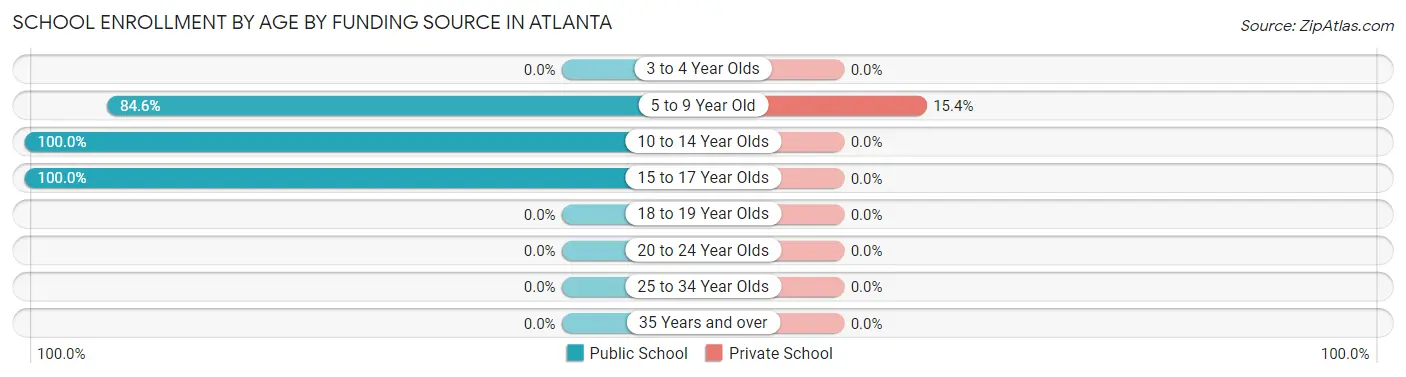
| Age Bracket | Public School | Private School |
| 3 to 4 Year Olds | 0 (0.0%) | 0 (0.0%) |
| 5 to 9 Year Old | 11 (84.6%) | 2 (15.4%) |
| 10 to 14 Year Olds | 11 (100.0%) | 0 (0.0%) |
| 15 to 17 Year Olds | 2 (100.0%) | 0 (0.0%) |
| 18 to 19 Year Olds | 0 (0.0%) | 0 (0.0%) |
| 20 to 24 Year Olds | 0 (0.0%) | 0 (0.0%) |
| 25 to 34 Year Olds | 0 (0.0%) | 0 (0.0%) |
| 35 Years and over | 0 (0.0%) | 0 (0.0%) |
| Total | 24 (92.3%) | 2 (7.7%) |
Educational Attainment by Field of Study in Atlanta
Bio, nature & agricultural (2 | 66.7%), and education (1 | 33.3%) are the most common fields of study among 3 individuals in Atlanta who have obtained a bachelor's degree or higher.
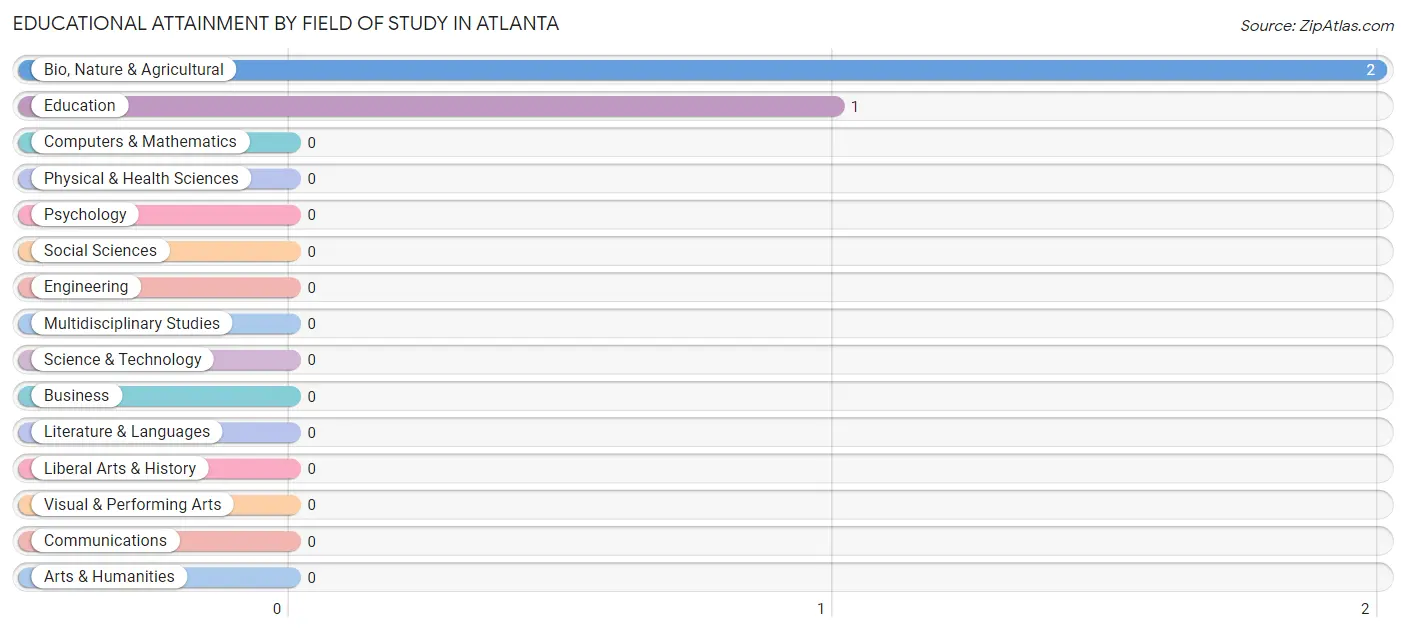
| Field of Study | # Graduates | % Graduates |
| Computers & Mathematics | 0 | 0.0% |
| Bio, Nature & Agricultural | 2 | 66.7% |
| Physical & Health Sciences | 0 | 0.0% |
| Psychology | 0 | 0.0% |
| Social Sciences | 0 | 0.0% |
| Engineering | 0 | 0.0% |
| Multidisciplinary Studies | 0 | 0.0% |
| Science & Technology | 0 | 0.0% |
| Business | 0 | 0.0% |
| Education | 1 | 33.3% |
| Literature & Languages | 0 | 0.0% |
| Liberal Arts & History | 0 | 0.0% |
| Visual & Performing Arts | 0 | 0.0% |
| Communications | 0 | 0.0% |
| Arts & Humanities | 0 | 0.0% |
| Total | 3 | 100.0% |
Transportation & Commute in Atlanta
Vehicle Availability by Sex in Atlanta
The most prevalent vehicle ownership categories in Atlanta are males with 2 vehicles (20, accounting for 76.9%) and females with 2 vehicles (21, making up 60.6%).
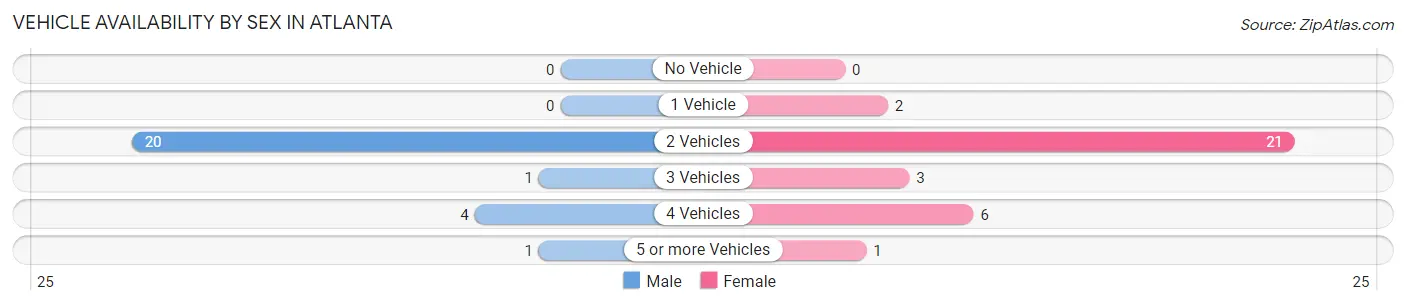
| Vehicles Available | Male | Female |
| No Vehicle | 0 (0.0%) | 0 (0.0%) |
| 1 Vehicle | 0 (0.0%) | 2 (6.1%) |
| 2 Vehicles | 20 (76.9%) | 21 (63.6%) |
| 3 Vehicles | 1 (3.8%) | 3 (9.1%) |
| 4 Vehicles | 4 (15.4%) | 6 (18.2%) |
| 5 or more Vehicles | 1 (3.8%) | 1 (3.0%) |
| Total | 26 (100.0%) | 33 (100.0%) |
Commute Time in Atlanta
The most frequently occuring commute durations in Atlanta are 10 to 14 minutes (23 commuters, 42.6%), 5 to 9 minutes (15 commuters, 27.8%), and 45 to 59 minutes (9 commuters, 16.7%).
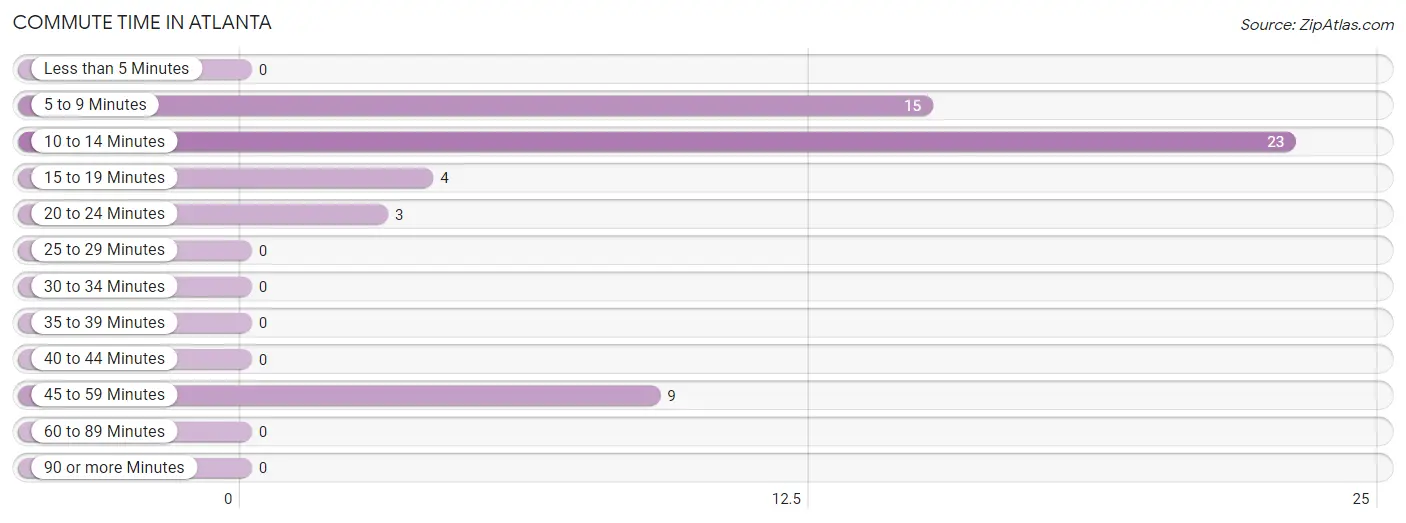
| Commute Time | # Commuters | % Commuters |
| Less than 5 Minutes | 0 | 0.0% |
| 5 to 9 Minutes | 15 | 27.8% |
| 10 to 14 Minutes | 23 | 42.6% |
| 15 to 19 Minutes | 4 | 7.4% |
| 20 to 24 Minutes | 3 | 5.6% |
| 25 to 29 Minutes | 0 | 0.0% |
| 30 to 34 Minutes | 0 | 0.0% |
| 35 to 39 Minutes | 0 | 0.0% |
| 40 to 44 Minutes | 0 | 0.0% |
| 45 to 59 Minutes | 9 | 16.7% |
| 60 to 89 Minutes | 0 | 0.0% |
| 90 or more Minutes | 0 | 0.0% |
Commute Time by Sex in Atlanta
The most common commute times in Atlanta are 5 to 9 minutes (9 commuters, 34.6%) for males and 10 to 14 minutes (14 commuters, 50.0%) for females.
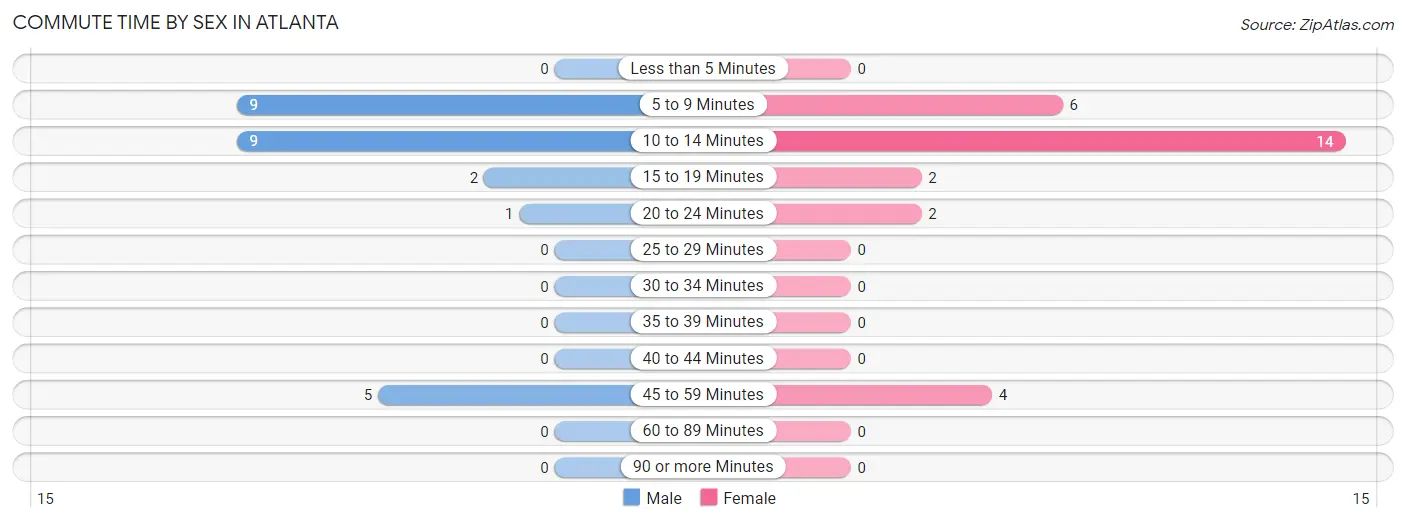
| Commute Time | Male | Female |
| Less than 5 Minutes | 0 (0.0%) | 0 (0.0%) |
| 5 to 9 Minutes | 9 (34.6%) | 6 (21.4%) |
| 10 to 14 Minutes | 9 (34.6%) | 14 (50.0%) |
| 15 to 19 Minutes | 2 (7.7%) | 2 (7.1%) |
| 20 to 24 Minutes | 1 (3.8%) | 2 (7.1%) |
| 25 to 29 Minutes | 0 (0.0%) | 0 (0.0%) |
| 30 to 34 Minutes | 0 (0.0%) | 0 (0.0%) |
| 35 to 39 Minutes | 0 (0.0%) | 0 (0.0%) |
| 40 to 44 Minutes | 0 (0.0%) | 0 (0.0%) |
| 45 to 59 Minutes | 5 (19.2%) | 4 (14.3%) |
| 60 to 89 Minutes | 0 (0.0%) | 0 (0.0%) |
| 90 or more Minutes | 0 (0.0%) | 0 (0.0%) |
Time of Departure to Work by Sex in Atlanta
The most frequent times of departure to work in Atlanta are 6:30 AM to 6:59 AM (7, 26.9%) for males and 7:30 AM to 7:59 AM (19, 67.9%) for females.
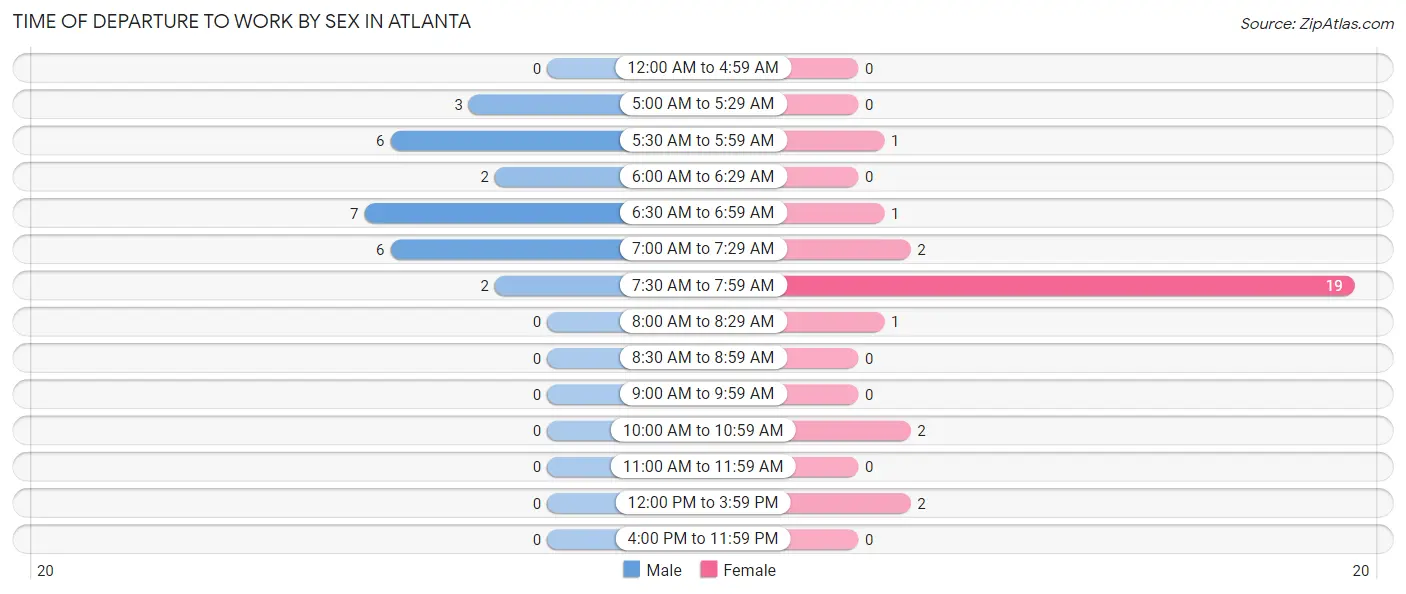
| Time of Departure | Male | Female |
| 12:00 AM to 4:59 AM | 0 (0.0%) | 0 (0.0%) |
| 5:00 AM to 5:29 AM | 3 (11.5%) | 0 (0.0%) |
| 5:30 AM to 5:59 AM | 6 (23.1%) | 1 (3.6%) |
| 6:00 AM to 6:29 AM | 2 (7.7%) | 0 (0.0%) |
| 6:30 AM to 6:59 AM | 7 (26.9%) | 1 (3.6%) |
| 7:00 AM to 7:29 AM | 6 (23.1%) | 2 (7.1%) |
| 7:30 AM to 7:59 AM | 2 (7.7%) | 19 (67.9%) |
| 8:00 AM to 8:29 AM | 0 (0.0%) | 1 (3.6%) |
| 8:30 AM to 8:59 AM | 0 (0.0%) | 0 (0.0%) |
| 9:00 AM to 9:59 AM | 0 (0.0%) | 0 (0.0%) |
| 10:00 AM to 10:59 AM | 0 (0.0%) | 2 (7.1%) |
| 11:00 AM to 11:59 AM | 0 (0.0%) | 0 (0.0%) |
| 12:00 PM to 3:59 PM | 0 (0.0%) | 2 (7.1%) |
| 4:00 PM to 11:59 PM | 0 (0.0%) | 0 (0.0%) |
| Total | 26 (100.0%) | 28 (100.0%) |
Housing Occupancy in Atlanta
Occupancy by Ownership in Atlanta
Of the total 46 dwellings in Atlanta, owner-occupied units account for 46 (100.0%), while renter-occupied units make up 0 (0.0%).
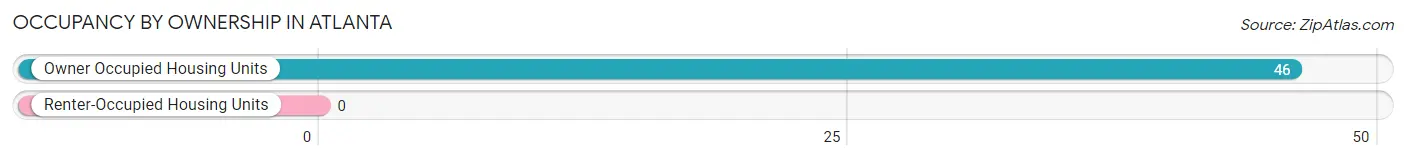
| Occupancy | # Housing Units | % Housing Units |
| Owner Occupied Housing Units | 46 | 100.0% |
| Renter-Occupied Housing Units | 0 | 0.0% |
| Total Occupied Housing Units | 46 | 100.0% |
Occupancy by Household Size in Atlanta
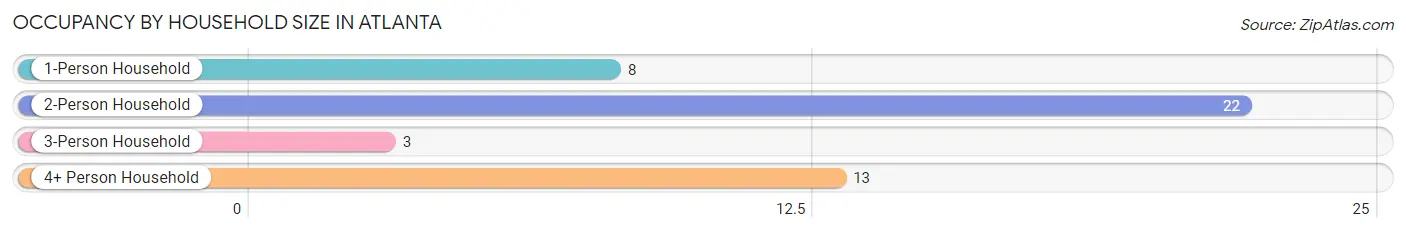
| Household Size | # Housing Units | % Housing Units |
| 1-Person Household | 8 | 17.4% |
| 2-Person Household | 22 | 47.8% |
| 3-Person Household | 3 | 6.5% |
| 4+ Person Household | 13 | 28.3% |
| Total Housing Units | 46 | 100.0% |
Occupancy by Ownership by Household Size in Atlanta
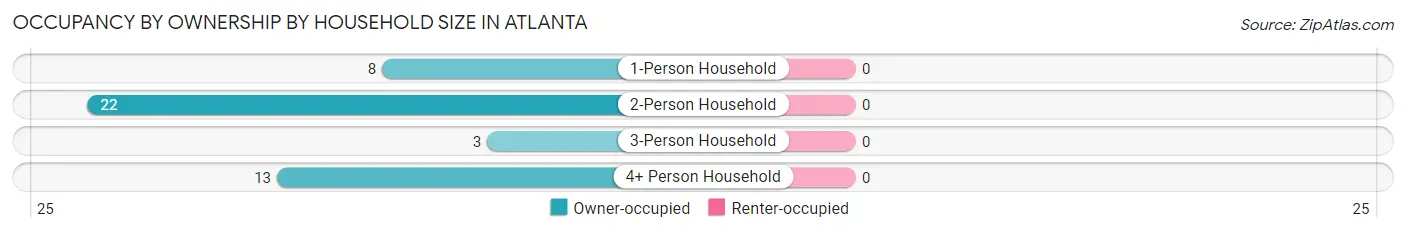
| Household Size | Owner-occupied | Renter-occupied |
| 1-Person Household | 8 (100.0%) | 0 (0.0%) |
| 2-Person Household | 22 (100.0%) | 0 (0.0%) |
| 3-Person Household | 3 (100.0%) | 0 (0.0%) |
| 4+ Person Household | 13 (100.0%) | 0 (0.0%) |
| Total Housing Units | 46 (100.0%) | 0 (0.0%) |
Occupancy by Educational Attainment in Atlanta
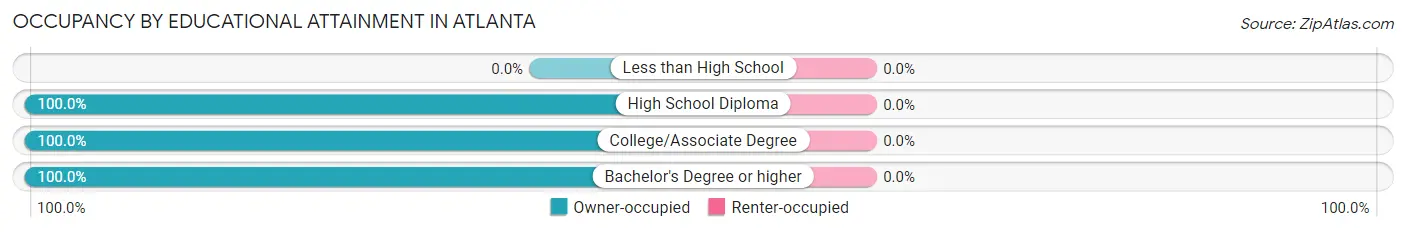
| Household Size | Owner-occupied | Renter-occupied |
| Less than High School | 0 (0.0%) | 0 (0.0%) |
| High School Diploma | 30 (100.0%) | 0 (0.0%) |
| College/Associate Degree | 13 (100.0%) | 0 (0.0%) |
| Bachelor's Degree or higher | 3 (100.0%) | 0 (0.0%) |
Occupancy by Age of Householder in Atlanta
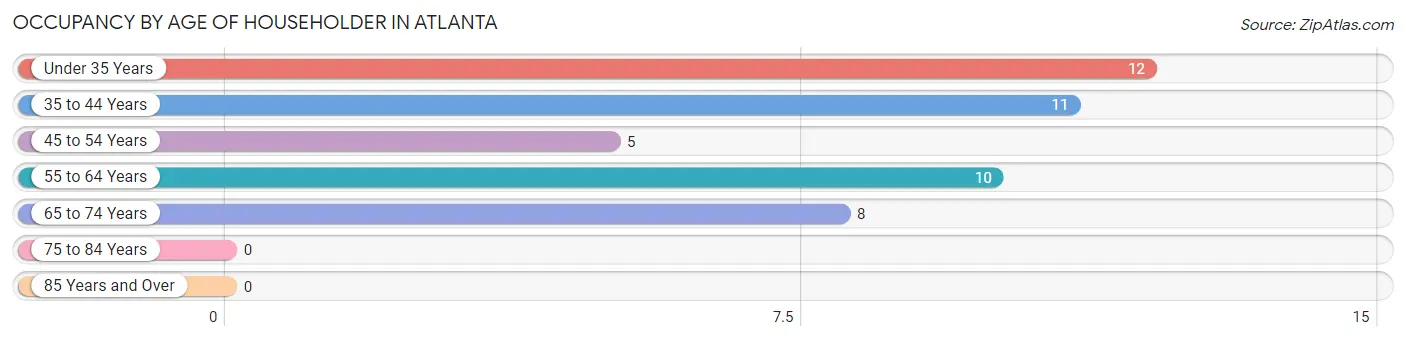
| Age Bracket | # Households | % Households |
| Under 35 Years | 12 | 26.1% |
| 35 to 44 Years | 11 | 23.9% |
| 45 to 54 Years | 5 | 10.9% |
| 55 to 64 Years | 10 | 21.7% |
| 65 to 74 Years | 8 | 17.4% |
| 75 to 84 Years | 0 | 0.0% |
| 85 Years and Over | 0 | 0.0% |
| Total | 46 | 100.0% |
Housing Finances in Atlanta
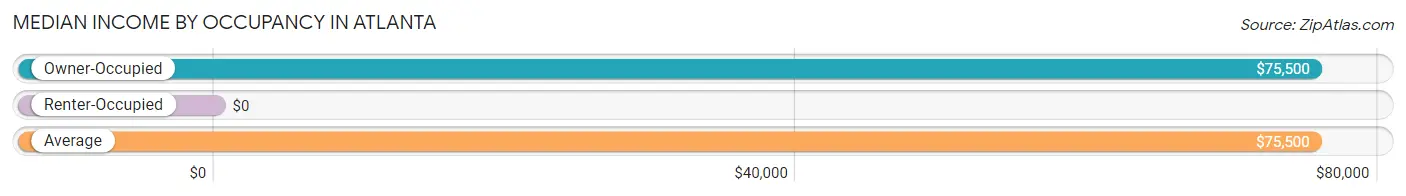
Median Income by Occupancy in Atlanta
| Occupancy Type | # Households | Median Income |
| Owner-Occupied | 46 (100.0%) | $75,500 |
| Renter-Occupied | 0 (0.0%) | $0 |
| Average | 46 (100.0%) | $75,500 |
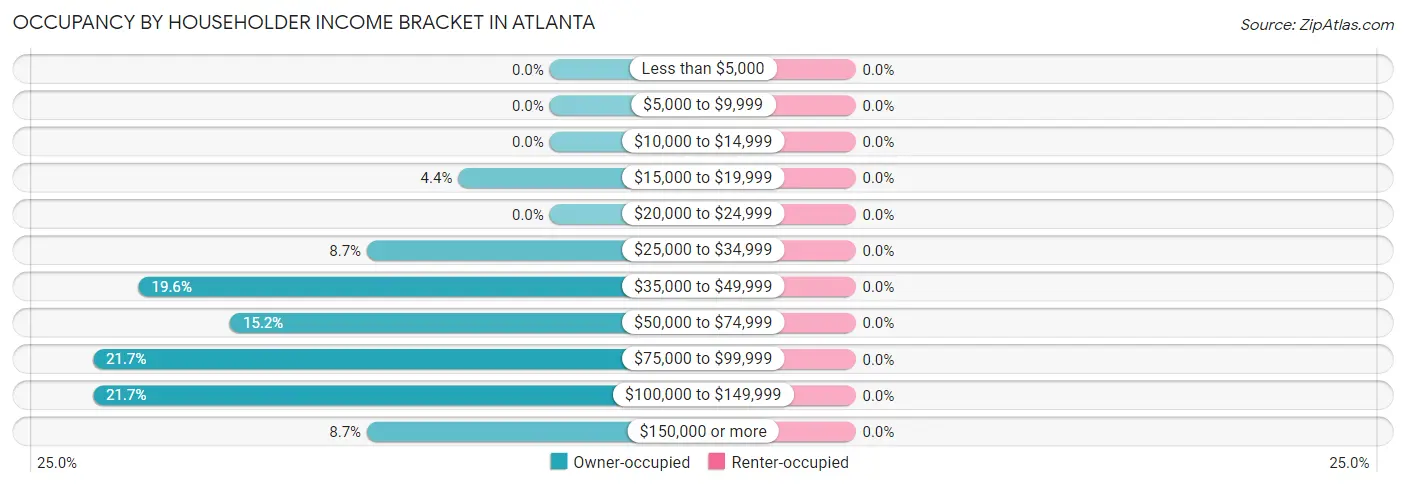
Occupancy by Householder Income Bracket in Atlanta
| Income Bracket | Owner-occupied | Renter-occupied |
| Less than $5,000 | 0 (0.0%) | 0 (0.0%) |
| $5,000 to $9,999 | 0 (0.0%) | 0 (0.0%) |
| $10,000 to $14,999 | 0 (0.0%) | 0 (0.0%) |
| $15,000 to $19,999 | 2 (4.3%) | 0 (0.0%) |
| $20,000 to $24,999 | 0 (0.0%) | 0 (0.0%) |
| $25,000 to $34,999 | 4 (8.7%) | 0 (0.0%) |
| $35,000 to $49,999 | 9 (19.6%) | 0 (0.0%) |
| $50,000 to $74,999 | 7 (15.2%) | 0 (0.0%) |
| $75,000 to $99,999 | 10 (21.7%) | 0 (0.0%) |
| $100,000 to $149,999 | 10 (21.7%) | 0 (0.0%) |
| $150,000 or more | 4 (8.7%) | 0 (0.0%) |
| Total | 46 (100.0%) | 0 (0.0%) |
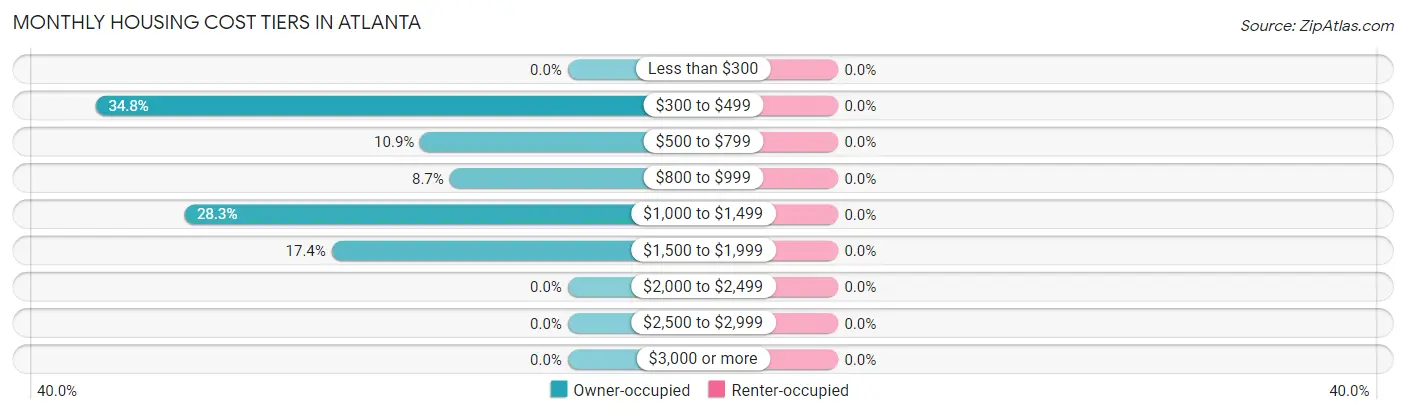
Monthly Housing Cost Tiers in Atlanta
| Monthly Cost | Owner-occupied | Renter-occupied |
| Less than $300 | 0 (0.0%) | 0 (0.0%) |
| $300 to $499 | 16 (34.8%) | 0 (0.0%) |
| $500 to $799 | 5 (10.9%) | 0 (0.0%) |
| $800 to $999 | 4 (8.7%) | 0 (0.0%) |
| $1,000 to $1,499 | 13 (28.3%) | 0 (0.0%) |
| $1,500 to $1,999 | 8 (17.4%) | 0 (0.0%) |
| $2,000 to $2,499 | 0 (0.0%) | 0 (0.0%) |
| $2,500 to $2,999 | 0 (0.0%) | 0 (0.0%) |
| $3,000 or more | 0 (0.0%) | 0 (0.0%) |
| Total | 46 (100.0%) | 0 (0.0%) |
Physical Housing Characteristics in Atlanta
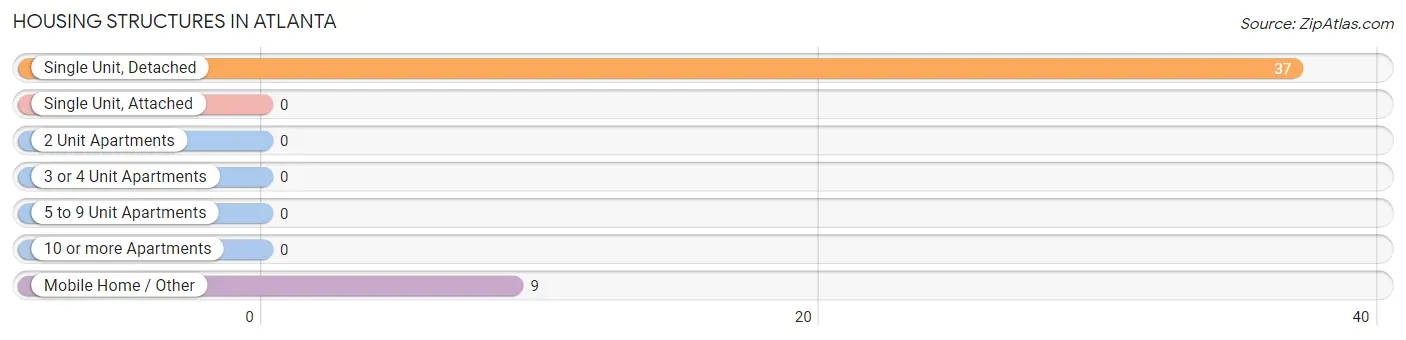
Housing Structures in Atlanta
| Structure Type | # Housing Units | % Housing Units |
| Single Unit, Detached | 37 | 80.4% |
| Single Unit, Attached | 0 | 0.0% |
| 2 Unit Apartments | 0 | 0.0% |
| 3 or 4 Unit Apartments | 0 | 0.0% |
| 5 to 9 Unit Apartments | 0 | 0.0% |
| 10 or more Apartments | 0 | 0.0% |
| Mobile Home / Other | 9 | 19.6% |
| Total | 46 | 100.0% |
Housing Structures by Occupancy in Atlanta
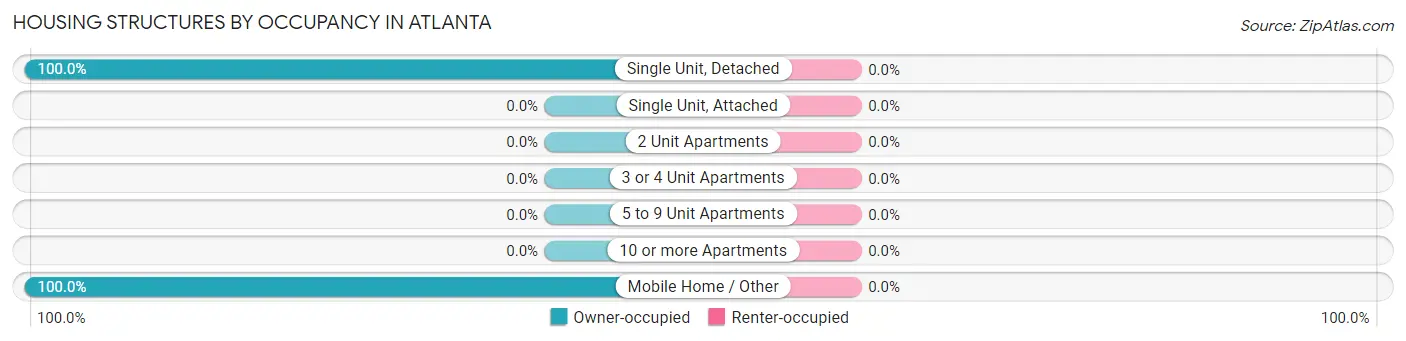
| Structure Type | Owner-occupied | Renter-occupied |
| Single Unit, Detached | 37 (100.0%) | 0 (0.0%) |
| Single Unit, Attached | 0 (0.0%) | 0 (0.0%) |
| 2 Unit Apartments | 0 (0.0%) | 0 (0.0%) |
| 3 or 4 Unit Apartments | 0 (0.0%) | 0 (0.0%) |
| 5 to 9 Unit Apartments | 0 (0.0%) | 0 (0.0%) |
| 10 or more Apartments | 0 (0.0%) | 0 (0.0%) |
| Mobile Home / Other | 9 (100.0%) | 0 (0.0%) |
| Total | 46 (100.0%) | 0 (0.0%) |
Housing Structures by Number of Rooms in Atlanta
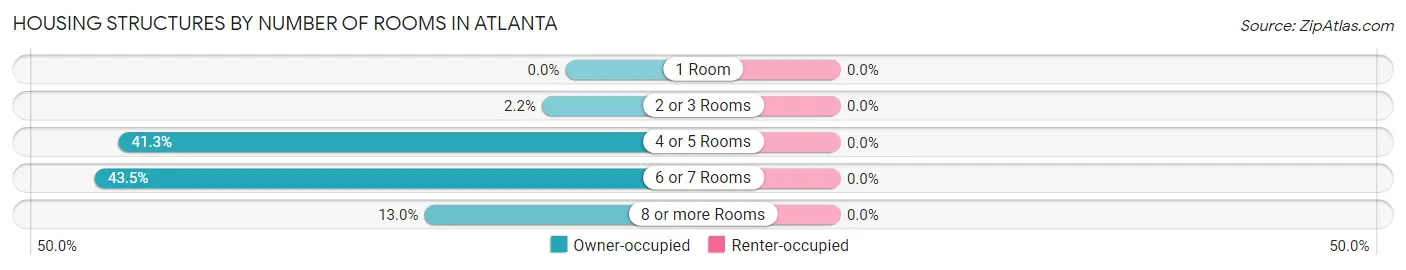
| Number of Rooms | Owner-occupied | Renter-occupied |
| 1 Room | 0 (0.0%) | 0 (0.0%) |
| 2 or 3 Rooms | 1 (2.2%) | 0 (0.0%) |
| 4 or 5 Rooms | 19 (41.3%) | 0 (0.0%) |
| 6 or 7 Rooms | 20 (43.5%) | 0 (0.0%) |
| 8 or more Rooms | 6 (13.0%) | 0 (0.0%) |
| Total | 46 (100.0%) | 0 (0.0%) |
Housing Structure by Heating Type in Atlanta

| Heating Type | Owner-occupied | Renter-occupied |
| Utility Gas | 13 (28.3%) | 0 (0.0%) |
| Bottled, Tank, or LP Gas | 10 (21.7%) | 0 (0.0%) |
| Electricity | 23 (50.0%) | 0 (0.0%) |
| Fuel Oil or Kerosene | 0 (0.0%) | 0 (0.0%) |
| Coal or Coke | 0 (0.0%) | 0 (0.0%) |
| All other Fuels | 0 (0.0%) | 0 (0.0%) |
| No Fuel Used | 0 (0.0%) | 0 (0.0%) |
| Total | 46 (100.0%) | 0 (0.0%) |
Household Vehicle Usage in Atlanta
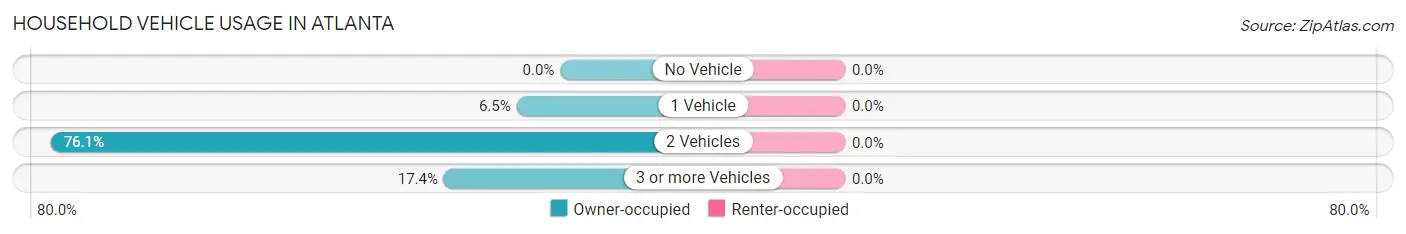
| Vehicles per Household | Owner-occupied | Renter-occupied |
| No Vehicle | 0 (0.0%) | 0 (0.0%) |
| 1 Vehicle | 3 (6.5%) | 0 (0.0%) |
| 2 Vehicles | 35 (76.1%) | 0 (0.0%) |
| 3 or more Vehicles | 8 (17.4%) | 0 (0.0%) |
| Total | 46 (100.0%) | 0 (0.0%) |
Real Estate & Mortgages in Atlanta
Real Estate and Mortgage Overview in Atlanta
| Characteristic | Without Mortgage | With Mortgage |
| Housing Units | 20 | 26 |
| Median Property Value | - | - |
| Median Household Income | $41,875 | $4 |
| Monthly Housing Costs | $333 | $0 |
| Real Estate Taxes | $1,667 | $0 |
Property Value by Mortgage Status in Atlanta
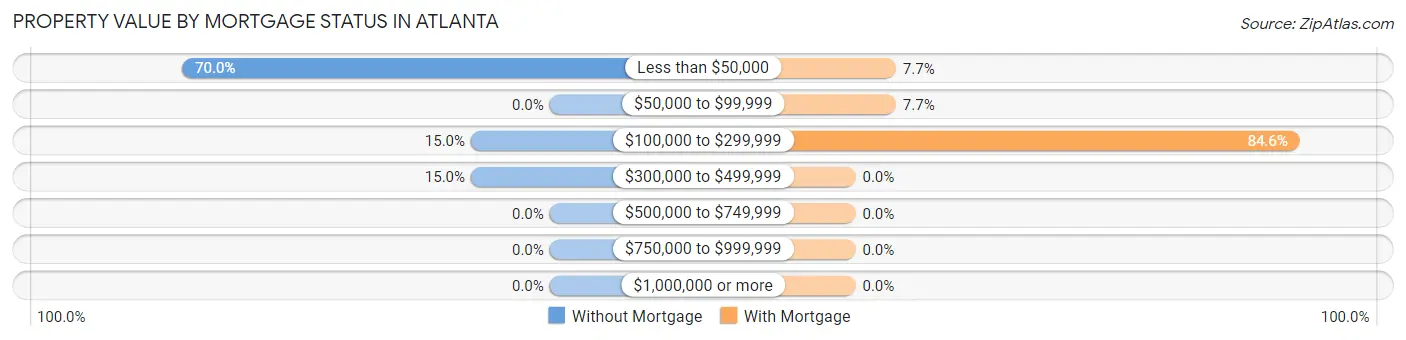
| Property Value | Without Mortgage | With Mortgage |
| Less than $50,000 | 14 (70.0%) | 2 (7.7%) |
| $50,000 to $99,999 | 0 (0.0%) | 2 (7.7%) |
| $100,000 to $299,999 | 3 (15.0%) | 22 (84.6%) |
| $300,000 to $499,999 | 3 (15.0%) | 0 (0.0%) |
| $500,000 to $749,999 | 0 (0.0%) | 0 (0.0%) |
| $750,000 to $999,999 | 0 (0.0%) | 0 (0.0%) |
| $1,000,000 or more | 0 (0.0%) | 0 (0.0%) |
| Total | 20 (100.0%) | 26 (100.0%) |
Household Income by Mortgage Status in Atlanta
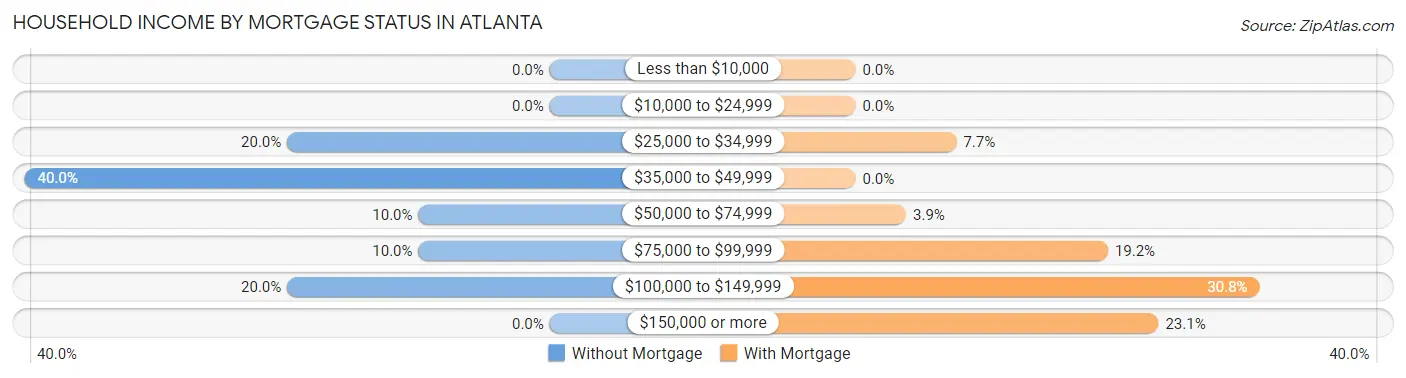
| Household Income | Without Mortgage | With Mortgage |
| Less than $10,000 | 0 (0.0%) | 0 (0.0%) |
| $10,000 to $24,999 | 0 (0.0%) | 0 (0.0%) |
| $25,000 to $34,999 | 4 (20.0%) | 2 (7.7%) |
| $35,000 to $49,999 | 8 (40.0%) | 0 (0.0%) |
| $50,000 to $74,999 | 2 (10.0%) | 1 (3.8%) |
| $75,000 to $99,999 | 2 (10.0%) | 5 (19.2%) |
| $100,000 to $149,999 | 4 (20.0%) | 8 (30.8%) |
| $150,000 or more | 0 (0.0%) | 6 (23.1%) |
| Total | 20 (100.0%) | 26 (100.0%) |
Property Value to Household Income Ratio in Atlanta
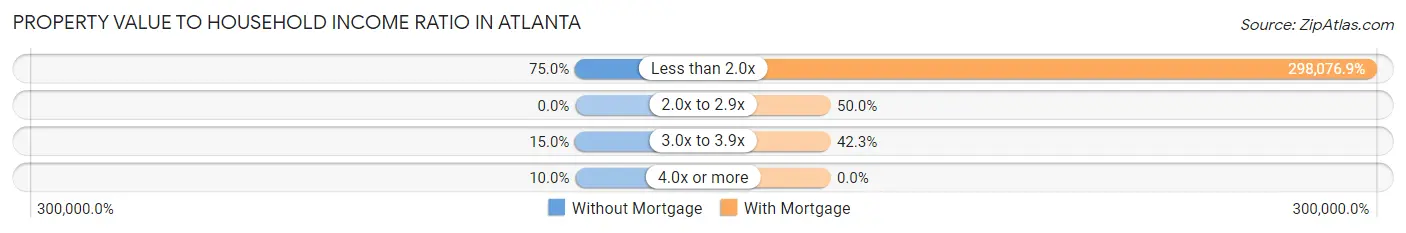
| Value-to-Income Ratio | Without Mortgage | With Mortgage |
| Less than 2.0x | 15 (75.0%) | 77,500 (298,076.9%) |
| 2.0x to 2.9x | 0 (0.0%) | 13 (50.0%) |
| 3.0x to 3.9x | 3 (15.0%) | 11 (42.3%) |
| 4.0x or more | 2 (10.0%) | 0 (0.0%) |
| Total | 20 (100.0%) | 26 (100.0%) |
Real Estate Taxes by Mortgage Status in Atlanta
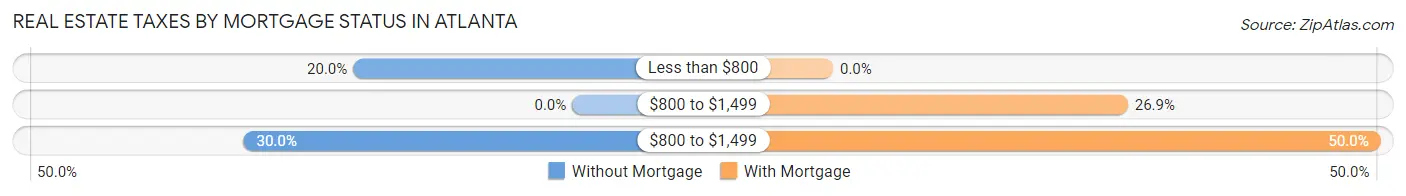
| Property Taxes | Without Mortgage | With Mortgage |
| Less than $800 | 4 (20.0%) | 0 (0.0%) |
| $800 to $1,499 | 0 (0.0%) | 7 (26.9%) |
| $800 to $1,499 | 6 (30.0%) | 13 (50.0%) |
| Total | 20 (100.0%) | 26 (100.0%) |
Health & Disability in Atlanta
Health Insurance Coverage by Age in Atlanta
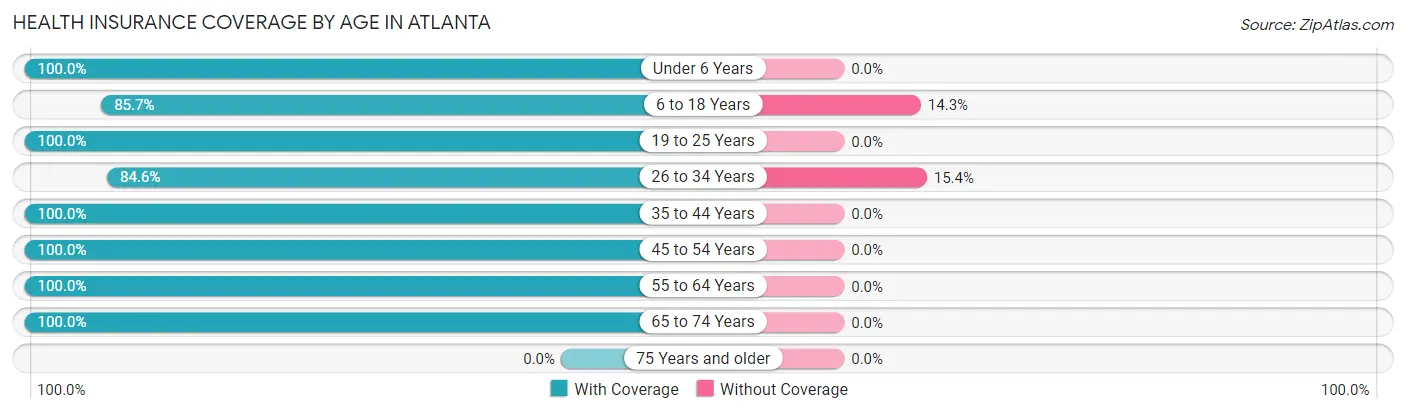
| Age Bracket | With Coverage | Without Coverage |
| Under 6 Years | 12 (100.0%) | 0 (0.0%) |
| 6 to 18 Years | 24 (85.7%) | 4 (14.3%) |
| 19 to 25 Years | 4 (100.0%) | 0 (0.0%) |
| 26 to 34 Years | 22 (84.6%) | 4 (15.4%) |
| 35 to 44 Years | 11 (100.0%) | 0 (0.0%) |
| 45 to 54 Years | 12 (100.0%) | 0 (0.0%) |
| 55 to 64 Years | 16 (100.0%) | 0 (0.0%) |
| 65 to 74 Years | 15 (100.0%) | 0 (0.0%) |
| 75 Years and older | 0 (0.0%) | 0 (0.0%) |
| Total | 116 (93.5%) | 8 (6.5%) |
Health Insurance Coverage by Citizenship Status in Atlanta
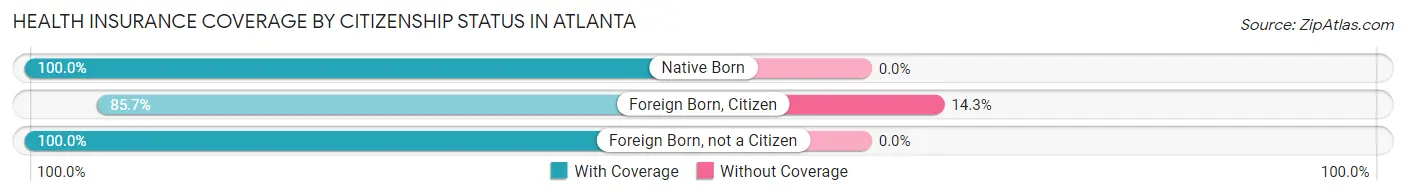
| Citizenship Status | With Coverage | Without Coverage |
| Native Born | 12 (100.0%) | 0 (0.0%) |
| Foreign Born, Citizen | 24 (85.7%) | 4 (14.3%) |
| Foreign Born, not a Citizen | 4 (100.0%) | 0 (0.0%) |
Health Insurance Coverage by Household Income in Atlanta
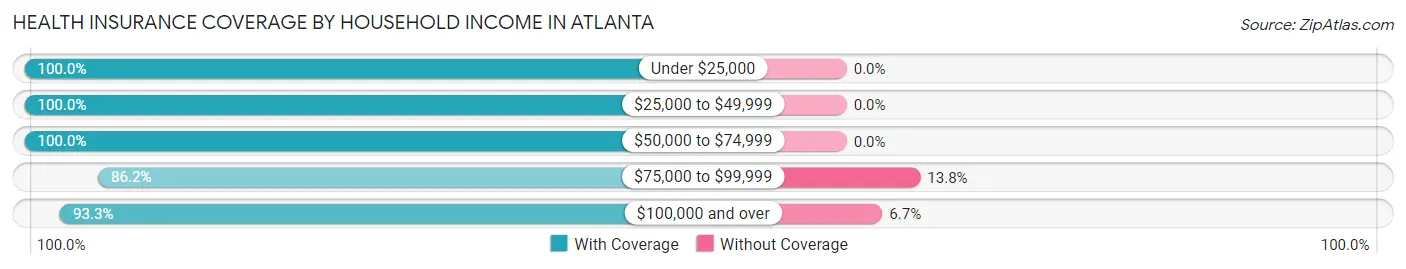
| Household Income | With Coverage | Without Coverage |
| Under $25,000 | 2 (100.0%) | 0 (0.0%) |
| $25,000 to $49,999 | 18 (100.0%) | 0 (0.0%) |
| $50,000 to $74,999 | 15 (100.0%) | 0 (0.0%) |
| $75,000 to $99,999 | 25 (86.2%) | 4 (13.8%) |
| $100,000 and over | 56 (93.3%) | 4 (6.7%) |
Public vs Private Health Insurance Coverage by Age in Atlanta
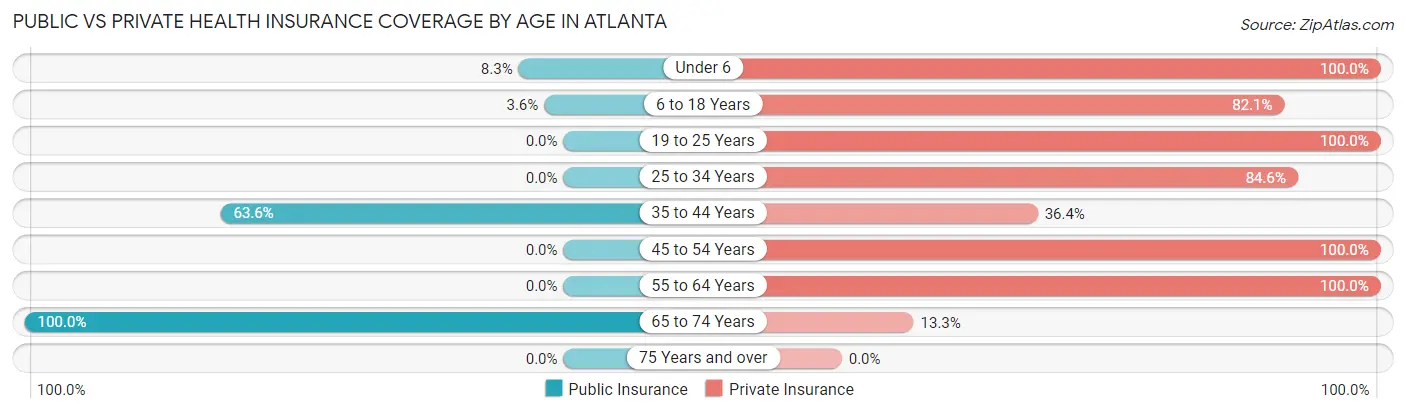
| Age Bracket | Public Insurance | Private Insurance |
| Under 6 | 1 (8.3%) | 12 (100.0%) |
| 6 to 18 Years | 1 (3.6%) | 23 (82.1%) |
| 19 to 25 Years | 0 (0.0%) | 4 (100.0%) |
| 25 to 34 Years | 0 (0.0%) | 22 (84.6%) |
| 35 to 44 Years | 7 (63.6%) | 4 (36.4%) |
| 45 to 54 Years | 0 (0.0%) | 12 (100.0%) |
| 55 to 64 Years | 0 (0.0%) | 16 (100.0%) |
| 65 to 74 Years | 15 (100.0%) | 2 (13.3%) |
| 75 Years and over | 0 (0.0%) | 0 (0.0%) |
| Total | 24 (19.4%) | 95 (76.6%) |
Disability Status by Sex by Age in Atlanta
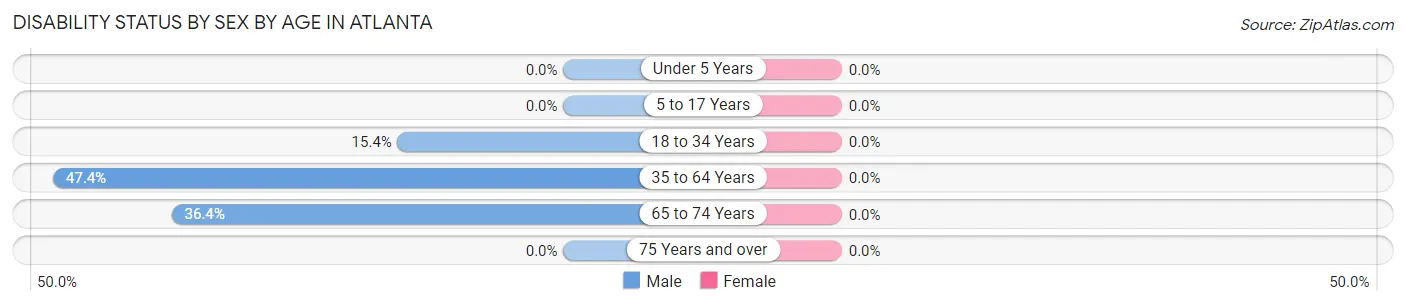
| Age Bracket | Male | Female |
| Under 5 Years | 0 (0.0%) | 0 (0.0%) |
| 5 to 17 Years | 0 (0.0%) | 0 (0.0%) |
| 18 to 34 Years | 2 (15.4%) | 0 (0.0%) |
| 35 to 64 Years | 9 (47.4%) | 0 (0.0%) |
| 65 to 74 Years | 4 (36.4%) | 0 (0.0%) |
| 75 Years and over | 0 (0.0%) | 0 (0.0%) |
Disability Class by Sex by Age in Atlanta
Disability Class: Hearing Difficulty
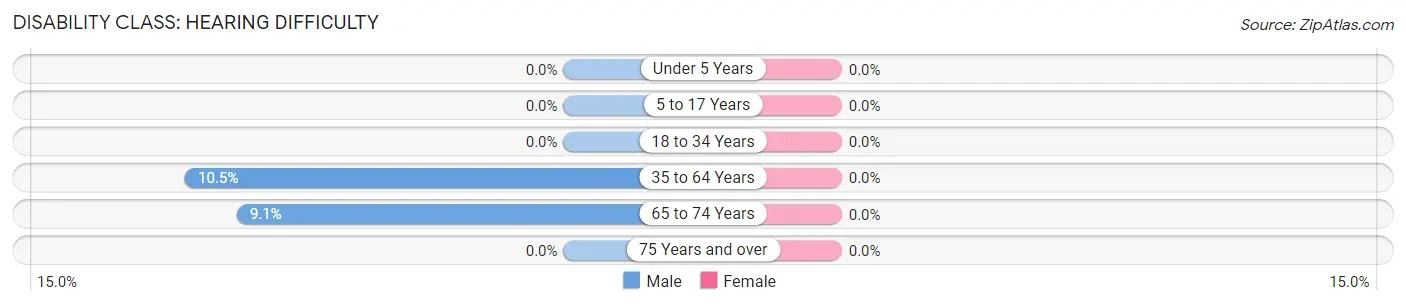
| Age Bracket | Male | Female |
| Under 5 Years | 0 (0.0%) | 0 (0.0%) |
| 5 to 17 Years | 0 (0.0%) | 0 (0.0%) |
| 18 to 34 Years | 0 (0.0%) | 0 (0.0%) |
| 35 to 64 Years | 2 (10.5%) | 0 (0.0%) |
| 65 to 74 Years | 1 (9.1%) | 0 (0.0%) |
| 75 Years and over | 0 (0.0%) | 0 (0.0%) |
Disability Class: Vision Difficulty
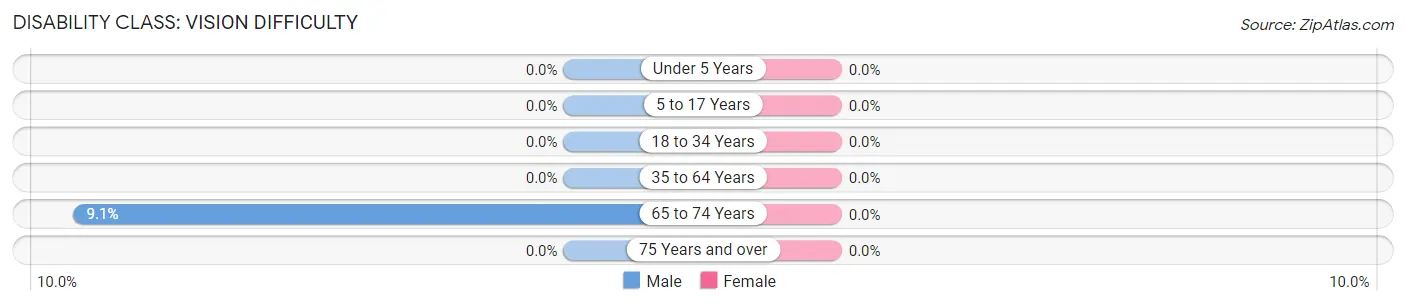
| Age Bracket | Male | Female |
| Under 5 Years | 0 (0.0%) | 0 (0.0%) |
| 5 to 17 Years | 0 (0.0%) | 0 (0.0%) |
| 18 to 34 Years | 0 (0.0%) | 0 (0.0%) |
| 35 to 64 Years | 0 (0.0%) | 0 (0.0%) |
| 65 to 74 Years | 1 (9.1%) | 0 (0.0%) |
| 75 Years and over | 0 (0.0%) | 0 (0.0%) |
Disability Class: Cognitive Difficulty
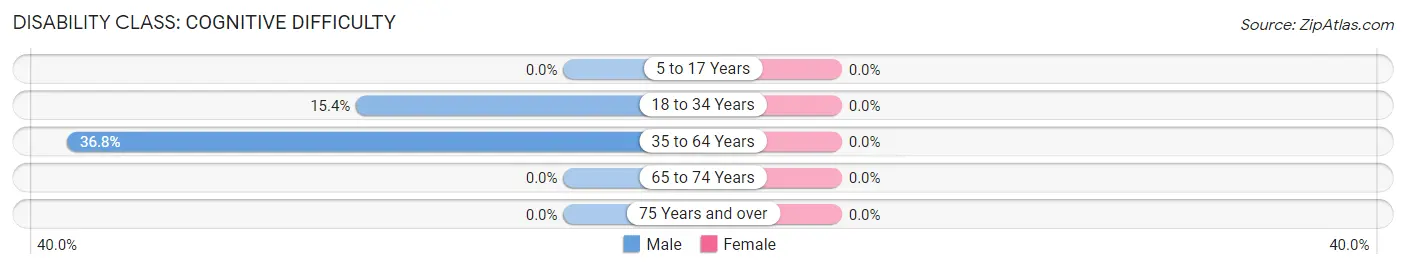
| Age Bracket | Male | Female |
| 5 to 17 Years | 0 (0.0%) | 0 (0.0%) |
| 18 to 34 Years | 2 (15.4%) | 0 (0.0%) |
| 35 to 64 Years | 7 (36.8%) | 0 (0.0%) |
| 65 to 74 Years | 0 (0.0%) | 0 (0.0%) |
| 75 Years and over | 0 (0.0%) | 0 (0.0%) |
Disability Class: Ambulatory Difficulty
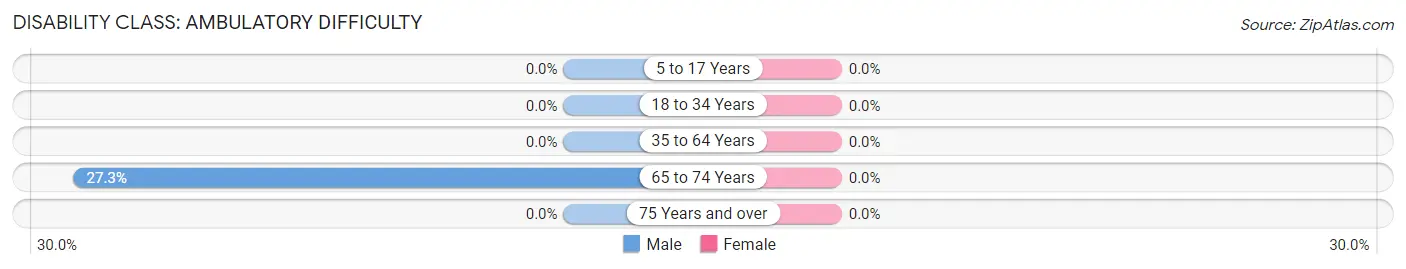
| Age Bracket | Male | Female |
| 5 to 17 Years | 0 (0.0%) | 0 (0.0%) |
| 18 to 34 Years | 0 (0.0%) | 0 (0.0%) |
| 35 to 64 Years | 0 (0.0%) | 0 (0.0%) |
| 65 to 74 Years | 3 (27.3%) | 0 (0.0%) |
| 75 Years and over | 0 (0.0%) | 0 (0.0%) |
Disability Class: Self-Care Difficulty
| Age Bracket | Male | Female |
| 5 to 17 Years | 0 (0.0%) | 0 (0.0%) |
| 18 to 34 Years | 0 (0.0%) | 0 (0.0%) |
| 35 to 64 Years | 0 (0.0%) | 0 (0.0%) |
| 65 to 74 Years | 0 (0.0%) | 0 (0.0%) |
| 75 Years and over | 0 (0.0%) | 0 (0.0%) |
Technology Access in Atlanta
Computing Device Access in Atlanta
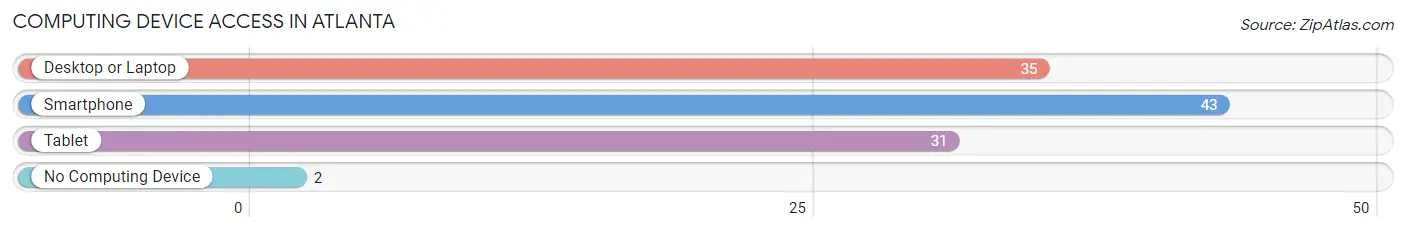
| Device Type | # Households | % Households |
| Desktop or Laptop | 35 | 76.1% |
| Smartphone | 43 | 93.5% |
| Tablet | 31 | 67.4% |
| No Computing Device | 2 | 4.3% |
| Total | 46 | 100.0% |
Internet Access in Atlanta
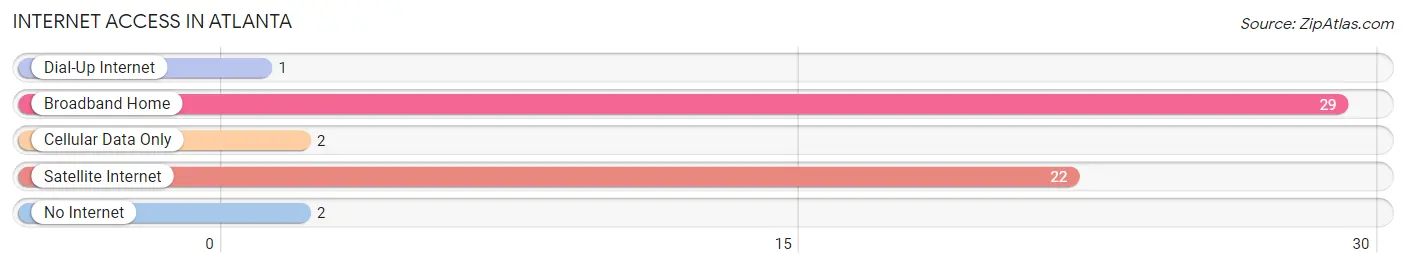
| Internet Type | # Households | % Households |
| Dial-Up Internet | 1 | 2.2% |
| Broadband Home | 29 | 63.0% |
| Cellular Data Only | 2 | 4.3% |
| Satellite Internet | 22 | 47.8% |
| No Internet | 2 | 4.3% |
| Total | 46 | 100.0% |
Atlanta Summary
Atlanta is the capital and most populous city in the U.S. state of Georgia. It is the cultural and economic center of the Atlanta metropolitan area, home to more than 6 million people and the ninth-largest metropolitan area in the United States. Atlanta is the county seat of Fulton County, and a small portion of the city extends eastward into DeKalb County.
History
The area that is now Atlanta was originally inhabited by the Creek and Cherokee Native American tribes. In 1837, the city of Atlanta was founded at the intersection of two railroad lines, and the city rose from the ashes of the American Civil War to become a national center of commerce. In the decades following the Civil War, the city earned a reputation as the "New South" capital of the United States.
In the 1950s, the city's economy began to diversify, and it became a major center for finance, transportation, and technology. In the 1960s, Atlanta became a major center of the civil rights movement, with Martin Luther King Jr. and other civil rights leaders having a major impact on the city.
Geography
Atlanta is located in the foothills of the Appalachian Mountains, at the southern end of the Appalachian Trail. The city is situated among rolling hills and dense forests, and is the largest city in the state of Georgia. The city is divided into several distinct neighborhoods, including Downtown, Midtown, Buckhead, and East Atlanta.
The city is home to several major parks, including Piedmont Park, Grant Park, and Centennial Olympic Park. The city is also home to the world's largest indoor aquarium, the Georgia Aquarium.
Economy
Atlanta is a major economic center in the Southeast, and is home to several Fortune 500 companies, including The Home Depot, Delta Air Lines, and Coca-Cola. The city is also home to several major universities, including Georgia Tech, Emory University, and Georgia State University.
The city's economy is largely driven by the service industry, with tourism, finance, and technology being major contributors. The city is also home to several major conventions and trade shows, including the annual Dragon Con and the Atlanta International Auto Show.
Demographics
As of the 2010 census, the population of Atlanta was 420,003. The city is racially diverse, with African Americans making up 54.0% of the population, whites making up 38.4%, and Hispanics making up 5.2%. The median household income in the city is $47,811, and the median age is 33.7 years.
Atlanta is home to a large LGBT community, with an estimated 10.7% of the population identifying as LGBT. The city is also home to a large immigrant population, with an estimated 11.2% of the population being foreign-born.
Common Questions
What is Per Capita Income in Atlanta?
Per Capita income in Atlanta is $34,347.
What is the Median Family Income in Atlanta?
Median Family Income in Atlanta is $77,250.
What is the Median Household income in Atlanta?
Median Household Income in Atlanta is $75,500.
What is Income or Wage Gap in Atlanta?
Income or Wage Gap in Atlanta is 29.7%.
Women in Atlanta earn 70.3 cents for every dollar earned by a man.
What is Inequality or Gini Index in Atlanta?
Inequality or Gini Index in Atlanta is 0.33.
What is the Total Population of Atlanta?
Total Population of Atlanta is 124.
What is the Total Male Population of Atlanta?
Total Male Population of Atlanta is 60.
What is the Total Female Population of Atlanta?
Total Female Population of Atlanta is 64.
What is the Ratio of Males per 100 Females in Atlanta?
There are 93.75 Males per 100 Females in Atlanta.
What is the Ratio of Females per 100 Males in Atlanta?
There are 106.67 Females per 100 Males in Atlanta.
What is the Median Population Age in Atlanta?
Median Population Age in Atlanta is 33.3 Years.
What is the Average Family Size in Atlanta
Average Family Size in Atlanta is 3.1 People.
What is the Average Household Size in Atlanta
Average Household Size in Atlanta is 2.7 People.
How Large is the Labor Force in Atlanta?
There are 60 People in the Labor Forcein in Atlanta.
What is the Percentage of People in the Labor Force in Atlanta?
69.8% of People are in the Labor Force in Atlanta.