Ashland, NE Map & Demographics
Ashland Map
Ashland Overview
$34,746
PER CAPITA INCOME
$100,658
AVG FAMILY INCOME
$78,966
AVG HOUSEHOLD INCOME
12.1%
WAGE / INCOME GAP [ % ]
87.9¢/ $1
WAGE / INCOME GAP [ $ ]
0.34
INEQUALITY / GINI INDEX
3,130
TOTAL POPULATION
1,438
MALE POPULATION
1,692
FEMALE POPULATION
84.99
MALES / 100 FEMALES
117.66
FEMALES / 100 MALES
37.0
MEDIAN AGE
3.1
AVG FAMILY SIZE
2.4
AVG HOUSEHOLD SIZE
1,717
LABOR FORCE [ PEOPLE ]
69.7%
PERCENT IN LABOR FORCE
5.0%
UNEMPLOYMENT RATE
Ashland Zip Codes
Ashland Area Codes
Income in Ashland
Income Overview in Ashland
Per Capita Income in Ashland is $34,746, while median incomes of families and households are $100,658 and $78,966 respectively.
| Characteristic | Number | Measure |
| Per Capita Income | 3,130 | $34,746 |
| Median Family Income | 816 | $100,658 |
| Mean Family Income | 816 | $105,269 |
| Median Household Income | 1,263 | $78,966 |
| Mean Household Income | 1,263 | $83,954 |
| Income Deficit | 816 | $0 |
| Wage / Income Gap (%) | 3,130 | 12.08% |
| Wage / Income Gap ($) | 3,130 | 87.92¢ per $1 |
| Gini / Inequality Index | 3,130 | 0.34 |
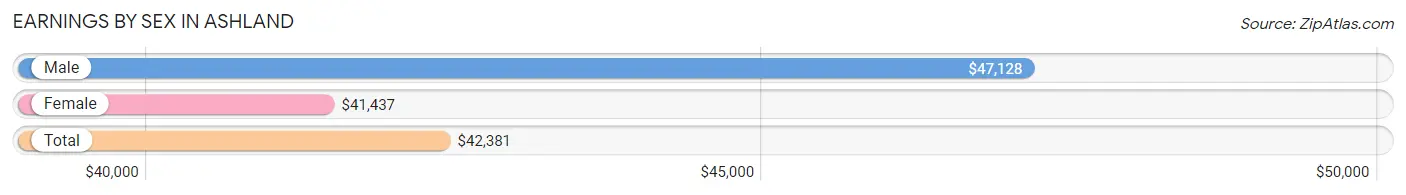
Earnings by Sex in Ashland
Average Earnings in Ashland are $42,381, $47,128 for men and $41,437 for women, a difference of 12.1%.
| Sex | Number | Average Earnings |
| Male | 901 (51.0%) | $47,128 |
| Female | 866 (49.0%) | $41,437 |
| Total | 1,767 (100.0%) | $42,381 |
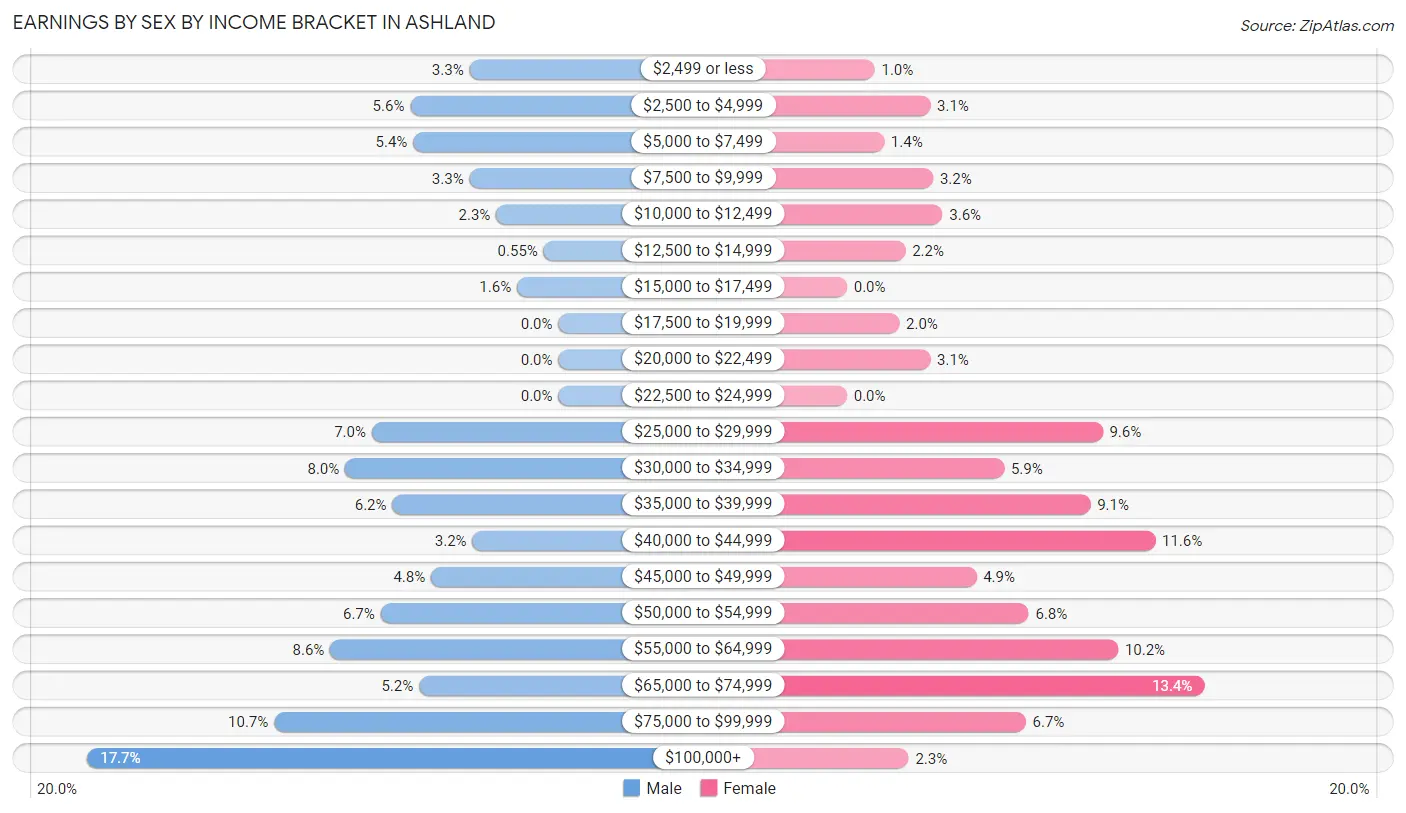
Earnings by Sex by Income Bracket in Ashland
The most common earnings brackets in Ashland are $100,000+ for men (159 | 17.6%) and $65,000 to $74,999 for women (116 | 13.4%).
| Income | Male | Female |
| $2,499 or less | 30 (3.3%) | 9 (1.0%) |
| $2,500 to $4,999 | 50 (5.6%) | 27 (3.1%) |
| $5,000 to $7,499 | 49 (5.4%) | 12 (1.4%) |
| $7,500 to $9,999 | 30 (3.3%) | 28 (3.2%) |
| $10,000 to $12,499 | 21 (2.3%) | 31 (3.6%) |
| $12,500 to $14,999 | 5 (0.5%) | 19 (2.2%) |
| $15,000 to $17,499 | 14 (1.5%) | 0 (0.0%) |
| $17,500 to $19,999 | 0 (0.0%) | 17 (2.0%) |
| $20,000 to $22,499 | 0 (0.0%) | 27 (3.1%) |
| $22,500 to $24,999 | 0 (0.0%) | 0 (0.0%) |
| $25,000 to $29,999 | 63 (7.0%) | 83 (9.6%) |
| $30,000 to $34,999 | 72 (8.0%) | 51 (5.9%) |
| $35,000 to $39,999 | 56 (6.2%) | 79 (9.1%) |
| $40,000 to $44,999 | 29 (3.2%) | 100 (11.6%) |
| $45,000 to $49,999 | 43 (4.8%) | 42 (4.9%) |
| $50,000 to $54,999 | 60 (6.7%) | 59 (6.8%) |
| $55,000 to $64,999 | 77 (8.6%) | 88 (10.2%) |
| $65,000 to $74,999 | 47 (5.2%) | 116 (13.4%) |
| $75,000 to $99,999 | 96 (10.6%) | 58 (6.7%) |
| $100,000+ | 159 (17.6%) | 20 (2.3%) |
| Total | 901 (100.0%) | 866 (100.0%) |
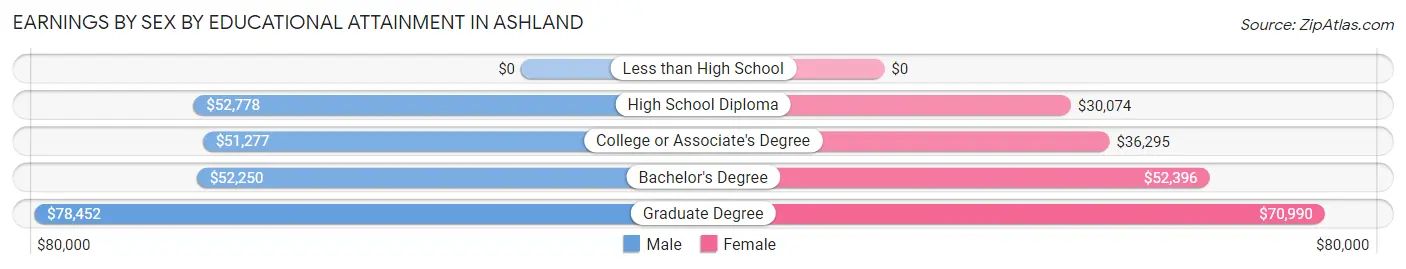
Earnings by Sex by Educational Attainment in Ashland
Average earnings in Ashland are $53,333 for men and $43,558 for women, a difference of 18.3%. Men with an educational attainment of graduate degree enjoy the highest average annual earnings of $78,452, while those with college or associate's degree education earn the least with $51,277. Women with an educational attainment of graduate degree earn the most with the average annual earnings of $70,990, while those with high school diploma education have the smallest earnings of $30,074.
| Educational Attainment | Male Income | Female Income |
| Less than High School | - | - |
| High School Diploma | $52,778 | $30,074 |
| College or Associate's Degree | $51,277 | $36,295 |
| Bachelor's Degree | $52,250 | $52,396 |
| Graduate Degree | $78,452 | $70,990 |
| Total | $53,333 | $43,558 |
Family Income in Ashland
Family Income Brackets in Ashland
According to the Ashland family income data, there are 273 families falling into the $100,000 to $149,999 income range, which is the most common income bracket and makes up 33.5% of all families. Conversely, the $15,000 to $24,999 income bracket is the least frequent group with only 3 families (0.4%) belonging to this category.
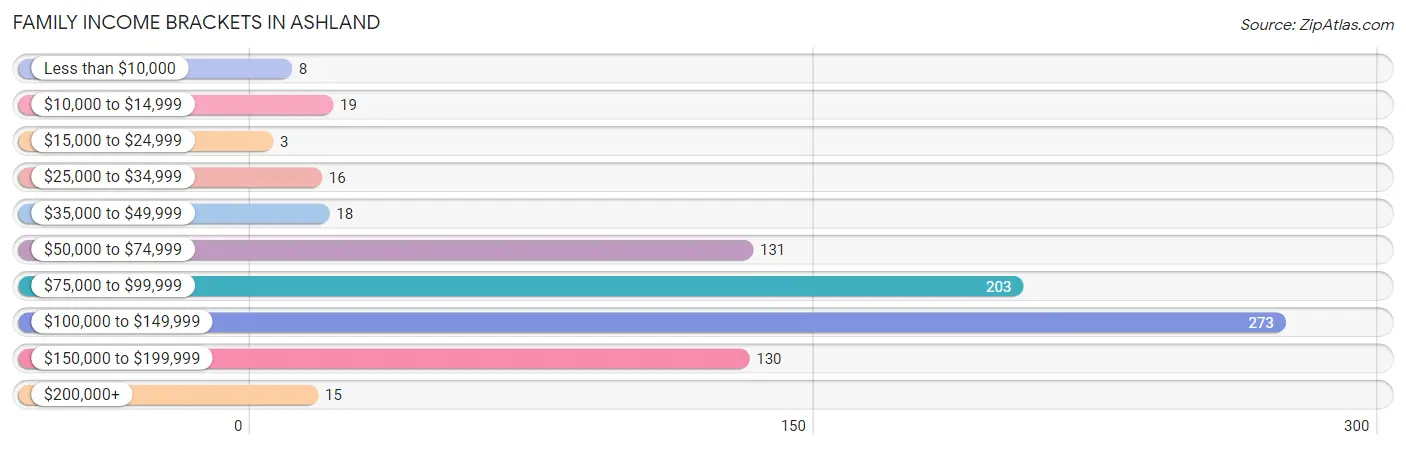
| Income Bracket | # Families | % Families |
| Less than $10,000 | 8 | 1.0% |
| $10,000 to $14,999 | 19 | 2.3% |
| $15,000 to $24,999 | 3 | 0.4% |
| $25,000 to $34,999 | 16 | 2.0% |
| $35,000 to $49,999 | 18 | 2.2% |
| $50,000 to $74,999 | 131 | 16.1% |
| $75,000 to $99,999 | 203 | 24.9% |
| $100,000 to $149,999 | 273 | 33.5% |
| $150,000 to $199,999 | 130 | 15.9% |
| $200,000+ | 15 | 1.8% |
Family Income by Famaliy Size in Ashland
3-person families (287 | 35.2%) account for the highest median family income in Ashland with $115,060 per family, while 2-person families (280 | 34.3%) have the highest median income of $46,022 per family member.
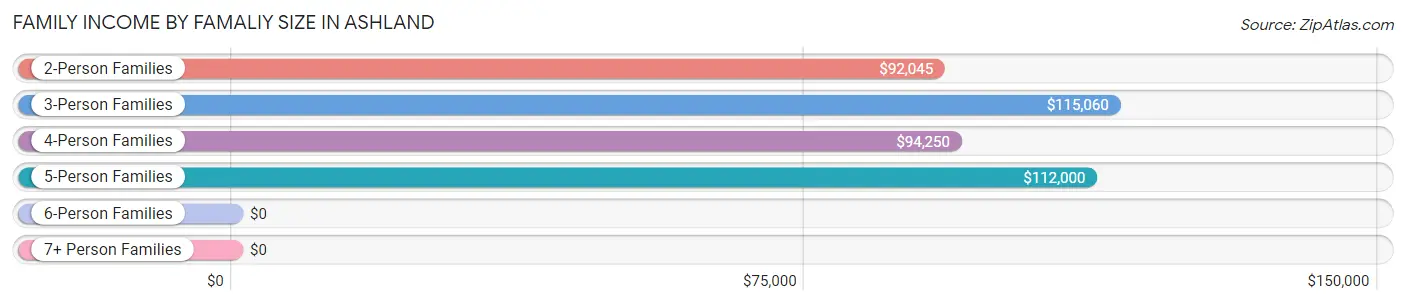
| Income Bracket | # Families | Median Income |
| 2-Person Families | 280 (34.3%) | $92,045 |
| 3-Person Families | 287 (35.2%) | $115,060 |
| 4-Person Families | 165 (20.2%) | $94,250 |
| 5-Person Families | 48 (5.9%) | $112,000 |
| 6-Person Families | 14 (1.7%) | $0 |
| 7+ Person Families | 22 (2.7%) | $0 |
| Total | 816 (100.0%) | $100,658 |
Family Income by Number of Earners in Ashland
The median family income in Ashland is $100,658, with families comprising 2 earners (447) having the highest median family income of $113,984, while families with no earners (55) have the lowest median family income of $72,639, accounting for 54.8% and 6.7% of families, respectively.
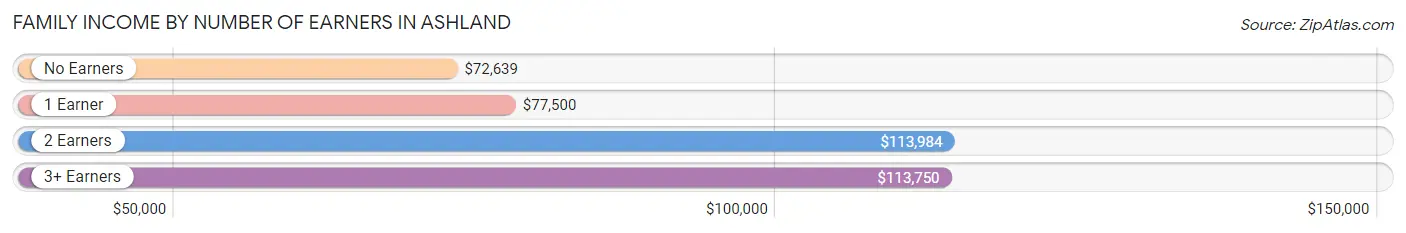
| Number of Earners | # Families | Median Income |
| No Earners | 55 (6.7%) | $72,639 |
| 1 Earner | 204 (25.0%) | $77,500 |
| 2 Earners | 447 (54.8%) | $113,984 |
| 3+ Earners | 110 (13.5%) | $113,750 |
| Total | 816 (100.0%) | $100,658 |
Household Income in Ashland
Household Income Brackets in Ashland
With 301 households falling in the category, the $100,000 to $149,999 income range is the most frequent in Ashland, accounting for 23.8% of all households. In contrast, only 15 households (1.2%) fall into the $200,000+ income bracket, making it the least populous group.
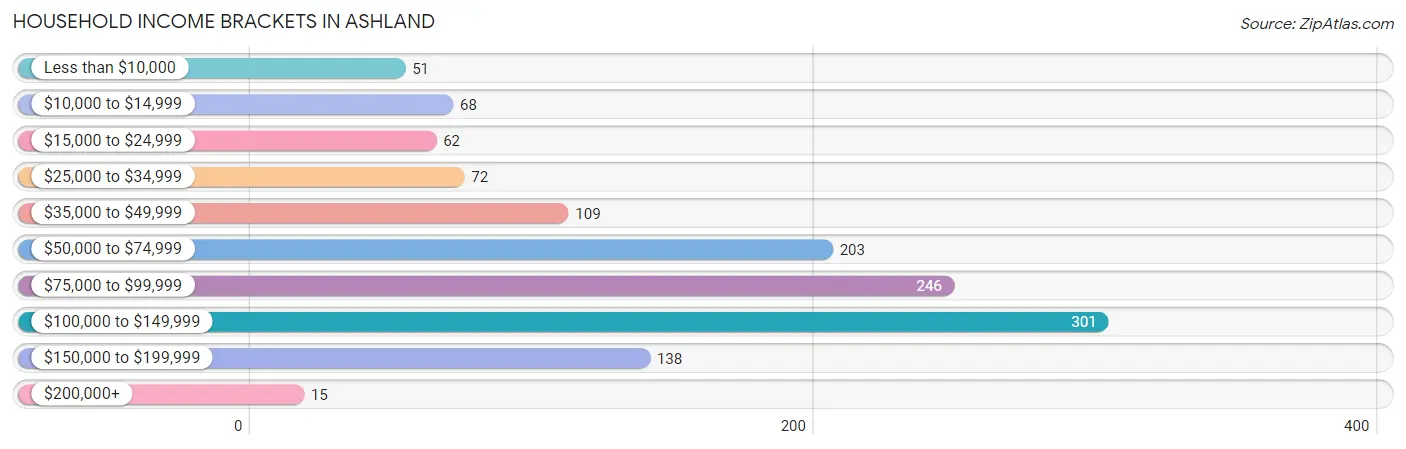
| Income Bracket | # Households | % Households |
| Less than $10,000 | 51 | 4.0% |
| $10,000 to $14,999 | 68 | 5.4% |
| $15,000 to $24,999 | 62 | 4.9% |
| $25,000 to $34,999 | 72 | 5.7% |
| $35,000 to $49,999 | 109 | 8.6% |
| $50,000 to $74,999 | 203 | 16.1% |
| $75,000 to $99,999 | 246 | 19.5% |
| $100,000 to $149,999 | 301 | 23.8% |
| $150,000 to $199,999 | 138 | 10.9% |
| $200,000+ | 15 | 1.2% |
Household Income by Householder Age in Ashland
The median household income in Ashland is $78,966, with the highest median household income of $107,868 found in the 25 to 44 years age bracket for the primary householder. A total of 441 households (34.9%) fall into this category. Meanwhile, the 15 to 24 years age bracket for the primary householder has the lowest median household income of $0, with 24 households (1.9%) in this group.
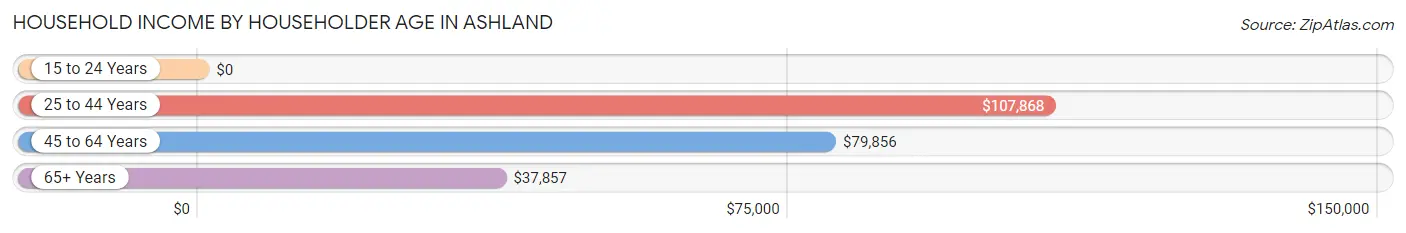
| Income Bracket | # Households | Median Income |
| 15 to 24 Years | 24 (1.9%) | $0 |
| 25 to 44 Years | 441 (34.9%) | $107,868 |
| 45 to 64 Years | 464 (36.7%) | $79,856 |
| 65+ Years | 334 (26.4%) | $37,857 |
| Total | 1,263 (100.0%) | $78,966 |
Poverty in Ashland
Income Below Poverty by Sex and Age in Ashland
With 5.9% poverty level for males and 7.7% for females among the residents of Ashland, 12 to 14 year old males and 75 year old and over females are the most vulnerable to poverty, with 13 males (35.1%) and 44 females (28.9%) in their respective age groups living below the poverty level.
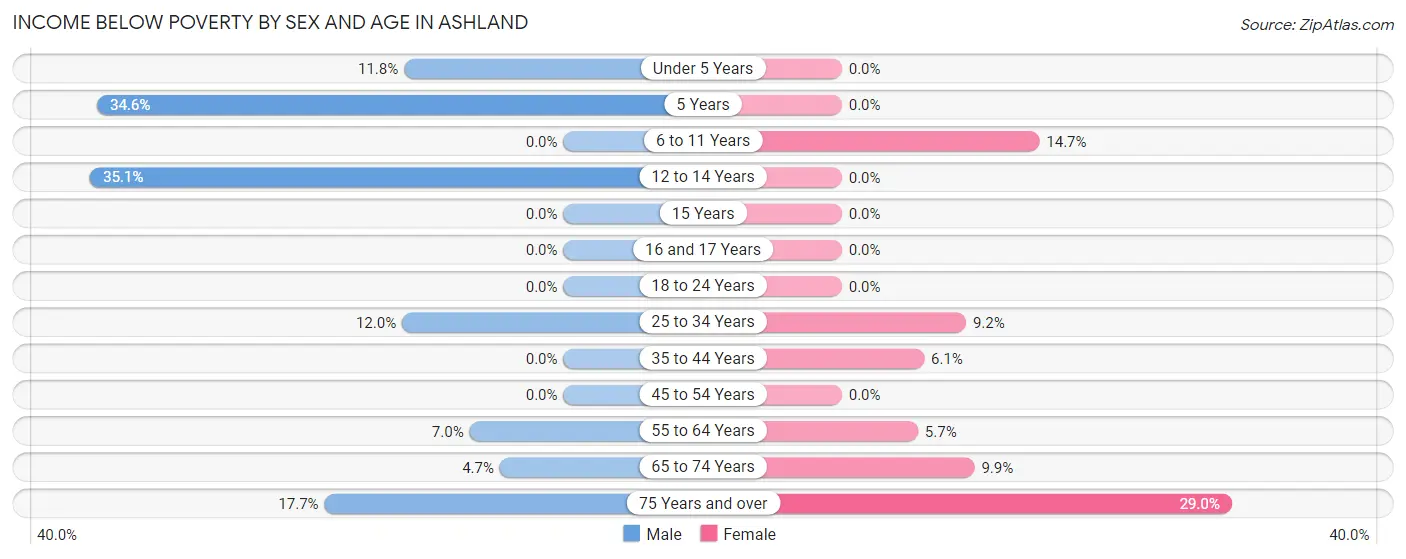
| Age Bracket | Male | Female |
| Under 5 Years | 11 (11.8%) | 0 (0.0%) |
| 5 Years | 9 (34.6%) | 0 (0.0%) |
| 6 to 11 Years | 0 (0.0%) | 22 (14.7%) |
| 12 to 14 Years | 13 (35.1%) | 0 (0.0%) |
| 15 Years | 0 (0.0%) | 0 (0.0%) |
| 16 and 17 Years | 0 (0.0%) | 0 (0.0%) |
| 18 to 24 Years | 0 (0.0%) | 0 (0.0%) |
| 25 to 34 Years | 20 (12.0%) | 20 (9.2%) |
| 35 to 44 Years | 0 (0.0%) | 14 (6.1%) |
| 45 to 54 Years | 0 (0.0%) | 0 (0.0%) |
| 55 to 64 Years | 14 (7.0%) | 14 (5.7%) |
| 65 to 74 Years | 6 (4.7%) | 13 (9.9%) |
| 75 Years and over | 11 (17.7%) | 44 (28.9%) |
| Total | 84 (5.9%) | 127 (7.7%) |
Income Above Poverty by Sex and Age in Ashland
According to the poverty statistics in Ashland, males aged 6 to 11 years and females aged under 5 years are the age groups that are most secure financially, with 100.0% of males and 100.0% of females in these age groups living above the poverty line.
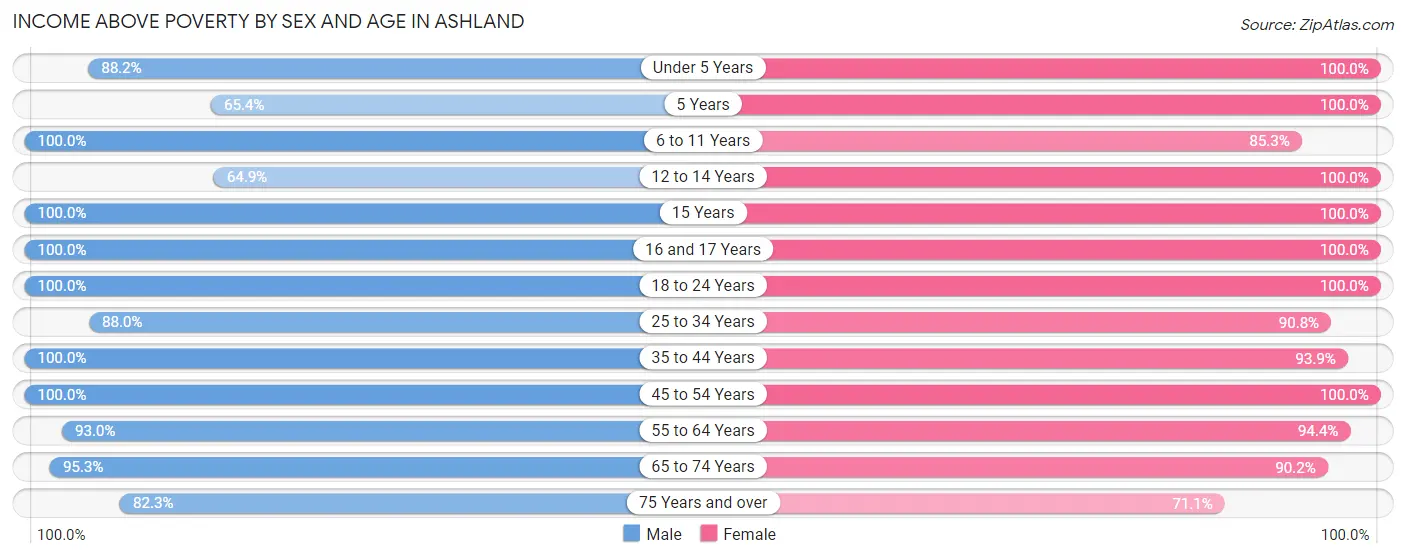
| Age Bracket | Male | Female |
| Under 5 Years | 82 (88.2%) | 86 (100.0%) |
| 5 Years | 17 (65.4%) | 13 (100.0%) |
| 6 to 11 Years | 144 (100.0%) | 128 (85.3%) |
| 12 to 14 Years | 24 (64.9%) | 75 (100.0%) |
| 15 Years | 20 (100.0%) | 18 (100.0%) |
| 16 and 17 Years | 62 (100.0%) | 51 (100.0%) |
| 18 to 24 Years | 78 (100.0%) | 88 (100.0%) |
| 25 to 34 Years | 147 (88.0%) | 197 (90.8%) |
| 35 to 44 Years | 267 (100.0%) | 215 (93.9%) |
| 45 to 54 Years | 127 (100.0%) | 182 (100.0%) |
| 55 to 64 Years | 187 (93.0%) | 234 (94.4%) |
| 65 to 74 Years | 121 (95.3%) | 119 (90.1%) |
| 75 Years and over | 51 (82.3%) | 108 (71.1%) |
| Total | 1,327 (94.1%) | 1,514 (92.3%) |
Income Below Poverty Among Married-Couple Families in Ashland
The poverty statistics for married-couple families in Ashland show that 1.9% or 13 of the total 699 families live below the poverty line. Families with no children have the highest poverty rate of 3.6%, comprising of 13 families. On the other hand, families with 1 or 2 children have the lowest poverty rate of 0.0%, which includes 0 families.
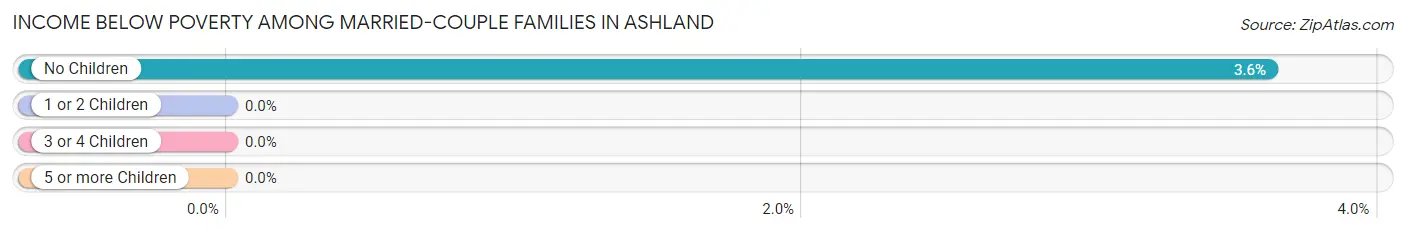
| Children | Above Poverty | Below Poverty |
| No Children | 346 (96.4%) | 13 (3.6%) |
| 1 or 2 Children | 274 (100.0%) | 0 (0.0%) |
| 3 or 4 Children | 50 (100.0%) | 0 (0.0%) |
| 5 or more Children | 16 (100.0%) | 0 (0.0%) |
| Total | 686 (98.1%) | 13 (1.9%) |
Income Below Poverty Among Single-Parent Households in Ashland
According to the poverty data in Ashland, 8.1% or 3 single-father households and 30.0% or 24 single-mother households are living below the poverty line. Among single-father households, those with no children have the highest poverty rate, with 3 households (12.5%) experiencing poverty. Likewise, among single-mother households, those with 3 or 4 children have the highest poverty rate, with 14 households (46.7%) falling below the poverty line.
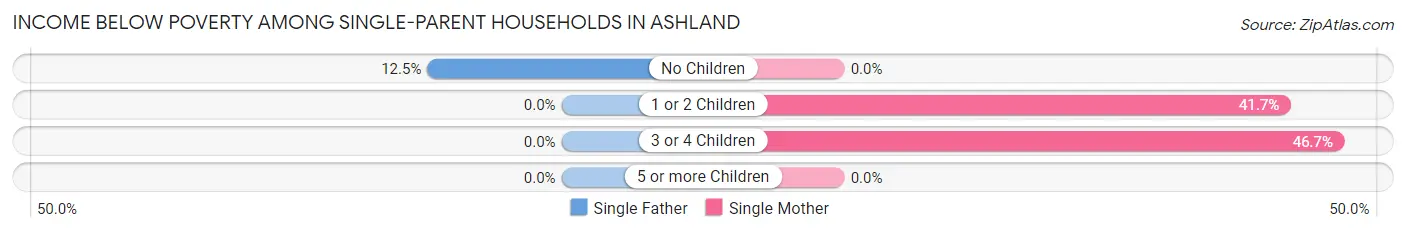
| Children | Single Father | Single Mother |
| No Children | 3 (12.5%) | 0 (0.0%) |
| 1 or 2 Children | 0 (0.0%) | 10 (41.7%) |
| 3 or 4 Children | 0 (0.0%) | 14 (46.7%) |
| 5 or more Children | 0 (0.0%) | 0 (0.0%) |
| Total | 3 (8.1%) | 24 (30.0%) |
Income Below Poverty Among Married-Couple vs Single-Parent Households in Ashland
The poverty data for Ashland shows that 13 of the married-couple family households (1.9%) and 27 of the single-parent households (23.1%) are living below the poverty level. Within the married-couple family households, those with no children have the highest poverty rate, with 13 households (3.6%) falling below the poverty line. Among the single-parent households, those with 3 or 4 children have the highest poverty rate, with 14 household (46.7%) living below poverty.
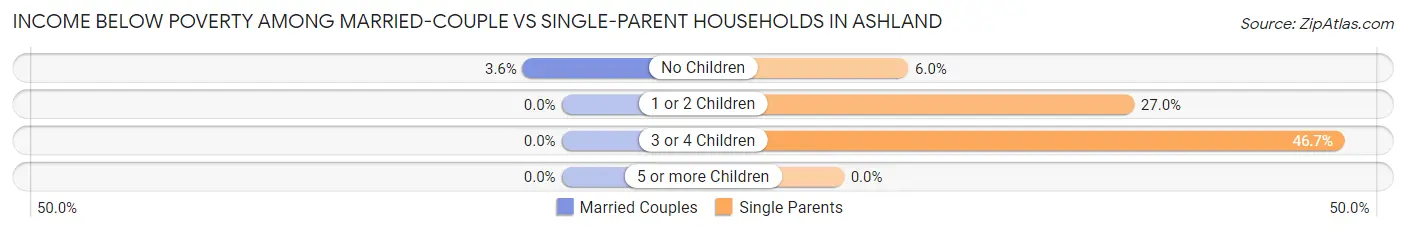
| Children | Married-Couple Families | Single-Parent Households |
| No Children | 13 (3.6%) | 3 (6.0%) |
| 1 or 2 Children | 0 (0.0%) | 10 (27.0%) |
| 3 or 4 Children | 0 (0.0%) | 14 (46.7%) |
| 5 or more Children | 0 (0.0%) | 0 (0.0%) |
| Total | 13 (1.9%) | 27 (23.1%) |
Race in Ashland
The most populous races in Ashland are White / Caucasian (2,931 | 93.6%), Asian (87 | 2.8%), and Two or more Races (86 | 2.8%).
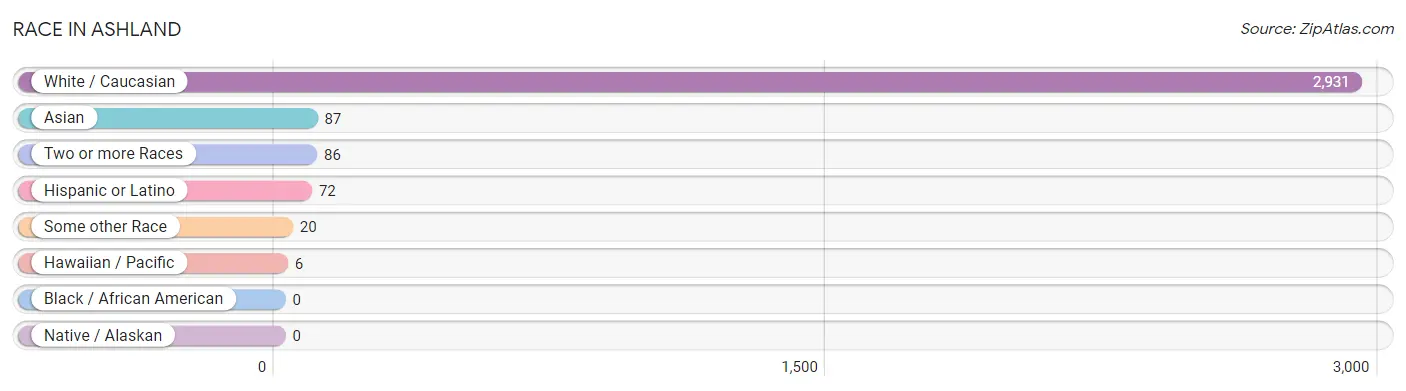
| Race | # Population | % Population |
| Asian | 87 | 2.8% |
| Black / African American | 0 | 0.0% |
| Hawaiian / Pacific | 6 | 0.2% |
| Hispanic or Latino | 72 | 2.3% |
| Native / Alaskan | 0 | 0.0% |
| White / Caucasian | 2,931 | 93.6% |
| Two or more Races | 86 | 2.8% |
| Some other Race | 20 | 0.6% |
| Total | 3,130 | 100.0% |
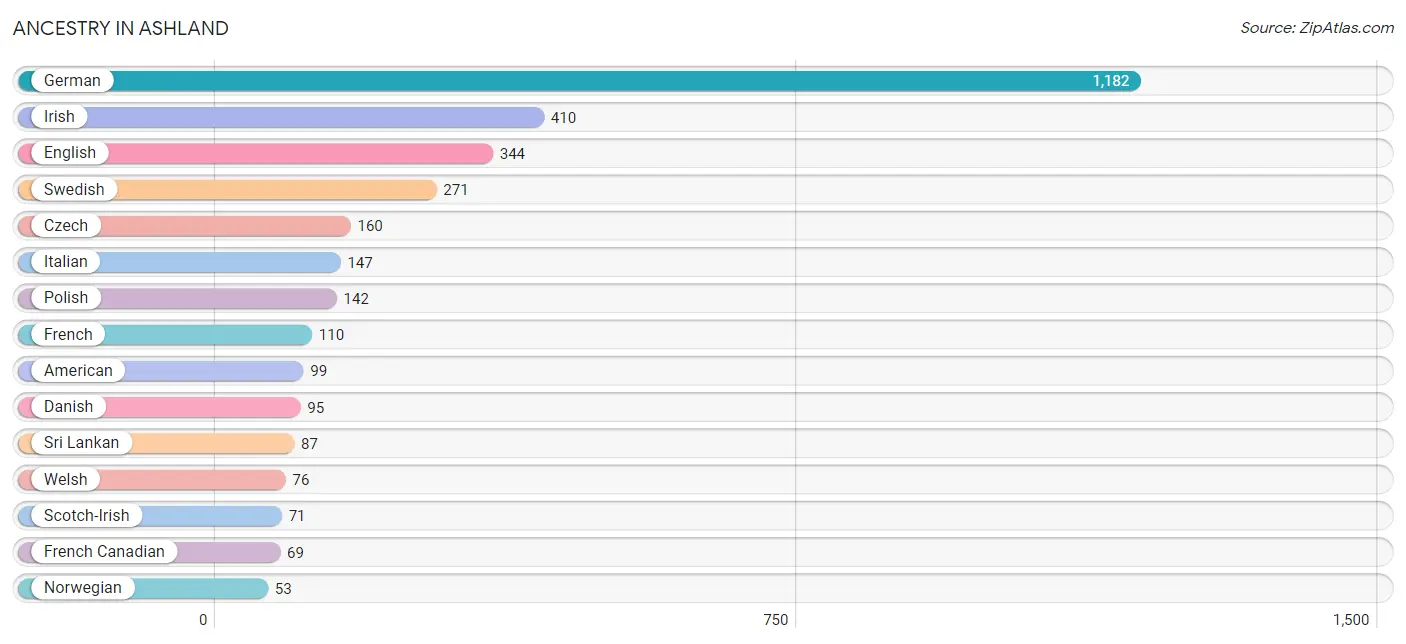
Ancestry in Ashland
The most populous ancestries reported in Ashland are German (1,182 | 37.8%), Irish (410 | 13.1%), English (344 | 11.0%), Swedish (271 | 8.7%), and Czech (160 | 5.1%), together accounting for 75.6% of all Ashland residents.
| Ancestry | # Population | % Population |
| American | 99 | 3.2% |
| Apache | 4 | 0.1% |
| Arab | 14 | 0.4% |
| British | 21 | 0.7% |
| Cuban | 13 | 0.4% |
| Czech | 160 | 5.1% |
| Danish | 95 | 3.0% |
| Dutch | 22 | 0.7% |
| Eastern European | 13 | 0.4% |
| Egyptian | 14 | 0.4% |
| English | 344 | 11.0% |
| European | 44 | 1.4% |
| French | 110 | 3.5% |
| French Canadian | 69 | 2.2% |
| German | 1,182 | 37.8% |
| Hungarian | 13 | 0.4% |
| Irish | 410 | 13.1% |
| Italian | 147 | 4.7% |
| Lithuanian | 6 | 0.2% |
| Mexican | 42 | 1.3% |
| Norwegian | 53 | 1.7% |
| Pennsylvania German | 14 | 0.4% |
| Polish | 142 | 4.5% |
| Russian | 5 | 0.2% |
| Samoan | 6 | 0.2% |
| Scotch-Irish | 71 | 2.3% |
| Scottish | 45 | 1.4% |
| Spaniard | 10 | 0.3% |
| Sri Lankan | 87 | 2.8% |
| Swedish | 271 | 8.7% |
| Welsh | 76 | 2.4% | View All 31 Rows |
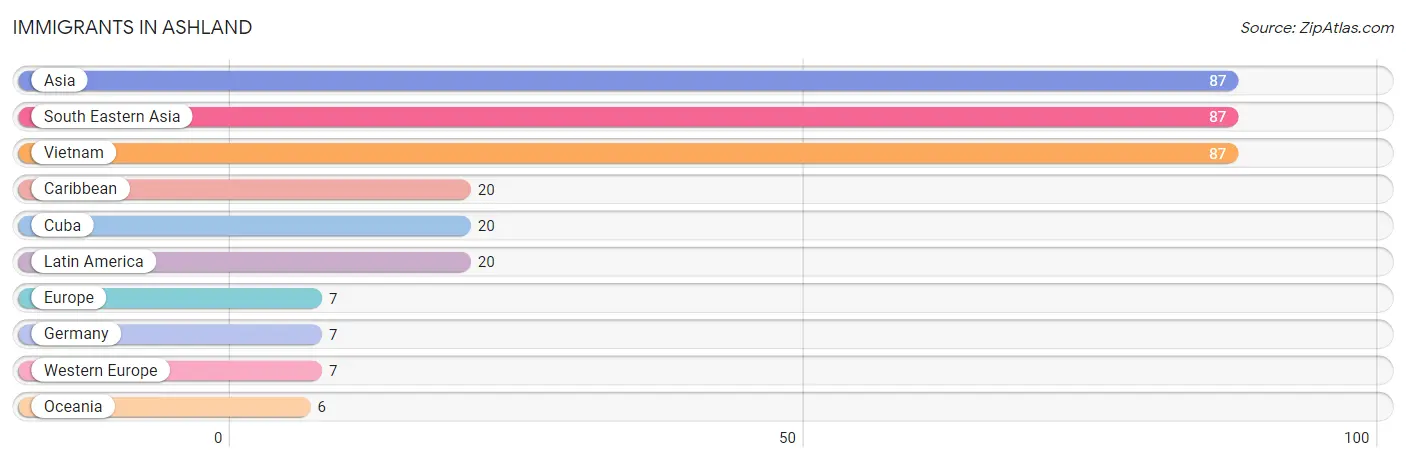
Immigrants in Ashland
The most numerous immigrant groups reported in Ashland came from Asia (87 | 2.8%), South Eastern Asia (87 | 2.8%), Vietnam (87 | 2.8%), Caribbean (20 | 0.6%), and Cuba (20 | 0.6%), together accounting for 9.6% of all Ashland residents.
| Immigration Origin | # Population | % Population |
| Asia | 87 | 2.8% |
| Caribbean | 20 | 0.6% |
| Cuba | 20 | 0.6% |
| Europe | 7 | 0.2% |
| Germany | 7 | 0.2% |
| Latin America | 20 | 0.6% |
| Oceania | 6 | 0.2% |
| South Eastern Asia | 87 | 2.8% |
| Vietnam | 87 | 2.8% |
| Western Europe | 7 | 0.2% | View All 10 Rows |
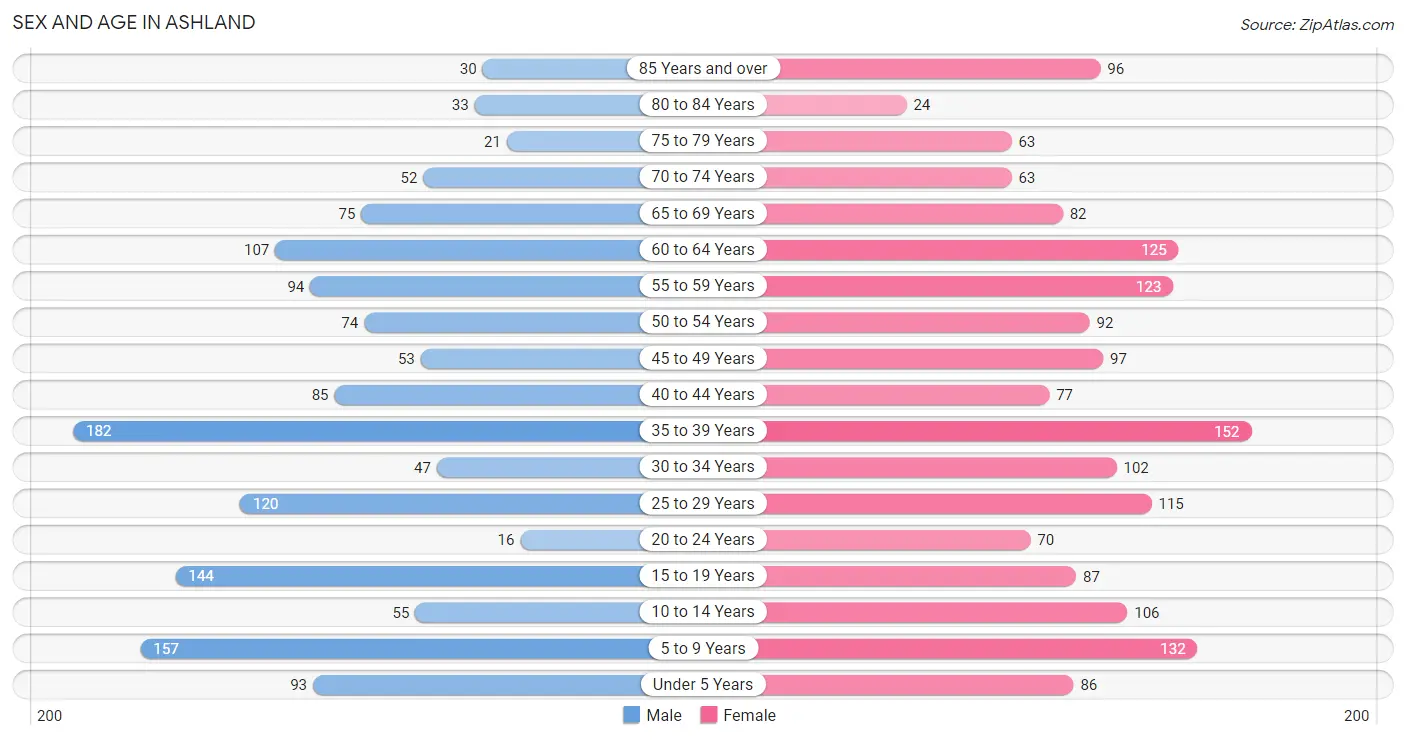
Sex and Age in Ashland
Sex and Age in Ashland
The most populous age groups in Ashland are 35 to 39 Years (182 | 12.7%) for men and 35 to 39 Years (152 | 9.0%) for women.
| Age Bracket | Male | Female |
| Under 5 Years | 93 (6.5%) | 86 (5.1%) |
| 5 to 9 Years | 157 (10.9%) | 132 (7.8%) |
| 10 to 14 Years | 55 (3.8%) | 106 (6.3%) |
| 15 to 19 Years | 144 (10.0%) | 87 (5.1%) |
| 20 to 24 Years | 16 (1.1%) | 70 (4.1%) |
| 25 to 29 Years | 120 (8.3%) | 115 (6.8%) |
| 30 to 34 Years | 47 (3.3%) | 102 (6.0%) |
| 35 to 39 Years | 182 (12.7%) | 152 (9.0%) |
| 40 to 44 Years | 85 (5.9%) | 77 (4.5%) |
| 45 to 49 Years | 53 (3.7%) | 97 (5.7%) |
| 50 to 54 Years | 74 (5.1%) | 92 (5.4%) |
| 55 to 59 Years | 94 (6.5%) | 123 (7.3%) |
| 60 to 64 Years | 107 (7.4%) | 125 (7.4%) |
| 65 to 69 Years | 75 (5.2%) | 82 (4.9%) |
| 70 to 74 Years | 52 (3.6%) | 63 (3.7%) |
| 75 to 79 Years | 21 (1.5%) | 63 (3.7%) |
| 80 to 84 Years | 33 (2.3%) | 24 (1.4%) |
| 85 Years and over | 30 (2.1%) | 96 (5.7%) |
| Total | 1,438 (100.0%) | 1,692 (100.0%) |
Families and Households in Ashland
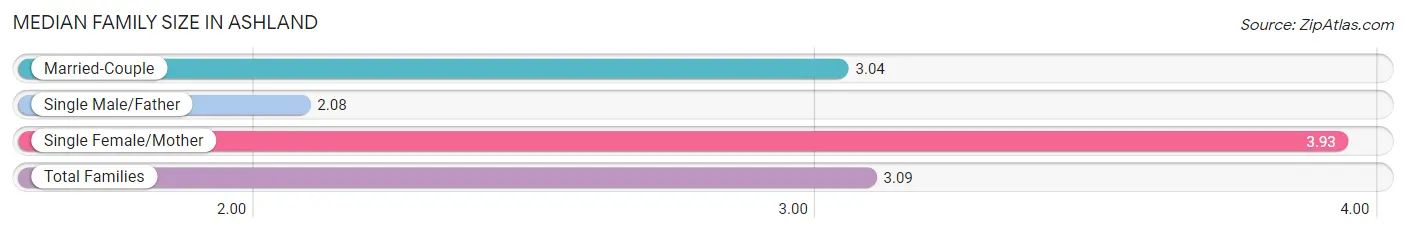
Median Family Size in Ashland
The median family size in Ashland is 3.09 persons per family, with single female/mother families (80 | 9.8%) accounting for the largest median family size of 3.93 persons per family. On the other hand, single male/father families (37 | 4.5%) represent the smallest median family size with 2.08 persons per family.
| Family Type | # Families | Family Size |
| Married-Couple | 699 (85.7%) | 3.04 |
| Single Male/Father | 37 (4.5%) | 2.08 |
| Single Female/Mother | 80 (9.8%) | 3.93 |
| Total Families | 816 (100.0%) | 3.09 |
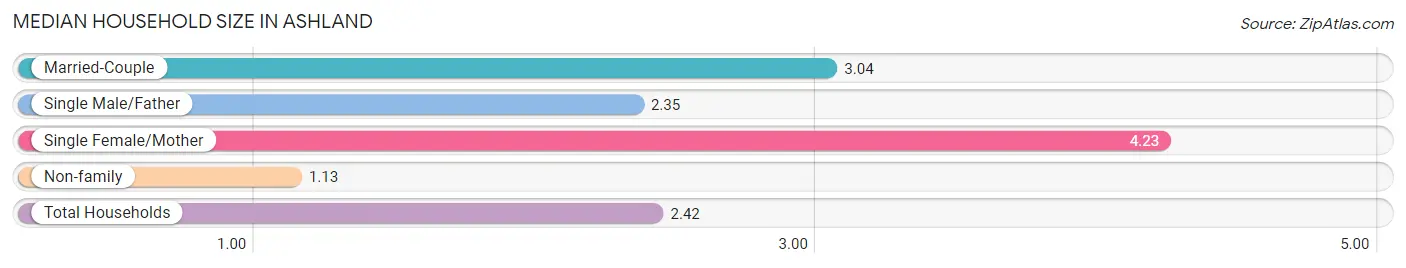
Median Household Size in Ashland
The median household size in Ashland is 2.42 persons per household, with single female/mother households (80 | 6.3%) accounting for the largest median household size of 4.23 persons per household. non-family households (447 | 35.4%) represent the smallest median household size with 1.13 persons per household.
| Household Type | # Households | Household Size |
| Married-Couple | 699 (55.3%) | 3.04 |
| Single Male/Father | 37 (2.9%) | 2.35 |
| Single Female/Mother | 80 (6.3%) | 4.23 |
| Non-family | 447 (35.4%) | 1.13 |
| Total Households | 1,263 (100.0%) | 2.42 |
Household Size by Marriage Status in Ashland
Out of a total of 1,263 households in Ashland, 816 (64.6%) are family households, while 447 (35.4%) are nonfamily households. The most numerous type of family households are 3-person households, comprising 293, and the most common type of nonfamily households are 1-person households, comprising 398.
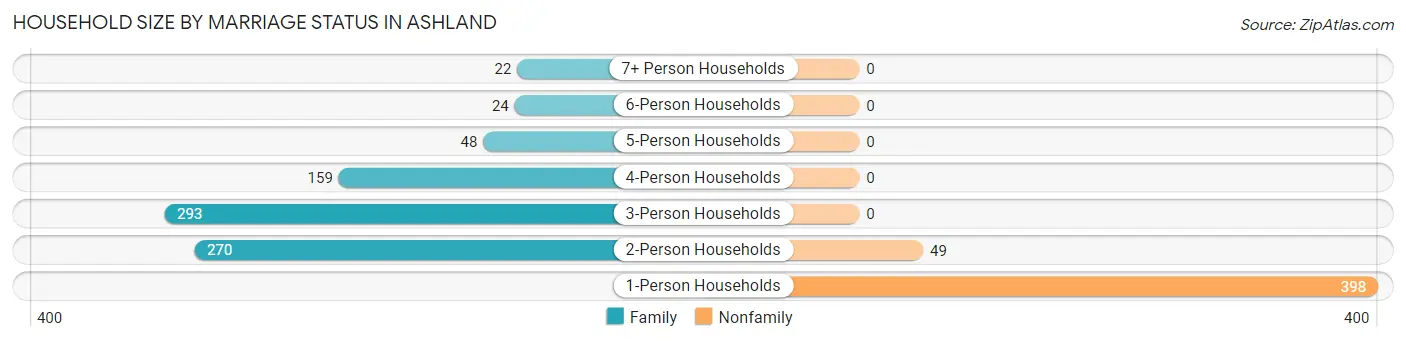
| Household Size | Family Households | Nonfamily Households |
| 1-Person Households | - | 398 (31.5%) |
| 2-Person Households | 270 (21.4%) | 49 (3.9%) |
| 3-Person Households | 293 (23.2%) | 0 (0.0%) |
| 4-Person Households | 159 (12.6%) | 0 (0.0%) |
| 5-Person Households | 48 (3.8%) | 0 (0.0%) |
| 6-Person Households | 24 (1.9%) | 0 (0.0%) |
| 7+ Person Households | 22 (1.7%) | 0 (0.0%) |
| Total | 816 (64.6%) | 447 (35.4%) |
Female Fertility in Ashland
Fertility by Age in Ashland
Average fertility rate in Ashland is 65.0 births per 1,000 women. Women in the age bracket of 20 to 34 years have the highest fertility rate with 160.0 births per 1,000 women. Women in the age bracket of 20 to 34 years acount for 100.0% of all women with births.
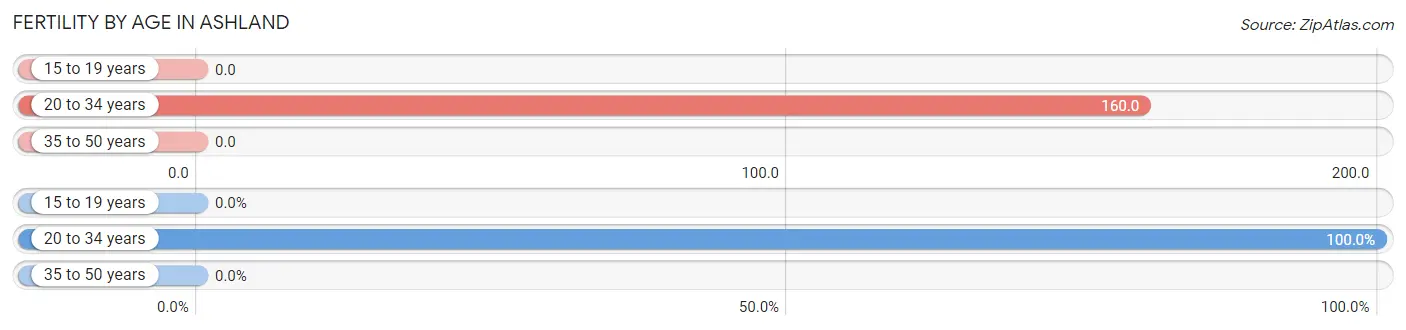
| Age Bracket | Women with Births | Births / 1,000 Women |
| 15 to 19 years | 0 (0.0%) | 0.0 |
| 20 to 34 years | 46 (100.0%) | 160.0 |
| 35 to 50 years | 0 (0.0%) | 0.0 |
| Total | 46 (100.0%) | 65.0 |
Fertility by Age by Marriage Status in Ashland
78.3% of women with births (46) in Ashland are married. The highest percentage of unmarried women with births falls into 20 to 34 years age bracket with 21.7% of them unmarried at the time of birth, while the lowest percentage of unmarried women with births belong to 20 to 34 years age bracket with 21.7% of them unmarried.
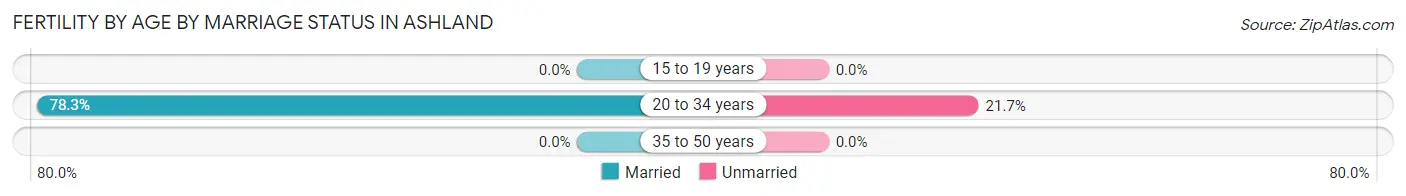
| Age Bracket | Married | Unmarried |
| 15 to 19 years | 0 (0.0%) | 0 (0.0%) |
| 20 to 34 years | 36 (78.3%) | 10 (21.7%) |
| 35 to 50 years | 0 (0.0%) | 0 (0.0%) |
| Total | 36 (78.3%) | 10 (21.7%) |
Fertility by Education in Ashland
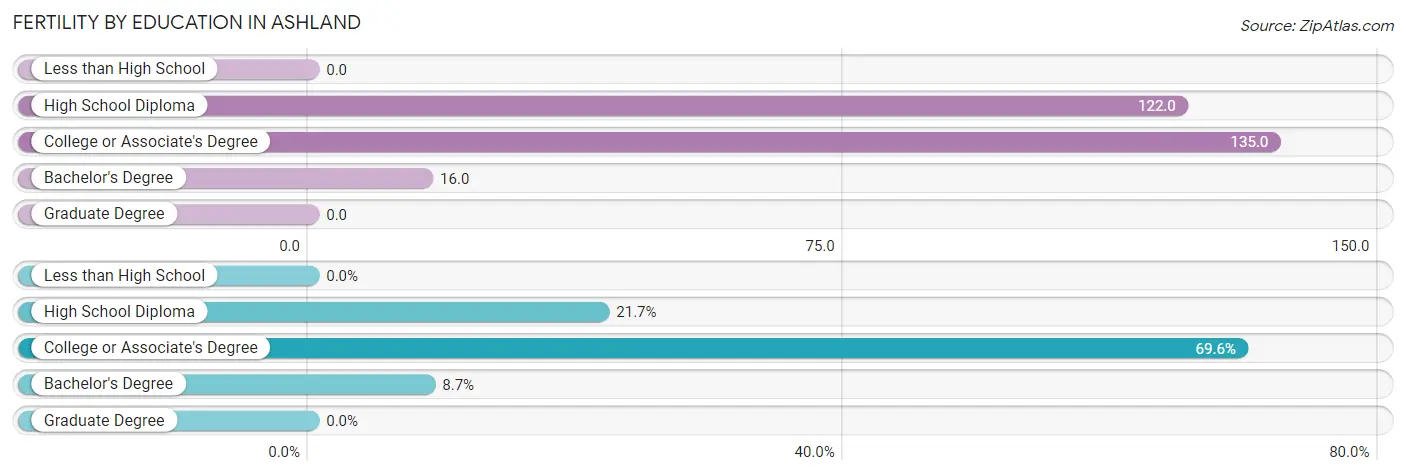
| Educational Attainment | Women with Births | Births / 1,000 Women |
| Less than High School | 0 (0.0%) | 0.0 |
| High School Diploma | 10 (21.7%) | 122.0 |
| College or Associate's Degree | 32 (69.6%) | 135.0 |
| Bachelor's Degree | 4 (8.7%) | 16.0 |
| Graduate Degree | 0 (0.0%) | 0.0 |
| Total | 46 (100.0%) | 65.0 |
Fertility by Education by Marriage Status in Ashland
21.7% of women with births in Ashland are unmarried. Women with the educational attainment of college or associate's degree are most likely to be married with 100.0% of them married at childbirth, while women with the educational attainment of high school diploma are least likely to be married with 100.0% of them unmarried at childbirth.
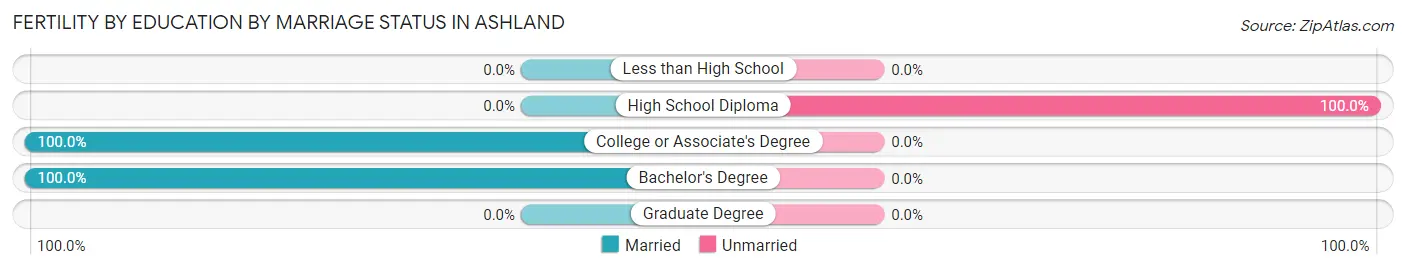
| Educational Attainment | Married | Unmarried |
| Less than High School | 0 (0.0%) | 0 (0.0%) |
| High School Diploma | 0 (0.0%) | 10 (100.0%) |
| College or Associate's Degree | 32 (100.0%) | 0 (0.0%) |
| Bachelor's Degree | 4 (100.0%) | 0 (0.0%) |
| Graduate Degree | 0 (0.0%) | 0 (0.0%) |
| Total | 36 (78.3%) | 10 (21.7%) |
Employment Characteristics in Ashland
Employment by Class of Employer in Ashland
Among the 1,516 employed individuals in Ashland, private company employees (969 | 63.9%), local government employees (183 | 12.1%), and not-for-profit organizations (110 | 7.3%) make up the most common classes of employment.
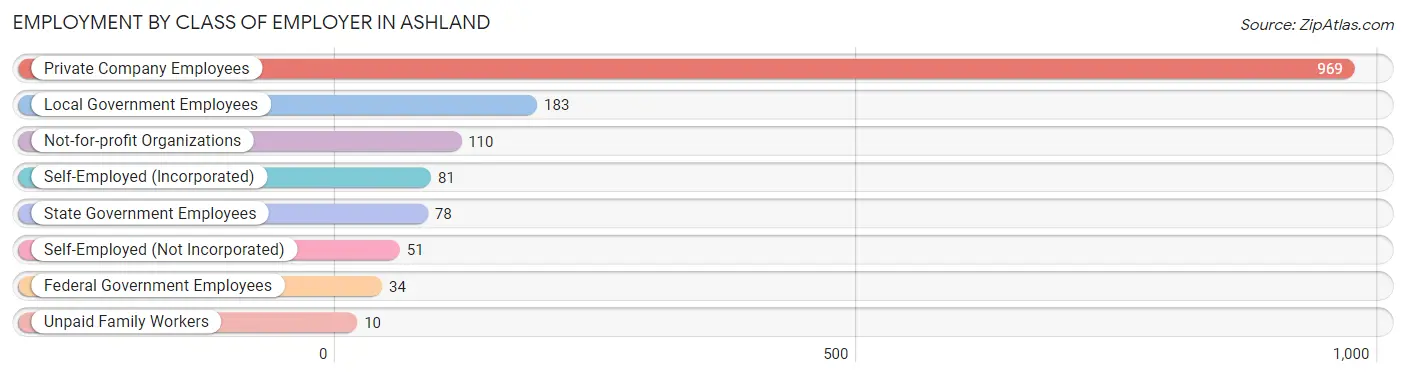
| Employer Class | # Employees | % Employees |
| Private Company Employees | 969 | 63.9% |
| Self-Employed (Incorporated) | 81 | 5.3% |
| Self-Employed (Not Incorporated) | 51 | 3.4% |
| Not-for-profit Organizations | 110 | 7.3% |
| Local Government Employees | 183 | 12.1% |
| State Government Employees | 78 | 5.1% |
| Federal Government Employees | 34 | 2.2% |
| Unpaid Family Workers | 10 | 0.7% |
| Total | 1,516 | 100.0% |
Employment Status by Age in Ashland
According to the labor force statistics for Ashland, out of the total population over 16 years of age (2,463), 69.7% or 1,717 individuals are in the labor force, with 5.0% or 86 of them unemployed. The age group with the highest labor force participation rate is 20 to 24 years, with 100.0% or 86 individuals in the labor force. Within the labor force, the 16 to 19 years age range has the highest percentage of unemployed individuals, with 23.1% or 25 of them being unemployed.
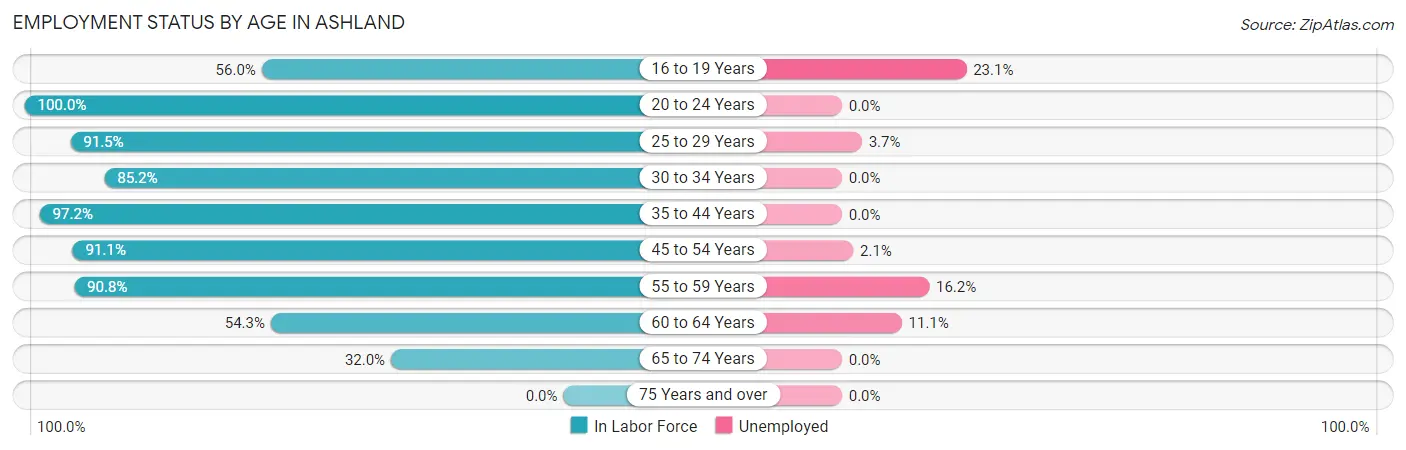
| Age Bracket | In Labor Force | Unemployed |
| 16 to 19 Years | 108 (56.0%) | 25 (23.1%) |
| 20 to 24 Years | 86 (100.0%) | 0 (0.0%) |
| 25 to 29 Years | 215 (91.5%) | 8 (3.7%) |
| 30 to 34 Years | 127 (85.2%) | 0 (0.0%) |
| 35 to 44 Years | 482 (97.2%) | 0 (0.0%) |
| 45 to 54 Years | 288 (91.1%) | 6 (2.1%) |
| 55 to 59 Years | 197 (90.8%) | 32 (16.2%) |
| 60 to 64 Years | 126 (54.3%) | 14 (11.1%) |
| 65 to 74 Years | 87 (32.0%) | 0 (0.0%) |
| 75 Years and over | 0 (0.0%) | 0 (0.0%) |
| Total | 1,717 (69.7%) | 86 (5.0%) |
Employment Status by Educational Attainment in Ashland
According to labor force statistics for Ashland, 87.2% of individuals (1,434) out of the total population between 25 and 64 years of age (1,645) are in the labor force, with 4.2% or 60 of them being unemployed. The group with the highest labor force participation rate are those with the educational attainment of bachelor's degree or higher, with 91.6% or 547 individuals in the labor force. Within the labor force, individuals with less than high school education have the highest percentage of unemployment, with 27.0% or 20 of them being unemployed.
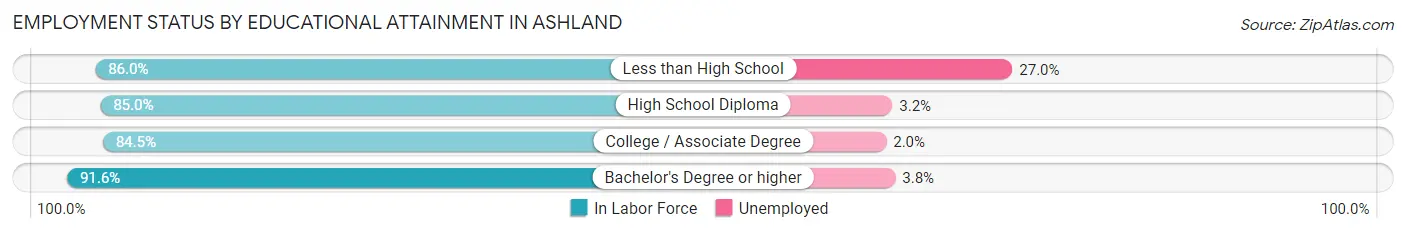
| Educational Attainment | In Labor Force | Unemployed |
| Less than High School | 74 (86.0%) | 23 (27.0%) |
| High School Diploma | 216 (85.0%) | 8 (3.2%) |
| College / Associate Degree | 598 (84.5%) | 14 (2.0%) |
| Bachelor's Degree or higher | 547 (91.6%) | 23 (3.8%) |
| Total | 1,434 (87.2%) | 69 (4.2%) |
Employment Occupations by Sex in Ashland
Management, Business, Science and Arts Occupations
The most common Management, Business, Science and Arts occupations in Ashland are Community & Social Service (229 | 14.0%), Education Instruction & Library (164 | 10.1%), Health Diagnosing & Treating (129 | 7.9%), Computers, Engineering & Science (90 | 5.5%), and Health Technologists (85 | 5.2%).

Management, Business, Science and Arts Occupations by Sex
Within the Management, Business, Science and Arts occupations in Ashland, the most male-oriented occupations are Business & Financial (61.4%), Architecture & Engineering (39.3%), and Management (37.7%), while the most female-oriented occupations are Legal Services & Support (100.0%), Health Diagnosing & Treating (100.0%), and Health Technologists (100.0%).
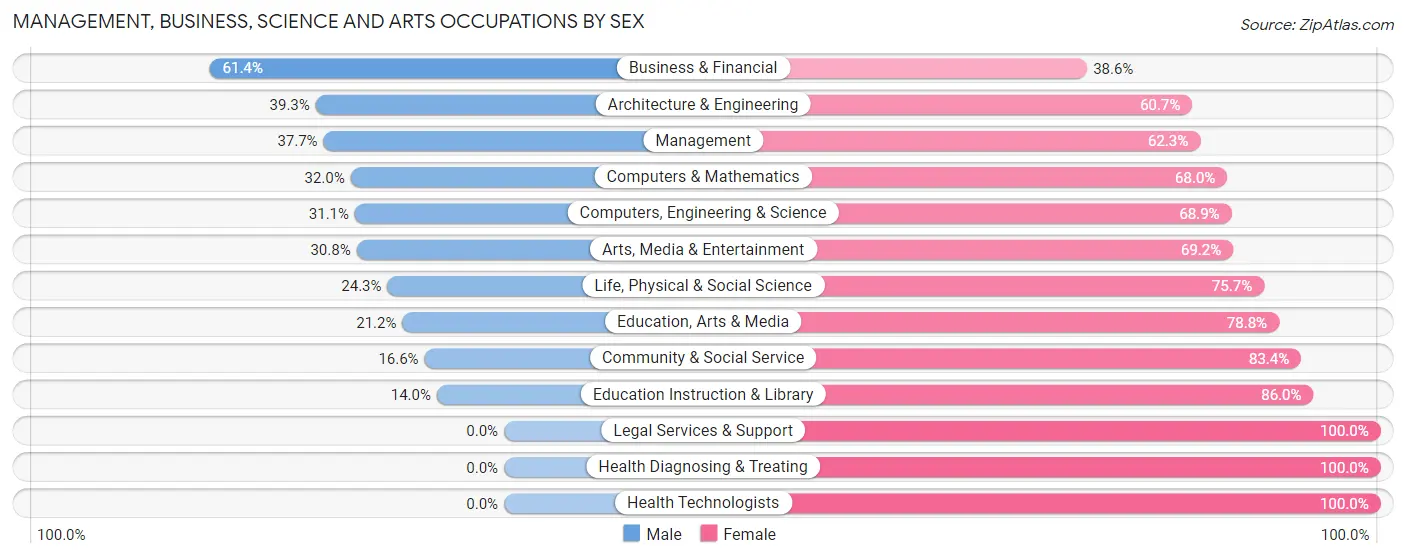
| Occupation | Male | Female |
| Management | 29 (37.7%) | 48 (62.3%) |
| Business & Financial | 35 (61.4%) | 22 (38.6%) |
| Computers, Engineering & Science | 28 (31.1%) | 62 (68.9%) |
| Computers & Mathematics | 8 (32.0%) | 17 (68.0%) |
| Architecture & Engineering | 11 (39.3%) | 17 (60.7%) |
| Life, Physical & Social Science | 9 (24.3%) | 28 (75.7%) |
| Community & Social Service | 38 (16.6%) | 191 (83.4%) |
| Education, Arts & Media | 7 (21.2%) | 26 (78.8%) |
| Legal Services & Support | 0 (0.0%) | 6 (100.0%) |
| Education Instruction & Library | 23 (14.0%) | 141 (86.0%) |
| Arts, Media & Entertainment | 8 (30.8%) | 18 (69.2%) |
| Health Diagnosing & Treating | 0 (0.0%) | 129 (100.0%) |
| Health Technologists | 0 (0.0%) | 85 (100.0%) |
| Total (Category) | 130 (22.3%) | 452 (77.7%) |
| Total (Overall) | 781 (47.9%) | 850 (52.1%) |
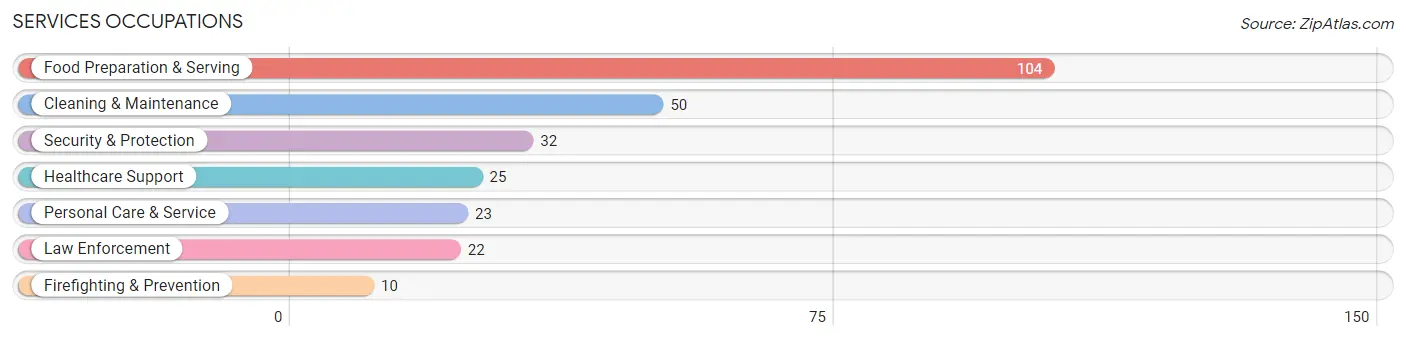
Services Occupations
The most common Services occupations in Ashland are Food Preparation & Serving (104 | 6.4%), Cleaning & Maintenance (50 | 3.1%), Security & Protection (32 | 2.0%), Healthcare Support (25 | 1.5%), and Personal Care & Service (23 | 1.4%).
Services Occupations by Sex
Within the Services occupations in Ashland, the most male-oriented occupations are Security & Protection (100.0%), Firefighting & Prevention (100.0%), and Law Enforcement (100.0%), while the most female-oriented occupations are Healthcare Support (100.0%), Food Preparation & Serving (40.4%), and Cleaning & Maintenance (12.0%).
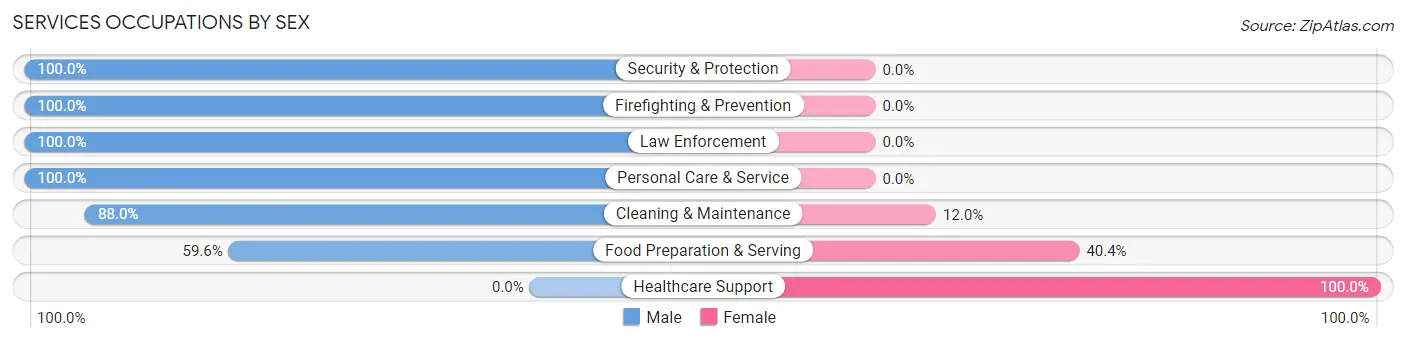
| Occupation | Male | Female |
| Healthcare Support | 0 (0.0%) | 25 (100.0%) |
| Security & Protection | 32 (100.0%) | 0 (0.0%) |
| Firefighting & Prevention | 10 (100.0%) | 0 (0.0%) |
| Law Enforcement | 22 (100.0%) | 0 (0.0%) |
| Food Preparation & Serving | 62 (59.6%) | 42 (40.4%) |
| Cleaning & Maintenance | 44 (88.0%) | 6 (12.0%) |
| Personal Care & Service | 23 (100.0%) | 0 (0.0%) |
| Total (Category) | 161 (68.8%) | 73 (31.2%) |
| Total (Overall) | 781 (47.9%) | 850 (52.1%) |
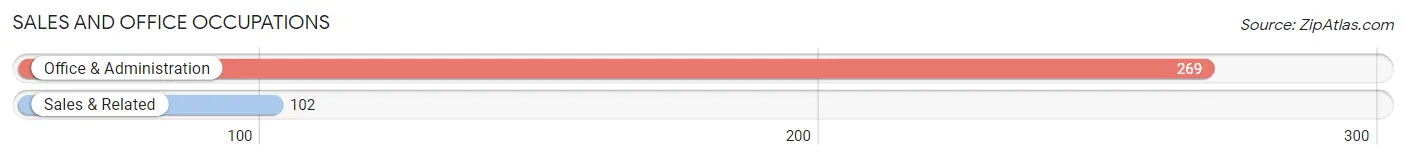
Sales and Office Occupations
The most common Sales and Office occupations in Ashland are Office & Administration (269 | 16.5%), and Sales & Related (102 | 6.2%).
Sales and Office Occupations by Sex
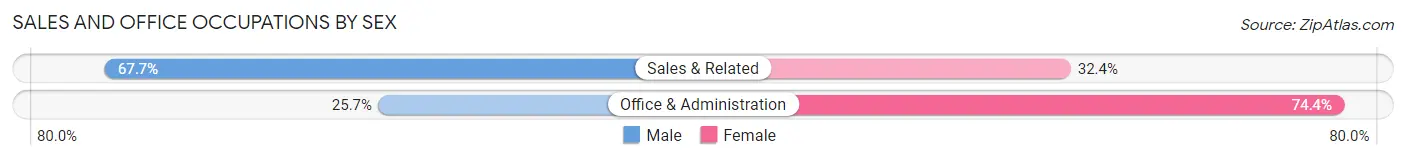
| Occupation | Male | Female |
| Sales & Related | 69 (67.6%) | 33 (32.4%) |
| Office & Administration | 69 (25.7%) | 200 (74.4%) |
| Total (Category) | 138 (37.2%) | 233 (62.8%) |
| Total (Overall) | 781 (47.9%) | 850 (52.1%) |
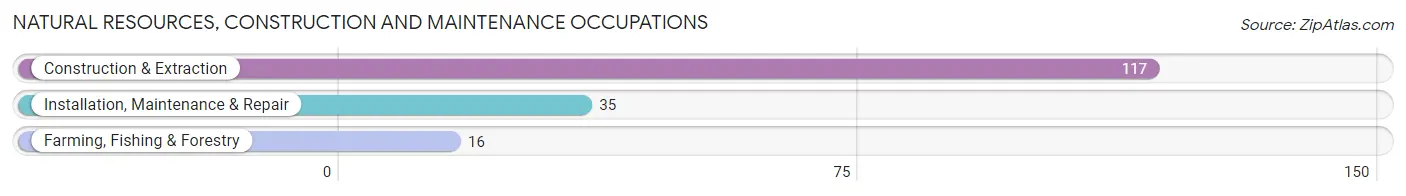
Natural Resources, Construction and Maintenance Occupations
The most common Natural Resources, Construction and Maintenance occupations in Ashland are Construction & Extraction (117 | 7.2%), Installation, Maintenance & Repair (35 | 2.1%), and Farming, Fishing & Forestry (16 | 1.0%).
Natural Resources, Construction and Maintenance Occupations by Sex
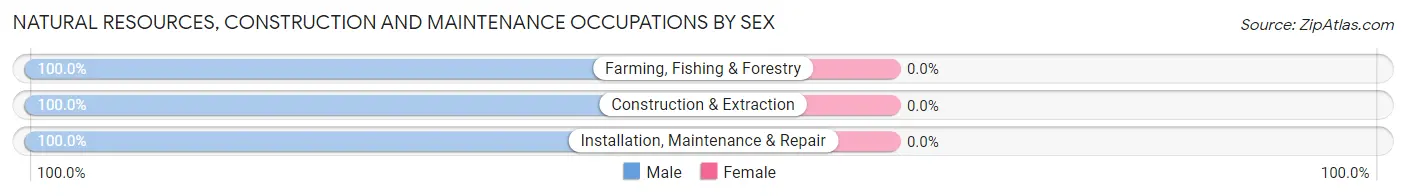
| Occupation | Male | Female |
| Farming, Fishing & Forestry | 16 (100.0%) | 0 (0.0%) |
| Construction & Extraction | 117 (100.0%) | 0 (0.0%) |
| Installation, Maintenance & Repair | 35 (100.0%) | 0 (0.0%) |
| Total (Category) | 168 (100.0%) | 0 (0.0%) |
| Total (Overall) | 781 (47.9%) | 850 (52.1%) |
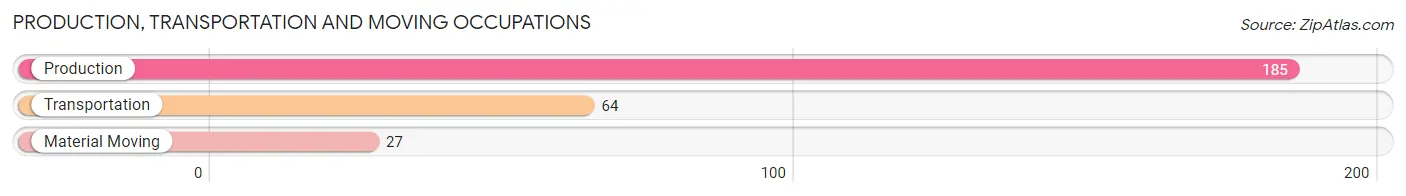
Production, Transportation and Moving Occupations
The most common Production, Transportation and Moving occupations in Ashland are Production (185 | 11.3%), Transportation (64 | 3.9%), and Material Moving (27 | 1.7%).
Production, Transportation and Moving Occupations by Sex
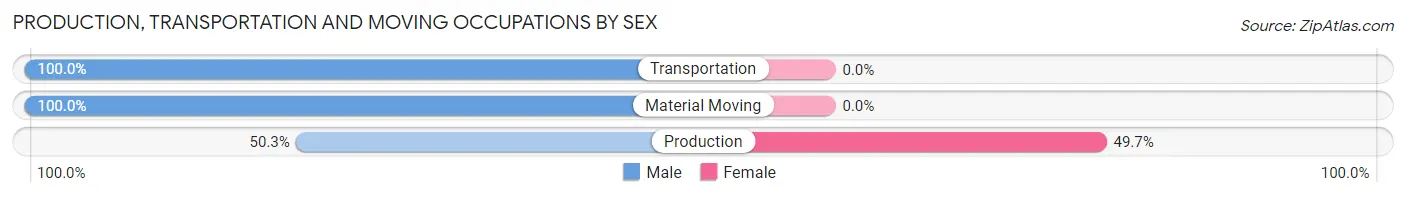
| Occupation | Male | Female |
| Production | 93 (50.3%) | 92 (49.7%) |
| Transportation | 64 (100.0%) | 0 (0.0%) |
| Material Moving | 27 (100.0%) | 0 (0.0%) |
| Total (Category) | 184 (66.7%) | 92 (33.3%) |
| Total (Overall) | 781 (47.9%) | 850 (52.1%) |
Employment Industries by Sex in Ashland
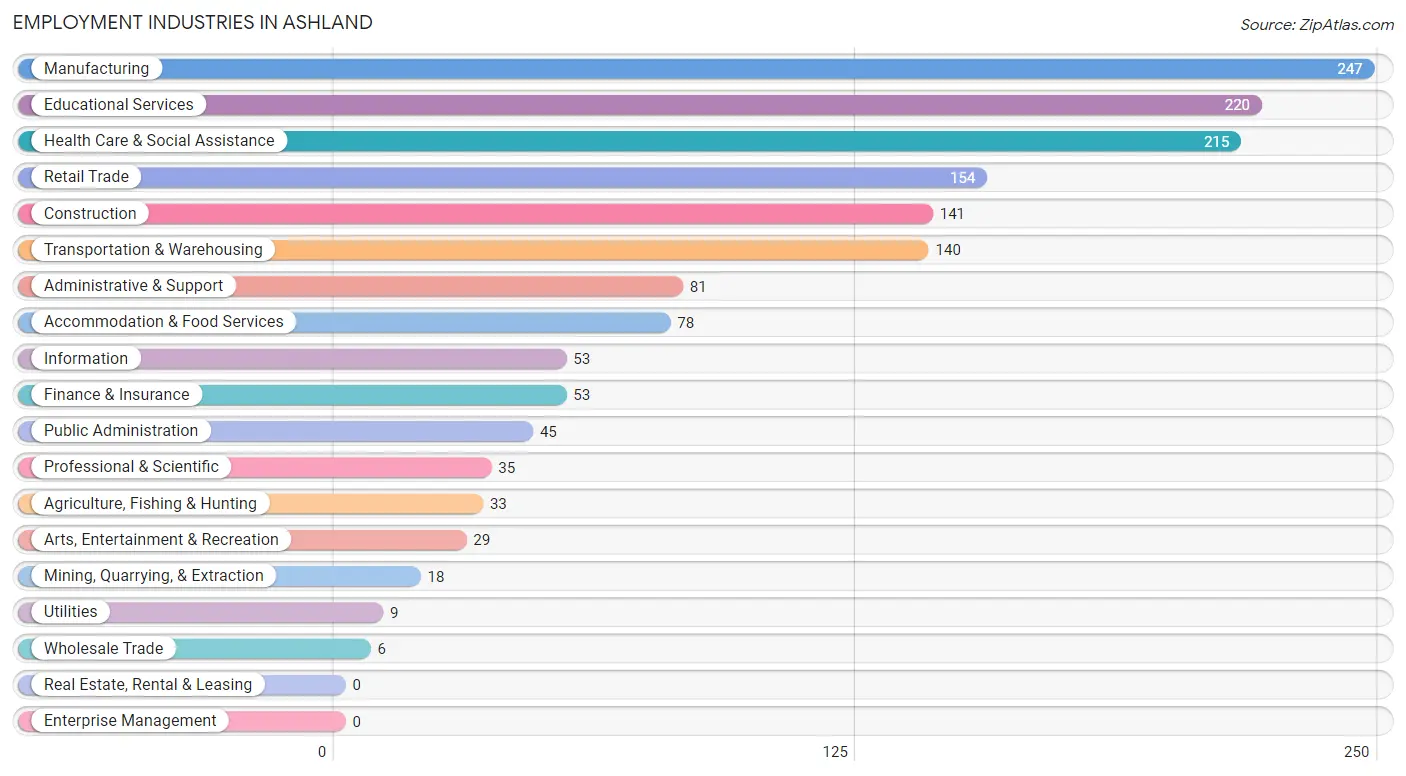
Employment Industries in Ashland
The major employment industries in Ashland include Manufacturing (247 | 15.1%), Educational Services (220 | 13.5%), Health Care & Social Assistance (215 | 13.2%), Retail Trade (154 | 9.4%), and Construction (141 | 8.6%).
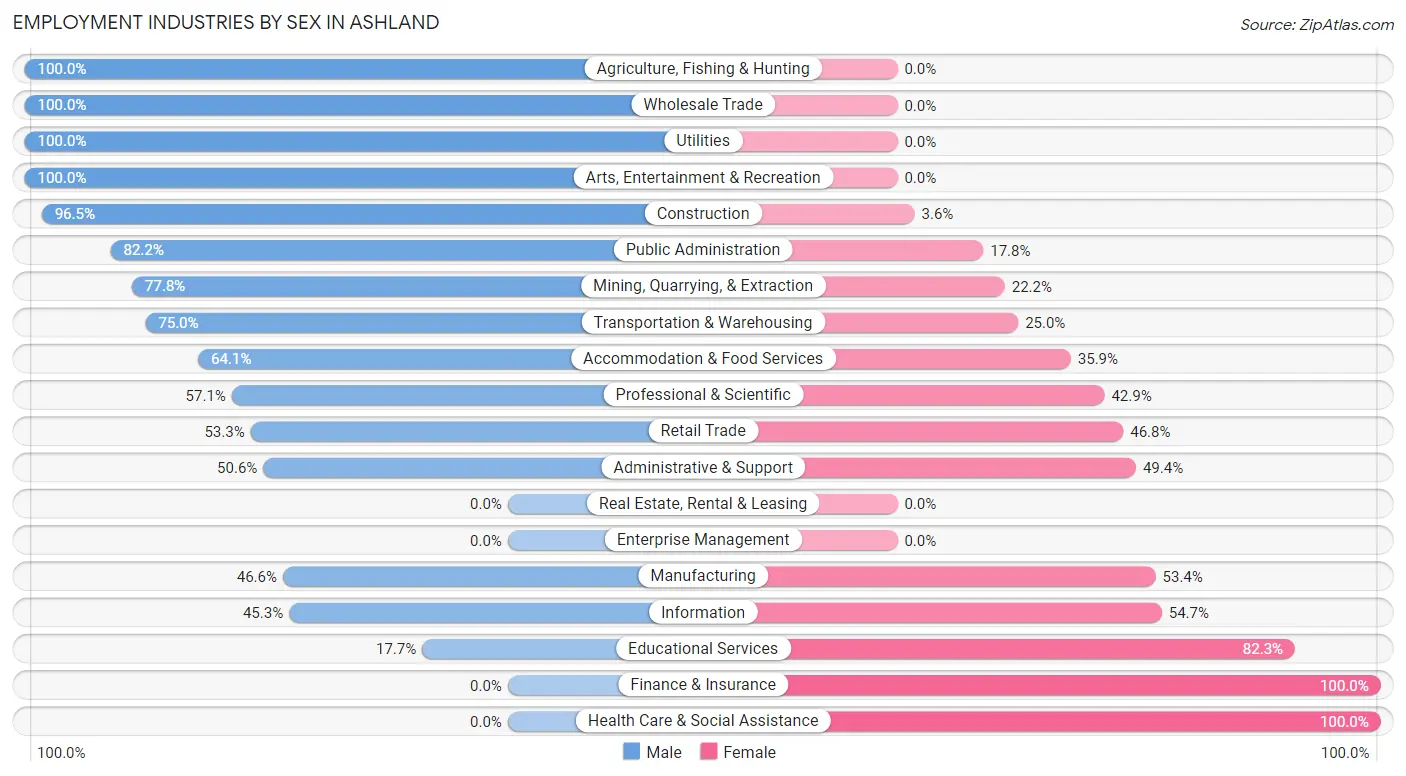
Employment Industries by Sex in Ashland
The Ashland industries that see more men than women are Agriculture, Fishing & Hunting (100.0%), Wholesale Trade (100.0%), and Utilities (100.0%), whereas the industries that tend to have a higher number of women are Finance & Insurance (100.0%), Health Care & Social Assistance (100.0%), and Educational Services (82.3%).
| Industry | Male | Female |
| Agriculture, Fishing & Hunting | 33 (100.0%) | 0 (0.0%) |
| Mining, Quarrying, & Extraction | 14 (77.8%) | 4 (22.2%) |
| Construction | 136 (96.5%) | 5 (3.5%) |
| Manufacturing | 115 (46.6%) | 132 (53.4%) |
| Wholesale Trade | 6 (100.0%) | 0 (0.0%) |
| Retail Trade | 82 (53.2%) | 72 (46.8%) |
| Transportation & Warehousing | 105 (75.0%) | 35 (25.0%) |
| Utilities | 9 (100.0%) | 0 (0.0%) |
| Information | 24 (45.3%) | 29 (54.7%) |
| Finance & Insurance | 0 (0.0%) | 53 (100.0%) |
| Real Estate, Rental & Leasing | 0 (0.0%) | 0 (0.0%) |
| Professional & Scientific | 20 (57.1%) | 15 (42.9%) |
| Enterprise Management | 0 (0.0%) | 0 (0.0%) |
| Administrative & Support | 41 (50.6%) | 40 (49.4%) |
| Educational Services | 39 (17.7%) | 181 (82.3%) |
| Health Care & Social Assistance | 0 (0.0%) | 215 (100.0%) |
| Arts, Entertainment & Recreation | 29 (100.0%) | 0 (0.0%) |
| Accommodation & Food Services | 50 (64.1%) | 28 (35.9%) |
| Public Administration | 37 (82.2%) | 8 (17.8%) |
| Total | 781 (47.9%) | 850 (52.1%) |
Education in Ashland
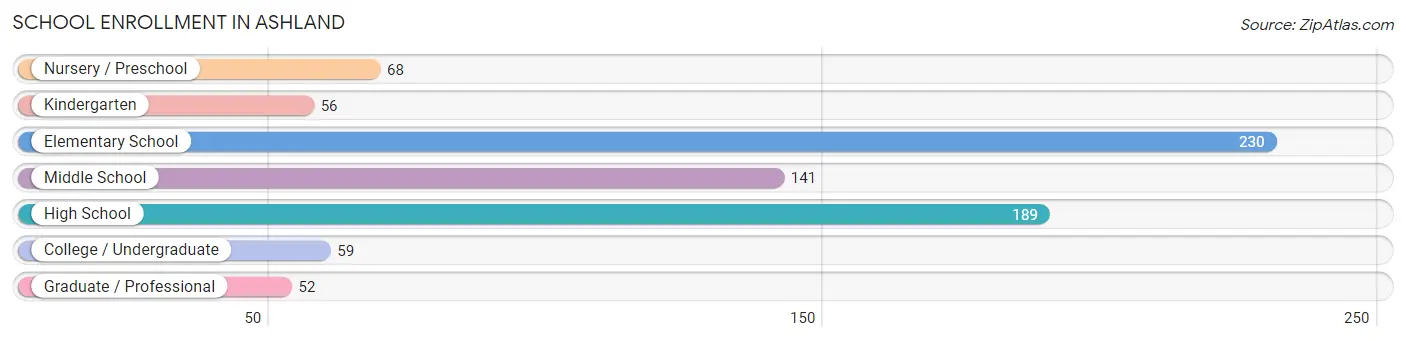
School Enrollment in Ashland
The most common levels of schooling among the 795 students in Ashland are elementary school (230 | 28.9%), high school (189 | 23.8%), and middle school (141 | 17.7%).
| School Level | # Students | % Students |
| Nursery / Preschool | 68 | 8.6% |
| Kindergarten | 56 | 7.0% |
| Elementary School | 230 | 28.9% |
| Middle School | 141 | 17.7% |
| High School | 189 | 23.8% |
| College / Undergraduate | 59 | 7.4% |
| Graduate / Professional | 52 | 6.5% |
| Total | 795 | 100.0% |
School Enrollment by Age by Funding Source in Ashland
Out of a total of 795 students who are enrolled in schools in Ashland, 91 (11.4%) attend a private institution, while the remaining 704 (88.6%) are enrolled in public schools. The age group of 35 years and over has the highest likelihood of being enrolled in private schools, with 22 (31.0% in the age bracket) enrolled. Conversely, the age group of 18 to 19 year olds has the lowest likelihood of being enrolled in a private school, with 51 (100.0% in the age bracket) attending a public institution.
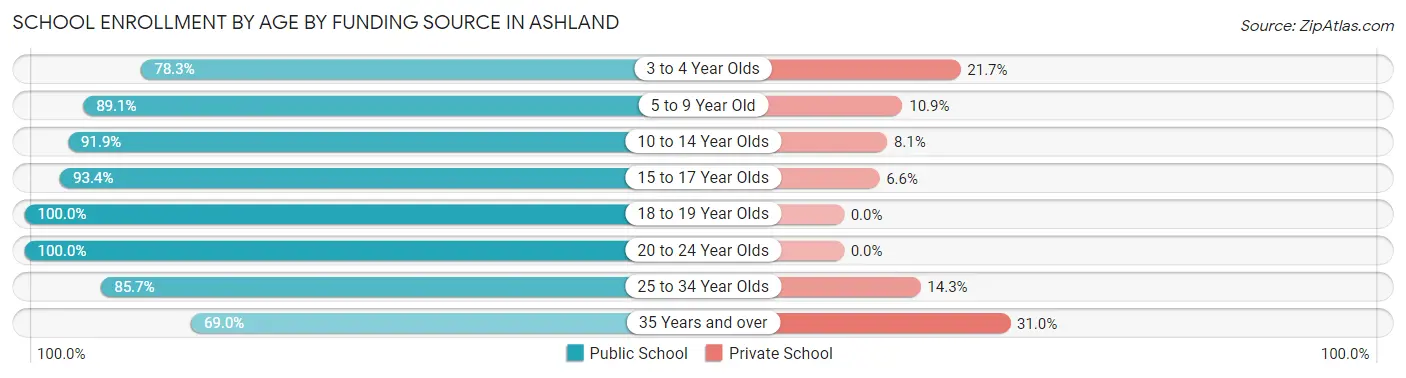
| Age Bracket | Public School | Private School |
| 3 to 4 Year Olds | 36 (78.3%) | 10 (21.7%) |
| 5 to 9 Year Old | 253 (89.1%) | 31 (10.9%) |
| 10 to 14 Year Olds | 148 (91.9%) | 13 (8.1%) |
| 15 to 17 Year Olds | 127 (93.4%) | 9 (6.6%) |
| 18 to 19 Year Olds | 51 (100.0%) | 0 (0.0%) |
| 20 to 24 Year Olds | 4 (100.0%) | 0 (0.0%) |
| 25 to 34 Year Olds | 36 (85.7%) | 6 (14.3%) |
| 35 Years and over | 49 (69.0%) | 22 (31.0%) |
| Total | 704 (88.6%) | 91 (11.4%) |
Educational Attainment by Field of Study in Ashland
Education (177 | 24.6%), social sciences (91 | 12.6%), arts & humanities (79 | 11.0%), business (69 | 9.6%), and science & technology (62 | 8.6%) are the most common fields of study among 720 individuals in Ashland who have obtained a bachelor's degree or higher.
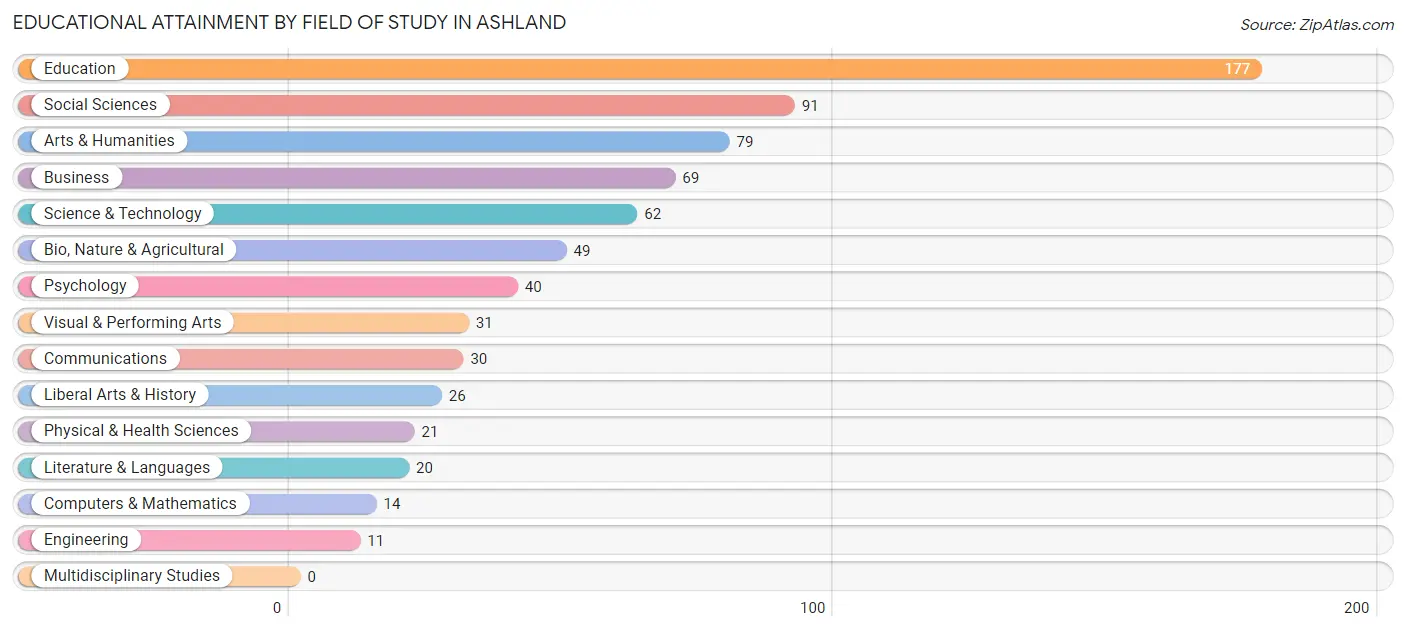
| Field of Study | # Graduates | % Graduates |
| Computers & Mathematics | 14 | 1.9% |
| Bio, Nature & Agricultural | 49 | 6.8% |
| Physical & Health Sciences | 21 | 2.9% |
| Psychology | 40 | 5.6% |
| Social Sciences | 91 | 12.6% |
| Engineering | 11 | 1.5% |
| Multidisciplinary Studies | 0 | 0.0% |
| Science & Technology | 62 | 8.6% |
| Business | 69 | 9.6% |
| Education | 177 | 24.6% |
| Literature & Languages | 20 | 2.8% |
| Liberal Arts & History | 26 | 3.6% |
| Visual & Performing Arts | 31 | 4.3% |
| Communications | 30 | 4.2% |
| Arts & Humanities | 79 | 11.0% |
| Total | 720 | 100.0% |
Transportation & Commute in Ashland
Vehicle Availability by Sex in Ashland
The most prevalent vehicle ownership categories in Ashland are males with 2 vehicles (231, accounting for 31.6%) and females with 2 vehicles (247, making up 29.4%).
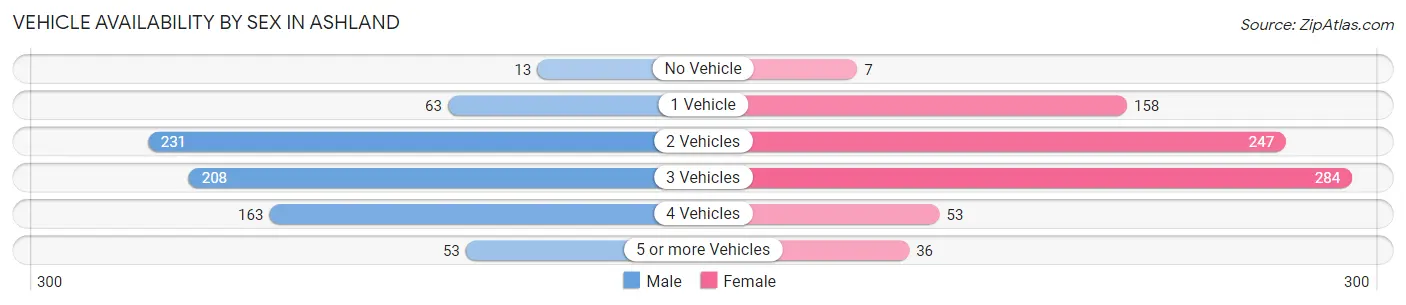
| Vehicles Available | Male | Female |
| No Vehicle | 13 (1.8%) | 7 (0.9%) |
| 1 Vehicle | 63 (8.6%) | 158 (20.1%) |
| 2 Vehicles | 231 (31.6%) | 247 (31.5%) |
| 3 Vehicles | 208 (28.4%) | 284 (36.2%) |
| 4 Vehicles | 163 (22.3%) | 53 (6.8%) |
| 5 or more Vehicles | 53 (7.2%) | 36 (4.6%) |
| Total | 731 (100.0%) | 785 (100.0%) |
Commute Time in Ashland
The most frequently occuring commute durations in Ashland are 30 to 34 minutes (297 commuters, 20.9%), 5 to 9 minutes (175 commuters, 12.3%), and 10 to 14 minutes (172 commuters, 12.1%).
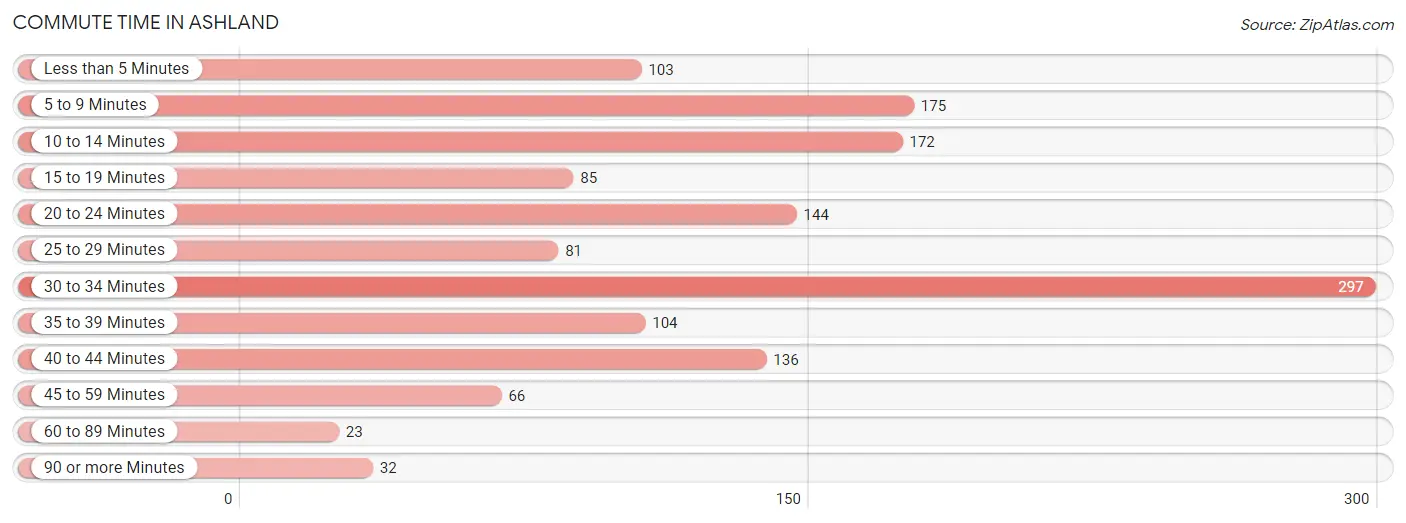
| Commute Time | # Commuters | % Commuters |
| Less than 5 Minutes | 103 | 7.3% |
| 5 to 9 Minutes | 175 | 12.3% |
| 10 to 14 Minutes | 172 | 12.1% |
| 15 to 19 Minutes | 85 | 6.0% |
| 20 to 24 Minutes | 144 | 10.2% |
| 25 to 29 Minutes | 81 | 5.7% |
| 30 to 34 Minutes | 297 | 20.9% |
| 35 to 39 Minutes | 104 | 7.3% |
| 40 to 44 Minutes | 136 | 9.6% |
| 45 to 59 Minutes | 66 | 4.6% |
| 60 to 89 Minutes | 23 | 1.6% |
| 90 or more Minutes | 32 | 2.3% |
Commute Time by Sex in Ashland
The most common commute times in Ashland are 30 to 34 minutes (179 commuters, 25.8%) for males and 5 to 9 minutes (125 commuters, 17.3%) for females.
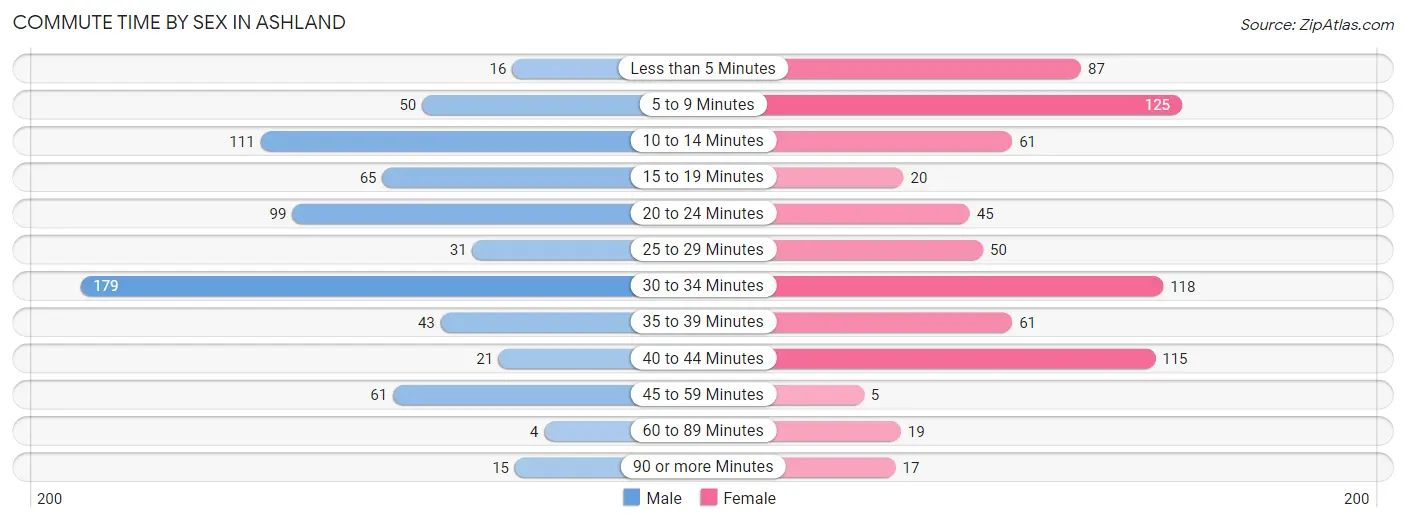
| Commute Time | Male | Female |
| Less than 5 Minutes | 16 (2.3%) | 87 (12.0%) |
| 5 to 9 Minutes | 50 (7.2%) | 125 (17.3%) |
| 10 to 14 Minutes | 111 (16.0%) | 61 (8.4%) |
| 15 to 19 Minutes | 65 (9.3%) | 20 (2.8%) |
| 20 to 24 Minutes | 99 (14.2%) | 45 (6.2%) |
| 25 to 29 Minutes | 31 (4.5%) | 50 (6.9%) |
| 30 to 34 Minutes | 179 (25.8%) | 118 (16.3%) |
| 35 to 39 Minutes | 43 (6.2%) | 61 (8.4%) |
| 40 to 44 Minutes | 21 (3.0%) | 115 (15.9%) |
| 45 to 59 Minutes | 61 (8.8%) | 5 (0.7%) |
| 60 to 89 Minutes | 4 (0.6%) | 19 (2.6%) |
| 90 or more Minutes | 15 (2.2%) | 17 (2.4%) |
Time of Departure to Work by Sex in Ashland
The most frequent times of departure to work in Ashland are 6:30 AM to 6:59 AM (166, 23.9%) for males and 8:00 AM to 8:29 AM (123, 17.0%) for females.
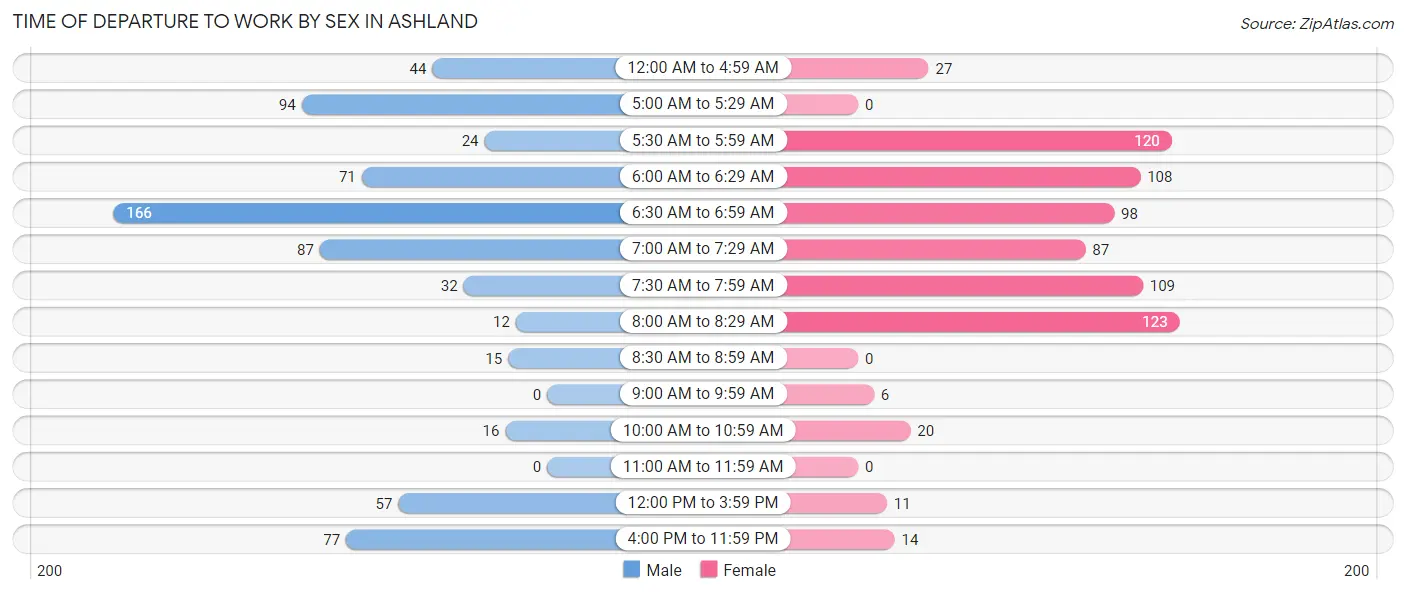
| Time of Departure | Male | Female |
| 12:00 AM to 4:59 AM | 44 (6.3%) | 27 (3.7%) |
| 5:00 AM to 5:29 AM | 94 (13.5%) | 0 (0.0%) |
| 5:30 AM to 5:59 AM | 24 (3.5%) | 120 (16.6%) |
| 6:00 AM to 6:29 AM | 71 (10.2%) | 108 (14.9%) |
| 6:30 AM to 6:59 AM | 166 (23.9%) | 98 (13.6%) |
| 7:00 AM to 7:29 AM | 87 (12.5%) | 87 (12.0%) |
| 7:30 AM to 7:59 AM | 32 (4.6%) | 109 (15.1%) |
| 8:00 AM to 8:29 AM | 12 (1.7%) | 123 (17.0%) |
| 8:30 AM to 8:59 AM | 15 (2.2%) | 0 (0.0%) |
| 9:00 AM to 9:59 AM | 0 (0.0%) | 6 (0.8%) |
| 10:00 AM to 10:59 AM | 16 (2.3%) | 20 (2.8%) |
| 11:00 AM to 11:59 AM | 0 (0.0%) | 0 (0.0%) |
| 12:00 PM to 3:59 PM | 57 (8.2%) | 11 (1.5%) |
| 4:00 PM to 11:59 PM | 77 (11.1%) | 14 (1.9%) |
| Total | 695 (100.0%) | 723 (100.0%) |
Housing Occupancy in Ashland
Occupancy by Ownership in Ashland
Of the total 1,263 dwellings in Ashland, owner-occupied units account for 860 (68.1%), while renter-occupied units make up 403 (31.9%).
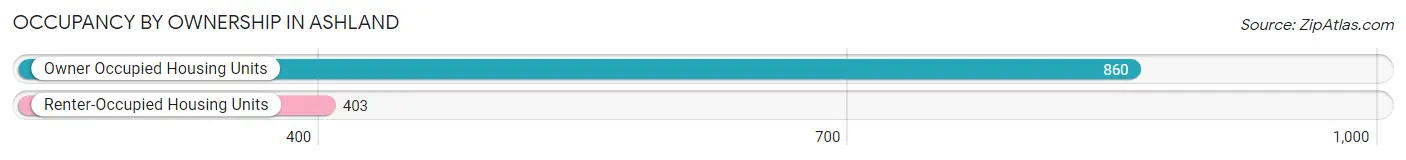
| Occupancy | # Housing Units | % Housing Units |
| Owner Occupied Housing Units | 860 | 68.1% |
| Renter-Occupied Housing Units | 403 | 31.9% |
| Total Occupied Housing Units | 1,263 | 100.0% |
Occupancy by Household Size in Ashland
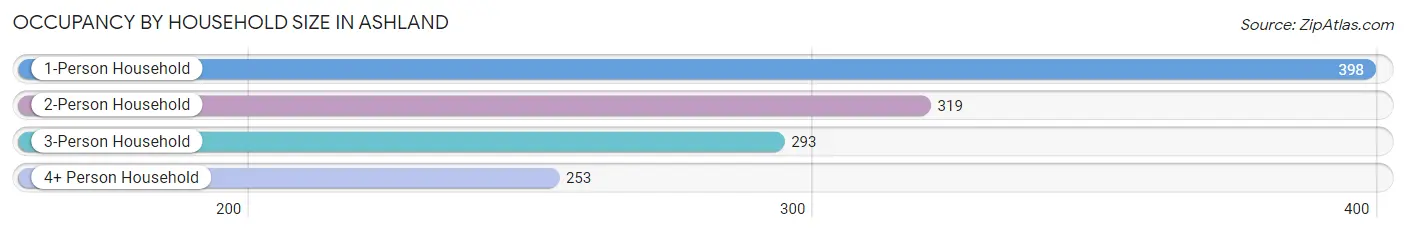
| Household Size | # Housing Units | % Housing Units |
| 1-Person Household | 398 | 31.5% |
| 2-Person Household | 319 | 25.3% |
| 3-Person Household | 293 | 23.2% |
| 4+ Person Household | 253 | 20.0% |
| Total Housing Units | 1,263 | 100.0% |
Occupancy by Ownership by Household Size in Ashland
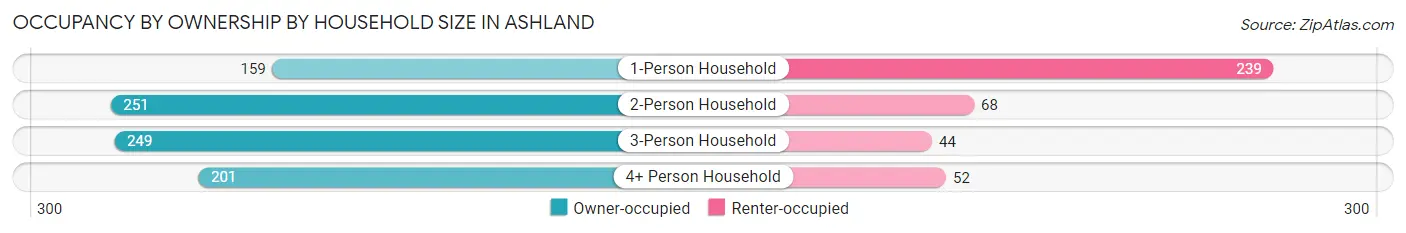
| Household Size | Owner-occupied | Renter-occupied |
| 1-Person Household | 159 (40.0%) | 239 (60.1%) |
| 2-Person Household | 251 (78.7%) | 68 (21.3%) |
| 3-Person Household | 249 (85.0%) | 44 (15.0%) |
| 4+ Person Household | 201 (79.4%) | 52 (20.5%) |
| Total Housing Units | 860 (68.1%) | 403 (31.9%) |
Occupancy by Educational Attainment in Ashland
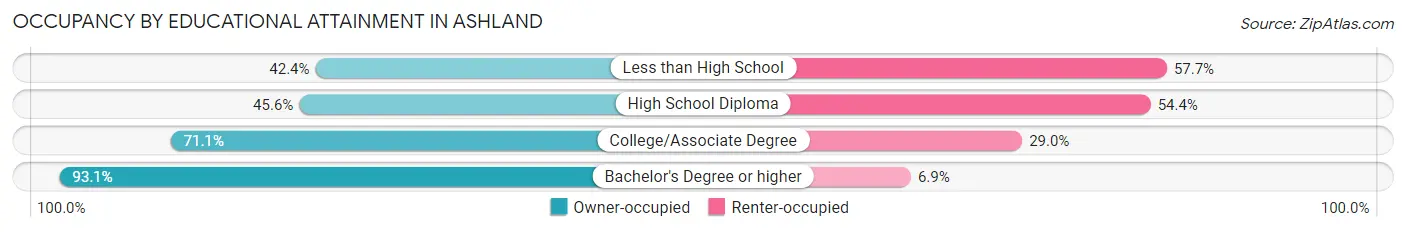
| Household Size | Owner-occupied | Renter-occupied |
| Less than High School | 36 (42.3%) | 49 (57.7%) |
| High School Diploma | 149 (45.6%) | 178 (54.4%) |
| College/Associate Degree | 378 (71.1%) | 154 (28.9%) |
| Bachelor's Degree or higher | 297 (93.1%) | 22 (6.9%) |
Occupancy by Age of Householder in Ashland
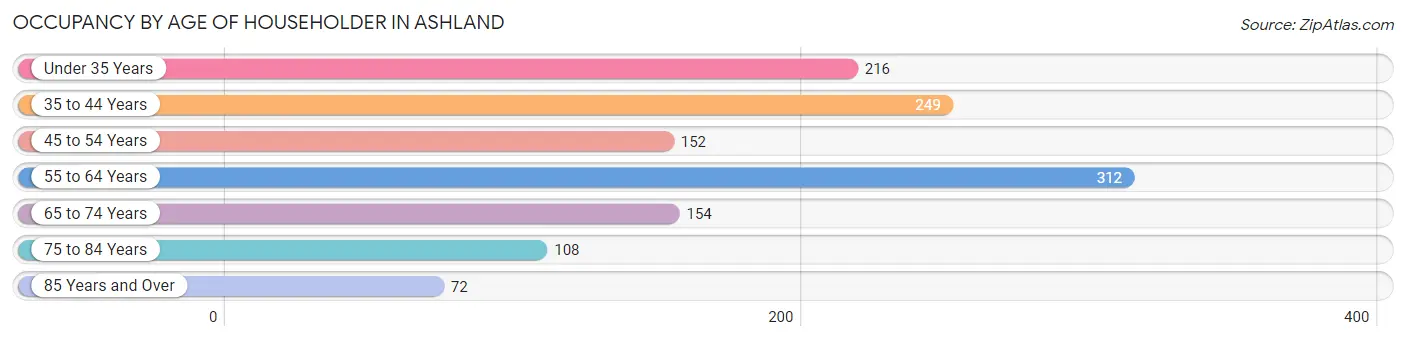
| Age Bracket | # Households | % Households |
| Under 35 Years | 216 | 17.1% |
| 35 to 44 Years | 249 | 19.7% |
| 45 to 54 Years | 152 | 12.0% |
| 55 to 64 Years | 312 | 24.7% |
| 65 to 74 Years | 154 | 12.2% |
| 75 to 84 Years | 108 | 8.6% |
| 85 Years and Over | 72 | 5.7% |
| Total | 1,263 | 100.0% |
Housing Finances in Ashland
Median Income by Occupancy in Ashland
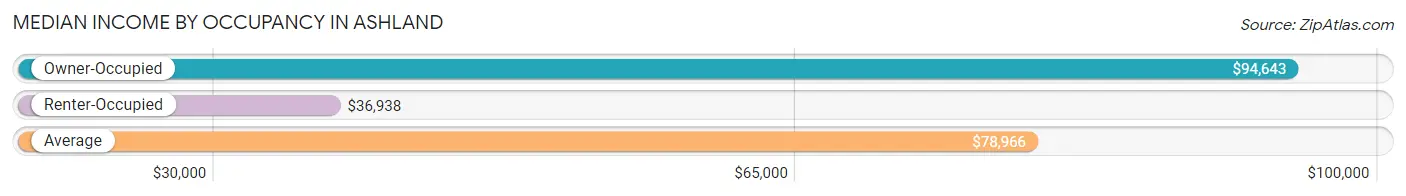
| Occupancy Type | # Households | Median Income |
| Owner-Occupied | 860 (68.1%) | $94,643 |
| Renter-Occupied | 403 (31.9%) | $36,938 |
| Average | 1,263 (100.0%) | $78,966 |
Occupancy by Householder Income Bracket in Ashland
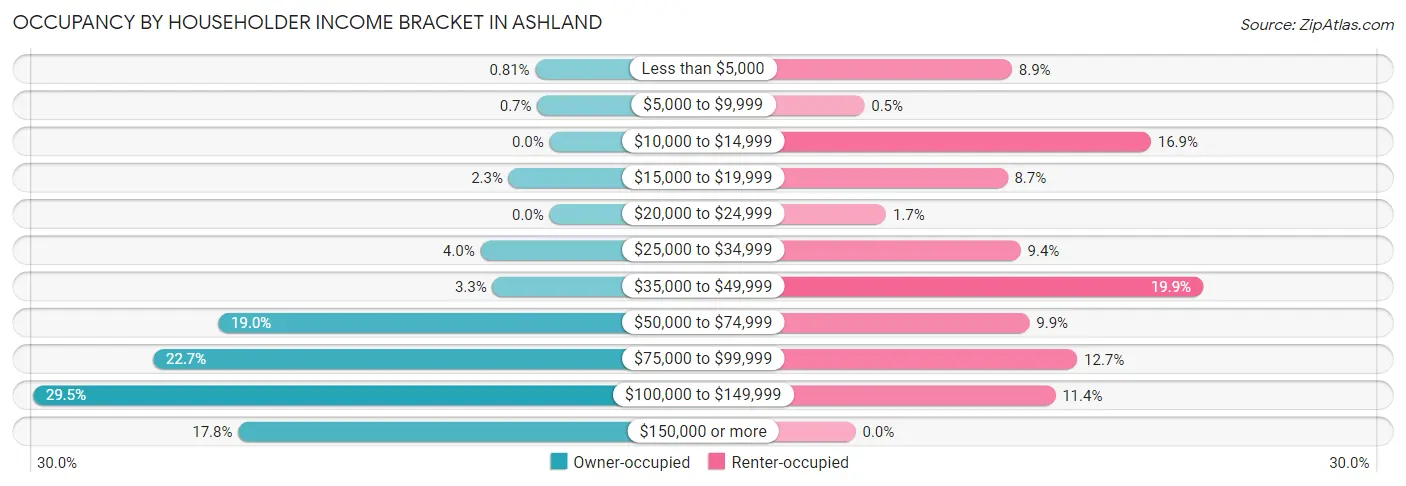
| Income Bracket | Owner-occupied | Renter-occupied |
| Less than $5,000 | 7 (0.8%) | 36 (8.9%) |
| $5,000 to $9,999 | 6 (0.7%) | 2 (0.5%) |
| $10,000 to $14,999 | 0 (0.0%) | 68 (16.9%) |
| $15,000 to $19,999 | 20 (2.3%) | 35 (8.7%) |
| $20,000 to $24,999 | 0 (0.0%) | 7 (1.7%) |
| $25,000 to $34,999 | 34 (4.0%) | 38 (9.4%) |
| $35,000 to $49,999 | 28 (3.3%) | 80 (19.9%) |
| $50,000 to $74,999 | 163 (19.0%) | 40 (9.9%) |
| $75,000 to $99,999 | 195 (22.7%) | 51 (12.7%) |
| $100,000 to $149,999 | 254 (29.5%) | 46 (11.4%) |
| $150,000 or more | 153 (17.8%) | 0 (0.0%) |
| Total | 860 (100.0%) | 403 (100.0%) |
Monthly Housing Cost Tiers in Ashland
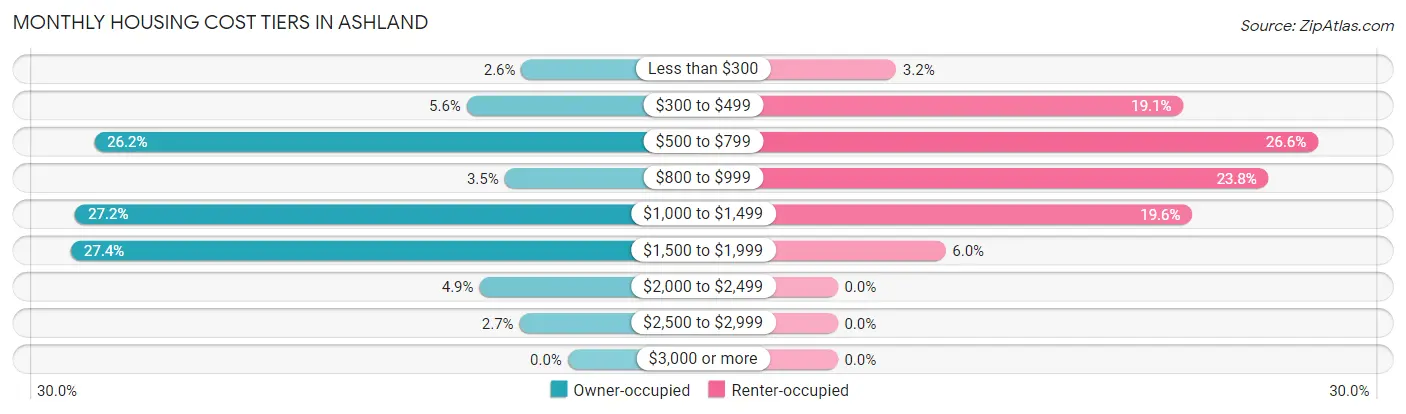
| Monthly Cost | Owner-occupied | Renter-occupied |
| Less than $300 | 22 (2.6%) | 13 (3.2%) |
| $300 to $499 | 48 (5.6%) | 77 (19.1%) |
| $500 to $799 | 225 (26.2%) | 107 (26.6%) |
| $800 to $999 | 30 (3.5%) | 96 (23.8%) |
| $1,000 to $1,499 | 234 (27.2%) | 79 (19.6%) |
| $1,500 to $1,999 | 236 (27.4%) | 24 (6.0%) |
| $2,000 to $2,499 | 42 (4.9%) | 0 (0.0%) |
| $2,500 to $2,999 | 23 (2.7%) | 0 (0.0%) |
| $3,000 or more | 0 (0.0%) | 0 (0.0%) |
| Total | 860 (100.0%) | 403 (100.0%) |
Physical Housing Characteristics in Ashland
Housing Structures in Ashland
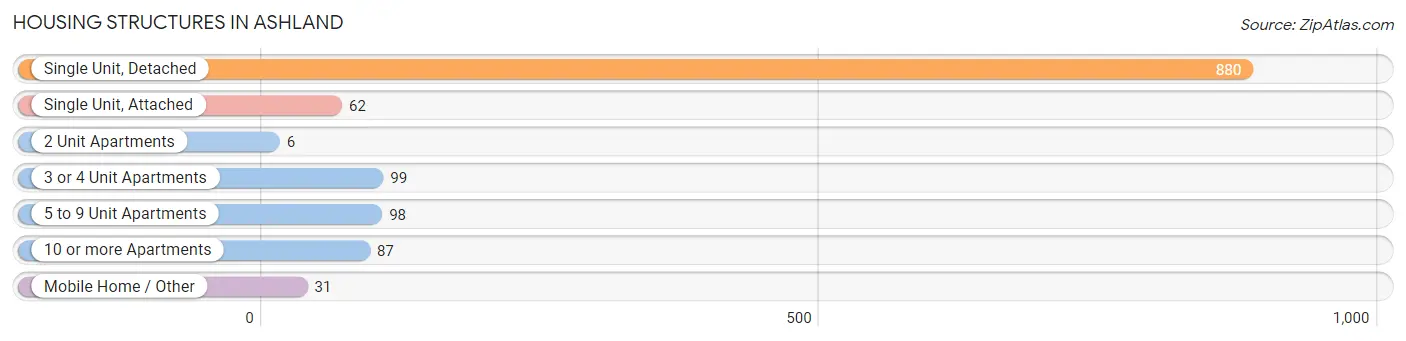
| Structure Type | # Housing Units | % Housing Units |
| Single Unit, Detached | 880 | 69.7% |
| Single Unit, Attached | 62 | 4.9% |
| 2 Unit Apartments | 6 | 0.5% |
| 3 or 4 Unit Apartments | 99 | 7.8% |
| 5 to 9 Unit Apartments | 98 | 7.8% |
| 10 or more Apartments | 87 | 6.9% |
| Mobile Home / Other | 31 | 2.5% |
| Total | 1,263 | 100.0% |
Housing Structures by Occupancy in Ashland
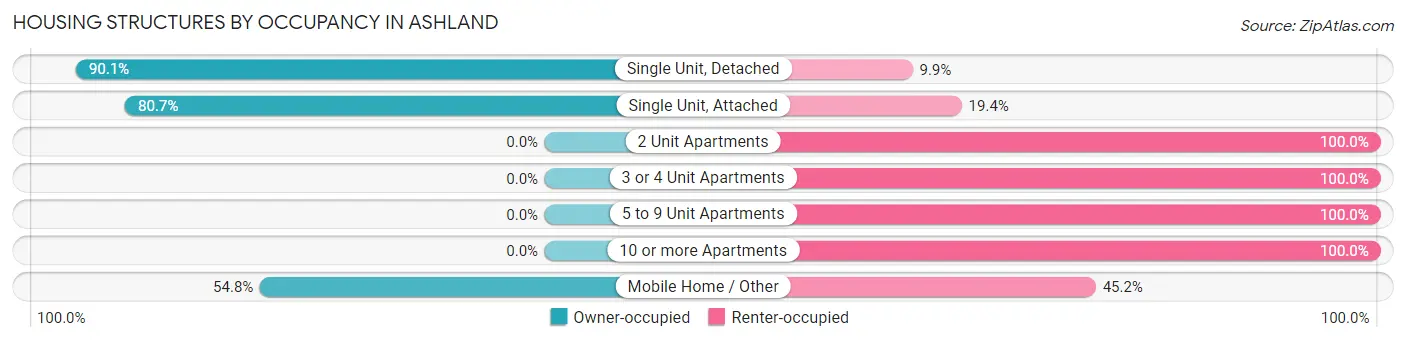
| Structure Type | Owner-occupied | Renter-occupied |
| Single Unit, Detached | 793 (90.1%) | 87 (9.9%) |
| Single Unit, Attached | 50 (80.6%) | 12 (19.4%) |
| 2 Unit Apartments | 0 (0.0%) | 6 (100.0%) |
| 3 or 4 Unit Apartments | 0 (0.0%) | 99 (100.0%) |
| 5 to 9 Unit Apartments | 0 (0.0%) | 98 (100.0%) |
| 10 or more Apartments | 0 (0.0%) | 87 (100.0%) |
| Mobile Home / Other | 17 (54.8%) | 14 (45.2%) |
| Total | 860 (68.1%) | 403 (31.9%) |
Housing Structures by Number of Rooms in Ashland
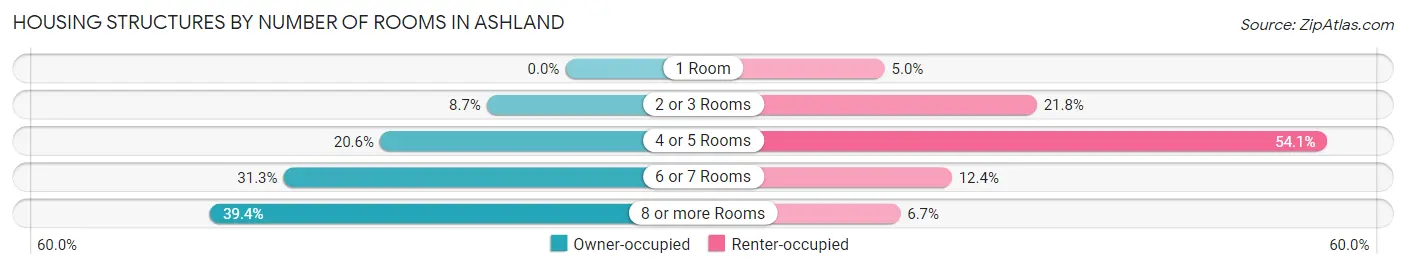
| Number of Rooms | Owner-occupied | Renter-occupied |
| 1 Room | 0 (0.0%) | 20 (5.0%) |
| 2 or 3 Rooms | 75 (8.7%) | 88 (21.8%) |
| 4 or 5 Rooms | 177 (20.6%) | 218 (54.1%) |
| 6 or 7 Rooms | 269 (31.3%) | 50 (12.4%) |
| 8 or more Rooms | 339 (39.4%) | 27 (6.7%) |
| Total | 860 (100.0%) | 403 (100.0%) |
Housing Structure by Heating Type in Ashland
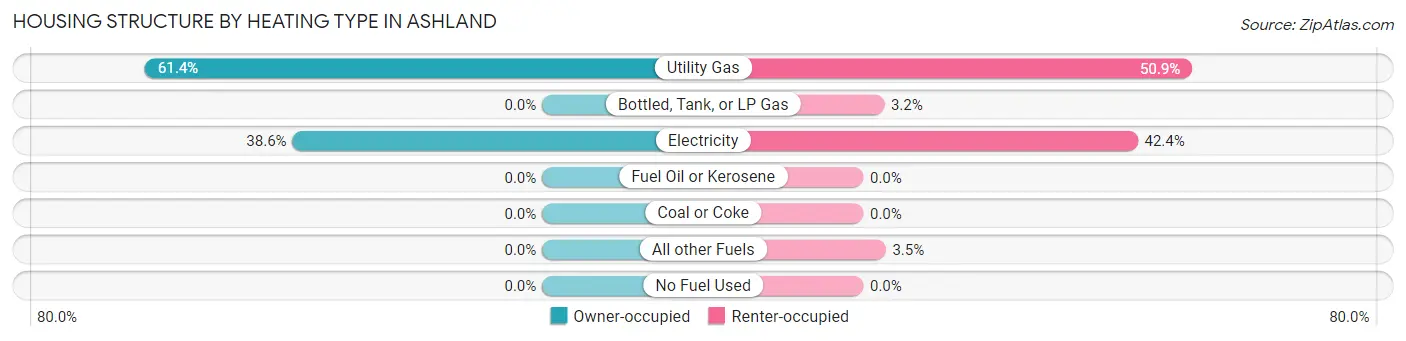
| Heating Type | Owner-occupied | Renter-occupied |
| Utility Gas | 528 (61.4%) | 205 (50.9%) |
| Bottled, Tank, or LP Gas | 0 (0.0%) | 13 (3.2%) |
| Electricity | 332 (38.6%) | 171 (42.4%) |
| Fuel Oil or Kerosene | 0 (0.0%) | 0 (0.0%) |
| Coal or Coke | 0 (0.0%) | 0 (0.0%) |
| All other Fuels | 0 (0.0%) | 14 (3.5%) |
| No Fuel Used | 0 (0.0%) | 0 (0.0%) |
| Total | 860 (100.0%) | 403 (100.0%) |
Household Vehicle Usage in Ashland
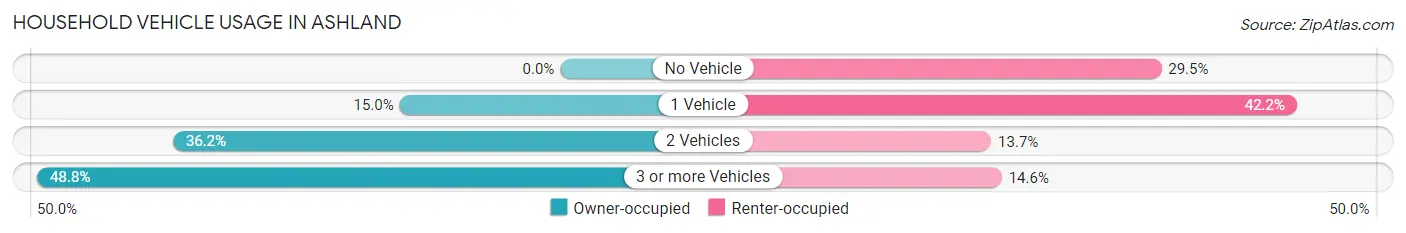
| Vehicles per Household | Owner-occupied | Renter-occupied |
| No Vehicle | 0 (0.0%) | 119 (29.5%) |
| 1 Vehicle | 129 (15.0%) | 170 (42.2%) |
| 2 Vehicles | 311 (36.2%) | 55 (13.7%) |
| 3 or more Vehicles | 420 (48.8%) | 59 (14.6%) |
| Total | 860 (100.0%) | 403 (100.0%) |
Real Estate & Mortgages in Ashland
Real Estate and Mortgage Overview in Ashland
| Characteristic | Without Mortgage | With Mortgage |
| Housing Units | 345 | 515 |
| Median Property Value | $265,800 | $212,500 |
| Median Household Income | $73,675 | $126 |
| Monthly Housing Costs | $671 | $0 |
| Real Estate Taxes | $3,471 | $28 |
Property Value by Mortgage Status in Ashland
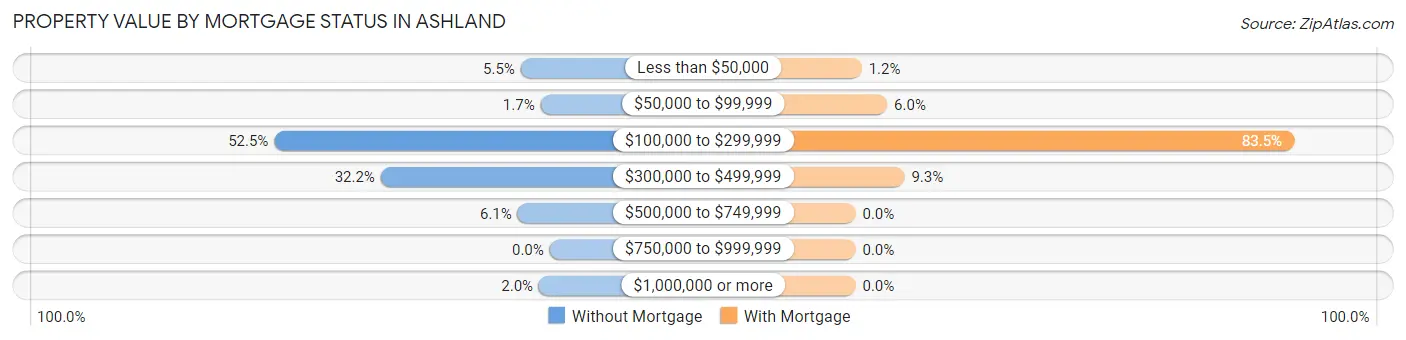
| Property Value | Without Mortgage | With Mortgage |
| Less than $50,000 | 19 (5.5%) | 6 (1.2%) |
| $50,000 to $99,999 | 6 (1.7%) | 31 (6.0%) |
| $100,000 to $299,999 | 181 (52.5%) | 430 (83.5%) |
| $300,000 to $499,999 | 111 (32.2%) | 48 (9.3%) |
| $500,000 to $749,999 | 21 (6.1%) | 0 (0.0%) |
| $750,000 to $999,999 | 0 (0.0%) | 0 (0.0%) |
| $1,000,000 or more | 7 (2.0%) | 0 (0.0%) |
| Total | 345 (100.0%) | 515 (100.0%) |
Household Income by Mortgage Status in Ashland
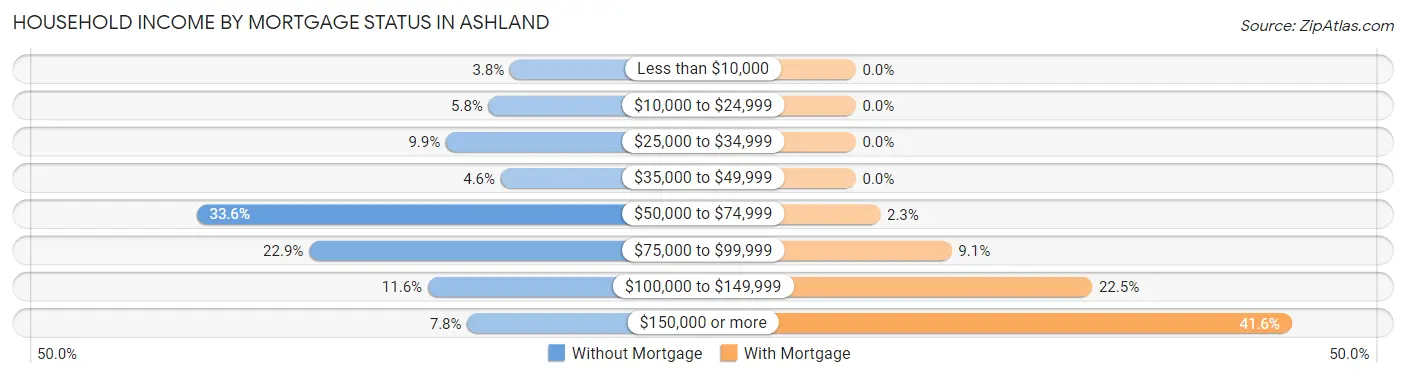
| Household Income | Without Mortgage | With Mortgage |
| Less than $10,000 | 13 (3.8%) | 0 (0.0%) |
| $10,000 to $24,999 | 20 (5.8%) | 0 (0.0%) |
| $25,000 to $34,999 | 34 (9.9%) | 0 (0.0%) |
| $35,000 to $49,999 | 16 (4.6%) | 0 (0.0%) |
| $50,000 to $74,999 | 116 (33.6%) | 12 (2.3%) |
| $75,000 to $99,999 | 79 (22.9%) | 47 (9.1%) |
| $100,000 to $149,999 | 40 (11.6%) | 116 (22.5%) |
| $150,000 or more | 27 (7.8%) | 214 (41.5%) |
| Total | 345 (100.0%) | 515 (100.0%) |
Property Value to Household Income Ratio in Ashland
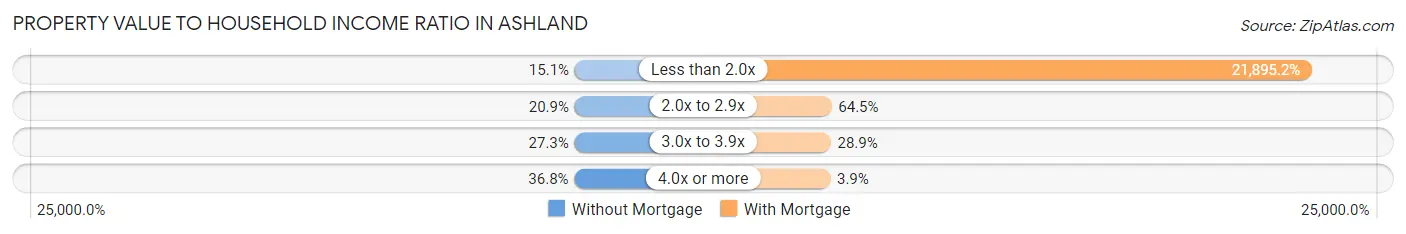
| Value-to-Income Ratio | Without Mortgage | With Mortgage |
| Less than 2.0x | 52 (15.1%) | 112,760 (21,895.2%) |
| 2.0x to 2.9x | 72 (20.9%) | 332 (64.5%) |
| 3.0x to 3.9x | 94 (27.3%) | 149 (28.9%) |
| 4.0x or more | 127 (36.8%) | 20 (3.9%) |
| Total | 345 (100.0%) | 515 (100.0%) |
Real Estate Taxes by Mortgage Status in Ashland
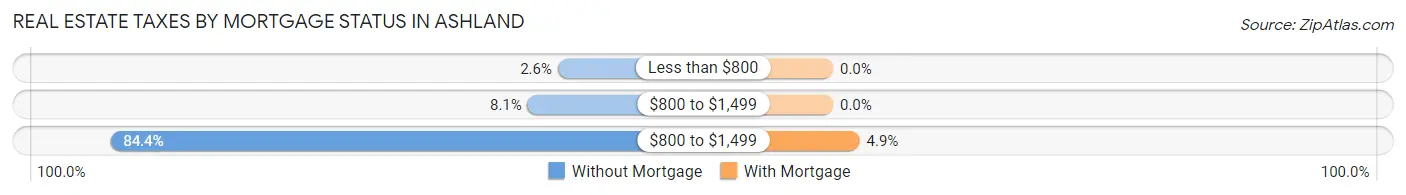
| Property Taxes | Without Mortgage | With Mortgage |
| Less than $800 | 9 (2.6%) | 0 (0.0%) |
| $800 to $1,499 | 28 (8.1%) | 0 (0.0%) |
| $800 to $1,499 | 291 (84.4%) | 25 (4.9%) |
| Total | 345 (100.0%) | 515 (100.0%) |
Health & Disability in Ashland
Health Insurance Coverage by Age in Ashland
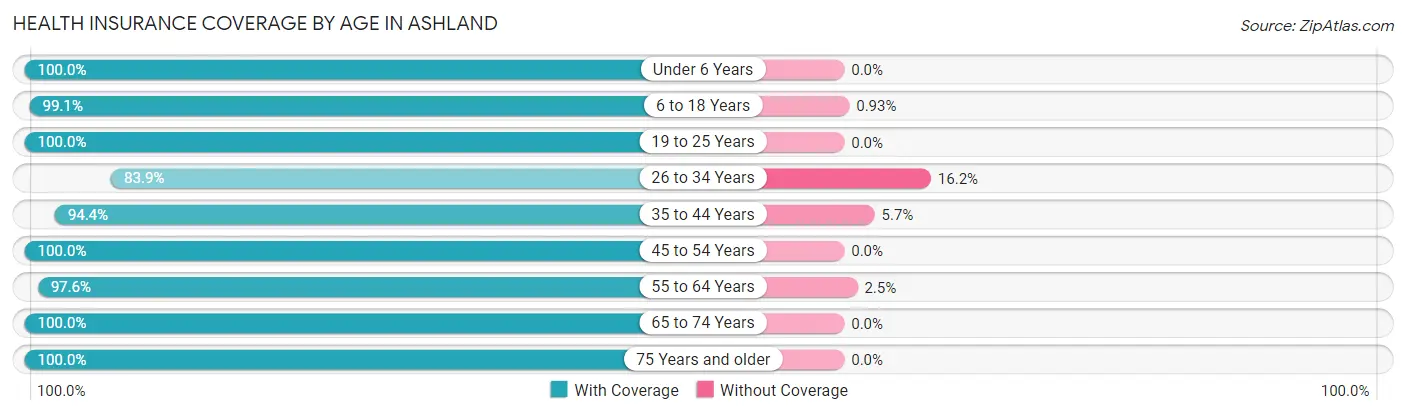
| Age Bracket | With Coverage | Without Coverage |
| Under 6 Years | 218 (100.0%) | 0 (0.0%) |
| 6 to 18 Years | 636 (99.1%) | 6 (0.9%) |
| 19 to 25 Years | 117 (100.0%) | 0 (0.0%) |
| 26 to 34 Years | 296 (83.9%) | 57 (16.2%) |
| 35 to 44 Years | 468 (94.4%) | 28 (5.7%) |
| 45 to 54 Years | 309 (100.0%) | 0 (0.0%) |
| 55 to 64 Years | 438 (97.6%) | 11 (2.5%) |
| 65 to 74 Years | 259 (100.0%) | 0 (0.0%) |
| 75 Years and older | 214 (100.0%) | 0 (0.0%) |
| Total | 2,955 (96.7%) | 102 (3.3%) |
Health Insurance Coverage by Citizenship Status in Ashland
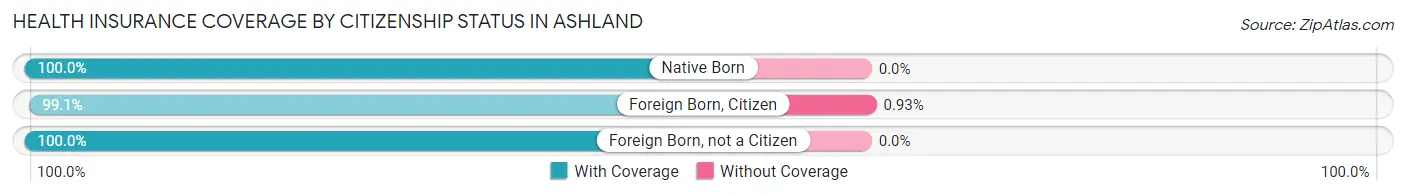
| Citizenship Status | With Coverage | Without Coverage |
| Native Born | 218 (100.0%) | 0 (0.0%) |
| Foreign Born, Citizen | 636 (99.1%) | 6 (0.9%) |
| Foreign Born, not a Citizen | 117 (100.0%) | 0 (0.0%) |
Health Insurance Coverage by Household Income in Ashland
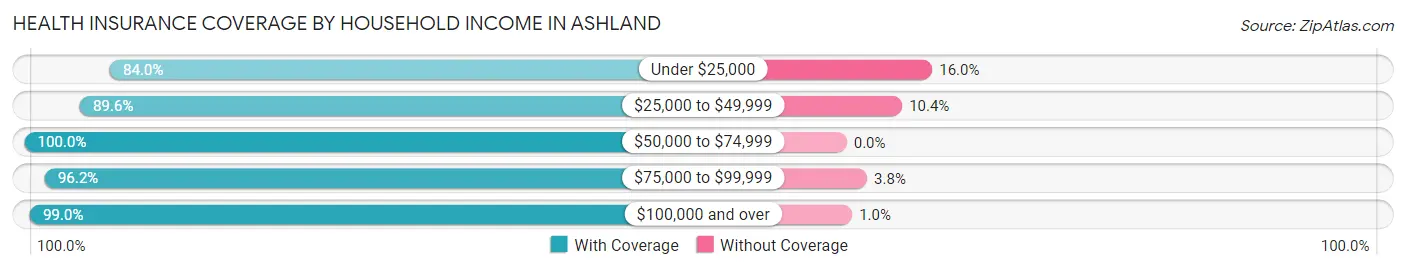
| Household Income | With Coverage | Without Coverage |
| Under $25,000 | 194 (84.0%) | 37 (16.0%) |
| $25,000 to $49,999 | 233 (89.6%) | 27 (10.4%) |
| $50,000 to $74,999 | 471 (100.0%) | 0 (0.0%) |
| $75,000 to $99,999 | 580 (96.2%) | 23 (3.8%) |
| $100,000 and over | 1,477 (99.0%) | 15 (1.0%) |
Public vs Private Health Insurance Coverage by Age in Ashland
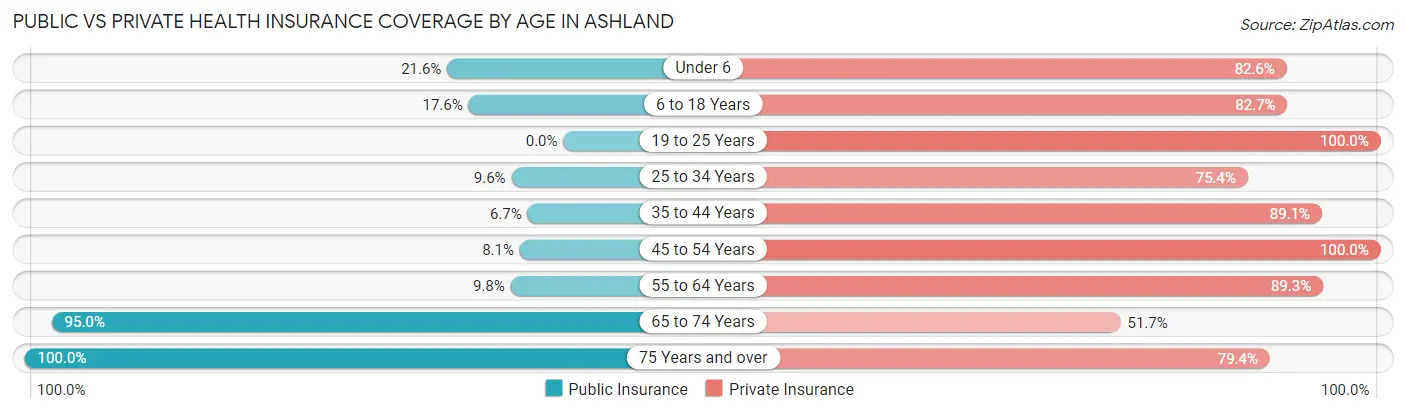
| Age Bracket | Public Insurance | Private Insurance |
| Under 6 | 47 (21.6%) | 180 (82.6%) |
| 6 to 18 Years | 113 (17.6%) | 531 (82.7%) |
| 19 to 25 Years | 0 (0.0%) | 117 (100.0%) |
| 25 to 34 Years | 34 (9.6%) | 266 (75.3%) |
| 35 to 44 Years | 33 (6.7%) | 442 (89.1%) |
| 45 to 54 Years | 25 (8.1%) | 309 (100.0%) |
| 55 to 64 Years | 44 (9.8%) | 401 (89.3%) |
| 65 to 74 Years | 246 (95.0%) | 134 (51.7%) |
| 75 Years and over | 214 (100.0%) | 170 (79.4%) |
| Total | 756 (24.7%) | 2,550 (83.4%) |
Disability Status by Sex by Age in Ashland
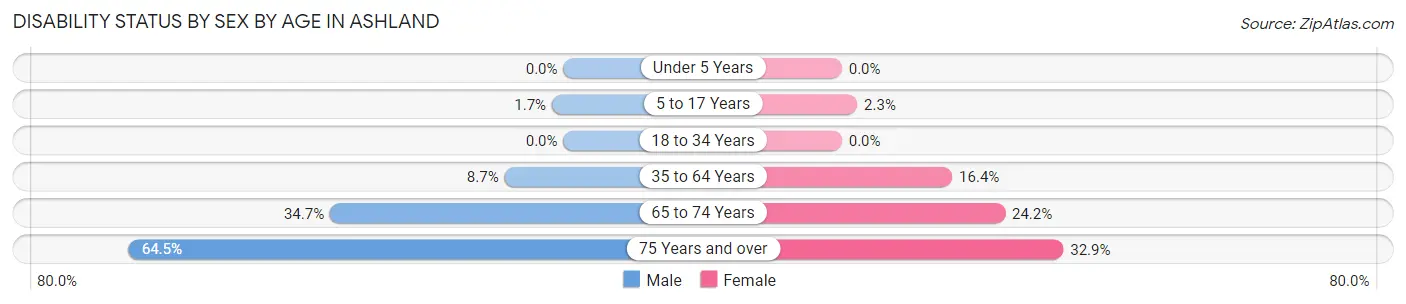
| Age Bracket | Male | Female |
| Under 5 Years | 0 (0.0%) | 0 (0.0%) |
| 5 to 17 Years | 5 (1.7%) | 7 (2.3%) |
| 18 to 34 Years | 0 (0.0%) | 0 (0.0%) |
| 35 to 64 Years | 52 (8.7%) | 108 (16.4%) |
| 65 to 74 Years | 44 (34.6%) | 32 (24.2%) |
| 75 Years and over | 40 (64.5%) | 50 (32.9%) |
Disability Class by Sex by Age in Ashland
Disability Class: Hearing Difficulty
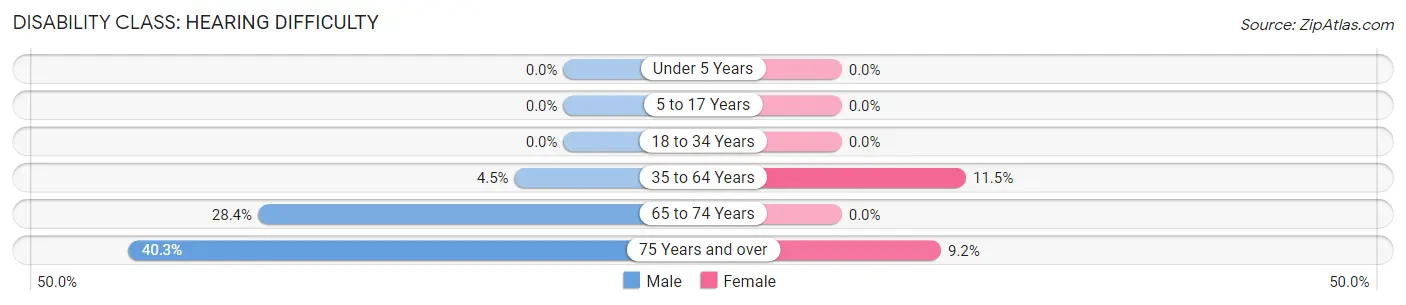
| Age Bracket | Male | Female |
| Under 5 Years | 0 (0.0%) | 0 (0.0%) |
| 5 to 17 Years | 0 (0.0%) | 0 (0.0%) |
| 18 to 34 Years | 0 (0.0%) | 0 (0.0%) |
| 35 to 64 Years | 27 (4.5%) | 76 (11.5%) |
| 65 to 74 Years | 36 (28.3%) | 0 (0.0%) |
| 75 Years and over | 25 (40.3%) | 14 (9.2%) |
Disability Class: Vision Difficulty
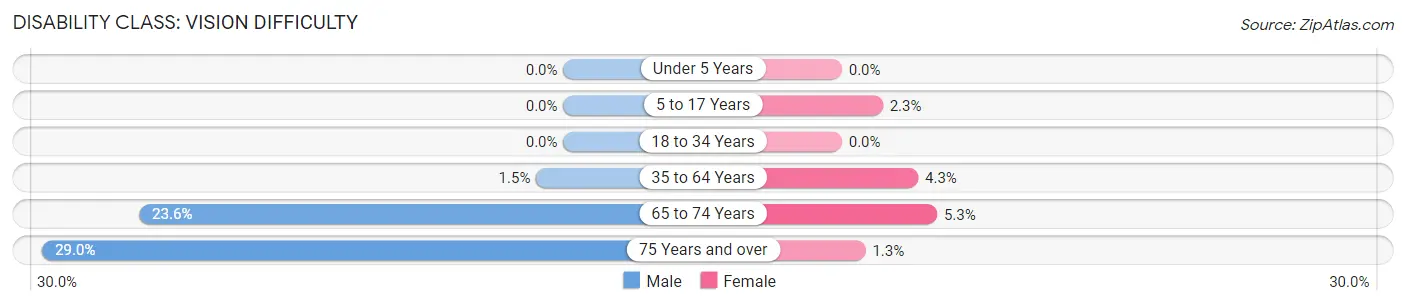
| Age Bracket | Male | Female |
| Under 5 Years | 0 (0.0%) | 0 (0.0%) |
| 5 to 17 Years | 0 (0.0%) | 7 (2.3%) |
| 18 to 34 Years | 0 (0.0%) | 0 (0.0%) |
| 35 to 64 Years | 9 (1.5%) | 28 (4.3%) |
| 65 to 74 Years | 30 (23.6%) | 7 (5.3%) |
| 75 Years and over | 18 (29.0%) | 2 (1.3%) |
Disability Class: Cognitive Difficulty
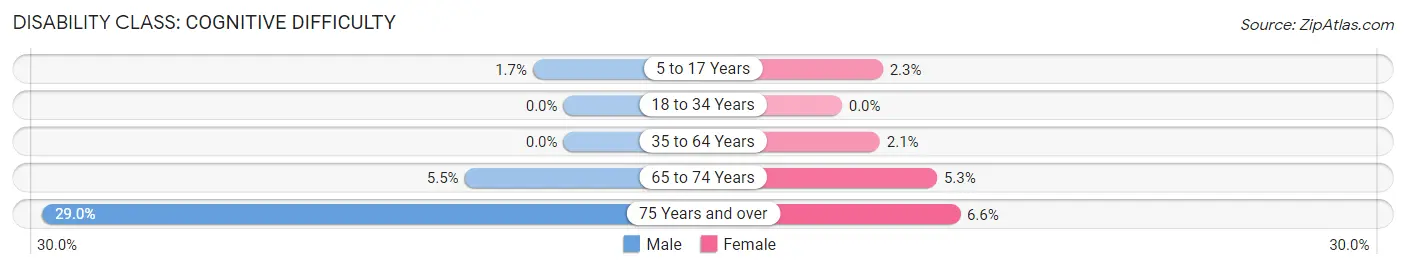
| Age Bracket | Male | Female |
| 5 to 17 Years | 5 (1.7%) | 7 (2.3%) |
| 18 to 34 Years | 0 (0.0%) | 0 (0.0%) |
| 35 to 64 Years | 0 (0.0%) | 14 (2.1%) |
| 65 to 74 Years | 7 (5.5%) | 7 (5.3%) |
| 75 Years and over | 18 (29.0%) | 10 (6.6%) |
Disability Class: Ambulatory Difficulty
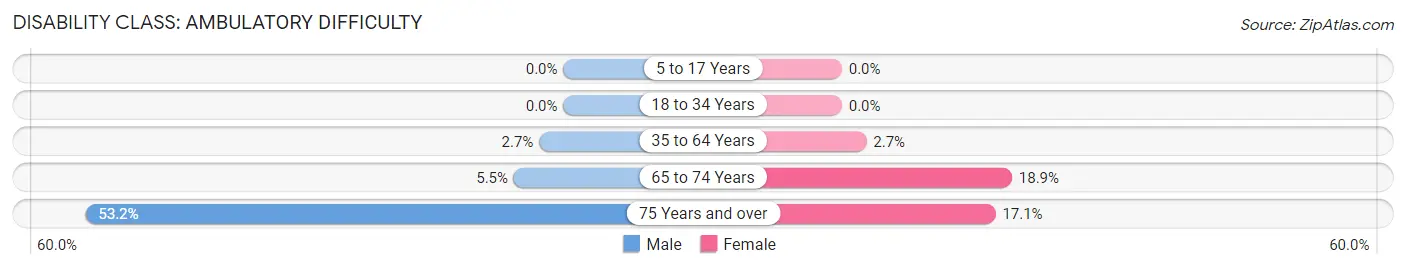
| Age Bracket | Male | Female |
| 5 to 17 Years | 0 (0.0%) | 0 (0.0%) |
| 18 to 34 Years | 0 (0.0%) | 0 (0.0%) |
| 35 to 64 Years | 16 (2.7%) | 18 (2.7%) |
| 65 to 74 Years | 7 (5.5%) | 25 (18.9%) |
| 75 Years and over | 33 (53.2%) | 26 (17.1%) |
Disability Class: Self-Care Difficulty
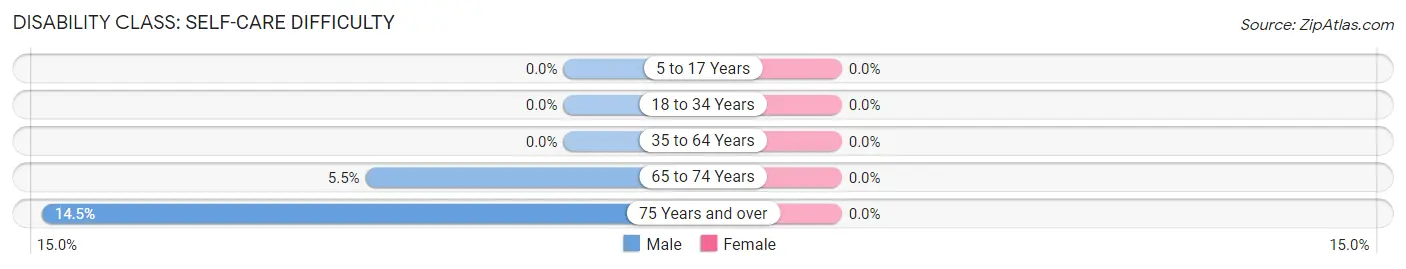
| Age Bracket | Male | Female |
| 5 to 17 Years | 0 (0.0%) | 0 (0.0%) |
| 18 to 34 Years | 0 (0.0%) | 0 (0.0%) |
| 35 to 64 Years | 0 (0.0%) | 0 (0.0%) |
| 65 to 74 Years | 7 (5.5%) | 0 (0.0%) |
| 75 Years and over | 9 (14.5%) | 0 (0.0%) |
Technology Access in Ashland
Computing Device Access in Ashland
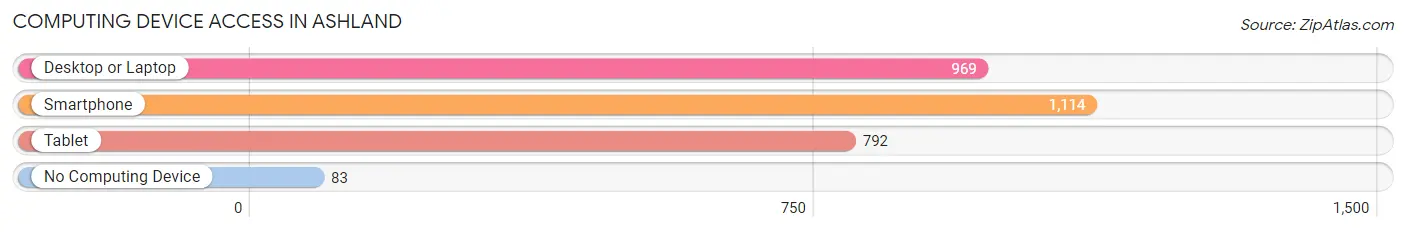
| Device Type | # Households | % Households |
| Desktop or Laptop | 969 | 76.7% |
| Smartphone | 1,114 | 88.2% |
| Tablet | 792 | 62.7% |
| No Computing Device | 83 | 6.6% |
| Total | 1,263 | 100.0% |
Internet Access in Ashland
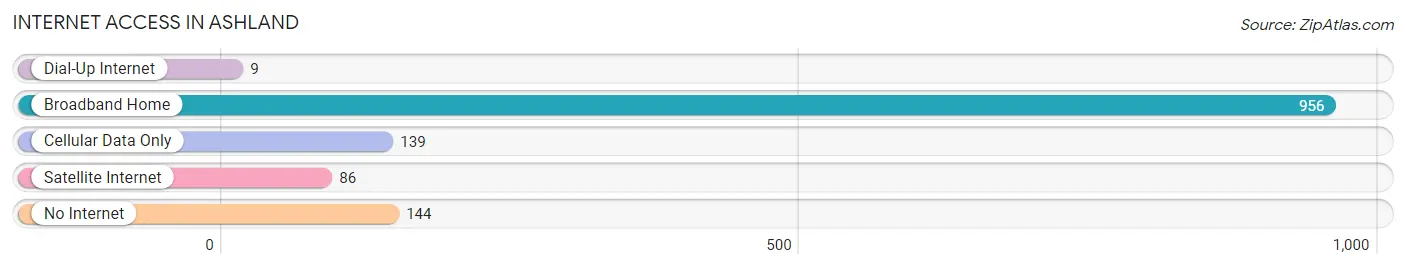
| Internet Type | # Households | % Households |
| Dial-Up Internet | 9 | 0.7% |
| Broadband Home | 956 | 75.7% |
| Cellular Data Only | 139 | 11.0% |
| Satellite Internet | 86 | 6.8% |
| No Internet | 144 | 11.4% |
| Total | 1,263 | 100.0% |
Ashland Summary
Ashland, Nebraska is a small city located in Saunders County, Nebraska, United States. It is situated along the Platte River, approximately 20 miles south of Omaha. The city has a population of approximately 6,000 people and is part of the Omaha-Council Bluffs metropolitan area.
History
The area that is now Ashland was first settled in 1854 by a group of settlers from Ohio. The town was originally known as “Ashland Station” and was named after the hometown of one of the settlers, Ashland, Ohio. The town was officially incorporated in 1887.
In the late 19th century, Ashland was a major stop on the Union Pacific Railroad. The railroad brought many new settlers to the area, and the town grew rapidly. By the early 20th century, Ashland had become a thriving agricultural center, with a variety of businesses and industries.
Geography
Ashland is located in Saunders County, Nebraska, approximately 20 miles south of Omaha. The city is situated along the Platte River, and is surrounded by rolling hills and farmland. The city has a total area of 4.2 square miles, all of which is land.
Economy
The economy of Ashland is largely based on agriculture and manufacturing. The city is home to several large agricultural businesses, including a feed mill, a grain elevator, and a dairy. The city also has several manufacturing businesses, including a plastics factory and a metal fabrication plant.
In addition to agriculture and manufacturing, Ashland is also home to several retail businesses, including a grocery store, a hardware store, and several restaurants. The city also has a small airport, which serves the surrounding area.
Demographics
As of the 2010 census, the population of Ashland was 6,068. The racial makeup of the city was 94.3% White, 0.7% African American, 0.3% Native American, 0.4% Asian, 0.1% Pacific Islander, 2.2% from other races, and 2.1% from two or more races. Hispanic or Latino of any race were 4.3% of the population.
The median income for a household in Ashland was $45,938, and the median income for a family was $51,938. The per capita income for the city was $20,938. About 8.3% of families and 10.2% of the population were below the poverty line, including 14.2% of those under age 18 and 6.2% of those age 65 or over.
Ashland is a small city with a rich history and a diverse economy. The city is home to a variety of businesses and industries, and is a popular destination for tourists and outdoor enthusiasts. With its close proximity to Omaha, Ashland is an ideal place to live and work.
Common Questions
What is Per Capita Income in Ashland?
Per Capita income in Ashland is $34,746.
What is the Median Family Income in Ashland?
Median Family Income in Ashland is $100,658.
What is the Median Household income in Ashland?
Median Household Income in Ashland is $78,966.
What is Income or Wage Gap in Ashland?
Income or Wage Gap in Ashland is 12.1%.
Women in Ashland earn 87.9 cents for every dollar earned by a man.
What is Inequality or Gini Index in Ashland?
Inequality or Gini Index in Ashland is 0.34.
What is the Total Population of Ashland?
Total Population of Ashland is 3,130.
What is the Total Male Population of Ashland?
Total Male Population of Ashland is 1,438.
What is the Total Female Population of Ashland?
Total Female Population of Ashland is 1,692.
What is the Ratio of Males per 100 Females in Ashland?
There are 84.99 Males per 100 Females in Ashland.
What is the Ratio of Females per 100 Males in Ashland?
There are 117.66 Females per 100 Males in Ashland.
What is the Median Population Age in Ashland?
Median Population Age in Ashland is 37.0 Years.
What is the Average Family Size in Ashland
Average Family Size in Ashland is 3.1 People.
What is the Average Household Size in Ashland
Average Household Size in Ashland is 2.4 People.
How Large is the Labor Force in Ashland?
There are 1,717 People in the Labor Forcein in Ashland.
What is the Percentage of People in the Labor Force in Ashland?
69.7% of People are in the Labor Force in Ashland.
What is the Unemployment Rate in Ashland?
Unemployment Rate in Ashland is 5.0%.