Arapahoe, NE Map & Demographics
Arapahoe Map
Arapahoe Overview
$32,306
PER CAPITA INCOME
$81,667
AVG FAMILY INCOME
$71,250
AVG HOUSEHOLD INCOME
30.8%
WAGE / INCOME GAP [ % ]
69.2¢/ $1
WAGE / INCOME GAP [ $ ]
0.39
INEQUALITY / GINI INDEX
976
TOTAL POPULATION
487
MALE POPULATION
489
FEMALE POPULATION
99.59
MALES / 100 FEMALES
100.41
FEMALES / 100 MALES
53.0
MEDIAN AGE
2.9
AVG FAMILY SIZE
2.5
AVG HOUSEHOLD SIZE
484
LABOR FORCE [ PEOPLE ]
61.7%
PERCENT IN LABOR FORCE
Arapahoe Zip Codes
Arapahoe Area Codes
Income in Arapahoe
Income Overview in Arapahoe
Per Capita Income in Arapahoe is $32,306, while median incomes of families and households are $81,667 and $71,250 respectively.
| Characteristic | Number | Measure |
| Per Capita Income | 976 | $32,306 |
| Median Family Income | 278 | $81,667 |
| Mean Family Income | 278 | $90,831 |
| Median Household Income | 375 | $71,250 |
| Mean Household Income | 375 | $78,631 |
| Income Deficit | 278 | $0 |
| Wage / Income Gap (%) | 976 | 30.82% |
| Wage / Income Gap ($) | 976 | 69.18¢ per $1 |
| Gini / Inequality Index | 976 | 0.39 |
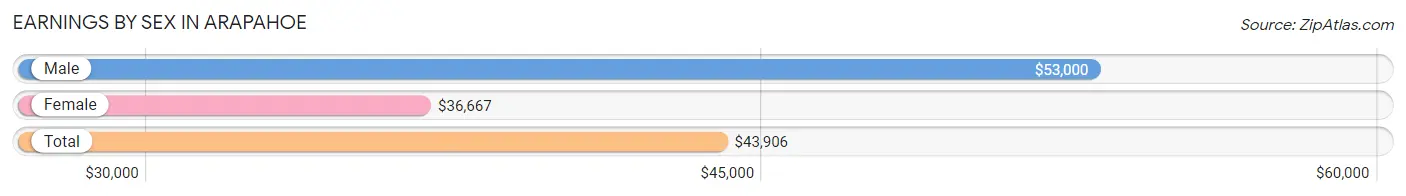
Earnings by Sex in Arapahoe
Average Earnings in Arapahoe are $43,906, $53,000 for men and $36,667 for women, a difference of 30.8%.
| Sex | Number | Average Earnings |
| Male | 280 (55.3%) | $53,000 |
| Female | 226 (44.7%) | $36,667 |
| Total | 506 (100.0%) | $43,906 |
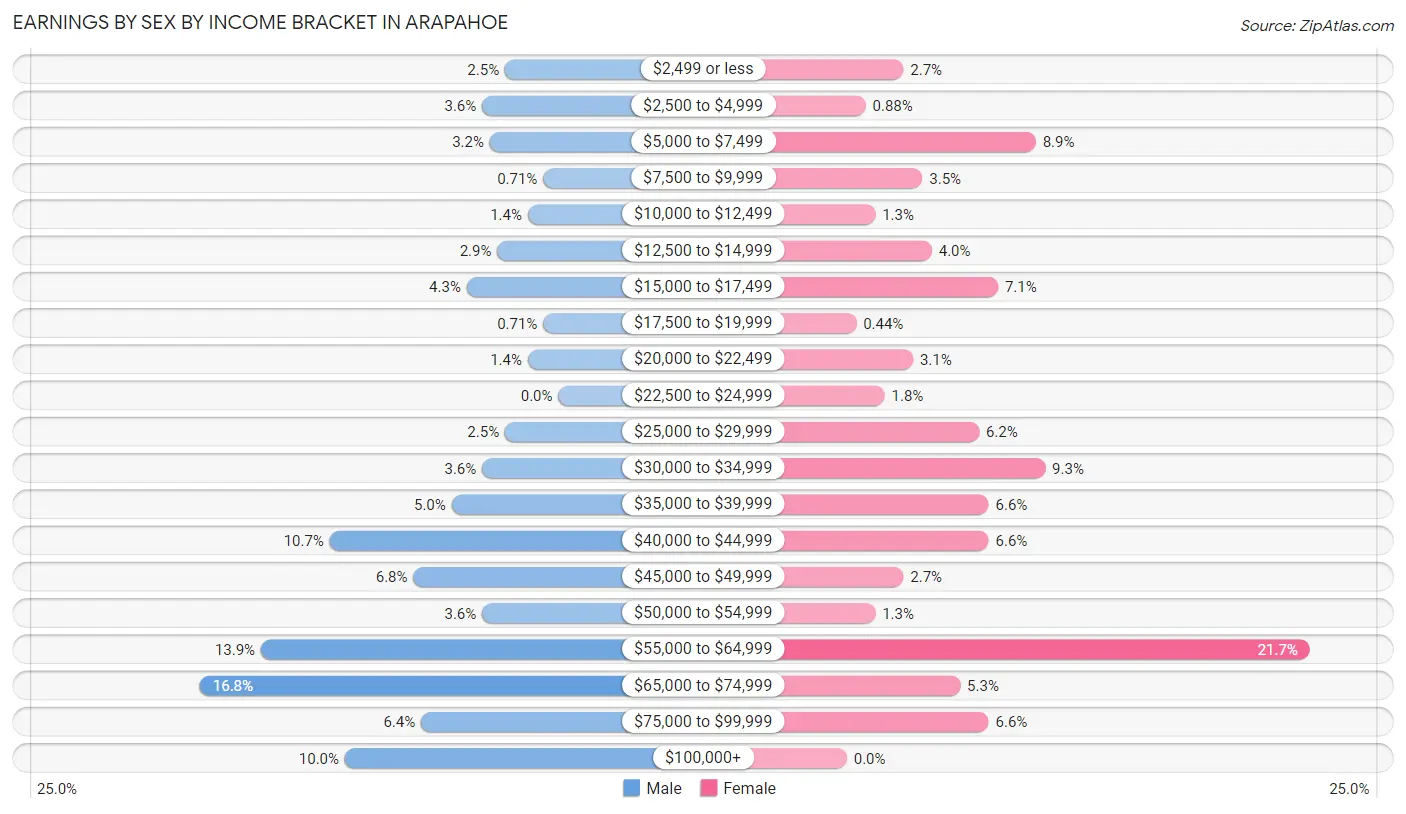
Earnings by Sex by Income Bracket in Arapahoe
The most common earnings brackets in Arapahoe are $65,000 to $74,999 for men (47 | 16.8%) and $55,000 to $64,999 for women (49 | 21.7%).
| Income | Male | Female |
| $2,499 or less | 7 (2.5%) | 6 (2.6%) |
| $2,500 to $4,999 | 10 (3.6%) | 2 (0.9%) |
| $5,000 to $7,499 | 9 (3.2%) | 20 (8.8%) |
| $7,500 to $9,999 | 2 (0.7%) | 8 (3.5%) |
| $10,000 to $12,499 | 4 (1.4%) | 3 (1.3%) |
| $12,500 to $14,999 | 8 (2.9%) | 9 (4.0%) |
| $15,000 to $17,499 | 12 (4.3%) | 16 (7.1%) |
| $17,500 to $19,999 | 2 (0.7%) | 1 (0.4%) |
| $20,000 to $22,499 | 4 (1.4%) | 7 (3.1%) |
| $22,500 to $24,999 | 0 (0.0%) | 4 (1.8%) |
| $25,000 to $29,999 | 7 (2.5%) | 14 (6.2%) |
| $30,000 to $34,999 | 10 (3.6%) | 21 (9.3%) |
| $35,000 to $39,999 | 14 (5.0%) | 15 (6.6%) |
| $40,000 to $44,999 | 30 (10.7%) | 15 (6.6%) |
| $45,000 to $49,999 | 19 (6.8%) | 6 (2.6%) |
| $50,000 to $54,999 | 10 (3.6%) | 3 (1.3%) |
| $55,000 to $64,999 | 39 (13.9%) | 49 (21.7%) |
| $65,000 to $74,999 | 47 (16.8%) | 12 (5.3%) |
| $75,000 to $99,999 | 18 (6.4%) | 15 (6.6%) |
| $100,000+ | 28 (10.0%) | 0 (0.0%) |
| Total | 280 (100.0%) | 226 (100.0%) |
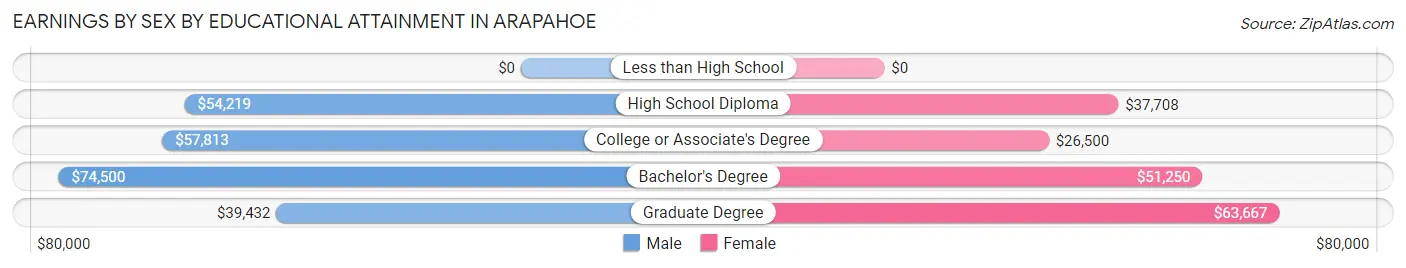
Earnings by Sex by Educational Attainment in Arapahoe
Average earnings in Arapahoe are $54,375 for men and $39,063 for women, a difference of 28.2%. Men with an educational attainment of bachelor's degree enjoy the highest average annual earnings of $74,500, while those with graduate degree education earn the least with $39,432. Women with an educational attainment of graduate degree earn the most with the average annual earnings of $63,667, while those with college or associate's degree education have the smallest earnings of $26,500.
| Educational Attainment | Male Income | Female Income |
| Less than High School | - | - |
| High School Diploma | $54,219 | $37,708 |
| College or Associate's Degree | $57,813 | $26,500 |
| Bachelor's Degree | $74,500 | $51,250 |
| Graduate Degree | $39,432 | $63,667 |
| Total | $54,375 | $39,063 |
Family Income in Arapahoe
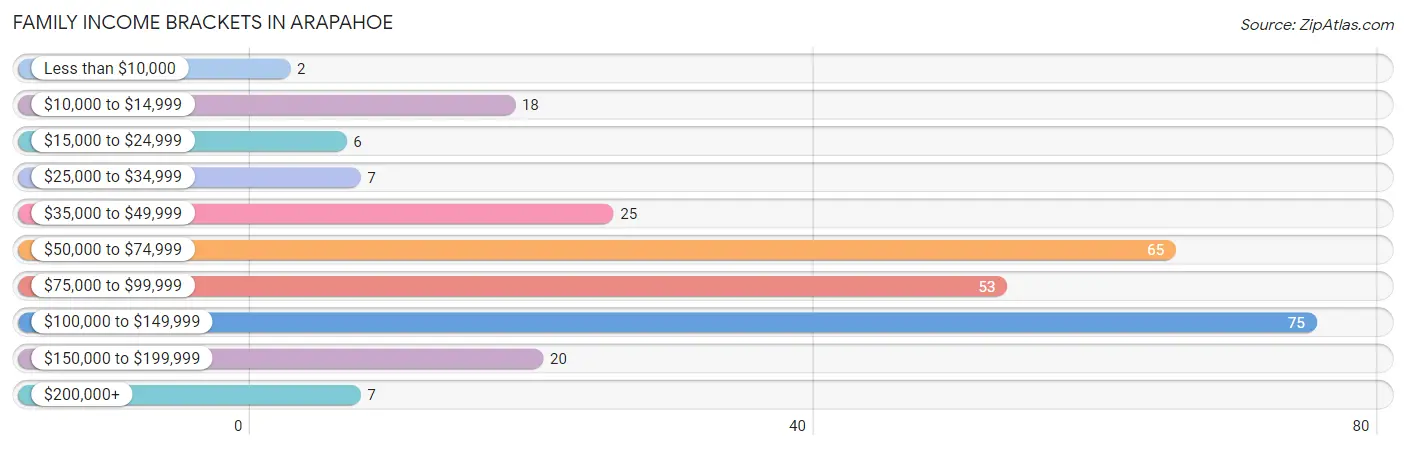
Family Income Brackets in Arapahoe
According to the Arapahoe family income data, there are 75 families falling into the $100,000 to $149,999 income range, which is the most common income bracket and makes up 27.0% of all families. Conversely, the less than $10,000 income bracket is the least frequent group with only 2 families (0.7%) belonging to this category.
| Income Bracket | # Families | % Families |
| Less than $10,000 | 2 | 0.7% |
| $10,000 to $14,999 | 18 | 6.5% |
| $15,000 to $24,999 | 6 | 2.2% |
| $25,000 to $34,999 | 7 | 2.5% |
| $35,000 to $49,999 | 25 | 9.0% |
| $50,000 to $74,999 | 65 | 23.4% |
| $75,000 to $99,999 | 53 | 19.1% |
| $100,000 to $149,999 | 75 | 27.0% |
| $150,000 to $199,999 | 20 | 7.2% |
| $200,000+ | 7 | 2.5% |
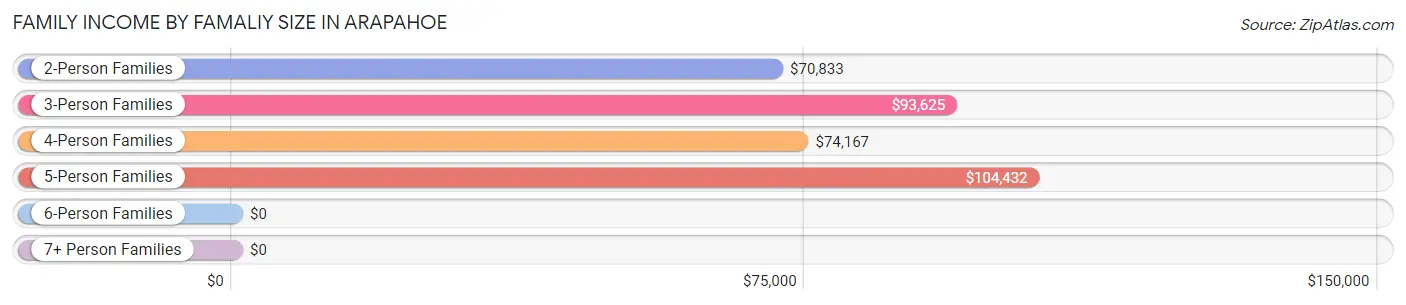
Family Income by Famaliy Size in Arapahoe
5-person families (17 | 6.1%) account for the highest median family income in Arapahoe with $104,432 per family, while 2-person families (158 | 56.8%) have the highest median income of $35,416 per family member.
| Income Bracket | # Families | Median Income |
| 2-Person Families | 158 (56.8%) | $70,833 |
| 3-Person Families | 35 (12.6%) | $93,625 |
| 4-Person Families | 50 (18.0%) | $74,167 |
| 5-Person Families | 17 (6.1%) | $104,432 |
| 6-Person Families | 12 (4.3%) | $0 |
| 7+ Person Families | 6 (2.2%) | $0 |
| Total | 278 (100.0%) | $81,667 |
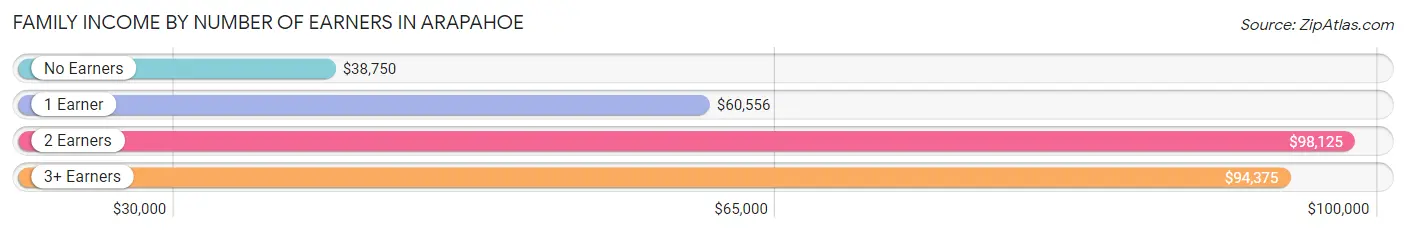
Family Income by Number of Earners in Arapahoe
The median family income in Arapahoe is $81,667, with families comprising 2 earners (165) having the highest median family income of $98,125, while families with no earners (40) have the lowest median family income of $38,750, accounting for 59.4% and 14.4% of families, respectively.
| Number of Earners | # Families | Median Income |
| No Earners | 40 (14.4%) | $38,750 |
| 1 Earner | 54 (19.4%) | $60,556 |
| 2 Earners | 165 (59.4%) | $98,125 |
| 3+ Earners | 19 (6.8%) | $94,375 |
| Total | 278 (100.0%) | $81,667 |
Household Income in Arapahoe
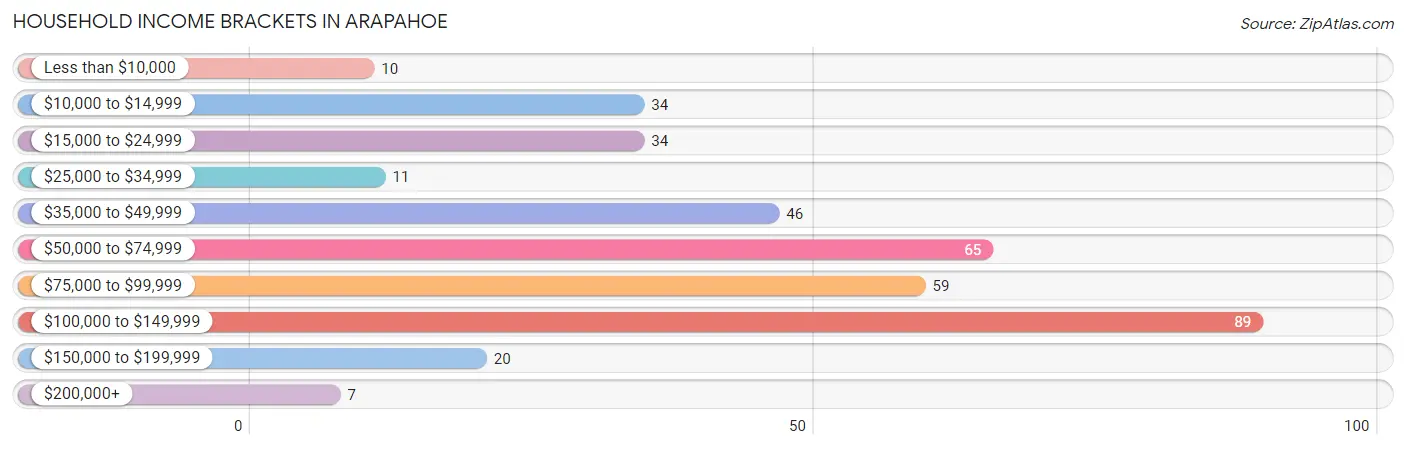
Household Income Brackets in Arapahoe
With 89 households falling in the category, the $100,000 to $149,999 income range is the most frequent in Arapahoe, accounting for 23.7% of all households. In contrast, only 7 households (1.9%) fall into the $200,000+ income bracket, making it the least populous group.
| Income Bracket | # Households | % Households |
| Less than $10,000 | 10 | 2.7% |
| $10,000 to $14,999 | 34 | 9.1% |
| $15,000 to $24,999 | 34 | 9.1% |
| $25,000 to $34,999 | 11 | 2.9% |
| $35,000 to $49,999 | 46 | 12.3% |
| $50,000 to $74,999 | 65 | 17.3% |
| $75,000 to $99,999 | 59 | 15.7% |
| $100,000 to $149,999 | 89 | 23.7% |
| $150,000 to $199,999 | 20 | 5.3% |
| $200,000+ | 7 | 1.9% |
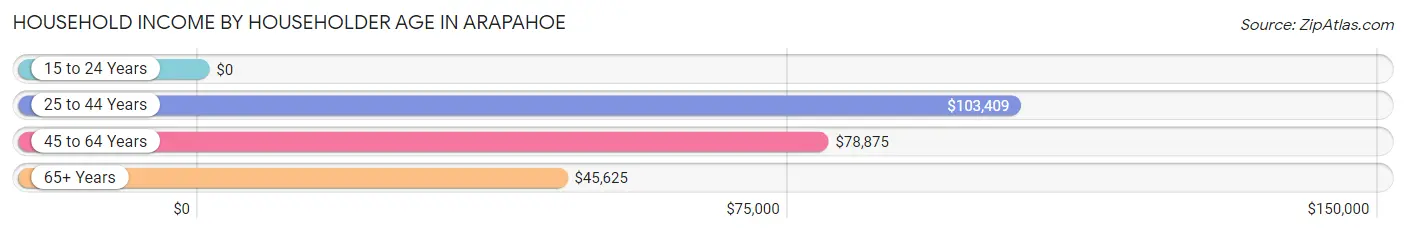
Household Income by Householder Age in Arapahoe
The median household income in Arapahoe is $71,250, with the highest median household income of $103,409 found in the 25 to 44 years age bracket for the primary householder. A total of 76 households (20.3%) fall into this category.
| Income Bracket | # Households | Median Income |
| 15 to 24 Years | 0 (0.0%) | $0 |
| 25 to 44 Years | 76 (20.3%) | $103,409 |
| 45 to 64 Years | 169 (45.1%) | $78,875 |
| 65+ Years | 130 (34.7%) | $45,625 |
| Total | 375 (100.0%) | $71,250 |
Poverty in Arapahoe
Income Below Poverty by Sex and Age in Arapahoe
With 11.8% poverty level for males and 14.3% for females among the residents of Arapahoe, under 5 year old males and 5 year old females are the most vulnerable to poverty, with 7 males (36.8%) and 5 females (45.5%) in their respective age groups living below the poverty level.
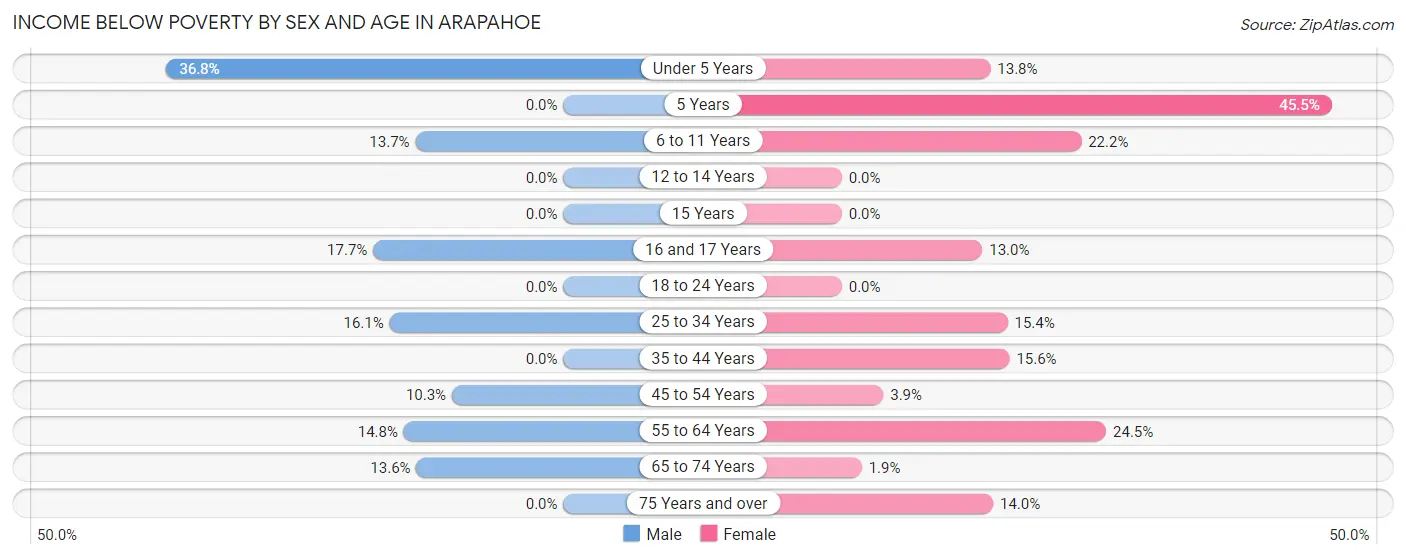
| Age Bracket | Male | Female |
| Under 5 Years | 7 (36.8%) | 4 (13.8%) |
| 5 Years | 0 (0.0%) | 5 (45.5%) |
| 6 to 11 Years | 7 (13.7%) | 6 (22.2%) |
| 12 to 14 Years | 0 (0.0%) | 0 (0.0%) |
| 15 Years | 0 (0.0%) | 0 (0.0%) |
| 16 and 17 Years | 6 (17.6%) | 3 (13.0%) |
| 18 to 24 Years | 0 (0.0%) | 0 (0.0%) |
| 25 to 34 Years | 5 (16.1%) | 4 (15.4%) |
| 35 to 44 Years | 0 (0.0%) | 7 (15.6%) |
| 45 to 54 Years | 6 (10.3%) | 2 (3.8%) |
| 55 to 64 Years | 16 (14.8%) | 26 (24.5%) |
| 65 to 74 Years | 9 (13.6%) | 1 (1.8%) |
| 75 Years and over | 0 (0.0%) | 8 (14.0%) |
| Total | 56 (11.8%) | 66 (14.3%) |
Income Above Poverty by Sex and Age in Arapahoe
According to the poverty statistics in Arapahoe, males aged 5 years and females aged 12 to 14 years are the age groups that are most secure financially, with 100.0% of males and 100.0% of females in these age groups living above the poverty line.
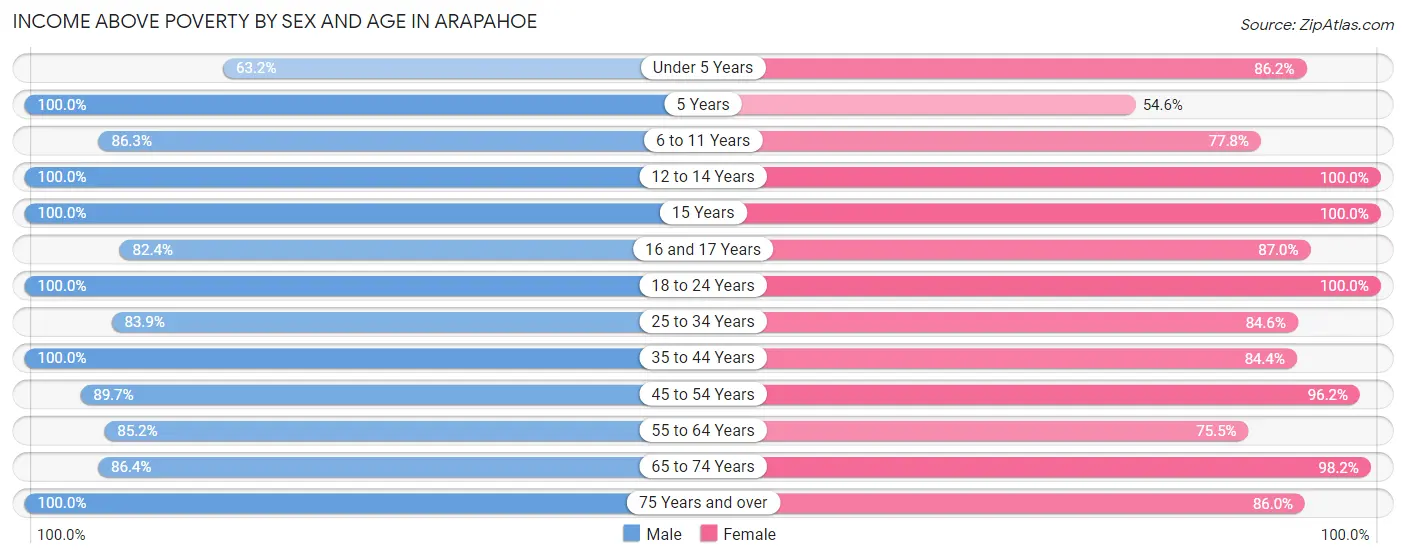
| Age Bracket | Male | Female |
| Under 5 Years | 12 (63.2%) | 25 (86.2%) |
| 5 Years | 11 (100.0%) | 6 (54.5%) |
| 6 to 11 Years | 44 (86.3%) | 21 (77.8%) |
| 12 to 14 Years | 17 (100.0%) | 6 (100.0%) |
| 15 Years | 5 (100.0%) | 6 (100.0%) |
| 16 and 17 Years | 28 (82.4%) | 20 (87.0%) |
| 18 to 24 Years | 12 (100.0%) | 20 (100.0%) |
| 25 to 34 Years | 26 (83.9%) | 22 (84.6%) |
| 35 to 44 Years | 35 (100.0%) | 38 (84.4%) |
| 45 to 54 Years | 52 (89.7%) | 50 (96.2%) |
| 55 to 64 Years | 92 (85.2%) | 80 (75.5%) |
| 65 to 74 Years | 57 (86.4%) | 53 (98.2%) |
| 75 Years and over | 29 (100.0%) | 49 (86.0%) |
| Total | 420 (88.2%) | 396 (85.7%) |
Income Below Poverty Among Married-Couple Families in Arapahoe
The poverty statistics for married-couple families in Arapahoe show that 6.2% or 16 of the total 256 families live below the poverty line. Families with 5 or more children have the highest poverty rate of 66.7%, comprising of 4 families. On the other hand, families with 1 or 2 children have the lowest poverty rate of 0.0%, which includes 0 families.
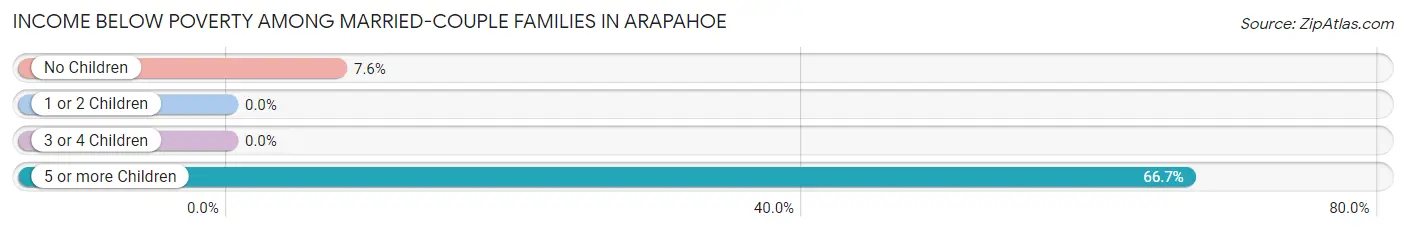
| Children | Above Poverty | Below Poverty |
| No Children | 146 (92.4%) | 12 (7.6%) |
| 1 or 2 Children | 63 (100.0%) | 0 (0.0%) |
| 3 or 4 Children | 29 (100.0%) | 0 (0.0%) |
| 5 or more Children | 2 (33.3%) | 4 (66.7%) |
| Total | 240 (93.8%) | 16 (6.2%) |
Income Below Poverty Among Single-Parent Households in Arapahoe
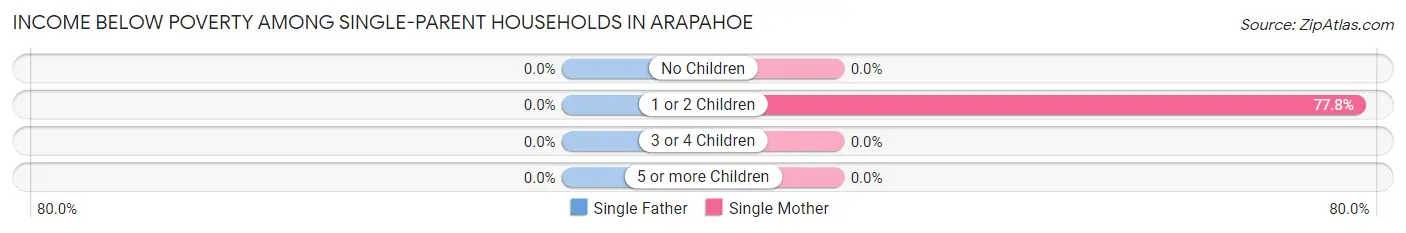
| Children | Single Father | Single Mother |
| No Children | 0 (0.0%) | 0 (0.0%) |
| 1 or 2 Children | 0 (0.0%) | 14 (77.8%) |
| 3 or 4 Children | 0 (0.0%) | 0 (0.0%) |
| 5 or more Children | 0 (0.0%) | 0 (0.0%) |
| Total | 0 (0.0%) | 14 (77.8%) |
Income Below Poverty Among Married-Couple vs Single-Parent Households in Arapahoe
The poverty data for Arapahoe shows that 16 of the married-couple family households (6.2%) and 14 of the single-parent households (63.6%) are living below the poverty level. Within the married-couple family households, those with 5 or more children have the highest poverty rate, with 4 households (66.7%) falling below the poverty line. Among the single-parent households, those with 1 or 2 children have the highest poverty rate, with 14 household (63.6%) living below poverty.
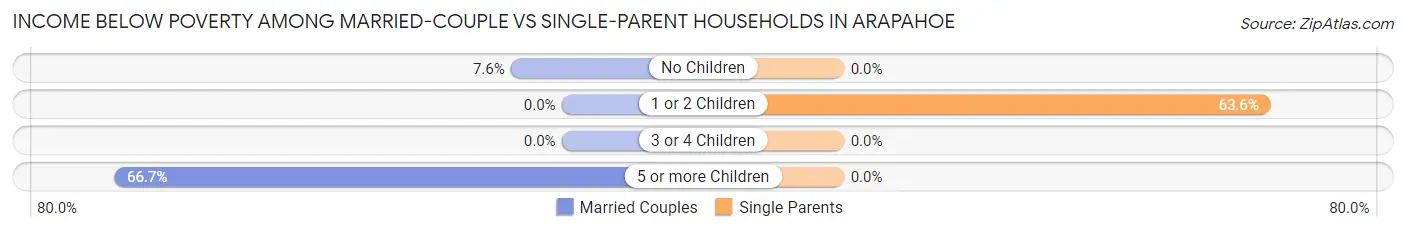
| Children | Married-Couple Families | Single-Parent Households |
| No Children | 12 (7.6%) | 0 (0.0%) |
| 1 or 2 Children | 0 (0.0%) | 14 (63.6%) |
| 3 or 4 Children | 0 (0.0%) | 0 (0.0%) |
| 5 or more Children | 4 (66.7%) | 0 (0.0%) |
| Total | 16 (6.2%) | 14 (63.6%) |
Race in Arapahoe
The most populous races in Arapahoe are White / Caucasian (926 | 94.9%), Hispanic or Latino (35 | 3.6%), and Two or more Races (23 | 2.4%).
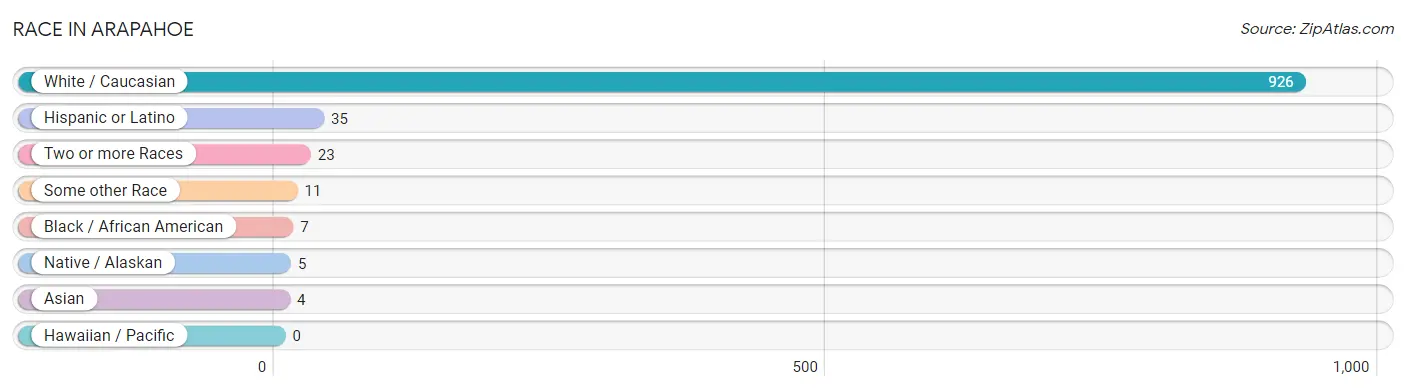
| Race | # Population | % Population |
| Asian | 4 | 0.4% |
| Black / African American | 7 | 0.7% |
| Hawaiian / Pacific | 0 | 0.0% |
| Hispanic or Latino | 35 | 3.6% |
| Native / Alaskan | 5 | 0.5% |
| White / Caucasian | 926 | 94.9% |
| Two or more Races | 23 | 2.4% |
| Some other Race | 11 | 1.1% |
| Total | 976 | 100.0% |
Ancestry in Arapahoe
The most populous ancestries reported in Arapahoe are German (371 | 38.0%), English (101 | 10.3%), Irish (100 | 10.2%), American (49 | 5.0%), and Swedish (48 | 4.9%), together accounting for 68.5% of all Arapahoe residents.
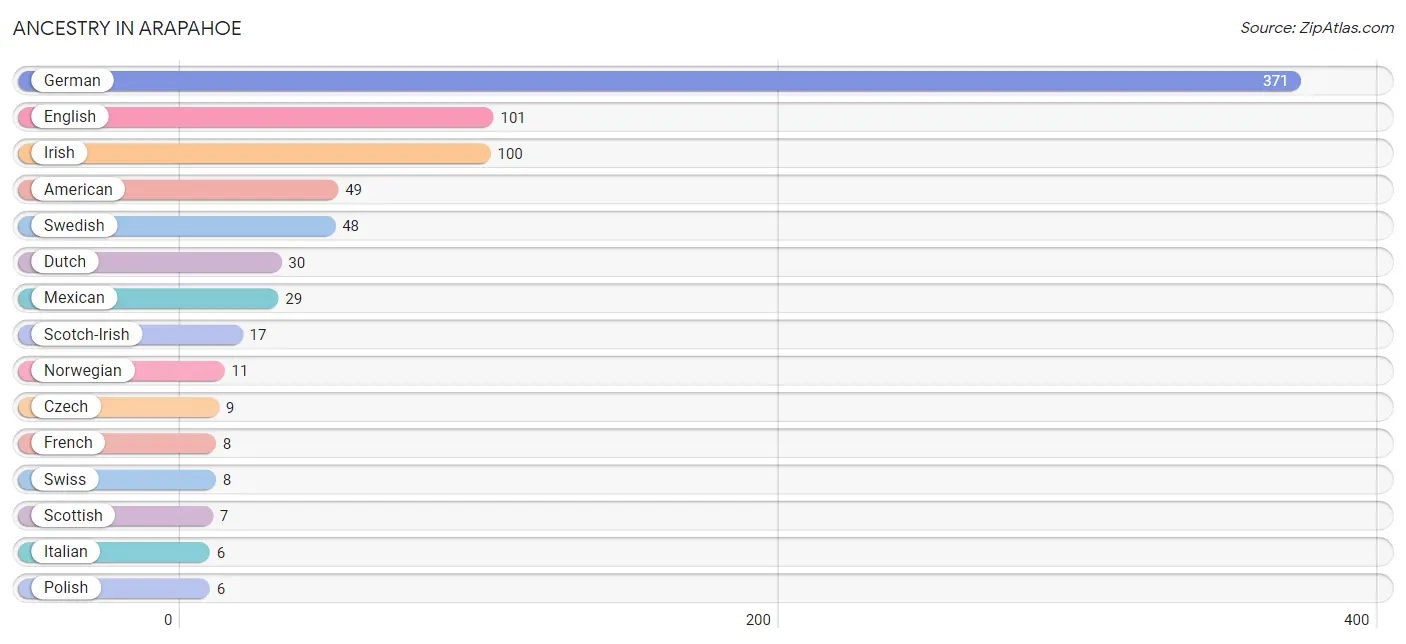
| Ancestry | # Population | % Population |
| American | 49 | 5.0% |
| Cherokee | 4 | 0.4% |
| Czech | 9 | 0.9% |
| Danish | 2 | 0.2% |
| Dutch | 30 | 3.1% |
| English | 101 | 10.3% |
| French | 8 | 0.8% |
| French American Indian | 3 | 0.3% |
| German | 371 | 38.0% |
| Indian (Asian) | 4 | 0.4% |
| Irish | 100 | 10.2% |
| Italian | 6 | 0.6% |
| Mexican | 29 | 3.0% |
| Norwegian | 11 | 1.1% |
| Pakistani | 4 | 0.4% |
| Polish | 6 | 0.6% |
| Scandinavian | 2 | 0.2% |
| Scotch-Irish | 17 | 1.7% |
| Scottish | 7 | 0.7% |
| Spaniard | 6 | 0.6% |
| Swedish | 48 | 4.9% |
| Swiss | 8 | 0.8% |
| Turkish | 2 | 0.2% | View All 23 Rows |
Immigrants in Arapahoe
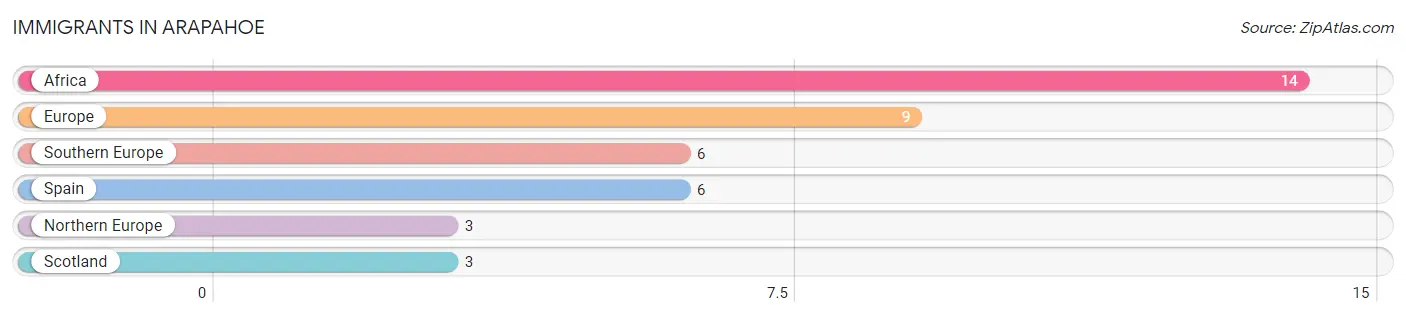
The most numerous immigrant groups reported in Arapahoe came from Africa (14 | 1.4%), Europe (9 | 0.9%), Southern Europe (6 | 0.6%), Spain (6 | 0.6%), and Northern Europe (3 | 0.3%), together accounting for 3.9% of all Arapahoe residents.
| Immigration Origin | # Population | % Population |
| Africa | 14 | 1.4% |
| Europe | 9 | 0.9% |
| Northern Europe | 3 | 0.3% |
| Scotland | 3 | 0.3% |
| Southern Europe | 6 | 0.6% |
| Spain | 6 | 0.6% | View All 6 Rows |
Sex and Age in Arapahoe
Sex and Age in Arapahoe
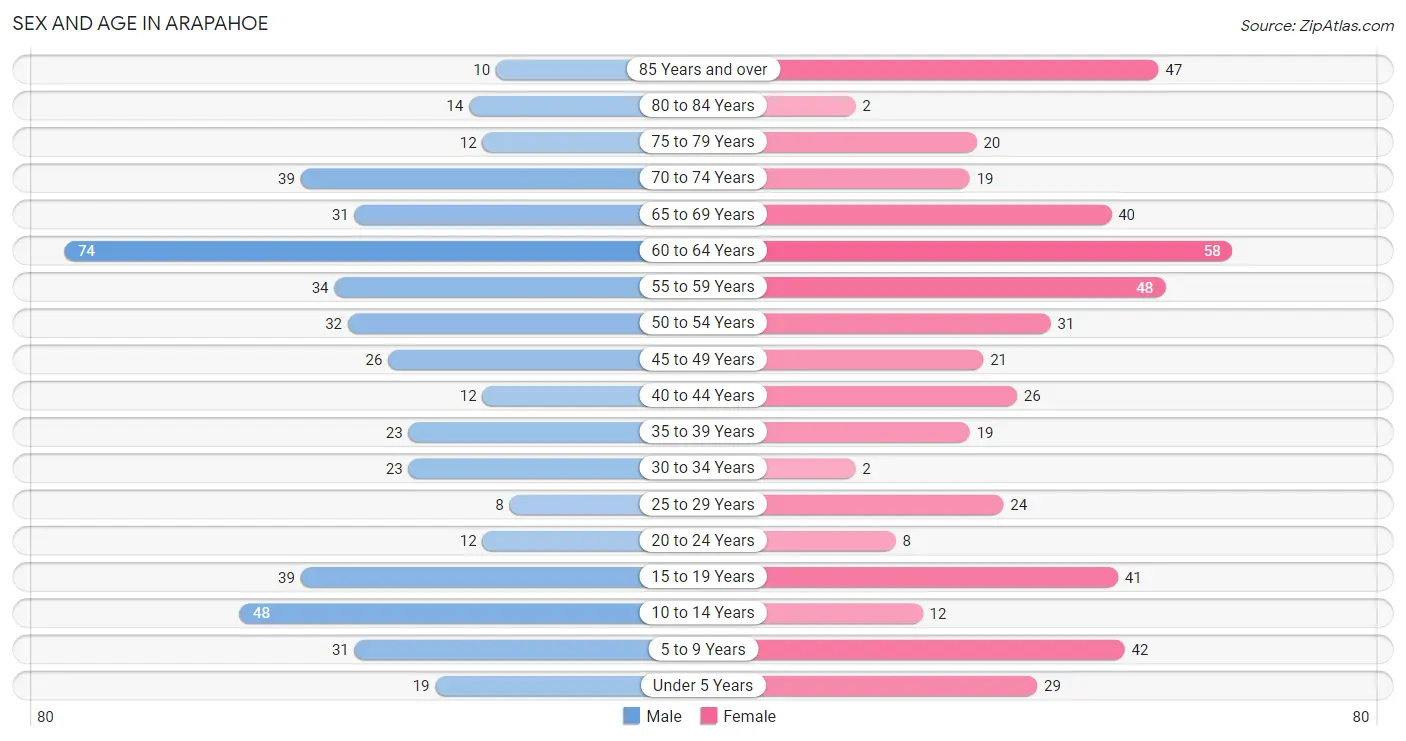
The most populous age groups in Arapahoe are 60 to 64 Years (74 | 15.2%) for men and 60 to 64 Years (58 | 11.9%) for women.
| Age Bracket | Male | Female |
| Under 5 Years | 19 (3.9%) | 29 (5.9%) |
| 5 to 9 Years | 31 (6.4%) | 42 (8.6%) |
| 10 to 14 Years | 48 (9.9%) | 12 (2.5%) |
| 15 to 19 Years | 39 (8.0%) | 41 (8.4%) |
| 20 to 24 Years | 12 (2.5%) | 8 (1.6%) |
| 25 to 29 Years | 8 (1.6%) | 24 (4.9%) |
| 30 to 34 Years | 23 (4.7%) | 2 (0.4%) |
| 35 to 39 Years | 23 (4.7%) | 19 (3.9%) |
| 40 to 44 Years | 12 (2.5%) | 26 (5.3%) |
| 45 to 49 Years | 26 (5.3%) | 21 (4.3%) |
| 50 to 54 Years | 32 (6.6%) | 31 (6.3%) |
| 55 to 59 Years | 34 (7.0%) | 48 (9.8%) |
| 60 to 64 Years | 74 (15.2%) | 58 (11.9%) |
| 65 to 69 Years | 31 (6.4%) | 40 (8.2%) |
| 70 to 74 Years | 39 (8.0%) | 19 (3.9%) |
| 75 to 79 Years | 12 (2.5%) | 20 (4.1%) |
| 80 to 84 Years | 14 (2.9%) | 2 (0.4%) |
| 85 Years and over | 10 (2.1%) | 47 (9.6%) |
| Total | 487 (100.0%) | 489 (100.0%) |
Families and Households in Arapahoe
Median Family Size in Arapahoe
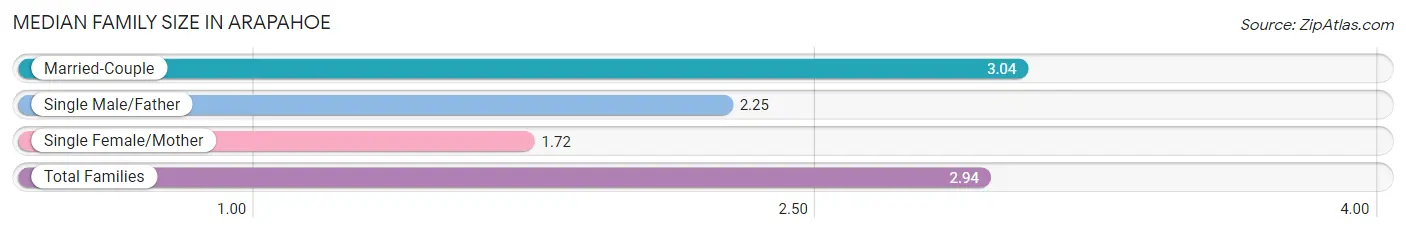
The median family size in Arapahoe is 2.94 persons per family, with married-couple families (256 | 92.1%) accounting for the largest median family size of 3.04 persons per family. On the other hand, single female/mother families (18 | 6.5%) represent the smallest median family size with 1.72 persons per family.
| Family Type | # Families | Family Size |
| Married-Couple | 256 (92.1%) | 3.04 |
| Single Male/Father | 4 (1.4%) | 2.25 |
| Single Female/Mother | 18 (6.5%) | 1.72 |
| Total Families | 278 (100.0%) | 2.94 |
Median Household Size in Arapahoe
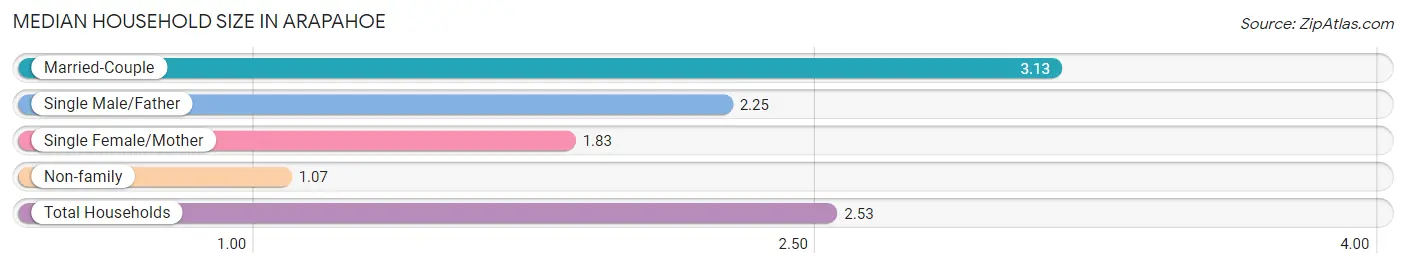
The median household size in Arapahoe is 2.53 persons per household, with married-couple households (256 | 68.3%) accounting for the largest median household size of 3.13 persons per household. non-family households (97 | 25.9%) represent the smallest median household size with 1.07 persons per household.
| Household Type | # Households | Household Size |
| Married-Couple | 256 (68.3%) | 3.13 |
| Single Male/Father | 4 (1.1%) | 2.25 |
| Single Female/Mother | 18 (4.8%) | 1.83 |
| Non-family | 97 (25.9%) | 1.07 |
| Total Households | 375 (100.0%) | 2.53 |
Household Size by Marriage Status in Arapahoe
Out of a total of 375 households in Arapahoe, 278 (74.1%) are family households, while 97 (25.9%) are nonfamily households. The most numerous type of family households are 2-person households, comprising 156, and the most common type of nonfamily households are 1-person households, comprising 93.
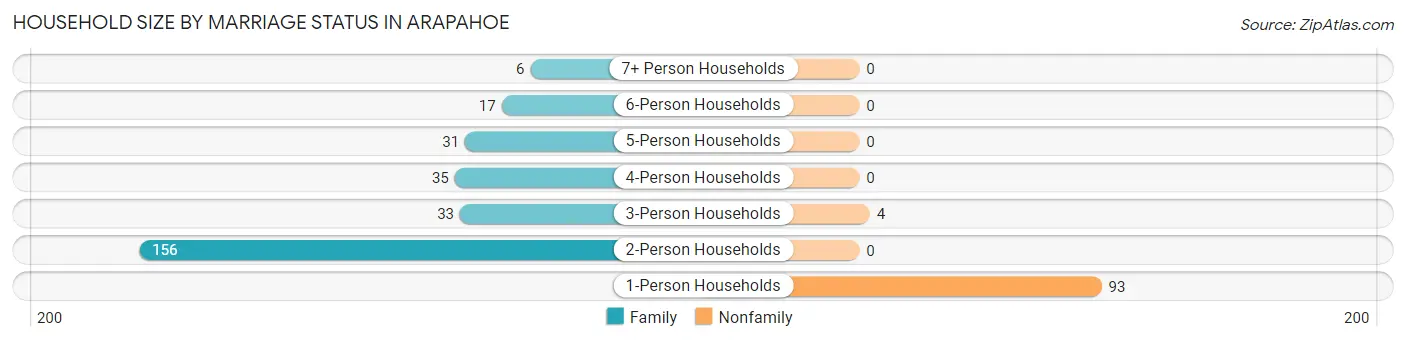
| Household Size | Family Households | Nonfamily Households |
| 1-Person Households | - | 93 (24.8%) |
| 2-Person Households | 156 (41.6%) | 0 (0.0%) |
| 3-Person Households | 33 (8.8%) | 4 (1.1%) |
| 4-Person Households | 35 (9.3%) | 0 (0.0%) |
| 5-Person Households | 31 (8.3%) | 0 (0.0%) |
| 6-Person Households | 17 (4.5%) | 0 (0.0%) |
| 7+ Person Households | 6 (1.6%) | 0 (0.0%) |
| Total | 278 (74.1%) | 97 (25.9%) |
Female Fertility in Arapahoe
Fertility by Age in Arapahoe
Average fertility rate in Arapahoe is 154.0 births per 1,000 women. Women in the age bracket of 20 to 34 years have the highest fertility rate with 647.0 births per 1,000 women. Women in the age bracket of 20 to 34 years acount for 100.0% of all women with births.
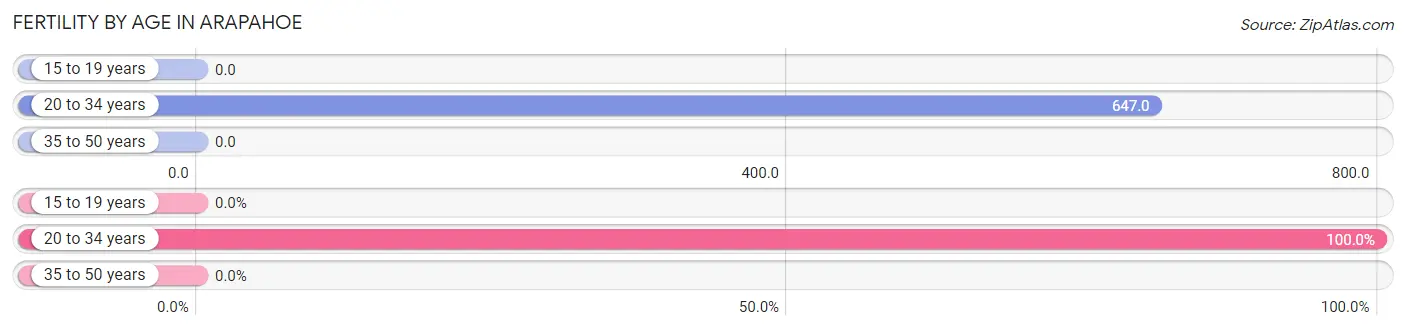
| Age Bracket | Women with Births | Births / 1,000 Women |
| 15 to 19 years | 0 (0.0%) | 0.0 |
| 20 to 34 years | 22 (100.0%) | 647.0 |
| 35 to 50 years | 0 (0.0%) | 0.0 |
| Total | 22 (100.0%) | 154.0 |
Fertility by Age by Marriage Status in Arapahoe
90.9% of women with births (22) in Arapahoe are married. The highest percentage of unmarried women with births falls into 20 to 34 years age bracket with 9.1% of them unmarried at the time of birth, while the lowest percentage of unmarried women with births belong to 20 to 34 years age bracket with 9.1% of them unmarried.
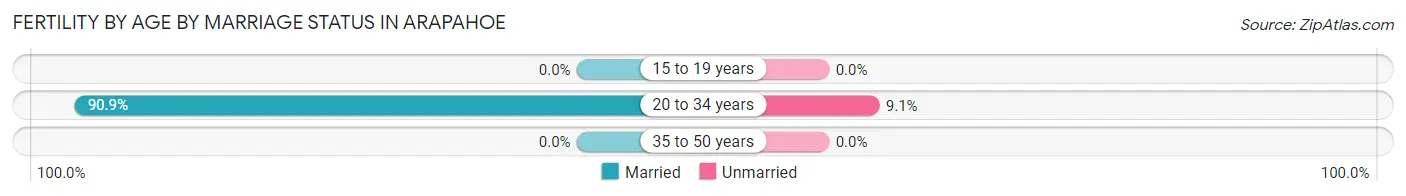
| Age Bracket | Married | Unmarried |
| 15 to 19 years | 0 (0.0%) | 0 (0.0%) |
| 20 to 34 years | 20 (90.9%) | 2 (9.1%) |
| 35 to 50 years | 0 (0.0%) | 0 (0.0%) |
| Total | 20 (90.9%) | 2 (9.1%) |
Fertility by Education in Arapahoe
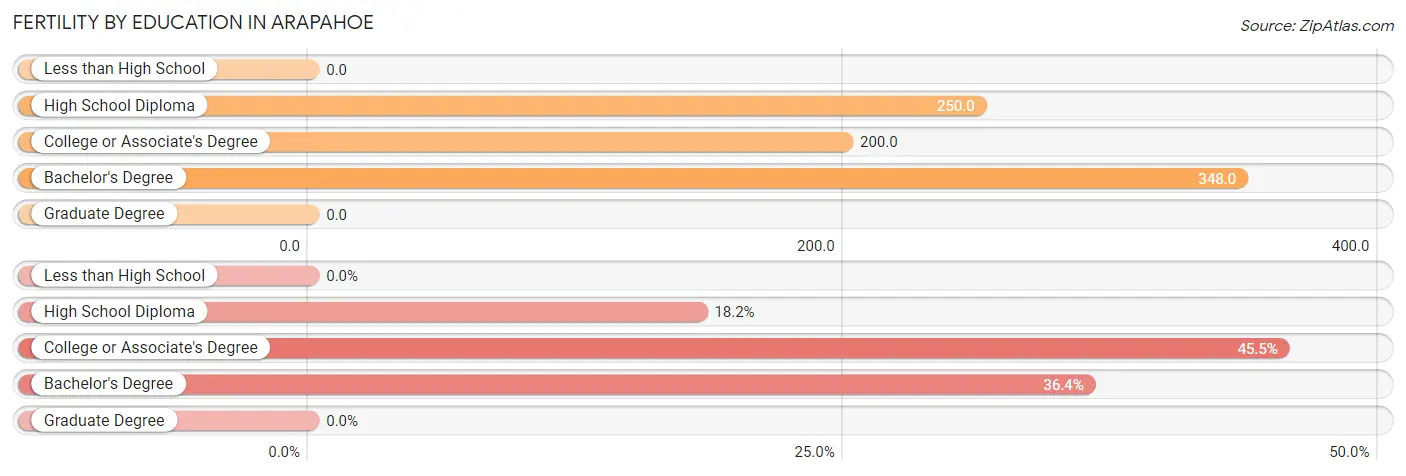
| Educational Attainment | Women with Births | Births / 1,000 Women |
| Less than High School | 0 (0.0%) | 0.0 |
| High School Diploma | 4 (18.2%) | 250.0 |
| College or Associate's Degree | 10 (45.5%) | 200.0 |
| Bachelor's Degree | 8 (36.4%) | 348.0 |
| Graduate Degree | 0 (0.0%) | 0.0 |
| Total | 22 (100.0%) | 154.0 |
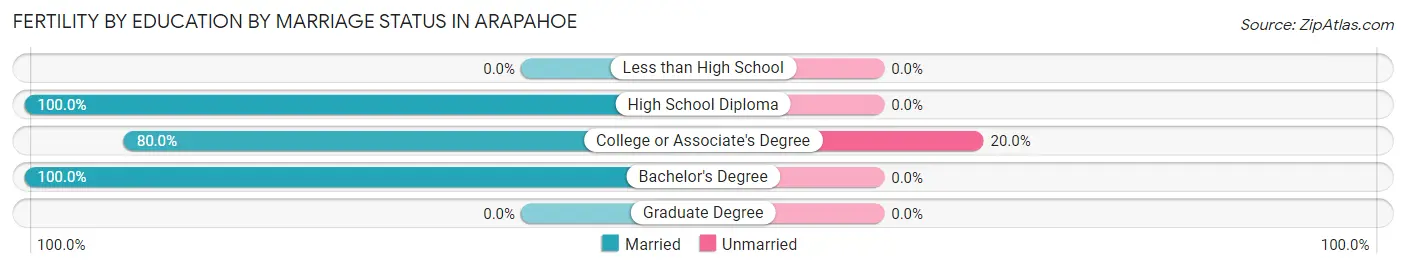
Fertility by Education by Marriage Status in Arapahoe
9.1% of women with births in Arapahoe are unmarried. Women with the educational attainment of high school diploma are most likely to be married with 100.0% of them married at childbirth, while women with the educational attainment of college or associate's degree are least likely to be married with 20.0% of them unmarried at childbirth.
| Educational Attainment | Married | Unmarried |
| Less than High School | 0 (0.0%) | 0 (0.0%) |
| High School Diploma | 4 (100.0%) | 0 (0.0%) |
| College or Associate's Degree | 8 (80.0%) | 2 (20.0%) |
| Bachelor's Degree | 8 (100.0%) | 0 (0.0%) |
| Graduate Degree | 0 (0.0%) | 0 (0.0%) |
| Total | 20 (90.9%) | 2 (9.1%) |
Employment Characteristics in Arapahoe
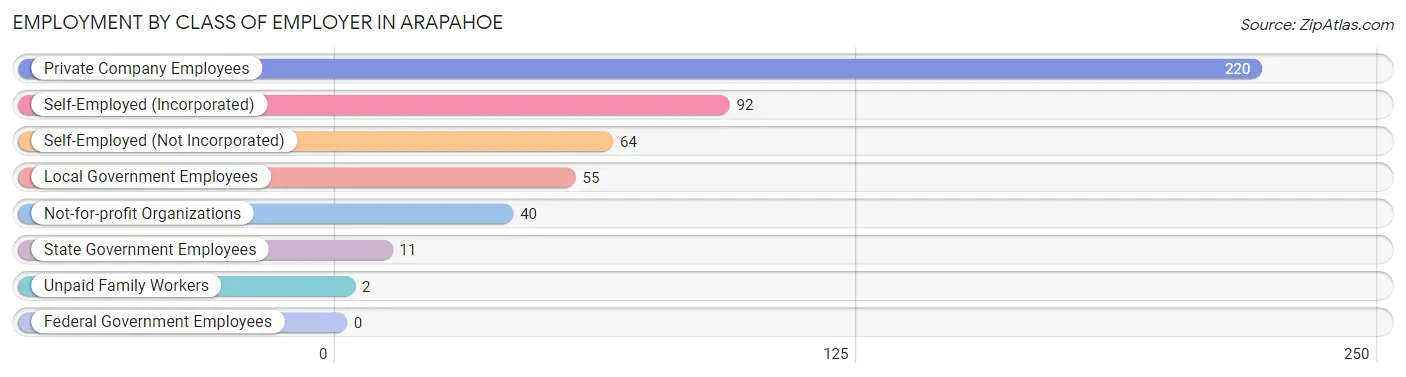
Employment by Class of Employer in Arapahoe
Among the 484 employed individuals in Arapahoe, private company employees (220 | 45.5%), self-employed (incorporated) (92 | 19.0%), and self-employed (not incorporated) (64 | 13.2%) make up the most common classes of employment.
| Employer Class | # Employees | % Employees |
| Private Company Employees | 220 | 45.5% |
| Self-Employed (Incorporated) | 92 | 19.0% |
| Self-Employed (Not Incorporated) | 64 | 13.2% |
| Not-for-profit Organizations | 40 | 8.3% |
| Local Government Employees | 55 | 11.4% |
| State Government Employees | 11 | 2.3% |
| Federal Government Employees | 0 | 0.0% |
| Unpaid Family Workers | 2 | 0.4% |
| Total | 484 | 100.0% |
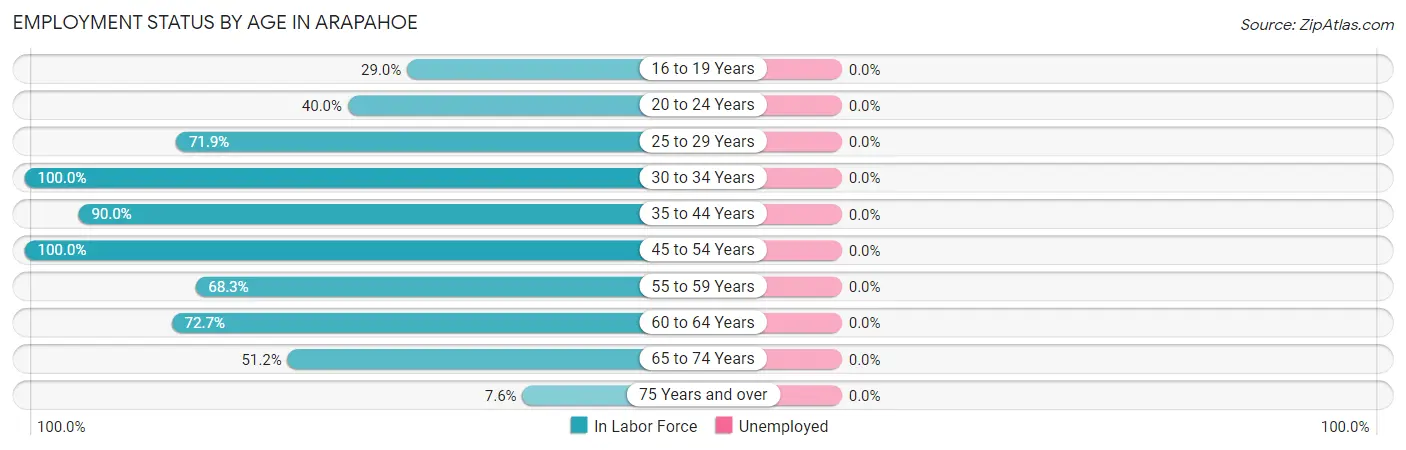
Employment Status by Age in Arapahoe
| Age Bracket | In Labor Force | Unemployed |
| 16 to 19 Years | 20 (29.0%) | 0 (0.0%) |
| 20 to 24 Years | 8 (40.0%) | 0 (0.0%) |
| 25 to 29 Years | 23 (71.9%) | 0 (0.0%) |
| 30 to 34 Years | 25 (100.0%) | 0 (0.0%) |
| 35 to 44 Years | 72 (90.0%) | 0 (0.0%) |
| 45 to 54 Years | 110 (100.0%) | 0 (0.0%) |
| 55 to 59 Years | 56 (68.3%) | 0 (0.0%) |
| 60 to 64 Years | 96 (72.7%) | 0 (0.0%) |
| 65 to 74 Years | 66 (51.2%) | 0 (0.0%) |
| 75 Years and over | 8 (7.6%) | 0 (0.0%) |
| Total | 484 (61.7%) | 0 (0.0%) |
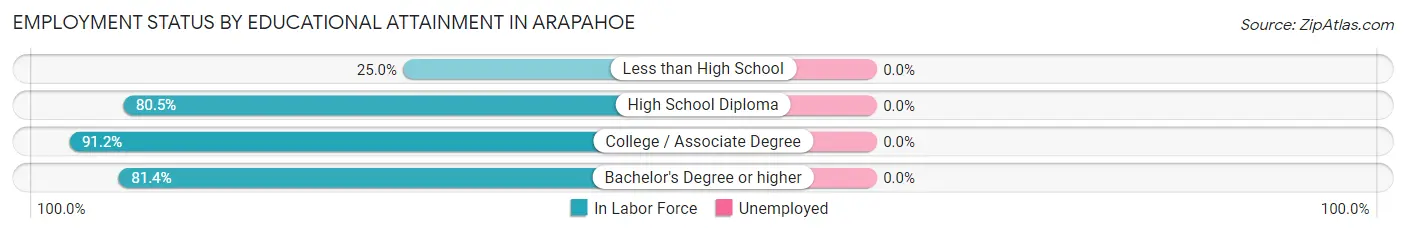
Employment Status by Educational Attainment in Arapahoe
| Educational Attainment | In Labor Force | Unemployed |
| Less than High School | 6 (25.0%) | 0 (0.0%) |
| High School Diploma | 95 (80.5%) | 0 (0.0%) |
| College / Associate Degree | 198 (91.2%) | 0 (0.0%) |
| Bachelor's Degree or higher | 83 (81.4%) | 0 (0.0%) |
| Total | 382 (82.9%) | 0 (0.0%) |
Employment Occupations by Sex in Arapahoe
Management, Business, Science and Arts Occupations
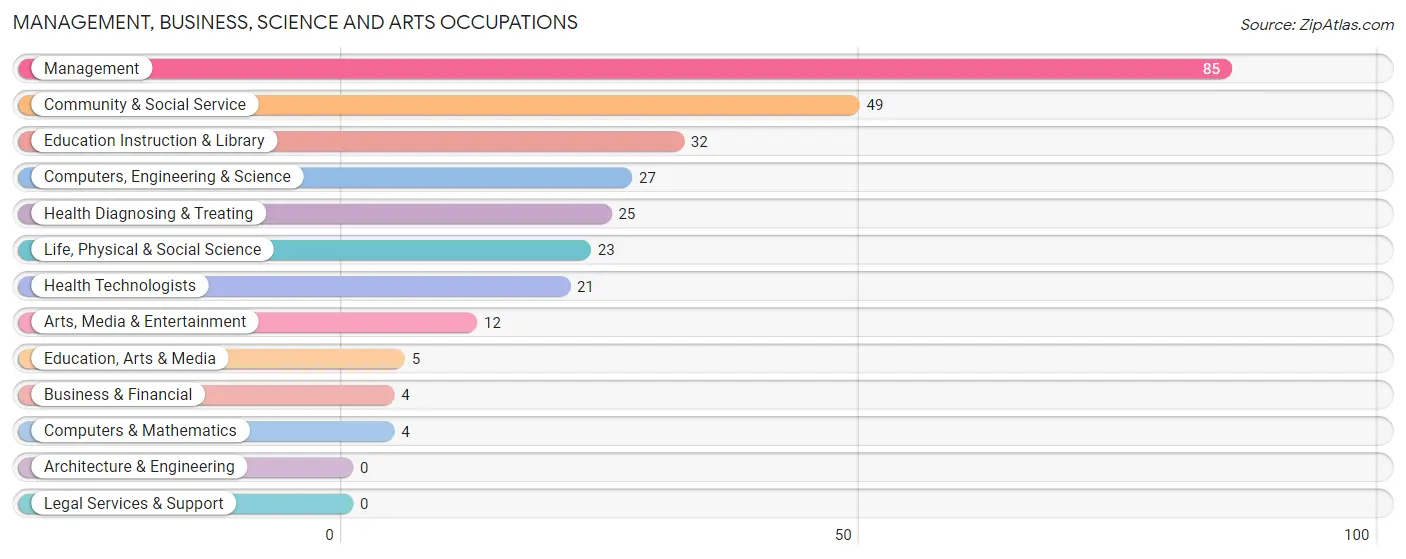
The most common Management, Business, Science and Arts occupations in Arapahoe are Management (85 | 17.6%), Community & Social Service (49 | 10.1%), Education Instruction & Library (32 | 6.6%), Computers, Engineering & Science (27 | 5.6%), and Health Diagnosing & Treating (25 | 5.2%).
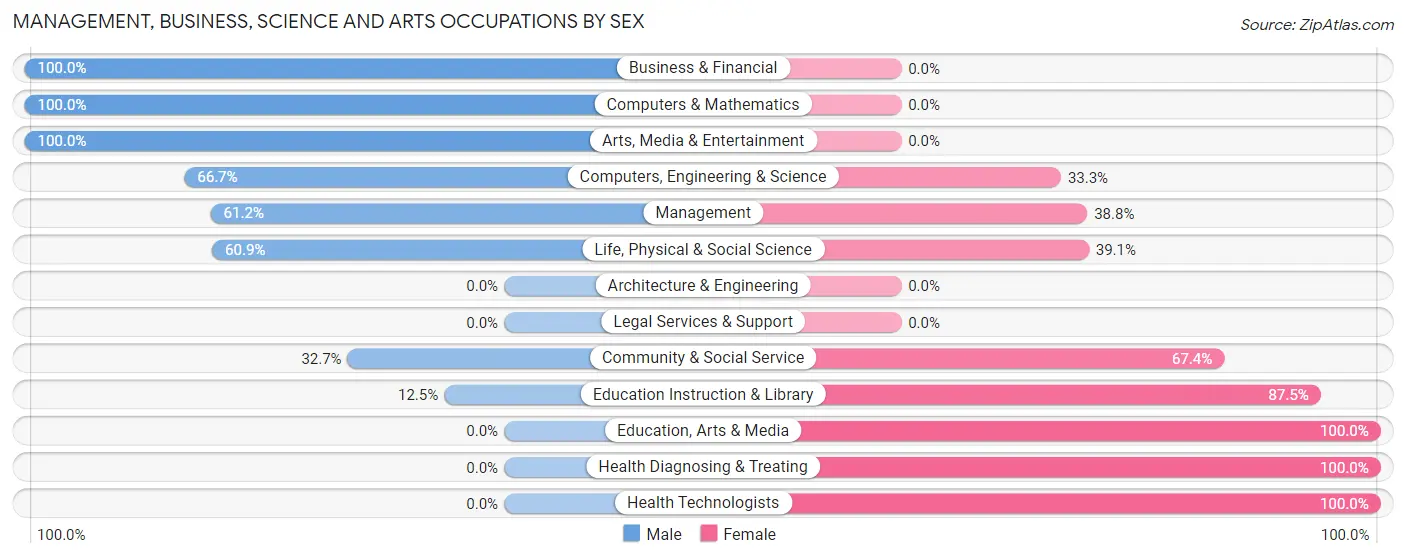
Management, Business, Science and Arts Occupations by Sex
Within the Management, Business, Science and Arts occupations in Arapahoe, the most male-oriented occupations are Business & Financial (100.0%), Computers & Mathematics (100.0%), and Arts, Media & Entertainment (100.0%), while the most female-oriented occupations are Education, Arts & Media (100.0%), Health Diagnosing & Treating (100.0%), and Health Technologists (100.0%).
| Occupation | Male | Female |
| Management | 52 (61.2%) | 33 (38.8%) |
| Business & Financial | 4 (100.0%) | 0 (0.0%) |
| Computers, Engineering & Science | 18 (66.7%) | 9 (33.3%) |
| Computers & Mathematics | 4 (100.0%) | 0 (0.0%) |
| Architecture & Engineering | 0 (0.0%) | 0 (0.0%) |
| Life, Physical & Social Science | 14 (60.9%) | 9 (39.1%) |
| Community & Social Service | 16 (32.7%) | 33 (67.3%) |
| Education, Arts & Media | 0 (0.0%) | 5 (100.0%) |
| Legal Services & Support | 0 (0.0%) | 0 (0.0%) |
| Education Instruction & Library | 4 (12.5%) | 28 (87.5%) |
| Arts, Media & Entertainment | 12 (100.0%) | 0 (0.0%) |
| Health Diagnosing & Treating | 0 (0.0%) | 25 (100.0%) |
| Health Technologists | 0 (0.0%) | 21 (100.0%) |
| Total (Category) | 90 (47.4%) | 100 (52.6%) |
| Total (Overall) | 264 (54.5%) | 220 (45.5%) |
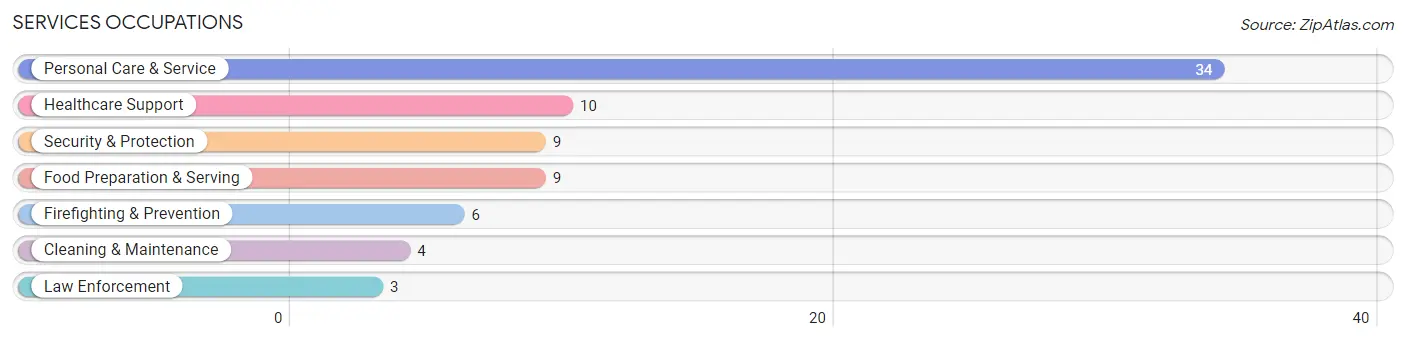
Services Occupations
The most common Services occupations in Arapahoe are Personal Care & Service (34 | 7.0%), Healthcare Support (10 | 2.1%), Security & Protection (9 | 1.9%), Food Preparation & Serving (9 | 1.9%), and Firefighting & Prevention (6 | 1.2%).
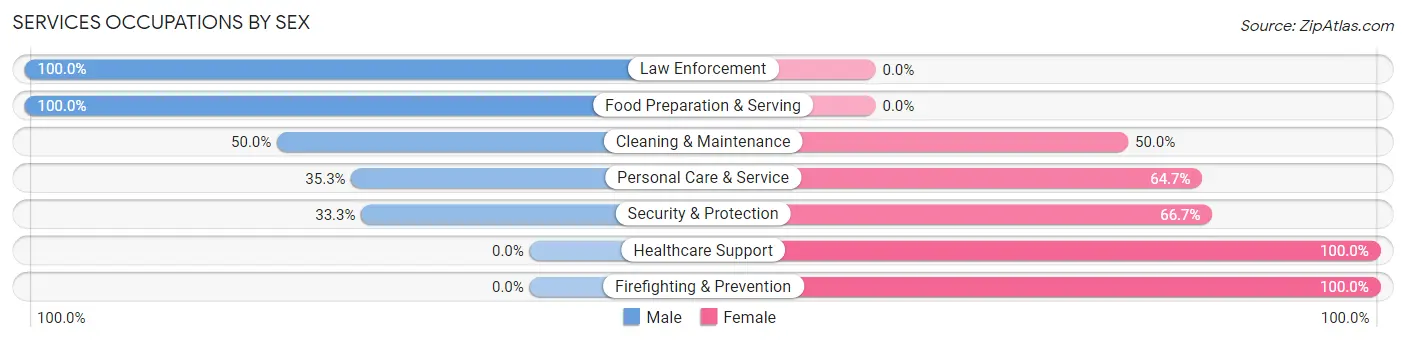
Services Occupations by Sex
Within the Services occupations in Arapahoe, the most male-oriented occupations are Law Enforcement (100.0%), Food Preparation & Serving (100.0%), and Cleaning & Maintenance (50.0%), while the most female-oriented occupations are Healthcare Support (100.0%), Firefighting & Prevention (100.0%), and Security & Protection (66.7%).
| Occupation | Male | Female |
| Healthcare Support | 0 (0.0%) | 10 (100.0%) |
| Security & Protection | 3 (33.3%) | 6 (66.7%) |
| Firefighting & Prevention | 0 (0.0%) | 6 (100.0%) |
| Law Enforcement | 3 (100.0%) | 0 (0.0%) |
| Food Preparation & Serving | 9 (100.0%) | 0 (0.0%) |
| Cleaning & Maintenance | 2 (50.0%) | 2 (50.0%) |
| Personal Care & Service | 12 (35.3%) | 22 (64.7%) |
| Total (Category) | 26 (39.4%) | 40 (60.6%) |
| Total (Overall) | 264 (54.5%) | 220 (45.5%) |
Sales and Office Occupations
The most common Sales and Office occupations in Arapahoe are Sales & Related (56 | 11.6%), and Office & Administration (40 | 8.3%).
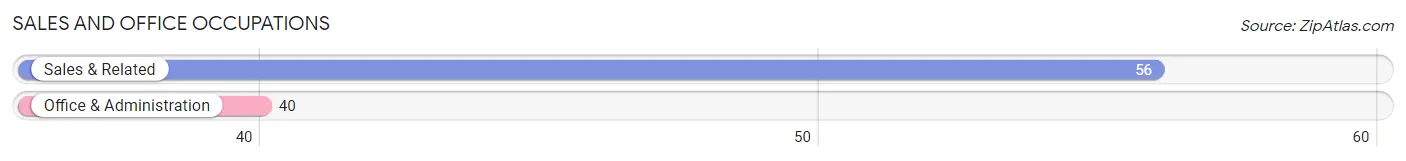
Sales and Office Occupations by Sex
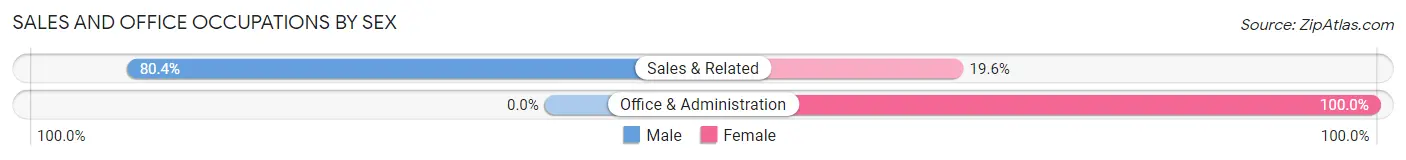
| Occupation | Male | Female |
| Sales & Related | 45 (80.4%) | 11 (19.6%) |
| Office & Administration | 0 (0.0%) | 40 (100.0%) |
| Total (Category) | 45 (46.9%) | 51 (53.1%) |
| Total (Overall) | 264 (54.5%) | 220 (45.5%) |
Natural Resources, Construction and Maintenance Occupations
The most common Natural Resources, Construction and Maintenance occupations in Arapahoe are Farming, Fishing & Forestry (36 | 7.4%), Installation, Maintenance & Repair (22 | 4.5%), and Construction & Extraction (18 | 3.7%).
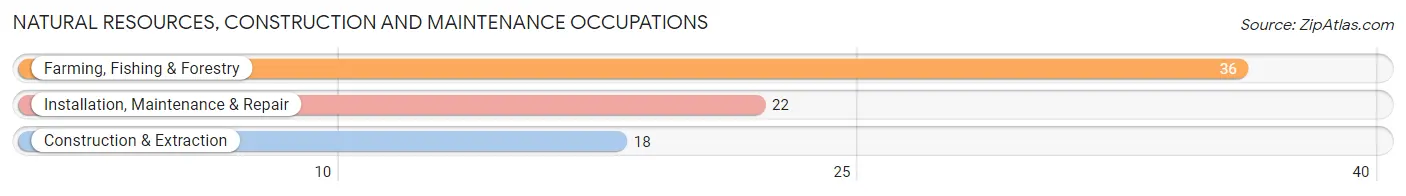
Natural Resources, Construction and Maintenance Occupations by Sex
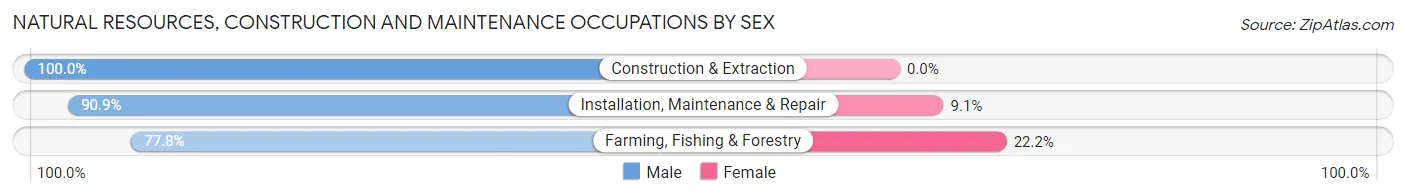
| Occupation | Male | Female |
| Farming, Fishing & Forestry | 28 (77.8%) | 8 (22.2%) |
| Construction & Extraction | 18 (100.0%) | 0 (0.0%) |
| Installation, Maintenance & Repair | 20 (90.9%) | 2 (9.1%) |
| Total (Category) | 66 (86.8%) | 10 (13.2%) |
| Total (Overall) | 264 (54.5%) | 220 (45.5%) |
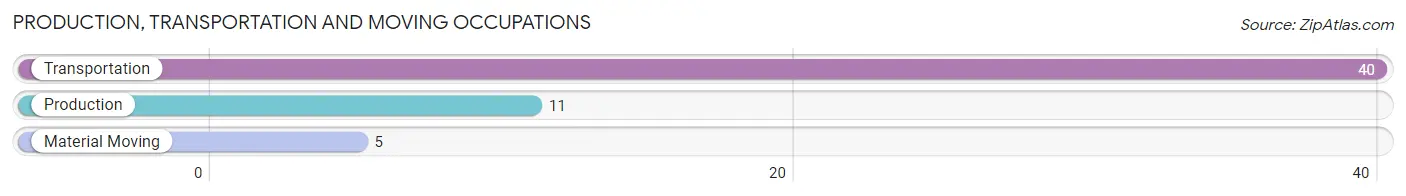
Production, Transportation and Moving Occupations
The most common Production, Transportation and Moving occupations in Arapahoe are Transportation (40 | 8.3%), Production (11 | 2.3%), and Material Moving (5 | 1.0%).
Production, Transportation and Moving Occupations by Sex
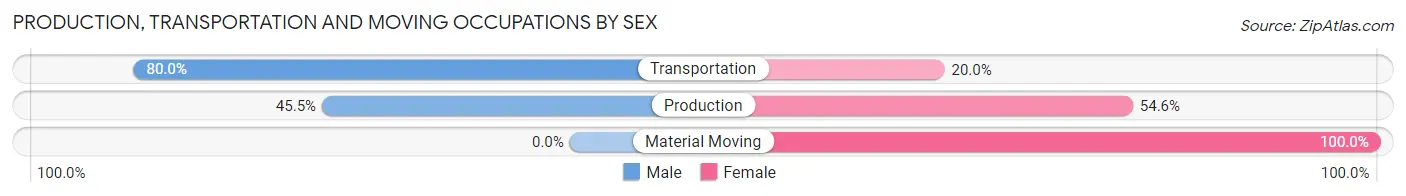
| Occupation | Male | Female |
| Production | 5 (45.5%) | 6 (54.5%) |
| Transportation | 32 (80.0%) | 8 (20.0%) |
| Material Moving | 0 (0.0%) | 5 (100.0%) |
| Total (Category) | 37 (66.1%) | 19 (33.9%) |
| Total (Overall) | 264 (54.5%) | 220 (45.5%) |
Employment Industries by Sex in Arapahoe
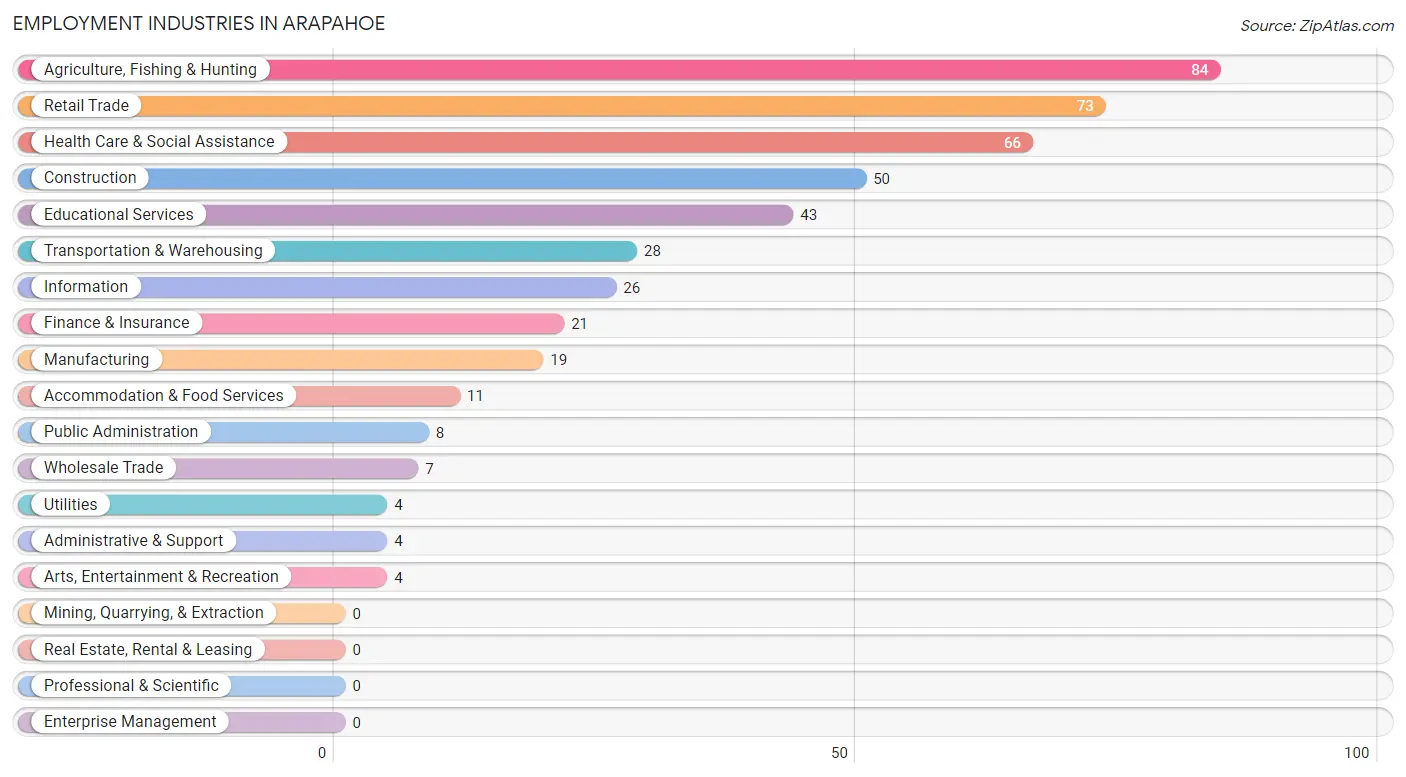
Employment Industries in Arapahoe
The major employment industries in Arapahoe include Agriculture, Fishing & Hunting (84 | 17.4%), Retail Trade (73 | 15.1%), Health Care & Social Assistance (66 | 13.6%), Construction (50 | 10.3%), and Educational Services (43 | 8.9%).
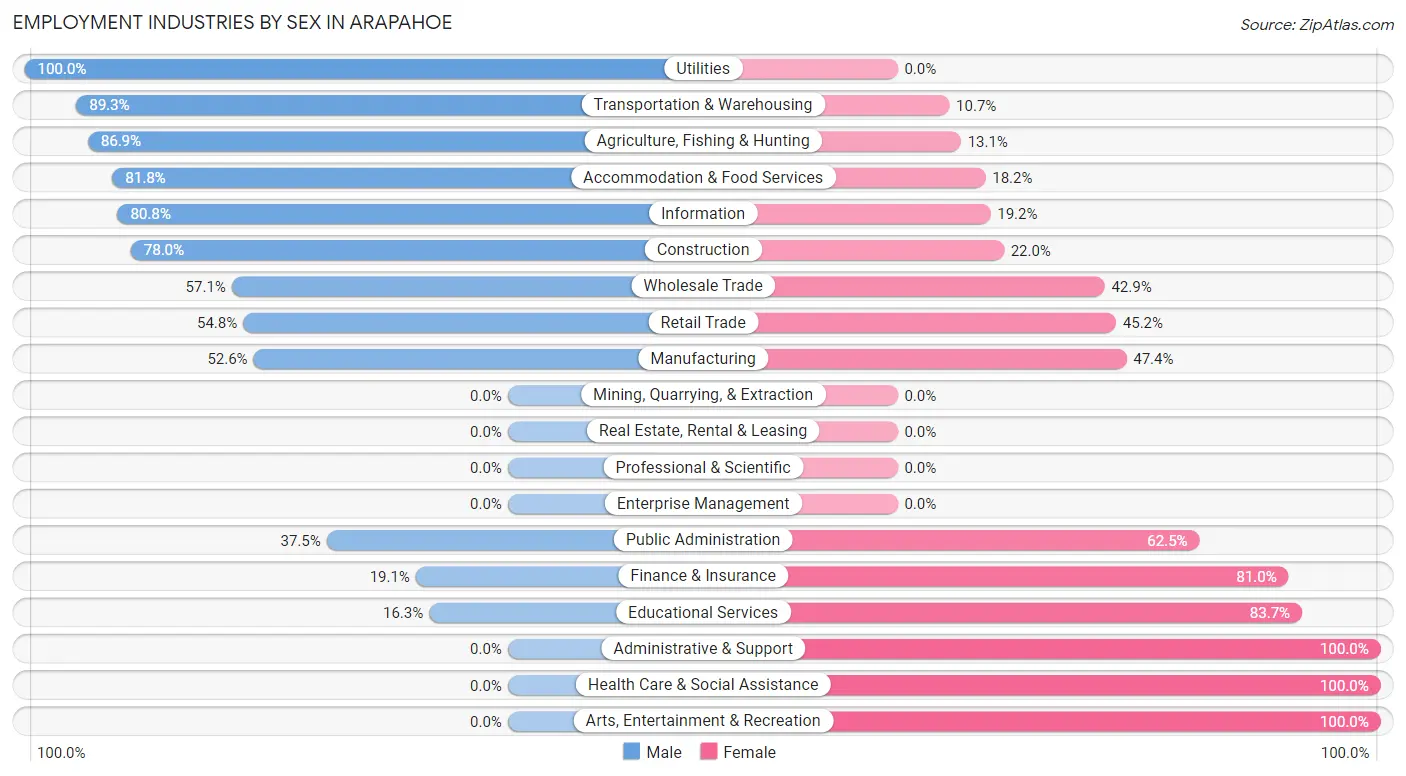
Employment Industries by Sex in Arapahoe
The Arapahoe industries that see more men than women are Utilities (100.0%), Transportation & Warehousing (89.3%), and Agriculture, Fishing & Hunting (86.9%), whereas the industries that tend to have a higher number of women are Administrative & Support (100.0%), Health Care & Social Assistance (100.0%), and Arts, Entertainment & Recreation (100.0%).
| Industry | Male | Female |
| Agriculture, Fishing & Hunting | 73 (86.9%) | 11 (13.1%) |
| Mining, Quarrying, & Extraction | 0 (0.0%) | 0 (0.0%) |
| Construction | 39 (78.0%) | 11 (22.0%) |
| Manufacturing | 10 (52.6%) | 9 (47.4%) |
| Wholesale Trade | 4 (57.1%) | 3 (42.9%) |
| Retail Trade | 40 (54.8%) | 33 (45.2%) |
| Transportation & Warehousing | 25 (89.3%) | 3 (10.7%) |
| Utilities | 4 (100.0%) | 0 (0.0%) |
| Information | 21 (80.8%) | 5 (19.2%) |
| Finance & Insurance | 4 (19.1%) | 17 (80.9%) |
| Real Estate, Rental & Leasing | 0 (0.0%) | 0 (0.0%) |
| Professional & Scientific | 0 (0.0%) | 0 (0.0%) |
| Enterprise Management | 0 (0.0%) | 0 (0.0%) |
| Administrative & Support | 0 (0.0%) | 4 (100.0%) |
| Educational Services | 7 (16.3%) | 36 (83.7%) |
| Health Care & Social Assistance | 0 (0.0%) | 66 (100.0%) |
| Arts, Entertainment & Recreation | 0 (0.0%) | 4 (100.0%) |
| Accommodation & Food Services | 9 (81.8%) | 2 (18.2%) |
| Public Administration | 3 (37.5%) | 5 (62.5%) |
| Total | 264 (54.5%) | 220 (45.5%) |
Education in Arapahoe
School Enrollment in Arapahoe
The most common levels of schooling among the 225 students in Arapahoe are high school (70 | 31.1%), middle school (61 | 27.1%), and elementary school (55 | 24.4%).
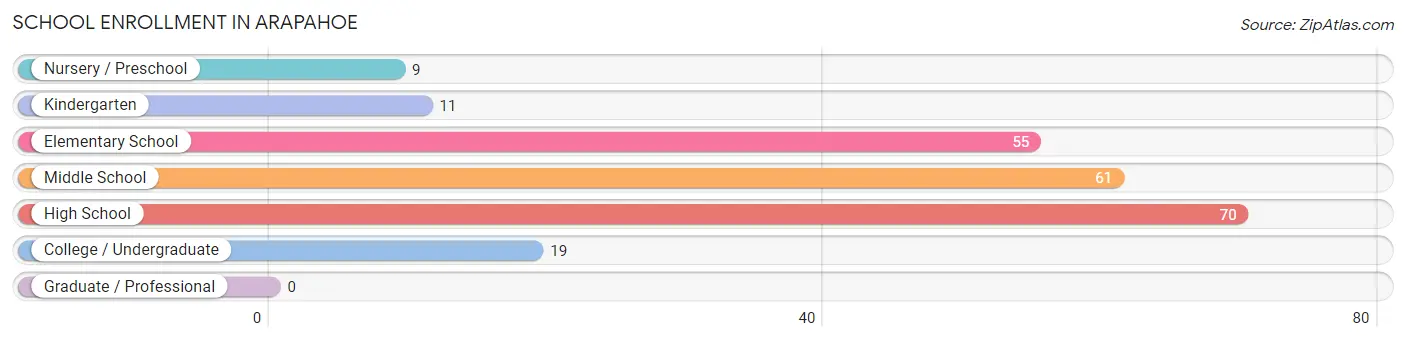
| School Level | # Students | % Students |
| Nursery / Preschool | 9 | 4.0% |
| Kindergarten | 11 | 4.9% |
| Elementary School | 55 | 24.4% |
| Middle School | 61 | 27.1% |
| High School | 70 | 31.1% |
| College / Undergraduate | 19 | 8.4% |
| Graduate / Professional | 0 | 0.0% |
| Total | 225 | 100.0% |
School Enrollment by Age by Funding Source in Arapahoe
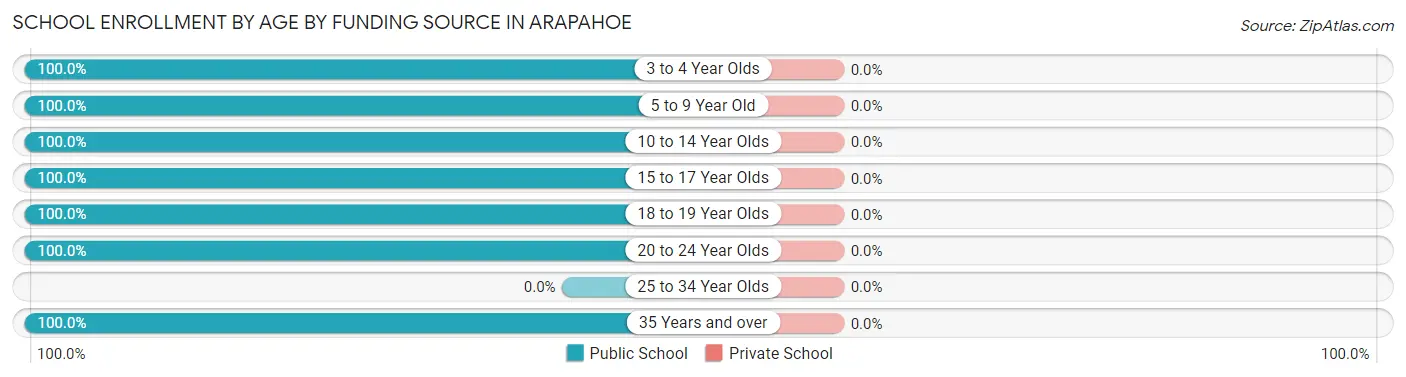
| Age Bracket | Public School | Private School |
| 3 to 4 Year Olds | 3 (100.0%) | 0 (0.0%) |
| 5 to 9 Year Old | 68 (100.0%) | 0 (0.0%) |
| 10 to 14 Year Olds | 60 (100.0%) | 0 (0.0%) |
| 15 to 17 Year Olds | 68 (100.0%) | 0 (0.0%) |
| 18 to 19 Year Olds | 12 (100.0%) | 0 (0.0%) |
| 20 to 24 Year Olds | 12 (100.0%) | 0 (0.0%) |
| 25 to 34 Year Olds | 0 (0.0%) | 0 (0.0%) |
| 35 Years and over | 2 (100.0%) | 0 (0.0%) |
| Total | 225 (100.0%) | 0 (0.0%) |
Educational Attainment by Field of Study in Arapahoe
Education (39 | 26.7%), science & technology (37 | 25.3%), bio, nature & agricultural (21 | 14.4%), psychology (15 | 10.3%), and business (10 | 6.9%) are the most common fields of study among 146 individuals in Arapahoe who have obtained a bachelor's degree or higher.
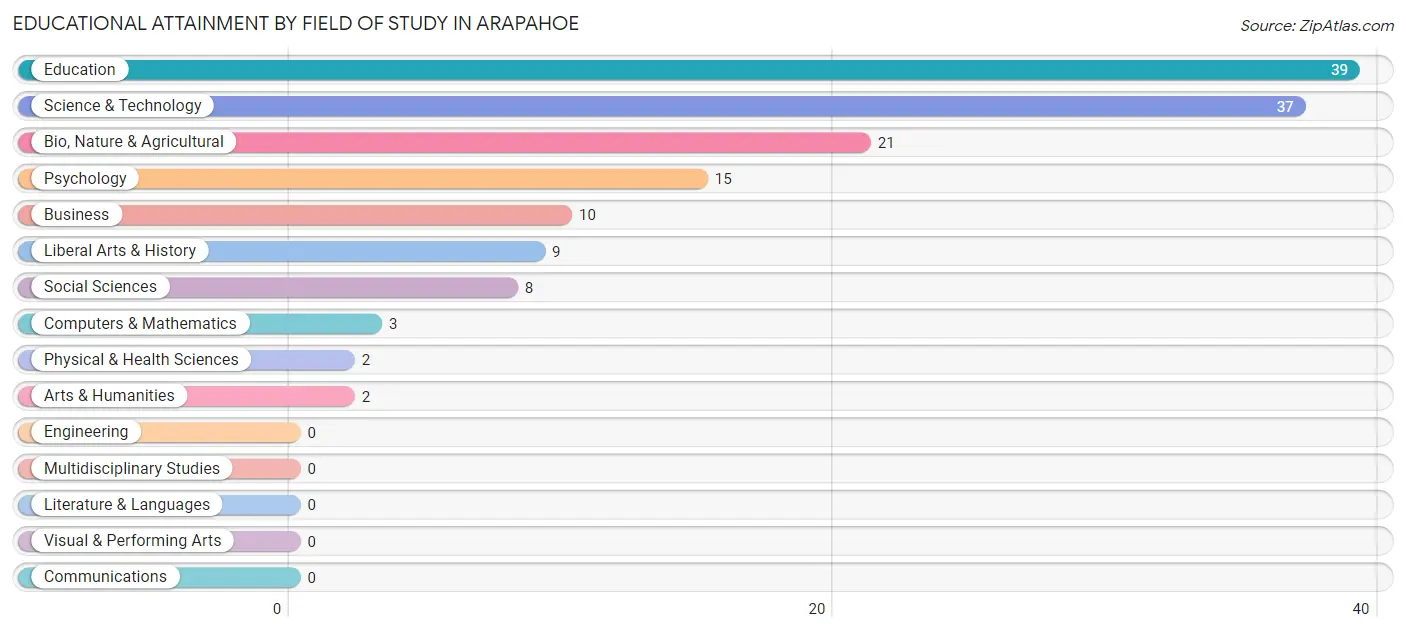
| Field of Study | # Graduates | % Graduates |
| Computers & Mathematics | 3 | 2.1% |
| Bio, Nature & Agricultural | 21 | 14.4% |
| Physical & Health Sciences | 2 | 1.4% |
| Psychology | 15 | 10.3% |
| Social Sciences | 8 | 5.5% |
| Engineering | 0 | 0.0% |
| Multidisciplinary Studies | 0 | 0.0% |
| Science & Technology | 37 | 25.3% |
| Business | 10 | 6.9% |
| Education | 39 | 26.7% |
| Literature & Languages | 0 | 0.0% |
| Liberal Arts & History | 9 | 6.2% |
| Visual & Performing Arts | 0 | 0.0% |
| Communications | 0 | 0.0% |
| Arts & Humanities | 2 | 1.4% |
| Total | 146 | 100.0% |
Transportation & Commute in Arapahoe
Vehicle Availability by Sex in Arapahoe
The most prevalent vehicle ownership categories in Arapahoe are males with 3 vehicles (106, accounting for 40.2%) and females with 3 vehicles (80, making up 48.2%).
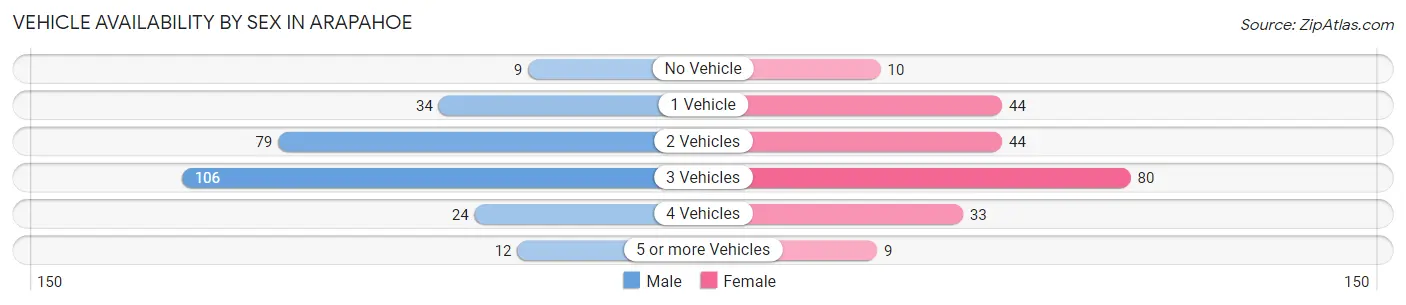
| Vehicles Available | Male | Female |
| No Vehicle | 9 (3.4%) | 10 (4.5%) |
| 1 Vehicle | 34 (12.9%) | 44 (20.0%) |
| 2 Vehicles | 79 (29.9%) | 44 (20.0%) |
| 3 Vehicles | 106 (40.2%) | 80 (36.4%) |
| 4 Vehicles | 24 (9.1%) | 33 (15.0%) |
| 5 or more Vehicles | 12 (4.5%) | 9 (4.1%) |
| Total | 264 (100.0%) | 220 (100.0%) |
Commute Time in Arapahoe
The most frequently occuring commute durations in Arapahoe are 5 to 9 minutes (140 commuters, 30.1%), less than 5 minutes (111 commuters, 23.9%), and 10 to 14 minutes (55 commuters, 11.8%).
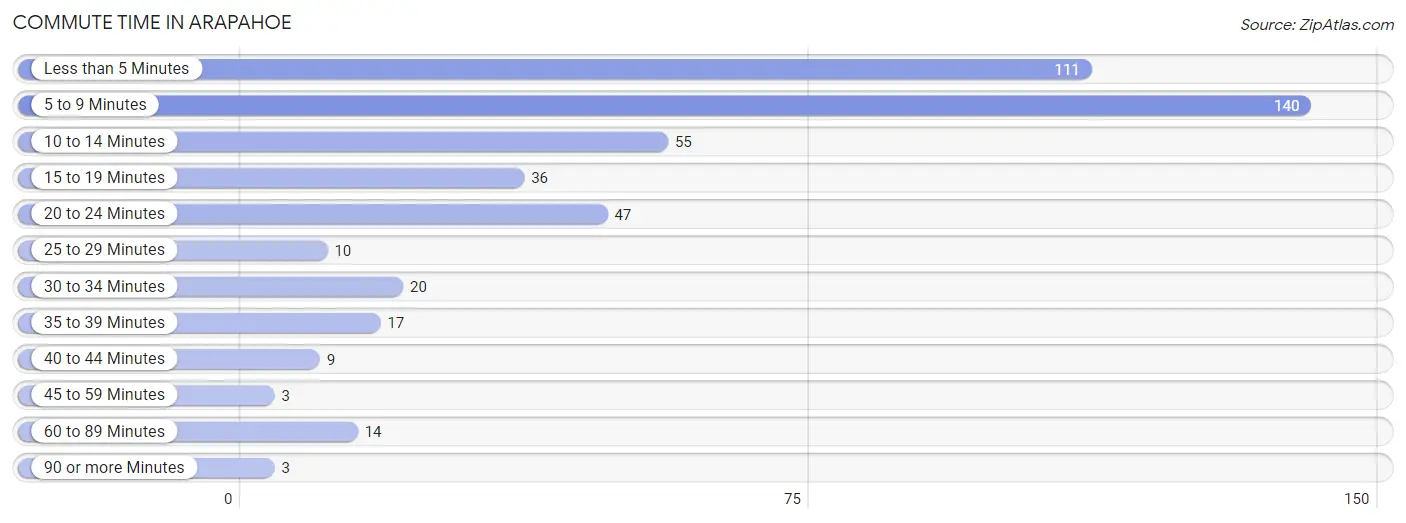
| Commute Time | # Commuters | % Commuters |
| Less than 5 Minutes | 111 | 23.9% |
| 5 to 9 Minutes | 140 | 30.1% |
| 10 to 14 Minutes | 55 | 11.8% |
| 15 to 19 Minutes | 36 | 7.7% |
| 20 to 24 Minutes | 47 | 10.1% |
| 25 to 29 Minutes | 10 | 2.1% |
| 30 to 34 Minutes | 20 | 4.3% |
| 35 to 39 Minutes | 17 | 3.7% |
| 40 to 44 Minutes | 9 | 1.9% |
| 45 to 59 Minutes | 3 | 0.6% |
| 60 to 89 Minutes | 14 | 3.0% |
| 90 or more Minutes | 3 | 0.6% |
Commute Time by Sex in Arapahoe
The most common commute times in Arapahoe are 5 to 9 minutes (78 commuters, 30.0%) for males and 5 to 9 minutes (62 commuters, 30.2%) for females.
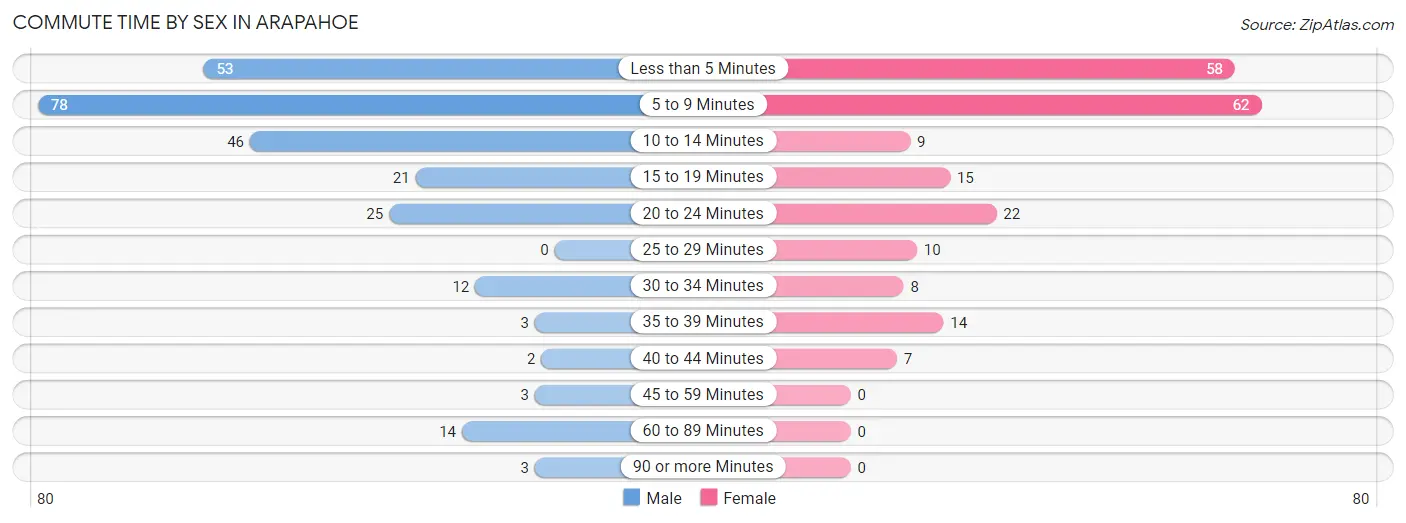
| Commute Time | Male | Female |
| Less than 5 Minutes | 53 (20.4%) | 58 (28.3%) |
| 5 to 9 Minutes | 78 (30.0%) | 62 (30.2%) |
| 10 to 14 Minutes | 46 (17.7%) | 9 (4.4%) |
| 15 to 19 Minutes | 21 (8.1%) | 15 (7.3%) |
| 20 to 24 Minutes | 25 (9.6%) | 22 (10.7%) |
| 25 to 29 Minutes | 0 (0.0%) | 10 (4.9%) |
| 30 to 34 Minutes | 12 (4.6%) | 8 (3.9%) |
| 35 to 39 Minutes | 3 (1.1%) | 14 (6.8%) |
| 40 to 44 Minutes | 2 (0.8%) | 7 (3.4%) |
| 45 to 59 Minutes | 3 (1.1%) | 0 (0.0%) |
| 60 to 89 Minutes | 14 (5.4%) | 0 (0.0%) |
| 90 or more Minutes | 3 (1.1%) | 0 (0.0%) |
Time of Departure to Work by Sex in Arapahoe
The most frequent times of departure to work in Arapahoe are 7:30 AM to 7:59 AM (59, 22.7%) for males and 7:00 AM to 7:29 AM (49, 23.9%) for females.
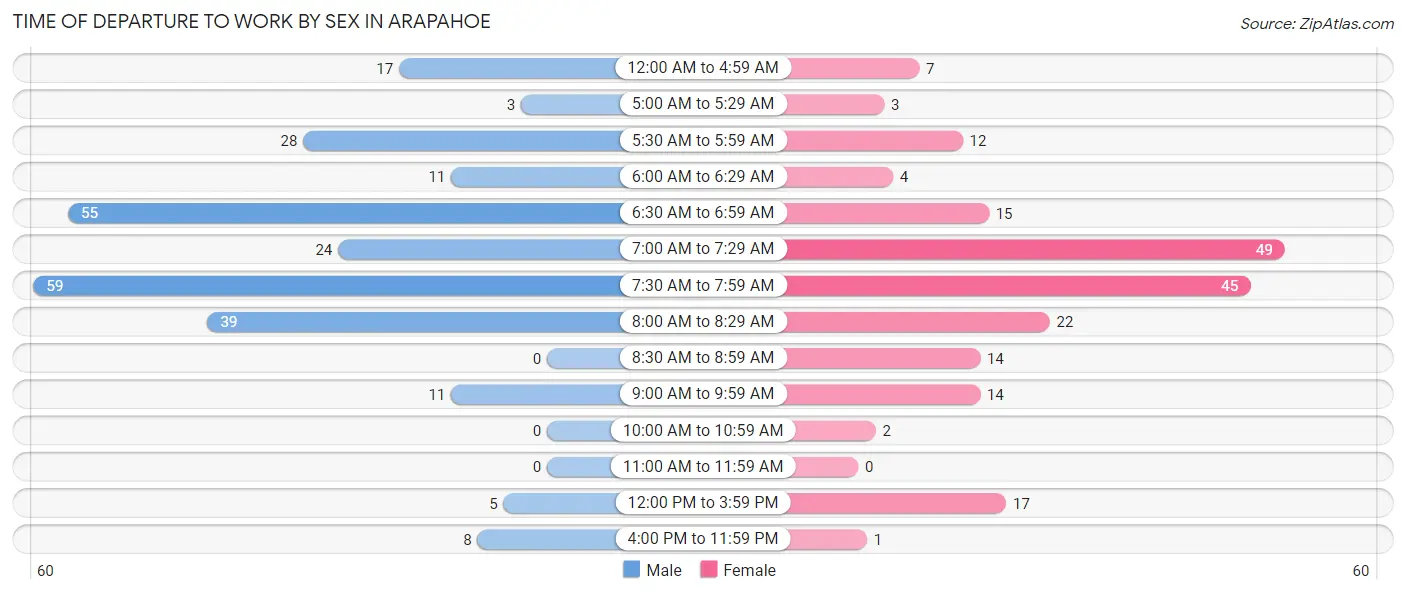
| Time of Departure | Male | Female |
| 12:00 AM to 4:59 AM | 17 (6.5%) | 7 (3.4%) |
| 5:00 AM to 5:29 AM | 3 (1.1%) | 3 (1.5%) |
| 5:30 AM to 5:59 AM | 28 (10.8%) | 12 (5.9%) |
| 6:00 AM to 6:29 AM | 11 (4.2%) | 4 (1.9%) |
| 6:30 AM to 6:59 AM | 55 (21.1%) | 15 (7.3%) |
| 7:00 AM to 7:29 AM | 24 (9.2%) | 49 (23.9%) |
| 7:30 AM to 7:59 AM | 59 (22.7%) | 45 (22.0%) |
| 8:00 AM to 8:29 AM | 39 (15.0%) | 22 (10.7%) |
| 8:30 AM to 8:59 AM | 0 (0.0%) | 14 (6.8%) |
| 9:00 AM to 9:59 AM | 11 (4.2%) | 14 (6.8%) |
| 10:00 AM to 10:59 AM | 0 (0.0%) | 2 (1.0%) |
| 11:00 AM to 11:59 AM | 0 (0.0%) | 0 (0.0%) |
| 12:00 PM to 3:59 PM | 5 (1.9%) | 17 (8.3%) |
| 4:00 PM to 11:59 PM | 8 (3.1%) | 1 (0.5%) |
| Total | 260 (100.0%) | 205 (100.0%) |
Housing Occupancy in Arapahoe
Occupancy by Ownership in Arapahoe
Of the total 375 dwellings in Arapahoe, owner-occupied units account for 282 (75.2%), while renter-occupied units make up 93 (24.8%).
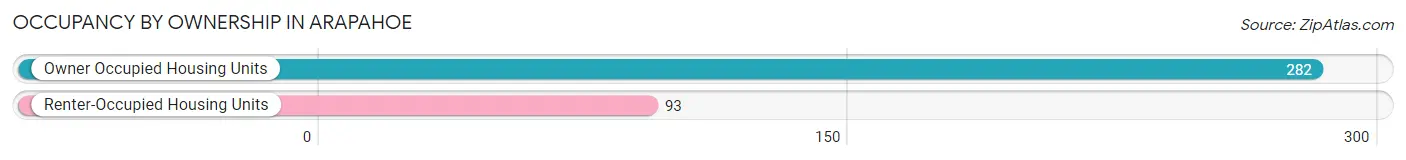
| Occupancy | # Housing Units | % Housing Units |
| Owner Occupied Housing Units | 282 | 75.2% |
| Renter-Occupied Housing Units | 93 | 24.8% |
| Total Occupied Housing Units | 375 | 100.0% |
Occupancy by Household Size in Arapahoe
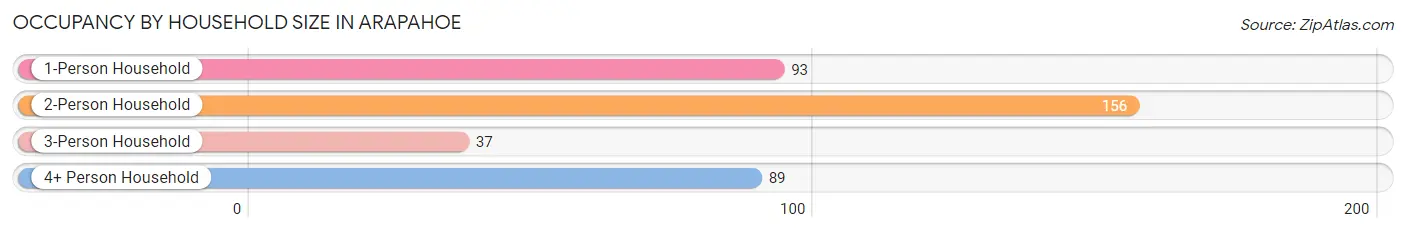
| Household Size | # Housing Units | % Housing Units |
| 1-Person Household | 93 | 24.8% |
| 2-Person Household | 156 | 41.6% |
| 3-Person Household | 37 | 9.9% |
| 4+ Person Household | 89 | 23.7% |
| Total Housing Units | 375 | 100.0% |
Occupancy by Ownership by Household Size in Arapahoe
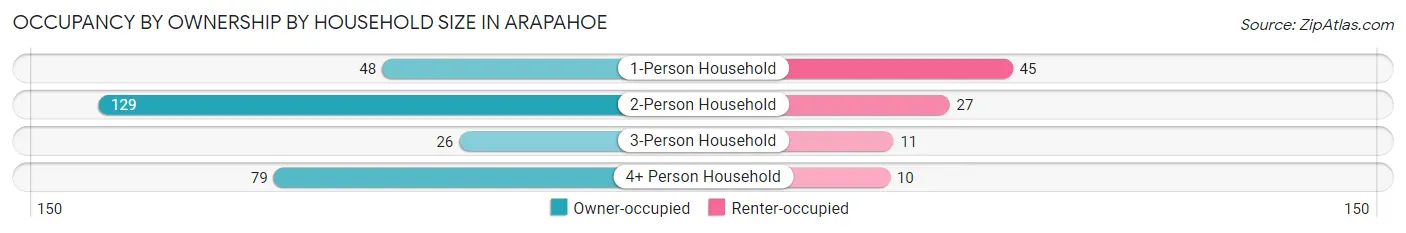
| Household Size | Owner-occupied | Renter-occupied |
| 1-Person Household | 48 (51.6%) | 45 (48.4%) |
| 2-Person Household | 129 (82.7%) | 27 (17.3%) |
| 3-Person Household | 26 (70.3%) | 11 (29.7%) |
| 4+ Person Household | 79 (88.8%) | 10 (11.2%) |
| Total Housing Units | 282 (75.2%) | 93 (24.8%) |
Occupancy by Educational Attainment in Arapahoe
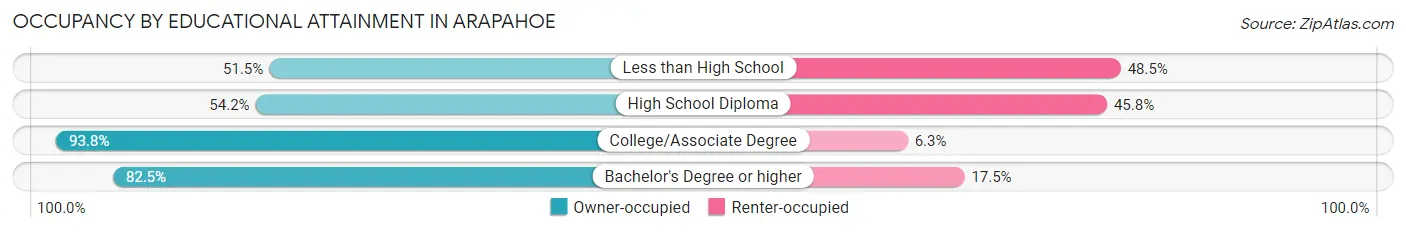
| Household Size | Owner-occupied | Renter-occupied |
| Less than High School | 17 (51.5%) | 16 (48.5%) |
| High School Diploma | 64 (54.2%) | 54 (45.8%) |
| College/Associate Degree | 135 (93.8%) | 9 (6.2%) |
| Bachelor's Degree or higher | 66 (82.5%) | 14 (17.5%) |
Occupancy by Age of Householder in Arapahoe
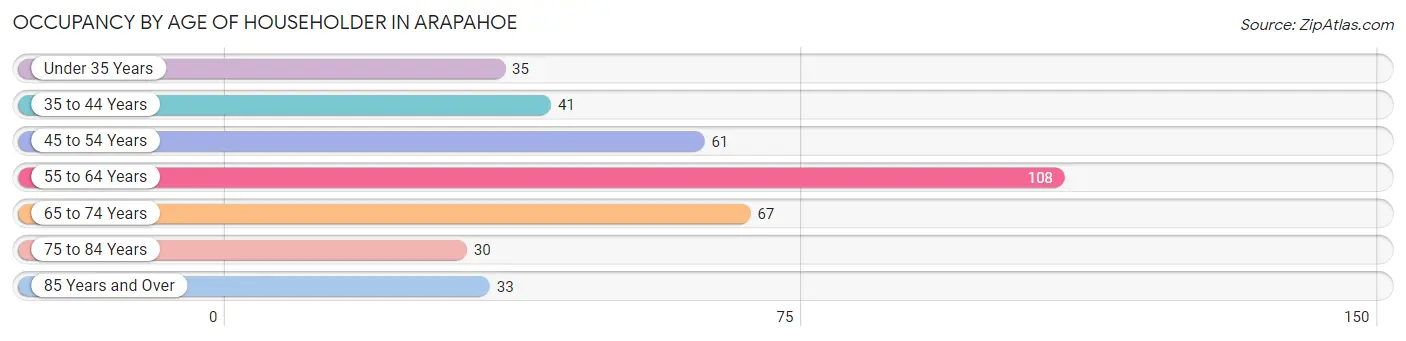
| Age Bracket | # Households | % Households |
| Under 35 Years | 35 | 9.3% |
| 35 to 44 Years | 41 | 10.9% |
| 45 to 54 Years | 61 | 16.3% |
| 55 to 64 Years | 108 | 28.8% |
| 65 to 74 Years | 67 | 17.9% |
| 75 to 84 Years | 30 | 8.0% |
| 85 Years and Over | 33 | 8.8% |
| Total | 375 | 100.0% |
Housing Finances in Arapahoe
Median Income by Occupancy in Arapahoe
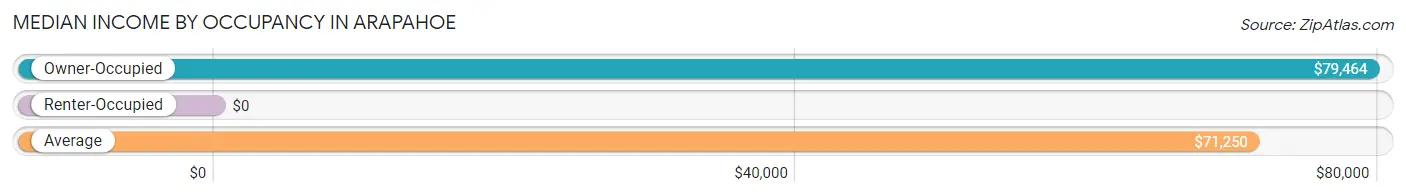
| Occupancy Type | # Households | Median Income |
| Owner-Occupied | 282 (75.2%) | $79,464 |
| Renter-Occupied | 93 (24.8%) | $0 |
| Average | 375 (100.0%) | $71,250 |
Occupancy by Householder Income Bracket in Arapahoe
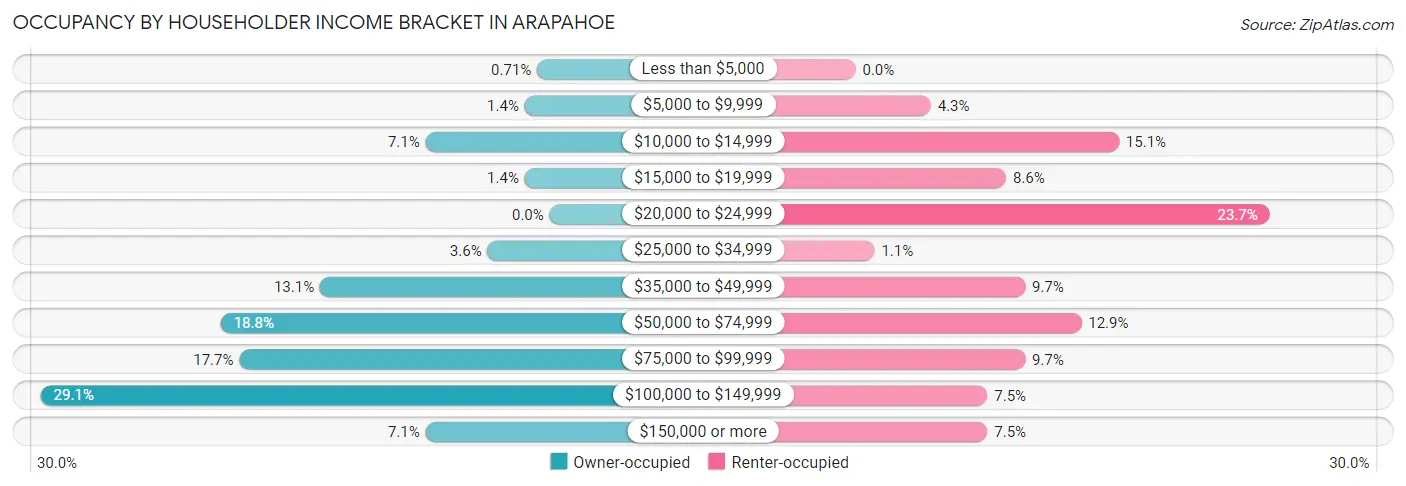
| Income Bracket | Owner-occupied | Renter-occupied |
| Less than $5,000 | 2 (0.7%) | 0 (0.0%) |
| $5,000 to $9,999 | 4 (1.4%) | 4 (4.3%) |
| $10,000 to $14,999 | 20 (7.1%) | 14 (15.0%) |
| $15,000 to $19,999 | 4 (1.4%) | 8 (8.6%) |
| $20,000 to $24,999 | 0 (0.0%) | 22 (23.7%) |
| $25,000 to $34,999 | 10 (3.5%) | 1 (1.1%) |
| $35,000 to $49,999 | 37 (13.1%) | 9 (9.7%) |
| $50,000 to $74,999 | 53 (18.8%) | 12 (12.9%) |
| $75,000 to $99,999 | 50 (17.7%) | 9 (9.7%) |
| $100,000 to $149,999 | 82 (29.1%) | 7 (7.5%) |
| $150,000 or more | 20 (7.1%) | 7 (7.5%) |
| Total | 282 (100.0%) | 93 (100.0%) |
Monthly Housing Cost Tiers in Arapahoe
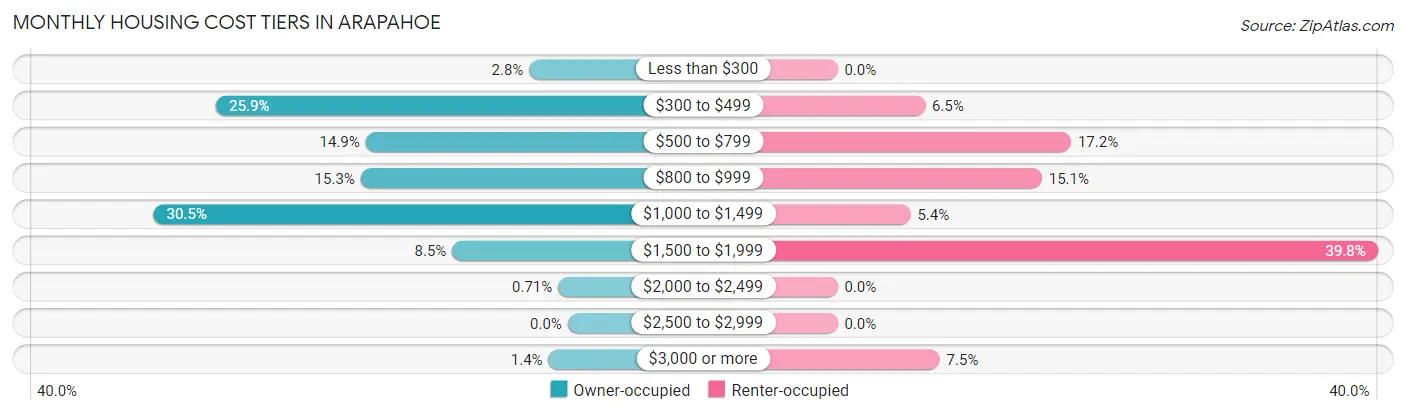
| Monthly Cost | Owner-occupied | Renter-occupied |
| Less than $300 | 8 (2.8%) | 0 (0.0%) |
| $300 to $499 | 73 (25.9%) | 6 (6.5%) |
| $500 to $799 | 42 (14.9%) | 16 (17.2%) |
| $800 to $999 | 43 (15.2%) | 14 (15.0%) |
| $1,000 to $1,499 | 86 (30.5%) | 5 (5.4%) |
| $1,500 to $1,999 | 24 (8.5%) | 37 (39.8%) |
| $2,000 to $2,499 | 2 (0.7%) | 0 (0.0%) |
| $2,500 to $2,999 | 0 (0.0%) | 0 (0.0%) |
| $3,000 or more | 4 (1.4%) | 7 (7.5%) |
| Total | 282 (100.0%) | 93 (100.0%) |
Physical Housing Characteristics in Arapahoe
Housing Structures in Arapahoe
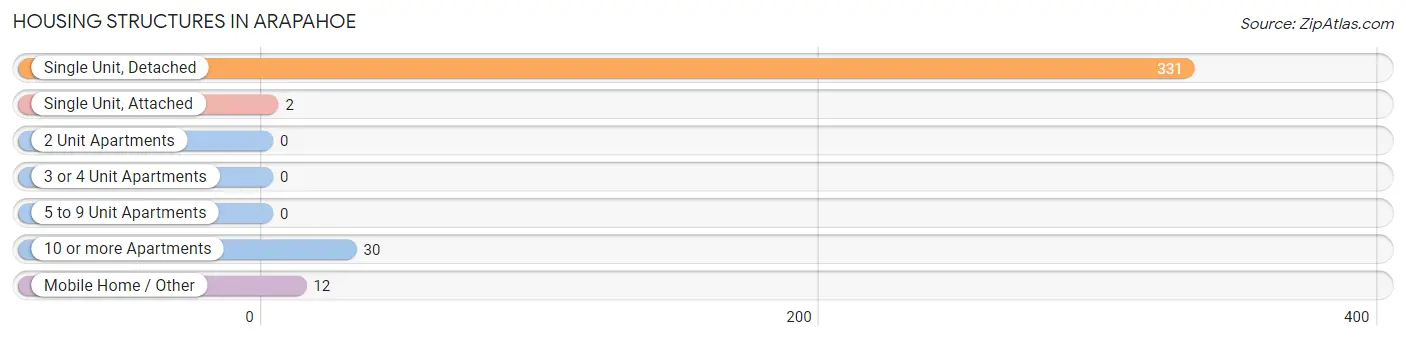
| Structure Type | # Housing Units | % Housing Units |
| Single Unit, Detached | 331 | 88.3% |
| Single Unit, Attached | 2 | 0.5% |
| 2 Unit Apartments | 0 | 0.0% |
| 3 or 4 Unit Apartments | 0 | 0.0% |
| 5 to 9 Unit Apartments | 0 | 0.0% |
| 10 or more Apartments | 30 | 8.0% |
| Mobile Home / Other | 12 | 3.2% |
| Total | 375 | 100.0% |
Housing Structures by Occupancy in Arapahoe
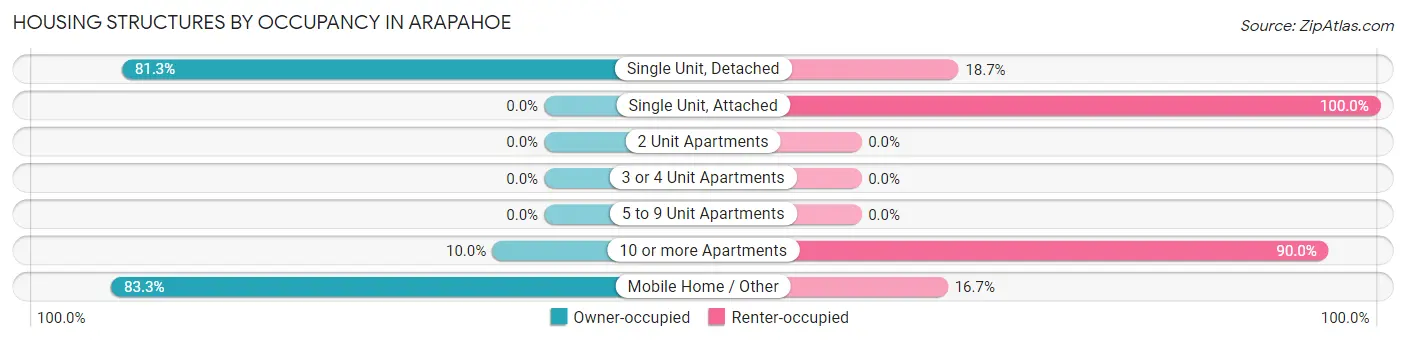
| Structure Type | Owner-occupied | Renter-occupied |
| Single Unit, Detached | 269 (81.3%) | 62 (18.7%) |
| Single Unit, Attached | 0 (0.0%) | 2 (100.0%) |
| 2 Unit Apartments | 0 (0.0%) | 0 (0.0%) |
| 3 or 4 Unit Apartments | 0 (0.0%) | 0 (0.0%) |
| 5 to 9 Unit Apartments | 0 (0.0%) | 0 (0.0%) |
| 10 or more Apartments | 3 (10.0%) | 27 (90.0%) |
| Mobile Home / Other | 10 (83.3%) | 2 (16.7%) |
| Total | 282 (75.2%) | 93 (24.8%) |
Housing Structures by Number of Rooms in Arapahoe
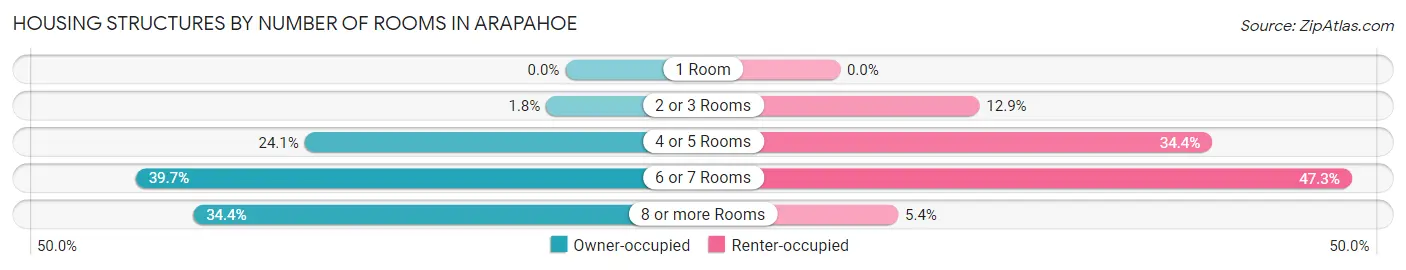
| Number of Rooms | Owner-occupied | Renter-occupied |
| 1 Room | 0 (0.0%) | 0 (0.0%) |
| 2 or 3 Rooms | 5 (1.8%) | 12 (12.9%) |
| 4 or 5 Rooms | 68 (24.1%) | 32 (34.4%) |
| 6 or 7 Rooms | 112 (39.7%) | 44 (47.3%) |
| 8 or more Rooms | 97 (34.4%) | 5 (5.4%) |
| Total | 282 (100.0%) | 93 (100.0%) |
Housing Structure by Heating Type in Arapahoe
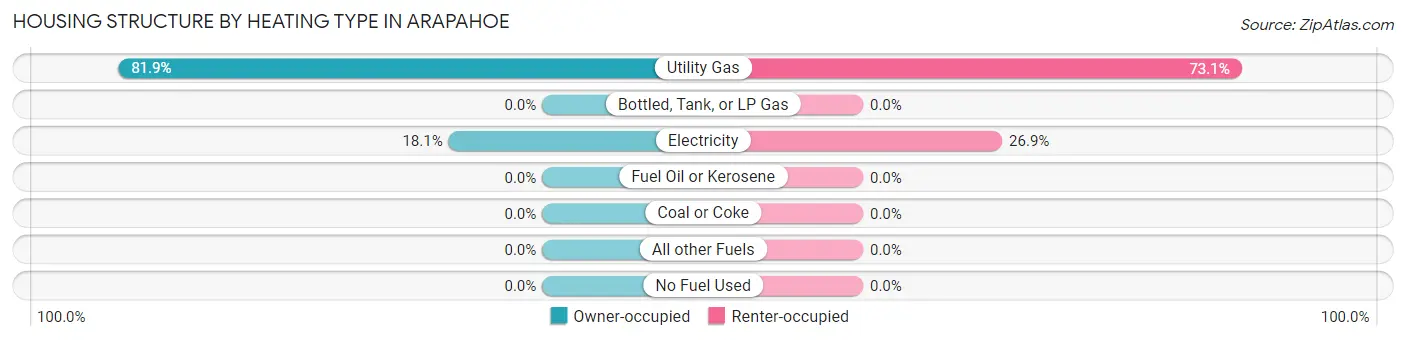
| Heating Type | Owner-occupied | Renter-occupied |
| Utility Gas | 231 (81.9%) | 68 (73.1%) |
| Bottled, Tank, or LP Gas | 0 (0.0%) | 0 (0.0%) |
| Electricity | 51 (18.1%) | 25 (26.9%) |
| Fuel Oil or Kerosene | 0 (0.0%) | 0 (0.0%) |
| Coal or Coke | 0 (0.0%) | 0 (0.0%) |
| All other Fuels | 0 (0.0%) | 0 (0.0%) |
| No Fuel Used | 0 (0.0%) | 0 (0.0%) |
| Total | 282 (100.0%) | 93 (100.0%) |
Household Vehicle Usage in Arapahoe
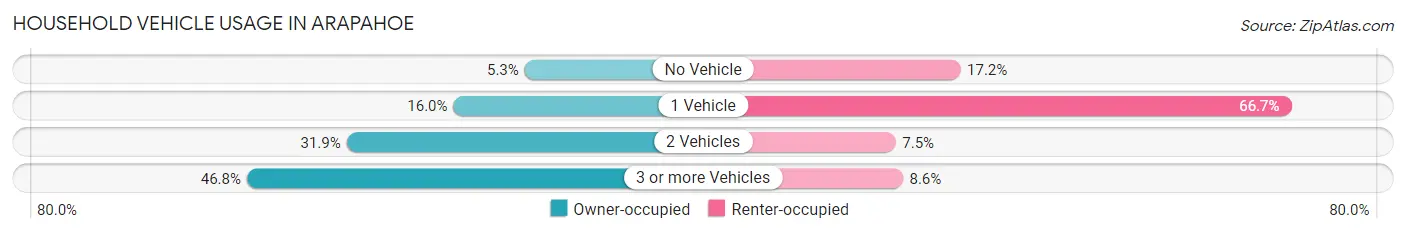
| Vehicles per Household | Owner-occupied | Renter-occupied |
| No Vehicle | 15 (5.3%) | 16 (17.2%) |
| 1 Vehicle | 45 (16.0%) | 62 (66.7%) |
| 2 Vehicles | 90 (31.9%) | 7 (7.5%) |
| 3 or more Vehicles | 132 (46.8%) | 8 (8.6%) |
| Total | 282 (100.0%) | 93 (100.0%) |
Real Estate & Mortgages in Arapahoe
Real Estate and Mortgage Overview in Arapahoe
| Characteristic | Without Mortgage | With Mortgage |
| Housing Units | 131 | 151 |
| Median Property Value | $77,900 | $104,800 |
| Median Household Income | $56,563 | $16 |
| Monthly Housing Costs | $479 | $0 |
| Real Estate Taxes | $1,211 | $11 |
Property Value by Mortgage Status in Arapahoe
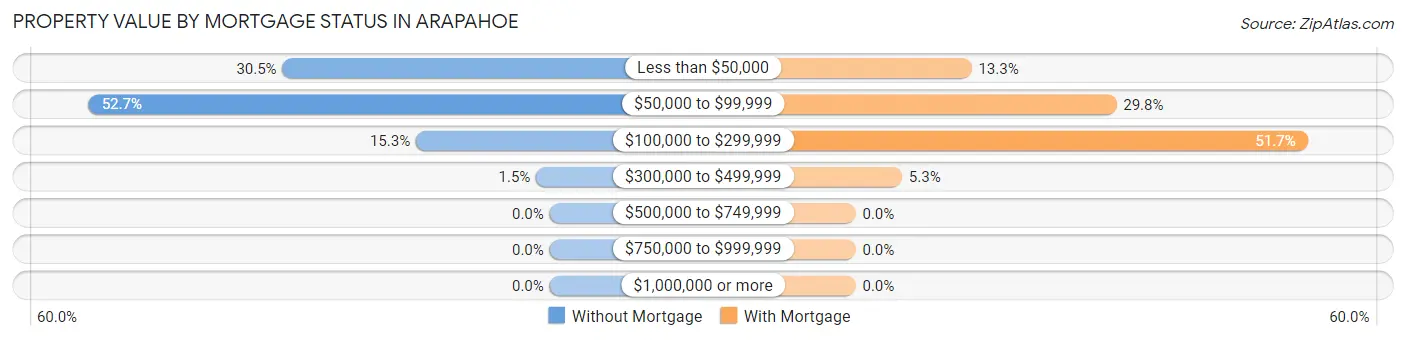
| Property Value | Without Mortgage | With Mortgage |
| Less than $50,000 | 40 (30.5%) | 20 (13.3%) |
| $50,000 to $99,999 | 69 (52.7%) | 45 (29.8%) |
| $100,000 to $299,999 | 20 (15.3%) | 78 (51.7%) |
| $300,000 to $499,999 | 2 (1.5%) | 8 (5.3%) |
| $500,000 to $749,999 | 0 (0.0%) | 0 (0.0%) |
| $750,000 to $999,999 | 0 (0.0%) | 0 (0.0%) |
| $1,000,000 or more | 0 (0.0%) | 0 (0.0%) |
| Total | 131 (100.0%) | 151 (100.0%) |
Household Income by Mortgage Status in Arapahoe
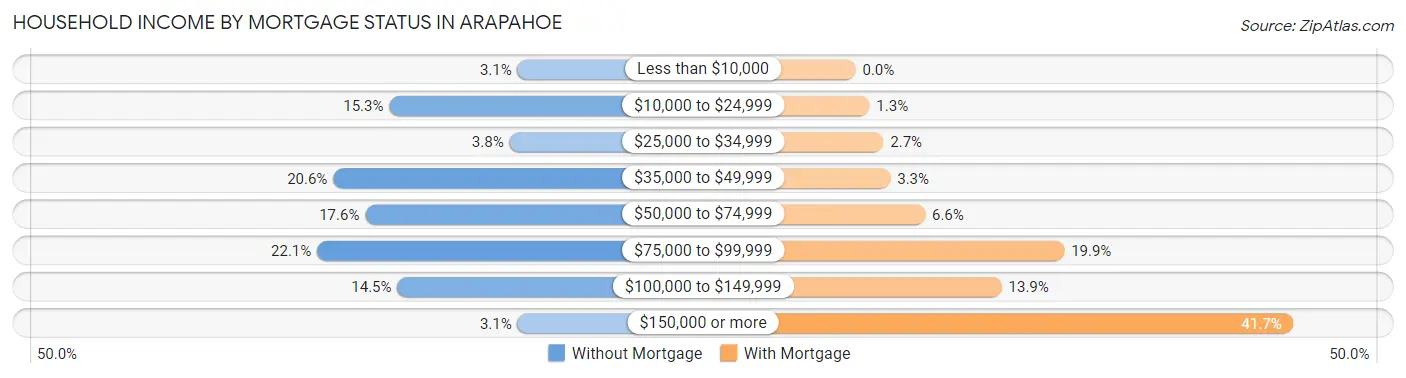
| Household Income | Without Mortgage | With Mortgage |
| Less than $10,000 | 4 (3.0%) | 0 (0.0%) |
| $10,000 to $24,999 | 20 (15.3%) | 2 (1.3%) |
| $25,000 to $34,999 | 5 (3.8%) | 4 (2.6%) |
| $35,000 to $49,999 | 27 (20.6%) | 5 (3.3%) |
| $50,000 to $74,999 | 23 (17.6%) | 10 (6.6%) |
| $75,000 to $99,999 | 29 (22.1%) | 30 (19.9%) |
| $100,000 to $149,999 | 19 (14.5%) | 21 (13.9%) |
| $150,000 or more | 4 (3.0%) | 63 (41.7%) |
| Total | 131 (100.0%) | 151 (100.0%) |
Property Value to Household Income Ratio in Arapahoe
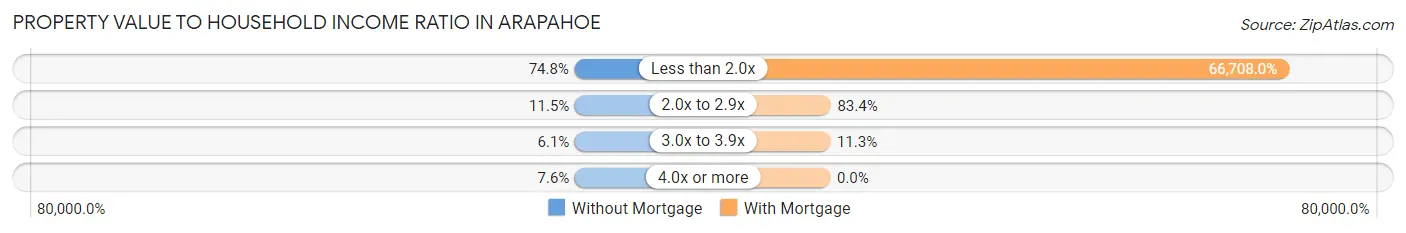
| Value-to-Income Ratio | Without Mortgage | With Mortgage |
| Less than 2.0x | 98 (74.8%) | 100,729 (66,708.0%) |
| 2.0x to 2.9x | 15 (11.5%) | 126 (83.4%) |
| 3.0x to 3.9x | 8 (6.1%) | 17 (11.3%) |
| 4.0x or more | 10 (7.6%) | 0 (0.0%) |
| Total | 131 (100.0%) | 151 (100.0%) |
Real Estate Taxes by Mortgage Status in Arapahoe
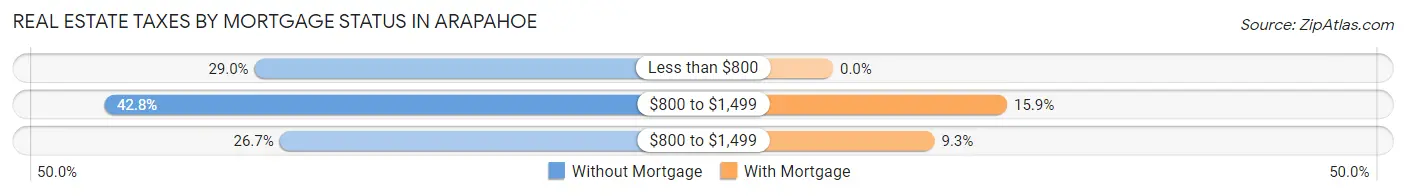
| Property Taxes | Without Mortgage | With Mortgage |
| Less than $800 | 38 (29.0%) | 0 (0.0%) |
| $800 to $1,499 | 56 (42.7%) | 24 (15.9%) |
| $800 to $1,499 | 35 (26.7%) | 14 (9.3%) |
| Total | 131 (100.0%) | 151 (100.0%) |
Health & Disability in Arapahoe
Health Insurance Coverage by Age in Arapahoe
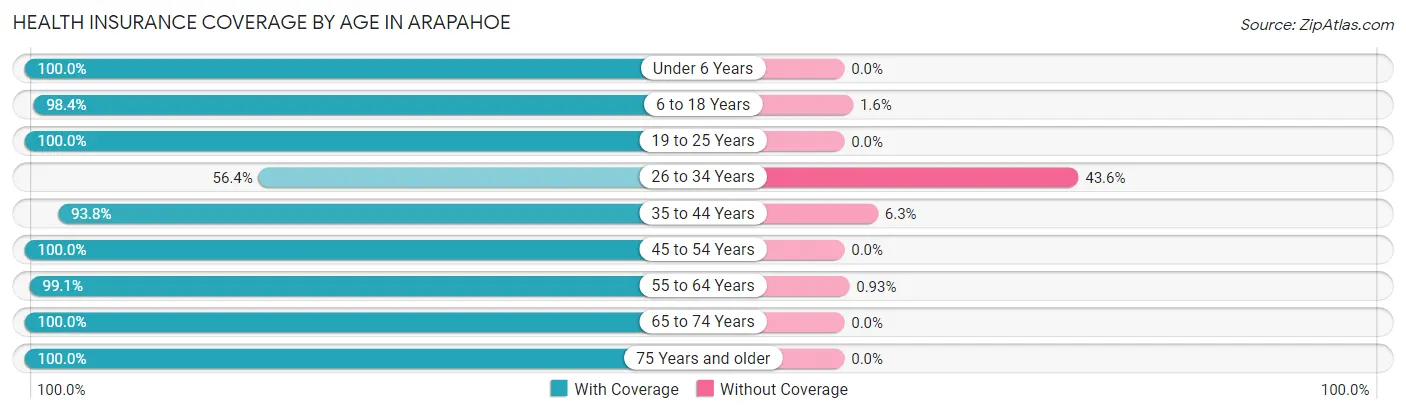
| Age Bracket | With Coverage | Without Coverage |
| Under 6 Years | 70 (100.0%) | 0 (0.0%) |
| 6 to 18 Years | 183 (98.4%) | 3 (1.6%) |
| 19 to 25 Years | 27 (100.0%) | 0 (0.0%) |
| 26 to 34 Years | 31 (56.4%) | 24 (43.6%) |
| 35 to 44 Years | 75 (93.8%) | 5 (6.2%) |
| 45 to 54 Years | 110 (100.0%) | 0 (0.0%) |
| 55 to 64 Years | 212 (99.1%) | 2 (0.9%) |
| 65 to 74 Years | 120 (100.0%) | 0 (0.0%) |
| 75 Years and older | 86 (100.0%) | 0 (0.0%) |
| Total | 914 (96.4%) | 34 (3.6%) |
Health Insurance Coverage by Citizenship Status in Arapahoe
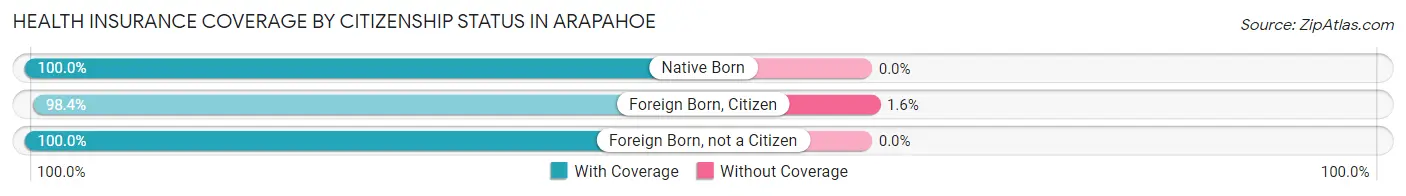
| Citizenship Status | With Coverage | Without Coverage |
| Native Born | 70 (100.0%) | 0 (0.0%) |
| Foreign Born, Citizen | 183 (98.4%) | 3 (1.6%) |
| Foreign Born, not a Citizen | 27 (100.0%) | 0 (0.0%) |
Health Insurance Coverage by Household Income in Arapahoe
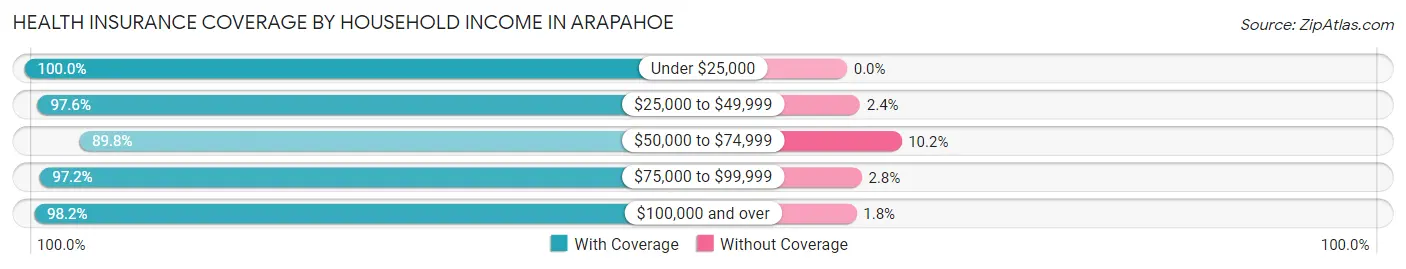
| Household Income | With Coverage | Without Coverage |
| Under $25,000 | 93 (100.0%) | 0 (0.0%) |
| $25,000 to $49,999 | 120 (97.6%) | 3 (2.4%) |
| $50,000 to $74,999 | 176 (89.8%) | 20 (10.2%) |
| $75,000 to $99,999 | 141 (97.2%) | 4 (2.8%) |
| $100,000 and over | 384 (98.2%) | 7 (1.8%) |
Public vs Private Health Insurance Coverage by Age in Arapahoe
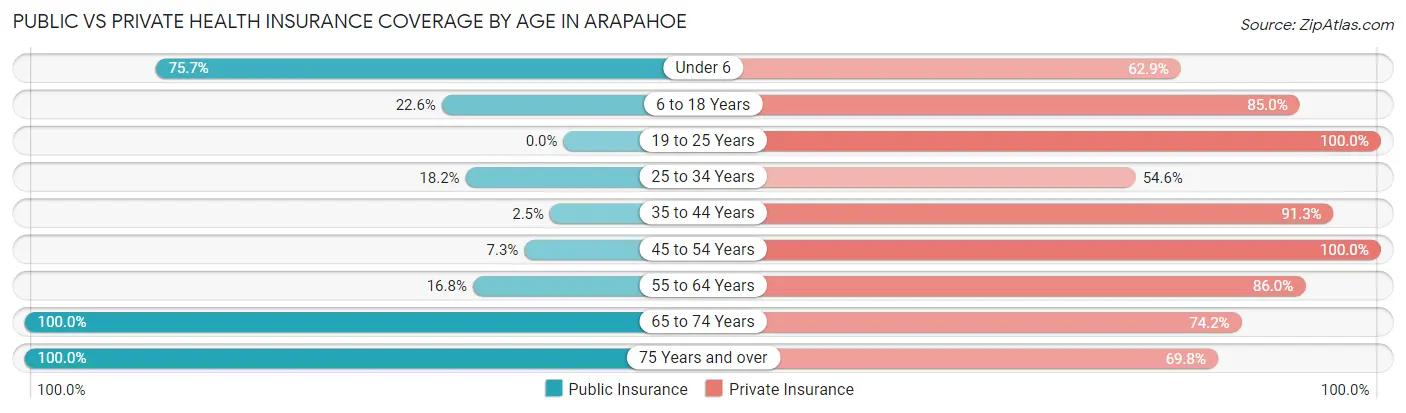
| Age Bracket | Public Insurance | Private Insurance |
| Under 6 | 53 (75.7%) | 44 (62.9%) |
| 6 to 18 Years | 42 (22.6%) | 158 (85.0%) |
| 19 to 25 Years | 0 (0.0%) | 27 (100.0%) |
| 25 to 34 Years | 10 (18.2%) | 30 (54.5%) |
| 35 to 44 Years | 2 (2.5%) | 73 (91.2%) |
| 45 to 54 Years | 8 (7.3%) | 110 (100.0%) |
| 55 to 64 Years | 36 (16.8%) | 184 (86.0%) |
| 65 to 74 Years | 120 (100.0%) | 89 (74.2%) |
| 75 Years and over | 86 (100.0%) | 60 (69.8%) |
| Total | 357 (37.7%) | 775 (81.8%) |
Disability Status by Sex by Age in Arapahoe
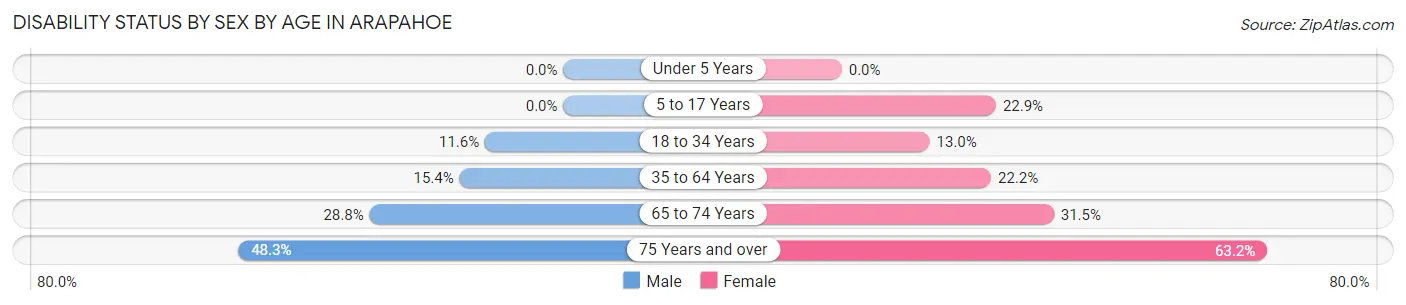
| Age Bracket | Male | Female |
| Under 5 Years | 0 (0.0%) | 0 (0.0%) |
| 5 to 17 Years | 0 (0.0%) | 19 (22.9%) |
| 18 to 34 Years | 5 (11.6%) | 6 (13.0%) |
| 35 to 64 Years | 31 (15.4%) | 45 (22.2%) |
| 65 to 74 Years | 19 (28.8%) | 17 (31.5%) |
| 75 Years and over | 14 (48.3%) | 36 (63.2%) |
Disability Class by Sex by Age in Arapahoe
Disability Class: Hearing Difficulty
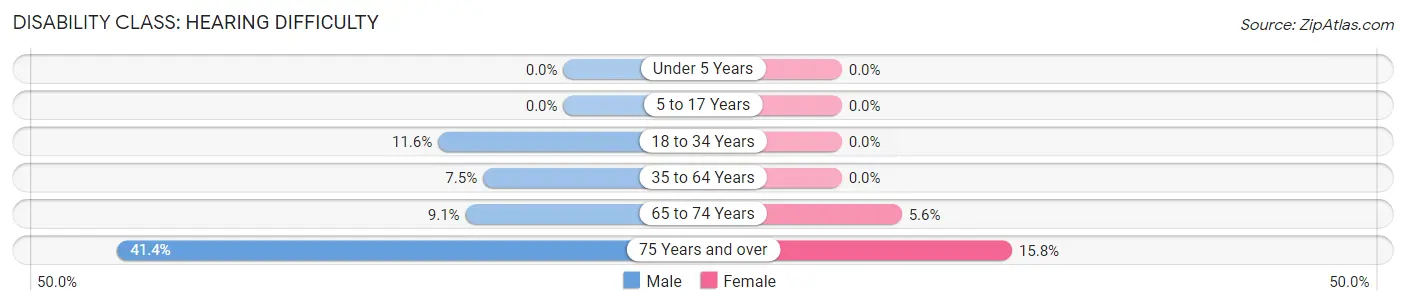
| Age Bracket | Male | Female |
| Under 5 Years | 0 (0.0%) | 0 (0.0%) |
| 5 to 17 Years | 0 (0.0%) | 0 (0.0%) |
| 18 to 34 Years | 5 (11.6%) | 0 (0.0%) |
| 35 to 64 Years | 15 (7.5%) | 0 (0.0%) |
| 65 to 74 Years | 6 (9.1%) | 3 (5.6%) |
| 75 Years and over | 12 (41.4%) | 9 (15.8%) |
Disability Class: Vision Difficulty
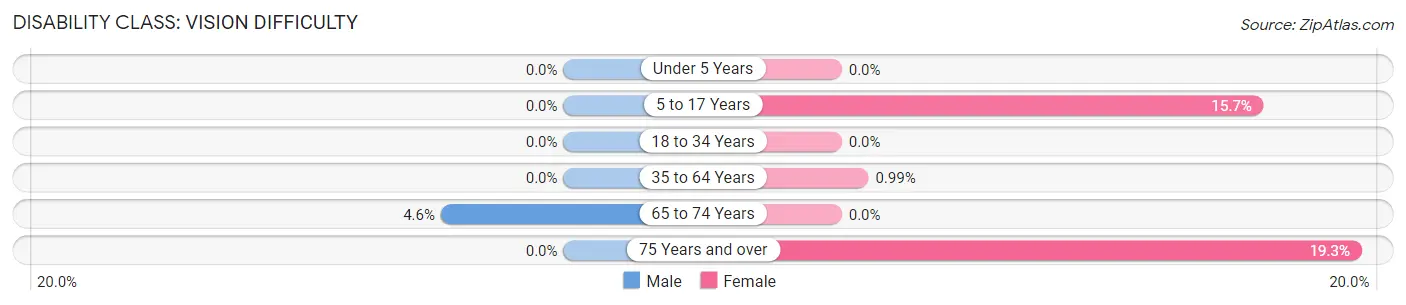
| Age Bracket | Male | Female |
| Under 5 Years | 0 (0.0%) | 0 (0.0%) |
| 5 to 17 Years | 0 (0.0%) | 13 (15.7%) |
| 18 to 34 Years | 0 (0.0%) | 0 (0.0%) |
| 35 to 64 Years | 0 (0.0%) | 2 (1.0%) |
| 65 to 74 Years | 3 (4.5%) | 0 (0.0%) |
| 75 Years and over | 0 (0.0%) | 11 (19.3%) |
Disability Class: Cognitive Difficulty
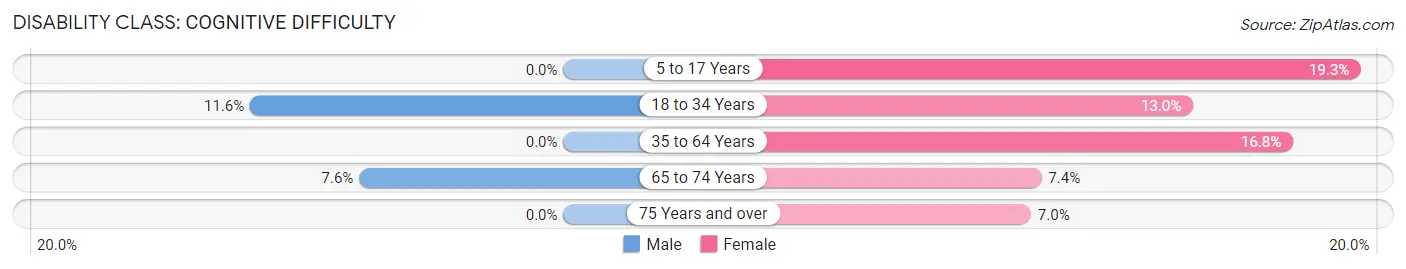
| Age Bracket | Male | Female |
| 5 to 17 Years | 0 (0.0%) | 16 (19.3%) |
| 18 to 34 Years | 5 (11.6%) | 6 (13.0%) |
| 35 to 64 Years | 0 (0.0%) | 34 (16.8%) |
| 65 to 74 Years | 5 (7.6%) | 4 (7.4%) |
| 75 Years and over | 0 (0.0%) | 4 (7.0%) |
Disability Class: Ambulatory Difficulty
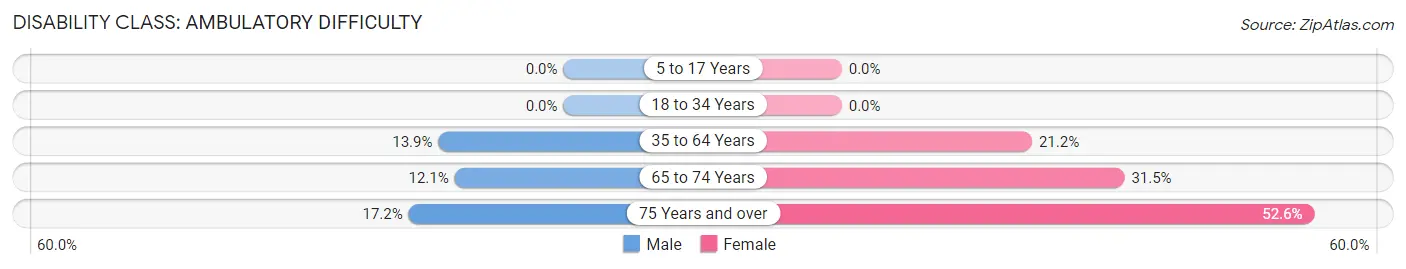
| Age Bracket | Male | Female |
| 5 to 17 Years | 0 (0.0%) | 0 (0.0%) |
| 18 to 34 Years | 0 (0.0%) | 0 (0.0%) |
| 35 to 64 Years | 28 (13.9%) | 43 (21.2%) |
| 65 to 74 Years | 8 (12.1%) | 17 (31.5%) |
| 75 Years and over | 5 (17.2%) | 30 (52.6%) |
Disability Class: Self-Care Difficulty
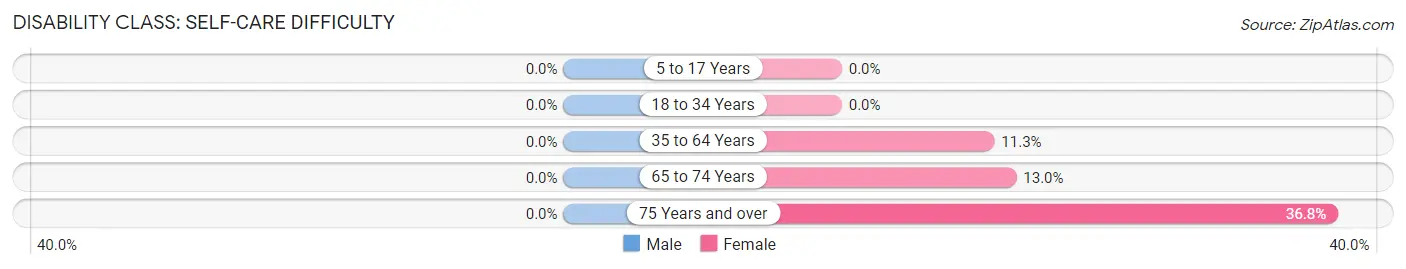
| Age Bracket | Male | Female |
| 5 to 17 Years | 0 (0.0%) | 0 (0.0%) |
| 18 to 34 Years | 0 (0.0%) | 0 (0.0%) |
| 35 to 64 Years | 0 (0.0%) | 23 (11.3%) |
| 65 to 74 Years | 0 (0.0%) | 7 (13.0%) |
| 75 Years and over | 0 (0.0%) | 21 (36.8%) |
Technology Access in Arapahoe
Computing Device Access in Arapahoe
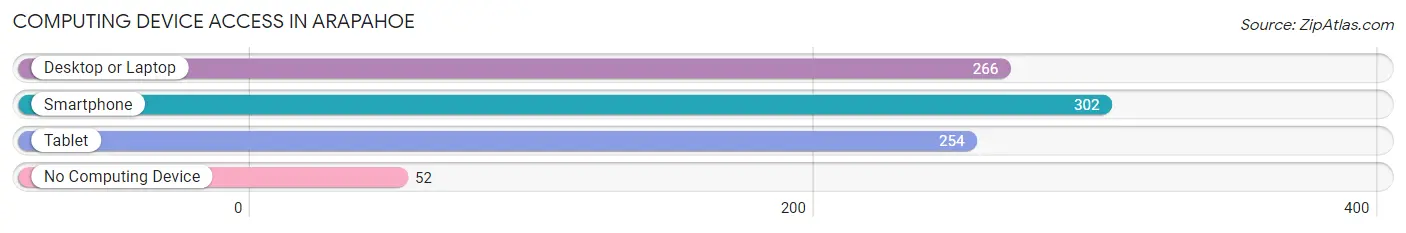
| Device Type | # Households | % Households |
| Desktop or Laptop | 266 | 70.9% |
| Smartphone | 302 | 80.5% |
| Tablet | 254 | 67.7% |
| No Computing Device | 52 | 13.9% |
| Total | 375 | 100.0% |
Internet Access in Arapahoe
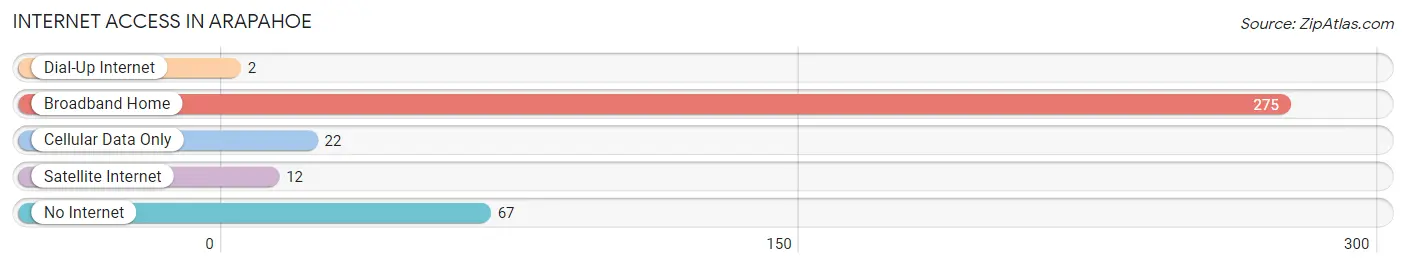
| Internet Type | # Households | % Households |
| Dial-Up Internet | 2 | 0.5% |
| Broadband Home | 275 | 73.3% |
| Cellular Data Only | 22 | 5.9% |
| Satellite Internet | 12 | 3.2% |
| No Internet | 67 | 17.9% |
| Total | 375 | 100.0% |
Arapahoe Summary
Arapahoe is a small town located in Furnas County, Nebraska. It is situated in the south-central part of the state, approximately 50 miles east of North Platte. The town was founded in 1887 and was named after the Arapaho Native American tribe. As of the 2010 census, the population of Arapahoe was 1,017.
History
The town of Arapahoe was founded in 1887 by the Union Pacific Railroad. The railroad was looking to expand its presence in the area and chose Arapahoe as the site for a new station. The town was named after the Arapaho Native American tribe, which had previously inhabited the area.
The town quickly grew and by 1890, it had a population of over 500. The town was incorporated in 1891 and the first mayor was elected in 1892.
In the early 1900s, Arapahoe was a thriving agricultural community. The town was home to several grain elevators, a flour mill, and a creamery. The town also had a number of businesses, including a bank, a hotel, a newspaper, and a movie theater.
Geography
Arapahoe is located in Furnas County, Nebraska. It is situated in the south-central part of the state, approximately 50 miles east of North Platte. The town is located on the banks of the Republican River, which flows through the area.
The town has a total area of 0.8 square miles, all of which is land. The elevation of the town is 2,845 feet above sea level.
Economy
The economy of Arapahoe is largely based on agriculture. The town is home to several grain elevators, a flour mill, and a creamery. The town also has a number of businesses, including a bank, a hotel, a newspaper, and a movie theater.
The town is also home to a number of manufacturing companies, including a furniture factory, a metal fabrication plant, and a plastics factory.
Demographics
As of the 2010 census, the population of Arapahoe was 1,017. The racial makeup of the town was 97.2% White, 0.3% African American, 0.3% Native American, 0.3% Asian, 0.2% from other races, and 1.7% from two or more races. Hispanic or Latino of any race were 1.2% of the population.
The median income for a household in the town was $37,500, and the median income for a family was $45,000. The per capita income for the town was $18,845. About 8.2% of families and 10.2% of the population were below the poverty line, including 11.2% of those under age 18 and 8.3% of those age 65 or over.
Common Questions
What is Per Capita Income in Arapahoe?
Per Capita income in Arapahoe is $32,306.
What is the Median Family Income in Arapahoe?
Median Family Income in Arapahoe is $81,667.
What is the Median Household income in Arapahoe?
Median Household Income in Arapahoe is $71,250.
What is Income or Wage Gap in Arapahoe?
Income or Wage Gap in Arapahoe is 30.8%.
Women in Arapahoe earn 69.2 cents for every dollar earned by a man.
What is Inequality or Gini Index in Arapahoe?
Inequality or Gini Index in Arapahoe is 0.39.
What is the Total Population of Arapahoe?
Total Population of Arapahoe is 976.
What is the Total Male Population of Arapahoe?
Total Male Population of Arapahoe is 487.
What is the Total Female Population of Arapahoe?
Total Female Population of Arapahoe is 489.
What is the Ratio of Males per 100 Females in Arapahoe?
There are 99.59 Males per 100 Females in Arapahoe.
What is the Ratio of Females per 100 Males in Arapahoe?
There are 100.41 Females per 100 Males in Arapahoe.
What is the Median Population Age in Arapahoe?
Median Population Age in Arapahoe is 53.0 Years.
What is the Average Family Size in Arapahoe
Average Family Size in Arapahoe is 2.9 People.
What is the Average Household Size in Arapahoe
Average Household Size in Arapahoe is 2.5 People.
How Large is the Labor Force in Arapahoe?
There are 484 People in the Labor Forcein in Arapahoe.
What is the Percentage of People in the Labor Force in Arapahoe?
61.7% of People are in the Labor Force in Arapahoe.