Zip Codes with the Highest Percentage of Population Employed in Food Preparation & Serving in Jamestown, ND
RELATED REPORTS & OPTIONS
Food Preparation & Serving
Jamestown
Compare Zip Codes
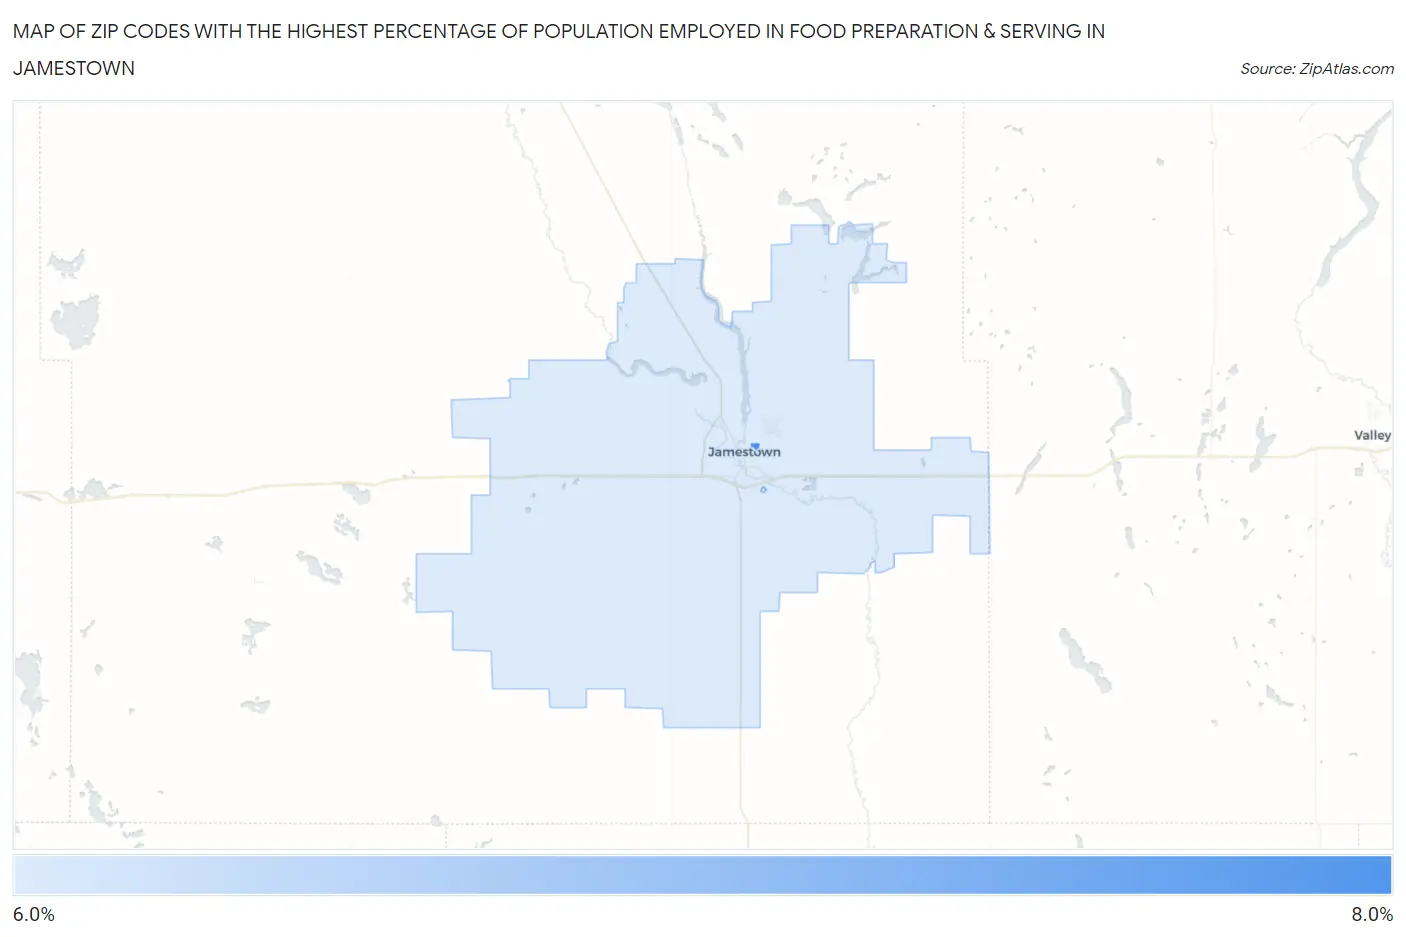
Map of Zip Codes with the Highest Percentage of Population Employed in Food Preparation & Serving in Jamestown
6.8%
7.6%
Zip Codes with the Highest Percentage of Population Employed in Food Preparation & Serving in Jamestown, ND
| Zip Code | % Employed | vs State | vs National | |
| 1. | 58405 | 7.6% | 5.2%(+2.41)#48 | 5.3%(+2.35)#5,315 |
| 2. | 58401 | 6.8% | 5.2%(+1.60)#56 | 5.3%(+1.55)#6,983 |
1
Common Questions
What are the Top Zip Codes with the Highest Percentage of Population Employed in Food Preparation & Serving in Jamestown, ND?
Top Zip Codes with the Highest Percentage of Population Employed in Food Preparation & Serving in Jamestown, ND are:
What zip code has the Highest Percentage of Population Employed in Food Preparation & Serving in Jamestown, ND?
58405 has the Highest Percentage of Population Employed in Food Preparation & Serving in Jamestown, ND with 7.6%.
What is the Percentage of Population Employed in Food Preparation & Serving in Jamestown, ND?
Percentage of Population Employed in Food Preparation & Serving in Jamestown is 7.6%.
What is the Percentage of Population Employed in Food Preparation & Serving in North Dakota?
Percentage of Population Employed in Food Preparation & Serving in North Dakota is 5.2%.
What is the Percentage of Population Employed in Food Preparation & Serving in the United States?
Percentage of Population Employed in Food Preparation & Serving in the United States is 5.3%.