Zip Codes with the Highest Percentage of Immigrants from Eastern Asia in Goldsboro, NC
RELATED REPORTS & OPTIONS
Eastern Asia
Goldsboro
Compare Zip Codes
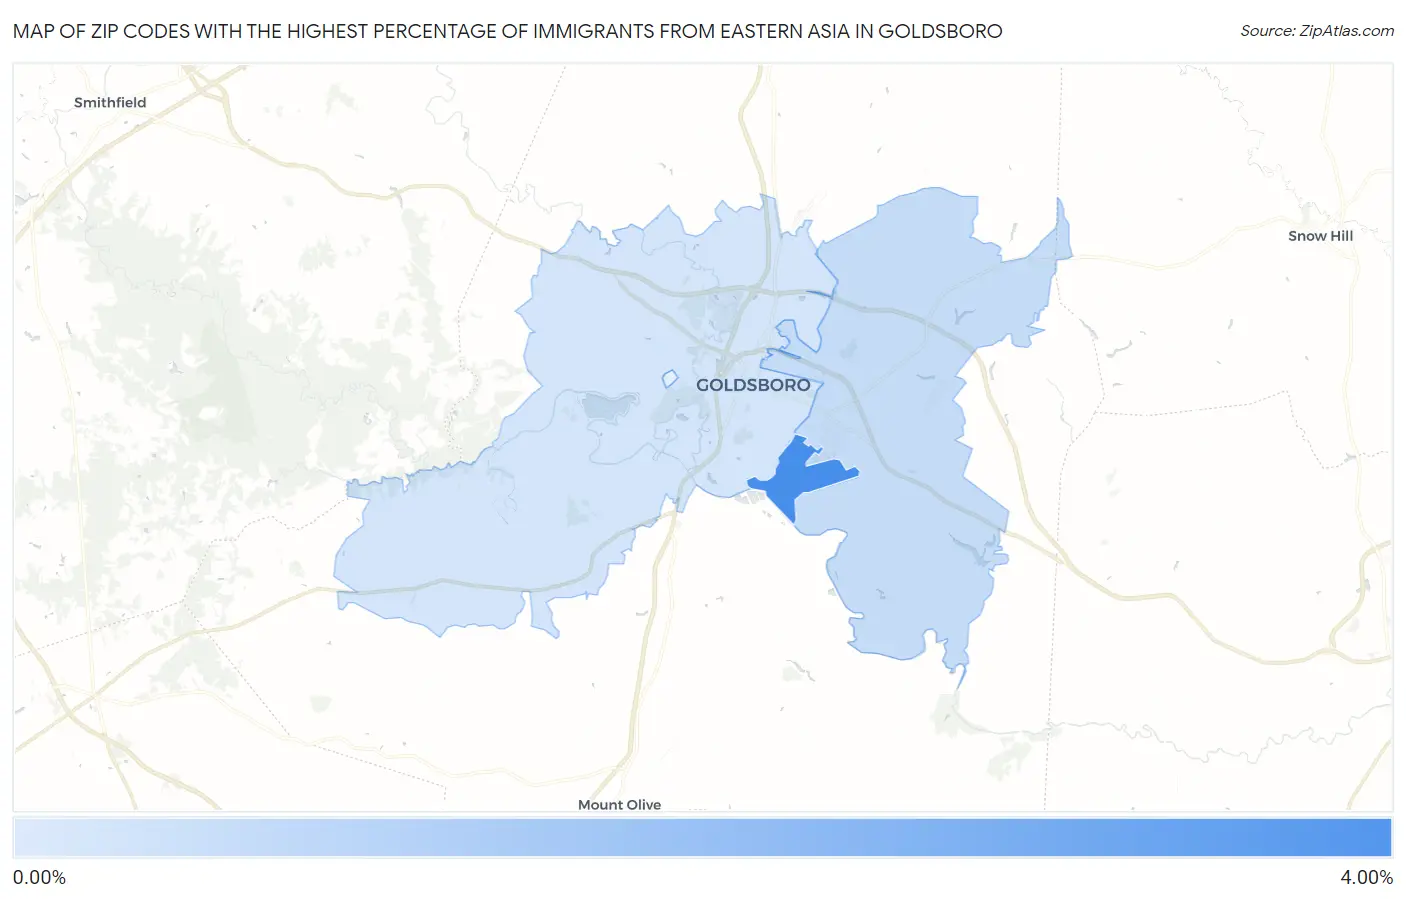
Map of Zip Codes with the Highest Percentage of Immigrants from Eastern Asia in Goldsboro
0.23%
3.89%
Zip Codes with the Highest Percentage of Immigrants from Eastern Asia in Goldsboro, NC
| Zip Code | Eastern Asia | vs State | vs National | |
| 1. | 27531 | 3.89% | 0.52%(+3.37)#10 | 1.28%(+2.62)#1,001 |
| 2. | 27534 | 0.56% | 0.52%(+0.038)#123 | 1.28%(-0.713)#6,095 |
| 3. | 27530 | 0.23% | 0.52%(-0.290)#219 | 1.28%(-1.04)#9,717 |
1
Common Questions
What are the Top 3 Zip Codes with the Highest Percentage of Immigrants from Eastern Asia in Goldsboro, NC?
Top 3 Zip Codes with the Highest Percentage of Immigrants from Eastern Asia in Goldsboro, NC are:
What zip code has the Highest Percentage of Immigrants from Eastern Asia in Goldsboro, NC?
27531 has the Highest Percentage of Immigrants from Eastern Asia in Goldsboro, NC with 3.89%.
What is the Percentage of Immigrants from Eastern Asia in Goldsboro, NC?
Percentage of Immigrants from Eastern Asia in Goldsboro is 0.59%.
What is the Percentage of Immigrants from Eastern Asia in North Carolina?
Percentage of Immigrants from Eastern Asia in North Carolina is 0.52%.
What is the Percentage of Immigrants from Eastern Asia in the United States?
Percentage of Immigrants from Eastern Asia in the United States is 1.28%.