Zip Codes with the Highest Percentage of Households Heated by Utility Gas in Moss Point, MS
RELATED REPORTS & OPTIONS
Utility Gas Heating
Moss Point
Compare Zip Codes
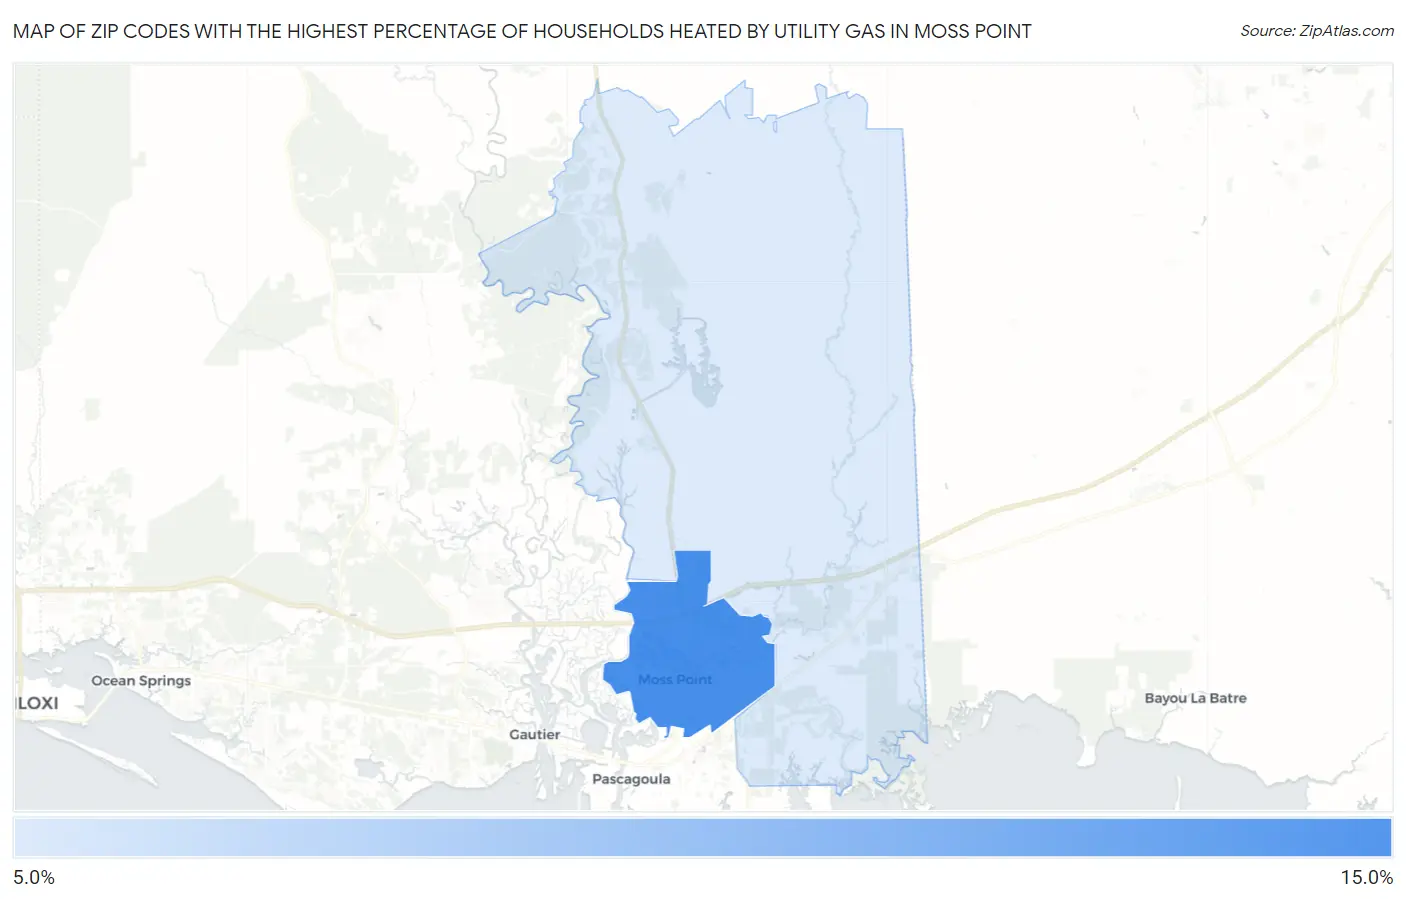
Map of Zip Codes with the Highest Percentage of Households Heated by Utility Gas in Moss Point
0.0%
15.0%
Zip Codes with the Highest Percentage of Households Heated by Utility Gas in Moss Point, MS
| Zip Code | Utility Gas Heating | vs State | vs National | |
| 1. | 39563 | 13.0% | 29.3%(-16.3)#252 | 47.1%(-34.1)#19,973 |
| 2. | 39562 | 7.0% | 29.3%(-22.3)#298 | 47.1%(-40.1)#21,937 |
1
Common Questions
What are the Top Zip Codes with the Highest Percentage of Households Heated by Utility Gas in Moss Point, MS?
Top Zip Codes with the Highest Percentage of Households Heated by Utility Gas in Moss Point, MS are:
What zip code has the Highest Percentage of Households Heated by Utility Gas in Moss Point, MS?
39563 has the Highest Percentage of Households Heated by Utility Gas in Moss Point, MS with 13.0%.
What is the Percentage of Households Heated by Utility Gas in Moss Point, MS?
Percentage of Households Heated by Utility Gas in Moss Point is 13.0%.
What is the Percentage of Households Heated by Utility Gas in Mississippi?
Percentage of Households Heated by Utility Gas in Mississippi is 29.3%.
What is the Percentage of Households Heated by Utility Gas in the United States?
Percentage of Households Heated by Utility Gas in the United States is 47.1%.