Zip Codes with the Highest Percentage of Renter-Occupied Units in Laurel, MS
RELATED REPORTS & OPTIONS
Highest Renter-Occupied
Laurel
Compare Zip Codes
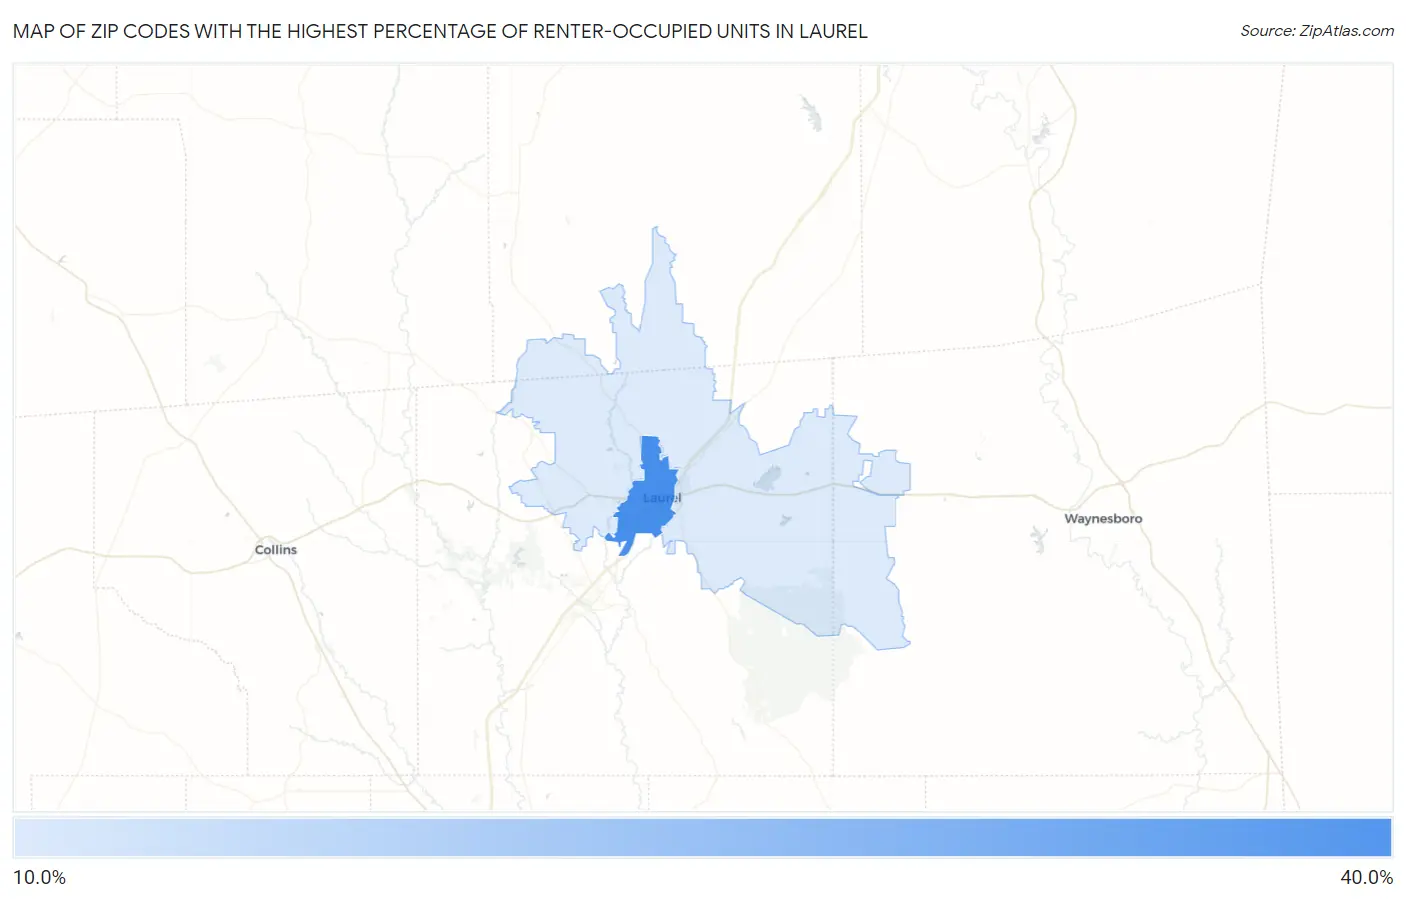
Map of Zip Codes with the Highest Percentage of Renter-Occupied Units in Laurel
0.0%
40.0%
Zip Codes with the Highest Percentage of Renter-Occupied Units in Laurel, MS
| Zip Code | % Renter-Occupied | vs State | vs National | |
| 1. | 39440 | 39.7% | 30.8%(+8.90)#81 | 35.2%(+4.55)#5,489 |
| 2. | 39443 | 19.4% | 30.8%(-11.5)#261 | 35.2%(-15.8)#18,804 |
1
Common Questions
What are the Top Zip Codes with the Highest Percentage of Renter-Occupied Units in Laurel, MS?
Top Zip Codes with the Highest Percentage of Renter-Occupied Units in Laurel, MS are:
What zip code has the Highest Percentage of Renter-Occupied Units in Laurel, MS?
39440 has the Highest Percentage of Renter-Occupied Units in Laurel, MS with 39.7%.
What is the Percentage of Renter-Occupied Units in Laurel, MS?
Percentage of Renter-Occupied Units in Laurel is 36.5%.
What is the Percentage of Renter-Occupied Units in Mississippi?
Percentage of Renter-Occupied Units in Mississippi is 30.8%.
What is the Percentage of Renter-Occupied Units in the United States?
Percentage of Renter-Occupied Units in the United States is 35.2%.