Zip Codes with the Highest Percentage of Population Employed in Agriculture, Fishing & Hunting in Jackson, MS
RELATED REPORTS & OPTIONS
Agriculture, Fishing & Hunting
Jackson
Compare Zip Codes
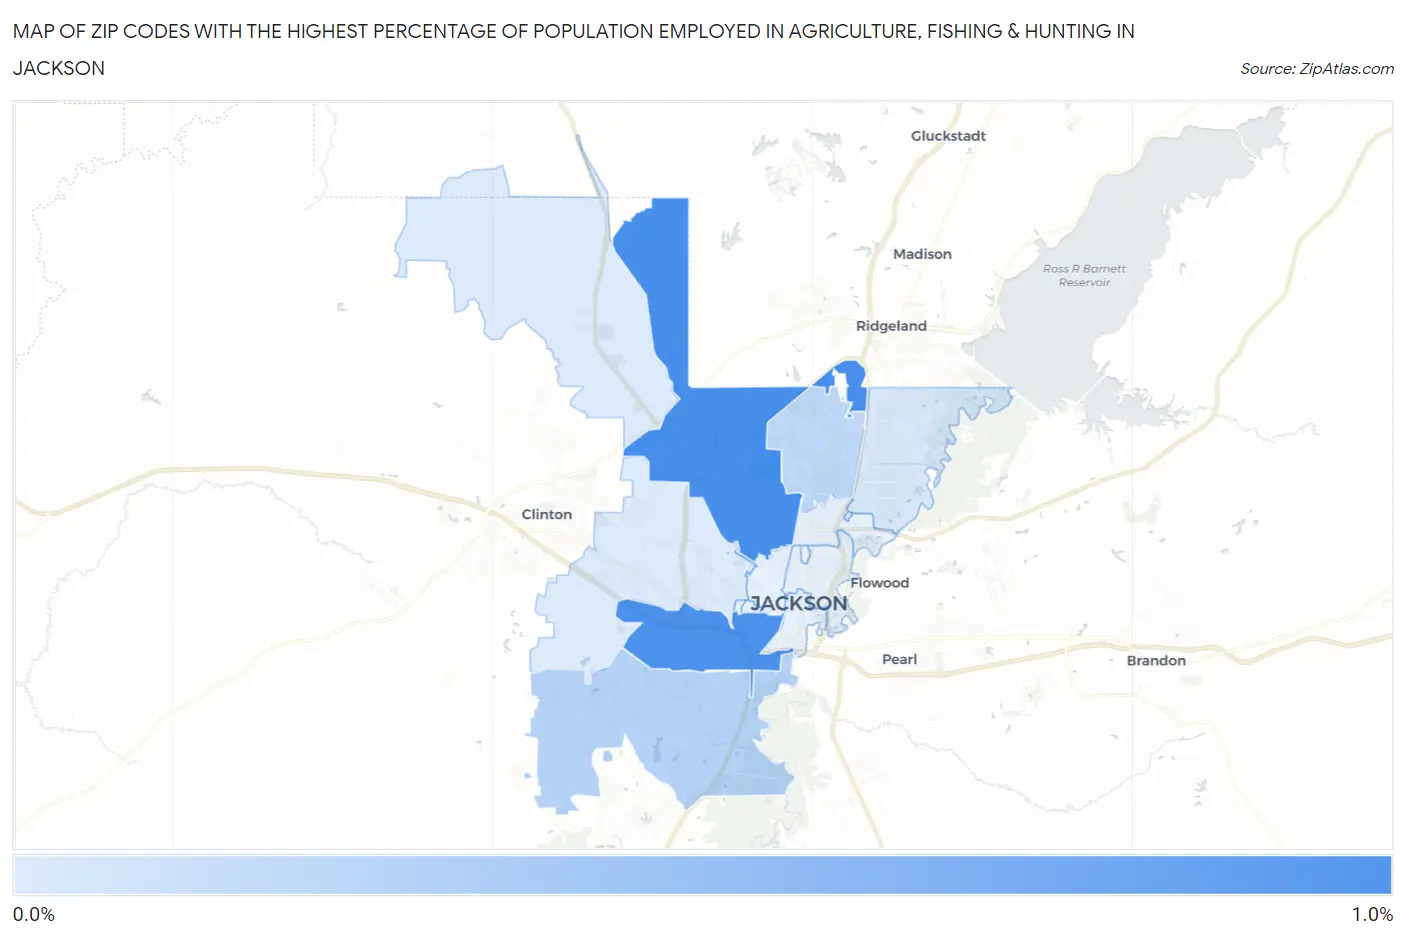
Map of Zip Codes with the Highest Percentage of Population Employed in Agriculture, Fishing & Hunting in Jackson
0.0%
1.0%
Zip Codes with the Highest Percentage of Population Employed in Agriculture, Fishing & Hunting in Jackson, MS
| Zip Code | % Employed | vs State | vs National | |
| 1. | 39213 | 0.93% | 1.6%(-0.619)#217 | 1.2%(-0.268)#16,552 |
| 2. | 39204 | 0.91% | 1.6%(-0.640)#218 | 1.2%(-0.289)#16,656 |
| 3. | 39212 | 0.32% | 1.6%(-1.23)#272 | 1.2%(-0.882)#20,975 |
| 4. | 39206 | 0.27% | 1.6%(-1.28)#280 | 1.2%(-0.930)#21,552 |
| 5. | 39211 | 0.13% | 1.6%(-1.42)#295 | 1.2%(-1.07)#23,274 |
| 6. | 39209 | 0.100% | 1.6%(-1.45)#299 | 1.2%(-1.10)#23,685 |
1
Common Questions
What are the Top 10 Zip Codes with the Highest Percentage of Population Employed in Agriculture, Fishing & Hunting in Jackson, MS?
Top 10 Zip Codes with the Highest Percentage of Population Employed in Agriculture, Fishing & Hunting in Jackson, MS are:
What zip code has the Highest Percentage of Population Employed in Agriculture, Fishing & Hunting in Jackson, MS?
39213 has the Highest Percentage of Population Employed in Agriculture, Fishing & Hunting in Jackson, MS with 0.93%.
What is the Percentage of Population Employed in Agriculture, Fishing & Hunting in Jackson, MS?
Percentage of Population Employed in Agriculture, Fishing & Hunting in Jackson is 0.33%.
What is the Percentage of Population Employed in Agriculture, Fishing & Hunting in Mississippi?
Percentage of Population Employed in Agriculture, Fishing & Hunting in Mississippi is 1.6%.
What is the Percentage of Population Employed in Agriculture, Fishing & Hunting in the United States?
Percentage of Population Employed in Agriculture, Fishing & Hunting in the United States is 1.2%.