Zip Codes with the Highest Percentage of Population Employed in Sales & Related in Saint Louis, MO
RELATED REPORTS & OPTIONS
Sales & Related
Saint Louis
Compare Zip Codes
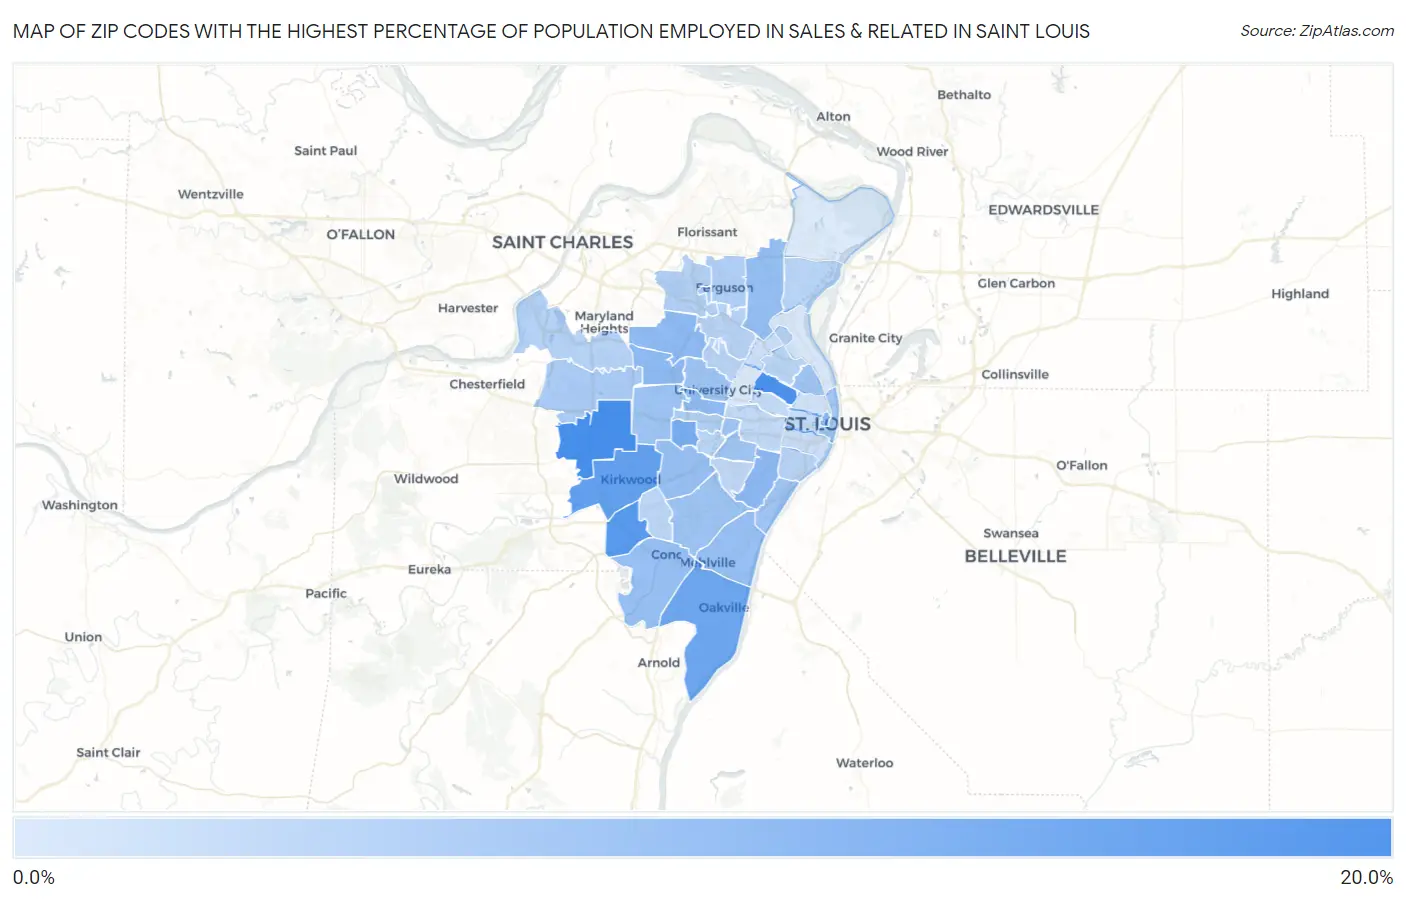
Map of Zip Codes with the Highest Percentage of Population Employed in Sales & Related in Saint Louis
5.2%
15.1%
Zip Codes with the Highest Percentage of Population Employed in Sales & Related in Saint Louis, MO
| Zip Code | % Employed | vs State | vs National | |
| 1. | 63131 | 15.1% | 9.7%(+5.39)#105 | 9.6%(+5.48)#2,696 |
| 2. | 63113 | 14.7% | 9.7%(+5.02)#118 | 9.6%(+5.11)#2,927 |
| 3. | 63127 | 13.9% | 9.7%(+4.22)#134 | 9.6%(+4.31)#3,561 |
| 4. | 63122 | 13.2% | 9.7%(+3.49)#155 | 9.6%(+3.57)#4,314 |
| 5. | 63129 | 12.4% | 9.7%(+2.68)#184 | 9.6%(+2.77)#5,385 |
| 6. | 63144 | 11.8% | 9.7%(+2.10)#206 | 9.6%(+2.19)#6,435 |
| 7. | 63101 | 10.6% | 9.7%(+0.869)#288 | 9.6%(+0.958)#9,409 |
| 8. | 63116 | 10.4% | 9.7%(+0.685)#303 | 9.6%(+0.773)#9,908 |
| 9. | 63132 | 10.3% | 9.7%(+0.657)#309 | 9.6%(+0.745)#9,997 |
| 10. | 63114 | 10.2% | 9.7%(+0.552)#316 | 9.6%(+0.640)#10,298 |
| 11. | 63105 | 10.1% | 9.7%(+0.414)#330 | 9.6%(+0.503)#10,719 |
| 12. | 63136 | 9.8% | 9.7%(+0.082)#351 | 9.6%(+0.171)#11,804 |
| 13. | 63125 | 9.6% | 9.7%(-0.039)#365 | 9.6%(+0.049)#12,233 |
| 14. | 63128 | 9.6% | 9.7%(-0.044)#366 | 9.6%(+0.044)#12,246 |
| 15. | 63119 | 9.6% | 9.7%(-0.081)#370 | 9.6%(+0.008)#12,384 |
| 16. | 63124 | 9.3% | 9.7%(-0.401)#395 | 9.6%(-0.313)#13,488 |
| 17. | 63130 | 9.2% | 9.7%(-0.446)#397 | 9.6%(-0.358)#13,652 |
| 18. | 63123 | 9.2% | 9.7%(-0.525)#403 | 9.6%(-0.437)#13,953 |
| 19. | 63139 | 9.1% | 9.7%(-0.567)#406 | 9.6%(-0.479)#14,092 |
| 20. | 63111 | 9.1% | 9.7%(-0.612)#413 | 9.6%(-0.524)#14,254 |
| 21. | 63107 | 9.0% | 9.7%(-0.676)#421 | 9.6%(-0.588)#14,481 |
| 22. | 63102 | 8.9% | 9.7%(-0.808)#441 | 9.6%(-0.719)#14,979 |
| 23. | 63140 | 8.6% | 9.7%(-1.11)#472 | 9.6%(-1.02)#16,089 |
| 24. | 63141 | 8.5% | 9.7%(-1.22)#482 | 9.6%(-1.13)#16,485 |
| 25. | 63135 | 8.0% | 9.7%(-1.67)#521 | 9.6%(-1.58)#17,987 |
| 26. | 63117 | 8.0% | 9.7%(-1.68)#522 | 9.6%(-1.59)#18,052 |
| 27. | 63134 | 7.9% | 9.7%(-1.81)#536 | 9.6%(-1.72)#18,449 |
| 28. | 63146 | 7.7% | 9.7%(-1.96)#548 | 9.6%(-1.87)#18,899 |
| 29. | 63118 | 7.5% | 9.7%(-2.14)#563 | 9.6%(-2.05)#19,505 |
| 30. | 63133 | 7.5% | 9.7%(-2.15)#566 | 9.6%(-2.07)#19,569 |
| 31. | 63121 | 7.5% | 9.7%(-2.16)#569 | 9.6%(-2.07)#19,588 |
| 32. | 63137 | 7.5% | 9.7%(-2.20)#573 | 9.6%(-2.11)#19,709 |
| 33. | 63115 | 7.4% | 9.7%(-2.26)#577 | 9.6%(-2.17)#19,904 |
| 34. | 63143 | 7.4% | 9.7%(-2.28)#579 | 9.6%(-2.19)#19,989 |
| 35. | 63126 | 7.3% | 9.7%(-2.42)#590 | 9.6%(-2.34)#20,438 |
| 36. | 63110 | 7.0% | 9.7%(-2.65)#604 | 9.6%(-2.56)#21,086 |
| 37. | 63109 | 7.0% | 9.7%(-2.71)#607 | 9.6%(-2.62)#21,239 |
| 38. | 63108 | 6.8% | 9.7%(-2.90)#628 | 9.6%(-2.81)#21,769 |
| 39. | 63103 | 6.7% | 9.7%(-2.94)#631 | 9.6%(-2.85)#21,868 |
| 40. | 63104 | 6.4% | 9.7%(-3.30)#661 | 9.6%(-3.21)#22,735 |
| 41. | 63120 | 6.3% | 9.7%(-3.35)#663 | 9.6%(-3.26)#22,866 |
| 42. | 63106 | 6.0% | 9.7%(-3.70)#698 | 9.6%(-3.62)#23,697 |
| 43. | 63147 | 5.5% | 9.7%(-4.19)#727 | 9.6%(-4.10)#24,681 |
| 44. | 63112 | 5.3% | 9.7%(-4.39)#743 | 9.6%(-4.31)#25,070 |
| 45. | 63138 | 5.2% | 9.7%(-4.44)#747 | 9.6%(-4.35)#25,151 |
1
Common Questions
What are the Top 10 Zip Codes with the Highest Percentage of Population Employed in Sales & Related in Saint Louis, MO?
Top 10 Zip Codes with the Highest Percentage of Population Employed in Sales & Related in Saint Louis, MO are:
What zip code has the Highest Percentage of Population Employed in Sales & Related in Saint Louis, MO?
63131 has the Highest Percentage of Population Employed in Sales & Related in Saint Louis, MO with 15.1%.
What is the Percentage of Population Employed in Sales & Related in Missouri?
Percentage of Population Employed in Sales & Related in Missouri is 9.7%.
What is the Percentage of Population Employed in Sales & Related in the United States?
Percentage of Population Employed in Sales & Related in the United States is 9.6%.