Zip Codes with the Highest Percentage of Population Employed in Agriculture, Fishing & Hunting in Burnsville, MN
RELATED REPORTS & OPTIONS
Agriculture, Fishing & Hunting
Burnsville
Compare Zip Codes
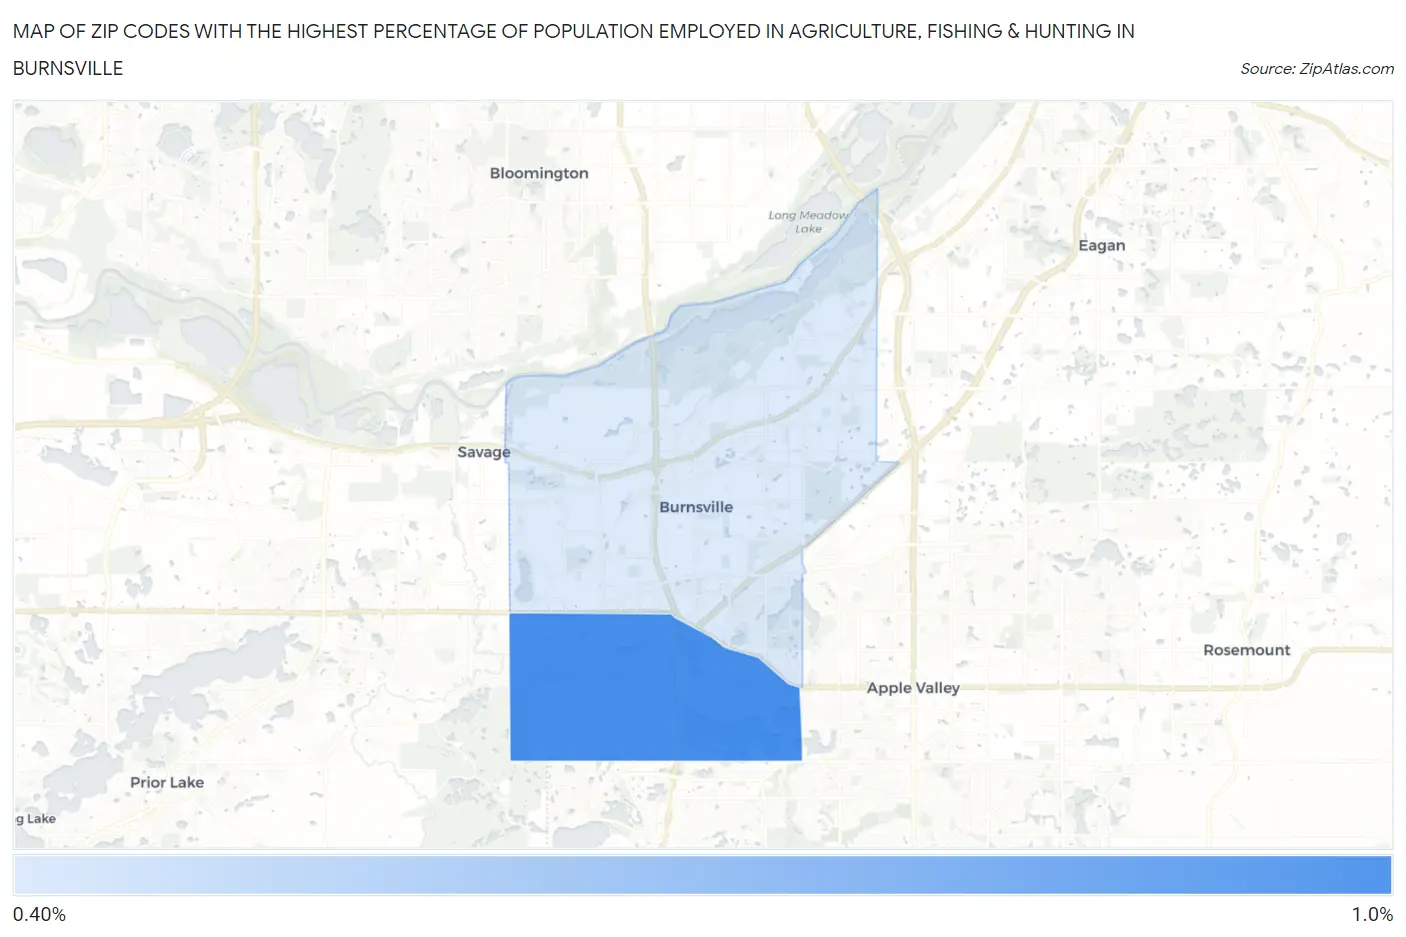
Map of Zip Codes with the Highest Percentage of Population Employed in Agriculture, Fishing & Hunting in Burnsville
0.0%
1.0%
Zip Codes with the Highest Percentage of Population Employed in Agriculture, Fishing & Hunting in Burnsville, MN
| Zip Code | % Employed | vs State | vs National | |
| 1. | 55306 | 0.95% | 1.9%(-0.941)#665 | 1.2%(-0.249)#16,448 |
| 2. | 55337 | 0.49% | 1.9%(-1.40)#740 | 1.2%(-0.705)#19,337 |
1
Common Questions
What are the Top Zip Codes with the Highest Percentage of Population Employed in Agriculture, Fishing & Hunting in Burnsville, MN?
Top Zip Codes with the Highest Percentage of Population Employed in Agriculture, Fishing & Hunting in Burnsville, MN are:
What zip code has the Highest Percentage of Population Employed in Agriculture, Fishing & Hunting in Burnsville, MN?
55306 has the Highest Percentage of Population Employed in Agriculture, Fishing & Hunting in Burnsville, MN with 0.95%.
What is the Percentage of Population Employed in Agriculture, Fishing & Hunting in Burnsville, MN?
Percentage of Population Employed in Agriculture, Fishing & Hunting in Burnsville is 0.61%.
What is the Percentage of Population Employed in Agriculture, Fishing & Hunting in Minnesota?
Percentage of Population Employed in Agriculture, Fishing & Hunting in Minnesota is 1.9%.
What is the Percentage of Population Employed in Agriculture, Fishing & Hunting in the United States?
Percentage of Population Employed in Agriculture, Fishing & Hunting in the United States is 1.2%.