Zip Codes with the Highest Percentage of Renter-Occupied Units in Washington, MI
RELATED REPORTS & OPTIONS
Highest Renter-Occupied
Washington
Compare Zip Codes
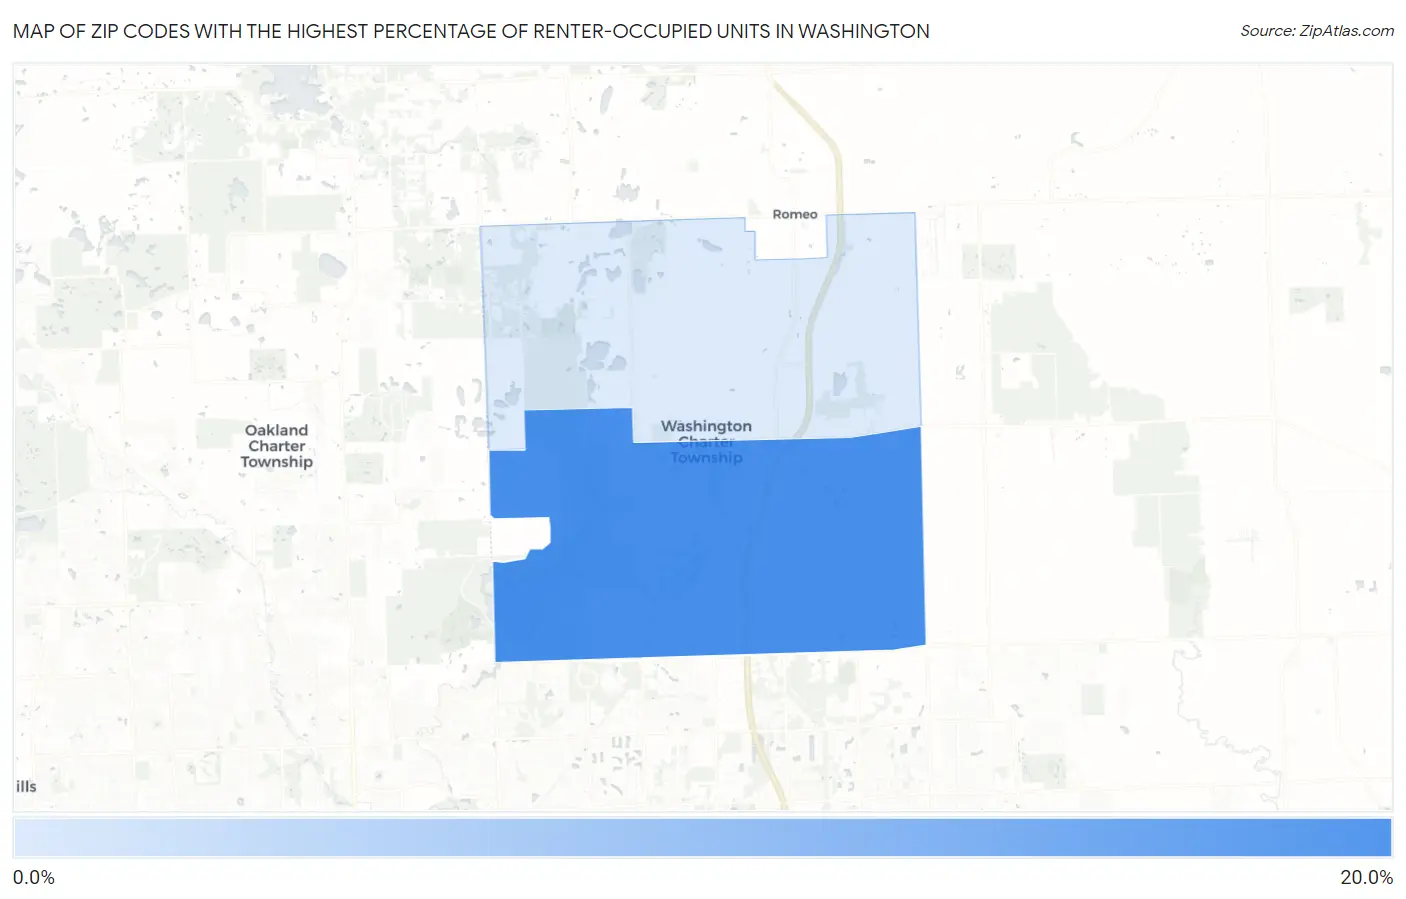
Map of Zip Codes with the Highest Percentage of Renter-Occupied Units in Washington
0.0%
20.0%
Zip Codes with the Highest Percentage of Renter-Occupied Units in Washington, MI
| Zip Code | % Renter-Occupied | vs State | vs National | |
| 1. | 48094 | 18.8% | 27.5%(-8.75)#383 | 35.2%(-16.4)#19,408 |
| 2. | 48095 | 4.9% | 27.5%(-22.6)#895 | 35.2%(-30.3)#30,106 |
1
Common Questions
What are the Top Zip Codes with the Highest Percentage of Renter-Occupied Units in Washington, MI?
Top Zip Codes with the Highest Percentage of Renter-Occupied Units in Washington, MI are:
What zip code has the Highest Percentage of Renter-Occupied Units in Washington, MI?
48094 has the Highest Percentage of Renter-Occupied Units in Washington, MI with 18.8%.
What is the Percentage of Renter-Occupied Units in Michigan?
Percentage of Renter-Occupied Units in Michigan is 27.5%.
What is the Percentage of Renter-Occupied Units in the United States?
Percentage of Renter-Occupied Units in the United States is 35.2%.