Zip Codes with the Highest Percentage of Population Employed in Business & Financial in Glen Burnie, MD
RELATED REPORTS & OPTIONS
Business & Financial
Glen Burnie
Compare Zip Codes
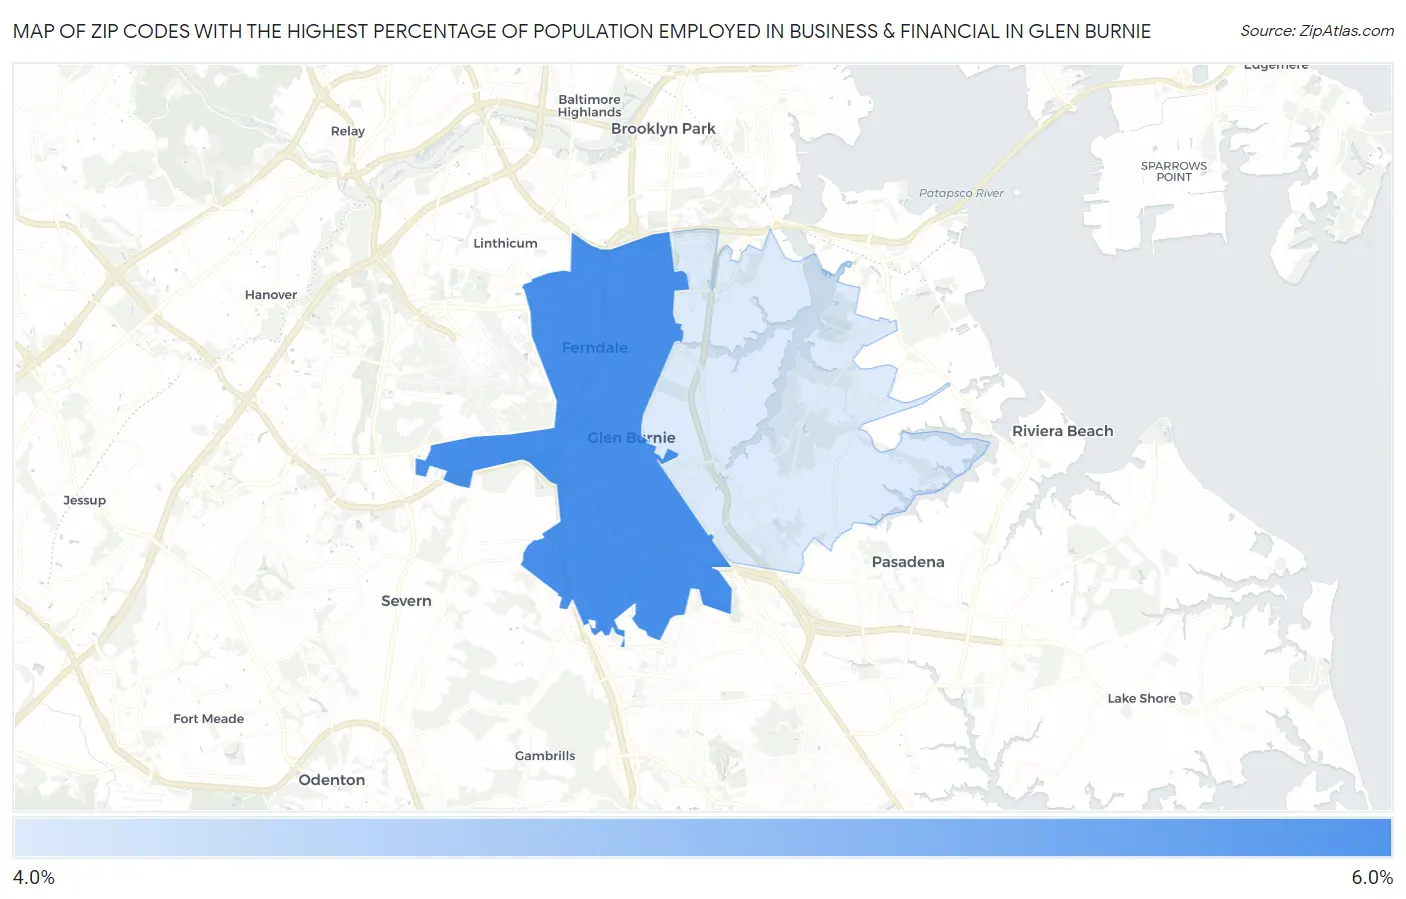
Map of Zip Codes with the Highest Percentage of Population Employed in Business & Financial in Glen Burnie
5.0%
5.5%
Zip Codes with the Highest Percentage of Population Employed in Business & Financial in Glen Burnie, MD
| Zip Code | % Employed | vs State | vs National | |
| 1. | 21061 | 5.5% | 7.3%(-1.81)#251 | 5.8%(-0.264)#9,041 |
| 2. | 21060 | 5.0% | 7.3%(-2.32)#273 | 5.8%(-0.769)#10,478 |
1
Common Questions
What are the Top Zip Codes with the Highest Percentage of Population Employed in Business & Financial in Glen Burnie, MD?
Top Zip Codes with the Highest Percentage of Population Employed in Business & Financial in Glen Burnie, MD are:
What zip code has the Highest Percentage of Population Employed in Business & Financial in Glen Burnie, MD?
21061 has the Highest Percentage of Population Employed in Business & Financial in Glen Burnie, MD with 5.5%.
What is the Percentage of Population Employed in Business & Financial in Glen Burnie, MD?
Percentage of Population Employed in Business & Financial in Glen Burnie is 5.4%.
What is the Percentage of Population Employed in Business & Financial in Maryland?
Percentage of Population Employed in Business & Financial in Maryland is 7.3%.
What is the Percentage of Population Employed in Business & Financial in the United States?
Percentage of Population Employed in Business & Financial in the United States is 5.8%.