Zip Codes with the Highest Percentage of Population Employed in Agriculture, Fishing & Hunting in Germantown, MD

RELATED REPORTS & OPTIONS

Agriculture, Fishing & Hunting
Population
Families and Households
Female Fertility
Female Fertility (Unmarried)
Race (Community Size)
Race (Percentage)
Ancestry (Community Size)
AfricanAlbanianAmericanArabArgentineanArmenianAustrianBhutaneseBolivianBrazilianBritishBritish West IndianBurmeseCentral AmericanCentral American IndianCherokeeChileanColombianCubanCzechDanishDominicanDutchEastern EuropeanEcuadorianEgyptianEnglishEthiopianEuropeanFilipinoFrenchFrench CanadianGermanGhanaianGreekGuatemalanGuyaneseHaitianHonduranHungarianIndian (Asian)IndonesianIranianIraqiIrishIsraeliItalianJamaicanJapaneseKenyanKoreanLebaneseLithuanianMexicanNicaraguanNigerianNorthern EuropeanNorwegianPakistaniPanamanianPennsylvania GermanPeruvianPolishPortuguesePuerto RicanRomanianRussianSalvadoranScotch-IrishScottishSerbianSierra LeoneanSlovakSouth AmericanSouth American IndianSpaniardSri LankanSubsaharan AfricanSwedishSwissSyrianThaiTrinidadian and TobagonianTurkishUkrainianWelshWest Indian
Ancestry (Percentage)
AfricanAlbanianAmericanArabArgentineanArmenianAustrianBhutaneseBolivianBrazilianBritishBritish West IndianBurmeseCentral AmericanCentral American IndianCherokeeChileanColombianCubanCzechDanishDominicanDutchEastern EuropeanEcuadorianEgyptianEnglishEthiopianEuropeanFilipinoFrenchFrench CanadianGermanGhanaianGreekGuatemalanGuyaneseHaitianHonduranHungarianIndian (Asian)IndonesianIranianIraqiIrishIsraeliItalianJamaicanJapaneseKenyanKoreanLebaneseLithuanianMexicanNicaraguanNigerianNorthern EuropeanNorwegianPakistaniPanamanianPennsylvania GermanPeruvianPolishPortuguesePuerto RicanRomanianRussianSalvadoranScotch-IrishScottishSerbianSierra LeoneanSlovakSouth AmericanSouth American IndianSpaniardSri LankanSubsaharan AfricanSwedishSwissSyrianThaiTrinidadian and TobagonianTurkishUkrainianWelshWest Indian
Immigrant Origin (Total)
Immigrant Origin (Percentage)
Income
Income (Families)
Income (Households)
Poverty
Poverty (Families)
Unemployment
Employment Occupations
Employment Industries
Employer Class
Commute Time
Commute Means
School Enrollment
Education by Degree Field
Occupancy
Finances
Physical Characteristics
Germantown
Compare Zip Codes
Comparison Subject

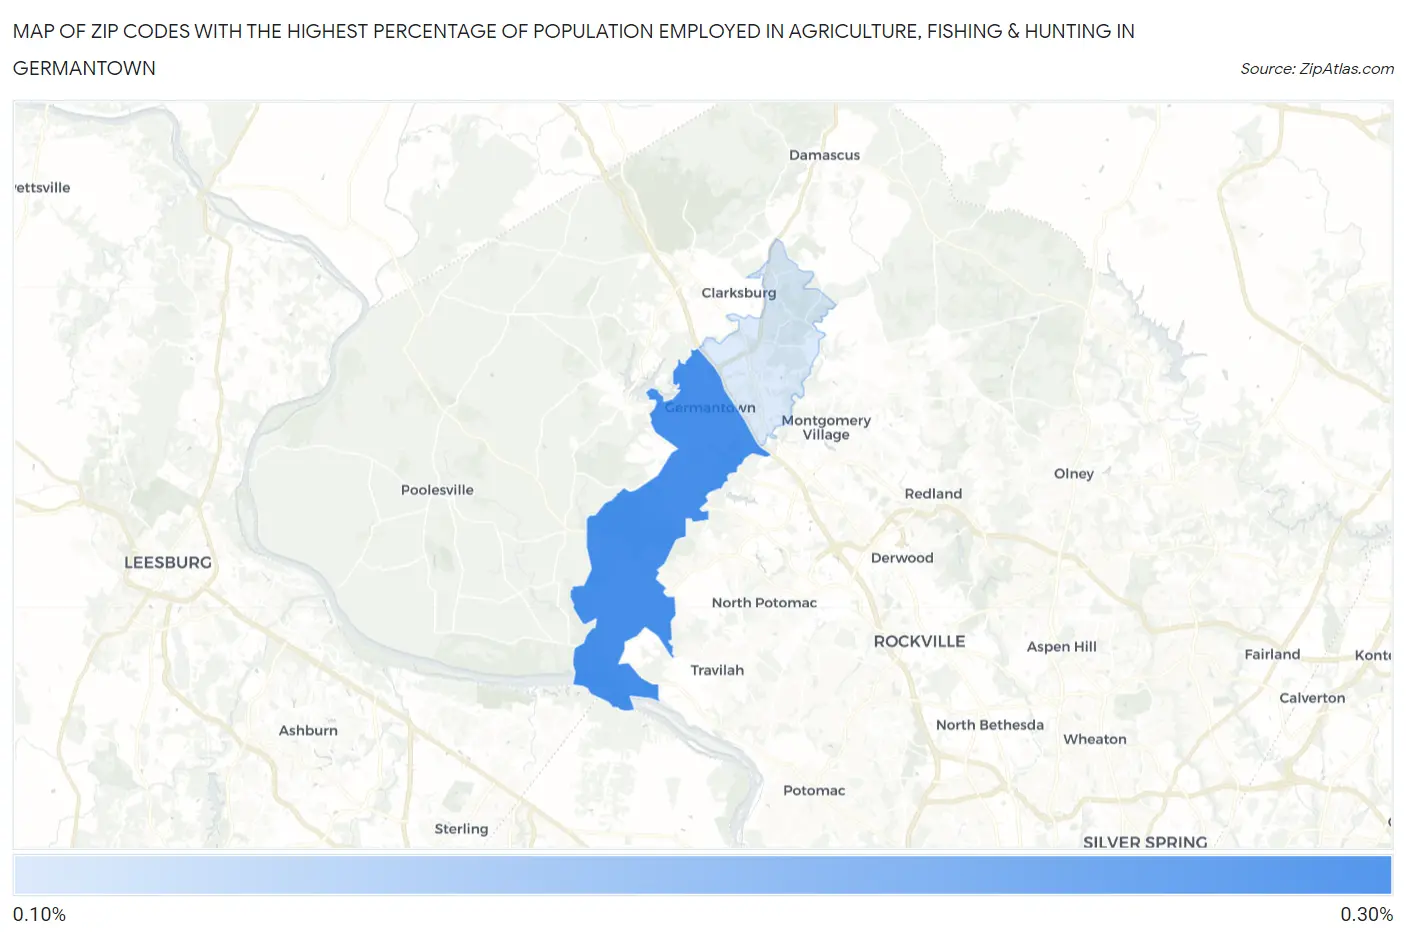
Map of Zip Codes with the Highest Percentage of Population Employed in Agriculture, Fishing & Hunting in Germantown

0.0%
0.30%
Zip Codes with the Highest Percentage of Population Employed in Agriculture, Fishing & Hunting in Germantown Map

Zip Codes with the Highest Percentage of Population Employed in Agriculture, Fishing & Hunting in Germantown, MD

Zip Code % Employed vs State vs National
1.208740.28%0.50%(-0.225)#2171.2%(-0.920)#21,425
2.208760.12%0.50%(-0.389)#2671.2%(-1.08)#23,471

Common Questions

What are the Top Zip Codes with the Highest Percentage of Population Employed in Agriculture, Fishing & Hunting in Germantown, MD?
Top Zip Codes with the Highest Percentage of Population Employed in Agriculture, Fishing & Hunting in Germantown, MD are:
#1
0.28%
#2
0.12%
What zip code has the Highest Percentage of Population Employed in Agriculture, Fishing & Hunting in Germantown, MD?
20874 has the Highest Percentage of Population Employed in Agriculture, Fishing & Hunting in Germantown, MD with 0.28%.
What is the Percentage of Population Employed in Agriculture, Fishing & Hunting in Germantown, MD?
Percentage of Population Employed in Agriculture, Fishing & Hunting in Germantown is 0.21%.
What is the Percentage of Population Employed in Agriculture, Fishing & Hunting in Maryland?
Percentage of Population Employed in Agriculture, Fishing & Hunting in Maryland is 0.50%.
What is the Percentage of Population Employed in Agriculture, Fishing & Hunting in the United States?
Percentage of Population Employed in Agriculture, Fishing & Hunting in the United States is 1.2%.