Youngsville, LA Map & Demographics
Youngsville Map
Youngsville Overview
$40,000
PER CAPITA INCOME
$118,410
AVG FAMILY INCOME
$111,619
AVG HOUSEHOLD INCOME
35.9%
WAGE / INCOME GAP [ % ]
64.1¢/ $1
WAGE / INCOME GAP [ $ ]
0.35
INEQUALITY / GINI INDEX
15,990
TOTAL POPULATION
7,080
MALE POPULATION
8,910
FEMALE POPULATION
79.46
MALES / 100 FEMALES
125.85
FEMALES / 100 MALES
33.8
MEDIAN AGE
3.4
AVG FAMILY SIZE
3.0
AVG HOUSEHOLD SIZE
8,026
LABOR FORCE [ PEOPLE ]
74.0%
PERCENT IN LABOR FORCE
2.4%
UNEMPLOYMENT RATE
Youngsville Zip Codes
Youngsville Area Codes
Income in Youngsville
Income Overview in Youngsville
Per Capita Income in Youngsville is $40,000, while median incomes of families and households are $118,410 and $111,619 respectively.
| Characteristic | Number | Measure |
| Per Capita Income | 15,990 | $40,000 |
| Median Family Income | 4,317 | $118,410 |
| Mean Family Income | 4,317 | $130,830 |
| Median Household Income | 5,241 | $111,619 |
| Mean Household Income | 5,241 | $118,028 |
| Income Deficit | 4,317 | $0 |
| Wage / Income Gap (%) | 15,990 | 35.91% |
| Wage / Income Gap ($) | 15,990 | 64.09¢ per $1 |
| Gini / Inequality Index | 15,990 | 0.35 |
Earnings by Sex in Youngsville
Average Earnings in Youngsville are $55,912, $78,938 for men and $50,595 for women, a difference of 35.9%.
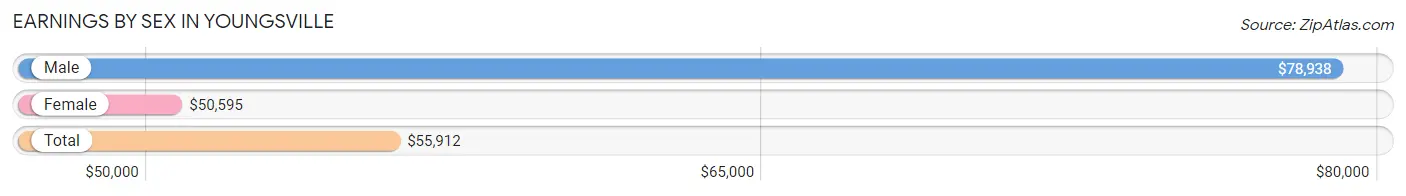
| Sex | Number | Average Earnings |
| Male | 3,821 (47.2%) | $78,938 |
| Female | 4,282 (52.8%) | $50,595 |
| Total | 8,103 (100.0%) | $55,912 |
Earnings by Sex by Income Bracket in Youngsville
The most common earnings brackets in Youngsville are $100,000+ for men (1,491 | 39.0%) and $55,000 to $64,999 for women (727 | 17.0%).
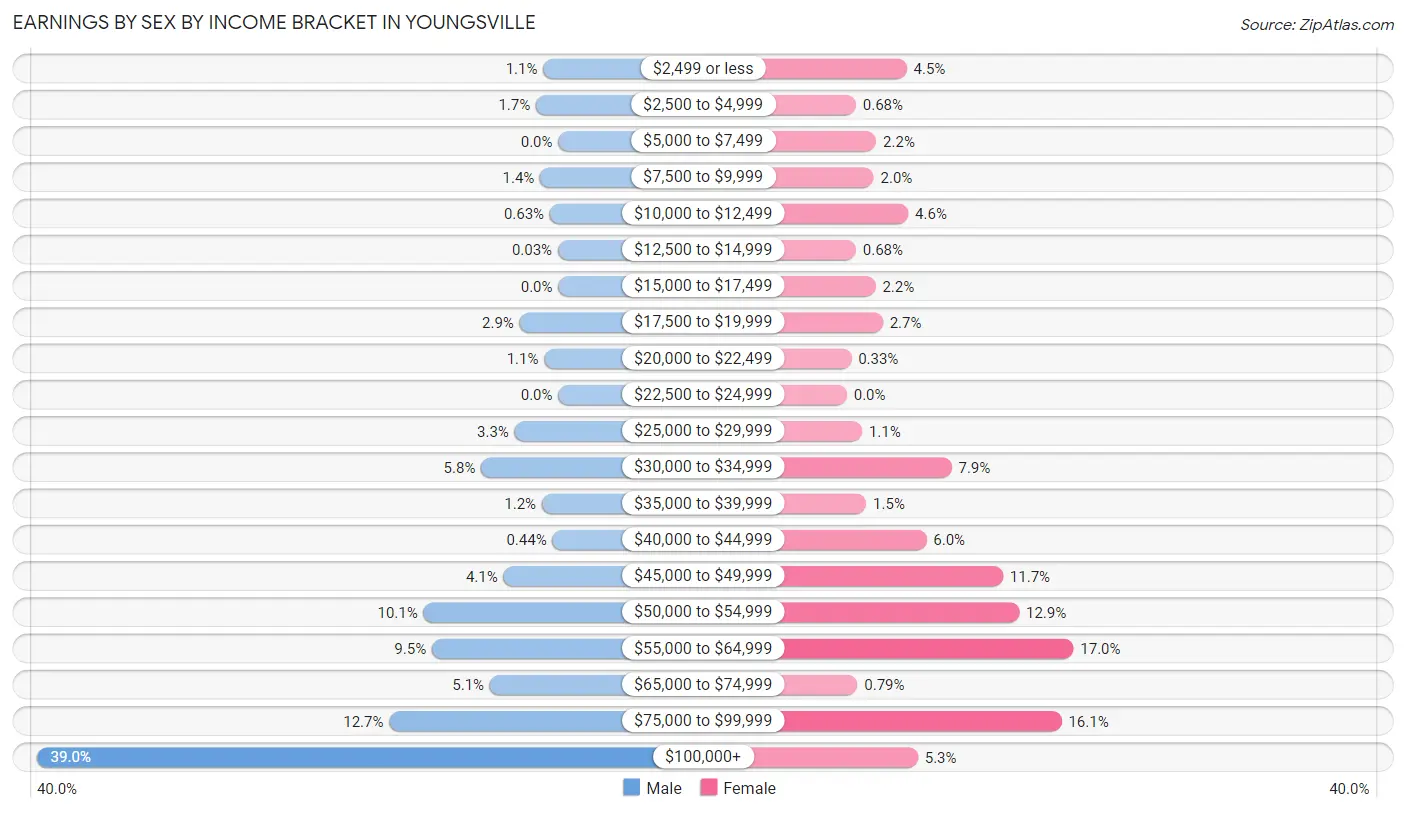
| Income | Male | Female |
| $2,499 or less | 43 (1.1%) | 192 (4.5%) |
| $2,500 to $4,999 | 64 (1.7%) | 29 (0.7%) |
| $5,000 to $7,499 | 0 (0.0%) | 94 (2.2%) |
| $7,500 to $9,999 | 52 (1.4%) | 86 (2.0%) |
| $10,000 to $12,499 | 24 (0.6%) | 197 (4.6%) |
| $12,500 to $14,999 | 1 (0.0%) | 29 (0.7%) |
| $15,000 to $17,499 | 0 (0.0%) | 92 (2.1%) |
| $17,500 to $19,999 | 111 (2.9%) | 115 (2.7%) |
| $20,000 to $22,499 | 40 (1.1%) | 14 (0.3%) |
| $22,500 to $24,999 | 0 (0.0%) | 0 (0.0%) |
| $25,000 to $29,999 | 125 (3.3%) | 49 (1.1%) |
| $30,000 to $34,999 | 221 (5.8%) | 336 (7.9%) |
| $35,000 to $39,999 | 47 (1.2%) | 62 (1.5%) |
| $40,000 to $44,999 | 17 (0.4%) | 255 (6.0%) |
| $45,000 to $49,999 | 157 (4.1%) | 501 (11.7%) |
| $50,000 to $54,999 | 386 (10.1%) | 553 (12.9%) |
| $55,000 to $64,999 | 362 (9.5%) | 727 (17.0%) |
| $65,000 to $74,999 | 196 (5.1%) | 34 (0.8%) |
| $75,000 to $99,999 | 484 (12.7%) | 689 (16.1%) |
| $100,000+ | 1,491 (39.0%) | 228 (5.3%) |
| Total | 3,821 (100.0%) | 4,282 (100.0%) |
Earnings by Sex by Educational Attainment in Youngsville
Average earnings in Youngsville are $86,458 for men and $51,660 for women, a difference of 40.3%. Men with an educational attainment of college or associate's degree enjoy the highest average annual earnings of $142,518, while those with high school diploma education earn the least with $52,807. Women with an educational attainment of bachelor's degree earn the most with the average annual earnings of $58,900, while those with high school diploma education have the smallest earnings of $19,418.
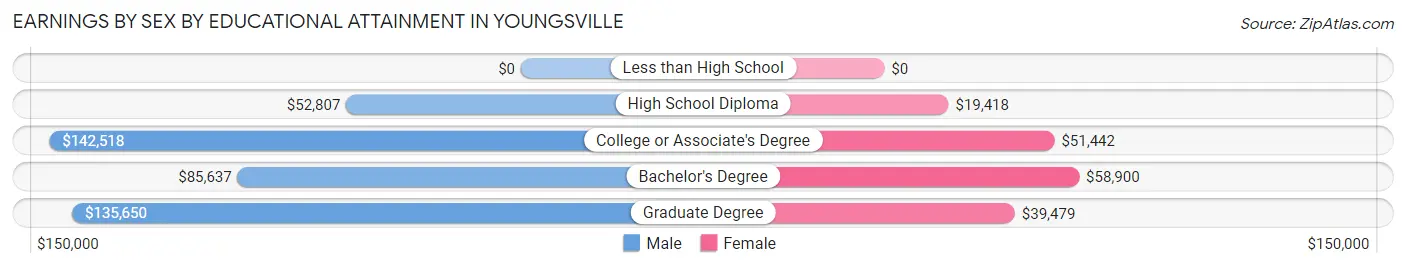
| Educational Attainment | Male Income | Female Income |
| Less than High School | - | - |
| High School Diploma | $52,807 | $19,418 |
| College or Associate's Degree | $142,518 | $51,442 |
| Bachelor's Degree | $85,637 | $58,900 |
| Graduate Degree | $135,650 | $39,479 |
| Total | $86,458 | $51,660 |
Family Income in Youngsville
Family Income Brackets in Youngsville
According to the Youngsville family income data, there are 1,511 families falling into the $100,000 to $149,999 income range, which is the most common income bracket and makes up 35.0% of all families.
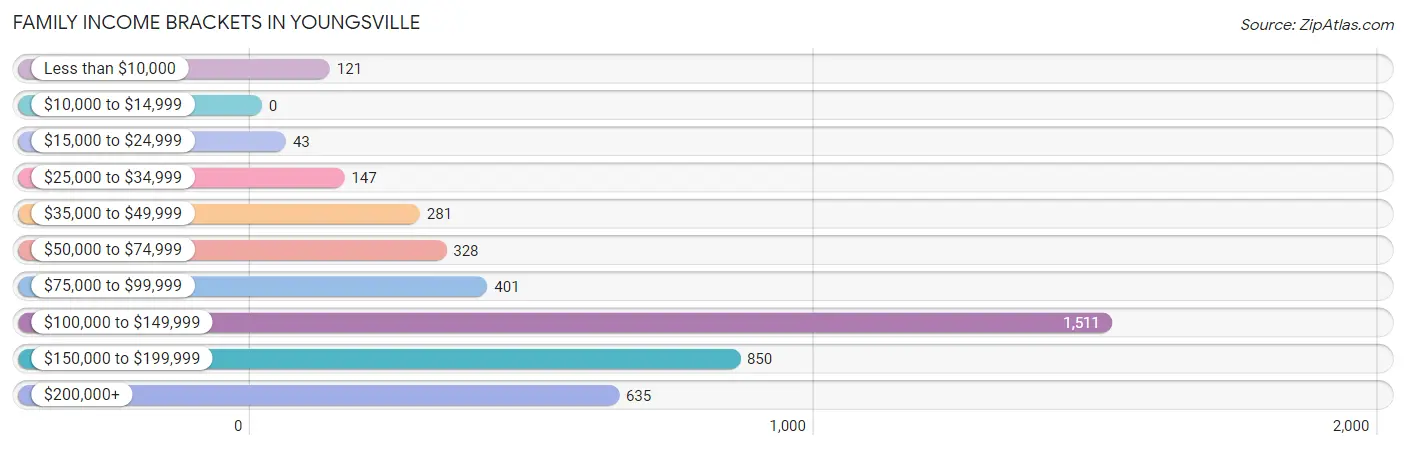
| Income Bracket | # Families | % Families |
| Less than $10,000 | 121 | 2.8% |
| $10,000 to $14,999 | 0 | 0.0% |
| $15,000 to $24,999 | 43 | 1.0% |
| $25,000 to $34,999 | 147 | 3.4% |
| $35,000 to $49,999 | 281 | 6.5% |
| $50,000 to $74,999 | 328 | 7.6% |
| $75,000 to $99,999 | 401 | 9.3% |
| $100,000 to $149,999 | 1,511 | 35.0% |
| $150,000 to $199,999 | 850 | 19.7% |
| $200,000+ | 635 | 14.7% |
Family Income by Famaliy Size in Youngsville
6-person families (138 | 3.2%) account for the highest median family income in Youngsville with $181,993 per family, while 2-person families (1,530 | 35.4%) have the highest median income of $60,625 per family member.
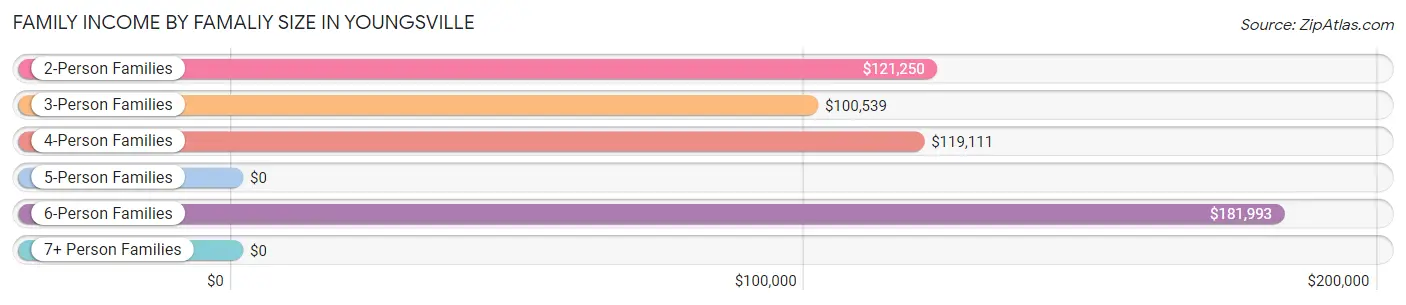
| Income Bracket | # Families | Median Income |
| 2-Person Families | 1,530 (35.4%) | $121,250 |
| 3-Person Families | 692 (16.0%) | $100,539 |
| 4-Person Families | 1,512 (35.0%) | $119,111 |
| 5-Person Families | 407 (9.4%) | $0 |
| 6-Person Families | 138 (3.2%) | $181,993 |
| 7+ Person Families | 38 (0.9%) | $0 |
| Total | 4,317 (100.0%) | $118,410 |
Family Income by Number of Earners in Youngsville
The median family income in Youngsville is $118,410, with families comprising 3+ earners (414) having the highest median family income of $160,804, while families with no earners (561) have the lowest median family income of $46,094, accounting for 9.6% and 13.0% of families, respectively.
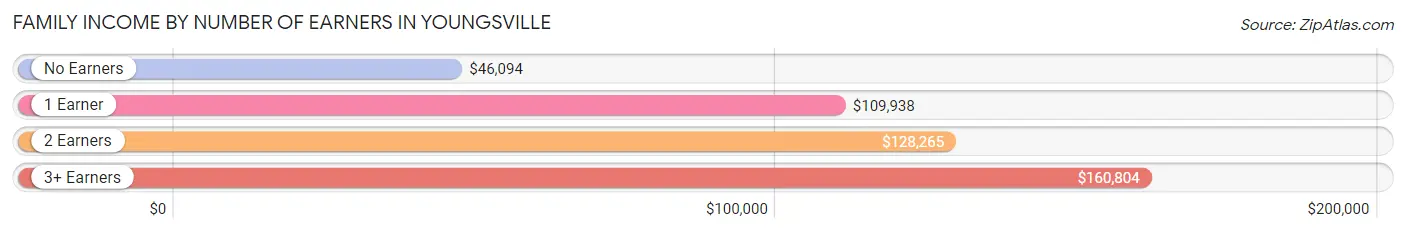
| Number of Earners | # Families | Median Income |
| No Earners | 561 (13.0%) | $46,094 |
| 1 Earner | 838 (19.4%) | $109,938 |
| 2 Earners | 2,504 (58.0%) | $128,265 |
| 3+ Earners | 414 (9.6%) | $160,804 |
| Total | 4,317 (100.0%) | $118,410 |
Household Income in Youngsville
Household Income Brackets in Youngsville
With 1,651 households falling in the category, the $100,000 to $149,999 income range is the most frequent in Youngsville, accounting for 31.5% of all households. In contrast, only 47 households (0.9%) fall into the $10,000 to $14,999 income bracket, making it the least populous group.
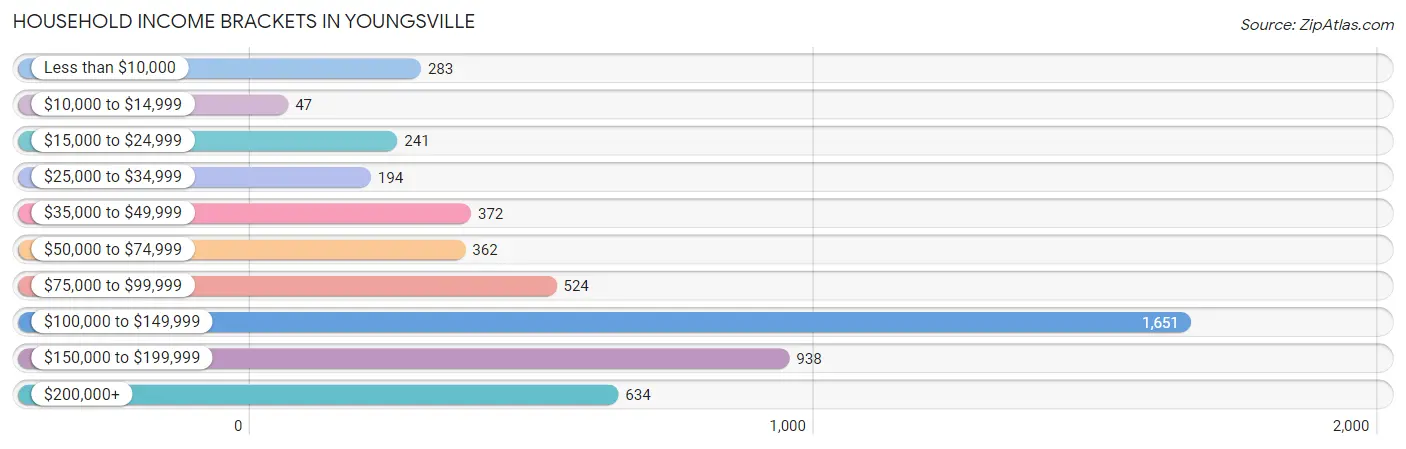
| Income Bracket | # Households | % Households |
| Less than $10,000 | 283 | 5.4% |
| $10,000 to $14,999 | 47 | 0.9% |
| $15,000 to $24,999 | 241 | 4.6% |
| $25,000 to $34,999 | 194 | 3.7% |
| $35,000 to $49,999 | 372 | 7.1% |
| $50,000 to $74,999 | 362 | 6.9% |
| $75,000 to $99,999 | 524 | 10.0% |
| $100,000 to $149,999 | 1,651 | 31.5% |
| $150,000 to $199,999 | 938 | 17.9% |
| $200,000+ | 634 | 12.1% |
Household Income by Householder Age in Youngsville
The median household income in Youngsville is $111,619, with the highest median household income of $129,409 found in the 45 to 64 years age bracket for the primary householder. A total of 1,472 households (28.1%) fall into this category. Meanwhile, the 15 to 24 years age bracket for the primary householder has the lowest median household income of $0, with 40 households (0.8%) in this group.
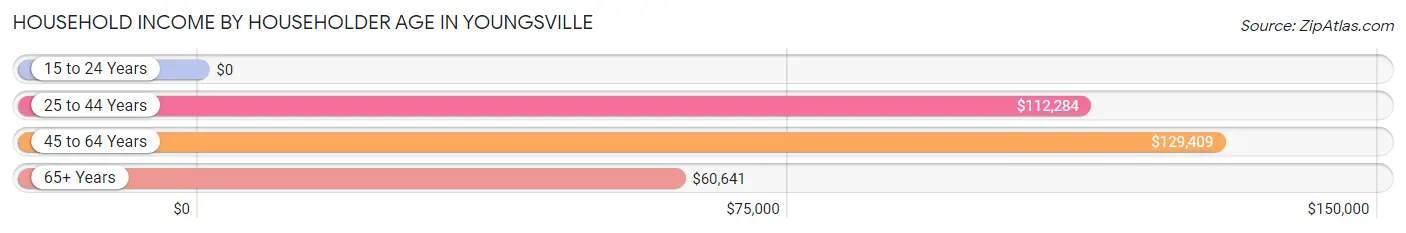
| Income Bracket | # Households | Median Income |
| 15 to 24 Years | 40 (0.8%) | $0 |
| 25 to 44 Years | 3,037 (58.0%) | $112,284 |
| 45 to 64 Years | 1,472 (28.1%) | $129,409 |
| 65+ Years | 692 (13.2%) | $60,641 |
| Total | 5,241 (100.0%) | $111,619 |
Poverty in Youngsville
Income Below Poverty by Sex and Age in Youngsville
With 9.8% poverty level for males and 6.9% for females among the residents of Youngsville, 16 and 17 year old males and 16 and 17 year old females are the most vulnerable to poverty, with 110 males (38.5%) and 35 females (43.8%) in their respective age groups living below the poverty level.
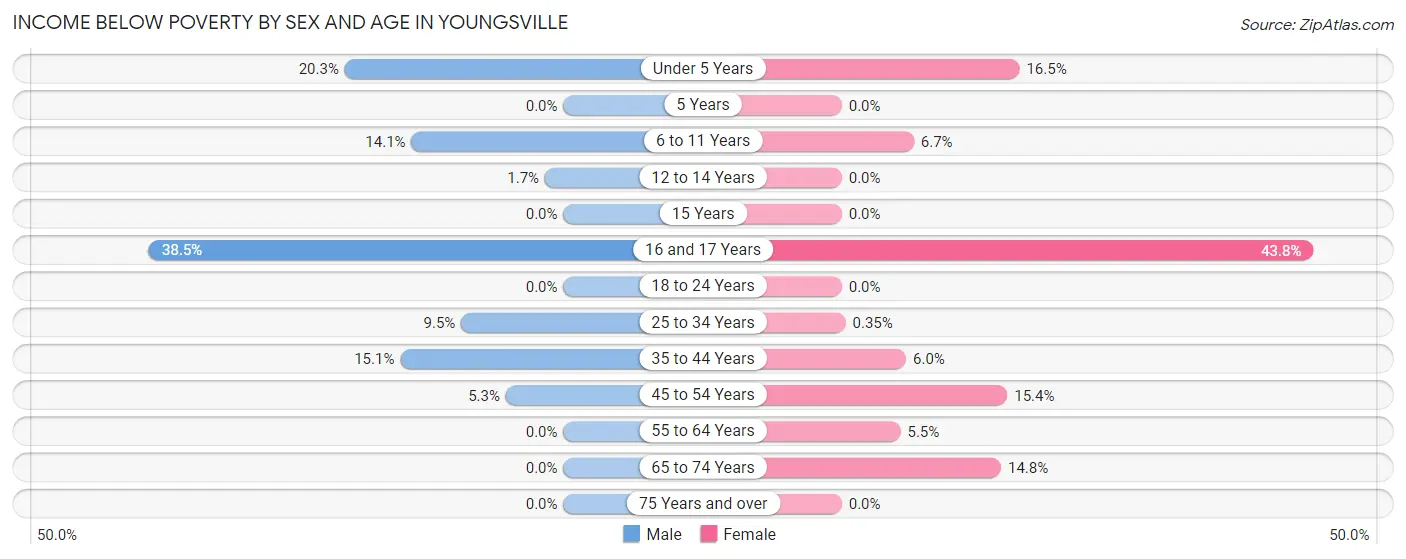
| Age Bracket | Male | Female |
| Under 5 Years | 99 (20.3%) | 93 (16.5%) |
| 5 Years | 0 (0.0%) | 0 (0.0%) |
| 6 to 11 Years | 129 (14.1%) | 101 (6.7%) |
| 12 to 14 Years | 6 (1.7%) | 0 (0.0%) |
| 15 Years | 0 (0.0%) | 0 (0.0%) |
| 16 and 17 Years | 110 (38.5%) | 35 (43.8%) |
| 18 to 24 Years | 0 (0.0%) | 0 (0.0%) |
| 25 to 34 Years | 120 (9.5%) | 5 (0.4%) |
| 35 to 44 Years | 182 (15.1%) | 109 (6.0%) |
| 45 to 54 Years | 45 (5.3%) | 127 (15.4%) |
| 55 to 64 Years | 0 (0.0%) | 32 (5.4%) |
| 65 to 74 Years | 0 (0.0%) | 107 (14.8%) |
| 75 Years and over | 0 (0.0%) | 0 (0.0%) |
| Total | 691 (9.8%) | 609 (6.9%) |
Income Above Poverty by Sex and Age in Youngsville
According to the poverty statistics in Youngsville, males aged 5 years and females aged 5 years are the age groups that are most secure financially, with 100.0% of males and 100.0% of females in these age groups living above the poverty line.
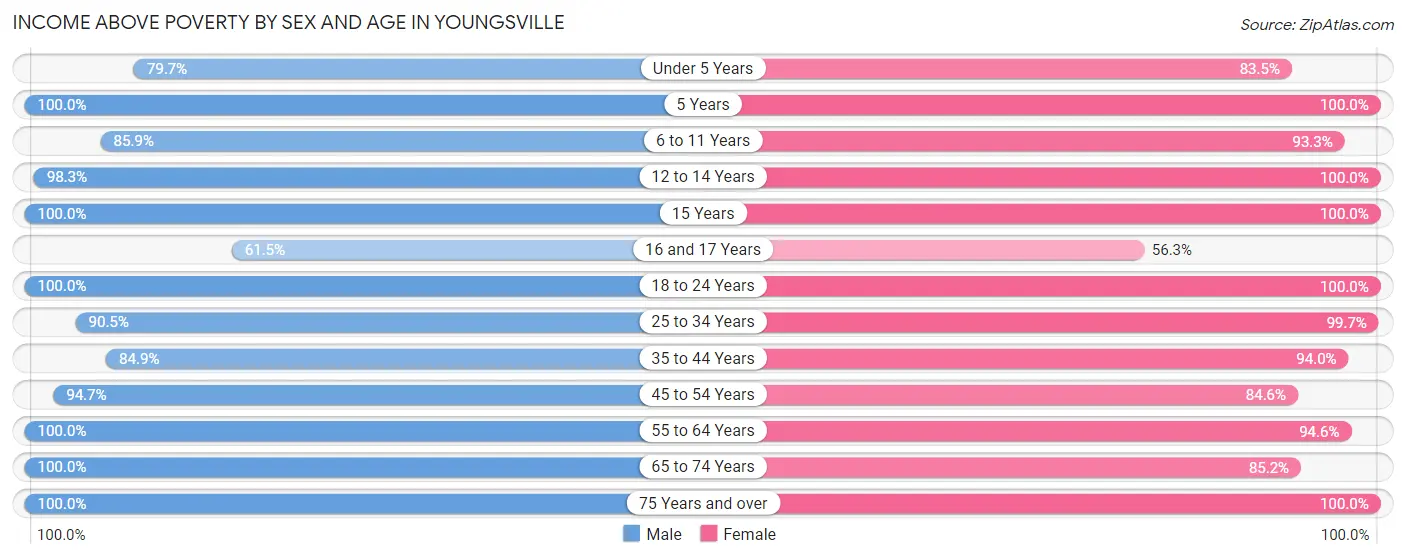
| Age Bracket | Male | Female |
| Under 5 Years | 389 (79.7%) | 471 (83.5%) |
| 5 Years | 155 (100.0%) | 98 (100.0%) |
| 6 to 11 Years | 786 (85.9%) | 1,409 (93.3%) |
| 12 to 14 Years | 345 (98.3%) | 363 (100.0%) |
| 15 Years | 298 (100.0%) | 229 (100.0%) |
| 16 and 17 Years | 176 (61.5%) | 45 (56.2%) |
| 18 to 24 Years | 197 (100.0%) | 311 (100.0%) |
| 25 to 34 Years | 1,146 (90.5%) | 1,426 (99.7%) |
| 35 to 44 Years | 1,020 (84.9%) | 1,717 (94.0%) |
| 45 to 54 Years | 797 (94.7%) | 700 (84.6%) |
| 55 to 64 Years | 603 (100.0%) | 555 (94.6%) |
| 65 to 74 Years | 245 (100.0%) | 617 (85.2%) |
| 75 Years and over | 184 (100.0%) | 235 (100.0%) |
| Total | 6,341 (90.2%) | 8,176 (93.1%) |
Income Below Poverty Among Married-Couple Families in Youngsville
The poverty statistics for married-couple families in Youngsville show that 1.3% or 50 of the total 3,808 families live below the poverty line. Families with 5 or more children have the highest poverty rate of 13.2%, comprising of 5 families. On the other hand, families with 1 or 2 children have the lowest poverty rate of 0.0%, which includes 0 families.
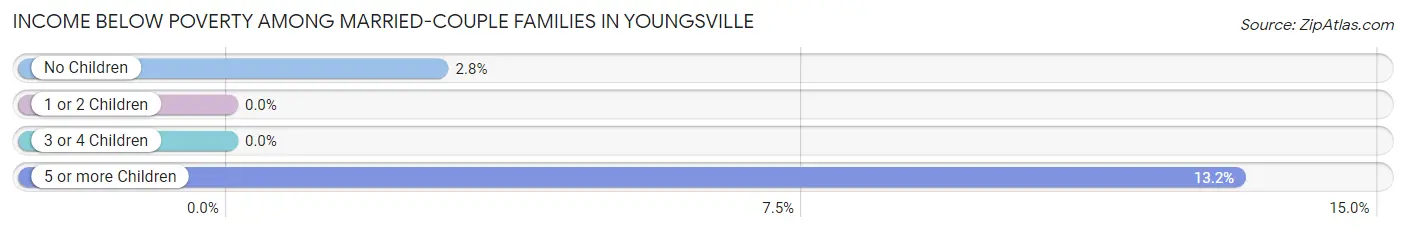
| Children | Above Poverty | Below Poverty |
| No Children | 1,589 (97.3%) | 45 (2.8%) |
| 1 or 2 Children | 1,738 (100.0%) | 0 (0.0%) |
| 3 or 4 Children | 398 (100.0%) | 0 (0.0%) |
| 5 or more Children | 33 (86.8%) | 5 (13.2%) |
| Total | 3,758 (98.7%) | 50 (1.3%) |
Income Below Poverty Among Single-Parent Households in Youngsville
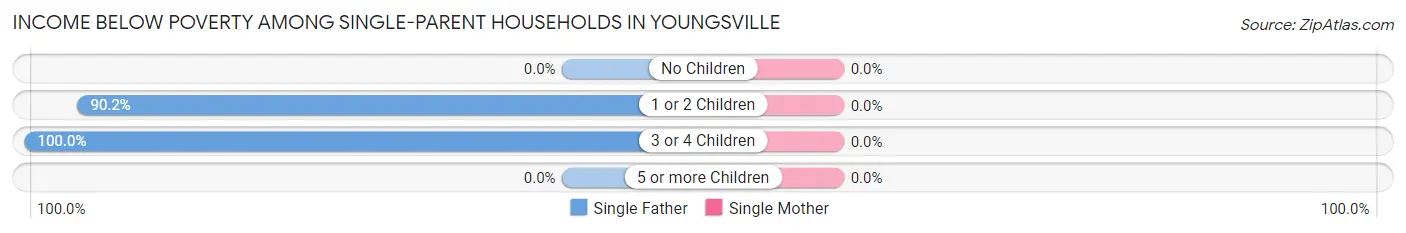
| Children | Single Father | Single Mother |
| No Children | 0 (0.0%) | 0 (0.0%) |
| 1 or 2 Children | 119 (90.1%) | 0 (0.0%) |
| 3 or 4 Children | 106 (100.0%) | 0 (0.0%) |
| 5 or more Children | 0 (0.0%) | 0 (0.0%) |
| Total | 225 (88.9%) | 0 (0.0%) |
Income Below Poverty Among Married-Couple vs Single-Parent Households in Youngsville
The poverty data for Youngsville shows that 50 of the married-couple family households (1.3%) and 225 of the single-parent households (44.2%) are living below the poverty level. Within the married-couple family households, those with 5 or more children have the highest poverty rate, with 5 households (13.2%) falling below the poverty line. Among the single-parent households, those with 3 or 4 children have the highest poverty rate, with 106 household (100.0%) living below poverty.
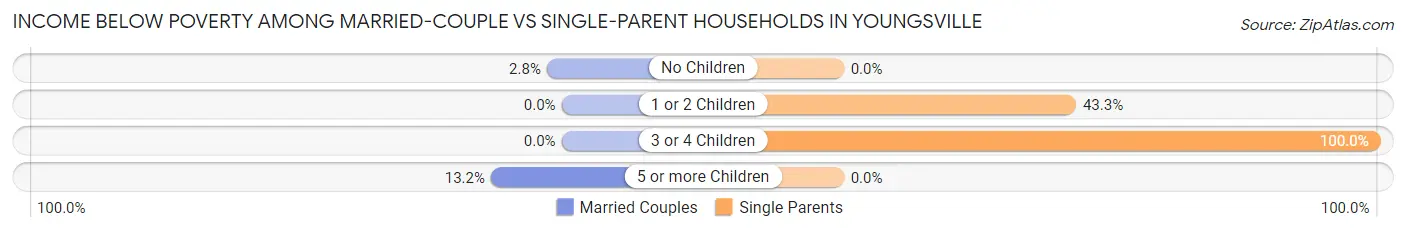
| Children | Married-Couple Families | Single-Parent Households |
| No Children | 45 (2.8%) | 0 (0.0%) |
| 1 or 2 Children | 0 (0.0%) | 119 (43.3%) |
| 3 or 4 Children | 0 (0.0%) | 106 (100.0%) |
| 5 or more Children | 5 (13.2%) | 0 (0.0%) |
| Total | 50 (1.3%) | 225 (44.2%) |
Race in Youngsville
The most populous races in Youngsville are White / Caucasian (13,525 | 84.6%), Black / African American (1,789 | 11.2%), and Hispanic or Latino (536 | 3.4%).
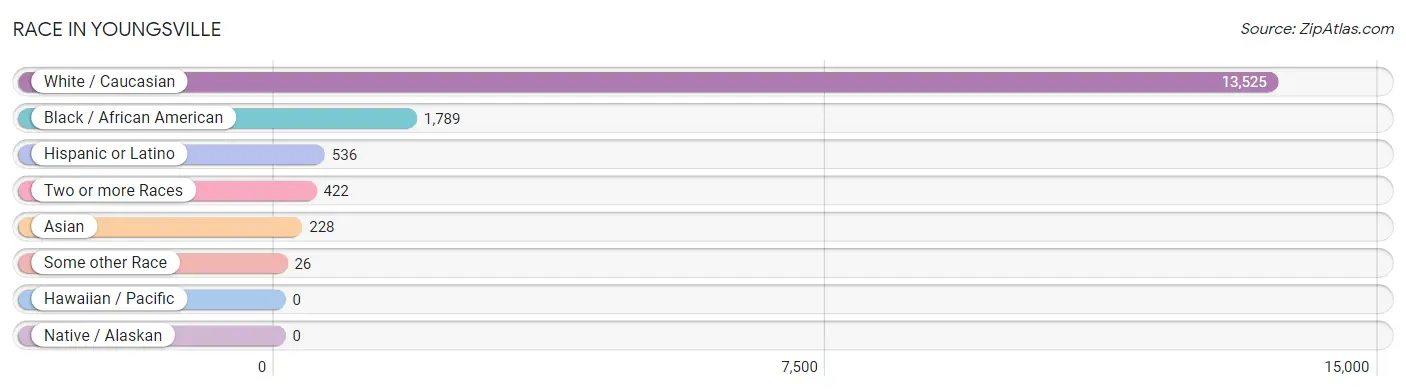
| Race | # Population | % Population |
| Asian | 228 | 1.4% |
| Black / African American | 1,789 | 11.2% |
| Hawaiian / Pacific | 0 | 0.0% |
| Hispanic or Latino | 536 | 3.4% |
| Native / Alaskan | 0 | 0.0% |
| White / Caucasian | 13,525 | 84.6% |
| Two or more Races | 422 | 2.6% |
| Some other Race | 26 | 0.2% |
| Total | 15,990 | 100.0% |
Ancestry in Youngsville
The most populous ancestries reported in Youngsville are French (3,741 | 23.4%), Irish (1,843 | 11.5%), English (1,584 | 9.9%), German (1,422 | 8.9%), and Polish (644 | 4.0%), together accounting for 57.8% of all Youngsville residents.
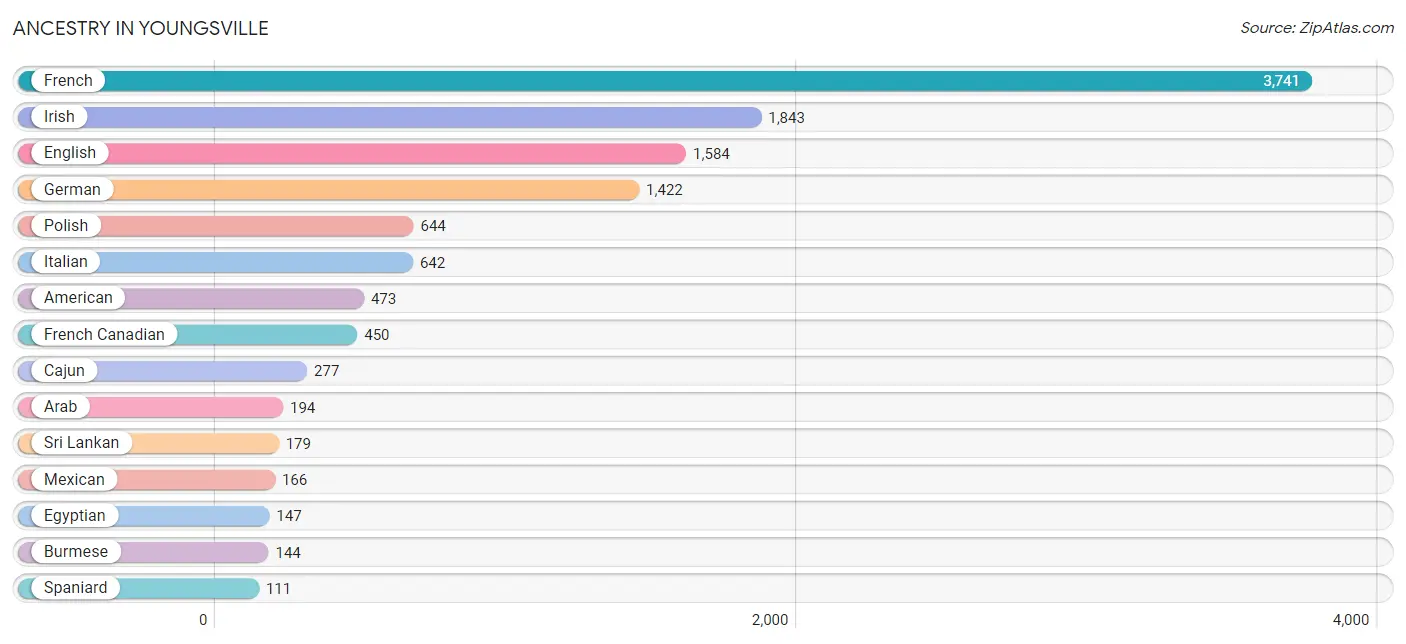
| Ancestry | # Population | % Population |
| African | 96 | 0.6% |
| American | 473 | 3.0% |
| Arab | 194 | 1.2% |
| Bolivian | 41 | 0.3% |
| Brazilian | 25 | 0.2% |
| British | 87 | 0.5% |
| Burmese | 144 | 0.9% |
| Cajun | 277 | 1.7% |
| Canadian | 15 | 0.1% |
| Central American | 91 | 0.6% |
| Danish | 40 | 0.3% |
| Egyptian | 147 | 0.9% |
| English | 1,584 | 9.9% |
| European | 4 | 0.0% |
| French | 3,741 | 23.4% |
| French Canadian | 450 | 2.8% |
| German | 1,422 | 8.9% |
| Guatemalan | 25 | 0.2% |
| Honduran | 27 | 0.2% |
| Houma | 29 | 0.2% |
| Hungarian | 20 | 0.1% |
| Irish | 1,843 | 11.5% |
| Italian | 642 | 4.0% |
| Japanese | 10 | 0.1% |
| Korean | 17 | 0.1% |
| Lebanese | 47 | 0.3% |
| Mexican | 166 | 1.0% |
| Nicaraguan | 39 | 0.2% |
| Norwegian | 16 | 0.1% |
| Peruvian | 22 | 0.1% |
| Polish | 644 | 4.0% |
| Puerto Rican | 26 | 0.2% |
| Russian | 75 | 0.5% |
| Scottish | 106 | 0.7% |
| South American | 104 | 0.6% |
| Spaniard | 111 | 0.7% |
| Spanish | 17 | 0.1% |
| Sri Lankan | 179 | 1.1% |
| Subsaharan African | 96 | 0.6% |
| Swedish | 48 | 0.3% |
| Thai | 49 | 0.3% |
| Turkish | 19 | 0.1% |
| Venezuelan | 41 | 0.3% | View All 43 Rows |
Immigrants in Youngsville
The most numerous immigrant groups reported in Youngsville came from Latin America (203 | 1.3%), Asia (179 | 1.1%), Africa (147 | 0.9%), Egypt (147 | 0.9%), and Northern Africa (147 | 0.9%), together accounting for 5.1% of all Youngsville residents.
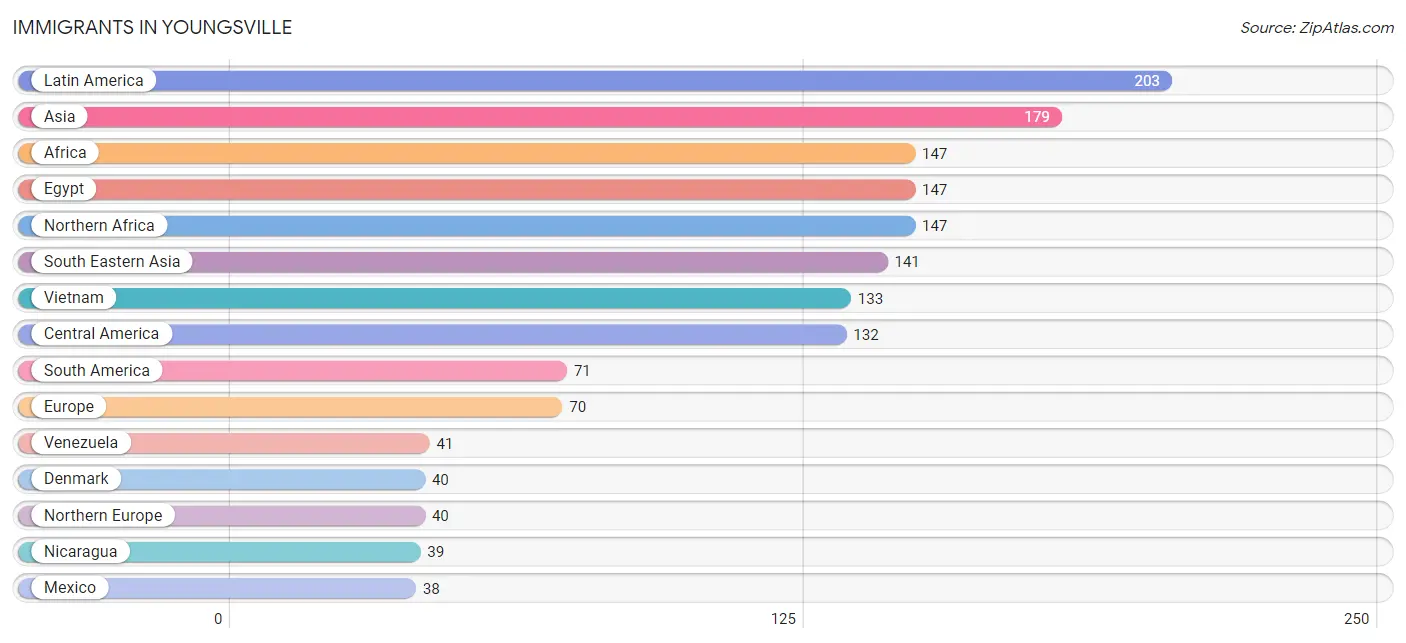
| Immigration Origin | # Population | % Population |
| Africa | 147 | 0.9% |
| Asia | 179 | 1.1% |
| Bolivia | 19 | 0.1% |
| Canada | 15 | 0.1% |
| Central America | 132 | 0.8% |
| Denmark | 40 | 0.3% |
| Eastern Europe | 10 | 0.1% |
| Egypt | 147 | 0.9% |
| Europe | 70 | 0.4% |
| Germany | 20 | 0.1% |
| Guatemala | 25 | 0.2% |
| Guyana | 11 | 0.1% |
| Honduras | 30 | 0.2% |
| India | 19 | 0.1% |
| Latin America | 203 | 1.3% |
| Mexico | 38 | 0.2% |
| Nicaragua | 39 | 0.2% |
| Northern Africa | 147 | 0.9% |
| Northern Europe | 40 | 0.3% |
| South America | 71 | 0.4% |
| South Central Asia | 19 | 0.1% |
| South Eastern Asia | 141 | 0.9% |
| Thailand | 8 | 0.1% |
| Turkey | 19 | 0.1% |
| Venezuela | 41 | 0.3% |
| Vietnam | 133 | 0.8% |
| Western Asia | 19 | 0.1% |
| Western Europe | 20 | 0.1% | View All 28 Rows |
Sex and Age in Youngsville
Sex and Age in Youngsville
The most populous age groups in Youngsville are 30 to 34 Years (935 | 13.2%) for men and 5 to 9 Years (1,191 | 13.4%) for women.
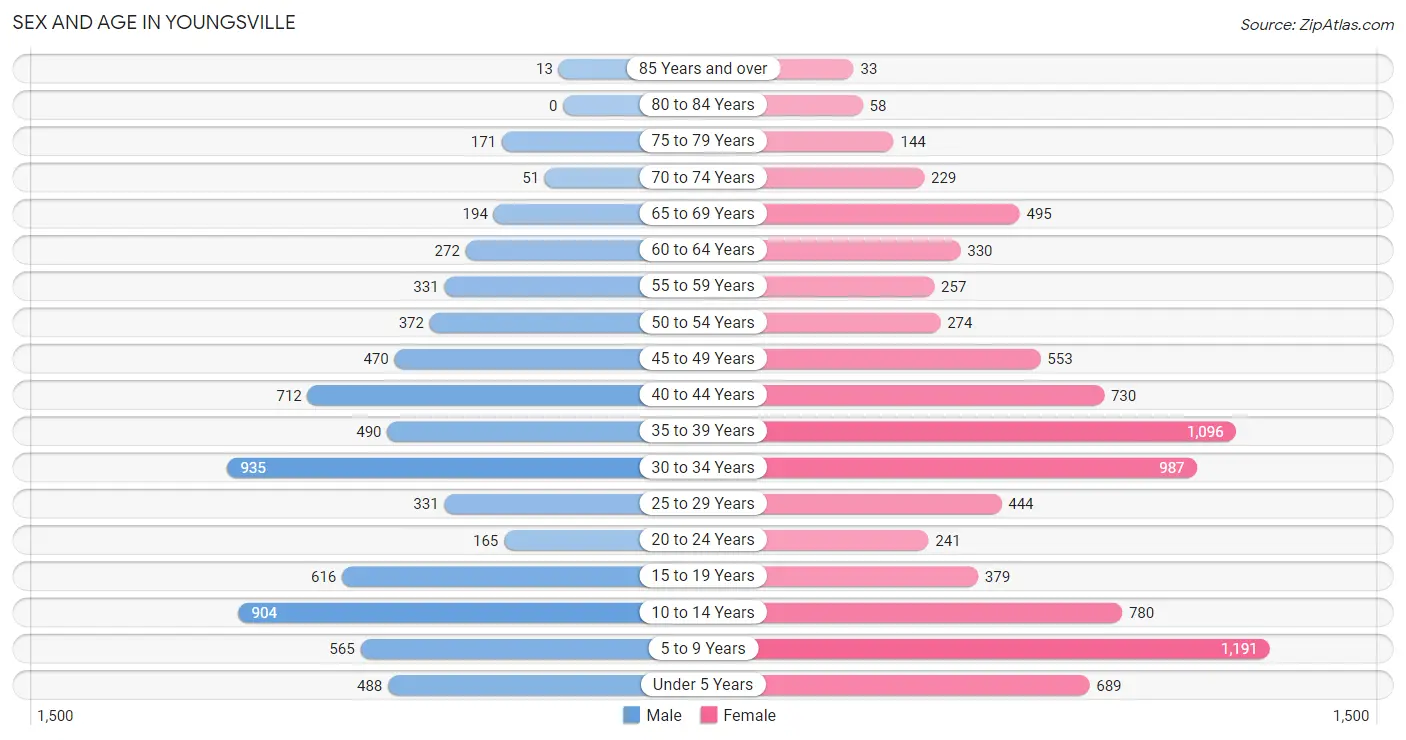
| Age Bracket | Male | Female |
| Under 5 Years | 488 (6.9%) | 689 (7.7%) |
| 5 to 9 Years | 565 (8.0%) | 1,191 (13.4%) |
| 10 to 14 Years | 904 (12.8%) | 780 (8.7%) |
| 15 to 19 Years | 616 (8.7%) | 379 (4.3%) |
| 20 to 24 Years | 165 (2.3%) | 241 (2.7%) |
| 25 to 29 Years | 331 (4.7%) | 444 (5.0%) |
| 30 to 34 Years | 935 (13.2%) | 987 (11.1%) |
| 35 to 39 Years | 490 (6.9%) | 1,096 (12.3%) |
| 40 to 44 Years | 712 (10.1%) | 730 (8.2%) |
| 45 to 49 Years | 470 (6.6%) | 553 (6.2%) |
| 50 to 54 Years | 372 (5.2%) | 274 (3.1%) |
| 55 to 59 Years | 331 (4.7%) | 257 (2.9%) |
| 60 to 64 Years | 272 (3.8%) | 330 (3.7%) |
| 65 to 69 Years | 194 (2.7%) | 495 (5.6%) |
| 70 to 74 Years | 51 (0.7%) | 229 (2.6%) |
| 75 to 79 Years | 171 (2.4%) | 144 (1.6%) |
| 80 to 84 Years | 0 (0.0%) | 58 (0.6%) |
| 85 Years and over | 13 (0.2%) | 33 (0.4%) |
| Total | 7,080 (100.0%) | 8,910 (100.0%) |
Families and Households in Youngsville
Median Family Size in Youngsville
The median family size in Youngsville is 3.38 persons per family, with married-couple families (3,808 | 88.2%) accounting for the largest median family size of 3.45 persons per family. On the other hand, single female/mother families (256 | 5.9%) represent the smallest median family size with 2.46 persons per family.
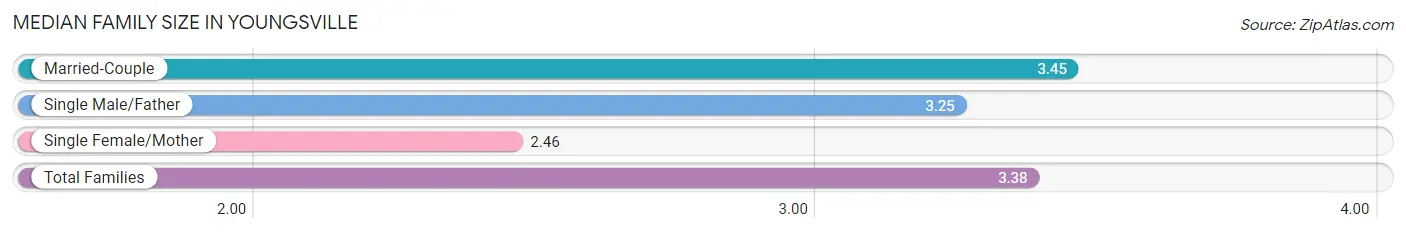
| Family Type | # Families | Family Size |
| Married-Couple | 3,808 (88.2%) | 3.45 |
| Single Male/Father | 253 (5.9%) | 3.25 |
| Single Female/Mother | 256 (5.9%) | 2.46 |
| Total Families | 4,317 (100.0%) | 3.38 |
Median Household Size in Youngsville
The median household size in Youngsville is 3.05 persons per household, with single male/father households (253 | 4.8%) accounting for the largest median household size of 3.72 persons per household. non-family households (924 | 17.6%) represent the smallest median household size with 1.18 persons per household.
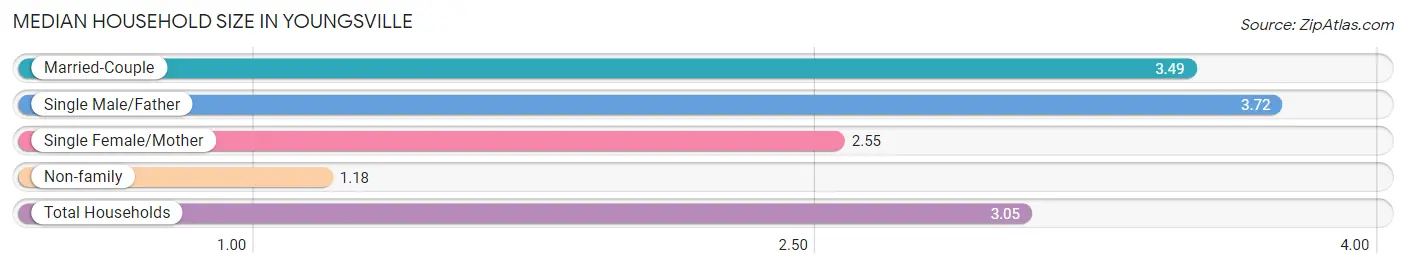
| Household Type | # Households | Household Size |
| Married-Couple | 3,808 (72.7%) | 3.49 |
| Single Male/Father | 253 (4.8%) | 3.72 |
| Single Female/Mother | 256 (4.9%) | 2.55 |
| Non-family | 924 (17.6%) | 1.18 |
| Total Households | 5,241 (100.0%) | 3.05 |
Household Size by Marriage Status in Youngsville
Out of a total of 5,241 households in Youngsville, 4,317 (82.4%) are family households, while 924 (17.6%) are nonfamily households. The most numerous type of family households are 2-person households, comprising 1,513, and the most common type of nonfamily households are 1-person households, comprising 808.
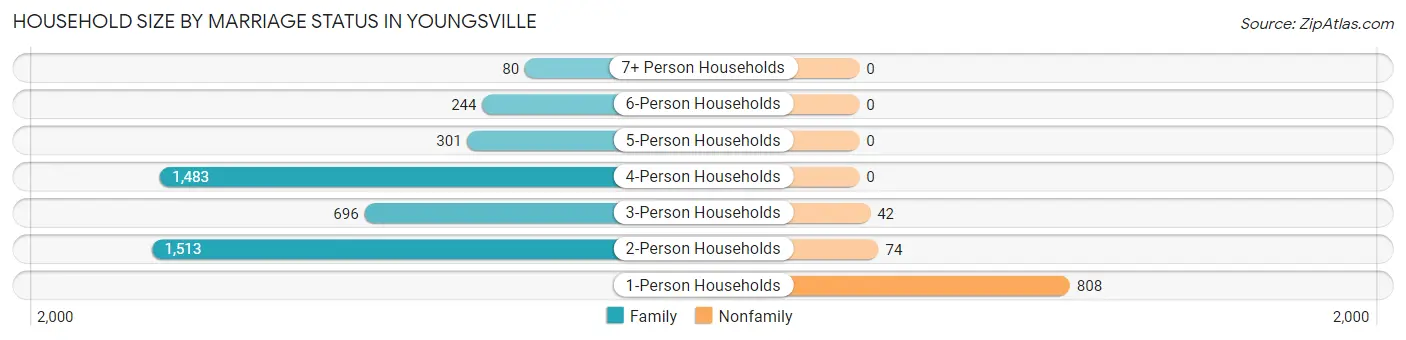
| Household Size | Family Households | Nonfamily Households |
| 1-Person Households | - | 808 (15.4%) |
| 2-Person Households | 1,513 (28.9%) | 74 (1.4%) |
| 3-Person Households | 696 (13.3%) | 42 (0.8%) |
| 4-Person Households | 1,483 (28.3%) | 0 (0.0%) |
| 5-Person Households | 301 (5.7%) | 0 (0.0%) |
| 6-Person Households | 244 (4.7%) | 0 (0.0%) |
| 7+ Person Households | 80 (1.5%) | 0 (0.0%) |
| Total | 4,317 (82.4%) | 924 (17.6%) |
Female Fertility in Youngsville
Fertility by Age in Youngsville
Average fertility rate in Youngsville is 26.0 births per 1,000 women. Women in the age bracket of 20 to 34 years have the highest fertility rate with 68.0 births per 1,000 women. Women in the age bracket of 20 to 34 years acount for 100.0% of all women with births.
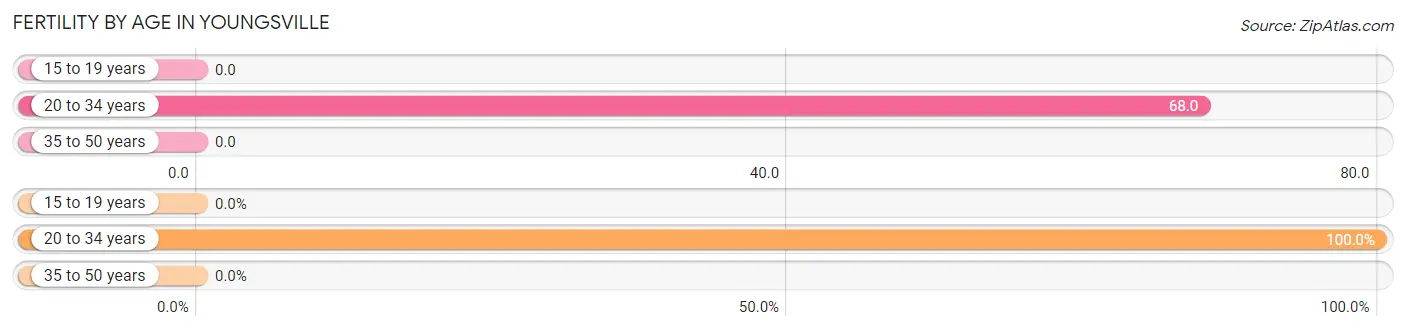
| Age Bracket | Women with Births | Births / 1,000 Women |
| 15 to 19 years | 0 (0.0%) | 0.0 |
| 20 to 34 years | 114 (100.0%) | 68.0 |
| 35 to 50 years | 0 (0.0%) | 0.0 |
| Total | 114 (100.0%) | 26.0 |
Fertility by Age by Marriage Status in Youngsville
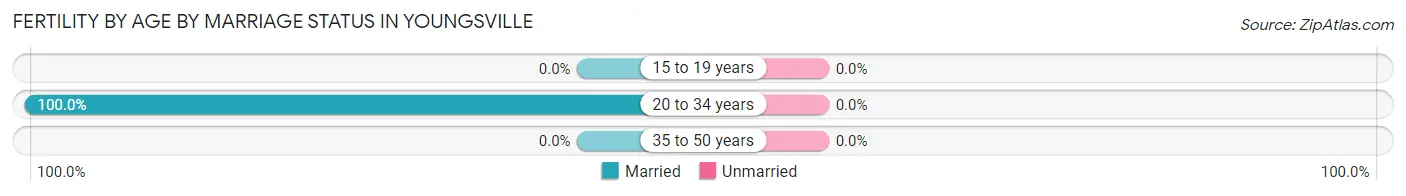
| Age Bracket | Married | Unmarried |
| 15 to 19 years | 0 (0.0%) | 0 (0.0%) |
| 20 to 34 years | 114 (100.0%) | 0 (0.0%) |
| 35 to 50 years | 0 (0.0%) | 0 (0.0%) |
| Total | 114 (100.0%) | 0 (0.0%) |
Fertility by Education in Youngsville
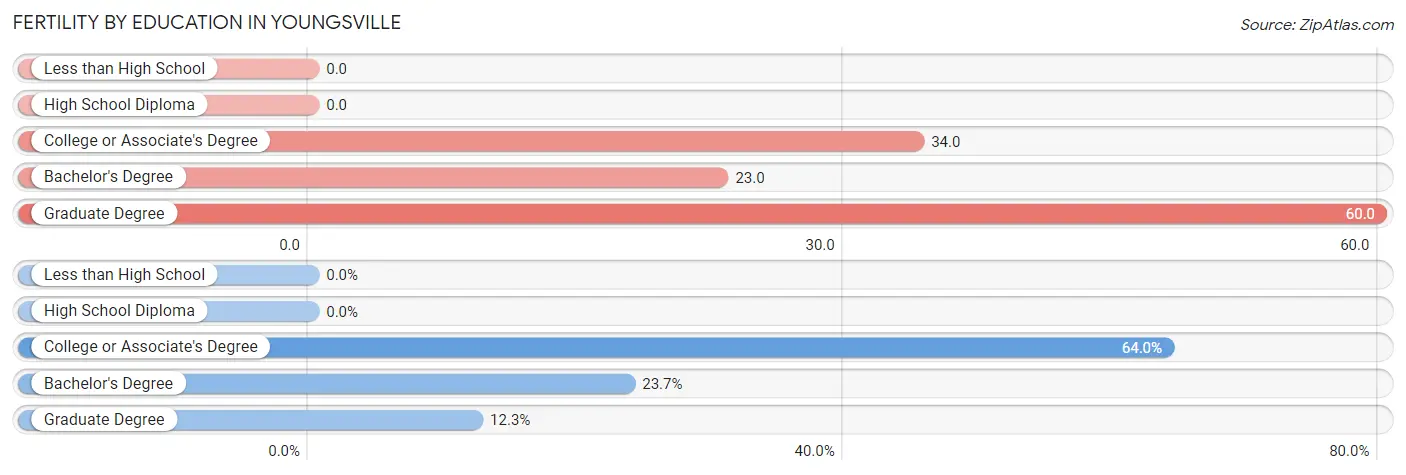
| Educational Attainment | Women with Births | Births / 1,000 Women |
| Less than High School | 0 (0.0%) | 0.0 |
| High School Diploma | 0 (0.0%) | 0.0 |
| College or Associate's Degree | 73 (64.0%) | 34.0 |
| Bachelor's Degree | 27 (23.7%) | 23.0 |
| Graduate Degree | 14 (12.3%) | 60.0 |
| Total | 114 (100.0%) | 26.0 |
Fertility by Education by Marriage Status in Youngsville
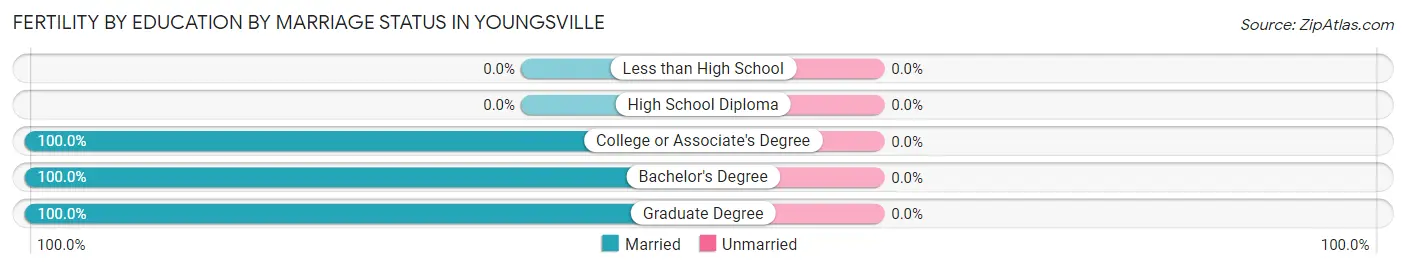
| Educational Attainment | Married | Unmarried |
| Less than High School | 0 (0.0%) | 0 (0.0%) |
| High School Diploma | 0 (0.0%) | 0 (0.0%) |
| College or Associate's Degree | 73 (100.0%) | 0 (0.0%) |
| Bachelor's Degree | 27 (100.0%) | 0 (0.0%) |
| Graduate Degree | 14 (100.0%) | 0 (0.0%) |
| Total | 114 (100.0%) | 0 (0.0%) |
Employment Characteristics in Youngsville
Employment by Class of Employer in Youngsville
Among the 7,749 employed individuals in Youngsville, private company employees (5,975 | 77.1%), state government employees (397 | 5.1%), and local government employees (362 | 4.7%) make up the most common classes of employment.
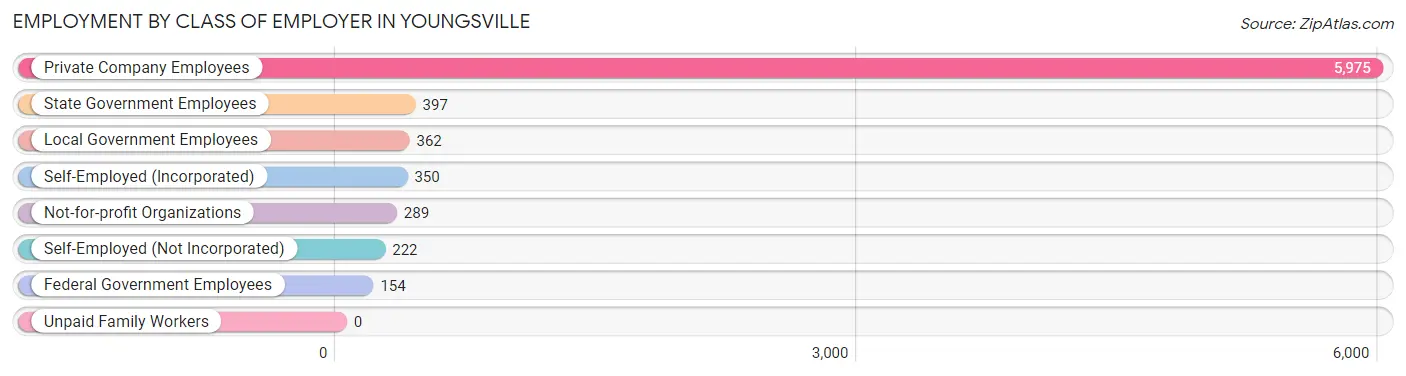
| Employer Class | # Employees | % Employees |
| Private Company Employees | 5,975 | 77.1% |
| Self-Employed (Incorporated) | 350 | 4.5% |
| Self-Employed (Not Incorporated) | 222 | 2.9% |
| Not-for-profit Organizations | 289 | 3.7% |
| Local Government Employees | 362 | 4.7% |
| State Government Employees | 397 | 5.1% |
| Federal Government Employees | 154 | 2.0% |
| Unpaid Family Workers | 0 | 0.0% |
| Total | 7,749 | 100.0% |
Employment Status by Age in Youngsville
According to the labor force statistics for Youngsville, out of the total population over 16 years of age (10,846), 74.0% or 8,026 individuals are in the labor force, with 2.4% or 193 of them unemployed. The age group with the highest labor force participation rate is 25 to 29 years, with 95.7% or 742 individuals in the labor force. Within the labor force, the 16 to 19 years age range has the highest percentage of unemployed individuals, with 7.1% or 14 of them being unemployed.
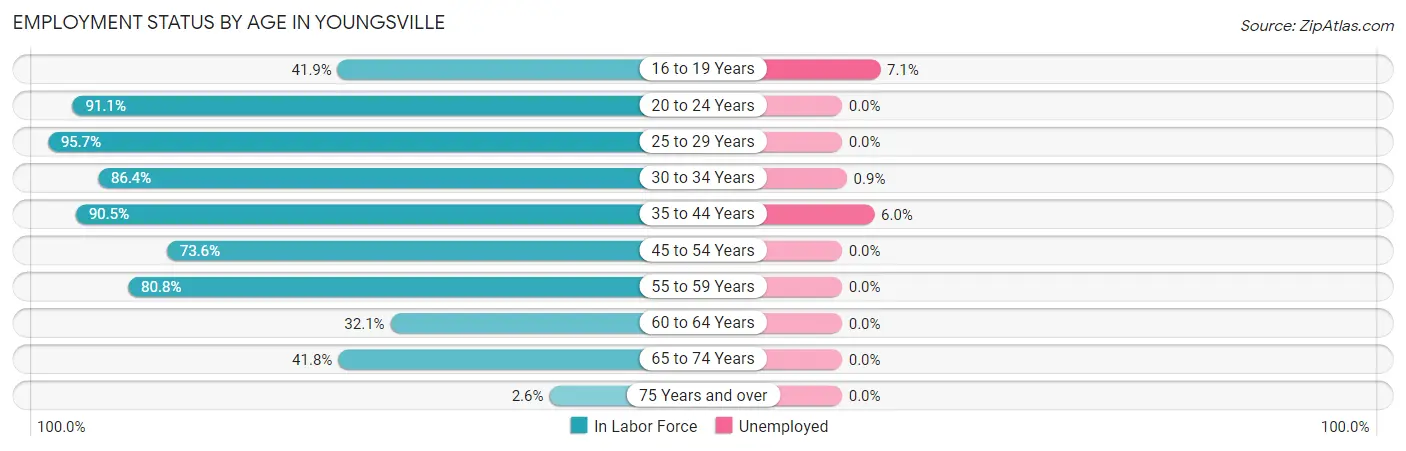
| Age Bracket | In Labor Force | Unemployed |
| 16 to 19 Years | 196 (41.9%) | 14 (7.1%) |
| 20 to 24 Years | 370 (91.1%) | 0 (0.0%) |
| 25 to 29 Years | 742 (95.7%) | 0 (0.0%) |
| 30 to 34 Years | 1,661 (86.4%) | 15 (0.9%) |
| 35 to 44 Years | 2,740 (90.5%) | 164 (6.0%) |
| 45 to 54 Years | 1,228 (73.6%) | 0 (0.0%) |
| 55 to 59 Years | 475 (80.8%) | 0 (0.0%) |
| 60 to 64 Years | 193 (32.1%) | 0 (0.0%) |
| 65 to 74 Years | 405 (41.8%) | 0 (0.0%) |
| 75 Years and over | 11 (2.6%) | 0 (0.0%) |
| Total | 8,026 (74.0%) | 193 (2.4%) |
Employment Status by Educational Attainment in Youngsville
According to labor force statistics for Youngsville, 82.0% of individuals (7,039) out of the total population between 25 and 64 years of age (8,584) are in the labor force, with 2.5% or 176 of them being unemployed. The group with the highest labor force participation rate are those with the educational attainment of bachelor's degree or higher, with 94.1% or 3,482 individuals in the labor force. Within the labor force, individuals with high school diploma education have the highest percentage of unemployment, with 16.1% or 155 of them being unemployed.
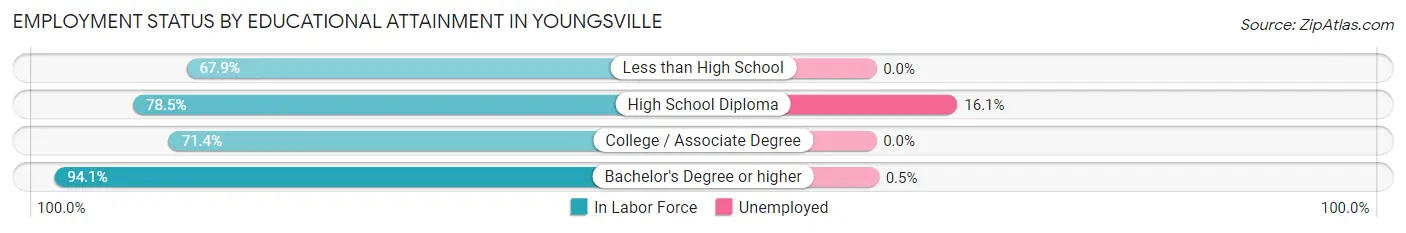
| Educational Attainment | In Labor Force | Unemployed |
| Less than High School | 279 (67.9%) | 0 (0.0%) |
| High School Diploma | 962 (78.5%) | 197 (16.1%) |
| College / Associate Degree | 2,318 (71.4%) | 0 (0.0%) |
| Bachelor's Degree or higher | 3,482 (94.1%) | 18 (0.5%) |
| Total | 7,039 (82.0%) | 215 (2.5%) |
Employment Occupations by Sex in Youngsville
Management, Business, Science and Arts Occupations
The most common Management, Business, Science and Arts occupations in Youngsville are Management (1,373 | 17.8%), Health Diagnosing & Treating (1,143 | 14.8%), Community & Social Service (748 | 9.7%), Education Instruction & Library (550 | 7.1%), and Business & Financial (513 | 6.6%).
Management, Business, Science and Arts Occupations by Sex
Within the Management, Business, Science and Arts occupations in Youngsville, the most male-oriented occupations are Life, Physical & Social Science (89.2%), Computers, Engineering & Science (74.9%), and Computers & Mathematics (74.2%), while the most female-oriented occupations are Legal Services & Support (100.0%), Education Instruction & Library (90.4%), and Community & Social Service (88.2%).
| Occupation | Male | Female |
| Management | 867 (63.1%) | 506 (36.8%) |
| Business & Financial | 234 (45.6%) | 279 (54.4%) |
| Computers, Engineering & Science | 349 (74.9%) | 117 (25.1%) |
| Computers & Mathematics | 175 (74.2%) | 61 (25.9%) |
| Architecture & Engineering | 91 (66.4%) | 46 (33.6%) |
| Life, Physical & Social Science | 83 (89.2%) | 10 (10.7%) |
| Community & Social Service | 88 (11.8%) | 660 (88.2%) |
| Education, Arts & Media | 20 (16.3%) | 103 (83.7%) |
| Legal Services & Support | 0 (0.0%) | 21 (100.0%) |
| Education Instruction & Library | 53 (9.6%) | 497 (90.4%) |
| Arts, Media & Entertainment | 15 (27.8%) | 39 (72.2%) |
| Health Diagnosing & Treating | 245 (21.4%) | 898 (78.6%) |
| Health Technologists | 229 (51.8%) | 213 (48.2%) |
| Total (Category) | 1,783 (42.0%) | 2,460 (58.0%) |
| Total (Overall) | 3,537 (45.7%) | 4,195 (54.3%) |
Services Occupations
The most common Services occupations in Youngsville are Food Preparation & Serving (284 | 3.7%), Personal Care & Service (122 | 1.6%), Healthcare Support (103 | 1.3%), Security & Protection (78 | 1.0%), and Firefighting & Prevention (61 | 0.8%).
Services Occupations by Sex
Within the Services occupations in Youngsville, the most male-oriented occupations are Security & Protection (100.0%), Firefighting & Prevention (100.0%), and Law Enforcement (100.0%), while the most female-oriented occupations are Healthcare Support (100.0%), Personal Care & Service (100.0%), and Food Preparation & Serving (56.0%).
| Occupation | Male | Female |
| Healthcare Support | 0 (0.0%) | 103 (100.0%) |
| Security & Protection | 78 (100.0%) | 0 (0.0%) |
| Firefighting & Prevention | 61 (100.0%) | 0 (0.0%) |
| Law Enforcement | 17 (100.0%) | 0 (0.0%) |
| Food Preparation & Serving | 125 (44.0%) | 159 (56.0%) |
| Cleaning & Maintenance | 0 (0.0%) | 0 (0.0%) |
| Personal Care & Service | 0 (0.0%) | 122 (100.0%) |
| Total (Category) | 203 (34.6%) | 384 (65.4%) |
| Total (Overall) | 3,537 (45.7%) | 4,195 (54.3%) |
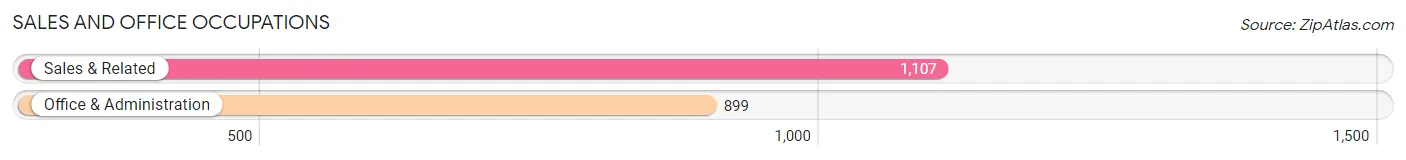
Sales and Office Occupations
The most common Sales and Office occupations in Youngsville are Sales & Related (1,107 | 14.3%), and Office & Administration (899 | 11.6%).
Sales and Office Occupations by Sex
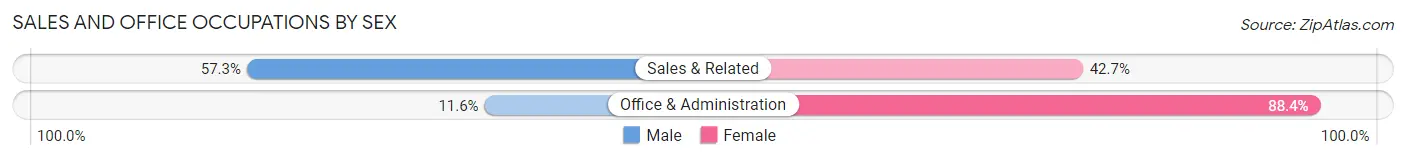
| Occupation | Male | Female |
| Sales & Related | 634 (57.3%) | 473 (42.7%) |
| Office & Administration | 104 (11.6%) | 795 (88.4%) |
| Total (Category) | 738 (36.8%) | 1,268 (63.2%) |
| Total (Overall) | 3,537 (45.7%) | 4,195 (54.3%) |
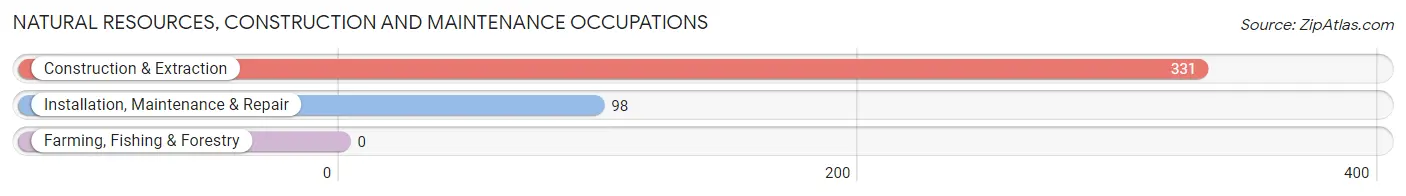
Natural Resources, Construction and Maintenance Occupations
The most common Natural Resources, Construction and Maintenance occupations in Youngsville are Construction & Extraction (331 | 4.3%), and Installation, Maintenance & Repair (98 | 1.3%).
Natural Resources, Construction and Maintenance Occupations by Sex
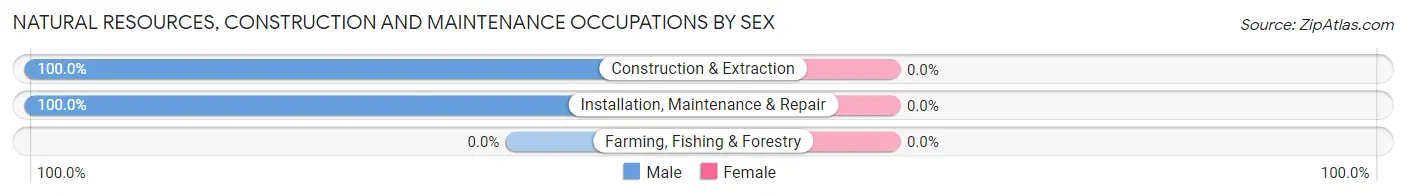
| Occupation | Male | Female |
| Farming, Fishing & Forestry | 0 (0.0%) | 0 (0.0%) |
| Construction & Extraction | 331 (100.0%) | 0 (0.0%) |
| Installation, Maintenance & Repair | 98 (100.0%) | 0 (0.0%) |
| Total (Category) | 429 (100.0%) | 0 (0.0%) |
| Total (Overall) | 3,537 (45.7%) | 4,195 (54.3%) |
Production, Transportation and Moving Occupations
The most common Production, Transportation and Moving occupations in Youngsville are Transportation (189 | 2.4%), Production (167 | 2.2%), and Material Moving (111 | 1.4%).
Production, Transportation and Moving Occupations by Sex
| Occupation | Male | Female |
| Production | 167 (100.0%) | 0 (0.0%) |
| Transportation | 121 (64.0%) | 68 (36.0%) |
| Material Moving | 96 (86.5%) | 15 (13.5%) |
| Total (Category) | 384 (82.2%) | 83 (17.8%) |
| Total (Overall) | 3,537 (45.7%) | 4,195 (54.3%) |
Employment Industries by Sex in Youngsville
Employment Industries in Youngsville
The major employment industries in Youngsville include Health Care & Social Assistance (1,364 | 17.6%), Retail Trade (1,288 | 16.7%), Educational Services (611 | 7.9%), Mining, Quarrying, & Extraction (583 | 7.5%), and Wholesale Trade (542 | 7.0%).
Employment Industries by Sex in Youngsville
The Youngsville industries that see more men than women are Agriculture, Fishing & Hunting (100.0%), Construction (100.0%), and Real Estate, Rental & Leasing (94.2%), whereas the industries that tend to have a higher number of women are Wholesale Trade (95.8%), Educational Services (91.3%), and Information (90.6%).
| Industry | Male | Female |
| Agriculture, Fishing & Hunting | 11 (100.0%) | 0 (0.0%) |
| Mining, Quarrying, & Extraction | 493 (84.6%) | 90 (15.4%) |
| Construction | 130 (100.0%) | 0 (0.0%) |
| Manufacturing | 242 (89.0%) | 30 (11.0%) |
| Wholesale Trade | 23 (4.2%) | 519 (95.8%) |
| Retail Trade | 688 (53.4%) | 600 (46.6%) |
| Transportation & Warehousing | 137 (63.7%) | 78 (36.3%) |
| Utilities | 0 (0.0%) | 0 (0.0%) |
| Information | 12 (9.4%) | 116 (90.6%) |
| Finance & Insurance | 240 (53.0%) | 213 (47.0%) |
| Real Estate, Rental & Leasing | 211 (94.2%) | 13 (5.8%) |
| Professional & Scientific | 246 (46.3%) | 285 (53.7%) |
| Enterprise Management | 0 (0.0%) | 0 (0.0%) |
| Administrative & Support | 366 (84.9%) | 65 (15.1%) |
| Educational Services | 53 (8.7%) | 558 (91.3%) |
| Health Care & Social Assistance | 269 (19.7%) | 1,095 (80.3%) |
| Arts, Entertainment & Recreation | 48 (56.5%) | 37 (43.5%) |
| Accommodation & Food Services | 125 (32.3%) | 262 (67.7%) |
| Public Administration | 84 (47.7%) | 92 (52.3%) |
| Total | 3,537 (45.7%) | 4,195 (54.3%) |
Education in Youngsville
School Enrollment in Youngsville
The most common levels of schooling among the 4,940 students in Youngsville are elementary school (1,687 | 34.2%), high school (1,196 | 24.2%), and middle school (1,132 | 22.9%).
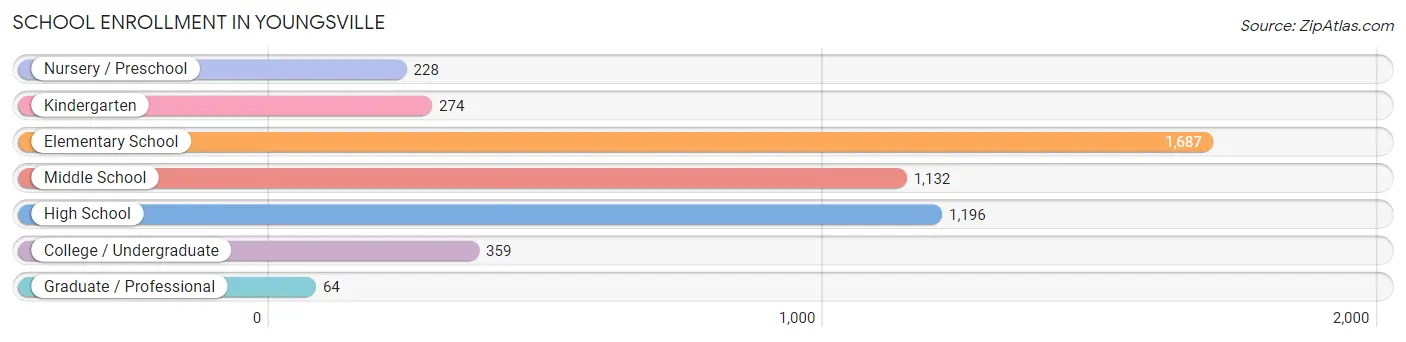
| School Level | # Students | % Students |
| Nursery / Preschool | 228 | 4.6% |
| Kindergarten | 274 | 5.6% |
| Elementary School | 1,687 | 34.2% |
| Middle School | 1,132 | 22.9% |
| High School | 1,196 | 24.2% |
| College / Undergraduate | 359 | 7.3% |
| Graduate / Professional | 64 | 1.3% |
| Total | 4,940 | 100.0% |
School Enrollment by Age by Funding Source in Youngsville
Out of a total of 4,940 students who are enrolled in schools in Youngsville, 1,279 (25.9%) attend a private institution, while the remaining 3,661 (74.1%) are enrolled in public schools. The age group of 15 to 17 year olds has the highest likelihood of being enrolled in private schools, with 400 (44.8% in the age bracket) enrolled. Conversely, the age group of 25 to 34 year olds has the lowest likelihood of being enrolled in a private school, with 135 (95.7% in the age bracket) attending a public institution.
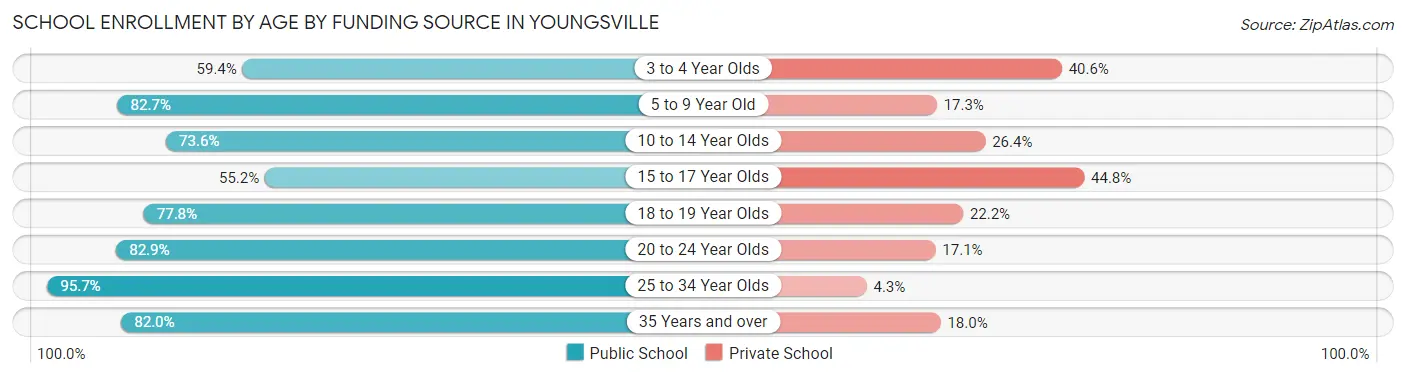
| Age Bracket | Public School | Private School |
| 3 to 4 Year Olds | 98 (59.4%) | 67 (40.6%) |
| 5 to 9 Year Old | 1,445 (82.7%) | 303 (17.3%) |
| 10 to 14 Year Olds | 1,240 (73.6%) | 444 (26.4%) |
| 15 to 17 Year Olds | 493 (55.2%) | 400 (44.8%) |
| 18 to 19 Year Olds | 70 (77.8%) | 20 (22.2%) |
| 20 to 24 Year Olds | 131 (82.9%) | 27 (17.1%) |
| 25 to 34 Year Olds | 135 (95.7%) | 6 (4.3%) |
| 35 Years and over | 50 (82.0%) | 11 (18.0%) |
| Total | 3,661 (74.1%) | 1,279 (25.9%) |
Educational Attainment by Field of Study in Youngsville
Education (946 | 21.8%), business (613 | 14.1%), liberal arts & history (453 | 10.5%), engineering (372 | 8.6%), and science & technology (372 | 8.6%) are the most common fields of study among 4,331 individuals in Youngsville who have obtained a bachelor's degree or higher.
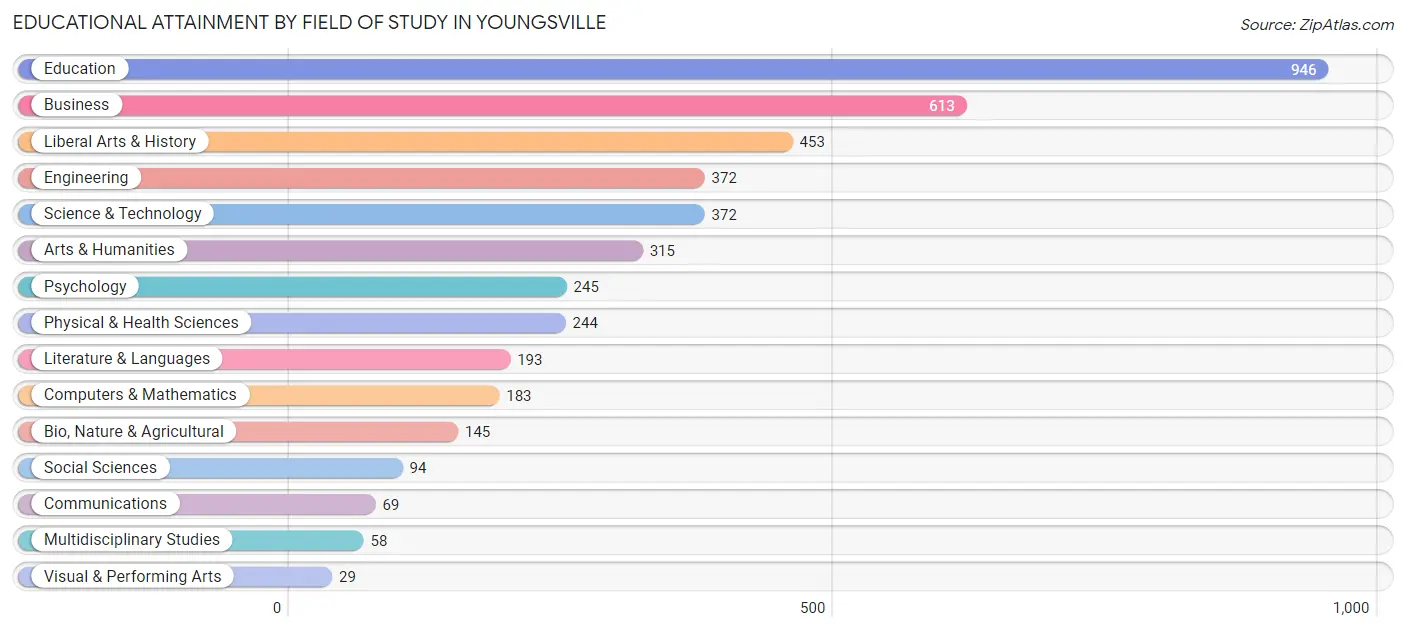
| Field of Study | # Graduates | % Graduates |
| Computers & Mathematics | 183 | 4.2% |
| Bio, Nature & Agricultural | 145 | 3.4% |
| Physical & Health Sciences | 244 | 5.6% |
| Psychology | 245 | 5.7% |
| Social Sciences | 94 | 2.2% |
| Engineering | 372 | 8.6% |
| Multidisciplinary Studies | 58 | 1.3% |
| Science & Technology | 372 | 8.6% |
| Business | 613 | 14.1% |
| Education | 946 | 21.8% |
| Literature & Languages | 193 | 4.5% |
| Liberal Arts & History | 453 | 10.5% |
| Visual & Performing Arts | 29 | 0.7% |
| Communications | 69 | 1.6% |
| Arts & Humanities | 315 | 7.3% |
| Total | 4,331 | 100.0% |
Transportation & Commute in Youngsville
Vehicle Availability by Sex in Youngsville
The most prevalent vehicle ownership categories in Youngsville are males with 2 vehicles (2,138, accounting for 59.6%) and females with 2 vehicles (2,474, making up 51.4%).
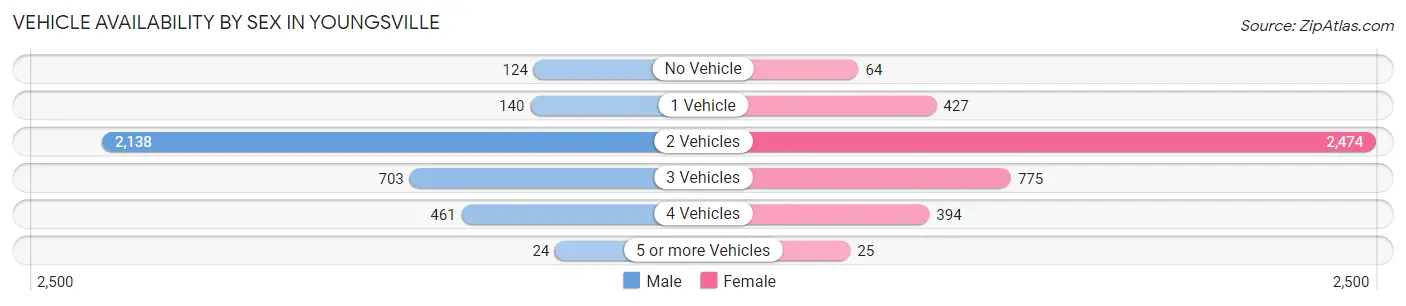
| Vehicles Available | Male | Female |
| No Vehicle | 124 (3.5%) | 64 (1.5%) |
| 1 Vehicle | 140 (3.9%) | 427 (10.3%) |
| 2 Vehicles | 2,138 (59.6%) | 2,474 (59.5%) |
| 3 Vehicles | 703 (19.6%) | 775 (18.6%) |
| 4 Vehicles | 461 (12.8%) | 394 (9.5%) |
| 5 or more Vehicles | 24 (0.7%) | 25 (0.6%) |
| Total | 3,590 (100.0%) | 4,159 (100.0%) |
Commute Time in Youngsville
The most frequently occuring commute durations in Youngsville are 15 to 19 minutes (1,624 commuters, 22.8%), 30 to 34 minutes (1,439 commuters, 20.2%), and 10 to 14 minutes (923 commuters, 13.0%).
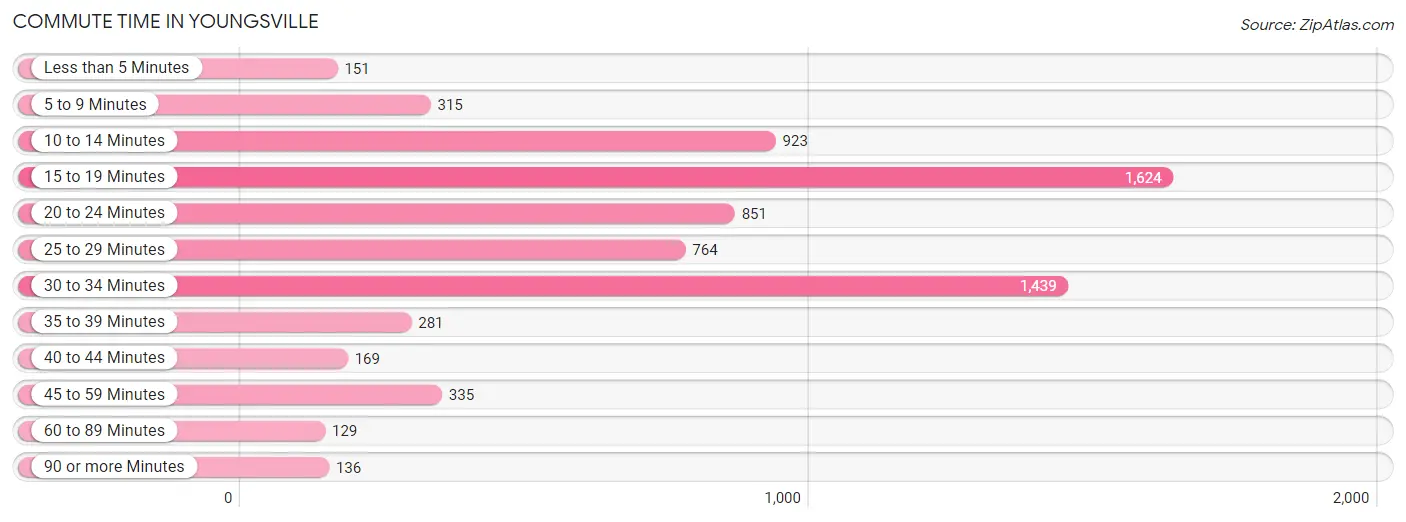
| Commute Time | # Commuters | % Commuters |
| Less than 5 Minutes | 151 | 2.1% |
| 5 to 9 Minutes | 315 | 4.4% |
| 10 to 14 Minutes | 923 | 13.0% |
| 15 to 19 Minutes | 1,624 | 22.8% |
| 20 to 24 Minutes | 851 | 12.0% |
| 25 to 29 Minutes | 764 | 10.7% |
| 30 to 34 Minutes | 1,439 | 20.2% |
| 35 to 39 Minutes | 281 | 4.0% |
| 40 to 44 Minutes | 169 | 2.4% |
| 45 to 59 Minutes | 335 | 4.7% |
| 60 to 89 Minutes | 129 | 1.8% |
| 90 or more Minutes | 136 | 1.9% |
Commute Time by Sex in Youngsville
The most common commute times in Youngsville are 15 to 19 minutes (1,252 commuters, 36.1%) for males and 30 to 34 minutes (981 commuters, 26.9%) for females.
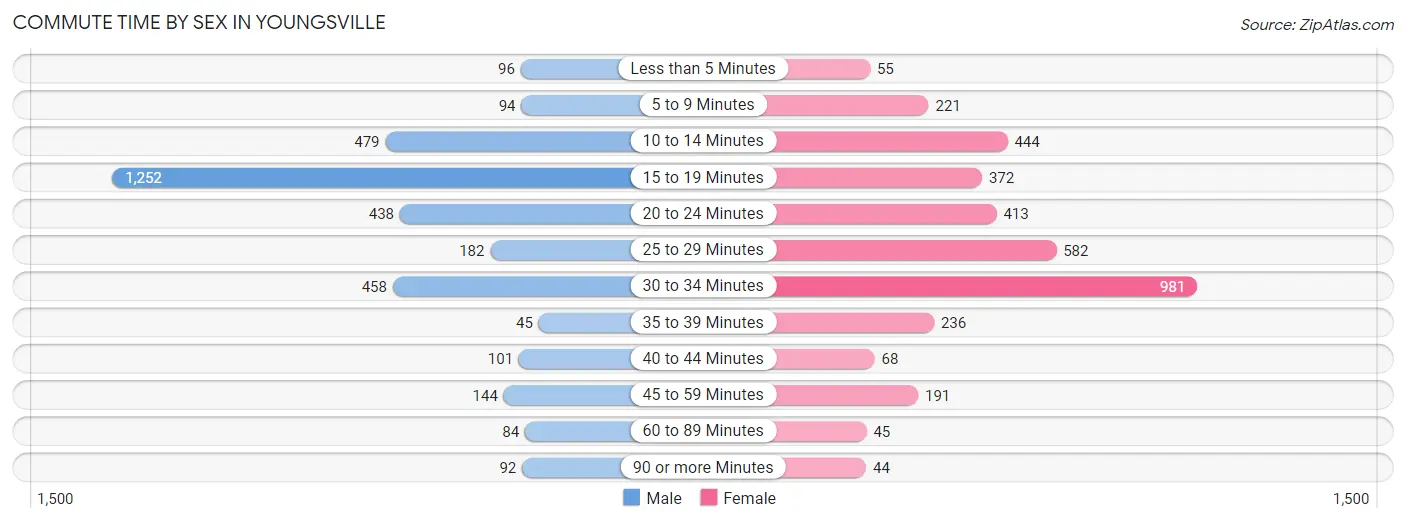
| Commute Time | Male | Female |
| Less than 5 Minutes | 96 (2.8%) | 55 (1.5%) |
| 5 to 9 Minutes | 94 (2.7%) | 221 (6.0%) |
| 10 to 14 Minutes | 479 (13.8%) | 444 (12.2%) |
| 15 to 19 Minutes | 1,252 (36.1%) | 372 (10.2%) |
| 20 to 24 Minutes | 438 (12.6%) | 413 (11.3%) |
| 25 to 29 Minutes | 182 (5.2%) | 582 (15.9%) |
| 30 to 34 Minutes | 458 (13.2%) | 981 (26.9%) |
| 35 to 39 Minutes | 45 (1.3%) | 236 (6.5%) |
| 40 to 44 Minutes | 101 (2.9%) | 68 (1.9%) |
| 45 to 59 Minutes | 144 (4.2%) | 191 (5.2%) |
| 60 to 89 Minutes | 84 (2.4%) | 45 (1.2%) |
| 90 or more Minutes | 92 (2.7%) | 44 (1.2%) |
Time of Departure to Work by Sex in Youngsville
The most frequent times of departure to work in Youngsville are 6:30 AM to 6:59 AM (761, 22.0%) for males and 7:00 AM to 7:29 AM (779, 21.3%) for females.
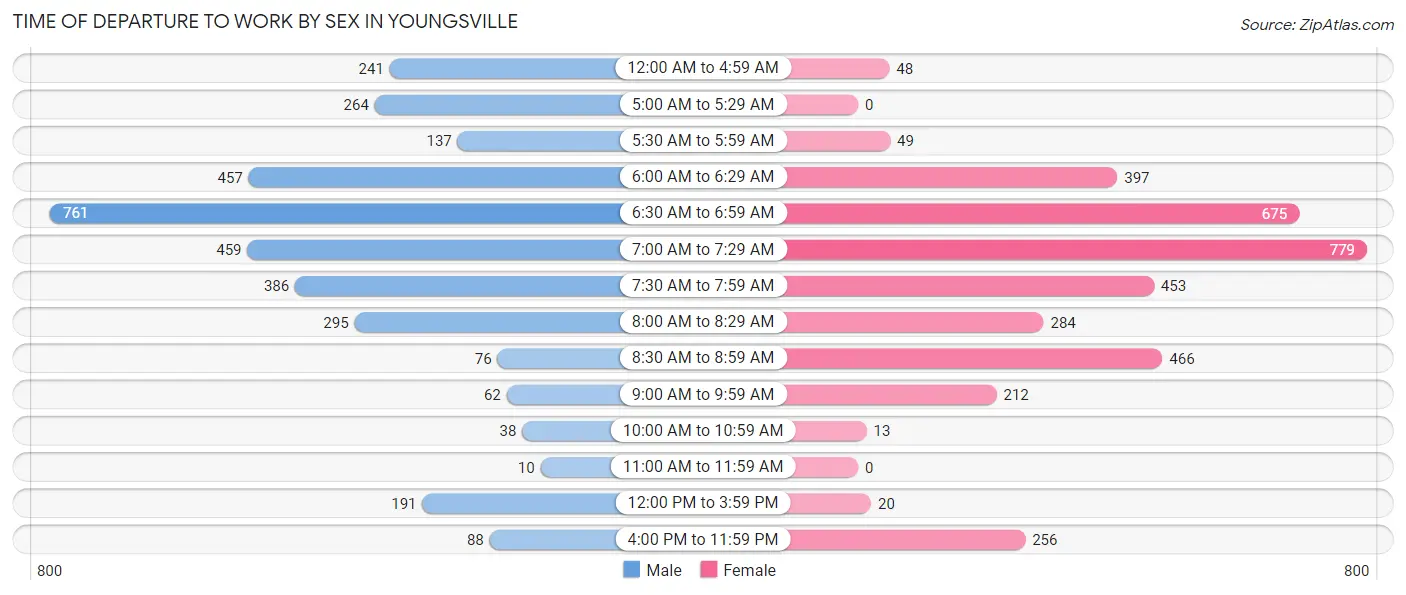
| Time of Departure | Male | Female |
| 12:00 AM to 4:59 AM | 241 (7.0%) | 48 (1.3%) |
| 5:00 AM to 5:29 AM | 264 (7.6%) | 0 (0.0%) |
| 5:30 AM to 5:59 AM | 137 (4.0%) | 49 (1.3%) |
| 6:00 AM to 6:29 AM | 457 (13.2%) | 397 (10.9%) |
| 6:30 AM to 6:59 AM | 761 (22.0%) | 675 (18.5%) |
| 7:00 AM to 7:29 AM | 459 (13.3%) | 779 (21.3%) |
| 7:30 AM to 7:59 AM | 386 (11.1%) | 453 (12.4%) |
| 8:00 AM to 8:29 AM | 295 (8.5%) | 284 (7.8%) |
| 8:30 AM to 8:59 AM | 76 (2.2%) | 466 (12.8%) |
| 9:00 AM to 9:59 AM | 62 (1.8%) | 212 (5.8%) |
| 10:00 AM to 10:59 AM | 38 (1.1%) | 13 (0.4%) |
| 11:00 AM to 11:59 AM | 10 (0.3%) | 0 (0.0%) |
| 12:00 PM to 3:59 PM | 191 (5.5%) | 20 (0.5%) |
| 4:00 PM to 11:59 PM | 88 (2.5%) | 256 (7.0%) |
| Total | 3,465 (100.0%) | 3,652 (100.0%) |
Housing Occupancy in Youngsville
Occupancy by Ownership in Youngsville
Of the total 5,241 dwellings in Youngsville, owner-occupied units account for 4,609 (87.9%), while renter-occupied units make up 632 (12.1%).
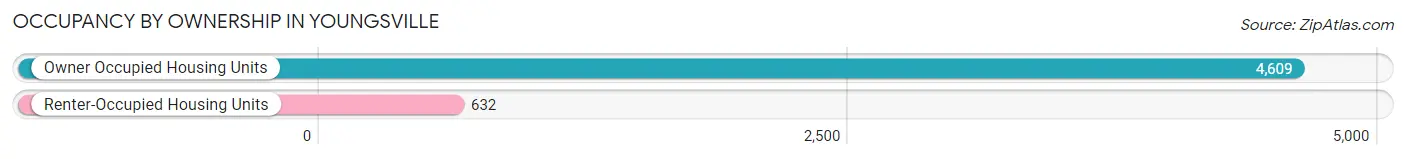
| Occupancy | # Housing Units | % Housing Units |
| Owner Occupied Housing Units | 4,609 | 87.9% |
| Renter-Occupied Housing Units | 632 | 12.1% |
| Total Occupied Housing Units | 5,241 | 100.0% |
Occupancy by Household Size in Youngsville
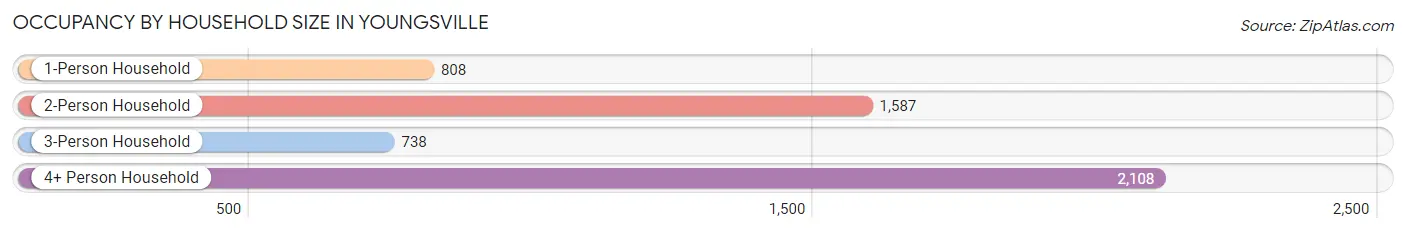
| Household Size | # Housing Units | % Housing Units |
| 1-Person Household | 808 | 15.4% |
| 2-Person Household | 1,587 | 30.3% |
| 3-Person Household | 738 | 14.1% |
| 4+ Person Household | 2,108 | 40.2% |
| Total Housing Units | 5,241 | 100.0% |
Occupancy by Ownership by Household Size in Youngsville
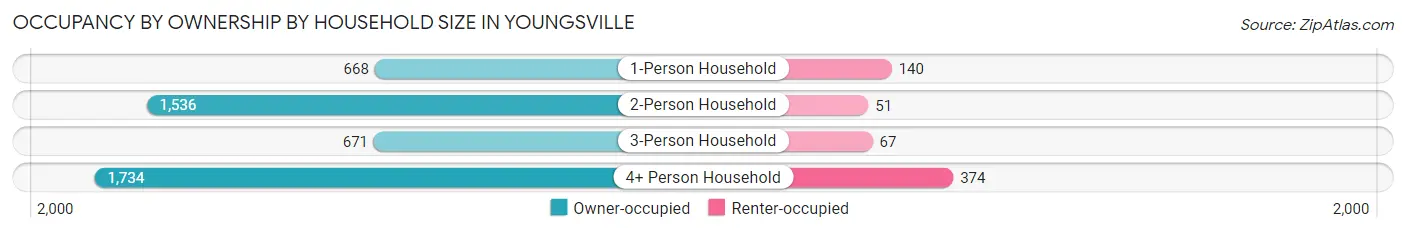
| Household Size | Owner-occupied | Renter-occupied |
| 1-Person Household | 668 (82.7%) | 140 (17.3%) |
| 2-Person Household | 1,536 (96.8%) | 51 (3.2%) |
| 3-Person Household | 671 (90.9%) | 67 (9.1%) |
| 4+ Person Household | 1,734 (82.3%) | 374 (17.7%) |
| Total Housing Units | 4,609 (87.9%) | 632 (12.1%) |
Occupancy by Educational Attainment in Youngsville
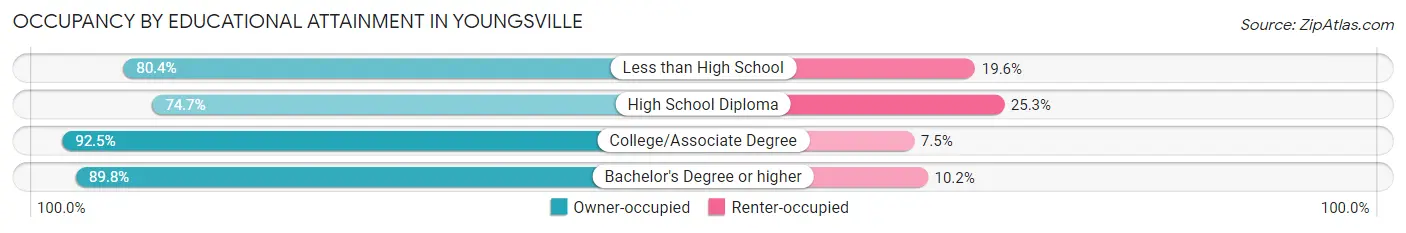
| Household Size | Owner-occupied | Renter-occupied |
| Less than High School | 300 (80.4%) | 73 (19.6%) |
| High School Diploma | 575 (74.7%) | 195 (25.3%) |
| College/Associate Degree | 1,819 (92.5%) | 147 (7.5%) |
| Bachelor's Degree or higher | 1,915 (89.8%) | 217 (10.2%) |
Occupancy by Age of Householder in Youngsville
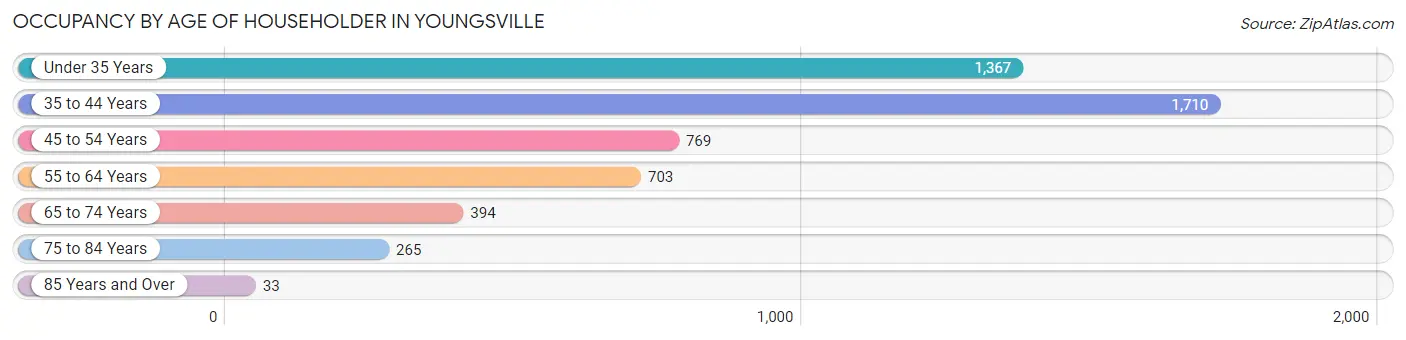
| Age Bracket | # Households | % Households |
| Under 35 Years | 1,367 | 26.1% |
| 35 to 44 Years | 1,710 | 32.6% |
| 45 to 54 Years | 769 | 14.7% |
| 55 to 64 Years | 703 | 13.4% |
| 65 to 74 Years | 394 | 7.5% |
| 75 to 84 Years | 265 | 5.1% |
| 85 Years and Over | 33 | 0.6% |
| Total | 5,241 | 100.0% |
Housing Finances in Youngsville
Median Income by Occupancy in Youngsville
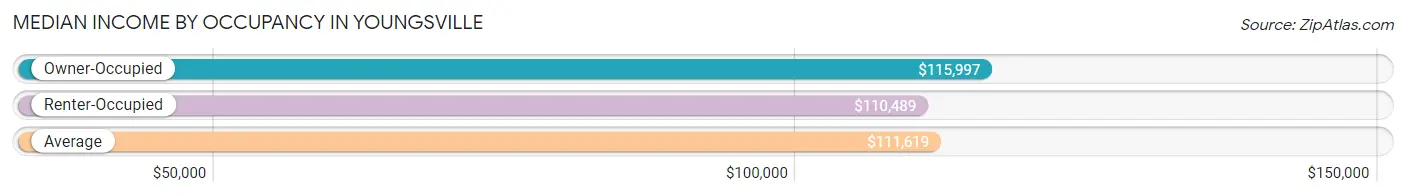
| Occupancy Type | # Households | Median Income |
| Owner-Occupied | 4,609 (87.9%) | $115,997 |
| Renter-Occupied | 632 (12.1%) | $110,489 |
| Average | 5,241 (100.0%) | $111,619 |
Occupancy by Householder Income Bracket in Youngsville
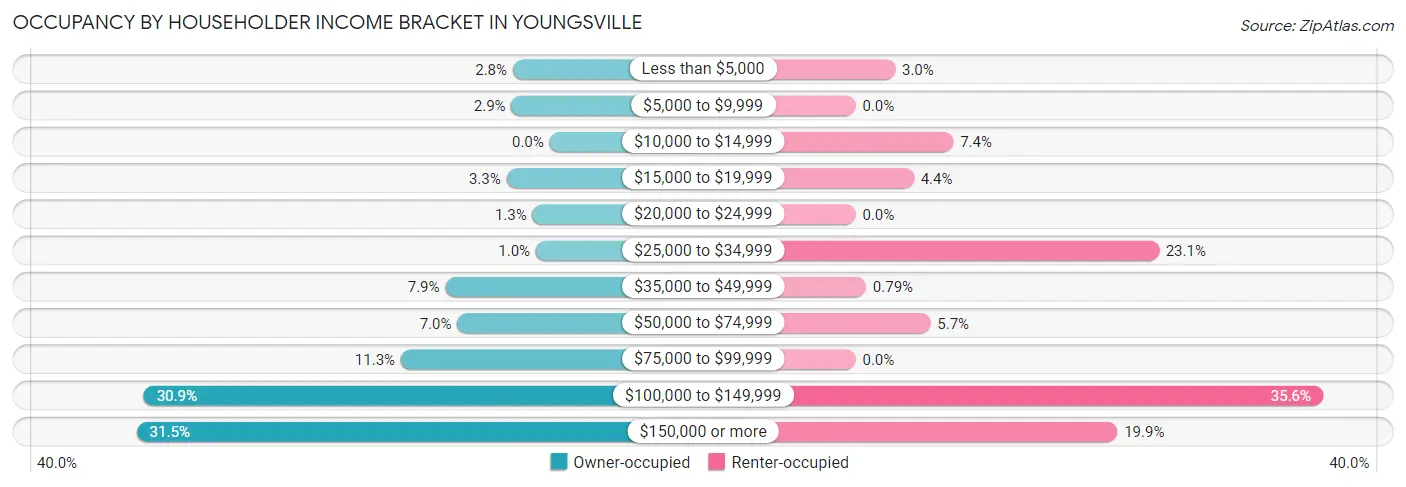
| Income Bracket | Owner-occupied | Renter-occupied |
| Less than $5,000 | 129 (2.8%) | 19 (3.0%) |
| $5,000 to $9,999 | 134 (2.9%) | 0 (0.0%) |
| $10,000 to $14,999 | 0 (0.0%) | 47 (7.4%) |
| $15,000 to $19,999 | 151 (3.3%) | 28 (4.4%) |
| $20,000 to $24,999 | 60 (1.3%) | 0 (0.0%) |
| $25,000 to $34,999 | 48 (1.0%) | 146 (23.1%) |
| $35,000 to $49,999 | 366 (7.9%) | 5 (0.8%) |
| $50,000 to $74,999 | 324 (7.0%) | 36 (5.7%) |
| $75,000 to $99,999 | 522 (11.3%) | 0 (0.0%) |
| $100,000 to $149,999 | 1,425 (30.9%) | 225 (35.6%) |
| $150,000 or more | 1,450 (31.5%) | 126 (19.9%) |
| Total | 4,609 (100.0%) | 632 (100.0%) |
Monthly Housing Cost Tiers in Youngsville
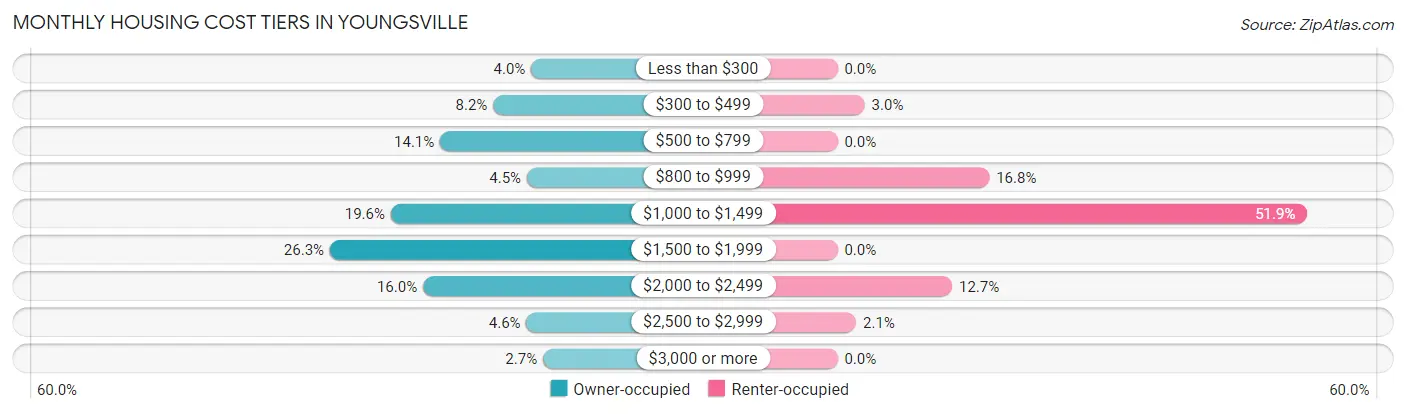
| Monthly Cost | Owner-occupied | Renter-occupied |
| Less than $300 | 186 (4.0%) | 0 (0.0%) |
| $300 to $499 | 380 (8.2%) | 19 (3.0%) |
| $500 to $799 | 650 (14.1%) | 0 (0.0%) |
| $800 to $999 | 208 (4.5%) | 106 (16.8%) |
| $1,000 to $1,499 | 901 (19.6%) | 328 (51.9%) |
| $1,500 to $1,999 | 1,211 (26.3%) | 0 (0.0%) |
| $2,000 to $2,499 | 737 (16.0%) | 80 (12.7%) |
| $2,500 to $2,999 | 210 (4.6%) | 13 (2.1%) |
| $3,000 or more | 126 (2.7%) | 0 (0.0%) |
| Total | 4,609 (100.0%) | 632 (100.0%) |
Physical Housing Characteristics in Youngsville
Housing Structures in Youngsville
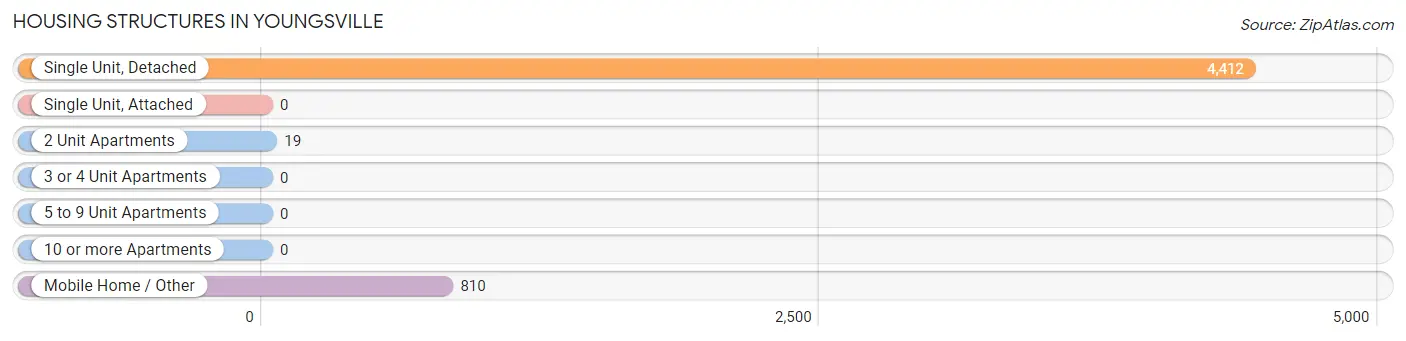
| Structure Type | # Housing Units | % Housing Units |
| Single Unit, Detached | 4,412 | 84.2% |
| Single Unit, Attached | 0 | 0.0% |
| 2 Unit Apartments | 19 | 0.4% |
| 3 or 4 Unit Apartments | 0 | 0.0% |
| 5 to 9 Unit Apartments | 0 | 0.0% |
| 10 or more Apartments | 0 | 0.0% |
| Mobile Home / Other | 810 | 15.5% |
| Total | 5,241 | 100.0% |
Housing Structures by Occupancy in Youngsville
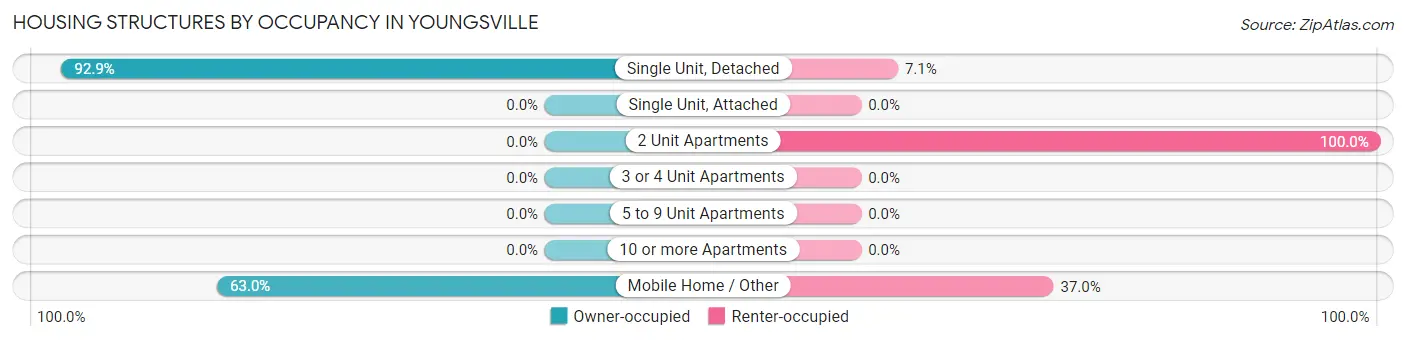
| Structure Type | Owner-occupied | Renter-occupied |
| Single Unit, Detached | 4,099 (92.9%) | 313 (7.1%) |
| Single Unit, Attached | 0 (0.0%) | 0 (0.0%) |
| 2 Unit Apartments | 0 (0.0%) | 19 (100.0%) |
| 3 or 4 Unit Apartments | 0 (0.0%) | 0 (0.0%) |
| 5 to 9 Unit Apartments | 0 (0.0%) | 0 (0.0%) |
| 10 or more Apartments | 0 (0.0%) | 0 (0.0%) |
| Mobile Home / Other | 510 (63.0%) | 300 (37.0%) |
| Total | 4,609 (87.9%) | 632 (12.1%) |
Housing Structures by Number of Rooms in Youngsville
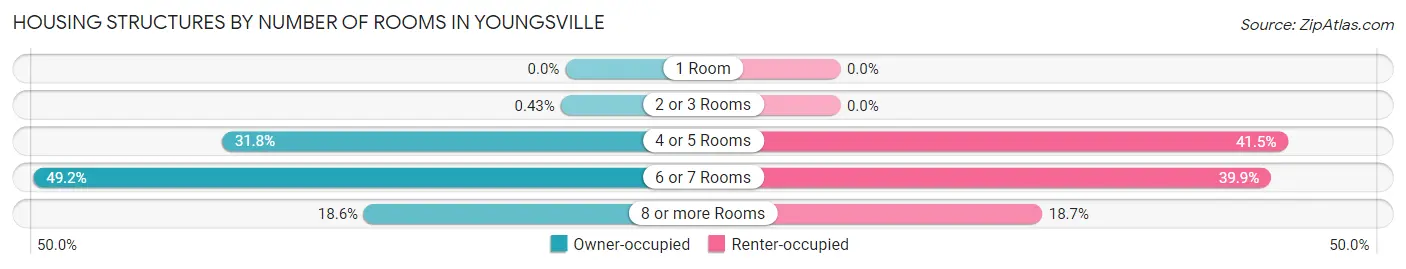
| Number of Rooms | Owner-occupied | Renter-occupied |
| 1 Room | 0 (0.0%) | 0 (0.0%) |
| 2 or 3 Rooms | 20 (0.4%) | 0 (0.0%) |
| 4 or 5 Rooms | 1,464 (31.8%) | 262 (41.5%) |
| 6 or 7 Rooms | 2,267 (49.2%) | 252 (39.9%) |
| 8 or more Rooms | 858 (18.6%) | 118 (18.7%) |
| Total | 4,609 (100.0%) | 632 (100.0%) |
Housing Structure by Heating Type in Youngsville
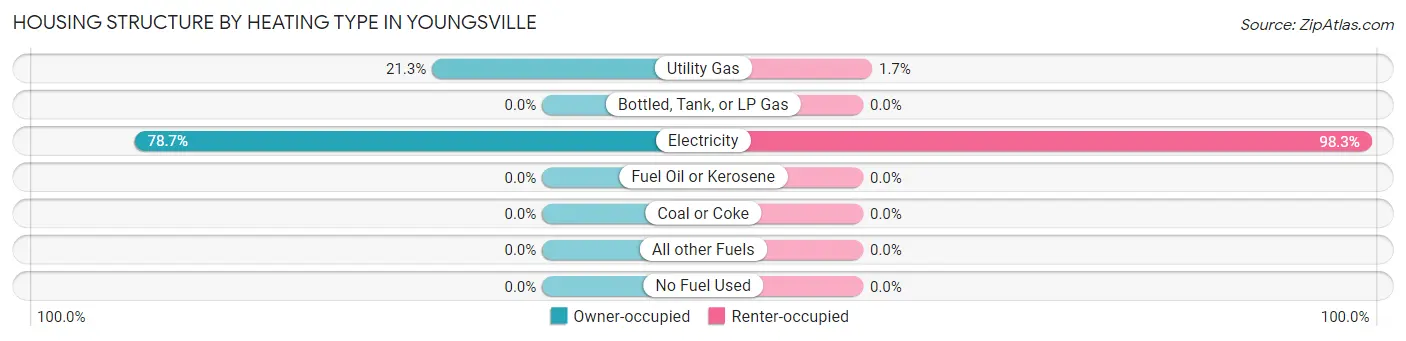
| Heating Type | Owner-occupied | Renter-occupied |
| Utility Gas | 980 (21.3%) | 11 (1.7%) |
| Bottled, Tank, or LP Gas | 0 (0.0%) | 0 (0.0%) |
| Electricity | 3,629 (78.7%) | 621 (98.3%) |
| Fuel Oil or Kerosene | 0 (0.0%) | 0 (0.0%) |
| Coal or Coke | 0 (0.0%) | 0 (0.0%) |
| All other Fuels | 0 (0.0%) | 0 (0.0%) |
| No Fuel Used | 0 (0.0%) | 0 (0.0%) |
| Total | 4,609 (100.0%) | 632 (100.0%) |
Household Vehicle Usage in Youngsville
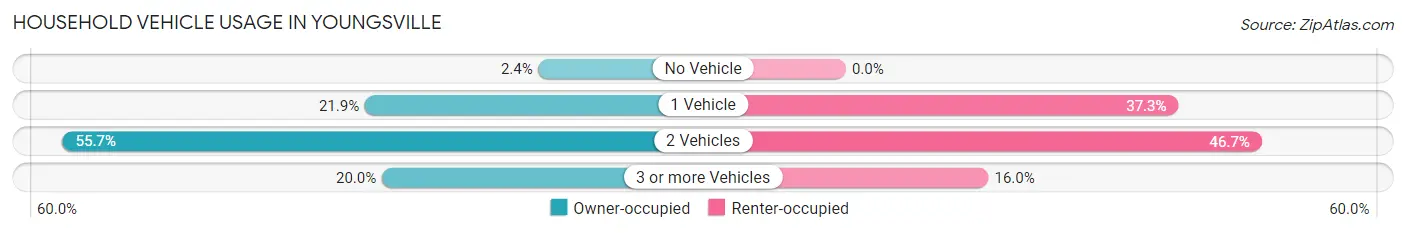
| Vehicles per Household | Owner-occupied | Renter-occupied |
| No Vehicle | 112 (2.4%) | 0 (0.0%) |
| 1 Vehicle | 1,008 (21.9%) | 236 (37.3%) |
| 2 Vehicles | 2,569 (55.7%) | 295 (46.7%) |
| 3 or more Vehicles | 920 (20.0%) | 101 (16.0%) |
| Total | 4,609 (100.0%) | 632 (100.0%) |
Real Estate & Mortgages in Youngsville
Real Estate and Mortgage Overview in Youngsville
| Characteristic | Without Mortgage | With Mortgage |
| Housing Units | 1,271 | 3,338 |
| Median Property Value | $266,100 | $247,700 |
| Median Household Income | $87,563 | $1,108 |
| Monthly Housing Costs | $537 | $113 |
| Real Estate Taxes | $1,996 | $204 |
Property Value by Mortgage Status in Youngsville
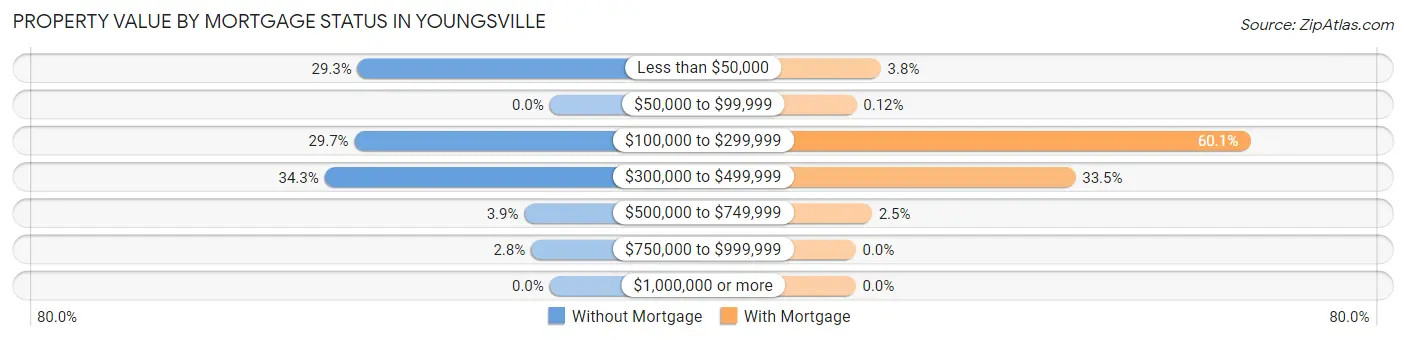
| Property Value | Without Mortgage | With Mortgage |
| Less than $50,000 | 372 (29.3%) | 128 (3.8%) |
| $50,000 to $99,999 | 0 (0.0%) | 4 (0.1%) |
| $100,000 to $299,999 | 378 (29.7%) | 2,006 (60.1%) |
| $300,000 to $499,999 | 436 (34.3%) | 1,118 (33.5%) |
| $500,000 to $749,999 | 49 (3.9%) | 82 (2.5%) |
| $750,000 to $999,999 | 36 (2.8%) | 0 (0.0%) |
| $1,000,000 or more | 0 (0.0%) | 0 (0.0%) |
| Total | 1,271 (100.0%) | 3,338 (100.0%) |
Household Income by Mortgage Status in Youngsville
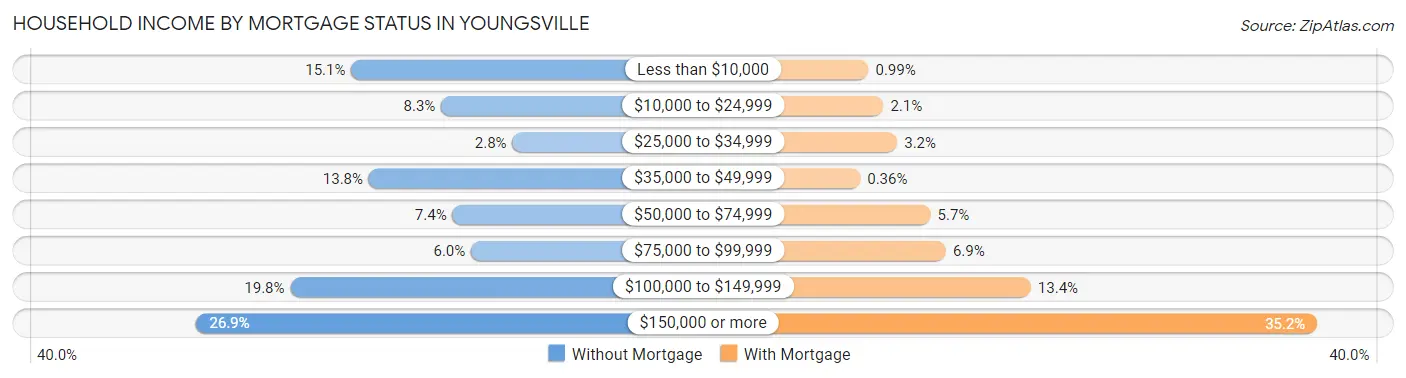
| Household Income | Without Mortgage | With Mortgage |
| Less than $10,000 | 192 (15.1%) | 33 (1.0%) |
| $10,000 to $24,999 | 105 (8.3%) | 71 (2.1%) |
| $25,000 to $34,999 | 36 (2.8%) | 106 (3.2%) |
| $35,000 to $49,999 | 175 (13.8%) | 12 (0.4%) |
| $50,000 to $74,999 | 94 (7.4%) | 191 (5.7%) |
| $75,000 to $99,999 | 76 (6.0%) | 230 (6.9%) |
| $100,000 to $149,999 | 251 (19.8%) | 446 (13.4%) |
| $150,000 or more | 342 (26.9%) | 1,174 (35.2%) |
| Total | 1,271 (100.0%) | 3,338 (100.0%) |
Property Value to Household Income Ratio in Youngsville
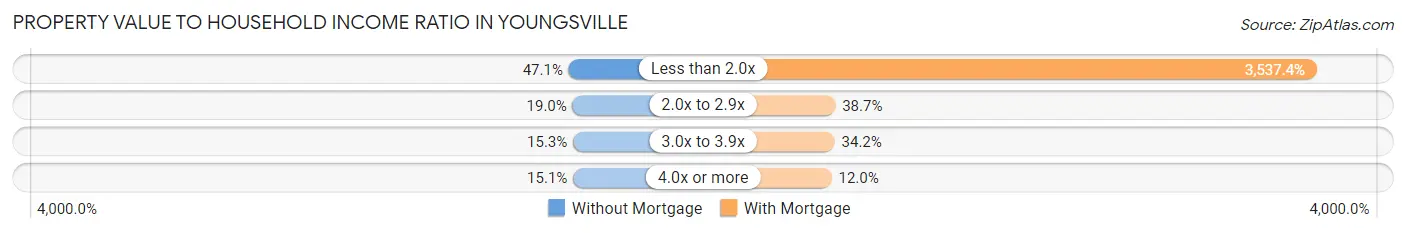
| Value-to-Income Ratio | Without Mortgage | With Mortgage |
| Less than 2.0x | 599 (47.1%) | 118,077 (3,537.4%) |
| 2.0x to 2.9x | 241 (19.0%) | 1,290 (38.7%) |
| 3.0x to 3.9x | 194 (15.3%) | 1,140 (34.2%) |
| 4.0x or more | 192 (15.1%) | 399 (11.9%) |
| Total | 1,271 (100.0%) | 3,338 (100.0%) |
Real Estate Taxes by Mortgage Status in Youngsville
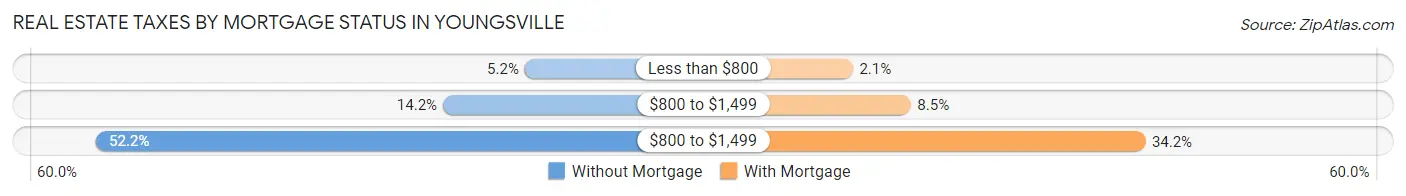
| Property Taxes | Without Mortgage | With Mortgage |
| Less than $800 | 66 (5.2%) | 71 (2.1%) |
| $800 to $1,499 | 180 (14.2%) | 283 (8.5%) |
| $800 to $1,499 | 663 (52.2%) | 1,141 (34.2%) |
| Total | 1,271 (100.0%) | 3,338 (100.0%) |
Health & Disability in Youngsville
Health Insurance Coverage by Age in Youngsville
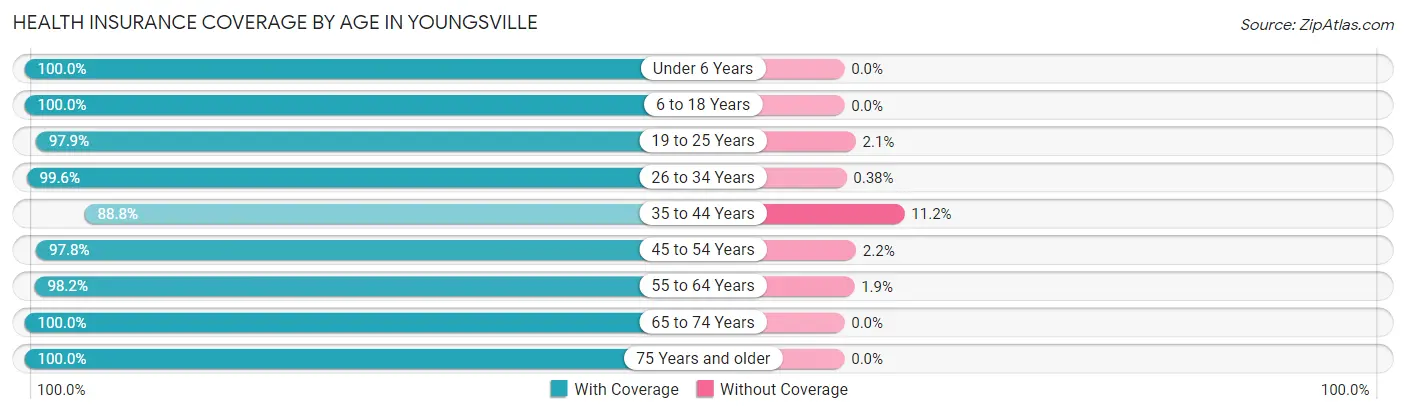
| Age Bracket | With Coverage | Without Coverage |
| Under 6 Years | 1,430 (100.0%) | 0 (0.0%) |
| 6 to 18 Years | 4,114 (100.0%) | 0 (0.0%) |
| 19 to 25 Years | 511 (97.9%) | 11 (2.1%) |
| 26 to 34 Years | 2,639 (99.6%) | 10 (0.4%) |
| 35 to 44 Years | 2,597 (88.8%) | 328 (11.2%) |
| 45 to 54 Years | 1,633 (97.8%) | 36 (2.2%) |
| 55 to 64 Years | 1,168 (98.2%) | 22 (1.8%) |
| 65 to 74 Years | 969 (100.0%) | 0 (0.0%) |
| 75 Years and older | 419 (100.0%) | 0 (0.0%) |
| Total | 15,480 (97.4%) | 407 (2.6%) |
Health Insurance Coverage by Citizenship Status in Youngsville
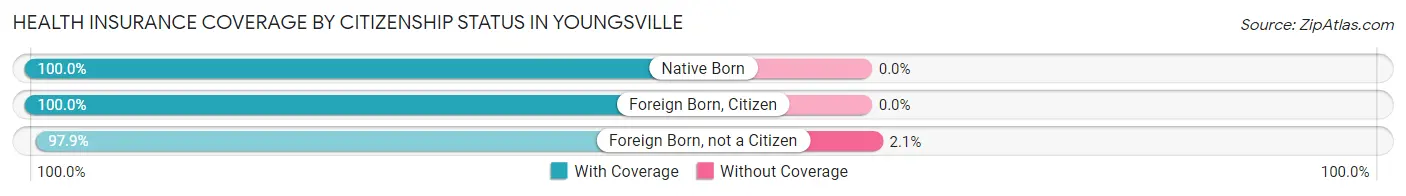
| Citizenship Status | With Coverage | Without Coverage |
| Native Born | 1,430 (100.0%) | 0 (0.0%) |
| Foreign Born, Citizen | 4,114 (100.0%) | 0 (0.0%) |
| Foreign Born, not a Citizen | 511 (97.9%) | 11 (2.1%) |
Health Insurance Coverage by Household Income in Youngsville
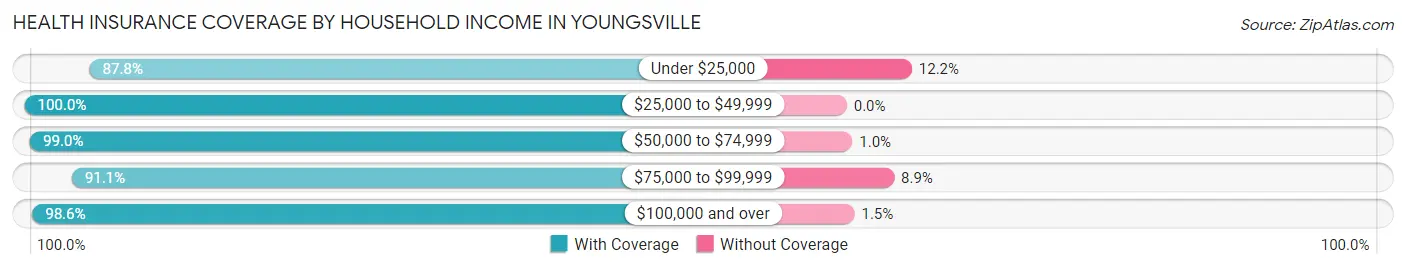
| Household Income | With Coverage | Without Coverage |
| Under $25,000 | 605 (87.8%) | 84 (12.2%) |
| $25,000 to $49,999 | 1,587 (100.0%) | 0 (0.0%) |
| $50,000 to $74,999 | 956 (99.0%) | 10 (1.0%) |
| $75,000 to $99,999 | 1,594 (91.1%) | 155 (8.9%) |
| $100,000 and over | 10,737 (98.6%) | 158 (1.5%) |
Public vs Private Health Insurance Coverage by Age in Youngsville
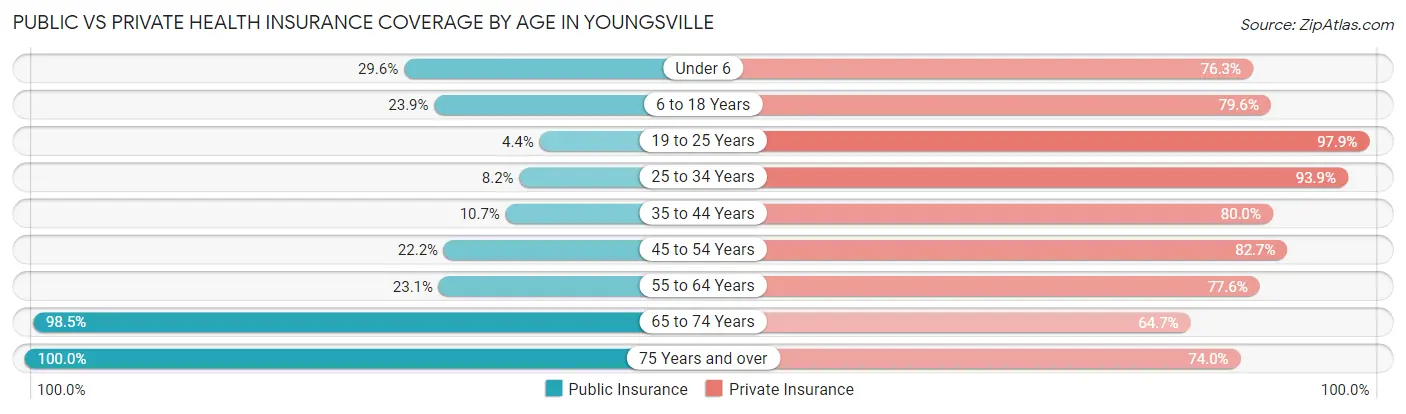
| Age Bracket | Public Insurance | Private Insurance |
| Under 6 | 423 (29.6%) | 1,091 (76.3%) |
| 6 to 18 Years | 985 (23.9%) | 3,275 (79.6%) |
| 19 to 25 Years | 23 (4.4%) | 511 (97.9%) |
| 25 to 34 Years | 216 (8.2%) | 2,488 (93.9%) |
| 35 to 44 Years | 313 (10.7%) | 2,340 (80.0%) |
| 45 to 54 Years | 370 (22.2%) | 1,380 (82.7%) |
| 55 to 64 Years | 275 (23.1%) | 923 (77.6%) |
| 65 to 74 Years | 954 (98.5%) | 627 (64.7%) |
| 75 Years and over | 419 (100.0%) | 310 (74.0%) |
| Total | 3,978 (25.0%) | 12,945 (81.5%) |
Disability Status by Sex by Age in Youngsville
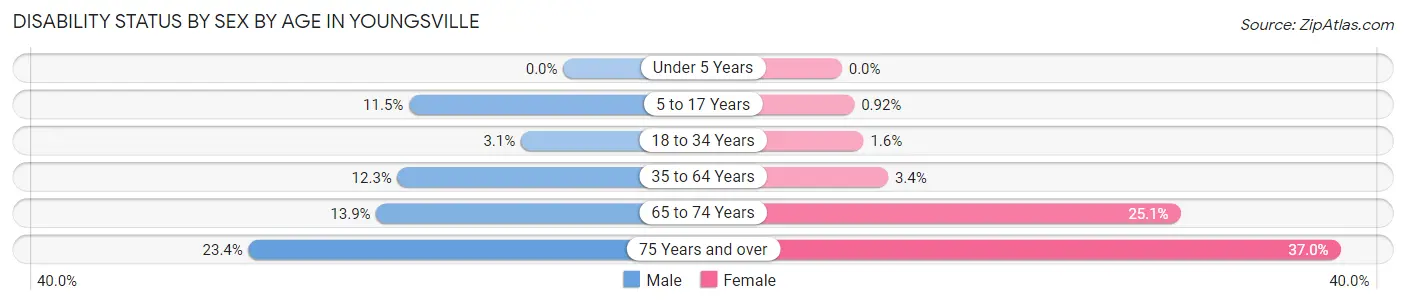
| Age Bracket | Male | Female |
| Under 5 Years | 0 (0.0%) | 0 (0.0%) |
| 5 to 17 Years | 235 (11.5%) | 21 (0.9%) |
| 18 to 34 Years | 46 (3.1%) | 28 (1.6%) |
| 35 to 64 Years | 313 (12.3%) | 111 (3.4%) |
| 65 to 74 Years | 34 (13.9%) | 182 (25.1%) |
| 75 Years and over | 43 (23.4%) | 87 (37.0%) |
Disability Class by Sex by Age in Youngsville
Disability Class: Hearing Difficulty
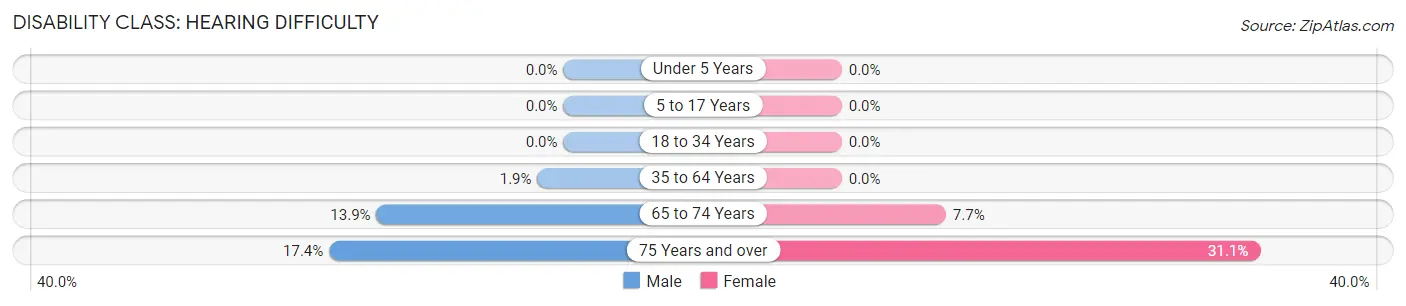
| Age Bracket | Male | Female |
| Under 5 Years | 0 (0.0%) | 0 (0.0%) |
| 5 to 17 Years | 0 (0.0%) | 0 (0.0%) |
| 18 to 34 Years | 0 (0.0%) | 0 (0.0%) |
| 35 to 64 Years | 49 (1.9%) | 0 (0.0%) |
| 65 to 74 Years | 34 (13.9%) | 56 (7.7%) |
| 75 Years and over | 32 (17.4%) | 73 (31.1%) |
Disability Class: Vision Difficulty
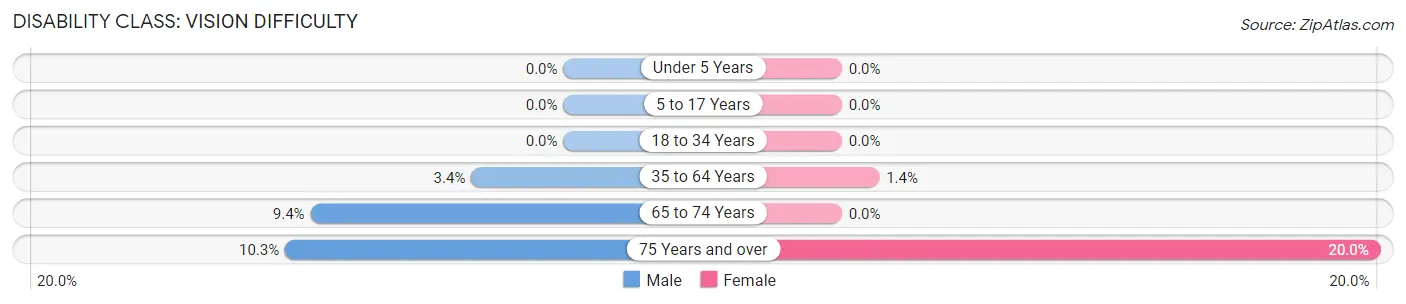
| Age Bracket | Male | Female |
| Under 5 Years | 0 (0.0%) | 0 (0.0%) |
| 5 to 17 Years | 0 (0.0%) | 0 (0.0%) |
| 18 to 34 Years | 0 (0.0%) | 0 (0.0%) |
| 35 to 64 Years | 87 (3.4%) | 45 (1.4%) |
| 65 to 74 Years | 23 (9.4%) | 0 (0.0%) |
| 75 Years and over | 19 (10.3%) | 47 (20.0%) |
Disability Class: Cognitive Difficulty
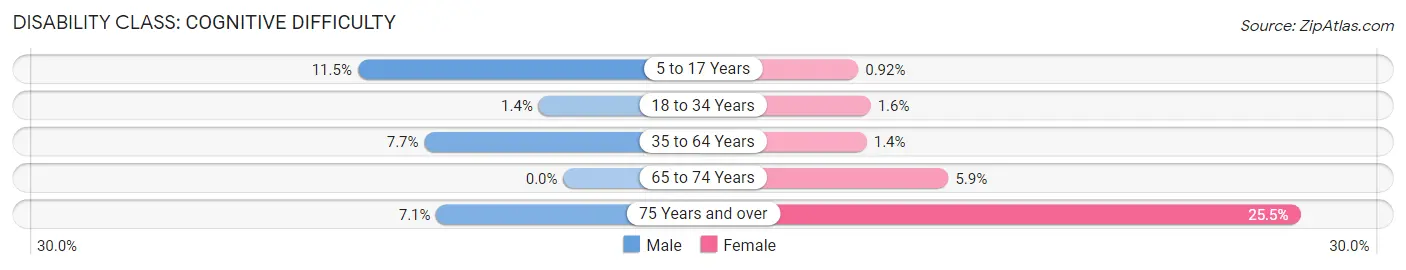
| Age Bracket | Male | Female |
| 5 to 17 Years | 235 (11.5%) | 21 (0.9%) |
| 18 to 34 Years | 20 (1.4%) | 28 (1.6%) |
| 35 to 64 Years | 197 (7.7%) | 45 (1.4%) |
| 65 to 74 Years | 0 (0.0%) | 43 (5.9%) |
| 75 Years and over | 13 (7.1%) | 60 (25.5%) |
Disability Class: Ambulatory Difficulty
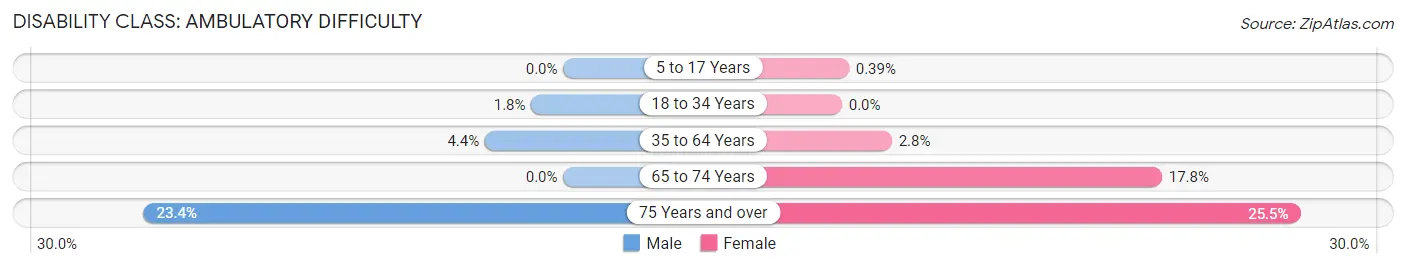
| Age Bracket | Male | Female |
| 5 to 17 Years | 0 (0.0%) | 9 (0.4%) |
| 18 to 34 Years | 26 (1.8%) | 0 (0.0%) |
| 35 to 64 Years | 111 (4.4%) | 90 (2.8%) |
| 65 to 74 Years | 0 (0.0%) | 129 (17.8%) |
| 75 Years and over | 43 (23.4%) | 60 (25.5%) |
Disability Class: Self-Care Difficulty
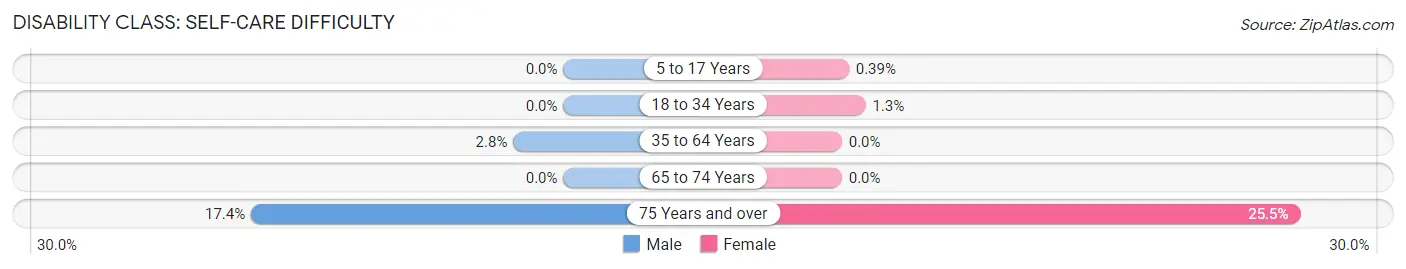
| Age Bracket | Male | Female |
| 5 to 17 Years | 0 (0.0%) | 9 (0.4%) |
| 18 to 34 Years | 0 (0.0%) | 23 (1.3%) |
| 35 to 64 Years | 71 (2.8%) | 0 (0.0%) |
| 65 to 74 Years | 0 (0.0%) | 0 (0.0%) |
| 75 Years and over | 32 (17.4%) | 60 (25.5%) |
Technology Access in Youngsville
Computing Device Access in Youngsville
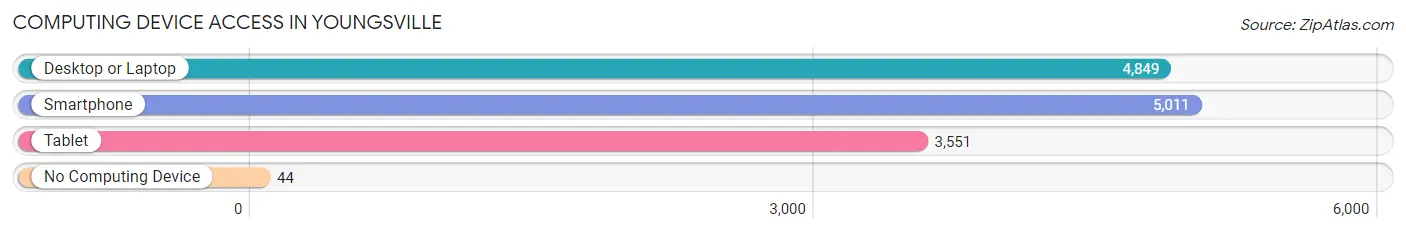
| Device Type | # Households | % Households |
| Desktop or Laptop | 4,849 | 92.5% |
| Smartphone | 5,011 | 95.6% |
| Tablet | 3,551 | 67.7% |
| No Computing Device | 44 | 0.8% |
| Total | 5,241 | 100.0% |
Internet Access in Youngsville
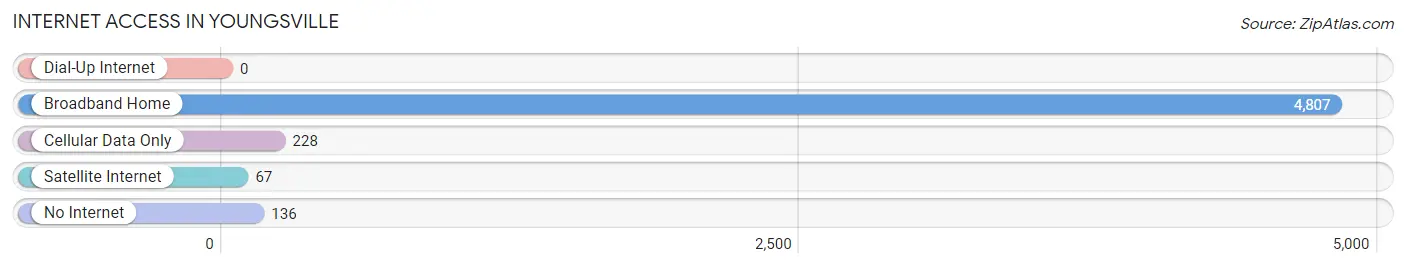
| Internet Type | # Households | % Households |
| Dial-Up Internet | 0 | 0.0% |
| Broadband Home | 4,807 | 91.7% |
| Cellular Data Only | 228 | 4.3% |
| Satellite Internet | 67 | 1.3% |
| No Internet | 136 | 2.6% |
| Total | 5,241 | 100.0% |
Youngsville Summary
Youngsville, Louisiana is a small city located in Lafayette Parish, Louisiana. It is situated in the heart of Cajun Country, and is part of the Lafayette Metropolitan Statistical Area. The city has a population of approximately 11,000 people, and is known for its strong sense of community and family values.
History
Youngsville was founded in 1883 by William Young, a former Confederate soldier. He named the town after himself, and it quickly became a thriving agricultural center. The town was incorporated in 1906, and the first mayor was elected in 1907.
In the early 1900s, the town was home to a number of businesses, including a cotton gin, a sawmill, and a general store. The town also had a post office, a bank, and a hotel.
In the 1950s, the town began to experience a population boom, as many people moved to the area to take advantage of the booming oil industry. This influx of people led to the construction of new homes and businesses, and the population of Youngsville continued to grow.
Geography
Youngsville is located in the heart of Cajun Country, and is situated in the Lafayette Metropolitan Statistical Area. The city is located in the southwestern part of Lafayette Parish, and is bordered by the cities of Lafayette, Broussard, and Scott.
The city is situated on the banks of the Vermilion River, and is surrounded by rolling hills and lush forests. The climate in Youngsville is humid subtropical, with hot summers and mild winters.
Economy
Youngsville’s economy is largely based on the oil and gas industry, as well as agriculture. The city is home to a number of oil and gas companies, as well as several agricultural businesses.
The city is also home to a number of retail stores, restaurants, and other businesses. The city is also home to a number of manufacturing companies, including a paper mill and a plastics plant.
Demographics
As of the 2010 census, the population of Youngsville was 11,099. The racial makeup of the city was 79.3% White, 15.2% African American, 0.4% Native American, 1.2% Asian, 0.1% Pacific Islander, and 3.8% from other races.
The median household income in Youngsville was $50,945, and the median family income was $60,945. The per capita income was $25,945. The poverty rate was 11.3%.
Conclusion
Youngsville, Louisiana is a small city located in Lafayette Parish, Louisiana. It is situated in the heart of Cajun Country, and is part of the Lafayette Metropolitan Statistical Area. The city has a population of approximately 11,000 people, and is known for its strong sense of community and family values. The economy of Youngsville is largely based on the oil and gas industry, as well as agriculture. The city is also home to a number of retail stores, restaurants, and other businesses. The racial makeup of the city is 79.3% White, 15.2% African American, 0.4% Native American, 1.2% Asian, 0.1% Pacific Islander, and 3.8% from other races. The median household income in Youngsville was $50,945, and the median family income was $60,945. The per capita income was $25,945. The poverty rate was 11.3%.
Common Questions
What is Per Capita Income in Youngsville?
Per Capita income in Youngsville is $40,000.
What is the Median Family Income in Youngsville?
Median Family Income in Youngsville is $118,410.
What is the Median Household income in Youngsville?
Median Household Income in Youngsville is $111,619.
What is Income or Wage Gap in Youngsville?
Income or Wage Gap in Youngsville is 35.9%.
Women in Youngsville earn 64.1 cents for every dollar earned by a man.
What is Inequality or Gini Index in Youngsville?
Inequality or Gini Index in Youngsville is 0.35.
What is the Total Population of Youngsville?
Total Population of Youngsville is 15,990.
What is the Total Male Population of Youngsville?
Total Male Population of Youngsville is 7,080.
What is the Total Female Population of Youngsville?
Total Female Population of Youngsville is 8,910.
What is the Ratio of Males per 100 Females in Youngsville?
There are 79.46 Males per 100 Females in Youngsville.
What is the Ratio of Females per 100 Males in Youngsville?
There are 125.85 Females per 100 Males in Youngsville.
What is the Median Population Age in Youngsville?
Median Population Age in Youngsville is 33.8 Years.
What is the Average Family Size in Youngsville
Average Family Size in Youngsville is 3.4 People.
What is the Average Household Size in Youngsville
Average Household Size in Youngsville is 3.0 People.
How Large is the Labor Force in Youngsville?
There are 8,026 People in the Labor Forcein in Youngsville.
What is the Percentage of People in the Labor Force in Youngsville?
74.0% of People are in the Labor Force in Youngsville.
What is the Unemployment Rate in Youngsville?
Unemployment Rate in Youngsville is 2.4%.