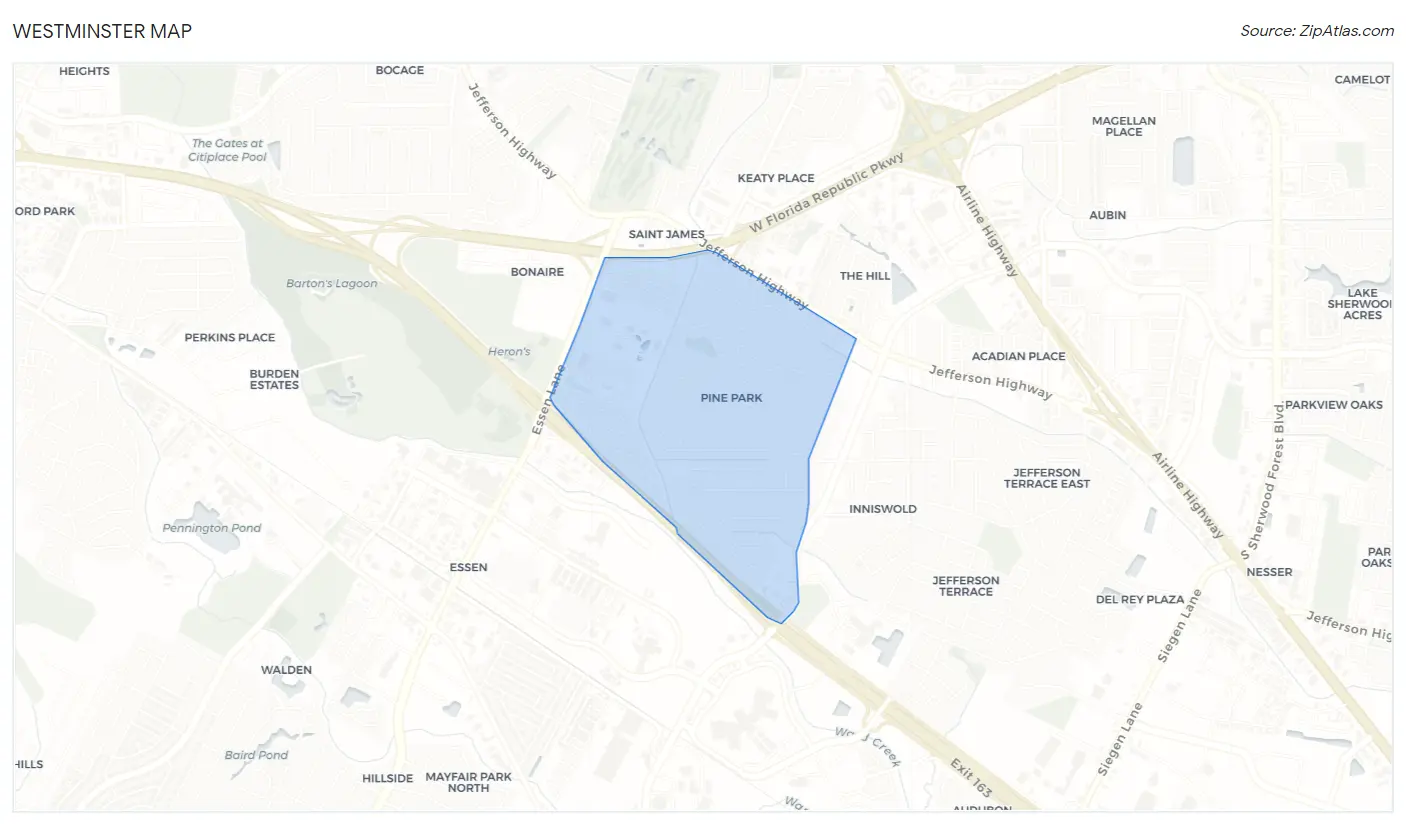
Westminster, LA Map & Demographics
Westminster Map
Westminster Overview
$57,654
PER CAPITA INCOME
$145,069
AVG FAMILY INCOME
$68,843
AVG HOUSEHOLD INCOME
0.53
INEQUALITY / GINI INDEX
2,907
TOTAL POPULATION
1,483
MALE POPULATION
1,424
FEMALE POPULATION
104.14
MALES / 100 FEMALES
96.02
FEMALES / 100 MALES
42.5
MEDIAN AGE
3.6
AVG FAMILY SIZE
2.1
AVG HOUSEHOLD SIZE
1,751
LABOR FORCE [ PEOPLE ]
68.6%
PERCENT IN LABOR FORCE
10.0%
UNEMPLOYMENT RATE
Income in Westminster
Income Overview in Westminster
Per Capita Income in Westminster is $57,654, while median incomes of families and households are $145,069 and $68,843 respectively.
| Characteristic | Number | Measure |
| Per Capita Income | 2,907 | $57,654 |
| Median Family Income | 519 | $145,069 |
| Mean Family Income | 519 | $175,516 |
| Median Household Income | 1,363 | $68,843 |
| Mean Household Income | 1,363 | $118,663 |
| Income Deficit | 519 | $0 |
| Wage / Income Gap (%) | 2,907 | 0.00% |
| Wage / Income Gap ($) | 2,907 | 100.00¢ per $1 |
| Gini / Inequality Index | 2,907 | 0.53 |
Earnings by Sex in Westminster
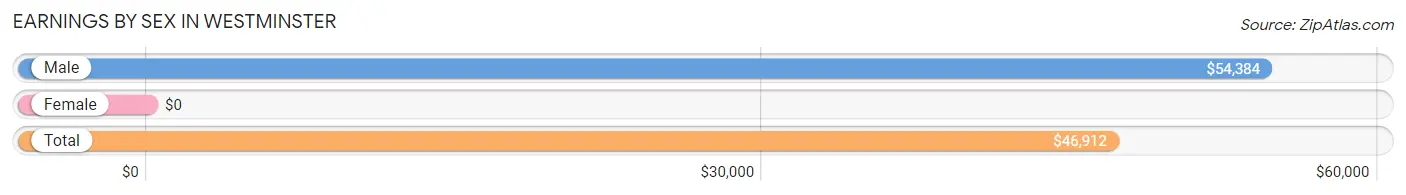
| Sex | Number | Average Earnings |
| Male | 1,095 (62.6%) | $54,384 |
| Female | 655 (37.4%) | $0 |
| Total | 1,750 (100.0%) | $46,912 |
Earnings by Sex by Income Bracket in Westminster
The most common earnings brackets in Westminster are $75,000 to $99,999 for men (191 | 17.4%) and $2,499 or less for women (119 | 18.2%).
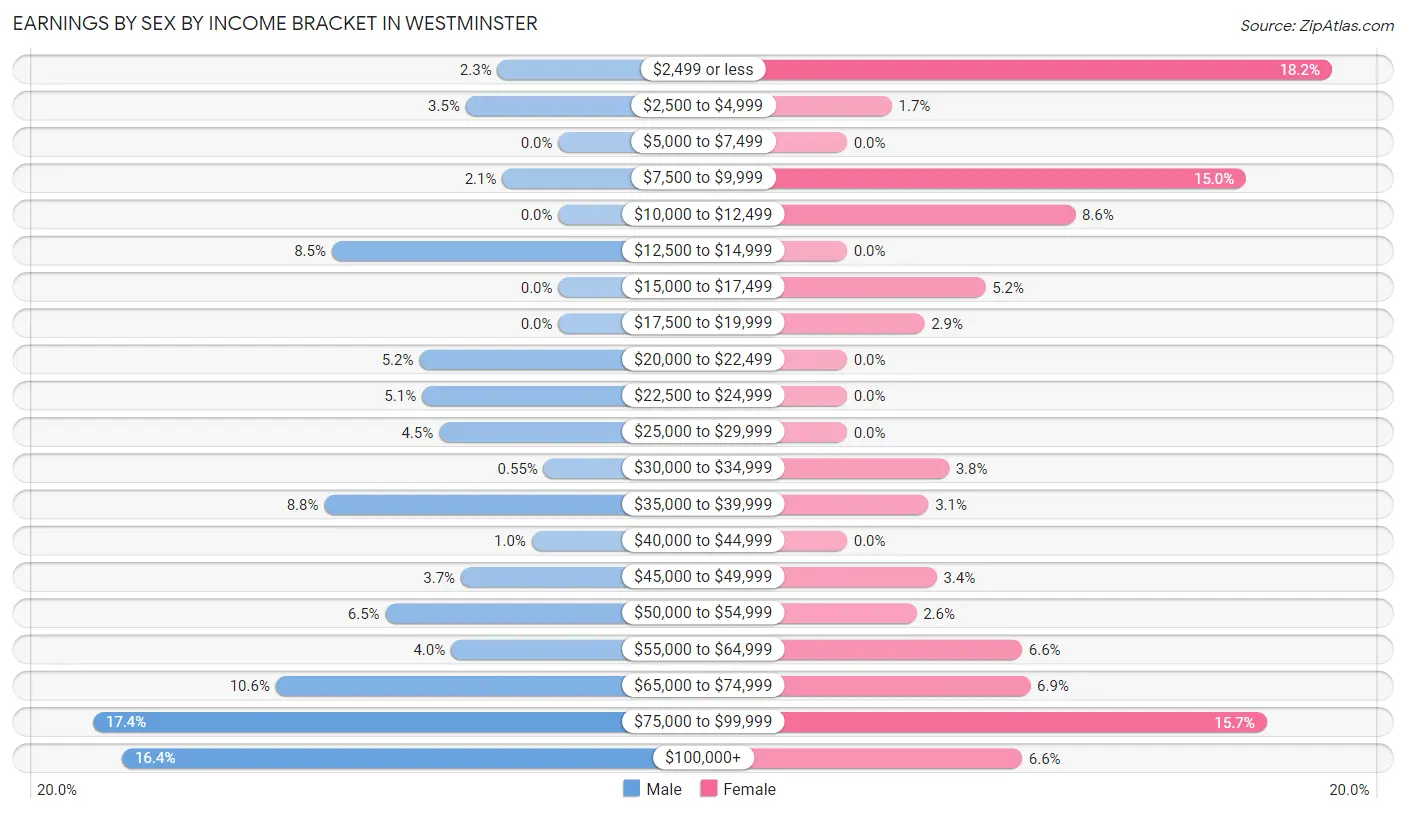
| Income | Male | Female |
| $2,499 or less | 25 (2.3%) | 119 (18.2%) |
| $2,500 to $4,999 | 38 (3.5%) | 11 (1.7%) |
| $5,000 to $7,499 | 0 (0.0%) | 0 (0.0%) |
| $7,500 to $9,999 | 23 (2.1%) | 98 (15.0%) |
| $10,000 to $12,499 | 0 (0.0%) | 56 (8.6%) |
| $12,500 to $14,999 | 93 (8.5%) | 0 (0.0%) |
| $15,000 to $17,499 | 0 (0.0%) | 34 (5.2%) |
| $17,500 to $19,999 | 0 (0.0%) | 19 (2.9%) |
| $20,000 to $22,499 | 57 (5.2%) | 0 (0.0%) |
| $22,500 to $24,999 | 56 (5.1%) | 0 (0.0%) |
| $25,000 to $29,999 | 49 (4.5%) | 0 (0.0%) |
| $30,000 to $34,999 | 6 (0.5%) | 25 (3.8%) |
| $35,000 to $39,999 | 96 (8.8%) | 20 (3.0%) |
| $40,000 to $44,999 | 11 (1.0%) | 0 (0.0%) |
| $45,000 to $49,999 | 40 (3.6%) | 22 (3.4%) |
| $50,000 to $54,999 | 71 (6.5%) | 17 (2.6%) |
| $55,000 to $64,999 | 44 (4.0%) | 43 (6.6%) |
| $65,000 to $74,999 | 116 (10.6%) | 45 (6.9%) |
| $75,000 to $99,999 | 191 (17.4%) | 103 (15.7%) |
| $100,000+ | 179 (16.4%) | 43 (6.6%) |
| Total | 1,095 (100.0%) | 655 (100.0%) |
Earnings by Sex by Educational Attainment in Westminster
Average earnings in Westminster are $62,188 for men and $45,114 for women, a difference of 27.5%. Men with an educational attainment of graduate degree enjoy the highest average annual earnings of $91,476, while those with college or associate's degree education earn the least with $38,555. Women with an educational attainment of graduate degree earn the most with the average annual earnings of $77,574, while those with bachelor's degree education have the smallest earnings of $50,662.
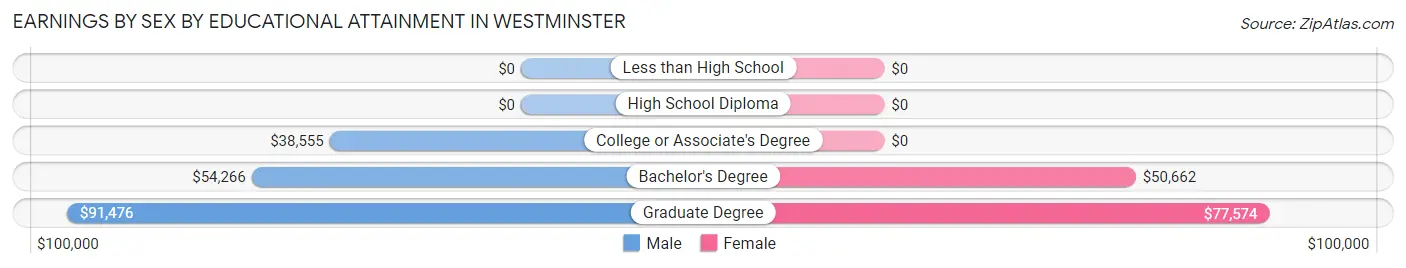
| Educational Attainment | Male Income | Female Income |
| Less than High School | - | - |
| High School Diploma | - | - |
| College or Associate's Degree | $38,555 | $0 |
| Bachelor's Degree | $54,266 | $50,662 |
| Graduate Degree | $91,476 | $77,574 |
| Total | $62,188 | $45,114 |
Family Income in Westminster
Family Income Brackets in Westminster
According to the Westminster family income data, there are 173 families falling into the $150,000 to $199,999 income range, which is the most common income bracket and makes up 33.3% of all families.
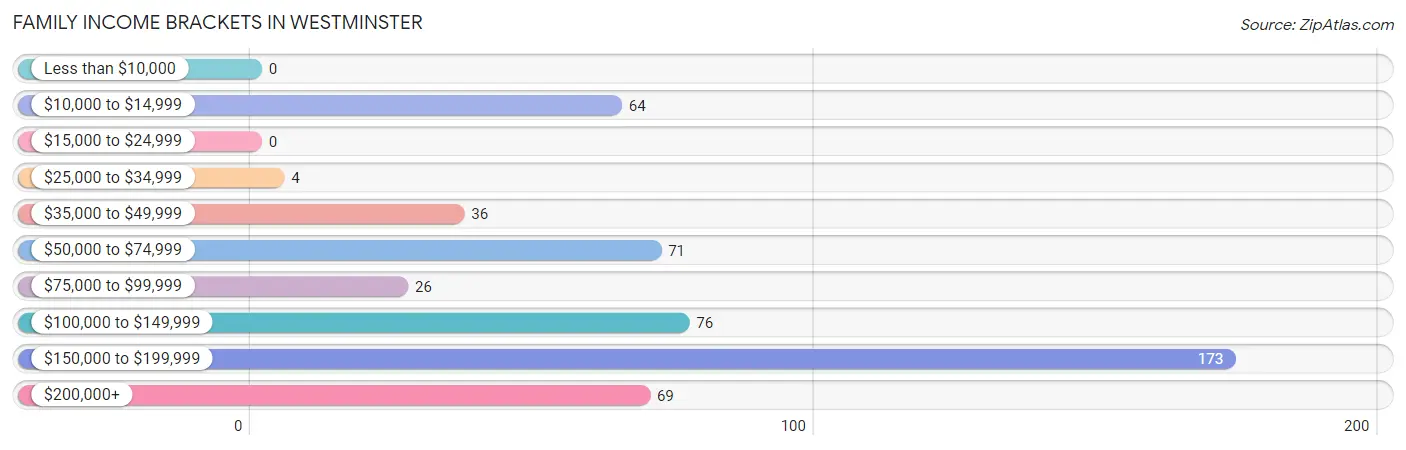
| Income Bracket | # Families | % Families |
| Less than $10,000 | 0 | 0.0% |
| $10,000 to $14,999 | 64 | 12.3% |
| $15,000 to $24,999 | 0 | 0.0% |
| $25,000 to $34,999 | 4 | 0.8% |
| $35,000 to $49,999 | 36 | 6.9% |
| $50,000 to $74,999 | 71 | 13.7% |
| $75,000 to $99,999 | 26 | 5.0% |
| $100,000 to $149,999 | 76 | 14.6% |
| $150,000 to $199,999 | 173 | 33.3% |
| $200,000+ | 69 | 13.3% |
Family Income by Famaliy Size in Westminster
3-person families (194 | 37.4%) account for the highest median family income in Westminster with $187,667 per family, while 2-person families (187 | 36.0%) have the highest median income of $91,328 per family member.
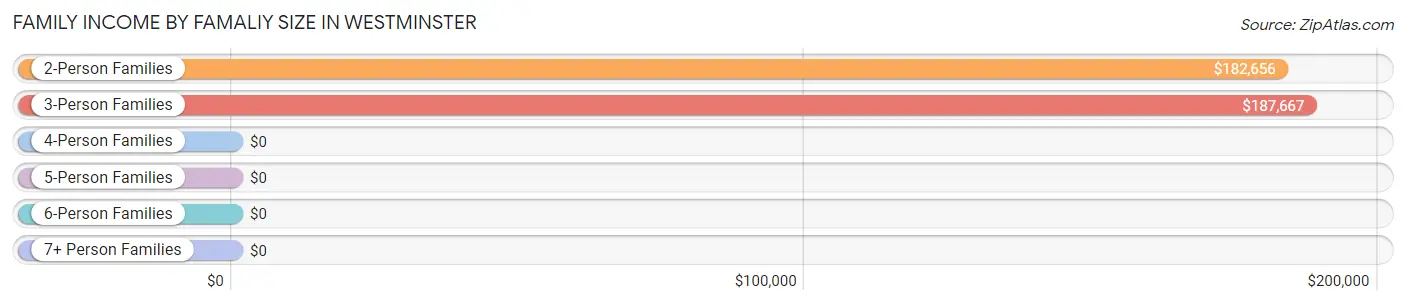
| Income Bracket | # Families | Median Income |
| 2-Person Families | 187 (36.0%) | $182,656 |
| 3-Person Families | 194 (37.4%) | $187,667 |
| 4-Person Families | 8 (1.5%) | $0 |
| 5-Person Families | 92 (17.7%) | $0 |
| 6-Person Families | 38 (7.3%) | $0 |
| 7+ Person Families | 0 (0.0%) | $0 |
| Total | 519 (100.0%) | $145,069 |
Family Income by Number of Earners in Westminster
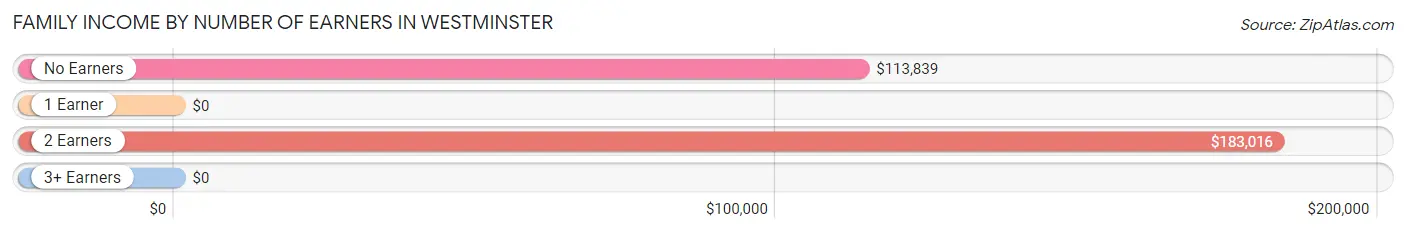
| Number of Earners | # Families | Median Income |
| No Earners | 45 (8.7%) | $113,839 |
| 1 Earner | 70 (13.5%) | $0 |
| 2 Earners | 377 (72.6%) | $183,016 |
| 3+ Earners | 27 (5.2%) | $0 |
| Total | 519 (100.0%) | $145,069 |
Household Income in Westminster
Household Income Brackets in Westminster
With 307 households falling in the category, the $100,000 to $149,999 income range is the most frequent in Westminster, accounting for 22.5% of all households. In contrast, only 14 households (1.0%) fall into the less than $10,000 income bracket, making it the least populous group.
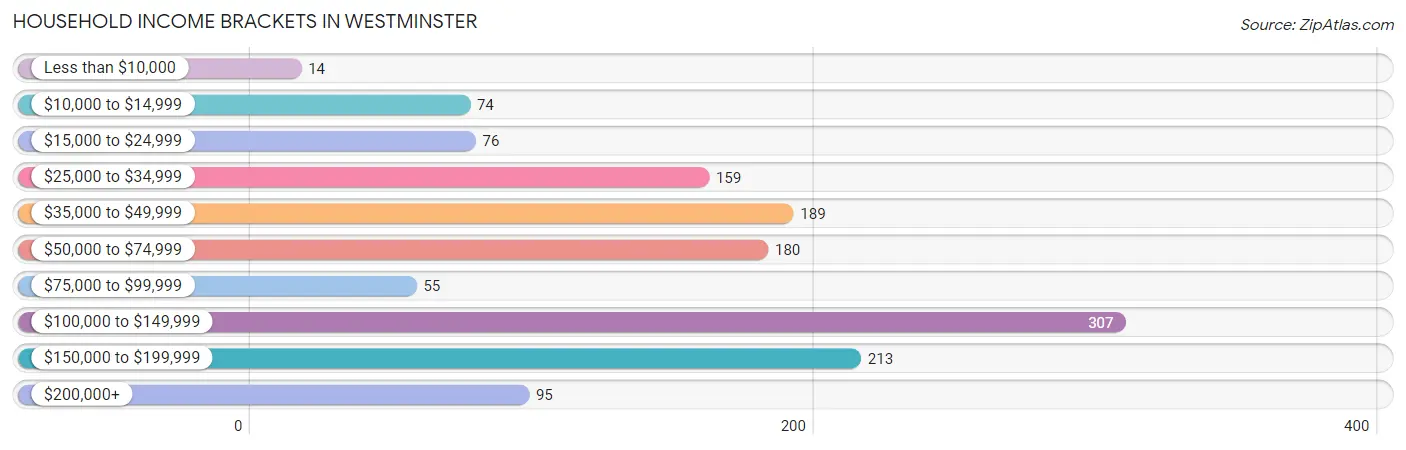
| Income Bracket | # Households | % Households |
| Less than $10,000 | 14 | 1.0% |
| $10,000 to $14,999 | 74 | 5.4% |
| $15,000 to $24,999 | 76 | 5.6% |
| $25,000 to $34,999 | 159 | 11.7% |
| $35,000 to $49,999 | 189 | 13.9% |
| $50,000 to $74,999 | 180 | 13.2% |
| $75,000 to $99,999 | 55 | 4.0% |
| $100,000 to $149,999 | 307 | 22.5% |
| $150,000 to $199,999 | 213 | 15.6% |
| $200,000+ | 95 | 7.0% |
Household Income by Householder Age in Westminster
The median household income in Westminster is $68,843, with the highest median household income of $103,667 found in the 25 to 44 years age bracket for the primary householder. A total of 410 households (30.1%) fall into this category. Meanwhile, the 15 to 24 years age bracket for the primary householder has the lowest median household income of $0, with 19 households (1.4%) in this group.
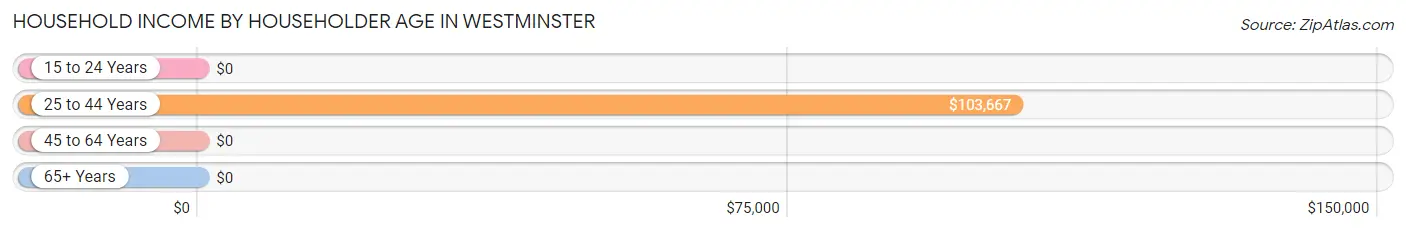
| Income Bracket | # Households | Median Income |
| 15 to 24 Years | 19 (1.4%) | $0 |
| 25 to 44 Years | 410 (30.1%) | $103,667 |
| 45 to 64 Years | 453 (33.2%) | $0 |
| 65+ Years | 481 (35.3%) | $0 |
| Total | 1,363 (100.0%) | $68,843 |
Poverty in Westminster
Income Below Poverty by Sex and Age in Westminster
With 4.3% poverty level for males and 22.8% for females among the residents of Westminster, 75 year old and over males and 12 to 14 year old females are the most vulnerable to poverty, with 64 males (36.2%) and 66 females (100.0%) in their respective age groups living below the poverty level.
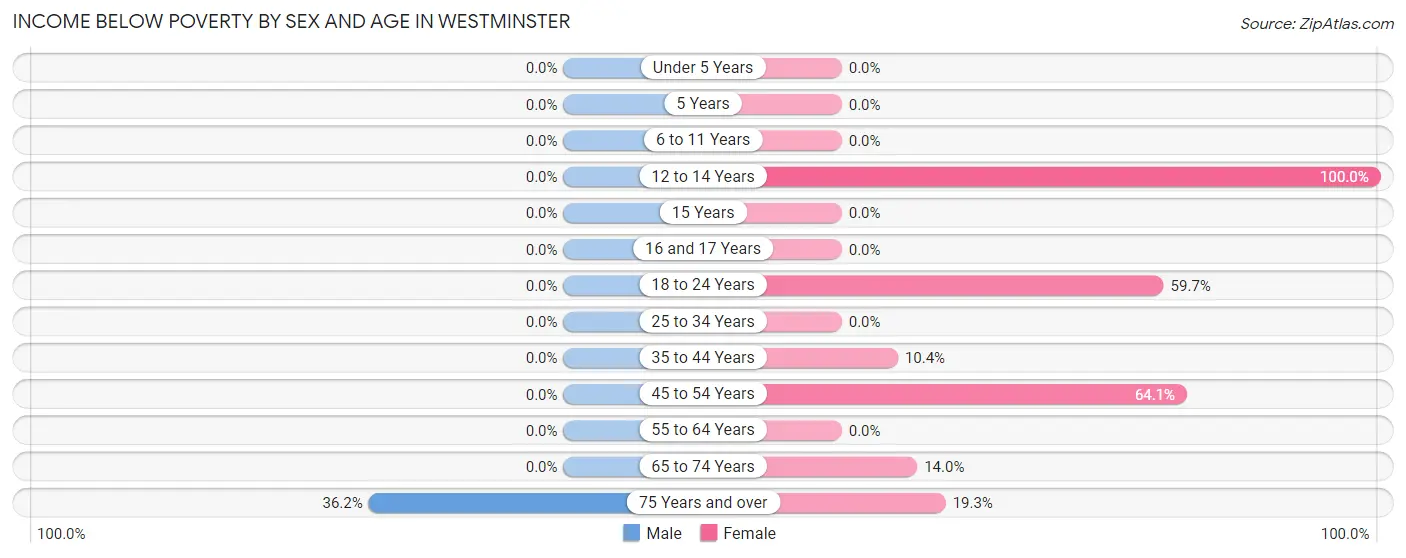
| Age Bracket | Male | Female |
| Under 5 Years | 0 (0.0%) | 0 (0.0%) |
| 5 Years | 0 (0.0%) | 0 (0.0%) |
| 6 to 11 Years | 0 (0.0%) | 0 (0.0%) |
| 12 to 14 Years | 0 (0.0%) | 66 (100.0%) |
| 15 Years | 0 (0.0%) | 0 (0.0%) |
| 16 and 17 Years | 0 (0.0%) | 0 (0.0%) |
| 18 to 24 Years | 0 (0.0%) | 92 (59.7%) |
| 25 to 34 Years | 0 (0.0%) | 0 (0.0%) |
| 35 to 44 Years | 0 (0.0%) | 10 (10.4%) |
| 45 to 54 Years | 0 (0.0%) | 82 (64.1%) |
| 55 to 64 Years | 0 (0.0%) | 0 (0.0%) |
| 65 to 74 Years | 0 (0.0%) | 14 (14.0%) |
| 75 Years and over | 64 (36.2%) | 60 (19.3%) |
| Total | 64 (4.3%) | 324 (22.8%) |
Income Above Poverty by Sex and Age in Westminster
According to the poverty statistics in Westminster, males aged under 5 years and females aged under 5 years are the age groups that are most secure financially, with 100.0% of males and 100.0% of females in these age groups living above the poverty line.
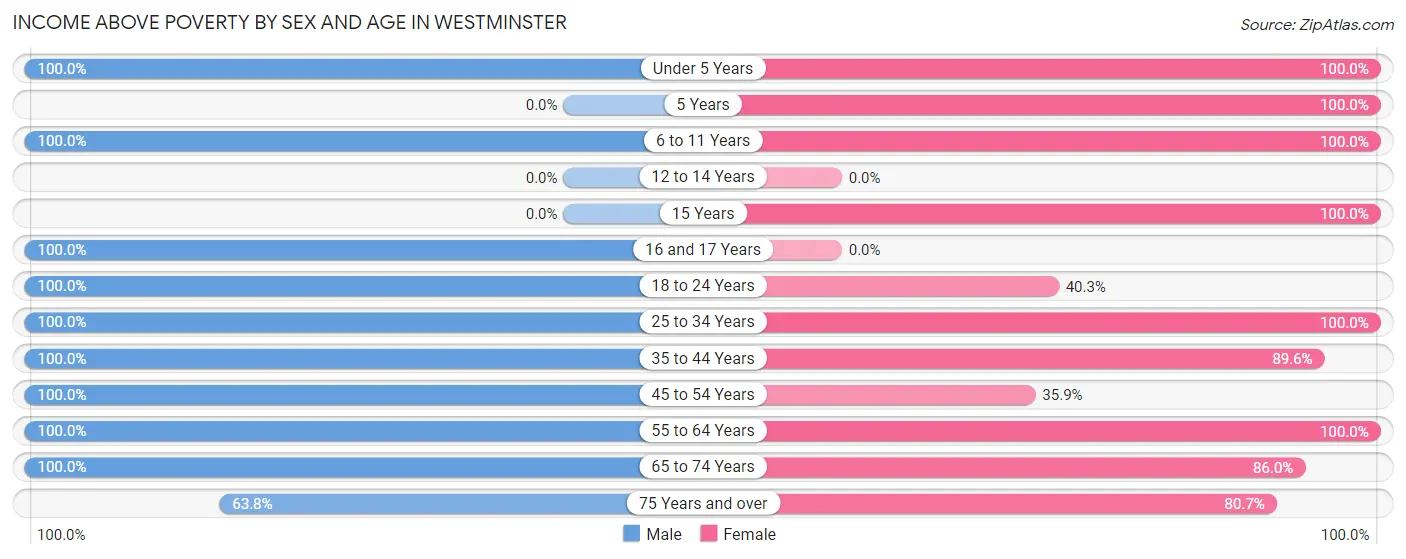
| Age Bracket | Male | Female |
| Under 5 Years | 70 (100.0%) | 116 (100.0%) |
| 5 Years | 0 (0.0%) | 11 (100.0%) |
| 6 to 11 Years | 42 (100.0%) | 30 (100.0%) |
| 12 to 14 Years | 0 (0.0%) | 0 (0.0%) |
| 15 Years | 0 (0.0%) | 20 (100.0%) |
| 16 and 17 Years | 25 (100.0%) | 0 (0.0%) |
| 18 to 24 Years | 175 (100.0%) | 62 (40.3%) |
| 25 to 34 Years | 329 (100.0%) | 176 (100.0%) |
| 35 to 44 Years | 214 (100.0%) | 86 (89.6%) |
| 45 to 54 Years | 224 (100.0%) | 46 (35.9%) |
| 55 to 64 Years | 175 (100.0%) | 216 (100.0%) |
| 65 to 74 Years | 52 (100.0%) | 86 (86.0%) |
| 75 Years and over | 113 (63.8%) | 251 (80.7%) |
| Total | 1,419 (95.7%) | 1,100 (77.2%) |
Income Below Poverty Among Married-Couple Families in Westminster
The poverty statistics for married-couple families in Westminster show that 13.9% or 64 of the total 461 families live below the poverty line. Families with 1 or 2 children have the highest poverty rate of 36.4%, comprising of 64 families. On the other hand, families with no children have the lowest poverty rate of 0.0%, which includes 0 families.
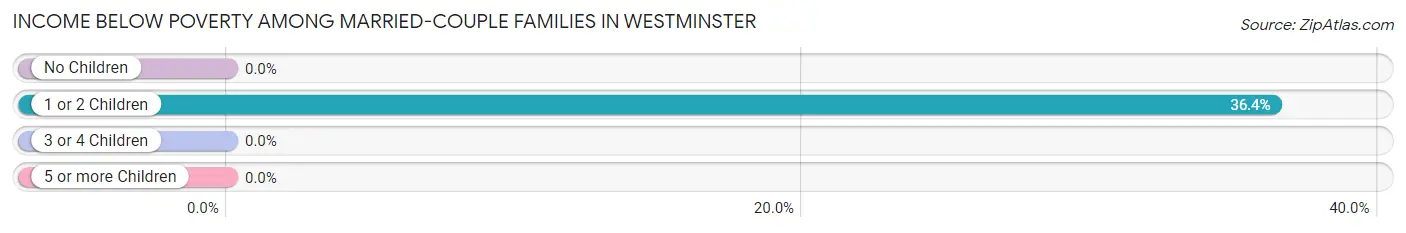
| Children | Above Poverty | Below Poverty |
| No Children | 252 (100.0%) | 0 (0.0%) |
| 1 or 2 Children | 112 (63.6%) | 64 (36.4%) |
| 3 or 4 Children | 33 (100.0%) | 0 (0.0%) |
| 5 or more Children | 0 (0.0%) | 0 (0.0%) |
| Total | 397 (86.1%) | 64 (13.9%) |
Income Below Poverty Among Single-Parent Households in Westminster
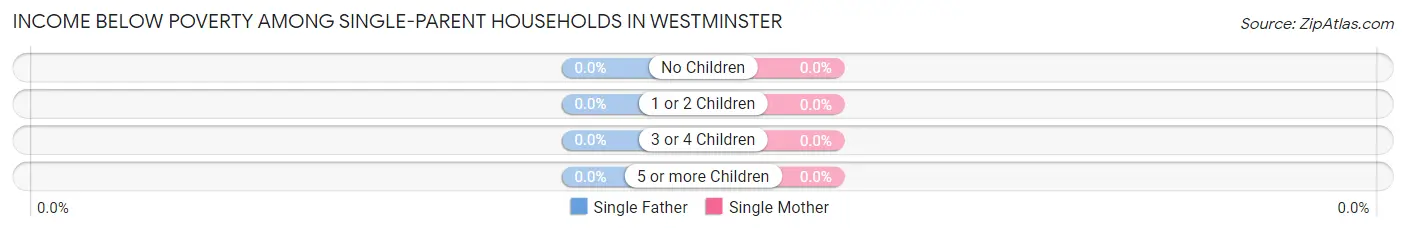
| Children | Single Father | Single Mother |
| No Children | 0 (0.0%) | 0 (0.0%) |
| 1 or 2 Children | 0 (0.0%) | 0 (0.0%) |
| 3 or 4 Children | 0 (0.0%) | 0 (0.0%) |
| 5 or more Children | 0 (0.0%) | 0 (0.0%) |
| Total | 0 (0.0%) | 0 (0.0%) |
Income Below Poverty Among Married-Couple vs Single-Parent Households in Westminster
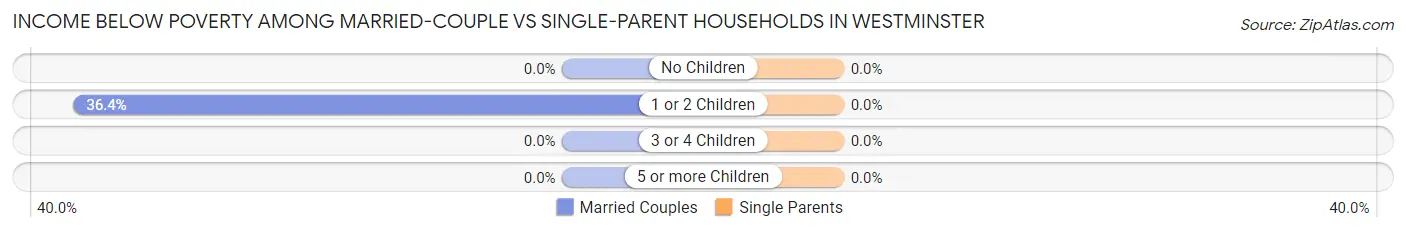
| Children | Married-Couple Families | Single-Parent Households |
| No Children | 0 (0.0%) | 0 (0.0%) |
| 1 or 2 Children | 64 (36.4%) | 0 (0.0%) |
| 3 or 4 Children | 0 (0.0%) | 0 (0.0%) |
| 5 or more Children | 0 (0.0%) | 0 (0.0%) |
| Total | 64 (13.9%) | 0 (0.0%) |
Race in Westminster
The most populous races in Westminster are White / Caucasian (2,444 | 84.1%), Black / African American (204 | 7.0%), and Asian (145 | 5.0%).
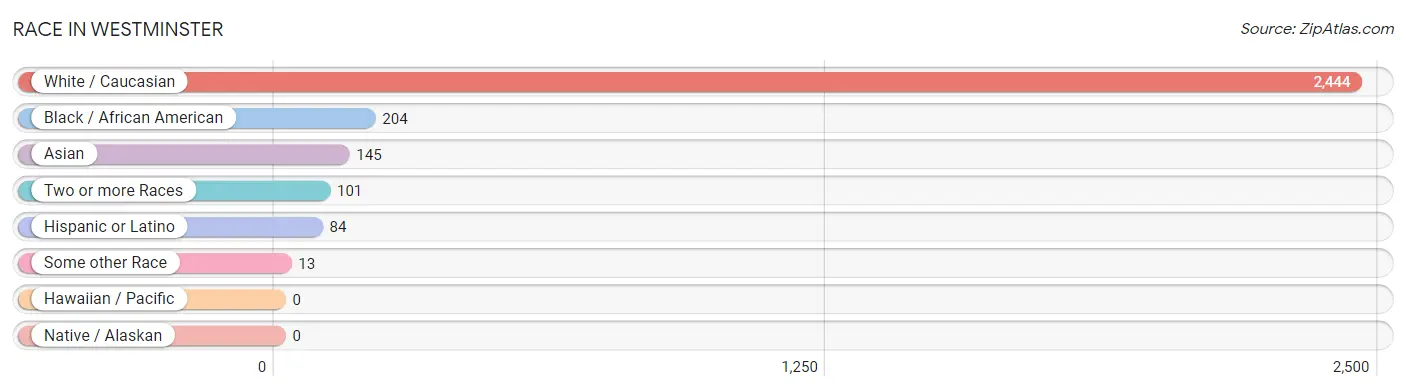
| Race | # Population | % Population |
| Asian | 145 | 5.0% |
| Black / African American | 204 | 7.0% |
| Hawaiian / Pacific | 0 | 0.0% |
| Hispanic or Latino | 84 | 2.9% |
| Native / Alaskan | 0 | 0.0% |
| White / Caucasian | 2,444 | 84.1% |
| Two or more Races | 101 | 3.5% |
| Some other Race | 13 | 0.4% |
| Total | 2,907 | 100.0% |
Ancestry in Westminster
The most populous ancestries reported in Westminster are French (595 | 20.5%), English (390 | 13.4%), German (360 | 12.4%), Italian (228 | 7.8%), and Irish (223 | 7.7%), together accounting for 61.8% of all Westminster residents.
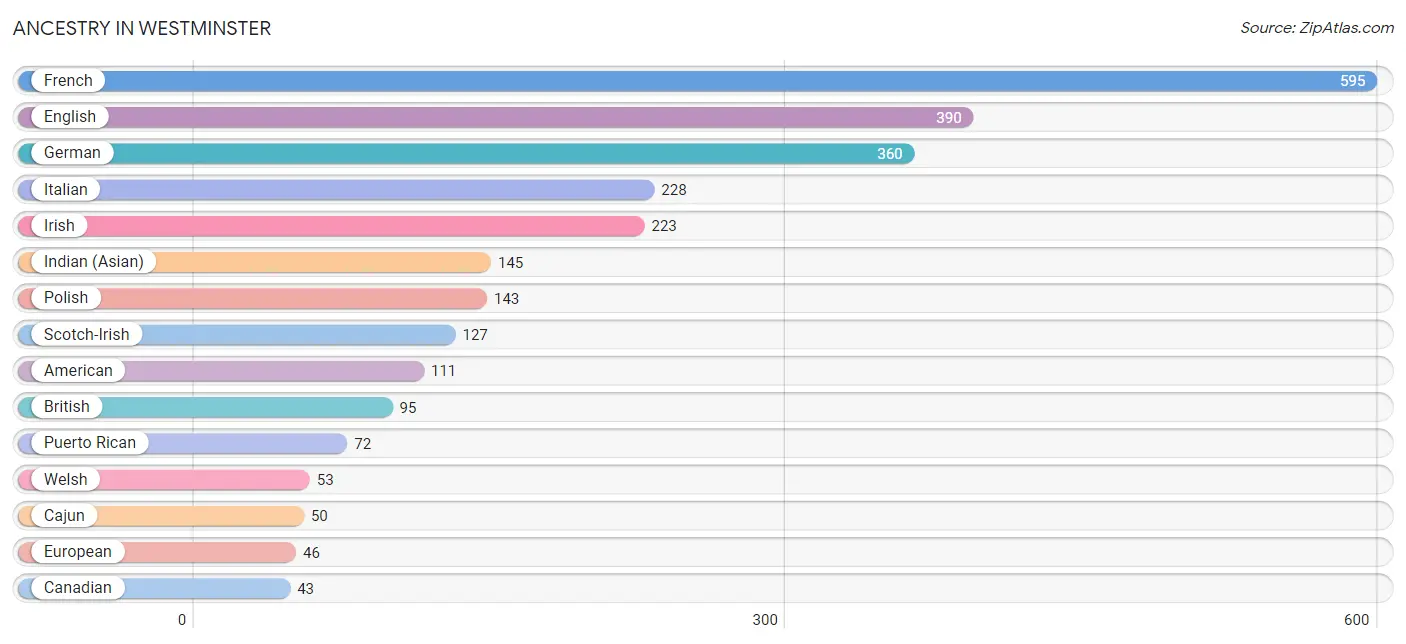
| Ancestry | # Population | % Population |
| American | 111 | 3.8% |
| British | 95 | 3.3% |
| Cajun | 50 | 1.7% |
| Canadian | 43 | 1.5% |
| Colombian | 12 | 0.4% |
| Dutch | 26 | 0.9% |
| English | 390 | 13.4% |
| European | 46 | 1.6% |
| French | 595 | 20.5% |
| German | 360 | 12.4% |
| Indian (Asian) | 145 | 5.0% |
| Irish | 223 | 7.7% |
| Italian | 228 | 7.8% |
| Northern European | 26 | 0.9% |
| Norwegian | 42 | 1.4% |
| Polish | 143 | 4.9% |
| Puerto Rican | 72 | 2.5% |
| Scotch-Irish | 127 | 4.4% |
| Scottish | 31 | 1.1% |
| South American | 12 | 0.4% |
| Ute | 4 | 0.1% |
| Welsh | 53 | 1.8% | View All 22 Rows |
Immigrants in Westminster
The most numerous immigrant groups reported in Westminster came from Asia (100 | 3.4%), China (100 | 3.4%), Eastern Asia (100 | 3.4%), Europe (76 | 2.6%), and Germany (60 | 2.1%), together accounting for 15.0% of all Westminster residents.
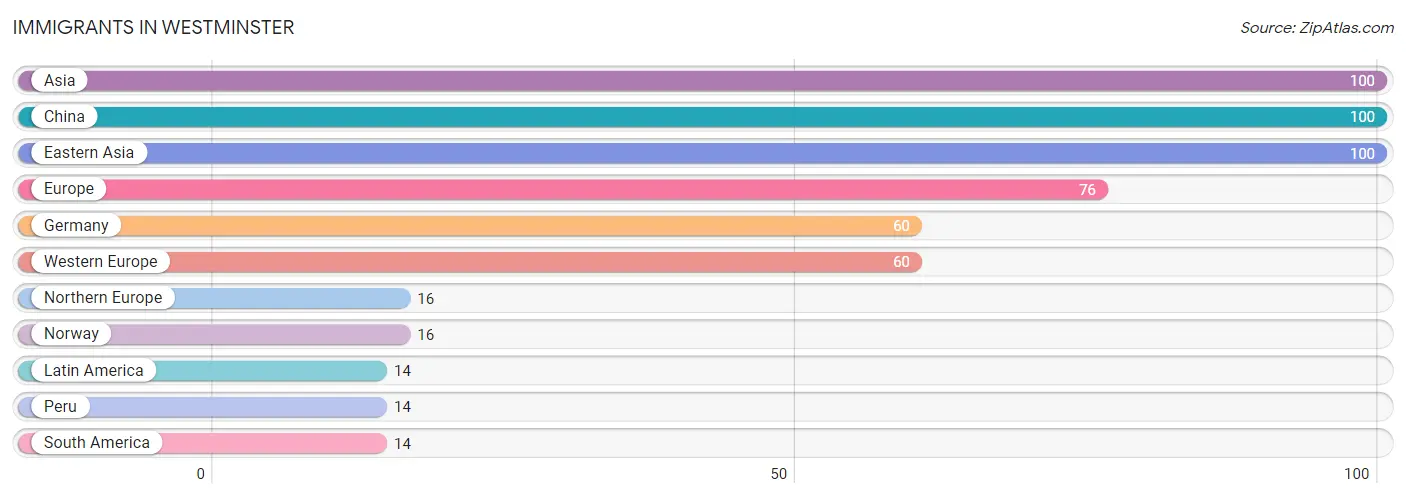
| Immigration Origin | # Population | % Population |
| Asia | 100 | 3.4% |
| China | 100 | 3.4% |
| Eastern Asia | 100 | 3.4% |
| Europe | 76 | 2.6% |
| Germany | 60 | 2.1% |
| Latin America | 14 | 0.5% |
| Northern Europe | 16 | 0.5% |
| Norway | 16 | 0.5% |
| Peru | 14 | 0.5% |
| South America | 14 | 0.5% |
| Western Europe | 60 | 2.1% | View All 11 Rows |
Sex and Age in Westminster
Sex and Age in Westminster
The most populous age groups in Westminster are 25 to 29 Years (196 | 13.2%) for men and 75 to 79 Years (228 | 16.0%) for women.
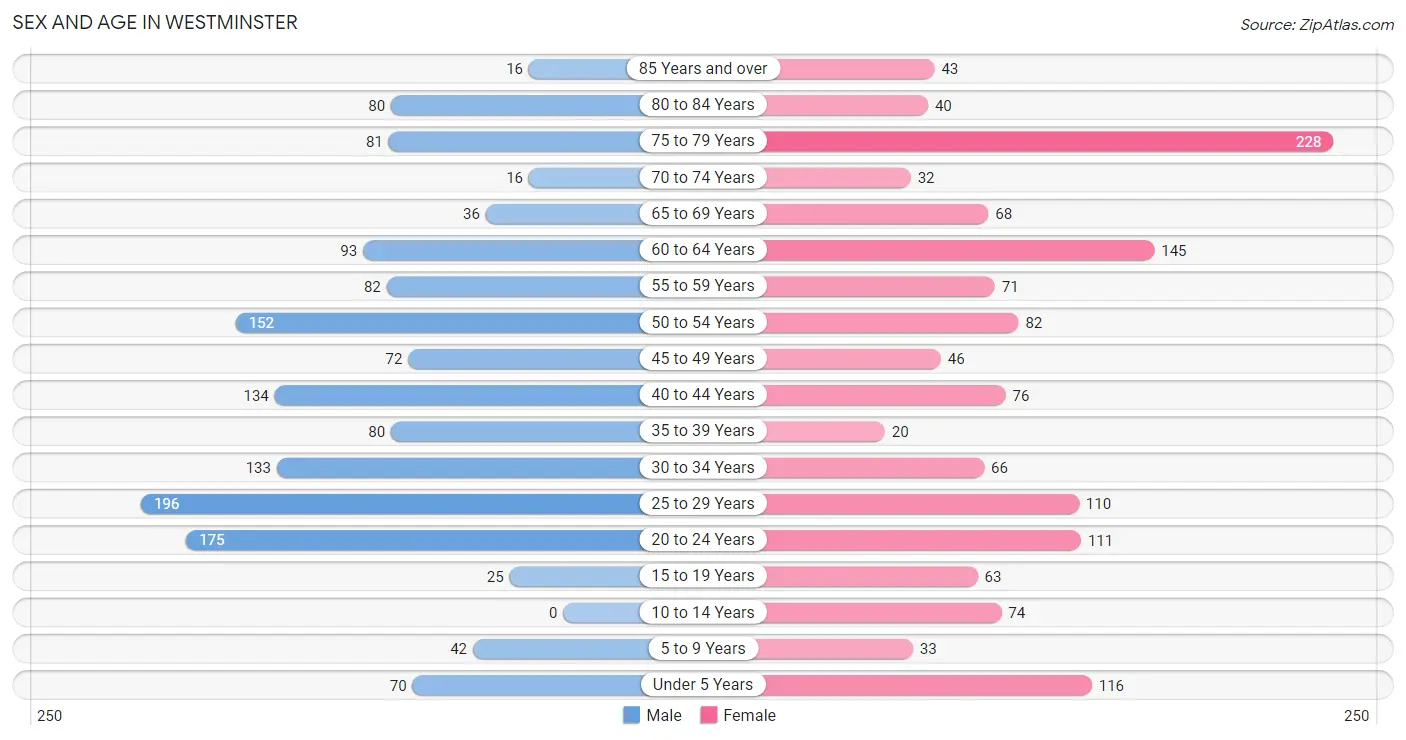
| Age Bracket | Male | Female |
| Under 5 Years | 70 (4.7%) | 116 (8.2%) |
| 5 to 9 Years | 42 (2.8%) | 33 (2.3%) |
| 10 to 14 Years | 0 (0.0%) | 74 (5.2%) |
| 15 to 19 Years | 25 (1.7%) | 63 (4.4%) |
| 20 to 24 Years | 175 (11.8%) | 111 (7.8%) |
| 25 to 29 Years | 196 (13.2%) | 110 (7.7%) |
| 30 to 34 Years | 133 (9.0%) | 66 (4.6%) |
| 35 to 39 Years | 80 (5.4%) | 20 (1.4%) |
| 40 to 44 Years | 134 (9.0%) | 76 (5.3%) |
| 45 to 49 Years | 72 (4.9%) | 46 (3.2%) |
| 50 to 54 Years | 152 (10.2%) | 82 (5.8%) |
| 55 to 59 Years | 82 (5.5%) | 71 (5.0%) |
| 60 to 64 Years | 93 (6.3%) | 145 (10.2%) |
| 65 to 69 Years | 36 (2.4%) | 68 (4.8%) |
| 70 to 74 Years | 16 (1.1%) | 32 (2.2%) |
| 75 to 79 Years | 81 (5.5%) | 228 (16.0%) |
| 80 to 84 Years | 80 (5.4%) | 40 (2.8%) |
| 85 Years and over | 16 (1.1%) | 43 (3.0%) |
| Total | 1,483 (100.0%) | 1,424 (100.0%) |
Families and Households in Westminster
Median Family Size in Westminster
The median family size in Westminster is 3.61 persons per family, with single female/mother families (47 | 9.1%) accounting for the largest median family size of 4.21 persons per family. On the other hand, single male/father families (11 | 2.1%) represent the smallest median family size with 3.27 persons per family.
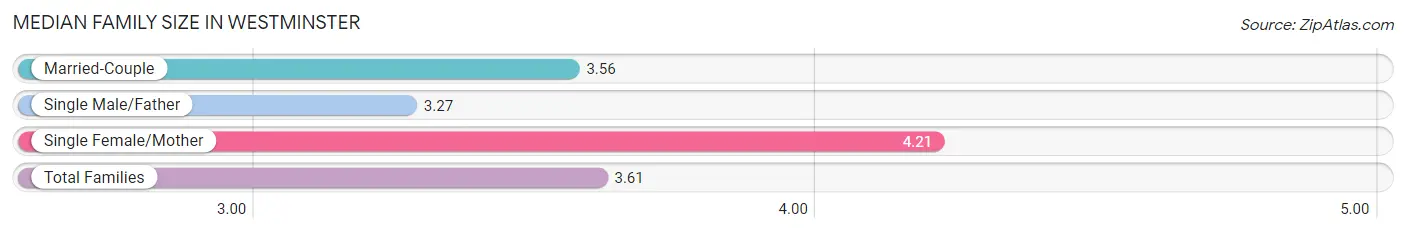
| Family Type | # Families | Family Size |
| Married-Couple | 461 (88.8%) | 3.56 |
| Single Male/Father | 11 (2.1%) | 3.27 |
| Single Female/Mother | 47 (9.1%) | 4.21 |
| Total Families | 519 (100.0%) | 3.61 |
Median Household Size in Westminster
The median household size in Westminster is 2.13 persons per household, with single male/father households (11 | 0.8%) accounting for the largest median household size of 4.45 persons per household. non-family households (844 | 61.9%) represent the smallest median household size with 1.21 persons per household.
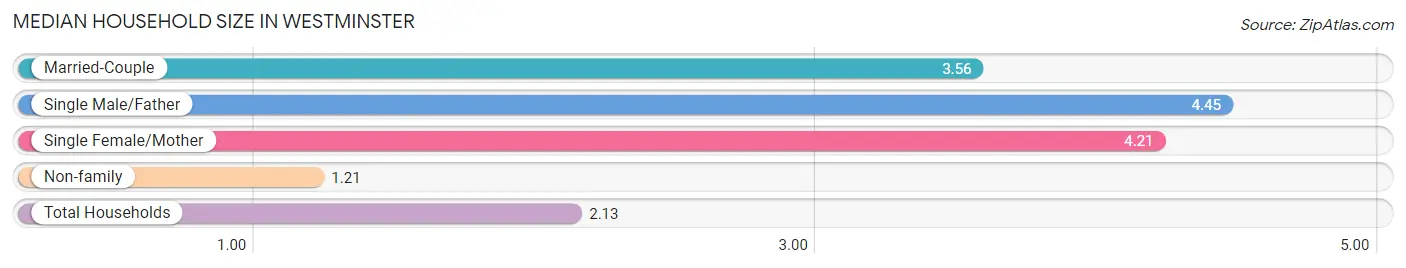
| Household Type | # Households | Household Size |
| Married-Couple | 461 (33.8%) | 3.56 |
| Single Male/Father | 11 (0.8%) | 4.45 |
| Single Female/Mother | 47 (3.5%) | 4.21 |
| Non-family | 844 (61.9%) | 1.21 |
| Total Households | 1,363 (100.0%) | 2.13 |
Household Size by Marriage Status in Westminster
Out of a total of 1,363 households in Westminster, 519 (38.1%) are family households, while 844 (61.9%) are nonfamily households. The most numerous type of family households are 2-person households, comprising 187, and the most common type of nonfamily households are 1-person households, comprising 753.
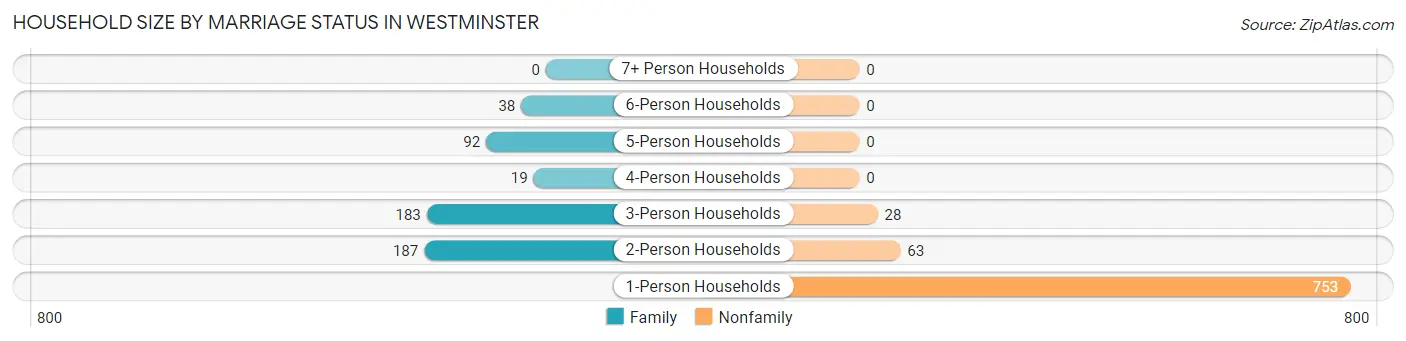
| Household Size | Family Households | Nonfamily Households |
| 1-Person Households | - | 753 (55.2%) |
| 2-Person Households | 187 (13.7%) | 63 (4.6%) |
| 3-Person Households | 183 (13.4%) | 28 (2.1%) |
| 4-Person Households | 19 (1.4%) | 0 (0.0%) |
| 5-Person Households | 92 (6.8%) | 0 (0.0%) |
| 6-Person Households | 38 (2.8%) | 0 (0.0%) |
| 7+ Person Households | 0 (0.0%) | 0 (0.0%) |
| Total | 519 (38.1%) | 844 (61.9%) |
Female Fertility in Westminster
Fertility by Age in Westminster
Average fertility rate in Westminster is 73.0 births per 1,000 women. Women in the age bracket of 20 to 34 years have the highest fertility rate with 125.0 births per 1,000 women. Women in the age bracket of 20 to 34 years acount for 100.0% of all women with births.
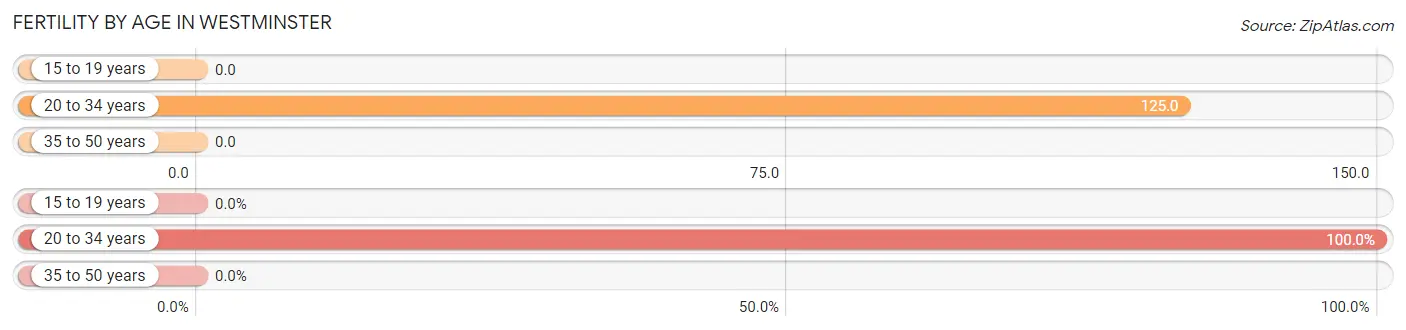
| Age Bracket | Women with Births | Births / 1,000 Women |
| 15 to 19 years | 0 (0.0%) | 0.0 |
| 20 to 34 years | 36 (100.0%) | 125.0 |
| 35 to 50 years | 0 (0.0%) | 0.0 |
| Total | 36 (100.0%) | 73.0 |
Fertility by Age by Marriage Status in Westminster
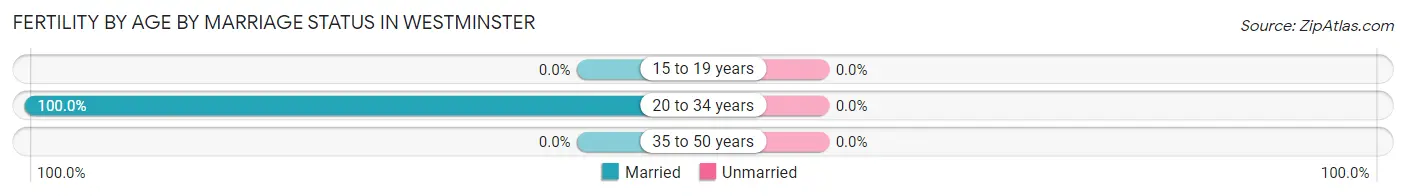
| Age Bracket | Married | Unmarried |
| 15 to 19 years | 0 (0.0%) | 0 (0.0%) |
| 20 to 34 years | 36 (100.0%) | 0 (0.0%) |
| 35 to 50 years | 0 (0.0%) | 0 (0.0%) |
| Total | 36 (100.0%) | 0 (0.0%) |
Fertility by Education in Westminster
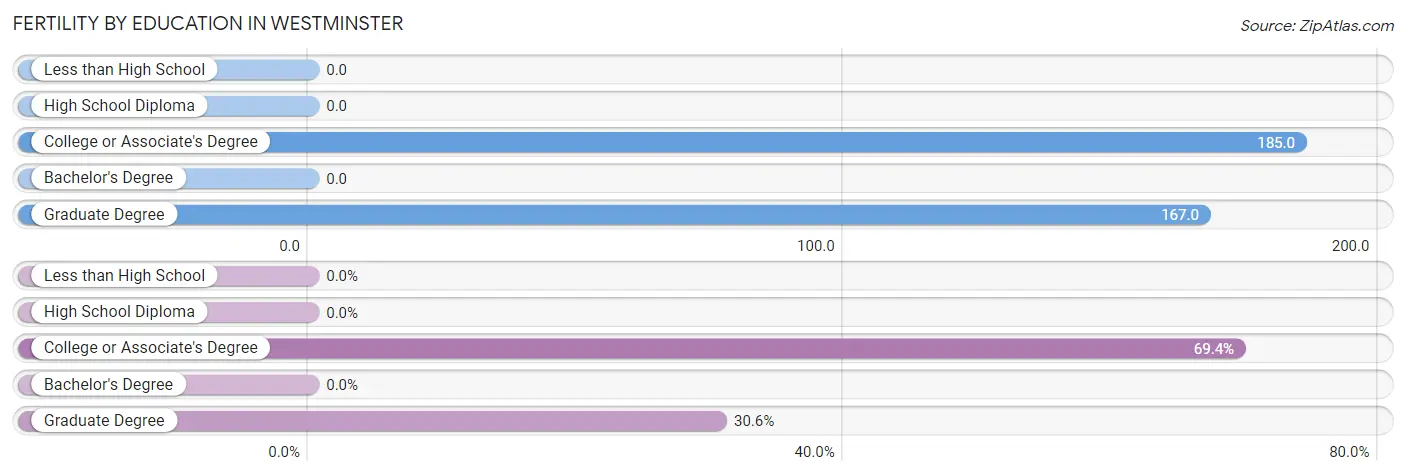
| Educational Attainment | Women with Births | Births / 1,000 Women |
| Less than High School | 0 (0.0%) | 0.0 |
| High School Diploma | 0 (0.0%) | 0.0 |
| College or Associate's Degree | 25 (69.4%) | 185.0 |
| Bachelor's Degree | 0 (0.0%) | 0.0 |
| Graduate Degree | 11 (30.6%) | 167.0 |
| Total | 36 (100.0%) | 73.0 |
Fertility by Education by Marriage Status in Westminster
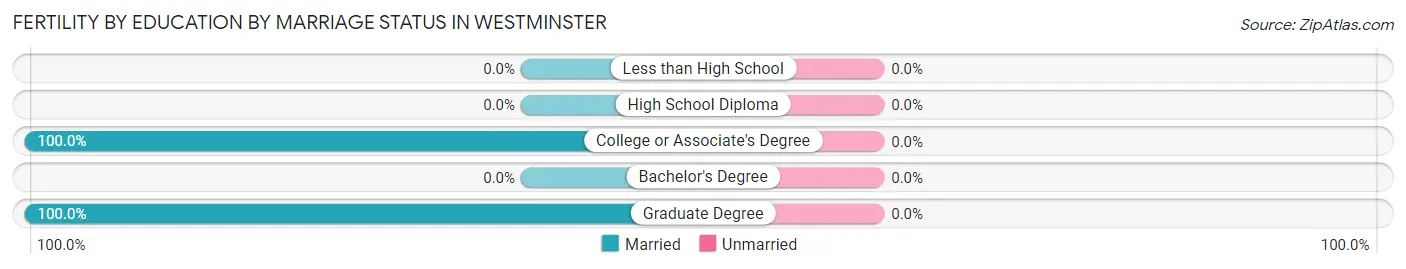
| Educational Attainment | Married | Unmarried |
| Less than High School | 0 (0.0%) | 0 (0.0%) |
| High School Diploma | 0 (0.0%) | 0 (0.0%) |
| College or Associate's Degree | 25 (100.0%) | 0 (0.0%) |
| Bachelor's Degree | 0 (0.0%) | 0 (0.0%) |
| Graduate Degree | 11 (100.0%) | 0 (0.0%) |
| Total | 36 (100.0%) | 0 (0.0%) |
Employment Characteristics in Westminster
Employment by Class of Employer in Westminster
Among the 1,576 employed individuals in Westminster, private company employees (996 | 63.2%), self-employed (incorporated) (236 | 15.0%), and not-for-profit organizations (136 | 8.6%) make up the most common classes of employment.
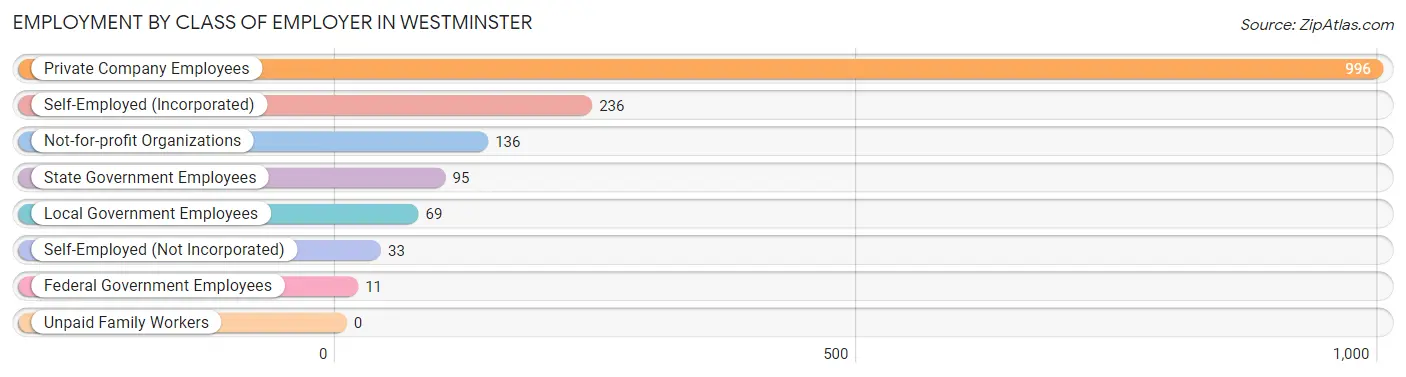
| Employer Class | # Employees | % Employees |
| Private Company Employees | 996 | 63.2% |
| Self-Employed (Incorporated) | 236 | 15.0% |
| Self-Employed (Not Incorporated) | 33 | 2.1% |
| Not-for-profit Organizations | 136 | 8.6% |
| Local Government Employees | 69 | 4.4% |
| State Government Employees | 95 | 6.0% |
| Federal Government Employees | 11 | 0.7% |
| Unpaid Family Workers | 0 | 0.0% |
| Total | 1,576 | 100.0% |
Employment Status by Age in Westminster
According to the labor force statistics for Westminster, out of the total population over 16 years of age (2,552), 68.6% or 1,751 individuals are in the labor force, with 10.0% or 175 of them unemployed. The age group with the highest labor force participation rate is 20 to 24 years, with 100.0% or 286 individuals in the labor force. Within the labor force, the 20 to 24 years age range has the highest percentage of unemployed individuals, with 32.2% or 92 of them being unemployed.
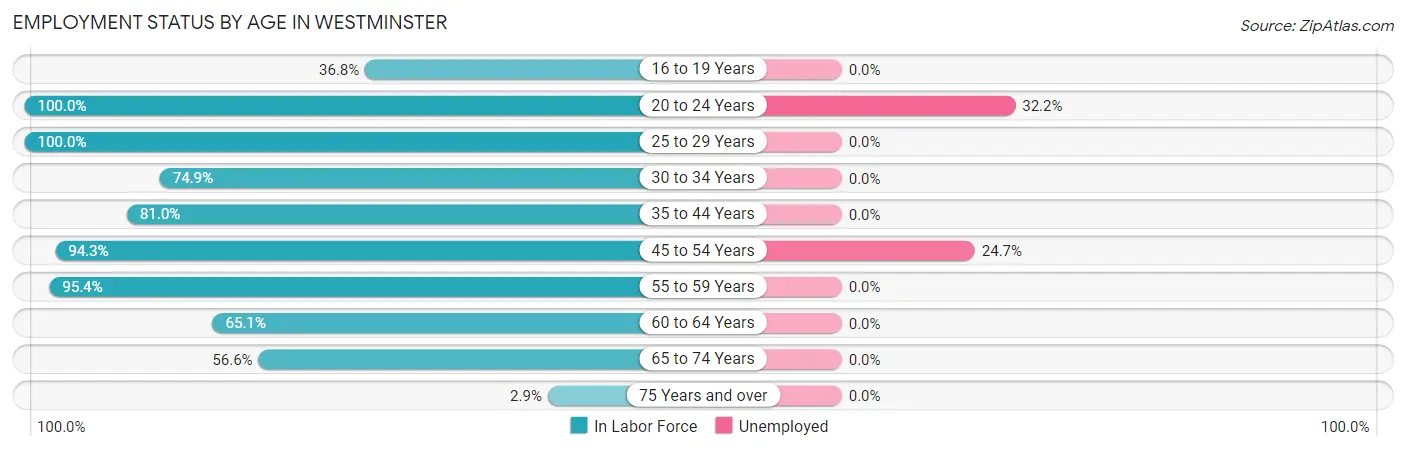
| Age Bracket | In Labor Force | Unemployed |
| 16 to 19 Years | 25 (36.8%) | 0 (0.0%) |
| 20 to 24 Years | 286 (100.0%) | 92 (32.2%) |
| 25 to 29 Years | 306 (100.0%) | 0 (0.0%) |
| 30 to 34 Years | 149 (74.9%) | 0 (0.0%) |
| 35 to 44 Years | 251 (81.0%) | 0 (0.0%) |
| 45 to 54 Years | 332 (94.3%) | 82 (24.7%) |
| 55 to 59 Years | 146 (95.4%) | 0 (0.0%) |
| 60 to 64 Years | 155 (65.1%) | 0 (0.0%) |
| 65 to 74 Years | 86 (56.6%) | 0 (0.0%) |
| 75 Years and over | 14 (2.9%) | 0 (0.0%) |
| Total | 1,751 (68.6%) | 175 (10.0%) |
Employment Status by Educational Attainment in Westminster
According to labor force statistics for Westminster, 85.9% of individuals (1,338) out of the total population between 25 and 64 years of age (1,558) are in the labor force, with 6.2% or 83 of them being unemployed. The group with the highest labor force participation rate are those with the educational attainment of high school diploma, with 100.0% or 210 individuals in the labor force. Within the labor force, individuals with high school diploma education have the highest percentage of unemployment, with 39.0% or 82 of them being unemployed.
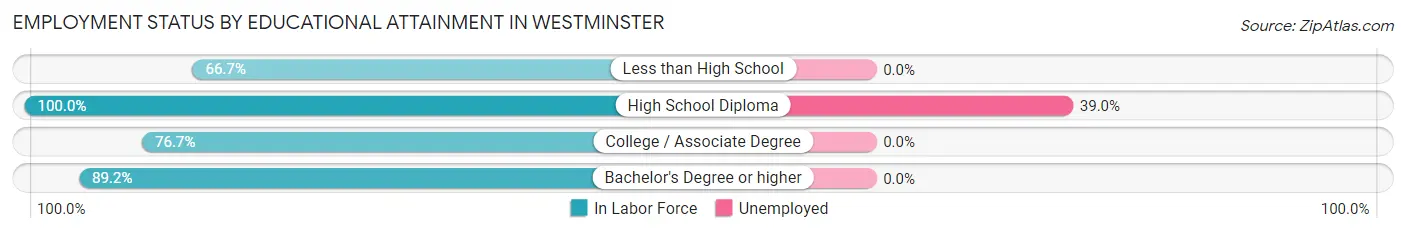
| Educational Attainment | In Labor Force | Unemployed |
| Less than High School | 40 (66.7%) | 0 (0.0%) |
| High School Diploma | 210 (100.0%) | 82 (39.0%) |
| College / Associate Degree | 369 (76.7%) | 0 (0.0%) |
| Bachelor's Degree or higher | 720 (89.2%) | 0 (0.0%) |
| Total | 1,338 (85.9%) | 97 (6.2%) |
Employment Occupations by Sex in Westminster
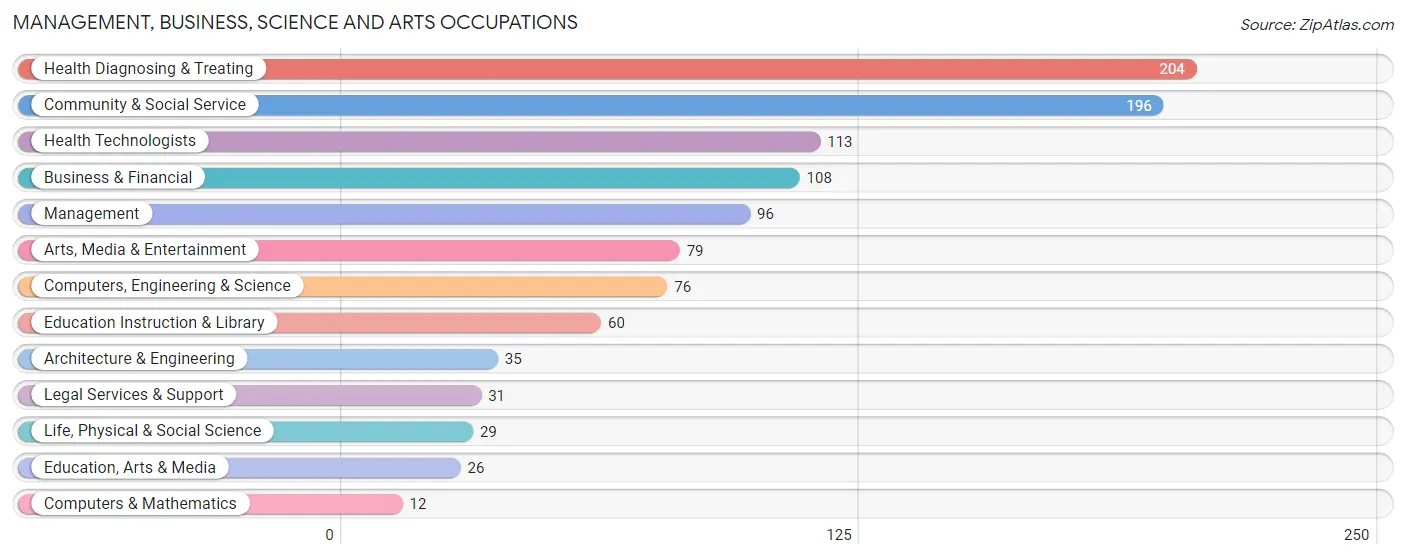
Management, Business, Science and Arts Occupations
The most common Management, Business, Science and Arts occupations in Westminster are Health Diagnosing & Treating (204 | 13.0%), Community & Social Service (196 | 12.5%), Health Technologists (113 | 7.2%), Business & Financial (108 | 6.9%), and Management (96 | 6.1%).
Management, Business, Science and Arts Occupations by Sex
Within the Management, Business, Science and Arts occupations in Westminster, the most male-oriented occupations are Computers, Engineering & Science (100.0%), Computers & Mathematics (100.0%), and Architecture & Engineering (100.0%), while the most female-oriented occupations are Education, Arts & Media (100.0%), Legal Services & Support (100.0%), and Health Technologists (83.2%).
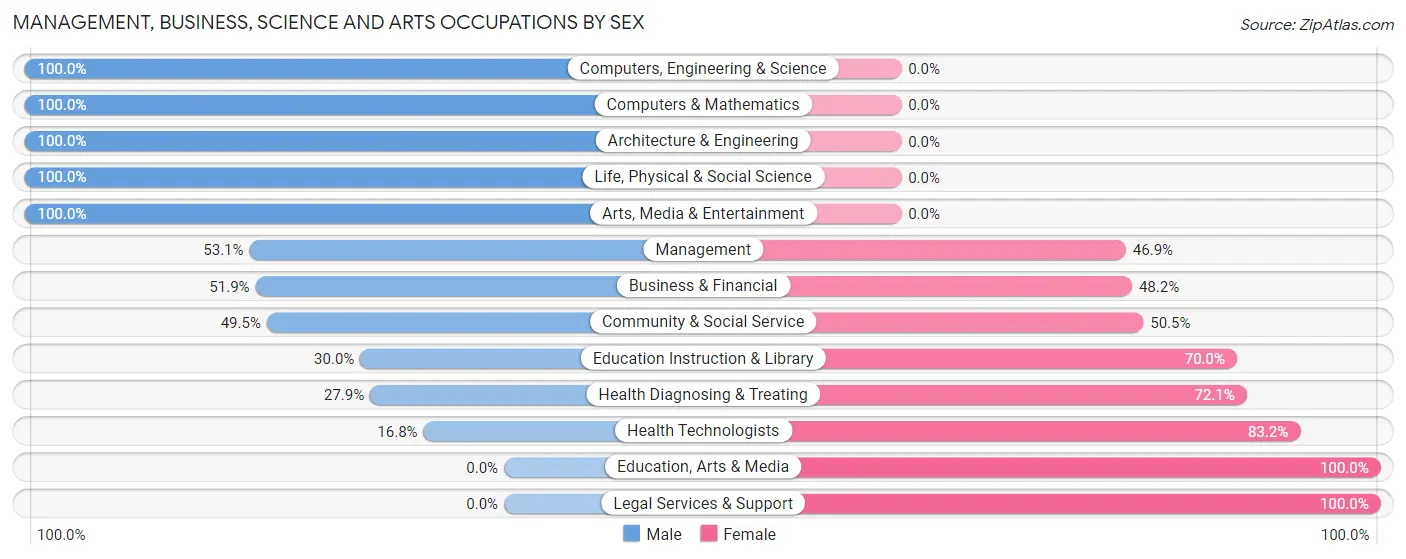
| Occupation | Male | Female |
| Management | 51 (53.1%) | 45 (46.9%) |
| Business & Financial | 56 (51.8%) | 52 (48.1%) |
| Computers, Engineering & Science | 76 (100.0%) | 0 (0.0%) |
| Computers & Mathematics | 12 (100.0%) | 0 (0.0%) |
| Architecture & Engineering | 35 (100.0%) | 0 (0.0%) |
| Life, Physical & Social Science | 29 (100.0%) | 0 (0.0%) |
| Community & Social Service | 97 (49.5%) | 99 (50.5%) |
| Education, Arts & Media | 0 (0.0%) | 26 (100.0%) |
| Legal Services & Support | 0 (0.0%) | 31 (100.0%) |
| Education Instruction & Library | 18 (30.0%) | 42 (70.0%) |
| Arts, Media & Entertainment | 79 (100.0%) | 0 (0.0%) |
| Health Diagnosing & Treating | 57 (27.9%) | 147 (72.1%) |
| Health Technologists | 19 (16.8%) | 94 (83.2%) |
| Total (Category) | 337 (49.6%) | 343 (50.4%) |
| Total (Overall) | 1,084 (69.3%) | 481 (30.7%) |
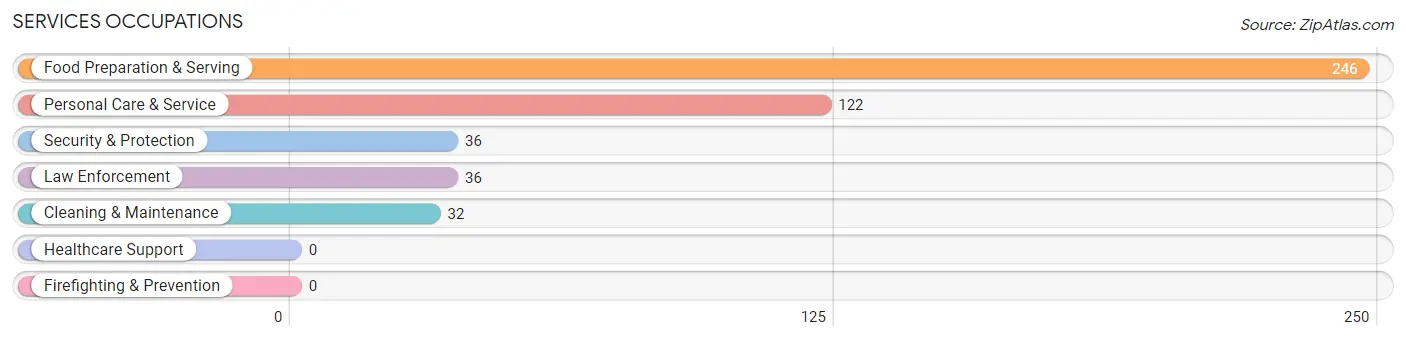
Services Occupations
The most common Services occupations in Westminster are Food Preparation & Serving (246 | 15.7%), Personal Care & Service (122 | 7.8%), Security & Protection (36 | 2.3%), Law Enforcement (36 | 2.3%), and Cleaning & Maintenance (32 | 2.0%).
Services Occupations by Sex
Within the Services occupations in Westminster, the most male-oriented occupations are Food Preparation & Serving (100.0%), Cleaning & Maintenance (100.0%), and Personal Care & Service (100.0%), while the most female-oriented occupations are Security & Protection (47.2%), and Law Enforcement (47.2%).
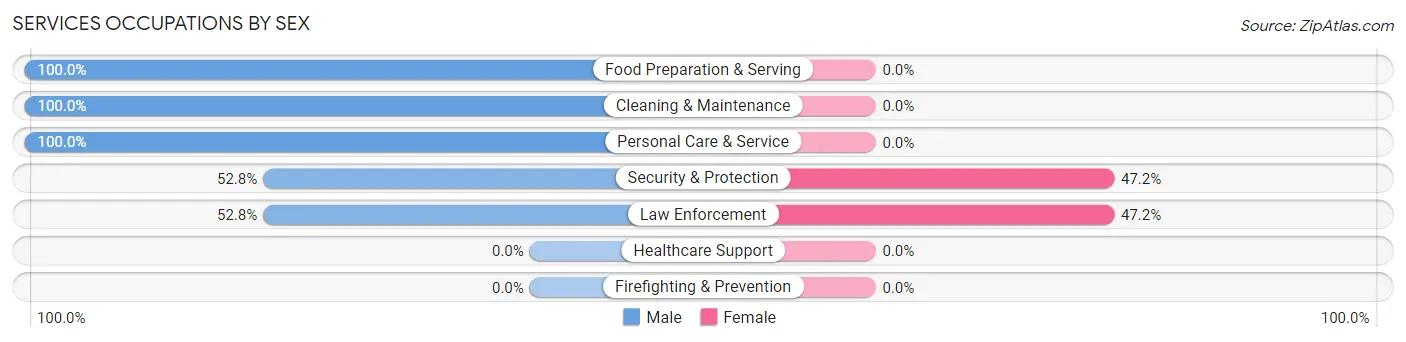
| Occupation | Male | Female |
| Healthcare Support | 0 (0.0%) | 0 (0.0%) |
| Security & Protection | 19 (52.8%) | 17 (47.2%) |
| Firefighting & Prevention | 0 (0.0%) | 0 (0.0%) |
| Law Enforcement | 19 (52.8%) | 17 (47.2%) |
| Food Preparation & Serving | 246 (100.0%) | 0 (0.0%) |
| Cleaning & Maintenance | 32 (100.0%) | 0 (0.0%) |
| Personal Care & Service | 122 (100.0%) | 0 (0.0%) |
| Total (Category) | 419 (96.1%) | 17 (3.9%) |
| Total (Overall) | 1,084 (69.3%) | 481 (30.7%) |
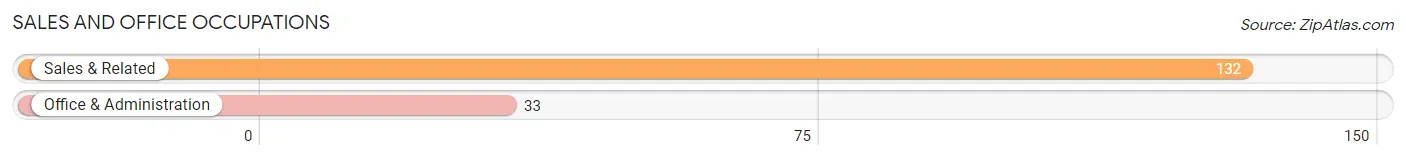
Sales and Office Occupations
The most common Sales and Office occupations in Westminster are Sales & Related (132 | 8.4%), and Office & Administration (33 | 2.1%).
Sales and Office Occupations by Sex
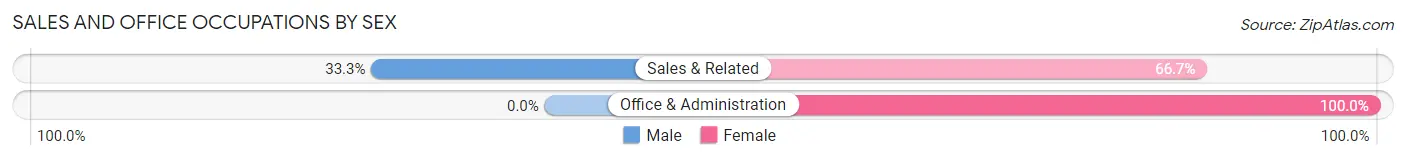
| Occupation | Male | Female |
| Sales & Related | 44 (33.3%) | 88 (66.7%) |
| Office & Administration | 0 (0.0%) | 33 (100.0%) |
| Total (Category) | 44 (26.7%) | 121 (73.3%) |
| Total (Overall) | 1,084 (69.3%) | 481 (30.7%) |
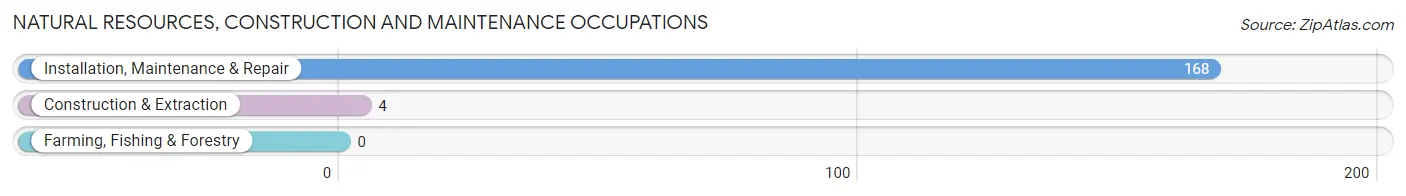
Natural Resources, Construction and Maintenance Occupations
The most common Natural Resources, Construction and Maintenance occupations in Westminster are Installation, Maintenance & Repair (168 | 10.7%), and Construction & Extraction (4 | 0.3%).
Natural Resources, Construction and Maintenance Occupations by Sex
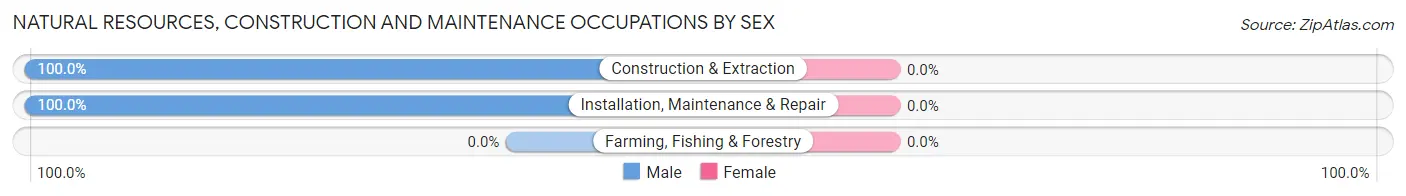
| Occupation | Male | Female |
| Farming, Fishing & Forestry | 0 (0.0%) | 0 (0.0%) |
| Construction & Extraction | 4 (100.0%) | 0 (0.0%) |
| Installation, Maintenance & Repair | 168 (100.0%) | 0 (0.0%) |
| Total (Category) | 172 (100.0%) | 0 (0.0%) |
| Total (Overall) | 1,084 (69.3%) | 481 (30.7%) |
Production, Transportation and Moving Occupations
The most common Production, Transportation and Moving occupations in Westminster are , and Production (112 | 7.2%).
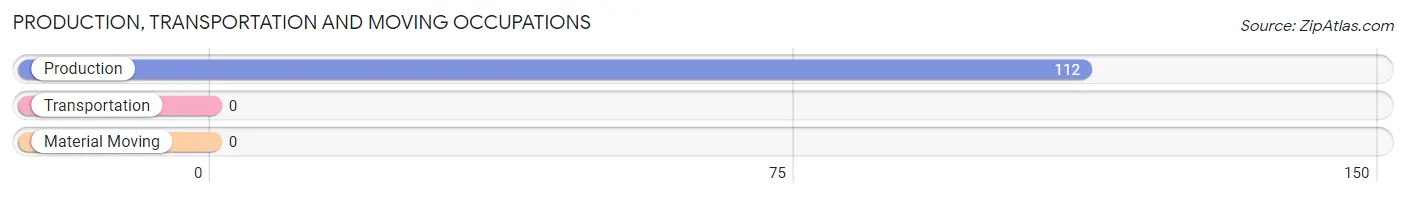
Production, Transportation and Moving Occupations by Sex
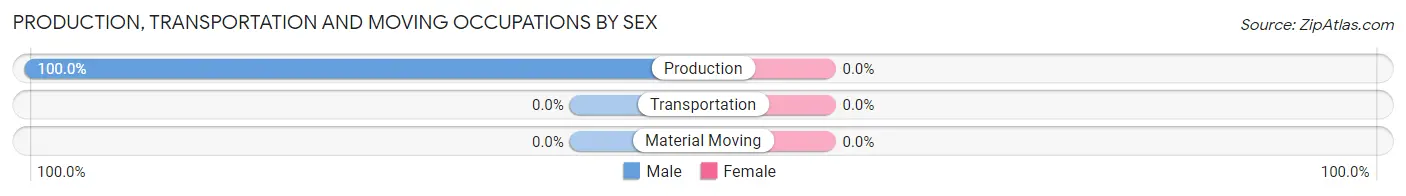
| Occupation | Male | Female |
| Production | 112 (100.0%) | 0 (0.0%) |
| Transportation | 0 (0.0%) | 0 (0.0%) |
| Material Moving | 0 (0.0%) | 0 (0.0%) |
| Total (Category) | 112 (100.0%) | 0 (0.0%) |
| Total (Overall) | 1,084 (69.3%) | 481 (30.7%) |
Employment Industries by Sex in Westminster
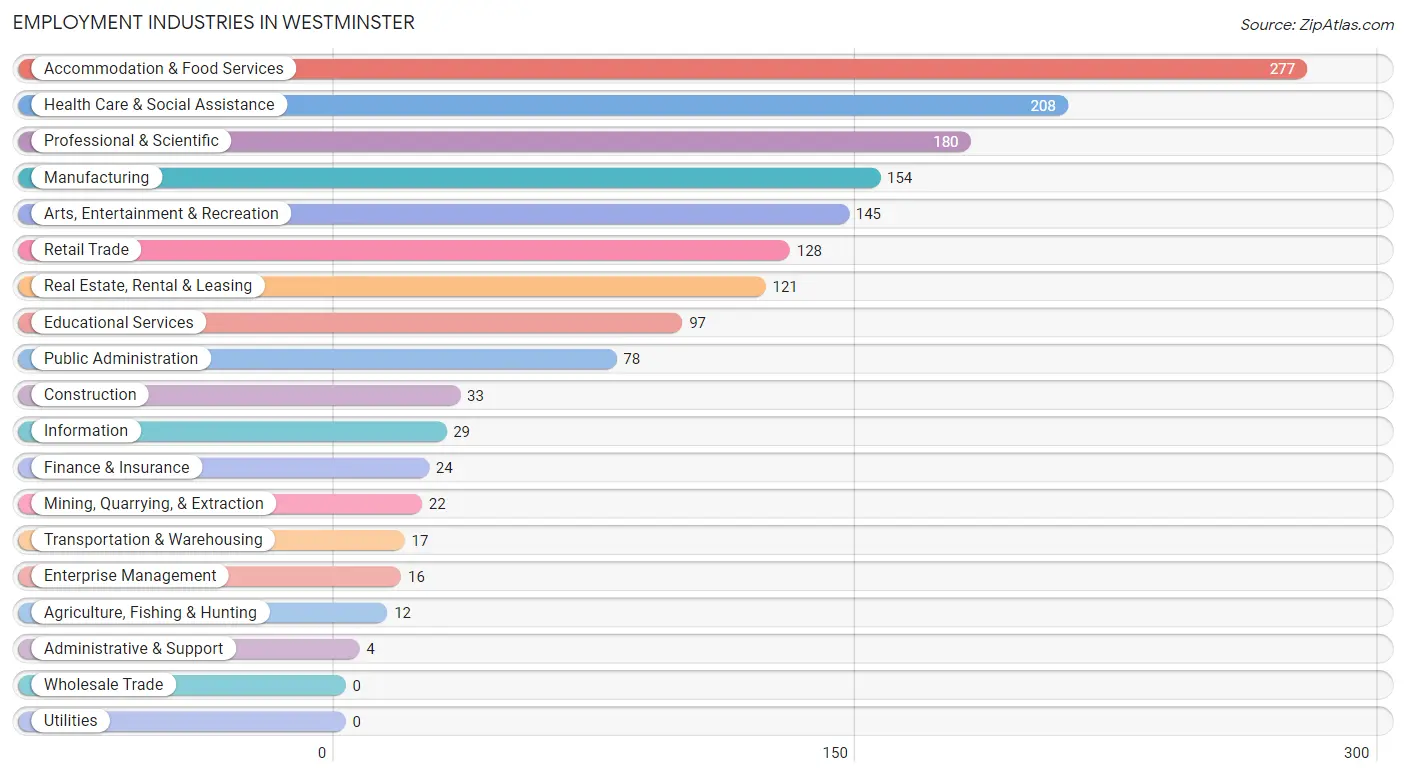
Employment Industries in Westminster
The major employment industries in Westminster include Accommodation & Food Services (277 | 17.7%), Health Care & Social Assistance (208 | 13.3%), Professional & Scientific (180 | 11.5%), Manufacturing (154 | 9.8%), and Arts, Entertainment & Recreation (145 | 9.3%).
Employment Industries by Sex in Westminster
The Westminster industries that see more men than women are Agriculture, Fishing & Hunting (100.0%), Mining, Quarrying, & Extraction (100.0%), and Information (100.0%), whereas the industries that tend to have a higher number of women are Transportation & Warehousing (100.0%), Enterprise Management (100.0%), and Construction (78.8%).
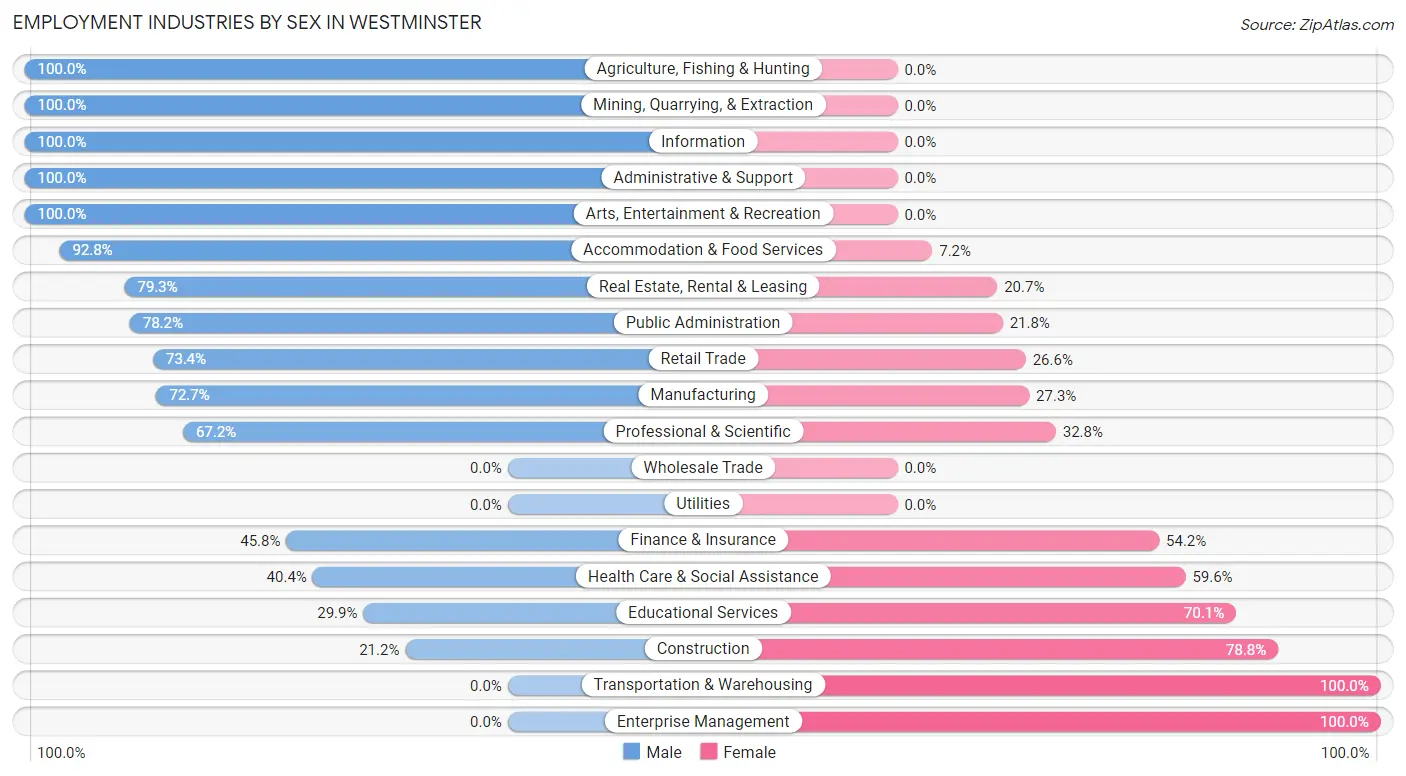
| Industry | Male | Female |
| Agriculture, Fishing & Hunting | 12 (100.0%) | 0 (0.0%) |
| Mining, Quarrying, & Extraction | 22 (100.0%) | 0 (0.0%) |
| Construction | 7 (21.2%) | 26 (78.8%) |
| Manufacturing | 112 (72.7%) | 42 (27.3%) |
| Wholesale Trade | 0 (0.0%) | 0 (0.0%) |
| Retail Trade | 94 (73.4%) | 34 (26.6%) |
| Transportation & Warehousing | 0 (0.0%) | 17 (100.0%) |
| Utilities | 0 (0.0%) | 0 (0.0%) |
| Information | 29 (100.0%) | 0 (0.0%) |
| Finance & Insurance | 11 (45.8%) | 13 (54.2%) |
| Real Estate, Rental & Leasing | 96 (79.3%) | 25 (20.7%) |
| Professional & Scientific | 121 (67.2%) | 59 (32.8%) |
| Enterprise Management | 0 (0.0%) | 16 (100.0%) |
| Administrative & Support | 4 (100.0%) | 0 (0.0%) |
| Educational Services | 29 (29.9%) | 68 (70.1%) |
| Health Care & Social Assistance | 84 (40.4%) | 124 (59.6%) |
| Arts, Entertainment & Recreation | 145 (100.0%) | 0 (0.0%) |
| Accommodation & Food Services | 257 (92.8%) | 20 (7.2%) |
| Public Administration | 61 (78.2%) | 17 (21.8%) |
| Total | 1,084 (69.3%) | 481 (30.7%) |
Education in Westminster
School Enrollment in Westminster
The most common levels of schooling among the 787 students in Westminster are college / undergraduate (448 | 56.9%), high school (88 | 11.2%), and middle school (66 | 8.4%).
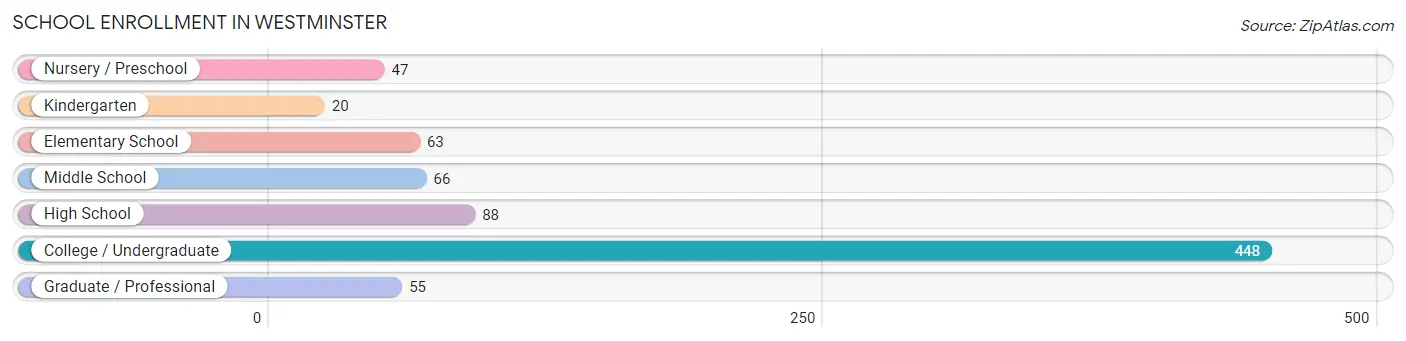
| School Level | # Students | % Students |
| Nursery / Preschool | 47 | 6.0% |
| Kindergarten | 20 | 2.5% |
| Elementary School | 63 | 8.0% |
| Middle School | 66 | 8.4% |
| High School | 88 | 11.2% |
| College / Undergraduate | 448 | 56.9% |
| Graduate / Professional | 55 | 7.0% |
| Total | 787 | 100.0% |
School Enrollment by Age by Funding Source in Westminster
Out of a total of 787 students who are enrolled in schools in Westminster, 214 (27.2%) attend a private institution, while the remaining 573 (72.8%) are enrolled in public schools. The age group of 3 to 4 year olds has the highest likelihood of being enrolled in private schools, with 47 (100.0% in the age bracket) enrolled. Conversely, the age group of 15 to 17 year olds has the lowest likelihood of being enrolled in a private school, with 45 (100.0% in the age bracket) attending a public institution.
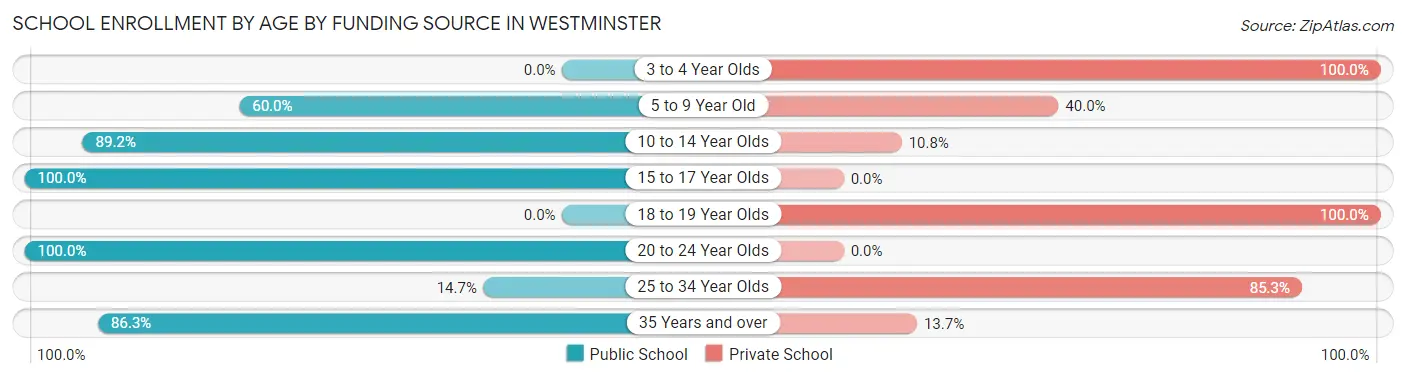
| Age Bracket | Public School | Private School |
| 3 to 4 Year Olds | 0 (0.0%) | 47 (100.0%) |
| 5 to 9 Year Old | 45 (60.0%) | 30 (40.0%) |
| 10 to 14 Year Olds | 66 (89.2%) | 8 (10.8%) |
| 15 to 17 Year Olds | 45 (100.0%) | 0 (0.0%) |
| 18 to 19 Year Olds | 0 (0.0%) | 43 (100.0%) |
| 20 to 24 Year Olds | 267 (100.0%) | 0 (0.0%) |
| 25 to 34 Year Olds | 11 (14.7%) | 64 (85.3%) |
| 35 Years and over | 139 (86.3%) | 22 (13.7%) |
| Total | 573 (72.8%) | 214 (27.2%) |
Educational Attainment by Field of Study in Westminster
Business (211 | 18.4%), engineering (160 | 14.0%), science & technology (137 | 12.0%), bio, nature & agricultural (105 | 9.2%), and visual & performing arts (74 | 6.5%) are the most common fields of study among 1,144 individuals in Westminster who have obtained a bachelor's degree or higher.
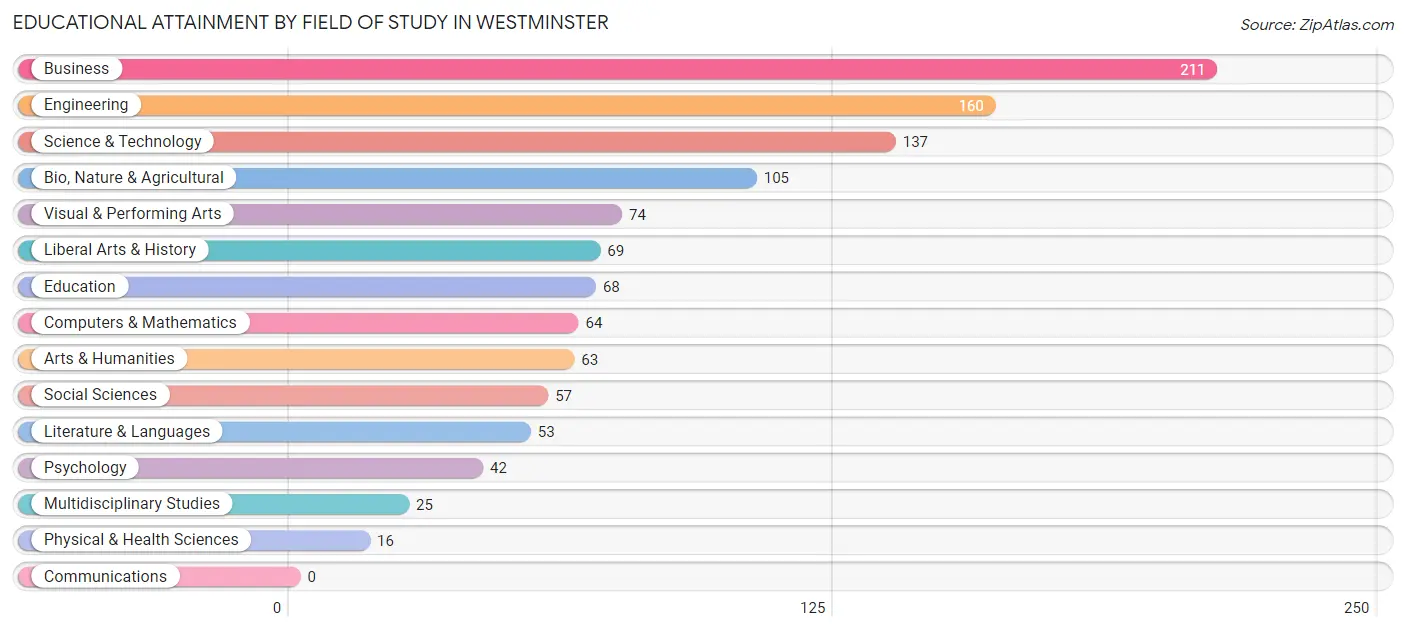
| Field of Study | # Graduates | % Graduates |
| Computers & Mathematics | 64 | 5.6% |
| Bio, Nature & Agricultural | 105 | 9.2% |
| Physical & Health Sciences | 16 | 1.4% |
| Psychology | 42 | 3.7% |
| Social Sciences | 57 | 5.0% |
| Engineering | 160 | 14.0% |
| Multidisciplinary Studies | 25 | 2.2% |
| Science & Technology | 137 | 12.0% |
| Business | 211 | 18.4% |
| Education | 68 | 5.9% |
| Literature & Languages | 53 | 4.6% |
| Liberal Arts & History | 69 | 6.0% |
| Visual & Performing Arts | 74 | 6.5% |
| Communications | 0 | 0.0% |
| Arts & Humanities | 63 | 5.5% |
| Total | 1,144 | 100.0% |
Transportation & Commute in Westminster
Vehicle Availability by Sex in Westminster
The most prevalent vehicle ownership categories in Westminster are males with 2 vehicles (336, accounting for 30.7%) and females with 2 vehicles (227, making up 69.9%).
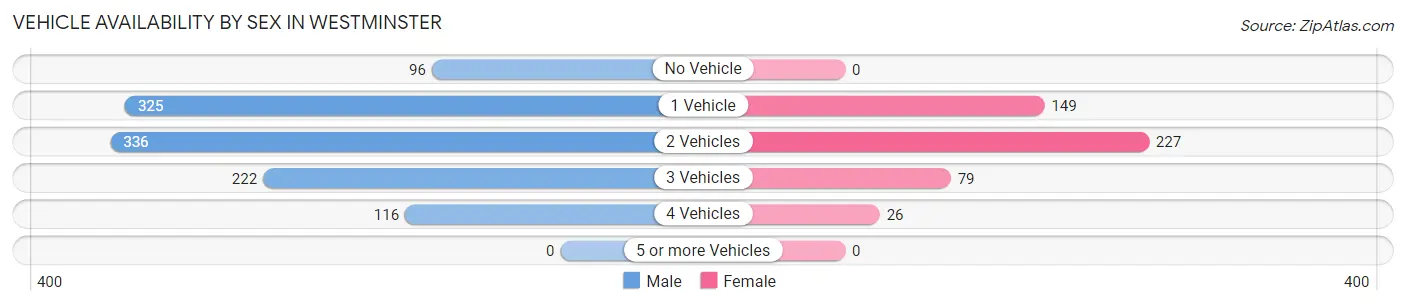
| Vehicles Available | Male | Female |
| No Vehicle | 96 (8.8%) | 0 (0.0%) |
| 1 Vehicle | 325 (29.7%) | 149 (31.0%) |
| 2 Vehicles | 336 (30.7%) | 227 (47.2%) |
| 3 Vehicles | 222 (20.3%) | 79 (16.4%) |
| 4 Vehicles | 116 (10.6%) | 26 (5.4%) |
| 5 or more Vehicles | 0 (0.0%) | 0 (0.0%) |
| Total | 1,095 (100.0%) | 481 (100.0%) |
Commute Time in Westminster
The most frequently occuring commute durations in Westminster are 15 to 19 minutes (403 commuters, 27.2%), 30 to 34 minutes (320 commuters, 21.6%), and 20 to 24 minutes (252 commuters, 17.0%).
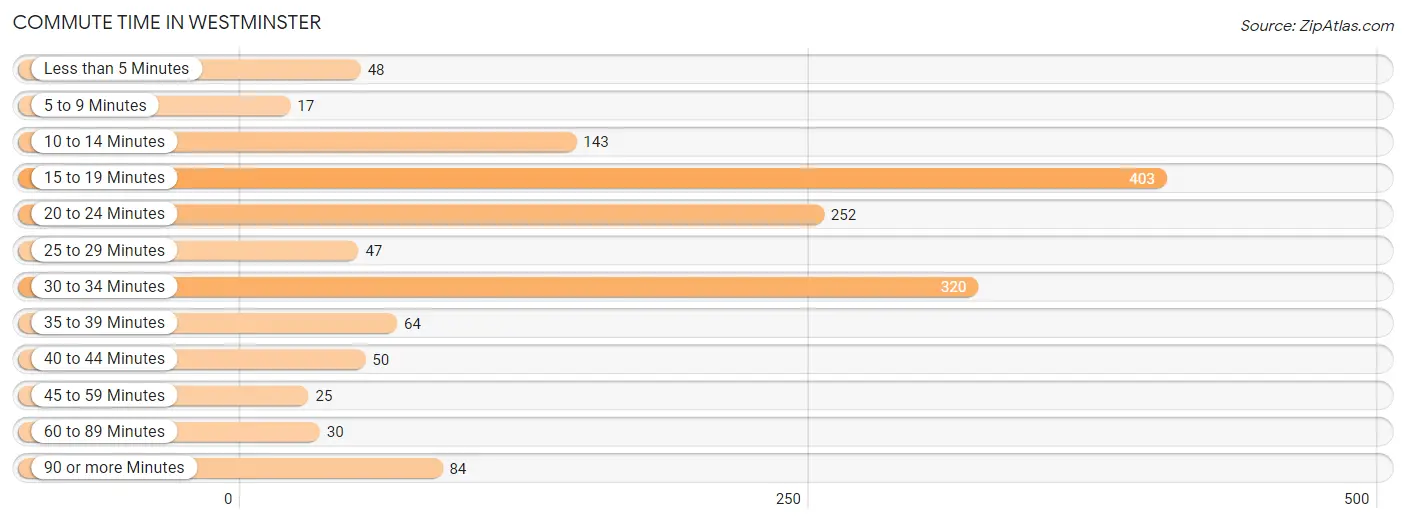
| Commute Time | # Commuters | % Commuters |
| Less than 5 Minutes | 48 | 3.2% |
| 5 to 9 Minutes | 17 | 1.1% |
| 10 to 14 Minutes | 143 | 9.6% |
| 15 to 19 Minutes | 403 | 27.2% |
| 20 to 24 Minutes | 252 | 17.0% |
| 25 to 29 Minutes | 47 | 3.2% |
| 30 to 34 Minutes | 320 | 21.6% |
| 35 to 39 Minutes | 64 | 4.3% |
| 40 to 44 Minutes | 50 | 3.4% |
| 45 to 59 Minutes | 25 | 1.7% |
| 60 to 89 Minutes | 30 | 2.0% |
| 90 or more Minutes | 84 | 5.7% |
Commute Time by Sex in Westminster
The most common commute times in Westminster are 15 to 19 minutes (266 commuters, 25.6%) for males and 15 to 19 minutes (137 commuters, 30.8%) for females.
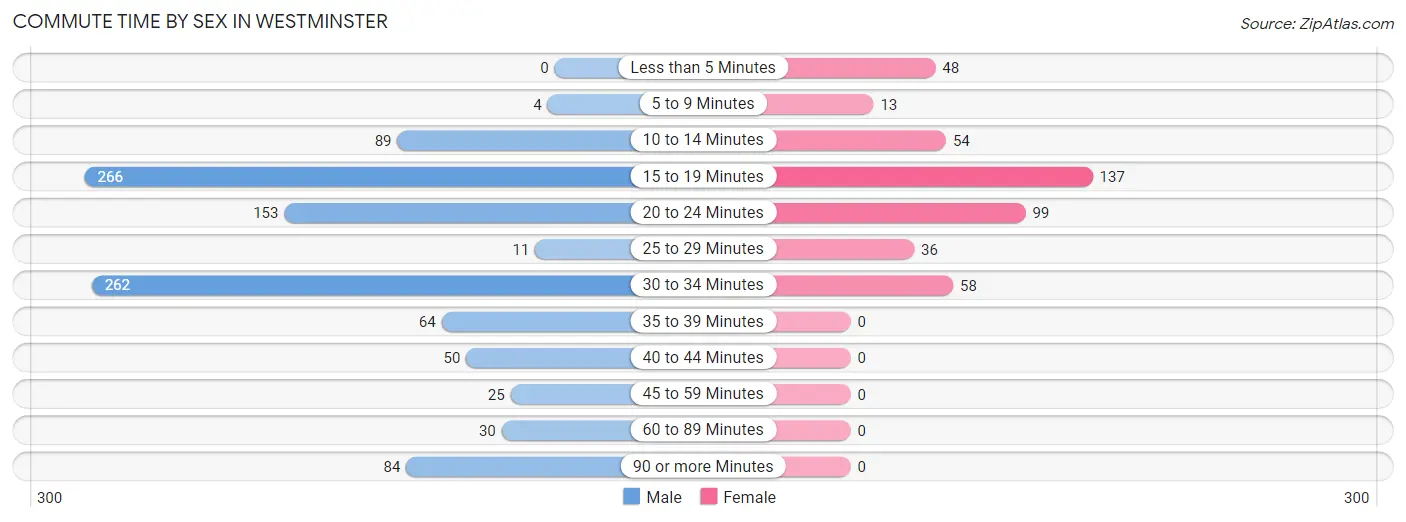
| Commute Time | Male | Female |
| Less than 5 Minutes | 0 (0.0%) | 48 (10.8%) |
| 5 to 9 Minutes | 4 (0.4%) | 13 (2.9%) |
| 10 to 14 Minutes | 89 (8.6%) | 54 (12.1%) |
| 15 to 19 Minutes | 266 (25.6%) | 137 (30.8%) |
| 20 to 24 Minutes | 153 (14.7%) | 99 (22.3%) |
| 25 to 29 Minutes | 11 (1.1%) | 36 (8.1%) |
| 30 to 34 Minutes | 262 (25.2%) | 58 (13.0%) |
| 35 to 39 Minutes | 64 (6.2%) | 0 (0.0%) |
| 40 to 44 Minutes | 50 (4.8%) | 0 (0.0%) |
| 45 to 59 Minutes | 25 (2.4%) | 0 (0.0%) |
| 60 to 89 Minutes | 30 (2.9%) | 0 (0.0%) |
| 90 or more Minutes | 84 (8.1%) | 0 (0.0%) |
Time of Departure to Work by Sex in Westminster
The most frequent times of departure to work in Westminster are 8:00 AM to 8:29 AM (268, 25.8%) for males and 7:00 AM to 7:29 AM (147, 33.0%) for females.
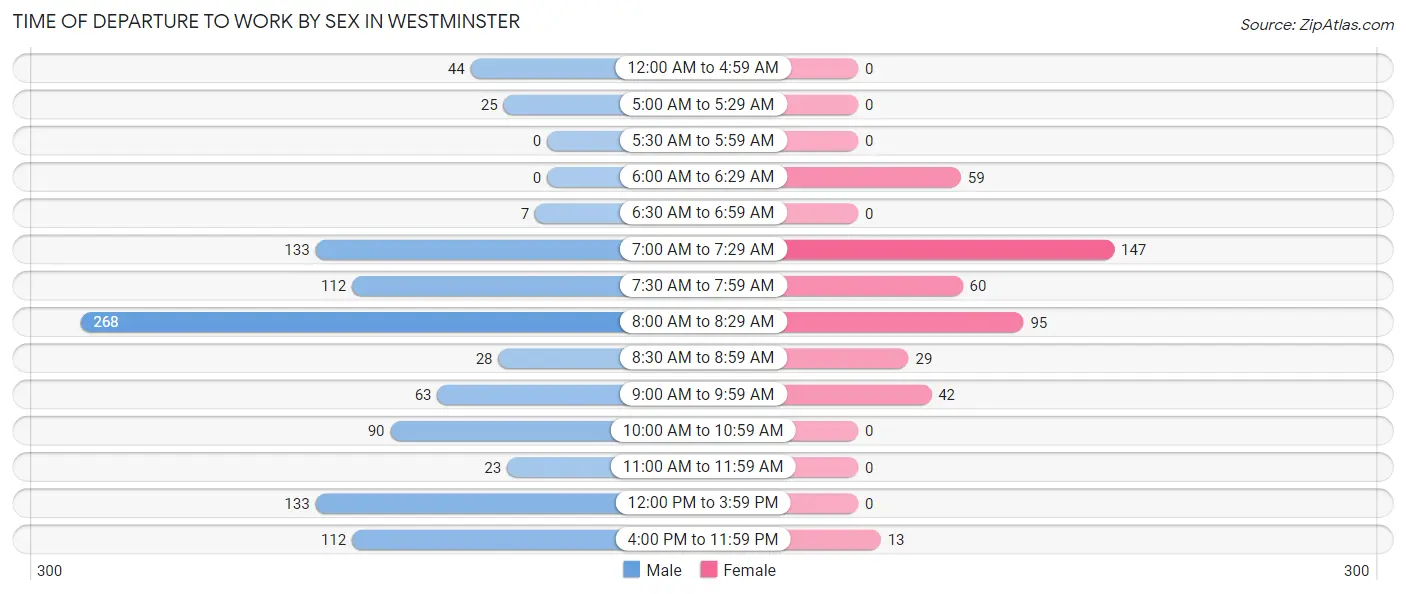
| Time of Departure | Male | Female |
| 12:00 AM to 4:59 AM | 44 (4.2%) | 0 (0.0%) |
| 5:00 AM to 5:29 AM | 25 (2.4%) | 0 (0.0%) |
| 5:30 AM to 5:59 AM | 0 (0.0%) | 0 (0.0%) |
| 6:00 AM to 6:29 AM | 0 (0.0%) | 59 (13.3%) |
| 6:30 AM to 6:59 AM | 7 (0.7%) | 0 (0.0%) |
| 7:00 AM to 7:29 AM | 133 (12.8%) | 147 (33.0%) |
| 7:30 AM to 7:59 AM | 112 (10.8%) | 60 (13.5%) |
| 8:00 AM to 8:29 AM | 268 (25.8%) | 95 (21.3%) |
| 8:30 AM to 8:59 AM | 28 (2.7%) | 29 (6.5%) |
| 9:00 AM to 9:59 AM | 63 (6.1%) | 42 (9.4%) |
| 10:00 AM to 10:59 AM | 90 (8.7%) | 0 (0.0%) |
| 11:00 AM to 11:59 AM | 23 (2.2%) | 0 (0.0%) |
| 12:00 PM to 3:59 PM | 133 (12.8%) | 0 (0.0%) |
| 4:00 PM to 11:59 PM | 112 (10.8%) | 13 (2.9%) |
| Total | 1,038 (100.0%) | 445 (100.0%) |
Housing Occupancy in Westminster
Occupancy by Ownership in Westminster
Of the total 1,363 dwellings in Westminster, owner-occupied units account for 1,023 (75.1%), while renter-occupied units make up 340 (24.9%).
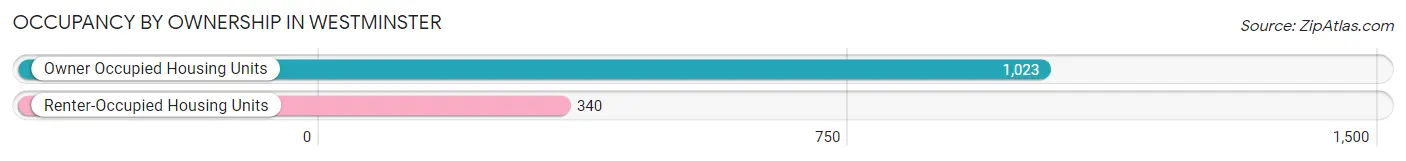
| Occupancy | # Housing Units | % Housing Units |
| Owner Occupied Housing Units | 1,023 | 75.1% |
| Renter-Occupied Housing Units | 340 | 24.9% |
| Total Occupied Housing Units | 1,363 | 100.0% |
Occupancy by Household Size in Westminster
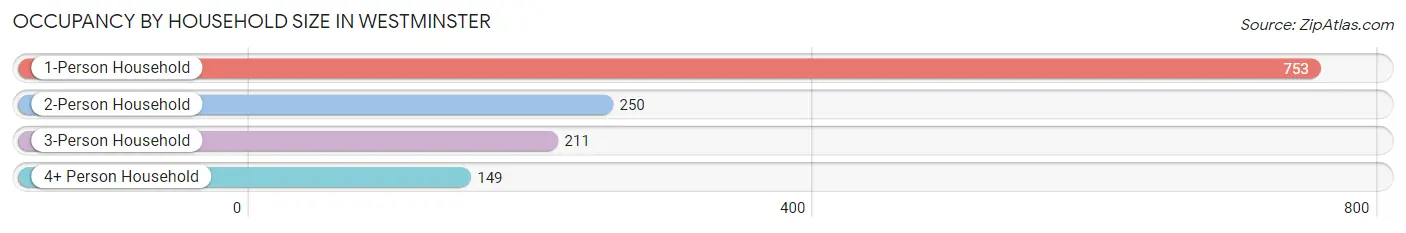
| Household Size | # Housing Units | % Housing Units |
| 1-Person Household | 753 | 55.2% |
| 2-Person Household | 250 | 18.3% |
| 3-Person Household | 211 | 15.5% |
| 4+ Person Household | 149 | 10.9% |
| Total Housing Units | 1,363 | 100.0% |
Occupancy by Ownership by Household Size in Westminster
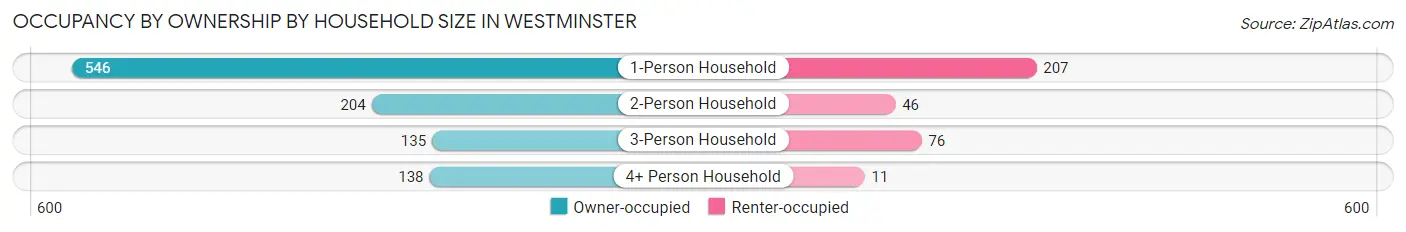
| Household Size | Owner-occupied | Renter-occupied |
| 1-Person Household | 546 (72.5%) | 207 (27.5%) |
| 2-Person Household | 204 (81.6%) | 46 (18.4%) |
| 3-Person Household | 135 (64.0%) | 76 (36.0%) |
| 4+ Person Household | 138 (92.6%) | 11 (7.4%) |
| Total Housing Units | 1,023 (75.1%) | 340 (24.9%) |
Occupancy by Educational Attainment in Westminster
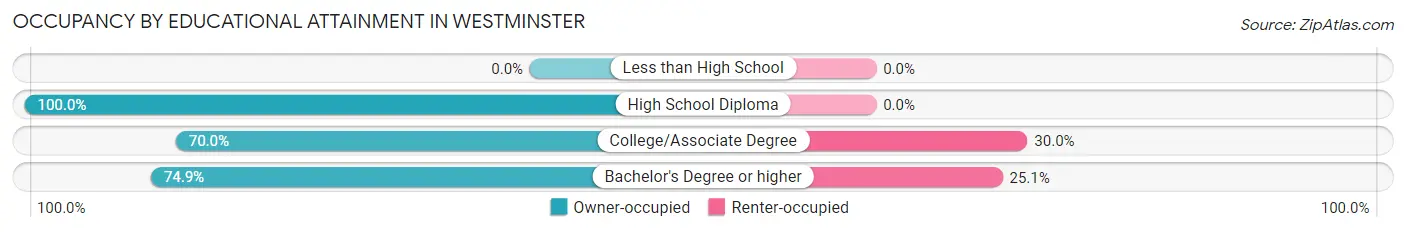
| Household Size | Owner-occupied | Renter-occupied |
| Less than High School | 0 (0.0%) | 0 (0.0%) |
| High School Diploma | 98 (100.0%) | 0 (0.0%) |
| College/Associate Degree | 327 (70.0%) | 140 (30.0%) |
| Bachelor's Degree or higher | 598 (74.9%) | 200 (25.1%) |
Occupancy by Age of Householder in Westminster
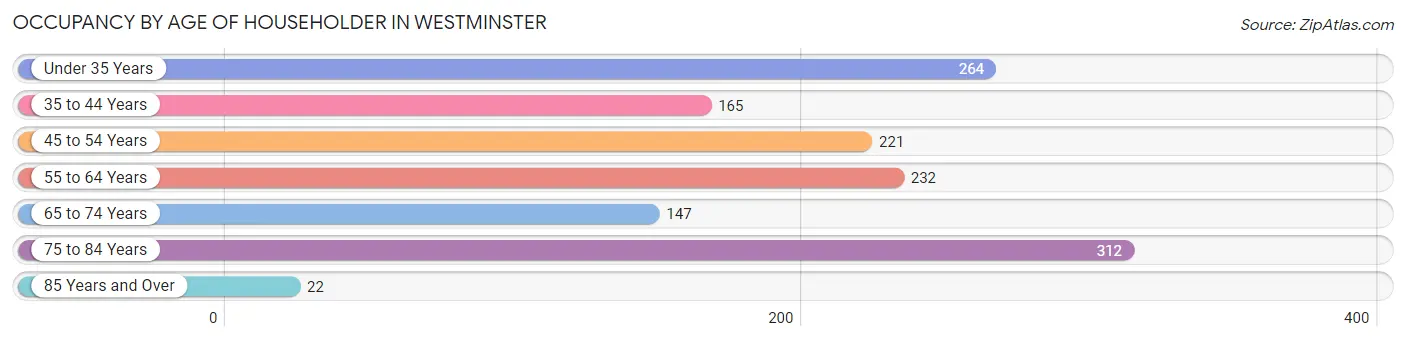
| Age Bracket | # Households | % Households |
| Under 35 Years | 264 | 19.4% |
| 35 to 44 Years | 165 | 12.1% |
| 45 to 54 Years | 221 | 16.2% |
| 55 to 64 Years | 232 | 17.0% |
| 65 to 74 Years | 147 | 10.8% |
| 75 to 84 Years | 312 | 22.9% |
| 85 Years and Over | 22 | 1.6% |
| Total | 1,363 | 100.0% |
Housing Finances in Westminster
Median Income by Occupancy in Westminster
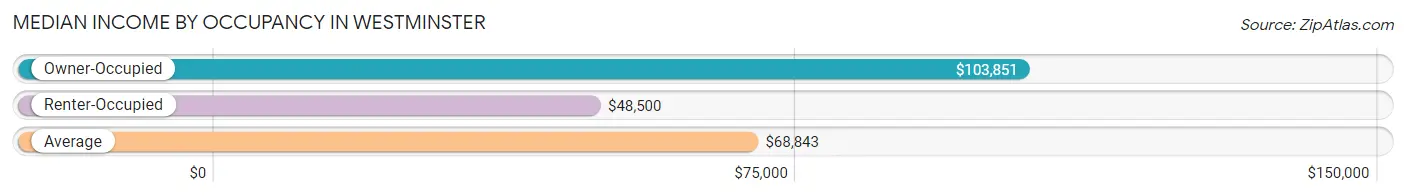
| Occupancy Type | # Households | Median Income |
| Owner-Occupied | 1,023 (75.1%) | $103,851 |
| Renter-Occupied | 340 (24.9%) | $48,500 |
| Average | 1,363 (100.0%) | $68,843 |
Occupancy by Householder Income Bracket in Westminster
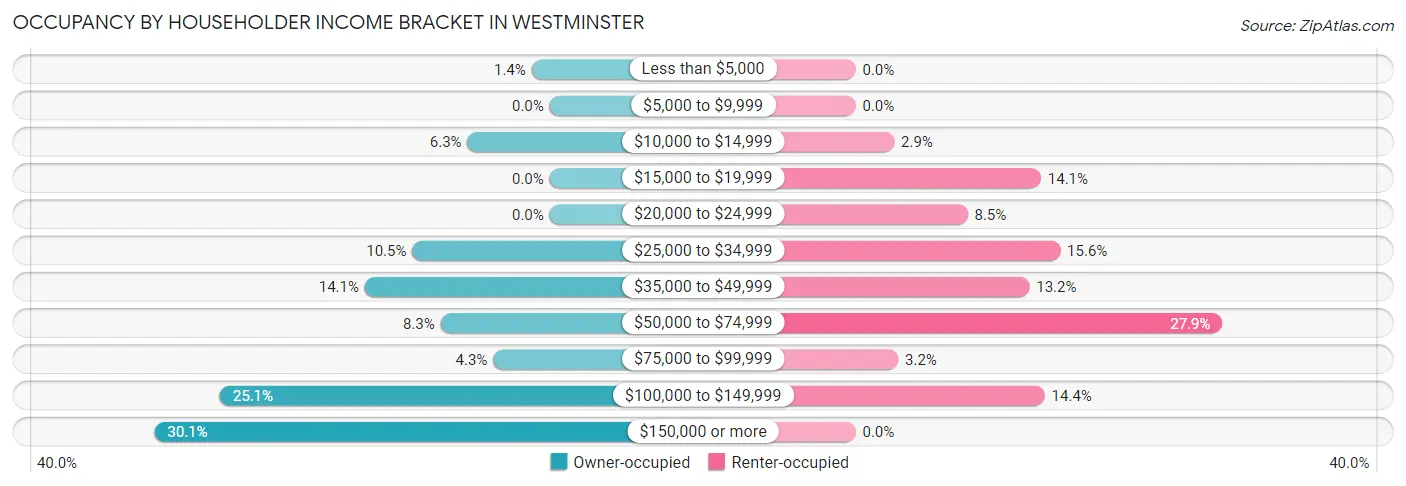
| Income Bracket | Owner-occupied | Renter-occupied |
| Less than $5,000 | 14 (1.4%) | 0 (0.0%) |
| $5,000 to $9,999 | 0 (0.0%) | 0 (0.0%) |
| $10,000 to $14,999 | 64 (6.3%) | 10 (2.9%) |
| $15,000 to $19,999 | 0 (0.0%) | 48 (14.1%) |
| $20,000 to $24,999 | 0 (0.0%) | 29 (8.5%) |
| $25,000 to $34,999 | 107 (10.5%) | 53 (15.6%) |
| $35,000 to $49,999 | 144 (14.1%) | 45 (13.2%) |
| $50,000 to $74,999 | 85 (8.3%) | 95 (27.9%) |
| $75,000 to $99,999 | 44 (4.3%) | 11 (3.2%) |
| $100,000 to $149,999 | 257 (25.1%) | 49 (14.4%) |
| $150,000 or more | 308 (30.1%) | 0 (0.0%) |
| Total | 1,023 (100.0%) | 340 (100.0%) |
Monthly Housing Cost Tiers in Westminster
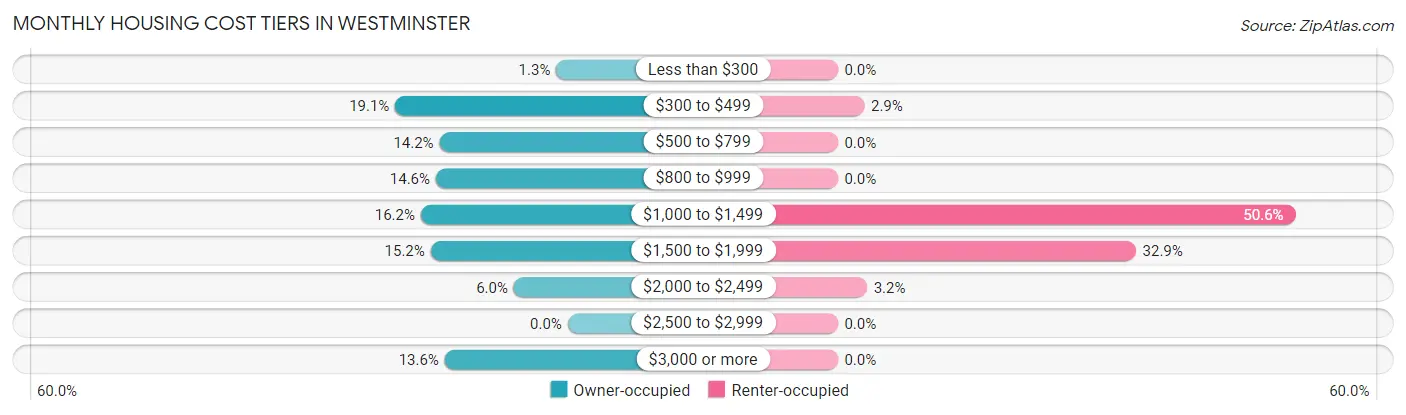
| Monthly Cost | Owner-occupied | Renter-occupied |
| Less than $300 | 13 (1.3%) | 0 (0.0%) |
| $300 to $499 | 195 (19.1%) | 10 (2.9%) |
| $500 to $799 | 145 (14.2%) | 0 (0.0%) |
| $800 to $999 | 149 (14.6%) | 0 (0.0%) |
| $1,000 to $1,499 | 166 (16.2%) | 172 (50.6%) |
| $1,500 to $1,999 | 155 (15.1%) | 112 (32.9%) |
| $2,000 to $2,499 | 61 (6.0%) | 11 (3.2%) |
| $2,500 to $2,999 | 0 (0.0%) | 0 (0.0%) |
| $3,000 or more | 139 (13.6%) | 0 (0.0%) |
| Total | 1,023 (100.0%) | 340 (100.0%) |
Physical Housing Characteristics in Westminster
Housing Structures in Westminster
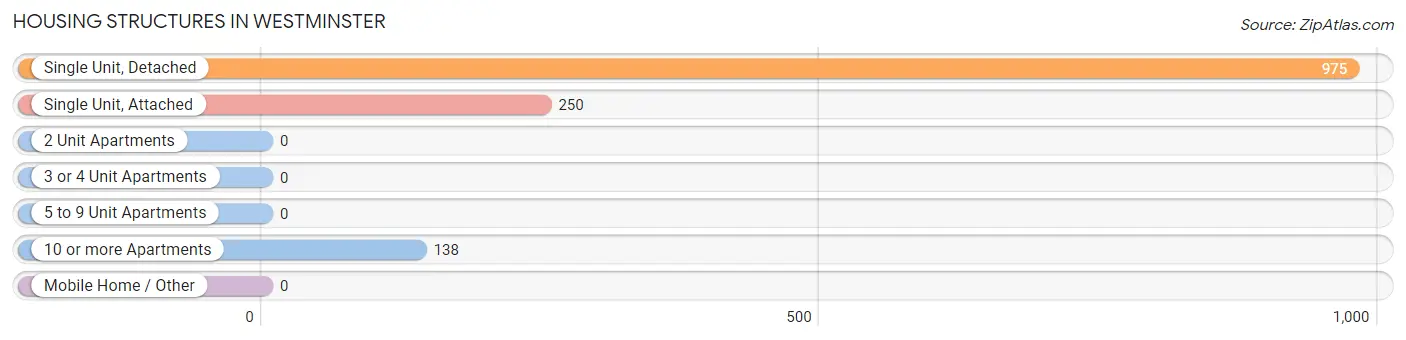
| Structure Type | # Housing Units | % Housing Units |
| Single Unit, Detached | 975 | 71.5% |
| Single Unit, Attached | 250 | 18.3% |
| 2 Unit Apartments | 0 | 0.0% |
| 3 or 4 Unit Apartments | 0 | 0.0% |
| 5 to 9 Unit Apartments | 0 | 0.0% |
| 10 or more Apartments | 138 | 10.1% |
| Mobile Home / Other | 0 | 0.0% |
| Total | 1,363 | 100.0% |
Housing Structures by Occupancy in Westminster
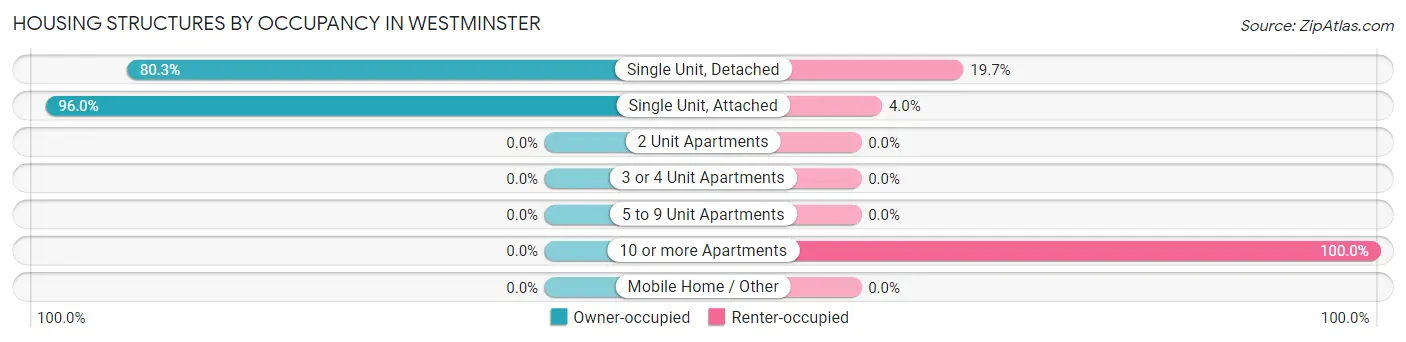
| Structure Type | Owner-occupied | Renter-occupied |
| Single Unit, Detached | 783 (80.3%) | 192 (19.7%) |
| Single Unit, Attached | 240 (96.0%) | 10 (4.0%) |
| 2 Unit Apartments | 0 (0.0%) | 0 (0.0%) |
| 3 or 4 Unit Apartments | 0 (0.0%) | 0 (0.0%) |
| 5 to 9 Unit Apartments | 0 (0.0%) | 0 (0.0%) |
| 10 or more Apartments | 0 (0.0%) | 138 (100.0%) |
| Mobile Home / Other | 0 (0.0%) | 0 (0.0%) |
| Total | 1,023 (75.1%) | 340 (24.9%) |
Housing Structures by Number of Rooms in Westminster
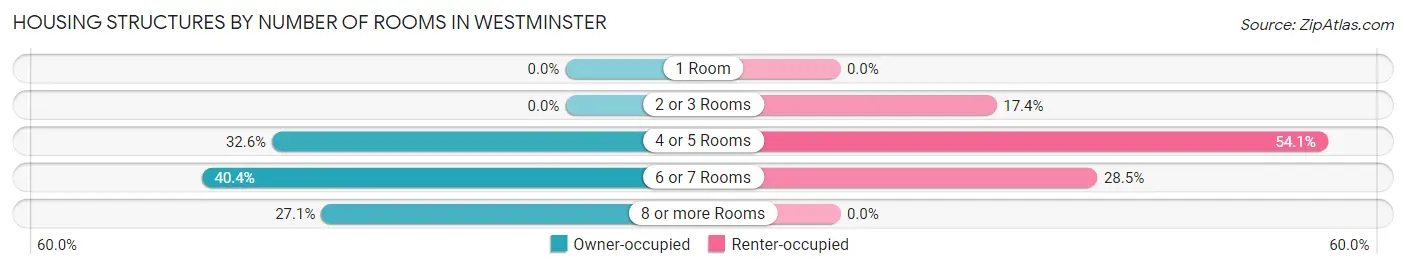
| Number of Rooms | Owner-occupied | Renter-occupied |
| 1 Room | 0 (0.0%) | 0 (0.0%) |
| 2 or 3 Rooms | 0 (0.0%) | 59 (17.3%) |
| 4 or 5 Rooms | 333 (32.6%) | 184 (54.1%) |
| 6 or 7 Rooms | 413 (40.4%) | 97 (28.5%) |
| 8 or more Rooms | 277 (27.1%) | 0 (0.0%) |
| Total | 1,023 (100.0%) | 340 (100.0%) |
Housing Structure by Heating Type in Westminster
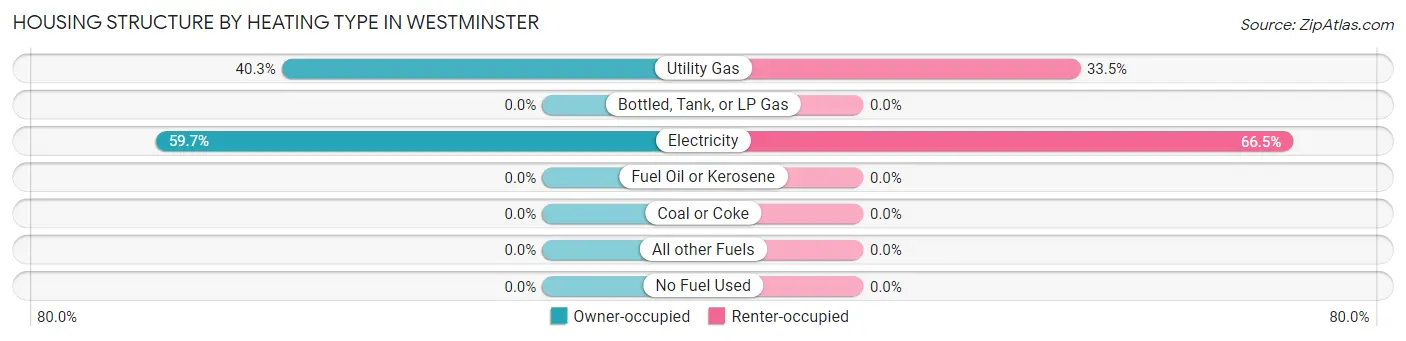
| Heating Type | Owner-occupied | Renter-occupied |
| Utility Gas | 412 (40.3%) | 114 (33.5%) |
| Bottled, Tank, or LP Gas | 0 (0.0%) | 0 (0.0%) |
| Electricity | 611 (59.7%) | 226 (66.5%) |
| Fuel Oil or Kerosene | 0 (0.0%) | 0 (0.0%) |
| Coal or Coke | 0 (0.0%) | 0 (0.0%) |
| All other Fuels | 0 (0.0%) | 0 (0.0%) |
| No Fuel Used | 0 (0.0%) | 0 (0.0%) |
| Total | 1,023 (100.0%) | 340 (100.0%) |
Household Vehicle Usage in Westminster
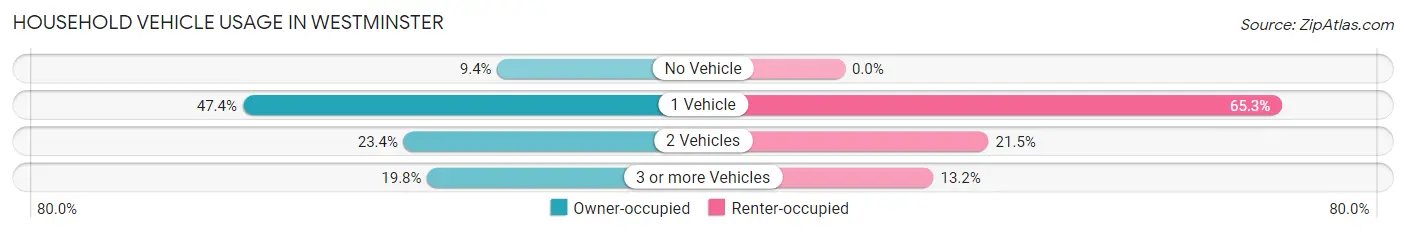
| Vehicles per Household | Owner-occupied | Renter-occupied |
| No Vehicle | 96 (9.4%) | 0 (0.0%) |
| 1 Vehicle | 485 (47.4%) | 222 (65.3%) |
| 2 Vehicles | 239 (23.4%) | 73 (21.5%) |
| 3 or more Vehicles | 203 (19.8%) | 45 (13.2%) |
| Total | 1,023 (100.0%) | 340 (100.0%) |
Real Estate & Mortgages in Westminster
Real Estate and Mortgage Overview in Westminster
| Characteristic | Without Mortgage | With Mortgage |
| Housing Units | 388 | 635 |
| Median Property Value | $207,100 | $255,300 |
| Median Household Income | $103,526 | $198 |
| Monthly Housing Costs | $484 | $139 |
| Real Estate Taxes | $1,398 | $0 |
Property Value by Mortgage Status in Westminster
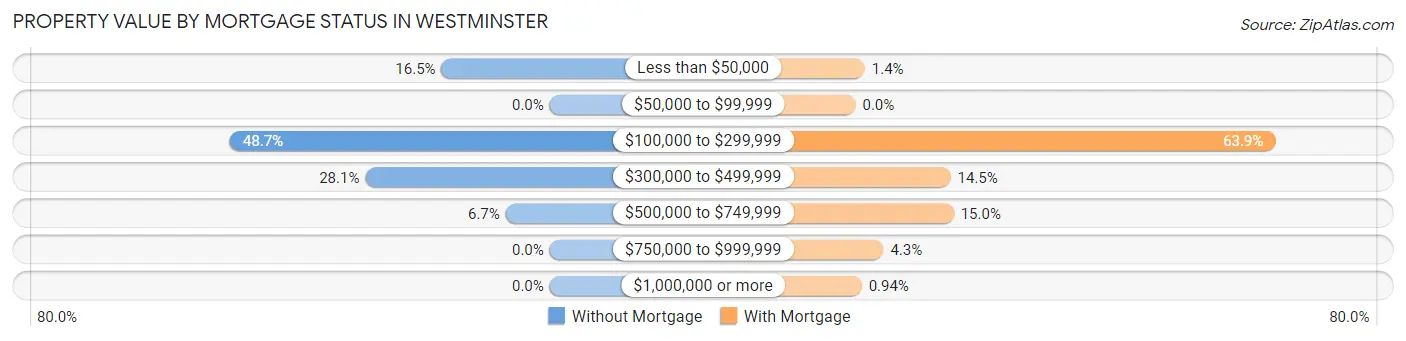
| Property Value | Without Mortgage | With Mortgage |
| Less than $50,000 | 64 (16.5%) | 9 (1.4%) |
| $50,000 to $99,999 | 0 (0.0%) | 0 (0.0%) |
| $100,000 to $299,999 | 189 (48.7%) | 406 (63.9%) |
| $300,000 to $499,999 | 109 (28.1%) | 92 (14.5%) |
| $500,000 to $749,999 | 26 (6.7%) | 95 (15.0%) |
| $750,000 to $999,999 | 0 (0.0%) | 27 (4.3%) |
| $1,000,000 or more | 0 (0.0%) | 6 (0.9%) |
| Total | 388 (100.0%) | 635 (100.0%) |
Household Income by Mortgage Status in Westminster
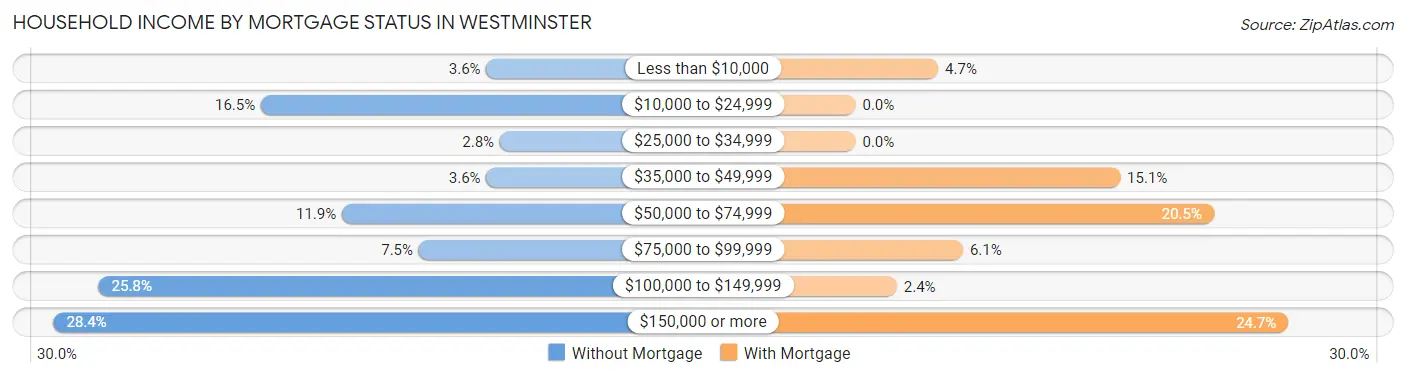
| Household Income | Without Mortgage | With Mortgage |
| Less than $10,000 | 14 (3.6%) | 30 (4.7%) |
| $10,000 to $24,999 | 64 (16.5%) | 0 (0.0%) |
| $25,000 to $34,999 | 11 (2.8%) | 0 (0.0%) |
| $35,000 to $49,999 | 14 (3.6%) | 96 (15.1%) |
| $50,000 to $74,999 | 46 (11.9%) | 130 (20.5%) |
| $75,000 to $99,999 | 29 (7.5%) | 39 (6.1%) |
| $100,000 to $149,999 | 100 (25.8%) | 15 (2.4%) |
| $150,000 or more | 110 (28.3%) | 157 (24.7%) |
| Total | 388 (100.0%) | 635 (100.0%) |
Property Value to Household Income Ratio in Westminster
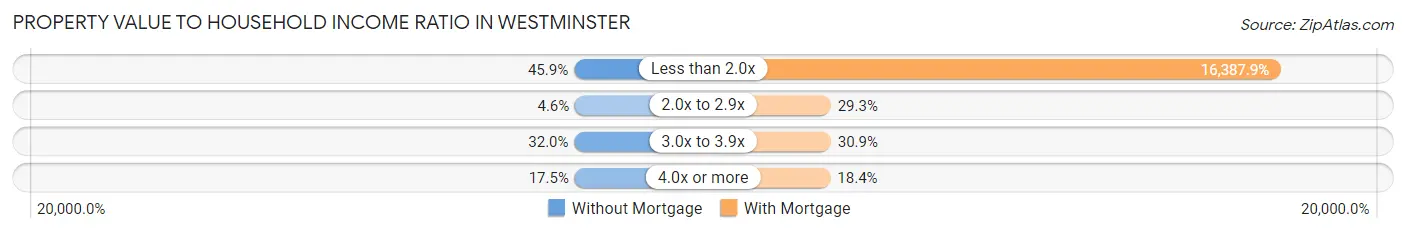
| Value-to-Income Ratio | Without Mortgage | With Mortgage |
| Less than 2.0x | 178 (45.9%) | 104,063 (16,387.9%) |
| 2.0x to 2.9x | 18 (4.6%) | 186 (29.3%) |
| 3.0x to 3.9x | 124 (32.0%) | 196 (30.9%) |
| 4.0x or more | 68 (17.5%) | 117 (18.4%) |
| Total | 388 (100.0%) | 635 (100.0%) |
Real Estate Taxes by Mortgage Status in Westminster
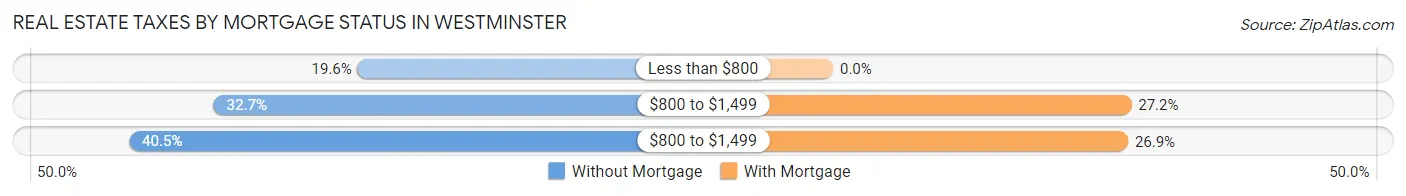
| Property Taxes | Without Mortgage | With Mortgage |
| Less than $800 | 76 (19.6%) | 0 (0.0%) |
| $800 to $1,499 | 127 (32.7%) | 173 (27.2%) |
| $800 to $1,499 | 157 (40.5%) | 171 (26.9%) |
| Total | 388 (100.0%) | 635 (100.0%) |
Health & Disability in Westminster
Health Insurance Coverage by Age in Westminster
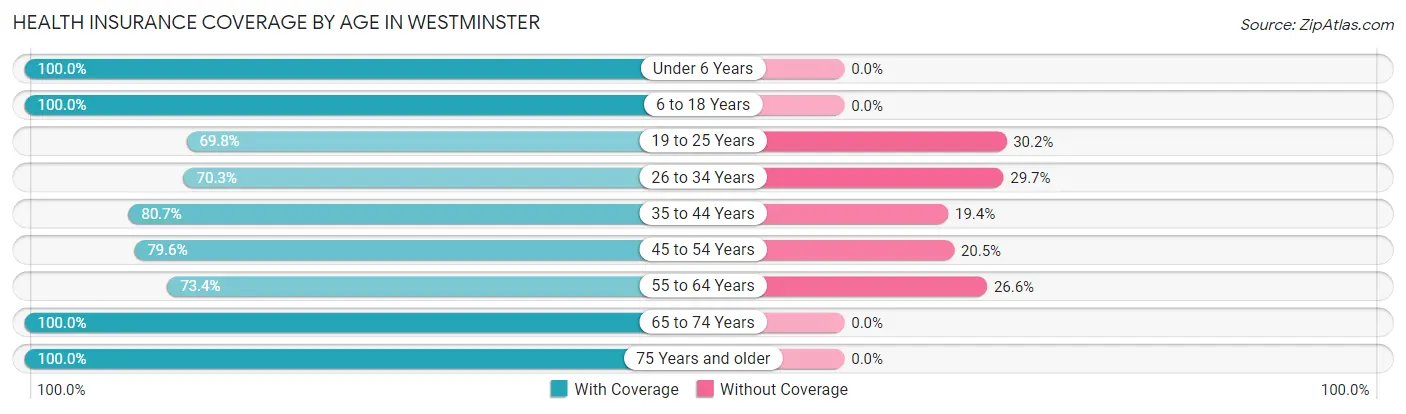
| Age Bracket | With Coverage | Without Coverage |
| Under 6 Years | 197 (100.0%) | 0 (0.0%) |
| 6 to 18 Years | 226 (100.0%) | 0 (0.0%) |
| 19 to 25 Years | 215 (69.8%) | 93 (30.2%) |
| 26 to 34 Years | 332 (70.3%) | 140 (29.7%) |
| 35 to 44 Years | 250 (80.6%) | 60 (19.4%) |
| 45 to 54 Years | 280 (79.5%) | 72 (20.4%) |
| 55 to 64 Years | 287 (73.4%) | 104 (26.6%) |
| 65 to 74 Years | 152 (100.0%) | 0 (0.0%) |
| 75 Years and older | 488 (100.0%) | 0 (0.0%) |
| Total | 2,427 (83.8%) | 469 (16.2%) |
Health Insurance Coverage by Citizenship Status in Westminster
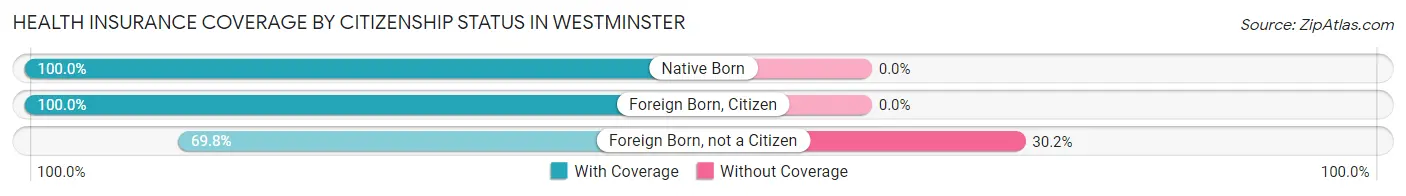
| Citizenship Status | With Coverage | Without Coverage |
| Native Born | 197 (100.0%) | 0 (0.0%) |
| Foreign Born, Citizen | 226 (100.0%) | 0 (0.0%) |
| Foreign Born, not a Citizen | 215 (69.8%) | 93 (30.2%) |
Health Insurance Coverage by Household Income in Westminster
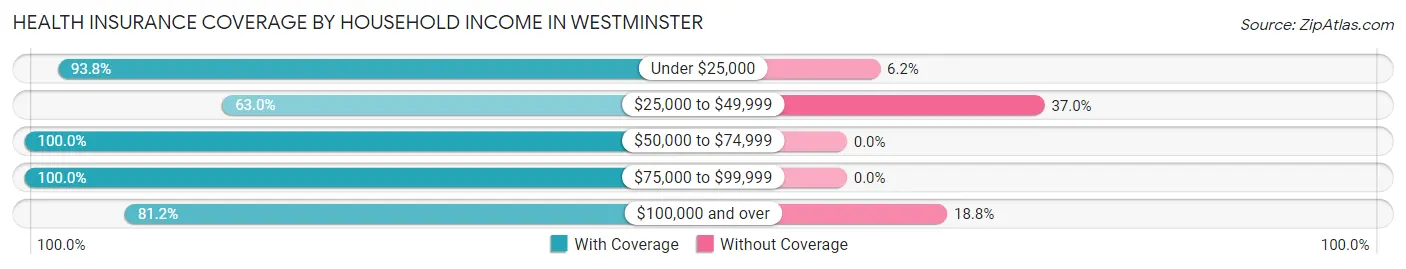
| Household Income | With Coverage | Without Coverage |
| Under $25,000 | 436 (93.8%) | 29 (6.2%) |
| $25,000 to $49,999 | 284 (63.0%) | 167 (37.0%) |
| $50,000 to $74,999 | 410 (100.0%) | 0 (0.0%) |
| $75,000 to $99,999 | 116 (100.0%) | 0 (0.0%) |
| $100,000 and over | 1,181 (81.2%) | 273 (18.8%) |
Public vs Private Health Insurance Coverage by Age in Westminster
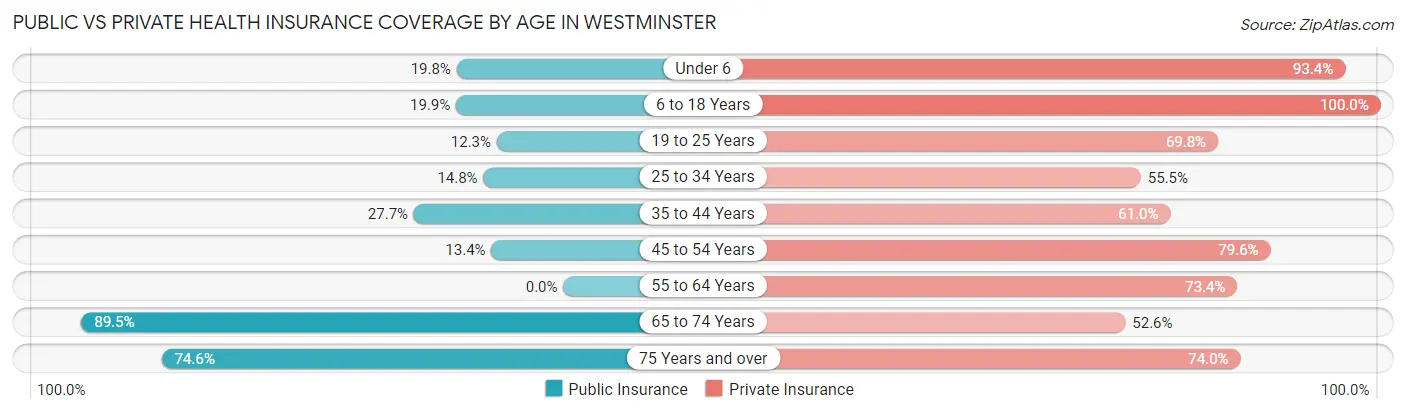
| Age Bracket | Public Insurance | Private Insurance |
| Under 6 | 39 (19.8%) | 184 (93.4%) |
| 6 to 18 Years | 45 (19.9%) | 226 (100.0%) |
| 19 to 25 Years | 38 (12.3%) | 215 (69.8%) |
| 25 to 34 Years | 70 (14.8%) | 262 (55.5%) |
| 35 to 44 Years | 86 (27.7%) | 189 (61.0%) |
| 45 to 54 Years | 47 (13.4%) | 280 (79.5%) |
| 55 to 64 Years | 0 (0.0%) | 287 (73.4%) |
| 65 to 74 Years | 136 (89.5%) | 80 (52.6%) |
| 75 Years and over | 364 (74.6%) | 361 (74.0%) |
| Total | 825 (28.5%) | 2,084 (72.0%) |
Disability Status by Sex by Age in Westminster
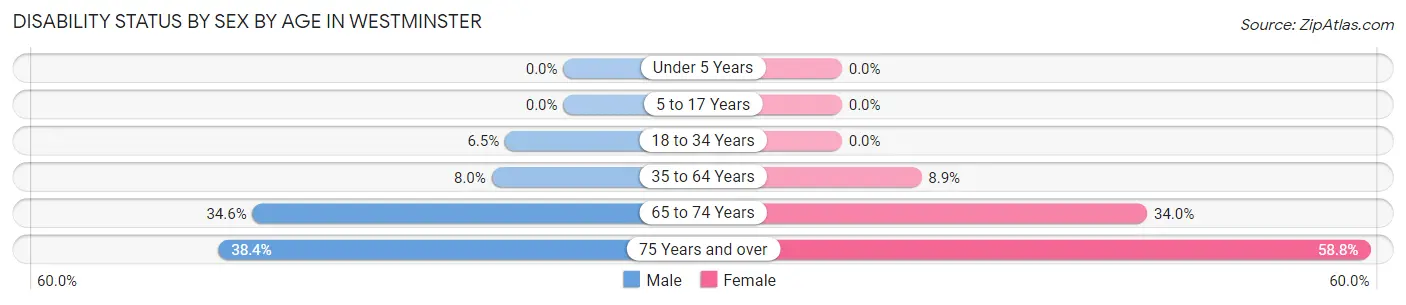
| Age Bracket | Male | Female |
| Under 5 Years | 0 (0.0%) | 0 (0.0%) |
| 5 to 17 Years | 0 (0.0%) | 0 (0.0%) |
| 18 to 34 Years | 32 (6.5%) | 0 (0.0%) |
| 35 to 64 Years | 49 (8.0%) | 39 (8.9%) |
| 65 to 74 Years | 18 (34.6%) | 34 (34.0%) |
| 75 Years and over | 68 (38.4%) | 183 (58.8%) |
Disability Class by Sex by Age in Westminster
Disability Class: Hearing Difficulty
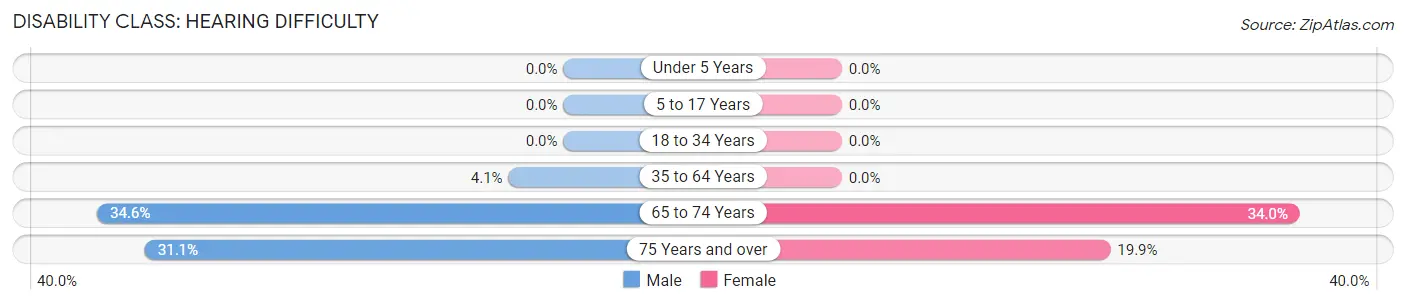
| Age Bracket | Male | Female |
| Under 5 Years | 0 (0.0%) | 0 (0.0%) |
| 5 to 17 Years | 0 (0.0%) | 0 (0.0%) |
| 18 to 34 Years | 0 (0.0%) | 0 (0.0%) |
| 35 to 64 Years | 25 (4.1%) | 0 (0.0%) |
| 65 to 74 Years | 18 (34.6%) | 34 (34.0%) |
| 75 Years and over | 55 (31.1%) | 62 (19.9%) |
Disability Class: Vision Difficulty
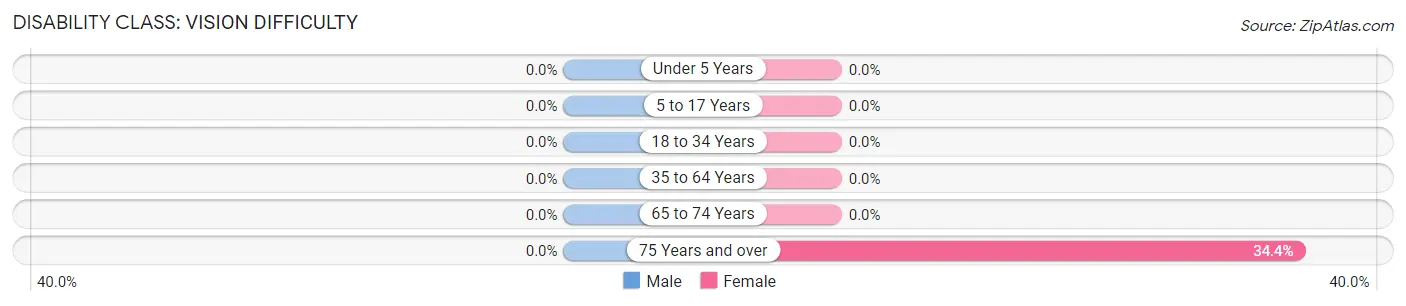
| Age Bracket | Male | Female |
| Under 5 Years | 0 (0.0%) | 0 (0.0%) |
| 5 to 17 Years | 0 (0.0%) | 0 (0.0%) |
| 18 to 34 Years | 0 (0.0%) | 0 (0.0%) |
| 35 to 64 Years | 0 (0.0%) | 0 (0.0%) |
| 65 to 74 Years | 0 (0.0%) | 0 (0.0%) |
| 75 Years and over | 0 (0.0%) | 107 (34.4%) |
Disability Class: Cognitive Difficulty
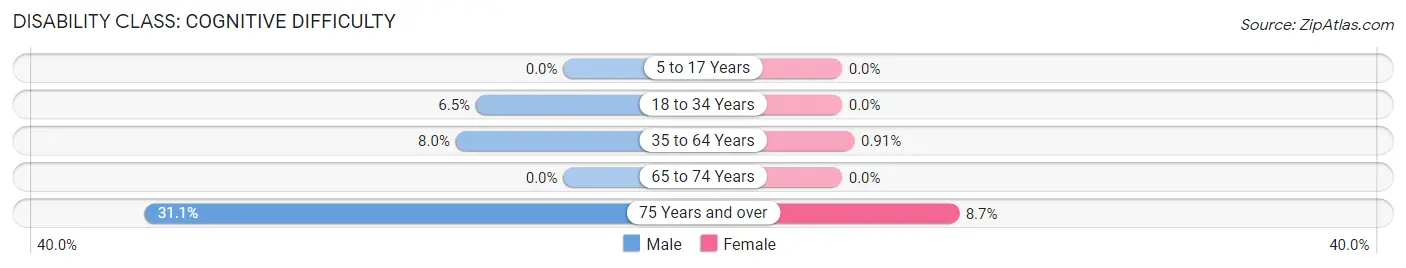
| Age Bracket | Male | Female |
| 5 to 17 Years | 0 (0.0%) | 0 (0.0%) |
| 18 to 34 Years | 32 (6.5%) | 0 (0.0%) |
| 35 to 64 Years | 49 (8.0%) | 4 (0.9%) |
| 65 to 74 Years | 0 (0.0%) | 0 (0.0%) |
| 75 Years and over | 55 (31.1%) | 27 (8.7%) |
Disability Class: Ambulatory Difficulty
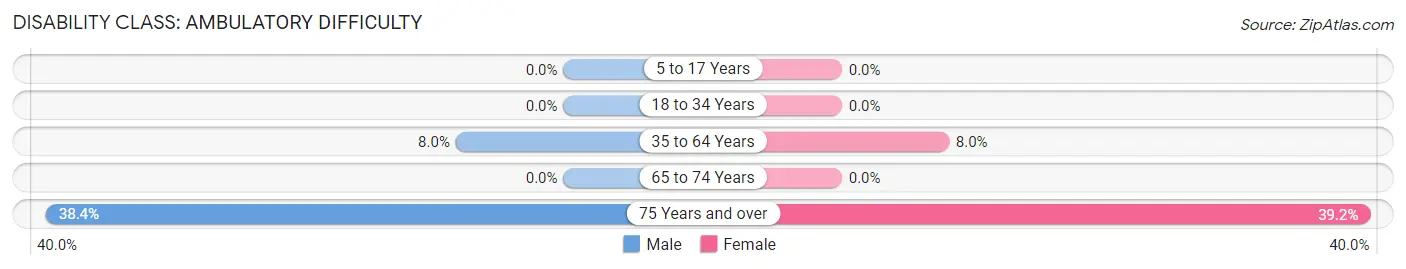
| Age Bracket | Male | Female |
| 5 to 17 Years | 0 (0.0%) | 0 (0.0%) |
| 18 to 34 Years | 0 (0.0%) | 0 (0.0%) |
| 35 to 64 Years | 49 (8.0%) | 35 (8.0%) |
| 65 to 74 Years | 0 (0.0%) | 0 (0.0%) |
| 75 Years and over | 68 (38.4%) | 122 (39.2%) |
Disability Class: Self-Care Difficulty
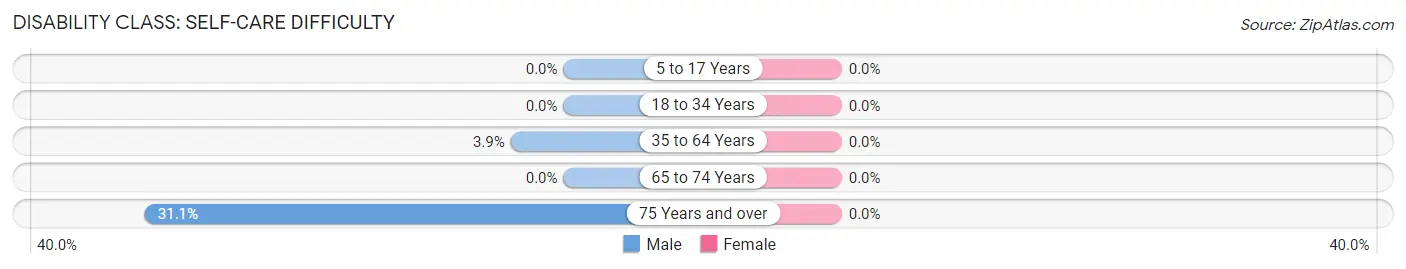
| Age Bracket | Male | Female |
| 5 to 17 Years | 0 (0.0%) | 0 (0.0%) |
| 18 to 34 Years | 0 (0.0%) | 0 (0.0%) |
| 35 to 64 Years | 24 (3.9%) | 0 (0.0%) |
| 65 to 74 Years | 0 (0.0%) | 0 (0.0%) |
| 75 Years and over | 55 (31.1%) | 0 (0.0%) |
Technology Access in Westminster
Computing Device Access in Westminster
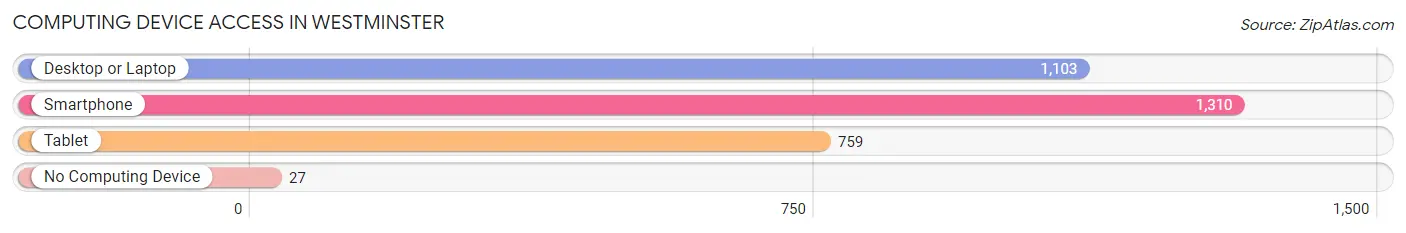
| Device Type | # Households | % Households |
| Desktop or Laptop | 1,103 | 80.9% |
| Smartphone | 1,310 | 96.1% |
| Tablet | 759 | 55.7% |
| No Computing Device | 27 | 2.0% |
| Total | 1,363 | 100.0% |
Internet Access in Westminster
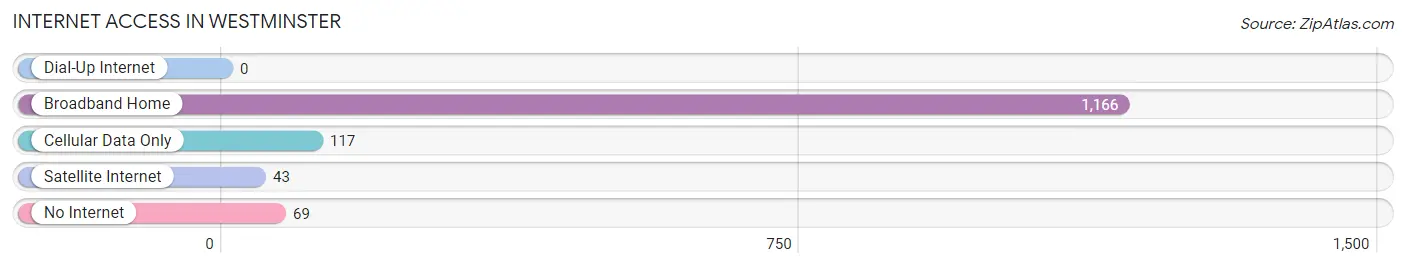
| Internet Type | # Households | % Households |
| Dial-Up Internet | 0 | 0.0% |
| Broadband Home | 1,166 | 85.6% |
| Cellular Data Only | 117 | 8.6% |
| Satellite Internet | 43 | 3.2% |
| No Internet | 69 | 5.1% |
| Total | 1,363 | 100.0% |
Westminster Summary
Westminster is a small town located in the state of Louisiana, in the United States of America. It is situated in the northern part of the state, in the parish of Rapides. The town has a population of around 1,000 people, and is part of the Alexandria Metropolitan Statistical Area.
History
Westminster was founded in 1845 by a group of settlers from the nearby town of Alexandria. The town was named after the Westminster Presbyterian Church, which was established in the area in 1844. The church was named after the Westminster Confession of Faith, which was adopted by the Presbyterian Church in 1647.
The town was originally a farming community, and the main crops grown were cotton, corn, and sugar cane. The town also had a sawmill and a gristmill. In the late 19th century, the town began to grow and develop, and by the early 20th century, it had become a thriving community.
Geography
Westminster is located in the northern part of the state of Louisiana, in the parish of Rapides. The town is situated on the banks of the Red River, and is surrounded by the Kisatchie National Forest. The town is located about 25 miles south of Alexandria, and about 50 miles north of Baton Rouge.
The town has a total area of 1.2 square miles, all of which is land. The town has a humid subtropical climate, with hot, humid summers and mild winters. The average annual temperature is around 70 degrees Fahrenheit, and the average annual precipitation is around 50 inches.
Economy
The economy of Westminster is largely based on agriculture. The main crops grown in the area are cotton, corn, and sugar cane. The town also has a sawmill and a gristmill.
In addition to agriculture, the town also has a few small businesses, including a grocery store, a hardware store, and a few restaurants. The town also has a few small manufacturing companies, which produce a variety of products, including furniture, clothing, and electronics.
Demographics
As of the 2010 census, the population of Westminster was 1,000 people. The racial makeup of the town was 97.2% White, 0.7% African American, 0.3% Native American, 0.2% Asian, 0.1% Pacific Islander, and 1.5% from other races. The median household income was $31,250, and the median family income was $37,500.
The town has a large number of elderly residents, with around 25% of the population over the age of 65. The town also has a large number of children, with around 25% of the population under the age of 18. The town has a low unemployment rate, with only around 4% of the population unemployed.
Common Questions
What is Per Capita Income in Westminster?
Per Capita income in Westminster is $57,654.
What is the Median Family Income in Westminster?
Median Family Income in Westminster is $145,069.
What is the Median Household income in Westminster?
Median Household Income in Westminster is $68,843.
What is Inequality or Gini Index in Westminster?
Inequality or Gini Index in Westminster is 0.53.
What is the Total Population of Westminster?
Total Population of Westminster is 2,907.
What is the Total Male Population of Westminster?
Total Male Population of Westminster is 1,483.
What is the Total Female Population of Westminster?
Total Female Population of Westminster is 1,424.
What is the Ratio of Males per 100 Females in Westminster?
There are 104.14 Males per 100 Females in Westminster.
What is the Ratio of Females per 100 Males in Westminster?
There are 96.02 Females per 100 Males in Westminster.
What is the Median Population Age in Westminster?
Median Population Age in Westminster is 42.5 Years.
What is the Average Family Size in Westminster
Average Family Size in Westminster is 3.6 People.
What is the Average Household Size in Westminster
Average Household Size in Westminster is 2.1 People.
How Large is the Labor Force in Westminster?
There are 1,751 People in the Labor Forcein in Westminster.
What is the Percentage of People in the Labor Force in Westminster?
68.6% of People are in the Labor Force in Westminster.
What is the Unemployment Rate in Westminster?
Unemployment Rate in Westminster is 10.0%.