Welsh, LA Map & Demographics
Welsh Map
Welsh Overview
$28,345
PER CAPITA INCOME
$111,000
AVG FAMILY INCOME
$94,196
AVG HOUSEHOLD INCOME
40.2%
WAGE / INCOME GAP [ % ]
59.8¢/ $1
WAGE / INCOME GAP [ $ ]
0.39
INEQUALITY / GINI INDEX
3,336
TOTAL POPULATION
1,625
MALE POPULATION
1,711
FEMALE POPULATION
94.97
MALES / 100 FEMALES
105.29
FEMALES / 100 MALES
36.5
MEDIAN AGE
3.5
AVG FAMILY SIZE
3.0
AVG HOUSEHOLD SIZE
1,341
LABOR FORCE [ PEOPLE ]
54.0%
PERCENT IN LABOR FORCE
Welsh Zip Codes
Welsh Area Codes
Income in Welsh
Income Overview in Welsh
Per Capita Income in Welsh is $28,345, while median incomes of families and households are $111,000 and $94,196 respectively.
| Characteristic | Number | Measure |
| Per Capita Income | 3,336 | $28,345 |
| Median Family Income | 858 | $111,000 |
| Mean Family Income | 858 | $107,186 |
| Median Household Income | 1,071 | $94,196 |
| Mean Household Income | 1,071 | $91,707 |
| Income Deficit | 858 | $0 |
| Wage / Income Gap (%) | 3,336 | 40.16% |
| Wage / Income Gap ($) | 3,336 | 59.84¢ per $1 |
| Gini / Inequality Index | 3,336 | 0.39 |
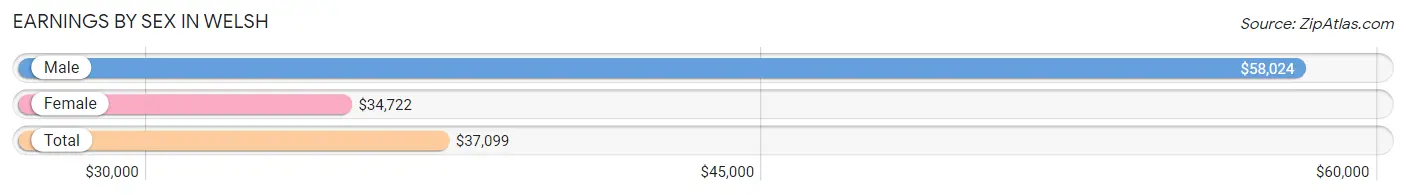
Earnings by Sex in Welsh
Average Earnings in Welsh are $37,099, $58,024 for men and $34,722 for women, a difference of 40.2%.
| Sex | Number | Average Earnings |
| Male | 920 (64.1%) | $58,024 |
| Female | 516 (35.9%) | $34,722 |
| Total | 1,436 (100.0%) | $37,099 |
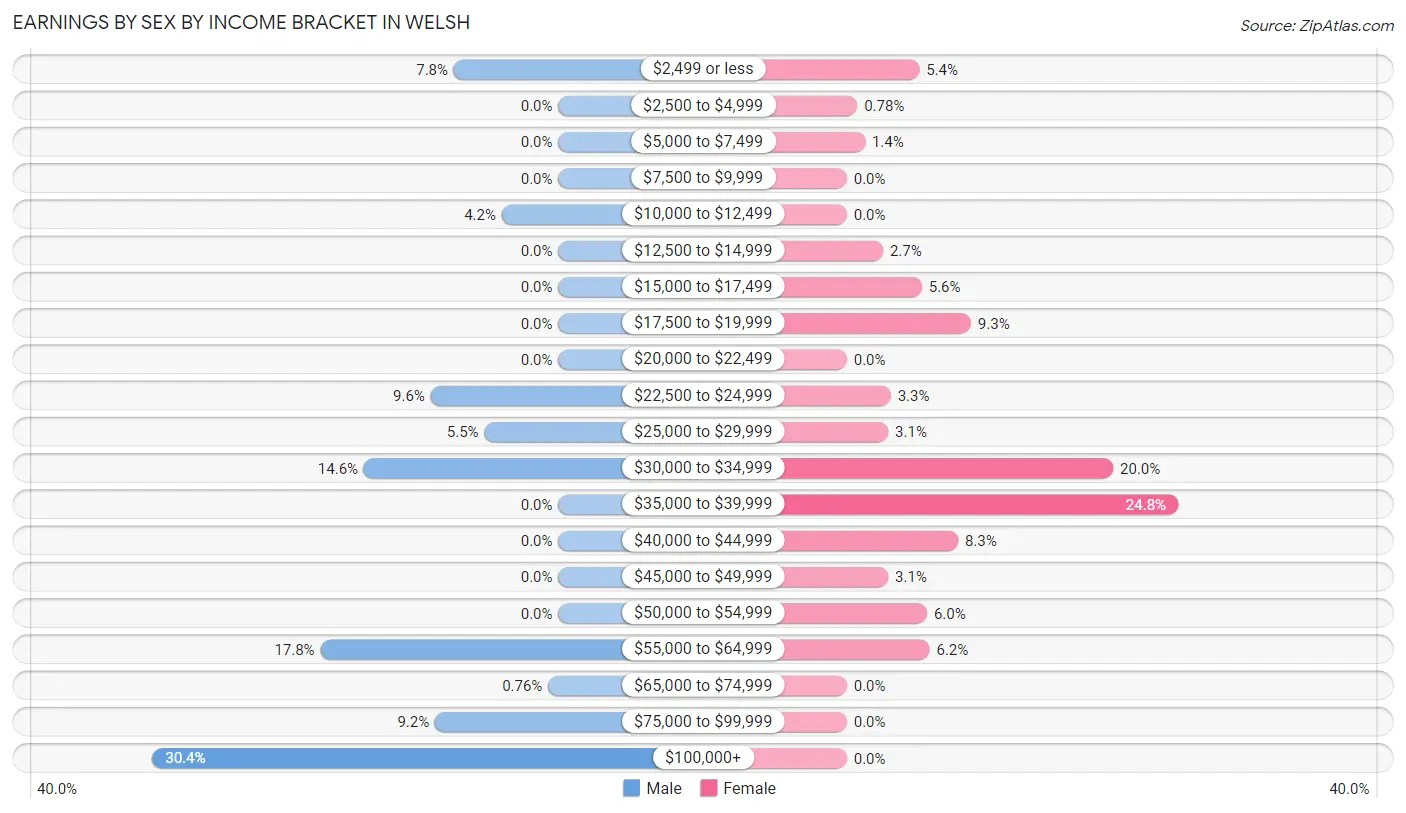
Earnings by Sex by Income Bracket in Welsh
The most common earnings brackets in Welsh are $100,000+ for men (280 | 30.4%) and $35,000 to $39,999 for women (128 | 24.8%).
| Income | Male | Female |
| $2,499 or less | 72 (7.8%) | 28 (5.4%) |
| $2,500 to $4,999 | 0 (0.0%) | 4 (0.8%) |
| $5,000 to $7,499 | 0 (0.0%) | 7 (1.4%) |
| $7,500 to $9,999 | 0 (0.0%) | 0 (0.0%) |
| $10,000 to $12,499 | 39 (4.2%) | 0 (0.0%) |
| $12,500 to $14,999 | 0 (0.0%) | 14 (2.7%) |
| $15,000 to $17,499 | 0 (0.0%) | 29 (5.6%) |
| $17,500 to $19,999 | 0 (0.0%) | 48 (9.3%) |
| $20,000 to $22,499 | 0 (0.0%) | 0 (0.0%) |
| $22,500 to $24,999 | 88 (9.6%) | 17 (3.3%) |
| $25,000 to $29,999 | 51 (5.5%) | 16 (3.1%) |
| $30,000 to $34,999 | 134 (14.6%) | 103 (20.0%) |
| $35,000 to $39,999 | 0 (0.0%) | 128 (24.8%) |
| $40,000 to $44,999 | 0 (0.0%) | 43 (8.3%) |
| $45,000 to $49,999 | 0 (0.0%) | 16 (3.1%) |
| $50,000 to $54,999 | 0 (0.0%) | 31 (6.0%) |
| $55,000 to $64,999 | 164 (17.8%) | 32 (6.2%) |
| $65,000 to $74,999 | 7 (0.8%) | 0 (0.0%) |
| $75,000 to $99,999 | 85 (9.2%) | 0 (0.0%) |
| $100,000+ | 280 (30.4%) | 0 (0.0%) |
| Total | 920 (100.0%) | 516 (100.0%) |
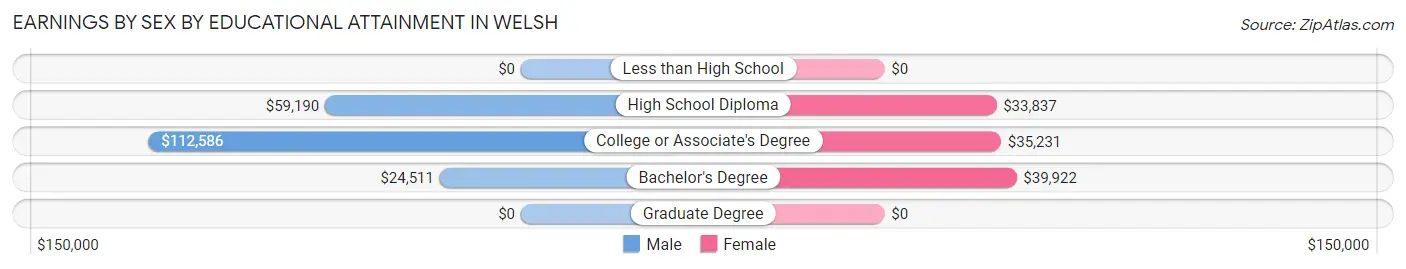
Earnings by Sex by Educational Attainment in Welsh
Average earnings in Welsh are $73,750 for men and $35,093 for women, a difference of 52.4%. Men with an educational attainment of college or associate's degree enjoy the highest average annual earnings of $112,586, while those with bachelor's degree education earn the least with $24,511. Women with an educational attainment of bachelor's degree earn the most with the average annual earnings of $39,922, while those with high school diploma education have the smallest earnings of $33,837.
| Educational Attainment | Male Income | Female Income |
| Less than High School | - | - |
| High School Diploma | $59,190 | $33,837 |
| College or Associate's Degree | $112,586 | $35,231 |
| Bachelor's Degree | $24,511 | $39,922 |
| Graduate Degree | - | - |
| Total | $73,750 | $35,093 |
Family Income in Welsh
Family Income Brackets in Welsh
According to the Welsh family income data, there are 248 families falling into the $100,000 to $149,999 income range, which is the most common income bracket and makes up 28.9% of all families. Conversely, the less than $10,000 income bracket is the least frequent group with only 7 families (0.8%) belonging to this category.
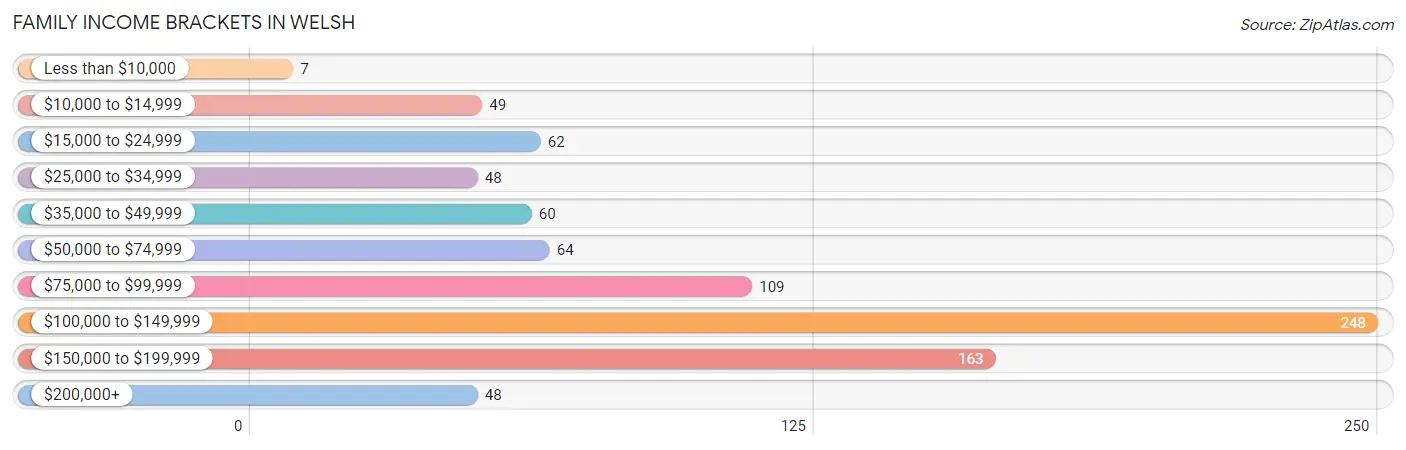
| Income Bracket | # Families | % Families |
| Less than $10,000 | 7 | 0.8% |
| $10,000 to $14,999 | 49 | 5.7% |
| $15,000 to $24,999 | 62 | 7.2% |
| $25,000 to $34,999 | 48 | 5.6% |
| $35,000 to $49,999 | 60 | 7.0% |
| $50,000 to $74,999 | 64 | 7.5% |
| $75,000 to $99,999 | 109 | 12.7% |
| $100,000 to $149,999 | 248 | 28.9% |
| $150,000 to $199,999 | 163 | 19.0% |
| $200,000+ | 48 | 5.6% |
Family Income by Famaliy Size in Welsh
4-person families (231 | 26.9%) account for the highest median family income in Welsh with $172,653 per family, while 3-person families (260 | 30.3%) have the highest median income of $44,570 per family member.
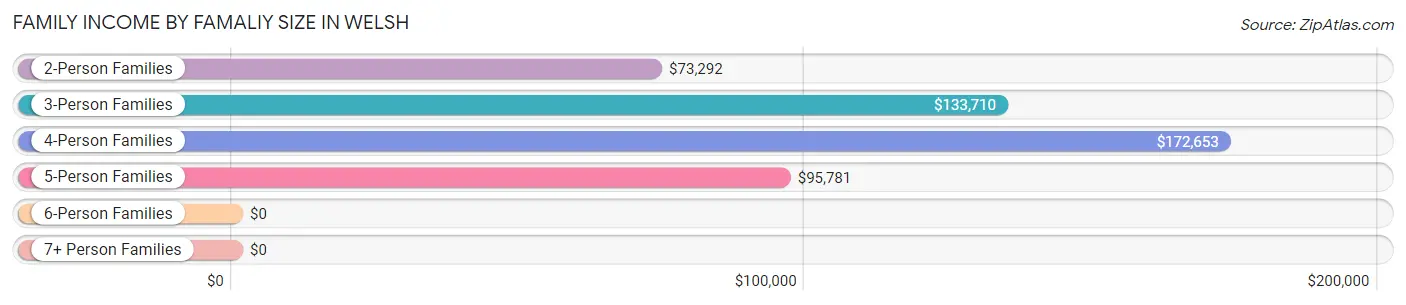
| Income Bracket | # Families | Median Income |
| 2-Person Families | 231 (26.9%) | $73,292 |
| 3-Person Families | 260 (30.3%) | $133,710 |
| 4-Person Families | 231 (26.9%) | $172,653 |
| 5-Person Families | 135 (15.7%) | $95,781 |
| 6-Person Families | 1 (0.1%) | $0 |
| 7+ Person Families | 0 (0.0%) | $0 |
| Total | 858 (100.0%) | $111,000 |
Family Income by Number of Earners in Welsh
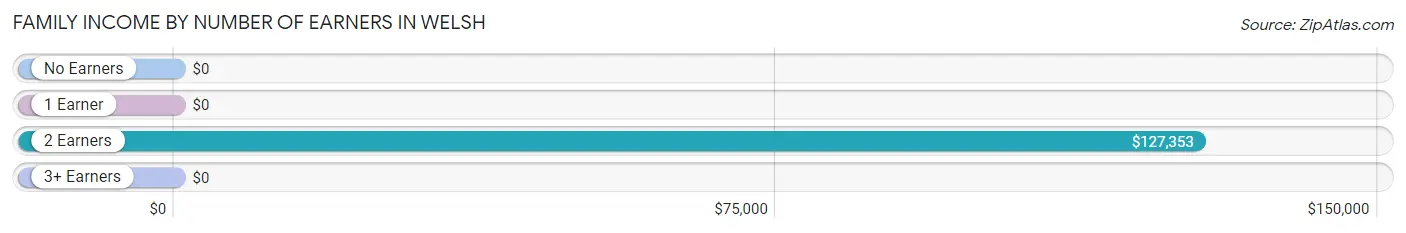
| Number of Earners | # Families | Median Income |
| No Earners | 46 (5.4%) | $0 |
| 1 Earner | 346 (40.3%) | $0 |
| 2 Earners | 426 (49.6%) | $127,353 |
| 3+ Earners | 40 (4.7%) | $0 |
| Total | 858 (100.0%) | $111,000 |
Household Income in Welsh
Household Income Brackets in Welsh
With 248 households falling in the category, the $100,000 to $149,999 income range is the most frequent in Welsh, accounting for 23.2% of all households. In contrast, only 11 households (1.0%) fall into the less than $10,000 income bracket, making it the least populous group.
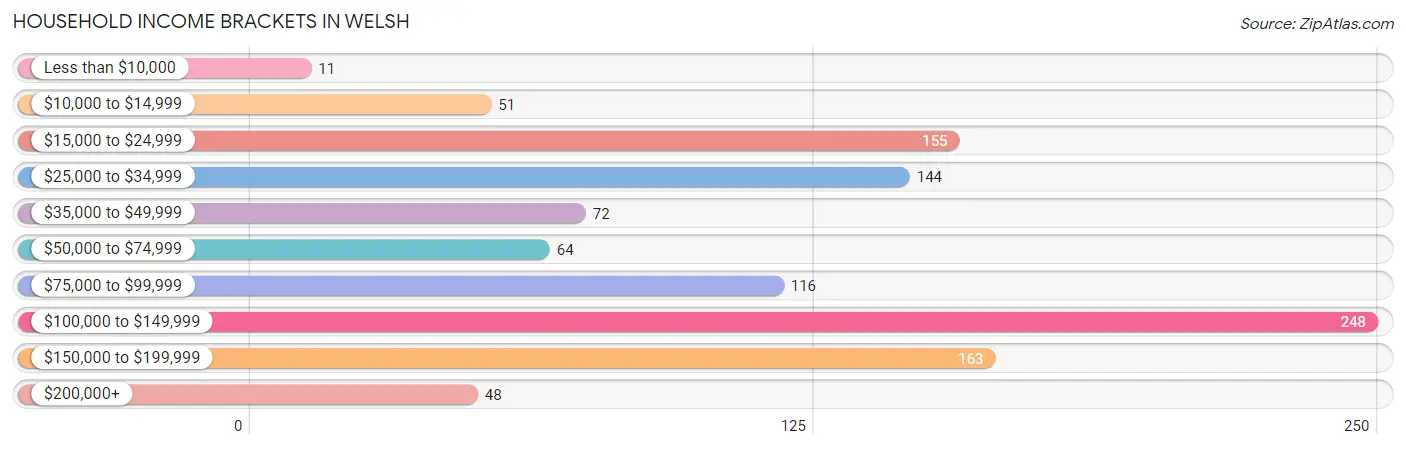
| Income Bracket | # Households | % Households |
| Less than $10,000 | 11 | 1.0% |
| $10,000 to $14,999 | 51 | 4.8% |
| $15,000 to $24,999 | 155 | 14.5% |
| $25,000 to $34,999 | 144 | 13.4% |
| $35,000 to $49,999 | 72 | 6.7% |
| $50,000 to $74,999 | 64 | 6.0% |
| $75,000 to $99,999 | 116 | 10.8% |
| $100,000 to $149,999 | 248 | 23.2% |
| $150,000 to $199,999 | 163 | 15.2% |
| $200,000+ | 48 | 4.5% |
Household Income by Householder Age in Welsh
The median household income in Welsh is $94,196, with the highest median household income of $140,754 found in the 45 to 64 years age bracket for the primary householder. A total of 441 households (41.2%) fall into this category.
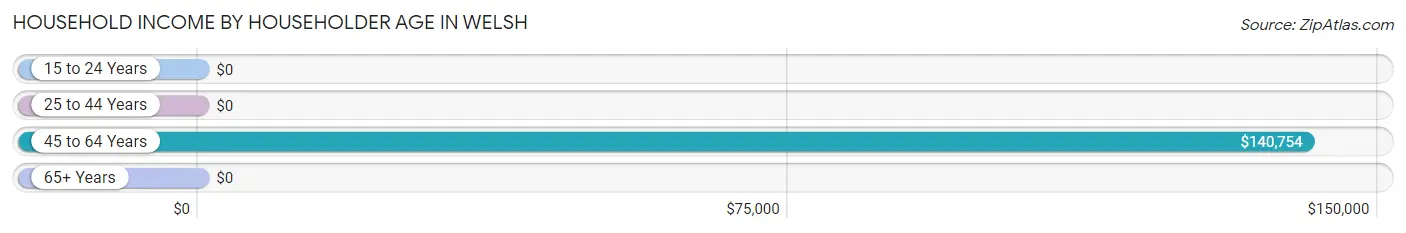
| Income Bracket | # Households | Median Income |
| 15 to 24 Years | 0 (0.0%) | $0 |
| 25 to 44 Years | 416 (38.8%) | $0 |
| 45 to 64 Years | 441 (41.2%) | $140,754 |
| 65+ Years | 214 (20.0%) | $0 |
| Total | 1,071 (100.0%) | $94,196 |
Poverty in Welsh
Income Below Poverty by Sex and Age in Welsh
With 14.4% poverty level for males and 19.5% for females among the residents of Welsh, 25 to 34 year old males and under 5 year old females are the most vulnerable to poverty, with 62 males (100.0%) and 71 females (86.6%) in their respective age groups living below the poverty level.
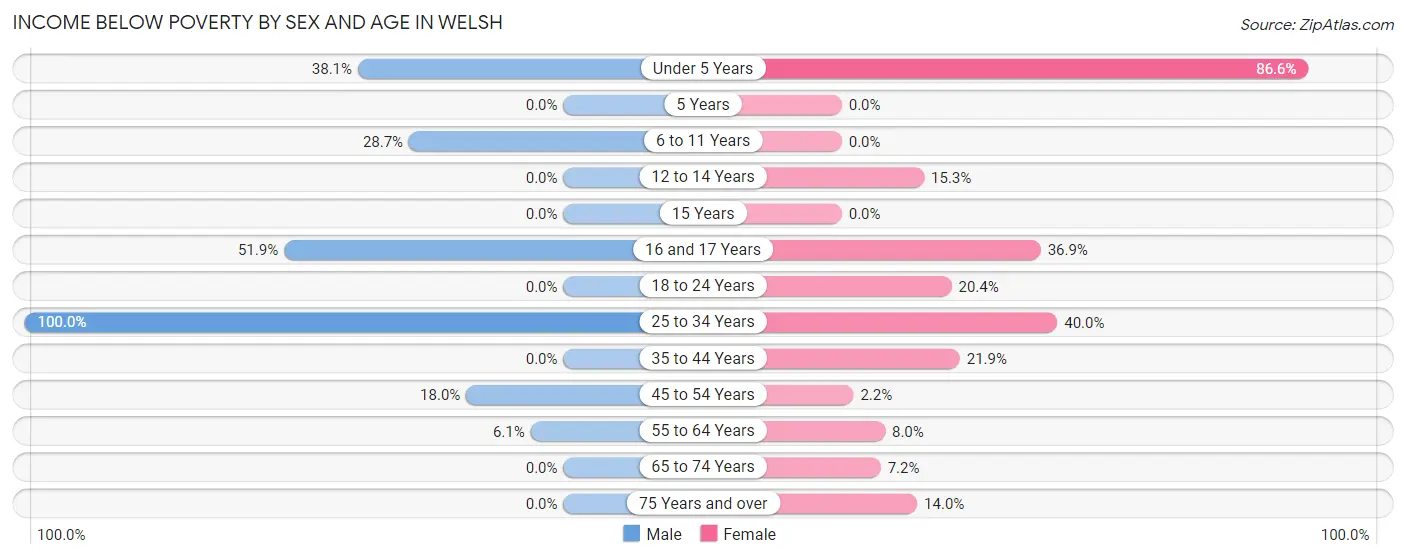
| Age Bracket | Male | Female |
| Under 5 Years | 37 (38.1%) | 71 (86.6%) |
| 5 Years | 0 (0.0%) | 0 (0.0%) |
| 6 to 11 Years | 45 (28.7%) | 0 (0.0%) |
| 12 to 14 Years | 0 (0.0%) | 11 (15.3%) |
| 15 Years | 0 (0.0%) | 0 (0.0%) |
| 16 and 17 Years | 14 (51.8%) | 24 (36.9%) |
| 18 to 24 Years | 0 (0.0%) | 22 (20.4%) |
| 25 to 34 Years | 62 (100.0%) | 94 (40.0%) |
| 35 to 44 Years | 0 (0.0%) | 53 (21.9%) |
| 45 to 54 Years | 59 (18.0%) | 4 (2.2%) |
| 55 to 64 Years | 11 (6.1%) | 21 (8.0%) |
| 65 to 74 Years | 0 (0.0%) | 6 (7.2%) |
| 75 Years and over | 0 (0.0%) | 20 (14.0%) |
| Total | 228 (14.4%) | 326 (19.5%) |
Income Above Poverty by Sex and Age in Welsh
According to the poverty statistics in Welsh, males aged 5 years and females aged 6 to 11 years are the age groups that are most secure financially, with 100.0% of males and 100.0% of females in these age groups living above the poverty line.
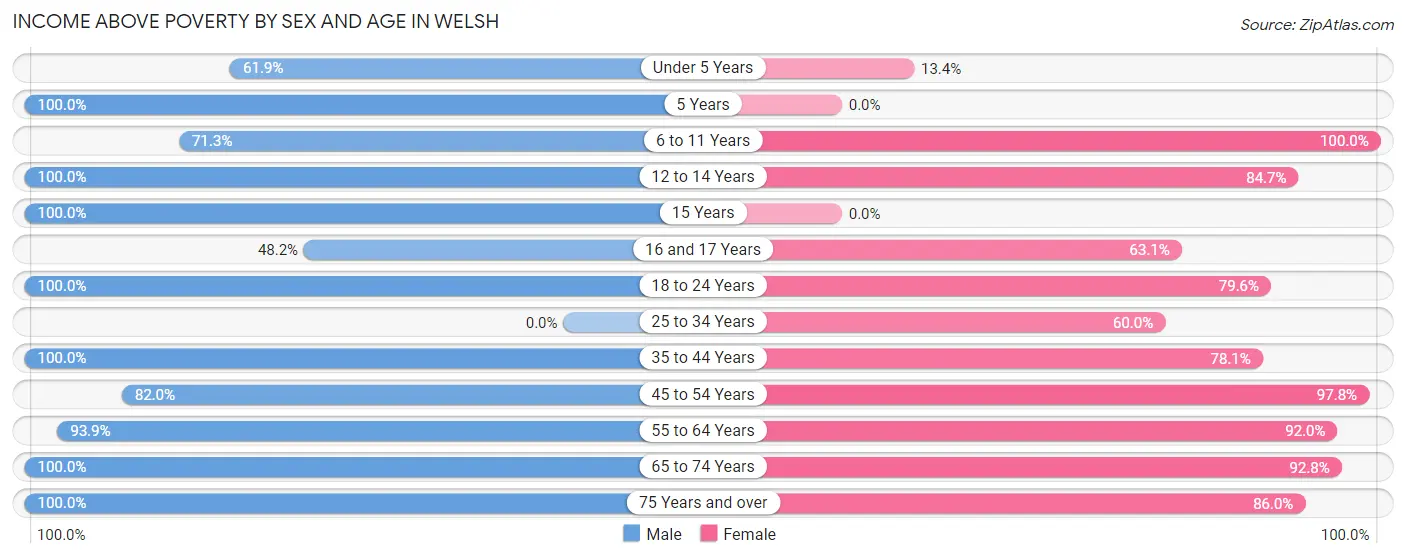
| Age Bracket | Male | Female |
| Under 5 Years | 60 (61.9%) | 11 (13.4%) |
| 5 Years | 30 (100.0%) | 0 (0.0%) |
| 6 to 11 Years | 112 (71.3%) | 195 (100.0%) |
| 12 to 14 Years | 12 (100.0%) | 61 (84.7%) |
| 15 Years | 207 (100.0%) | 0 (0.0%) |
| 16 and 17 Years | 13 (48.1%) | 41 (63.1%) |
| 18 to 24 Years | 196 (100.0%) | 86 (79.6%) |
| 25 to 34 Years | 0 (0.0%) | 141 (60.0%) |
| 35 to 44 Years | 166 (100.0%) | 189 (78.1%) |
| 45 to 54 Years | 268 (82.0%) | 180 (97.8%) |
| 55 to 64 Years | 170 (93.9%) | 241 (92.0%) |
| 65 to 74 Years | 94 (100.0%) | 77 (92.8%) |
| 75 Years and over | 25 (100.0%) | 123 (86.0%) |
| Total | 1,353 (85.6%) | 1,345 (80.5%) |
Income Below Poverty Among Married-Couple Families in Welsh
The poverty statistics for married-couple families in Welsh show that 7.2% or 53 of the total 740 families live below the poverty line. Families with 1 or 2 children have the highest poverty rate of 16.2%, comprising of 53 families. On the other hand, families with no children have the lowest poverty rate of 0.0%, which includes 0 families.
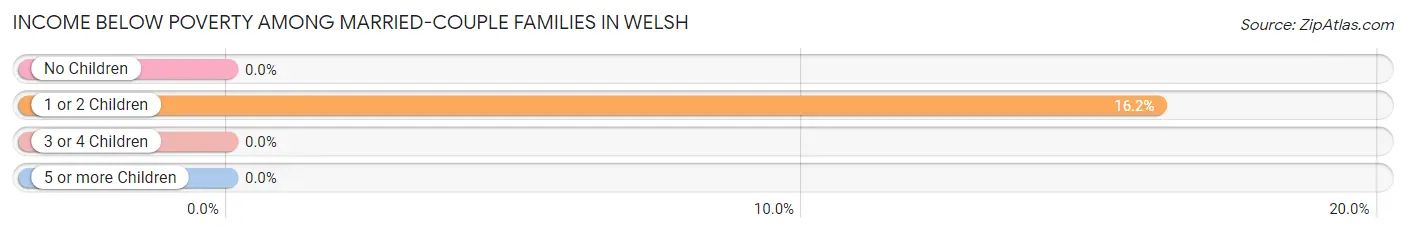
| Children | Above Poverty | Below Poverty |
| No Children | 308 (100.0%) | 0 (0.0%) |
| 1 or 2 Children | 275 (83.8%) | 53 (16.2%) |
| 3 or 4 Children | 104 (100.0%) | 0 (0.0%) |
| 5 or more Children | 0 (0.0%) | 0 (0.0%) |
| Total | 687 (92.8%) | 53 (7.2%) |
Income Below Poverty Among Single-Parent Households in Welsh
According to the poverty data in Welsh, 88.6% or 39 single-father households and 36.5% or 27 single-mother households are living below the poverty line. Among single-father households, those with 1 or 2 children have the highest poverty rate, with 39 households (88.6%) experiencing poverty. Likewise, among single-mother households, those with no children have the highest poverty rate, with 17 households (100.0%) falling below the poverty line.
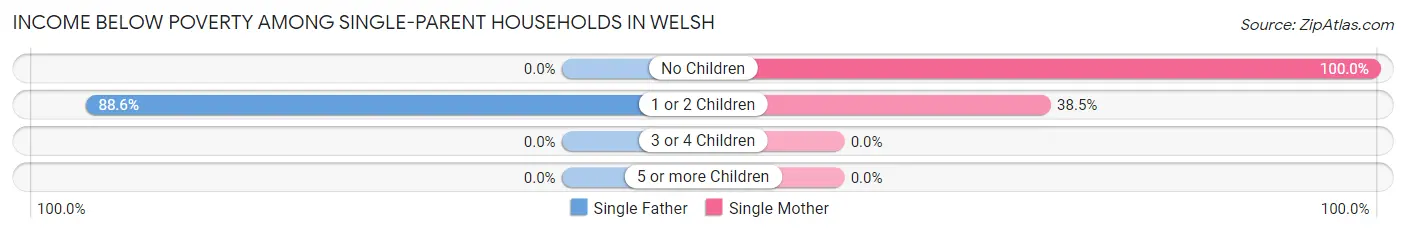
| Children | Single Father | Single Mother |
| No Children | 0 (0.0%) | 17 (100.0%) |
| 1 or 2 Children | 39 (88.6%) | 10 (38.5%) |
| 3 or 4 Children | 0 (0.0%) | 0 (0.0%) |
| 5 or more Children | 0 (0.0%) | 0 (0.0%) |
| Total | 39 (88.6%) | 27 (36.5%) |
Income Below Poverty Among Married-Couple vs Single-Parent Households in Welsh
The poverty data for Welsh shows that 53 of the married-couple family households (7.2%) and 66 of the single-parent households (55.9%) are living below the poverty level. Within the married-couple family households, those with 1 or 2 children have the highest poverty rate, with 53 households (16.2%) falling below the poverty line. Among the single-parent households, those with no children have the highest poverty rate, with 17 household (100.0%) living below poverty.
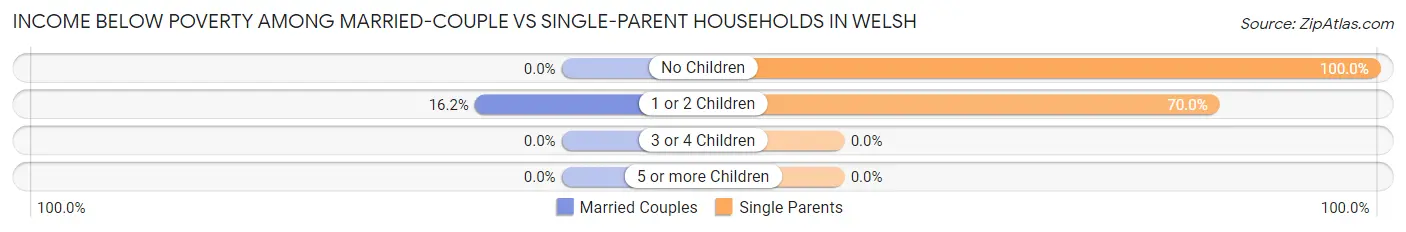
| Children | Married-Couple Families | Single-Parent Households |
| No Children | 0 (0.0%) | 17 (100.0%) |
| 1 or 2 Children | 53 (16.2%) | 49 (70.0%) |
| 3 or 4 Children | 0 (0.0%) | 0 (0.0%) |
| 5 or more Children | 0 (0.0%) | 0 (0.0%) |
| Total | 53 (7.2%) | 66 (55.9%) |
Race in Welsh
The most populous races in Welsh are White / Caucasian (2,293 | 68.7%), Black / African American (782 | 23.4%), and Two or more Races (261 | 7.8%).
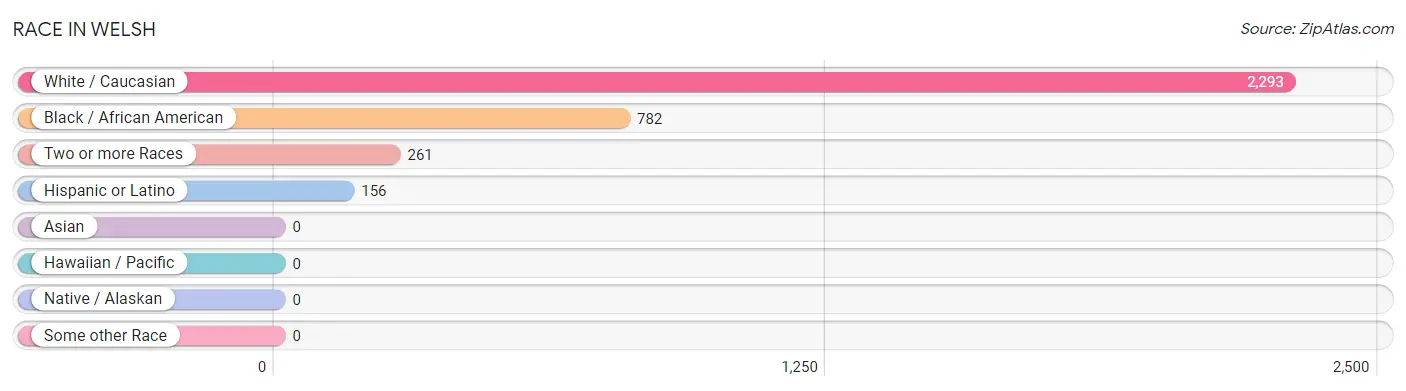
| Race | # Population | % Population |
| Asian | 0 | 0.0% |
| Black / African American | 782 | 23.4% |
| Hawaiian / Pacific | 0 | 0.0% |
| Hispanic or Latino | 156 | 4.7% |
| Native / Alaskan | 0 | 0.0% |
| White / Caucasian | 2,293 | 68.7% |
| Two or more Races | 261 | 7.8% |
| Some other Race | 0 | 0.0% |
| Total | 3,336 | 100.0% |
Ancestry in Welsh
The most populous ancestries reported in Welsh are French (725 | 21.7%), French Canadian (377 | 11.3%), Spanish (131 | 3.9%), European (98 | 2.9%), and English (97 | 2.9%), together accounting for 42.8% of all Welsh residents.
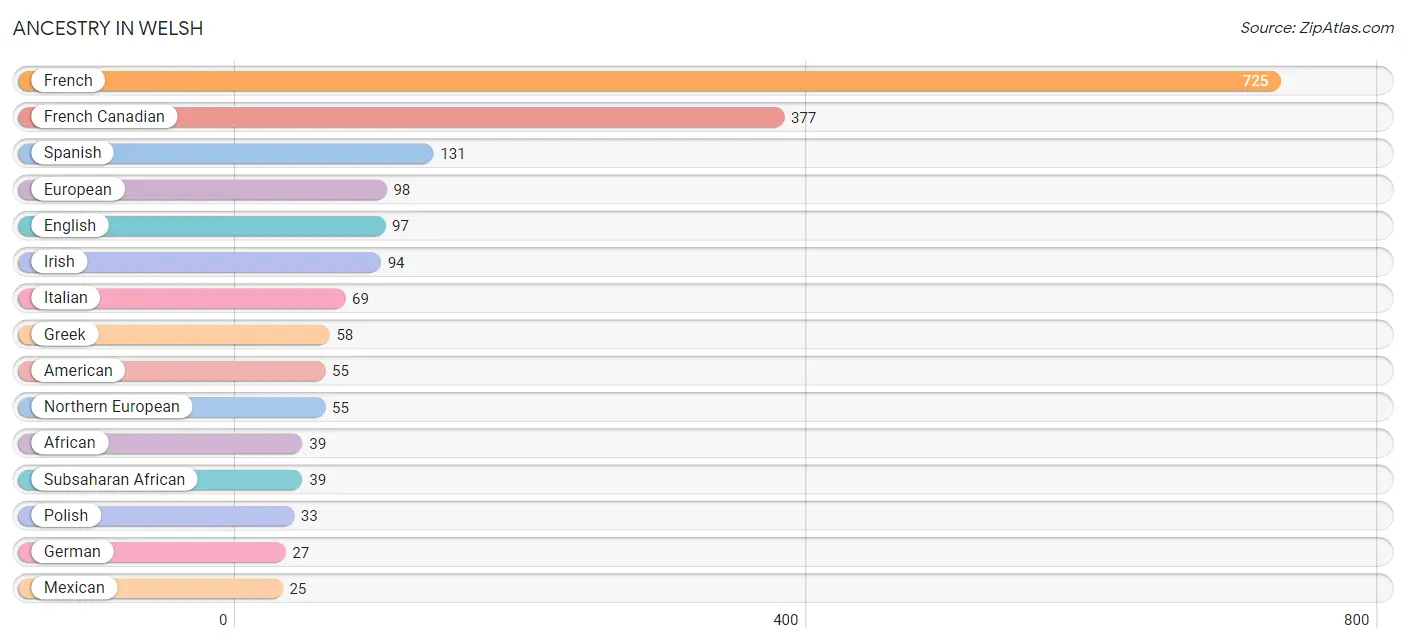
| Ancestry | # Population | % Population |
| African | 39 | 1.2% |
| American | 55 | 1.7% |
| Cajun | 23 | 0.7% |
| Canadian | 22 | 0.7% |
| Celtic | 17 | 0.5% |
| English | 97 | 2.9% |
| European | 98 | 2.9% |
| French | 725 | 21.7% |
| French Canadian | 377 | 11.3% |
| German | 27 | 0.8% |
| Greek | 58 | 1.7% |
| Irish | 94 | 2.8% |
| Italian | 69 | 2.1% |
| Mexican | 25 | 0.7% |
| Northern European | 55 | 1.7% |
| Polish | 33 | 1.0% |
| Spanish | 131 | 3.9% |
| Subsaharan African | 39 | 1.2% |
| Swiss | 6 | 0.2% | View All 19 Rows |
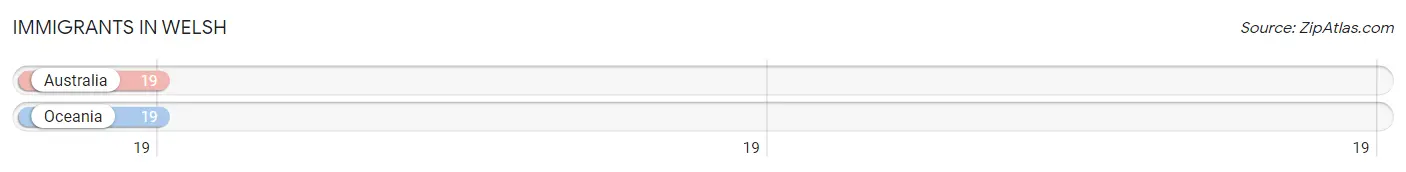
Immigrants in Welsh
The most numerous immigrant groups reported in Welsh came from Australia (19 | 0.6%), and Oceania (19 | 0.6%), together accounting for 1.1% of all Welsh residents.
| Immigration Origin | # Population | % Population |
| Australia | 19 | 0.6% |
| Oceania | 19 | 0.6% | View All 2 Rows |
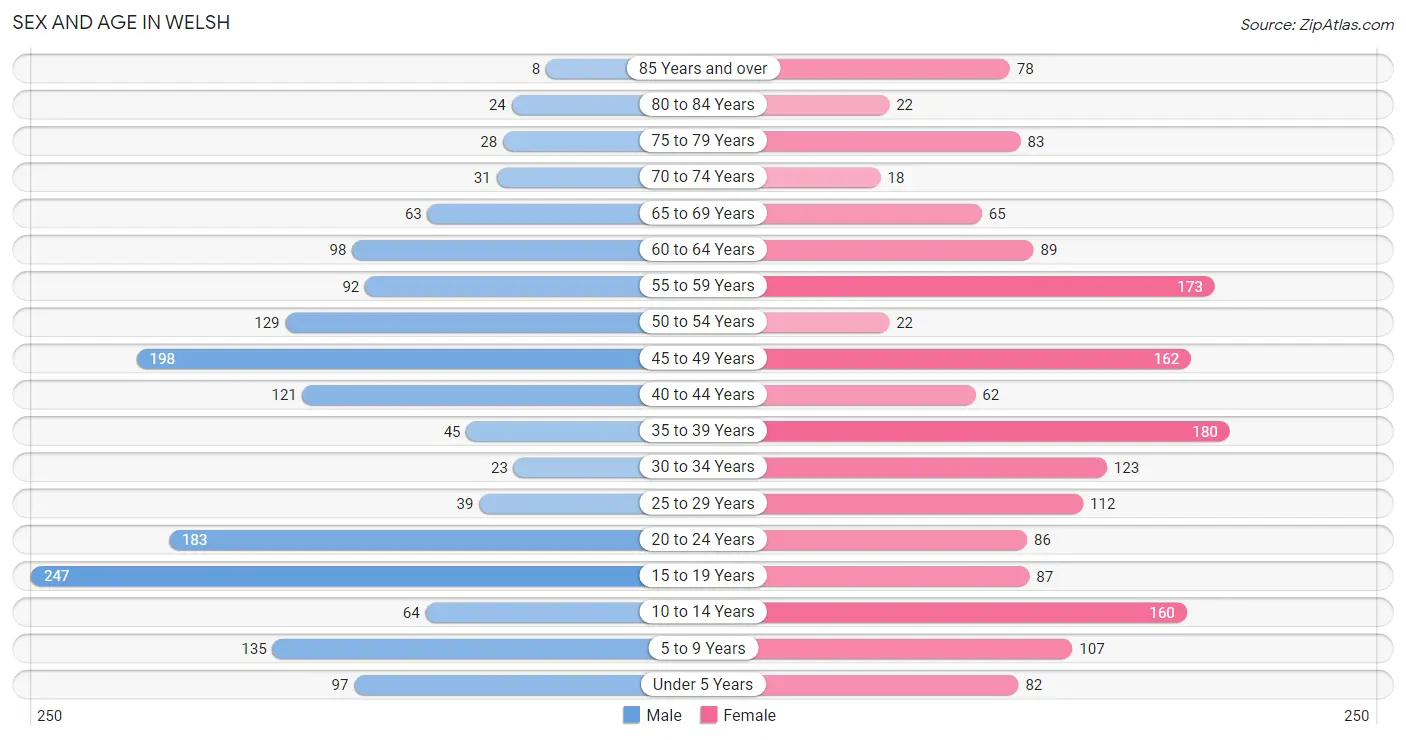
Sex and Age in Welsh
Sex and Age in Welsh
The most populous age groups in Welsh are 15 to 19 Years (247 | 15.2%) for men and 35 to 39 Years (180 | 10.5%) for women.
| Age Bracket | Male | Female |
| Under 5 Years | 97 (6.0%) | 82 (4.8%) |
| 5 to 9 Years | 135 (8.3%) | 107 (6.2%) |
| 10 to 14 Years | 64 (3.9%) | 160 (9.3%) |
| 15 to 19 Years | 247 (15.2%) | 87 (5.1%) |
| 20 to 24 Years | 183 (11.3%) | 86 (5.0%) |
| 25 to 29 Years | 39 (2.4%) | 112 (6.6%) |
| 30 to 34 Years | 23 (1.4%) | 123 (7.2%) |
| 35 to 39 Years | 45 (2.8%) | 180 (10.5%) |
| 40 to 44 Years | 121 (7.4%) | 62 (3.6%) |
| 45 to 49 Years | 198 (12.2%) | 162 (9.5%) |
| 50 to 54 Years | 129 (7.9%) | 22 (1.3%) |
| 55 to 59 Years | 92 (5.7%) | 173 (10.1%) |
| 60 to 64 Years | 98 (6.0%) | 89 (5.2%) |
| 65 to 69 Years | 63 (3.9%) | 65 (3.8%) |
| 70 to 74 Years | 31 (1.9%) | 18 (1.1%) |
| 75 to 79 Years | 28 (1.7%) | 83 (4.9%) |
| 80 to 84 Years | 24 (1.5%) | 22 (1.3%) |
| 85 Years and over | 8 (0.5%) | 78 (4.6%) |
| Total | 1,625 (100.0%) | 1,711 (100.0%) |
Families and Households in Welsh
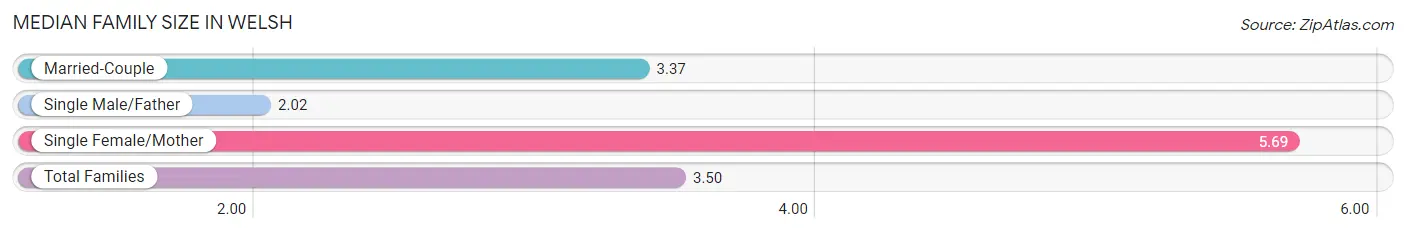
Median Family Size in Welsh
The median family size in Welsh is 3.50 persons per family, with single female/mother families (74 | 8.6%) accounting for the largest median family size of 5.69 persons per family. On the other hand, single male/father families (44 | 5.1%) represent the smallest median family size with 2.02 persons per family.
| Family Type | # Families | Family Size |
| Married-Couple | 740 (86.3%) | 3.37 |
| Single Male/Father | 44 (5.1%) | 2.02 |
| Single Female/Mother | 74 (8.6%) | 5.69 |
| Total Families | 858 (100.0%) | 3.50 |
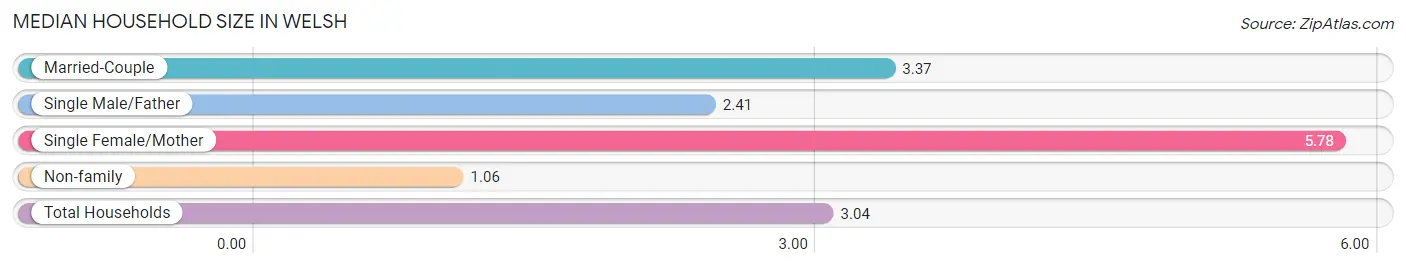
Median Household Size in Welsh
The median household size in Welsh is 3.04 persons per household, with single female/mother households (74 | 6.9%) accounting for the largest median household size of 5.78 persons per household. non-family households (213 | 19.9%) represent the smallest median household size with 1.06 persons per household.
| Household Type | # Households | Household Size |
| Married-Couple | 740 (69.1%) | 3.37 |
| Single Male/Father | 44 (4.1%) | 2.41 |
| Single Female/Mother | 74 (6.9%) | 5.78 |
| Non-family | 213 (19.9%) | 1.06 |
| Total Households | 1,071 (100.0%) | 3.04 |
Household Size by Marriage Status in Welsh
Out of a total of 1,071 households in Welsh, 858 (80.1%) are family households, while 213 (19.9%) are nonfamily households. The most numerous type of family households are 3-person households, comprising 292, and the most common type of nonfamily households are 1-person households, comprising 203.
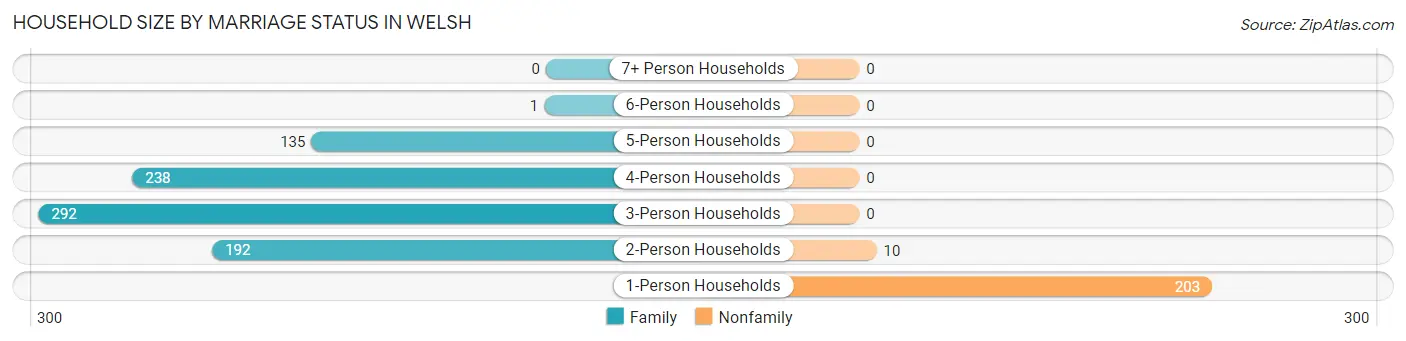
| Household Size | Family Households | Nonfamily Households |
| 1-Person Households | - | 203 (19.0%) |
| 2-Person Households | 192 (17.9%) | 10 (0.9%) |
| 3-Person Households | 292 (27.3%) | 0 (0.0%) |
| 4-Person Households | 238 (22.2%) | 0 (0.0%) |
| 5-Person Households | 135 (12.6%) | 0 (0.0%) |
| 6-Person Households | 1 (0.1%) | 0 (0.0%) |
| 7+ Person Households | 0 (0.0%) | 0 (0.0%) |
| Total | 858 (80.1%) | 213 (19.9%) |
Female Fertility in Welsh
Fertility by Age in Welsh
Average fertility rate in Welsh is 21.0 births per 1,000 women. Women in the age bracket of 20 to 34 years have the highest fertility rate with 53.0 births per 1,000 women. Women in the age bracket of 20 to 34 years acount for 100.0% of all women with births.
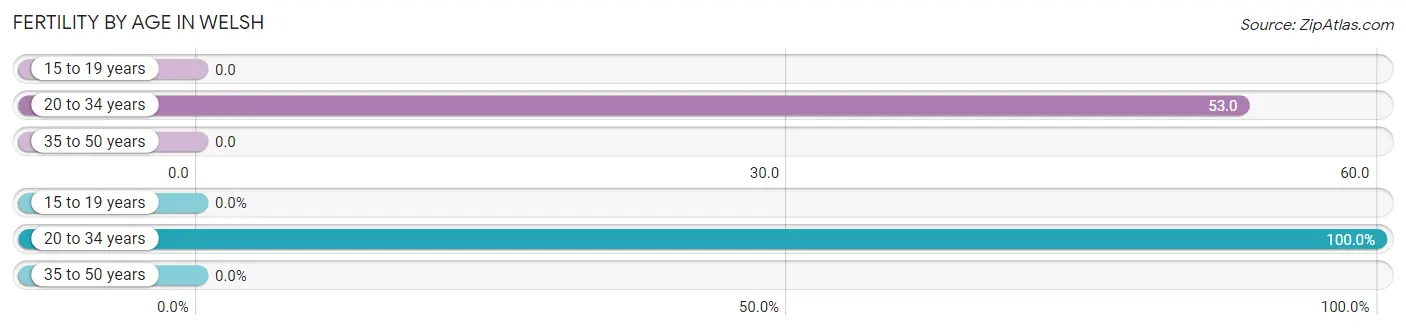
| Age Bracket | Women with Births | Births / 1,000 Women |
| 15 to 19 years | 0 (0.0%) | 0.0 |
| 20 to 34 years | 17 (100.0%) | 53.0 |
| 35 to 50 years | 0 (0.0%) | 0.0 |
| Total | 17 (100.0%) | 21.0 |
Fertility by Age by Marriage Status in Welsh
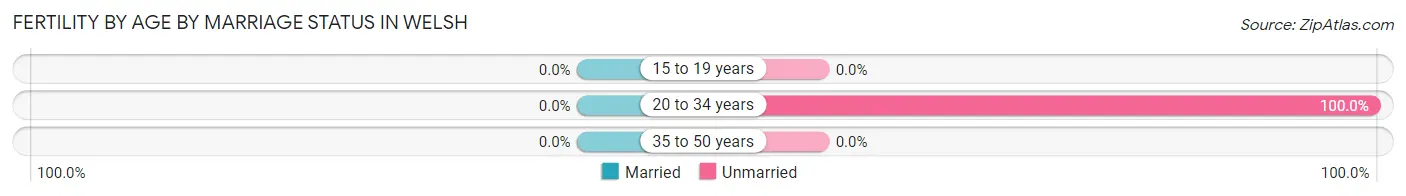
| Age Bracket | Married | Unmarried |
| 15 to 19 years | 0 (0.0%) | 0 (0.0%) |
| 20 to 34 years | 0 (0.0%) | 17 (100.0%) |
| 35 to 50 years | 0 (0.0%) | 0 (0.0%) |
| Total | 0 (0.0%) | 17 (100.0%) |
Fertility by Education in Welsh

| Educational Attainment | Women with Births | Births / 1,000 Women |
| Less than High School | 0 (0.0%) | 0.0 |
| High School Diploma | 0 (0.0%) | 0.0 |
| College or Associate's Degree | 0 (0.0%) | 0.0 |
| Bachelor's Degree | 17 (100.0%) | 630.0 |
| Graduate Degree | 0 (0.0%) | 0.0 |
| Total | 17 (100.0%) | 21.0 |
Fertility by Education by Marriage Status in Welsh
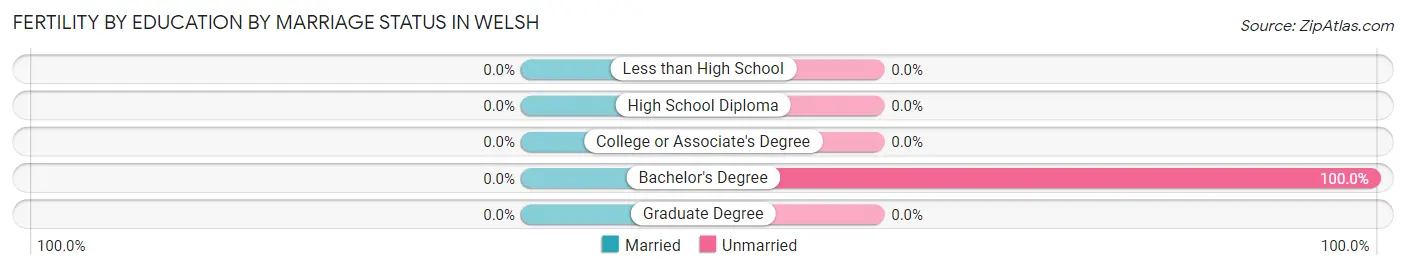
| Educational Attainment | Married | Unmarried |
| Less than High School | 0 (0.0%) | 0 (0.0%) |
| High School Diploma | 0 (0.0%) | 0 (0.0%) |
| College or Associate's Degree | 0 (0.0%) | 0 (0.0%) |
| Bachelor's Degree | 0 (0.0%) | 17 (100.0%) |
| Graduate Degree | 0 (0.0%) | 0 (0.0%) |
| Total | 0 (0.0%) | 17 (100.0%) |
Employment Characteristics in Welsh
Employment by Class of Employer in Welsh
Among the 1,317 employed individuals in Welsh, private company employees (933 | 70.8%), self-employed (incorporated) (106 | 8.1%), and local government employees (100 | 7.6%) make up the most common classes of employment.
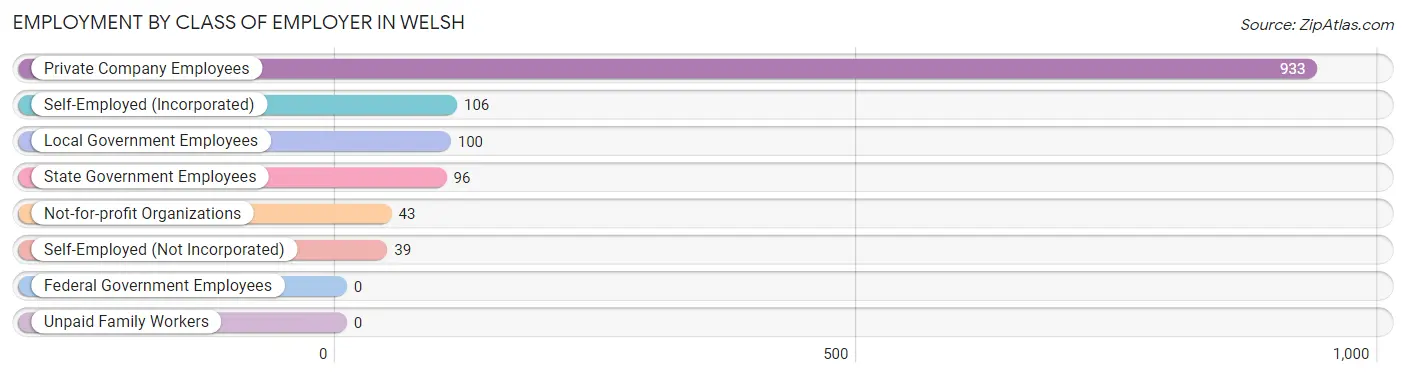
| Employer Class | # Employees | % Employees |
| Private Company Employees | 933 | 70.8% |
| Self-Employed (Incorporated) | 106 | 8.1% |
| Self-Employed (Not Incorporated) | 39 | 3.0% |
| Not-for-profit Organizations | 43 | 3.3% |
| Local Government Employees | 100 | 7.6% |
| State Government Employees | 96 | 7.3% |
| Federal Government Employees | 0 | 0.0% |
| Unpaid Family Workers | 0 | 0.0% |
| Total | 1,317 | 100.0% |
Employment Status by Age in Welsh
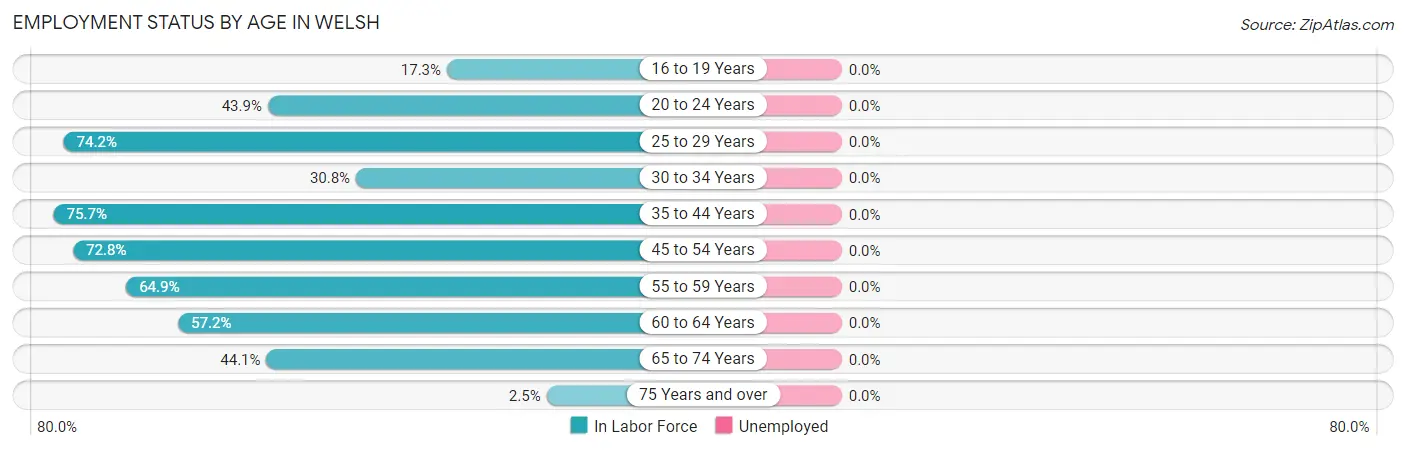
| Age Bracket | In Labor Force | Unemployed |
| 16 to 19 Years | 22 (17.3%) | 0 (0.0%) |
| 20 to 24 Years | 118 (43.9%) | 0 (0.0%) |
| 25 to 29 Years | 112 (74.2%) | 0 (0.0%) |
| 30 to 34 Years | 45 (30.8%) | 0 (0.0%) |
| 35 to 44 Years | 309 (75.7%) | 0 (0.0%) |
| 45 to 54 Years | 372 (72.8%) | 0 (0.0%) |
| 55 to 59 Years | 172 (64.9%) | 0 (0.0%) |
| 60 to 64 Years | 107 (57.2%) | 0 (0.0%) |
| 65 to 74 Years | 78 (44.1%) | 0 (0.0%) |
| 75 Years and over | 6 (2.5%) | 0 (0.0%) |
| Total | 1,341 (54.0%) | 0 (0.0%) |
Employment Status by Educational Attainment in Welsh
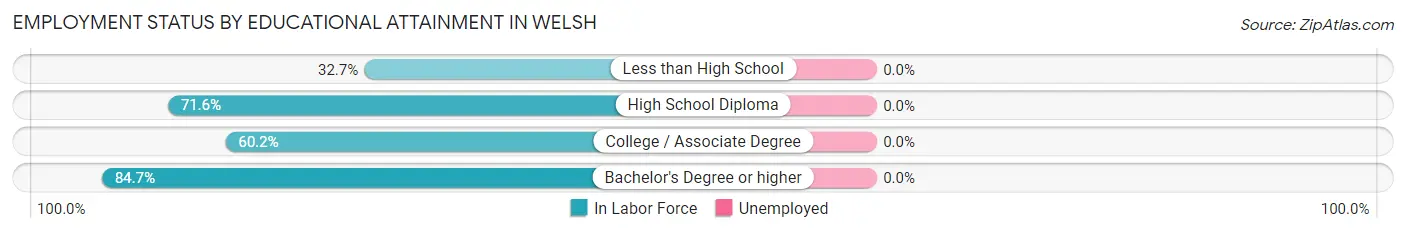
| Educational Attainment | In Labor Force | Unemployed |
| Less than High School | 36 (32.7%) | 0 (0.0%) |
| High School Diploma | 527 (71.6%) | 0 (0.0%) |
| College / Associate Degree | 349 (60.2%) | 0 (0.0%) |
| Bachelor's Degree or higher | 205 (84.7%) | 0 (0.0%) |
| Total | 1,118 (67.0%) | 0 (0.0%) |
Employment Occupations by Sex in Welsh
Management, Business, Science and Arts Occupations
The most common Management, Business, Science and Arts occupations in Welsh are Management (146 | 10.9%), Community & Social Service (98 | 7.3%), Education Instruction & Library (98 | 7.3%), Health Diagnosing & Treating (56 | 4.2%), and Health Technologists (45 | 3.4%).
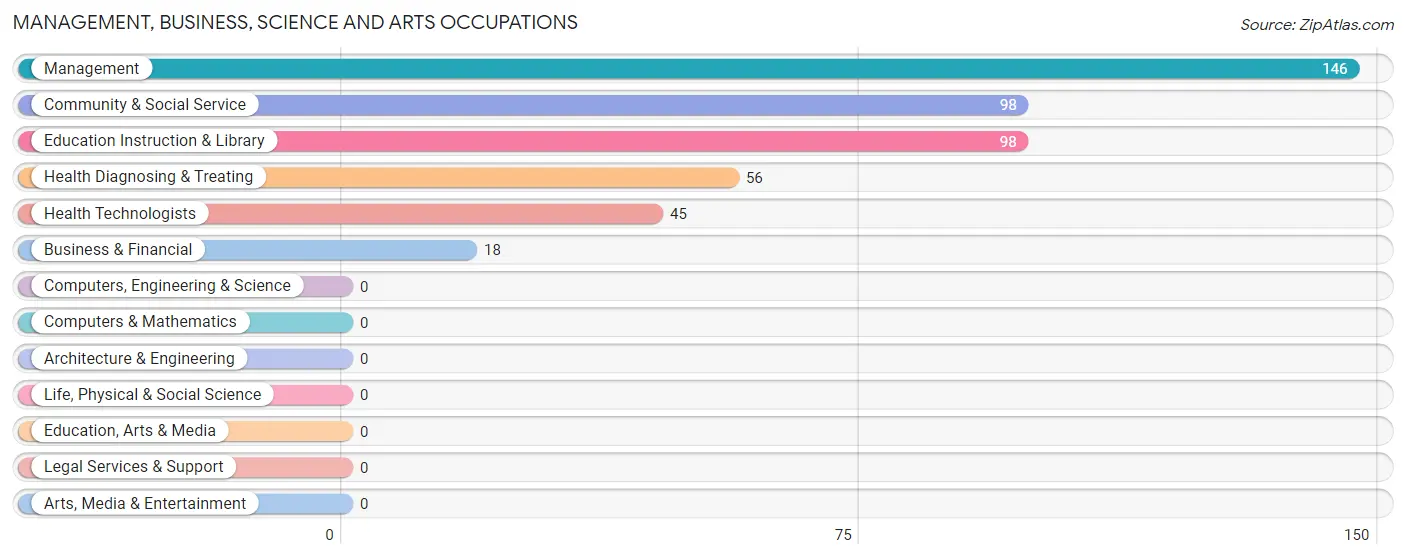
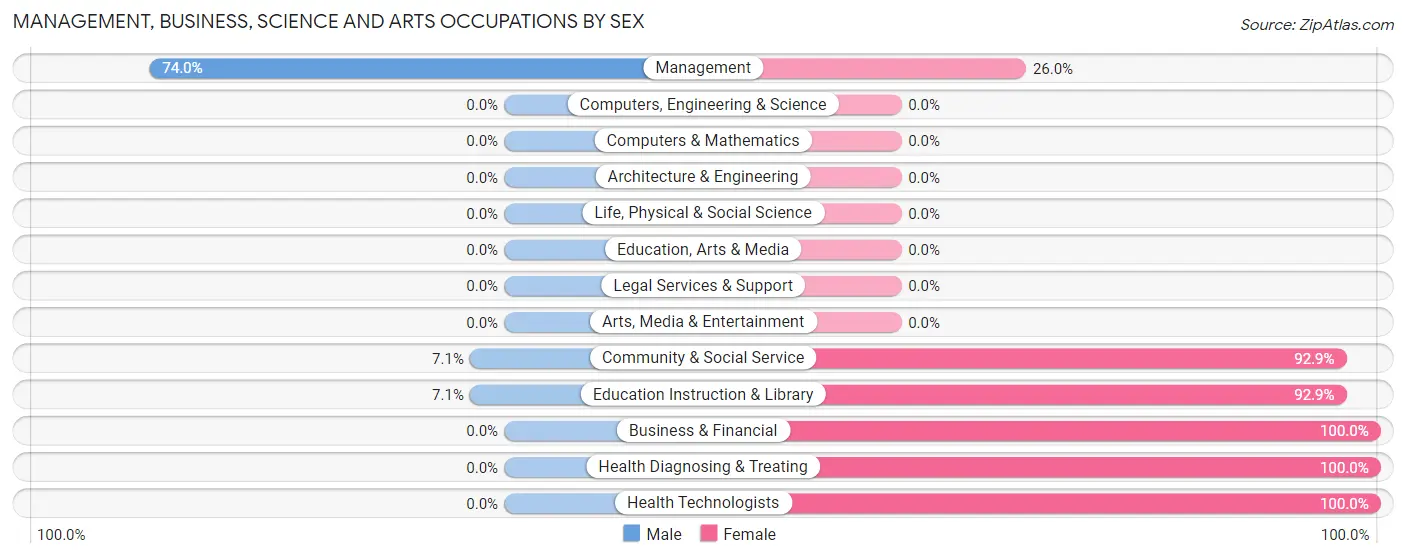
Management, Business, Science and Arts Occupations by Sex
Within the Management, Business, Science and Arts occupations in Welsh, the most male-oriented occupations are Management (74.0%), Community & Social Service (7.1%), and Education Instruction & Library (7.1%), while the most female-oriented occupations are Business & Financial (100.0%), Health Diagnosing & Treating (100.0%), and Health Technologists (100.0%).
| Occupation | Male | Female |
| Management | 108 (74.0%) | 38 (26.0%) |
| Business & Financial | 0 (0.0%) | 18 (100.0%) |
| Computers, Engineering & Science | 0 (0.0%) | 0 (0.0%) |
| Computers & Mathematics | 0 (0.0%) | 0 (0.0%) |
| Architecture & Engineering | 0 (0.0%) | 0 (0.0%) |
| Life, Physical & Social Science | 0 (0.0%) | 0 (0.0%) |
| Community & Social Service | 7 (7.1%) | 91 (92.9%) |
| Education, Arts & Media | 0 (0.0%) | 0 (0.0%) |
| Legal Services & Support | 0 (0.0%) | 0 (0.0%) |
| Education Instruction & Library | 7 (7.1%) | 91 (92.9%) |
| Arts, Media & Entertainment | 0 (0.0%) | 0 (0.0%) |
| Health Diagnosing & Treating | 0 (0.0%) | 56 (100.0%) |
| Health Technologists | 0 (0.0%) | 45 (100.0%) |
| Total (Category) | 115 (36.2%) | 203 (63.8%) |
| Total (Overall) | 831 (62.0%) | 510 (38.0%) |
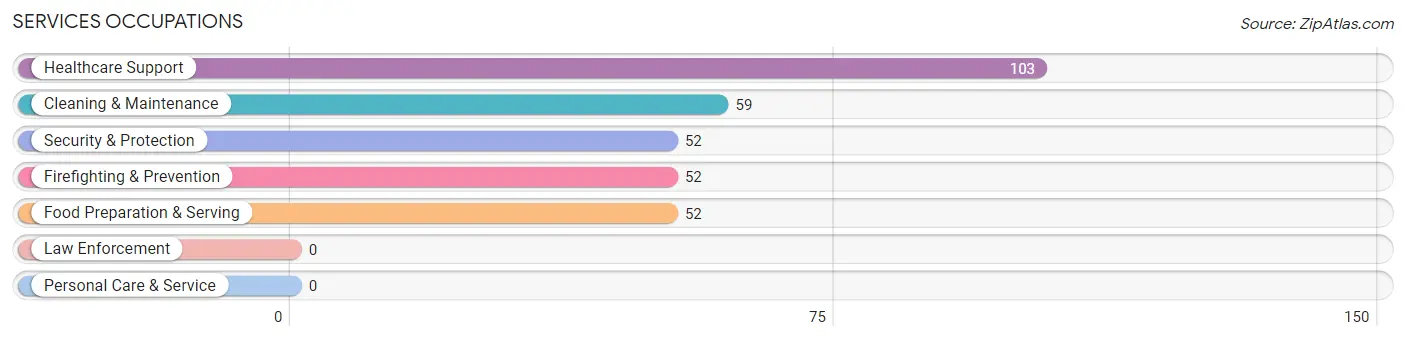
Services Occupations
The most common Services occupations in Welsh are Healthcare Support (103 | 7.7%), Cleaning & Maintenance (59 | 4.4%), Security & Protection (52 | 3.9%), Firefighting & Prevention (52 | 3.9%), and Food Preparation & Serving (52 | 3.9%).
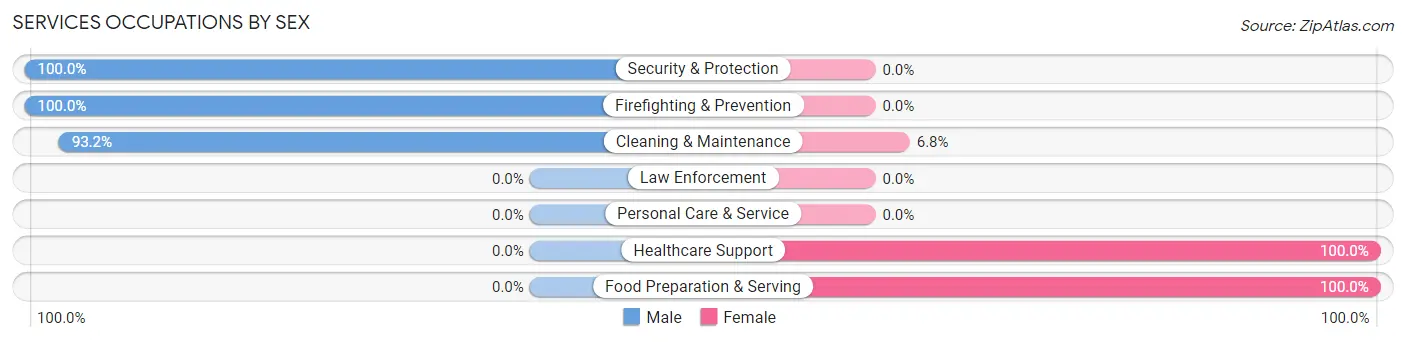
Services Occupations by Sex
Within the Services occupations in Welsh, the most male-oriented occupations are Security & Protection (100.0%), Firefighting & Prevention (100.0%), and Cleaning & Maintenance (93.2%), while the most female-oriented occupations are Healthcare Support (100.0%), Food Preparation & Serving (100.0%), and Cleaning & Maintenance (6.8%).
| Occupation | Male | Female |
| Healthcare Support | 0 (0.0%) | 103 (100.0%) |
| Security & Protection | 52 (100.0%) | 0 (0.0%) |
| Firefighting & Prevention | 52 (100.0%) | 0 (0.0%) |
| Law Enforcement | 0 (0.0%) | 0 (0.0%) |
| Food Preparation & Serving | 0 (0.0%) | 52 (100.0%) |
| Cleaning & Maintenance | 55 (93.2%) | 4 (6.8%) |
| Personal Care & Service | 0 (0.0%) | 0 (0.0%) |
| Total (Category) | 107 (40.2%) | 159 (59.8%) |
| Total (Overall) | 831 (62.0%) | 510 (38.0%) |
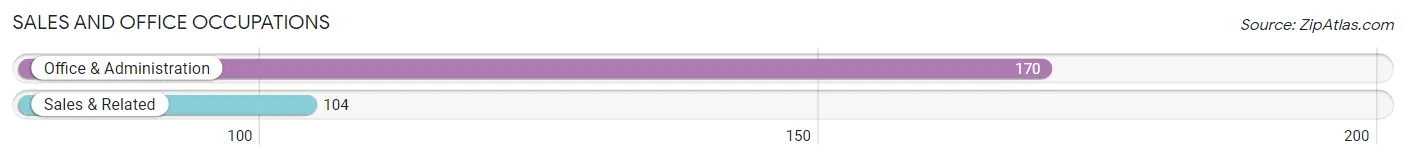
Sales and Office Occupations
The most common Sales and Office occupations in Welsh are Office & Administration (170 | 12.7%), and Sales & Related (104 | 7.8%).
Sales and Office Occupations by Sex

| Occupation | Male | Female |
| Sales & Related | 17 (16.4%) | 87 (83.7%) |
| Office & Administration | 118 (69.4%) | 52 (30.6%) |
| Total (Category) | 135 (49.3%) | 139 (50.7%) |
| Total (Overall) | 831 (62.0%) | 510 (38.0%) |
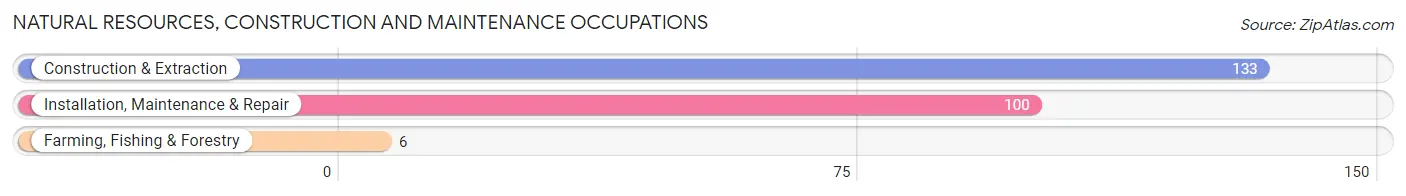
Natural Resources, Construction and Maintenance Occupations
The most common Natural Resources, Construction and Maintenance occupations in Welsh are Construction & Extraction (133 | 9.9%), Installation, Maintenance & Repair (100 | 7.5%), and Farming, Fishing & Forestry (6 | 0.4%).
Natural Resources, Construction and Maintenance Occupations by Sex
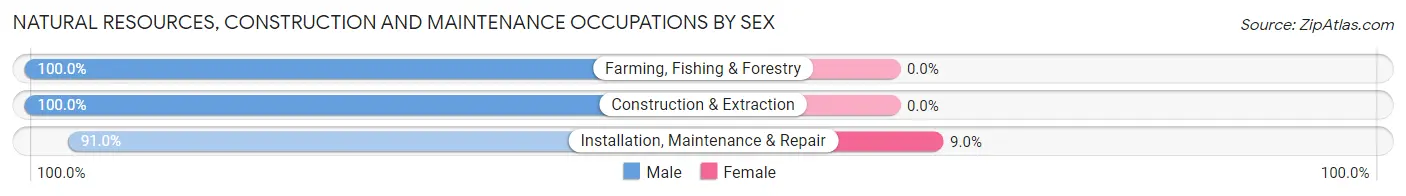
| Occupation | Male | Female |
| Farming, Fishing & Forestry | 6 (100.0%) | 0 (0.0%) |
| Construction & Extraction | 133 (100.0%) | 0 (0.0%) |
| Installation, Maintenance & Repair | 91 (91.0%) | 9 (9.0%) |
| Total (Category) | 230 (96.2%) | 9 (3.8%) |
| Total (Overall) | 831 (62.0%) | 510 (38.0%) |
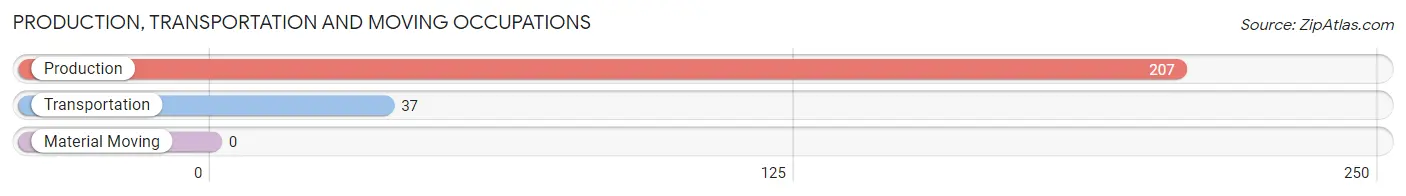
Production, Transportation and Moving Occupations
The most common Production, Transportation and Moving occupations in Welsh are Production (207 | 15.4%), and Transportation (37 | 2.8%).
Production, Transportation and Moving Occupations by Sex
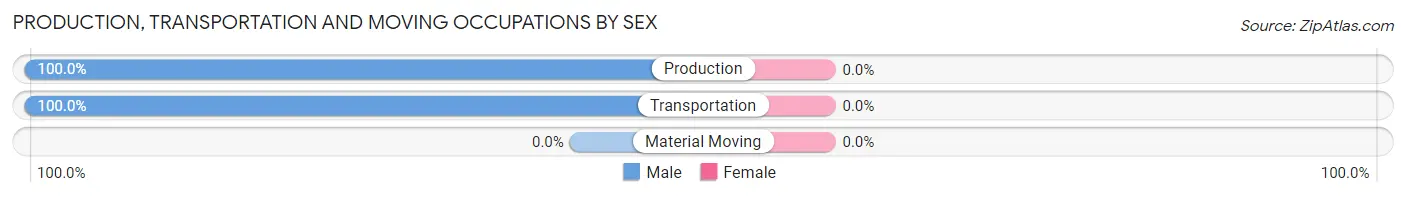
| Occupation | Male | Female |
| Production | 207 (100.0%) | 0 (0.0%) |
| Transportation | 37 (100.0%) | 0 (0.0%) |
| Material Moving | 0 (0.0%) | 0 (0.0%) |
| Total (Category) | 244 (100.0%) | 0 (0.0%) |
| Total (Overall) | 831 (62.0%) | 510 (38.0%) |
Employment Industries by Sex in Welsh
Employment Industries in Welsh
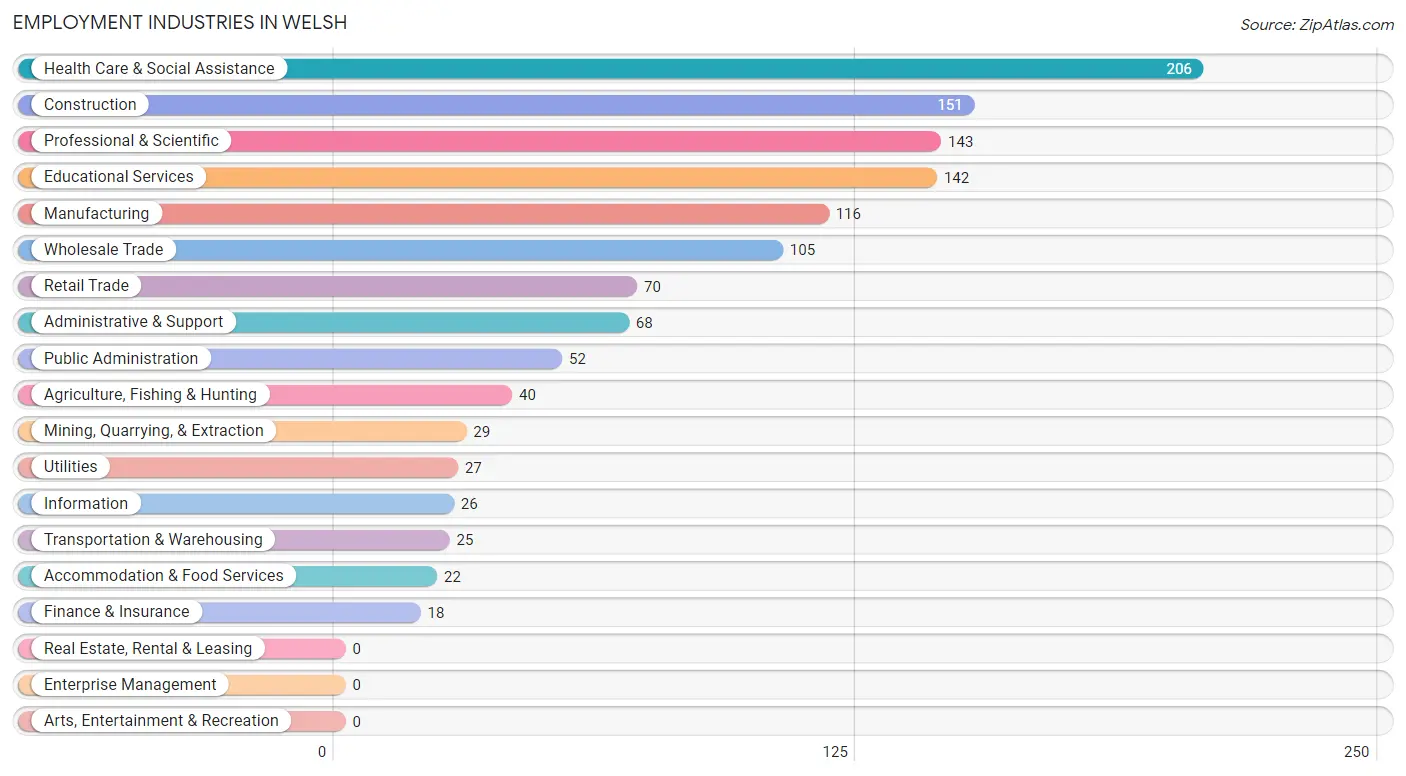
The major employment industries in Welsh include Health Care & Social Assistance (206 | 15.4%), Construction (151 | 11.3%), Professional & Scientific (143 | 10.7%), Educational Services (142 | 10.6%), and Manufacturing (116 | 8.6%).
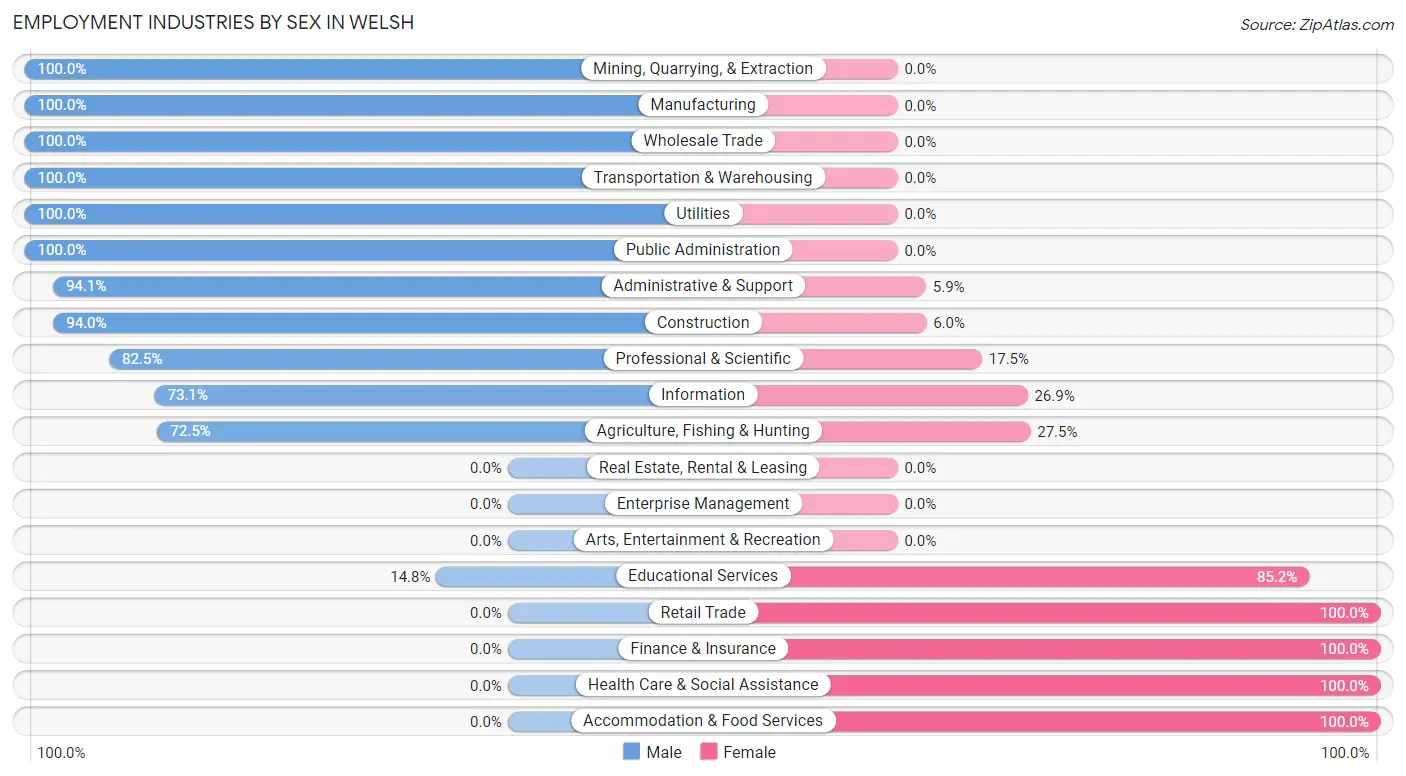
Employment Industries by Sex in Welsh
The Welsh industries that see more men than women are Mining, Quarrying, & Extraction (100.0%), Manufacturing (100.0%), and Wholesale Trade (100.0%), whereas the industries that tend to have a higher number of women are Retail Trade (100.0%), Finance & Insurance (100.0%), and Health Care & Social Assistance (100.0%).
| Industry | Male | Female |
| Agriculture, Fishing & Hunting | 29 (72.5%) | 11 (27.5%) |
| Mining, Quarrying, & Extraction | 29 (100.0%) | 0 (0.0%) |
| Construction | 142 (94.0%) | 9 (6.0%) |
| Manufacturing | 116 (100.0%) | 0 (0.0%) |
| Wholesale Trade | 105 (100.0%) | 0 (0.0%) |
| Retail Trade | 0 (0.0%) | 70 (100.0%) |
| Transportation & Warehousing | 25 (100.0%) | 0 (0.0%) |
| Utilities | 27 (100.0%) | 0 (0.0%) |
| Information | 19 (73.1%) | 7 (26.9%) |
| Finance & Insurance | 0 (0.0%) | 18 (100.0%) |
| Real Estate, Rental & Leasing | 0 (0.0%) | 0 (0.0%) |
| Professional & Scientific | 118 (82.5%) | 25 (17.5%) |
| Enterprise Management | 0 (0.0%) | 0 (0.0%) |
| Administrative & Support | 64 (94.1%) | 4 (5.9%) |
| Educational Services | 21 (14.8%) | 121 (85.2%) |
| Health Care & Social Assistance | 0 (0.0%) | 206 (100.0%) |
| Arts, Entertainment & Recreation | 0 (0.0%) | 0 (0.0%) |
| Accommodation & Food Services | 0 (0.0%) | 22 (100.0%) |
| Public Administration | 52 (100.0%) | 0 (0.0%) |
| Total | 831 (62.0%) | 510 (38.0%) |
Education in Welsh
School Enrollment in Welsh
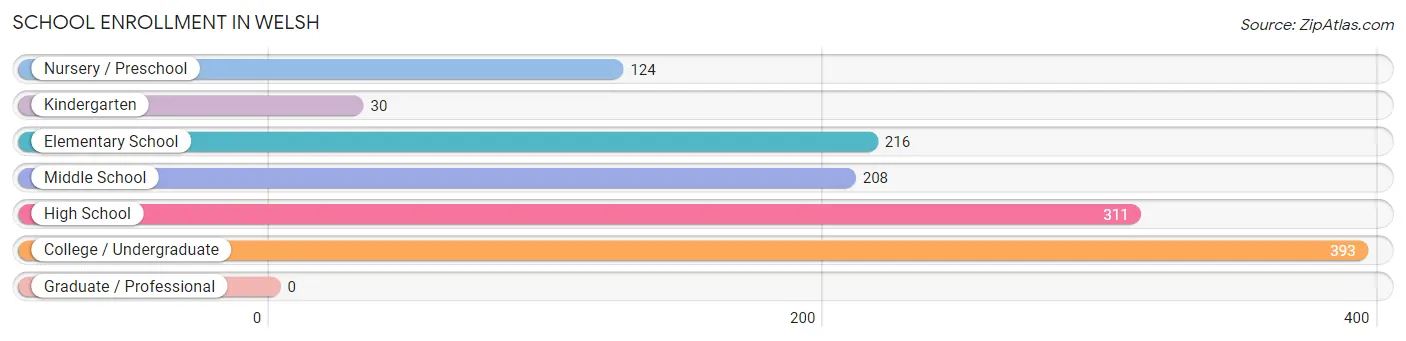
The most common levels of schooling among the 1,282 students in Welsh are college / undergraduate (393 | 30.7%), high school (311 | 24.3%), and elementary school (216 | 16.9%).
| School Level | # Students | % Students |
| Nursery / Preschool | 124 | 9.7% |
| Kindergarten | 30 | 2.3% |
| Elementary School | 216 | 16.9% |
| Middle School | 208 | 16.2% |
| High School | 311 | 24.3% |
| College / Undergraduate | 393 | 30.7% |
| Graduate / Professional | 0 | 0.0% |
| Total | 1,282 | 100.0% |
School Enrollment by Age by Funding Source in Welsh
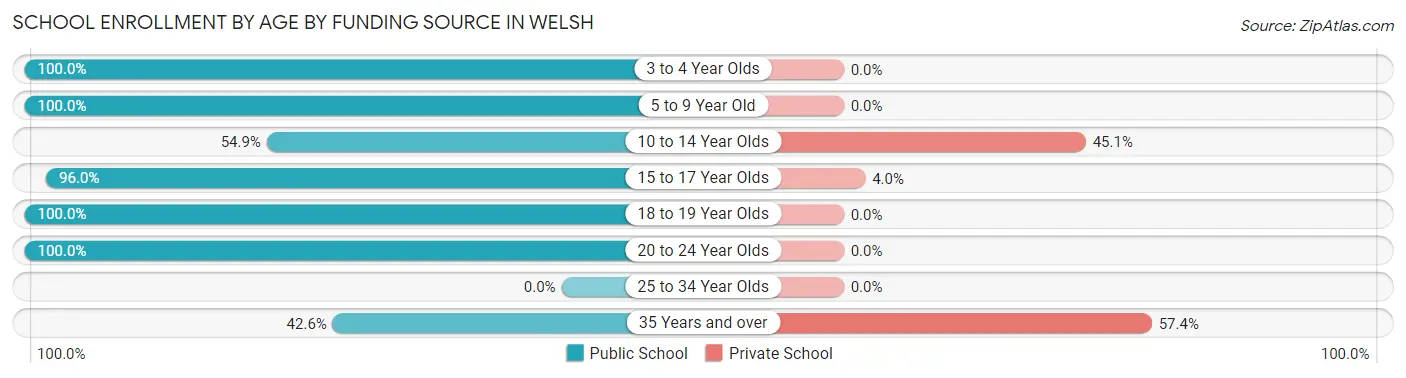
Out of a total of 1,282 students who are enrolled in schools in Welsh, 183 (14.3%) attend a private institution, while the remaining 1,099 (85.7%) are enrolled in public schools. The age group of 35 years and over has the highest likelihood of being enrolled in private schools, with 70 (57.4% in the age bracket) enrolled. Conversely, the age group of 3 to 4 year olds has the lowest likelihood of being enrolled in a private school, with 124 (100.0% in the age bracket) attending a public institution.
| Age Bracket | Public School | Private School |
| 3 to 4 Year Olds | 124 (100.0%) | 0 (0.0%) |
| 5 to 9 Year Old | 242 (100.0%) | 0 (0.0%) |
| 10 to 14 Year Olds | 123 (54.9%) | 101 (45.1%) |
| 15 to 17 Year Olds | 287 (96.0%) | 12 (4.0%) |
| 18 to 19 Year Olds | 13 (100.0%) | 0 (0.0%) |
| 20 to 24 Year Olds | 258 (100.0%) | 0 (0.0%) |
| 25 to 34 Year Olds | 0 (0.0%) | 0 (0.0%) |
| 35 Years and over | 52 (42.6%) | 70 (57.4%) |
| Total | 1,099 (85.7%) | 183 (14.3%) |
Educational Attainment by Field of Study in Welsh
Education (98 | 35.8%), science & technology (60 | 21.9%), business (39 | 14.2%), bio, nature & agricultural (34 | 12.4%), and literature & languages (17 | 6.2%) are the most common fields of study among 274 individuals in Welsh who have obtained a bachelor's degree or higher.
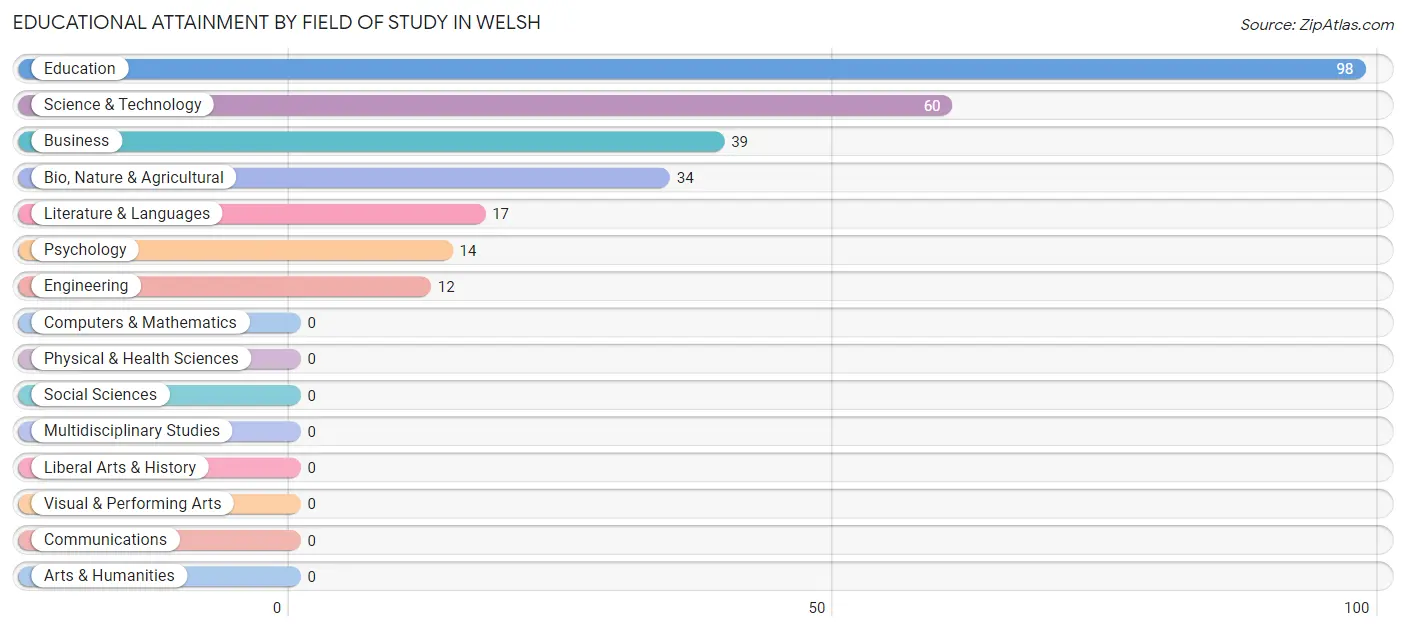
| Field of Study | # Graduates | % Graduates |
| Computers & Mathematics | 0 | 0.0% |
| Bio, Nature & Agricultural | 34 | 12.4% |
| Physical & Health Sciences | 0 | 0.0% |
| Psychology | 14 | 5.1% |
| Social Sciences | 0 | 0.0% |
| Engineering | 12 | 4.4% |
| Multidisciplinary Studies | 0 | 0.0% |
| Science & Technology | 60 | 21.9% |
| Business | 39 | 14.2% |
| Education | 98 | 35.8% |
| Literature & Languages | 17 | 6.2% |
| Liberal Arts & History | 0 | 0.0% |
| Visual & Performing Arts | 0 | 0.0% |
| Communications | 0 | 0.0% |
| Arts & Humanities | 0 | 0.0% |
| Total | 274 | 100.0% |
Transportation & Commute in Welsh
Vehicle Availability by Sex in Welsh
The most prevalent vehicle ownership categories in Welsh are males with 4 vehicles (307, accounting for 36.9%) and females with 4 vehicles (66, making up 63.2%).
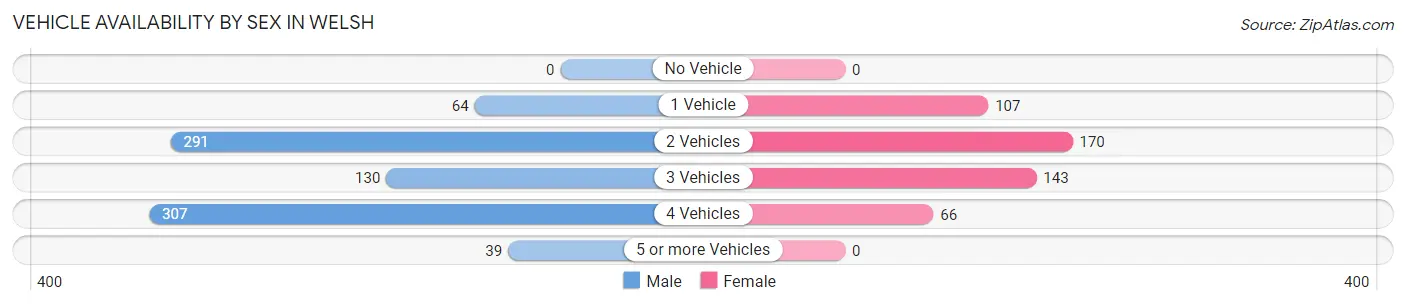
| Vehicles Available | Male | Female |
| No Vehicle | 0 (0.0%) | 0 (0.0%) |
| 1 Vehicle | 64 (7.7%) | 107 (22.0%) |
| 2 Vehicles | 291 (35.0%) | 170 (35.0%) |
| 3 Vehicles | 130 (15.6%) | 143 (29.4%) |
| 4 Vehicles | 307 (36.9%) | 66 (13.6%) |
| 5 or more Vehicles | 39 (4.7%) | 0 (0.0%) |
| Total | 831 (100.0%) | 486 (100.0%) |
Commute Time in Welsh
The most frequently occuring commute durations in Welsh are 30 to 34 minutes (300 commuters, 22.8%), 25 to 29 minutes (170 commuters, 12.9%), and 60 to 89 minutes (159 commuters, 12.1%).
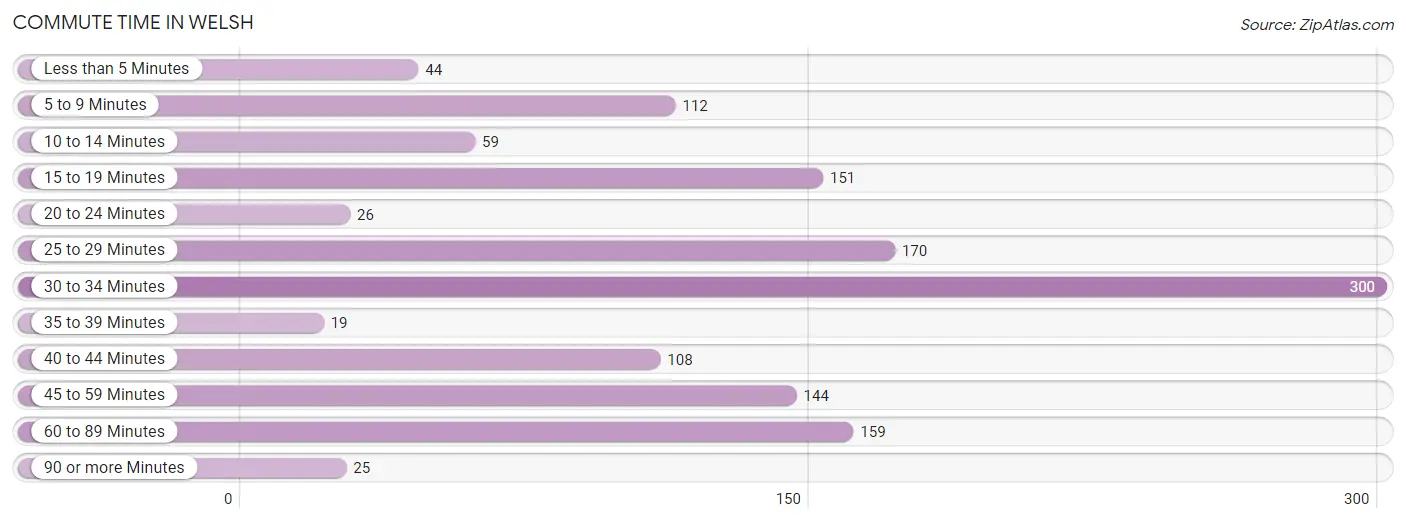
| Commute Time | # Commuters | % Commuters |
| Less than 5 Minutes | 44 | 3.3% |
| 5 to 9 Minutes | 112 | 8.5% |
| 10 to 14 Minutes | 59 | 4.5% |
| 15 to 19 Minutes | 151 | 11.5% |
| 20 to 24 Minutes | 26 | 2.0% |
| 25 to 29 Minutes | 170 | 12.9% |
| 30 to 34 Minutes | 300 | 22.8% |
| 35 to 39 Minutes | 19 | 1.4% |
| 40 to 44 Minutes | 108 | 8.2% |
| 45 to 59 Minutes | 144 | 10.9% |
| 60 to 89 Minutes | 159 | 12.1% |
| 90 or more Minutes | 25 | 1.9% |
Commute Time by Sex in Welsh
The most common commute times in Welsh are 30 to 34 minutes (275 commuters, 33.1%) for males and 5 to 9 minutes (99 commuters, 20.4%) for females.
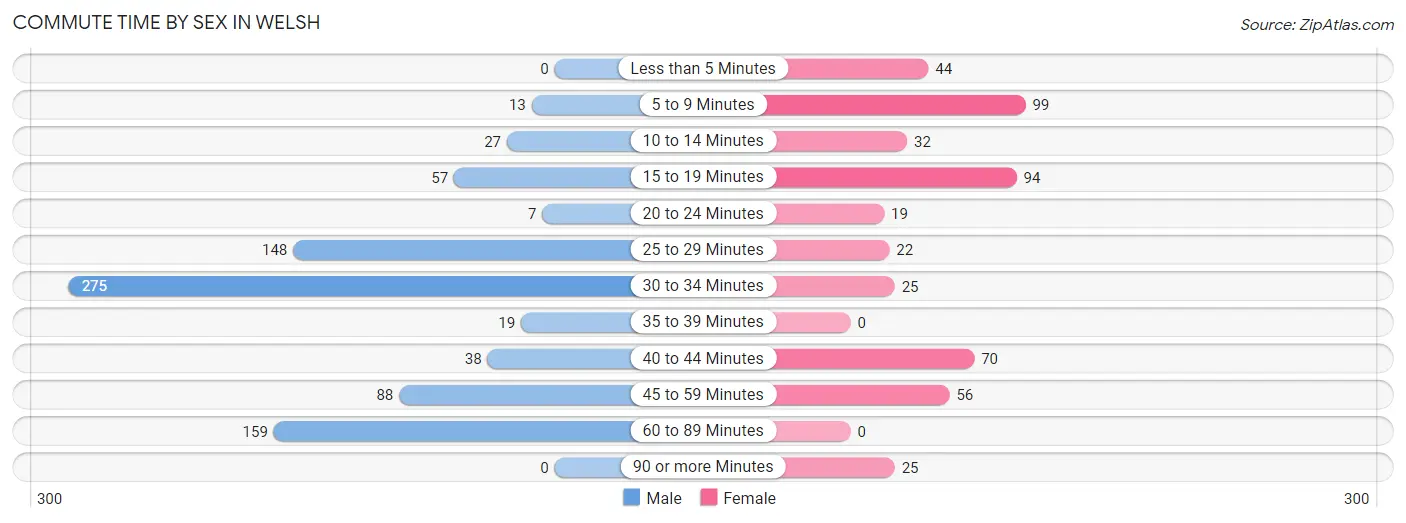
| Commute Time | Male | Female |
| Less than 5 Minutes | 0 (0.0%) | 44 (9.0%) |
| 5 to 9 Minutes | 13 (1.6%) | 99 (20.4%) |
| 10 to 14 Minutes | 27 (3.3%) | 32 (6.6%) |
| 15 to 19 Minutes | 57 (6.9%) | 94 (19.3%) |
| 20 to 24 Minutes | 7 (0.8%) | 19 (3.9%) |
| 25 to 29 Minutes | 148 (17.8%) | 22 (4.5%) |
| 30 to 34 Minutes | 275 (33.1%) | 25 (5.1%) |
| 35 to 39 Minutes | 19 (2.3%) | 0 (0.0%) |
| 40 to 44 Minutes | 38 (4.6%) | 70 (14.4%) |
| 45 to 59 Minutes | 88 (10.6%) | 56 (11.5%) |
| 60 to 89 Minutes | 159 (19.1%) | 0 (0.0%) |
| 90 or more Minutes | 0 (0.0%) | 25 (5.1%) |
Time of Departure to Work by Sex in Welsh
The most frequent times of departure to work in Welsh are 6:00 AM to 6:29 AM (226, 27.2%) for males and 7:00 AM to 7:29 AM (234, 48.1%) for females.
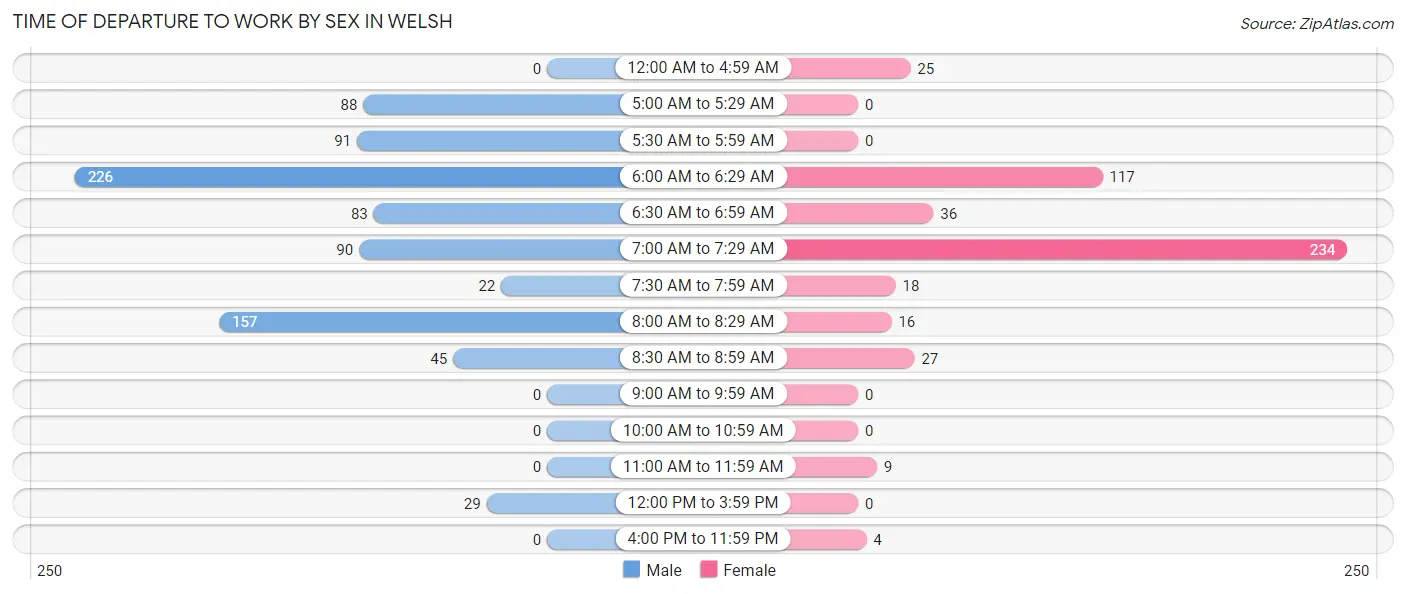
| Time of Departure | Male | Female |
| 12:00 AM to 4:59 AM | 0 (0.0%) | 25 (5.1%) |
| 5:00 AM to 5:29 AM | 88 (10.6%) | 0 (0.0%) |
| 5:30 AM to 5:59 AM | 91 (11.0%) | 0 (0.0%) |
| 6:00 AM to 6:29 AM | 226 (27.2%) | 117 (24.1%) |
| 6:30 AM to 6:59 AM | 83 (10.0%) | 36 (7.4%) |
| 7:00 AM to 7:29 AM | 90 (10.8%) | 234 (48.1%) |
| 7:30 AM to 7:59 AM | 22 (2.6%) | 18 (3.7%) |
| 8:00 AM to 8:29 AM | 157 (18.9%) | 16 (3.3%) |
| 8:30 AM to 8:59 AM | 45 (5.4%) | 27 (5.6%) |
| 9:00 AM to 9:59 AM | 0 (0.0%) | 0 (0.0%) |
| 10:00 AM to 10:59 AM | 0 (0.0%) | 0 (0.0%) |
| 11:00 AM to 11:59 AM | 0 (0.0%) | 9 (1.8%) |
| 12:00 PM to 3:59 PM | 29 (3.5%) | 0 (0.0%) |
| 4:00 PM to 11:59 PM | 0 (0.0%) | 4 (0.8%) |
| Total | 831 (100.0%) | 486 (100.0%) |
Housing Occupancy in Welsh
Occupancy by Ownership in Welsh
Of the total 1,071 dwellings in Welsh, owner-occupied units account for 881 (82.3%), while renter-occupied units make up 190 (17.7%).
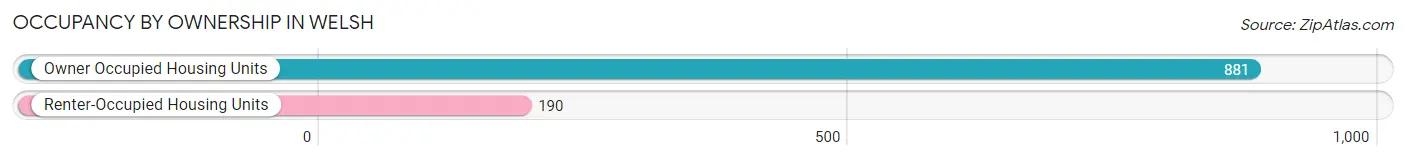
| Occupancy | # Housing Units | % Housing Units |
| Owner Occupied Housing Units | 881 | 82.3% |
| Renter-Occupied Housing Units | 190 | 17.7% |
| Total Occupied Housing Units | 1,071 | 100.0% |
Occupancy by Household Size in Welsh
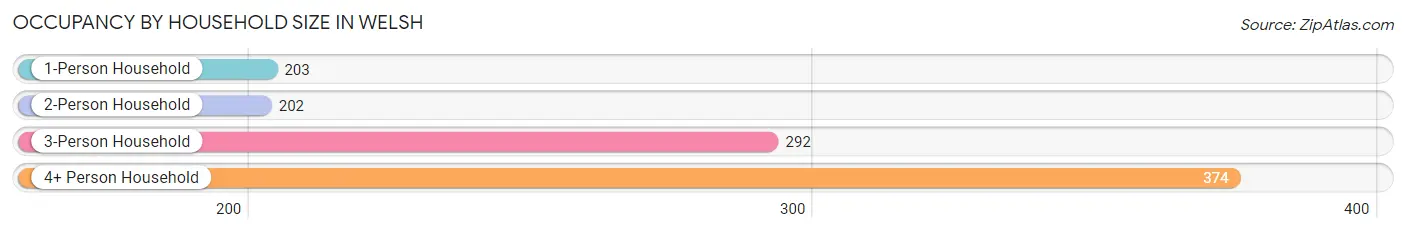
| Household Size | # Housing Units | % Housing Units |
| 1-Person Household | 203 | 19.0% |
| 2-Person Household | 202 | 18.9% |
| 3-Person Household | 292 | 27.3% |
| 4+ Person Household | 374 | 34.9% |
| Total Housing Units | 1,071 | 100.0% |
Occupancy by Ownership by Household Size in Welsh
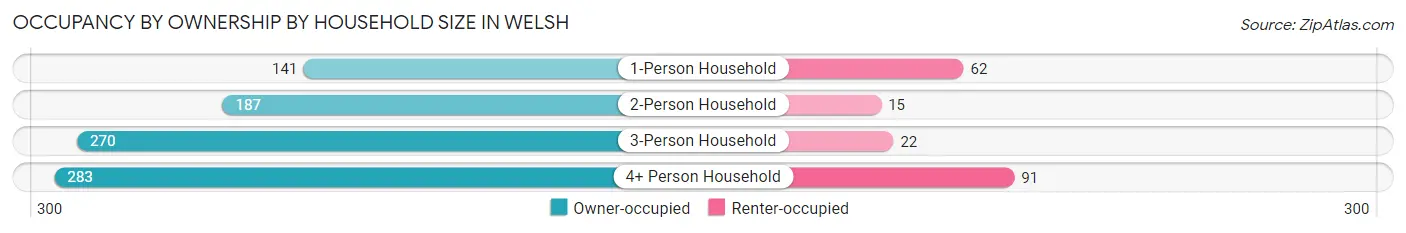
| Household Size | Owner-occupied | Renter-occupied |
| 1-Person Household | 141 (69.5%) | 62 (30.5%) |
| 2-Person Household | 187 (92.6%) | 15 (7.4%) |
| 3-Person Household | 270 (92.5%) | 22 (7.5%) |
| 4+ Person Household | 283 (75.7%) | 91 (24.3%) |
| Total Housing Units | 881 (82.3%) | 190 (17.7%) |
Occupancy by Educational Attainment in Welsh
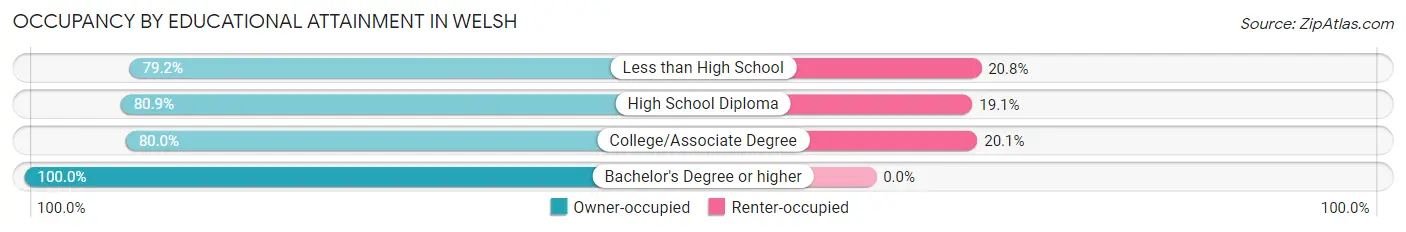
| Household Size | Owner-occupied | Renter-occupied |
| Less than High School | 114 (79.2%) | 30 (20.8%) |
| High School Diploma | 365 (80.9%) | 86 (19.1%) |
| College/Associate Degree | 295 (79.9%) | 74 (20.1%) |
| Bachelor's Degree or higher | 107 (100.0%) | 0 (0.0%) |
Occupancy by Age of Householder in Welsh
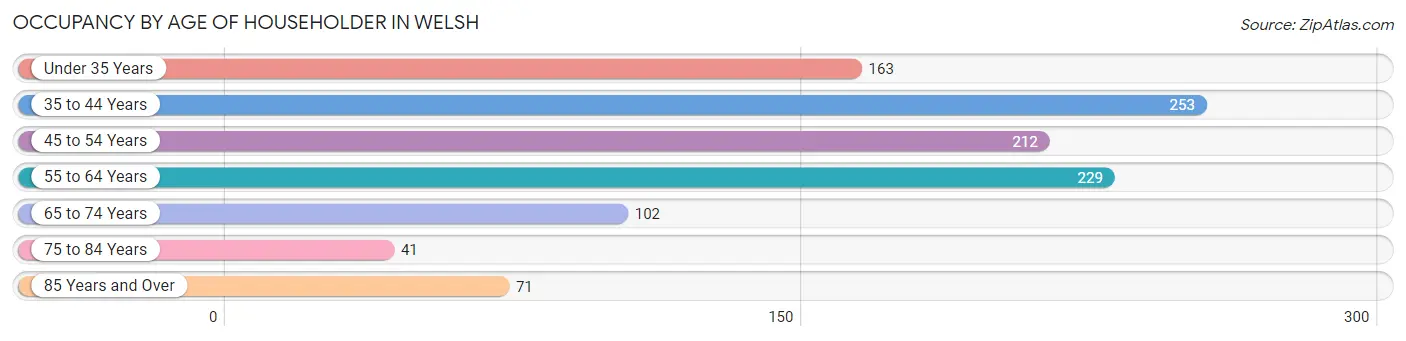
| Age Bracket | # Households | % Households |
| Under 35 Years | 163 | 15.2% |
| 35 to 44 Years | 253 | 23.6% |
| 45 to 54 Years | 212 | 19.8% |
| 55 to 64 Years | 229 | 21.4% |
| 65 to 74 Years | 102 | 9.5% |
| 75 to 84 Years | 41 | 3.8% |
| 85 Years and Over | 71 | 6.6% |
| Total | 1,071 | 100.0% |
Housing Finances in Welsh
Median Income by Occupancy in Welsh
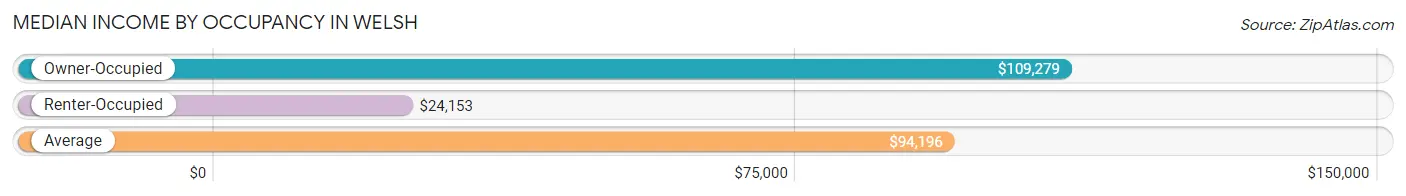
| Occupancy Type | # Households | Median Income |
| Owner-Occupied | 881 (82.3%) | $109,279 |
| Renter-Occupied | 190 (17.7%) | $24,153 |
| Average | 1,071 (100.0%) | $94,196 |
Occupancy by Householder Income Bracket in Welsh
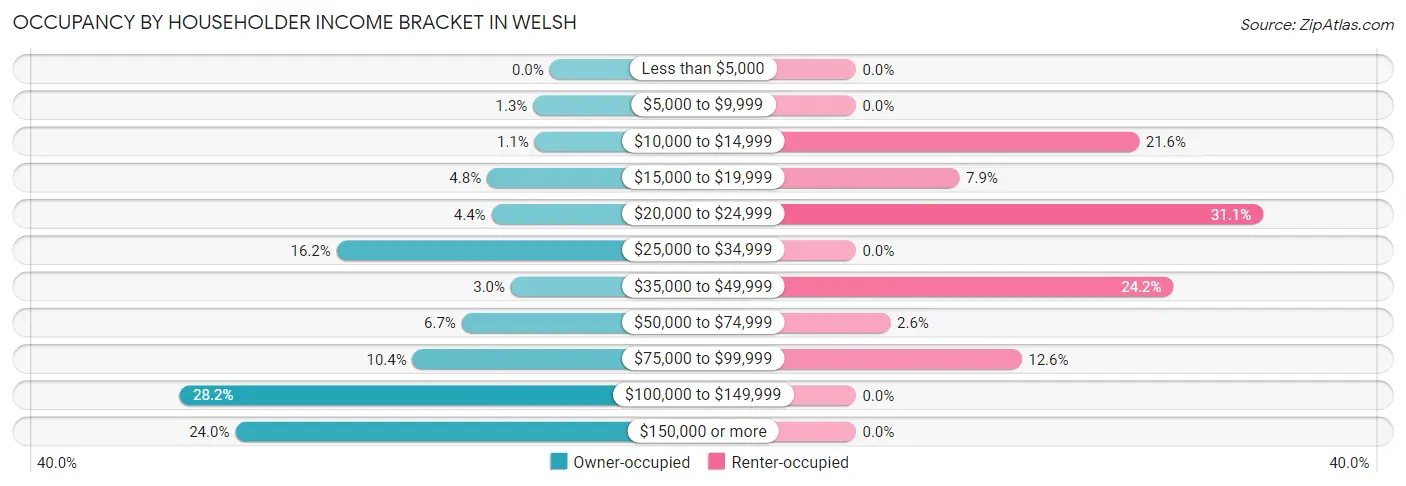
| Income Bracket | Owner-occupied | Renter-occupied |
| Less than $5,000 | 0 (0.0%) | 0 (0.0%) |
| $5,000 to $9,999 | 11 (1.3%) | 0 (0.0%) |
| $10,000 to $14,999 | 10 (1.1%) | 41 (21.6%) |
| $15,000 to $19,999 | 42 (4.8%) | 15 (7.9%) |
| $20,000 to $24,999 | 39 (4.4%) | 59 (31.0%) |
| $25,000 to $34,999 | 143 (16.2%) | 0 (0.0%) |
| $35,000 to $49,999 | 26 (2.9%) | 46 (24.2%) |
| $50,000 to $74,999 | 59 (6.7%) | 5 (2.6%) |
| $75,000 to $99,999 | 92 (10.4%) | 24 (12.6%) |
| $100,000 to $149,999 | 248 (28.1%) | 0 (0.0%) |
| $150,000 or more | 211 (23.9%) | 0 (0.0%) |
| Total | 881 (100.0%) | 190 (100.0%) |
Monthly Housing Cost Tiers in Welsh
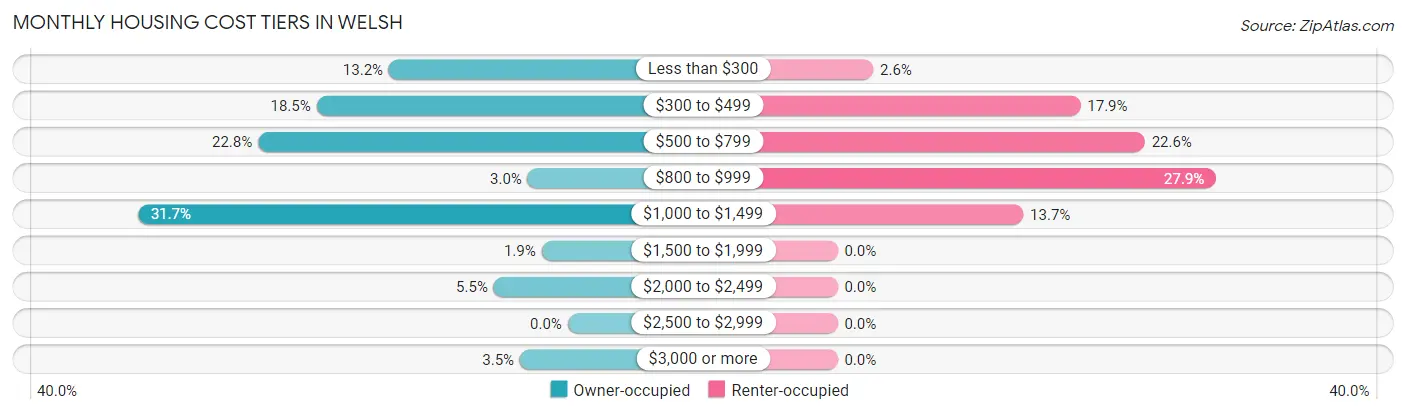
| Monthly Cost | Owner-occupied | Renter-occupied |
| Less than $300 | 116 (13.2%) | 5 (2.6%) |
| $300 to $499 | 163 (18.5%) | 34 (17.9%) |
| $500 to $799 | 201 (22.8%) | 43 (22.6%) |
| $800 to $999 | 26 (2.9%) | 53 (27.9%) |
| $1,000 to $1,499 | 279 (31.7%) | 26 (13.7%) |
| $1,500 to $1,999 | 17 (1.9%) | 0 (0.0%) |
| $2,000 to $2,499 | 48 (5.4%) | 0 (0.0%) |
| $2,500 to $2,999 | 0 (0.0%) | 0 (0.0%) |
| $3,000 or more | 31 (3.5%) | 0 (0.0%) |
| Total | 881 (100.0%) | 190 (100.0%) |
Physical Housing Characteristics in Welsh
Housing Structures in Welsh
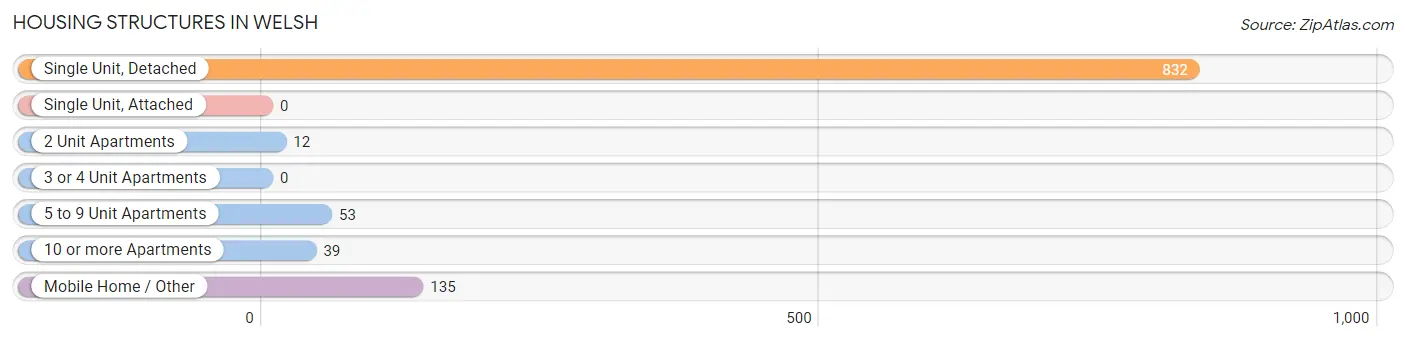
| Structure Type | # Housing Units | % Housing Units |
| Single Unit, Detached | 832 | 77.7% |
| Single Unit, Attached | 0 | 0.0% |
| 2 Unit Apartments | 12 | 1.1% |
| 3 or 4 Unit Apartments | 0 | 0.0% |
| 5 to 9 Unit Apartments | 53 | 5.0% |
| 10 or more Apartments | 39 | 3.6% |
| Mobile Home / Other | 135 | 12.6% |
| Total | 1,071 | 100.0% |
Housing Structures by Occupancy in Welsh
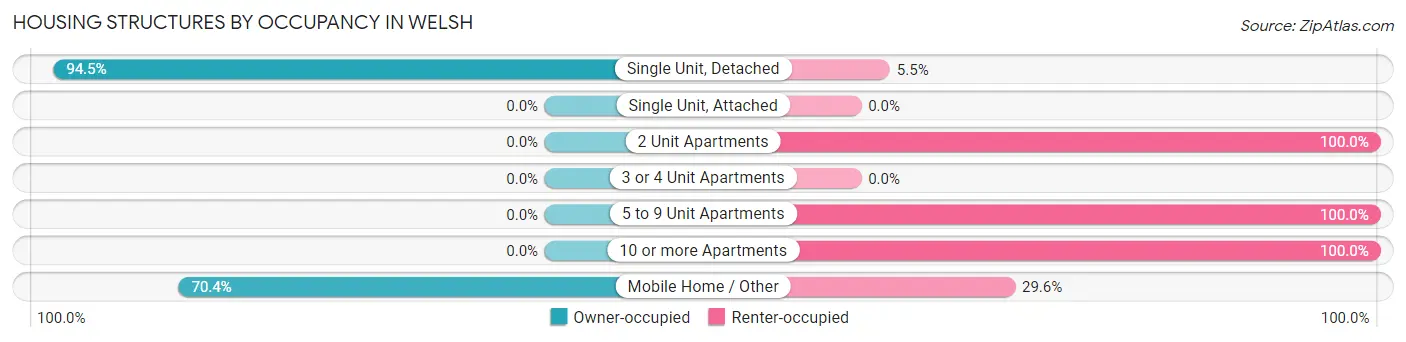
| Structure Type | Owner-occupied | Renter-occupied |
| Single Unit, Detached | 786 (94.5%) | 46 (5.5%) |
| Single Unit, Attached | 0 (0.0%) | 0 (0.0%) |
| 2 Unit Apartments | 0 (0.0%) | 12 (100.0%) |
| 3 or 4 Unit Apartments | 0 (0.0%) | 0 (0.0%) |
| 5 to 9 Unit Apartments | 0 (0.0%) | 53 (100.0%) |
| 10 or more Apartments | 0 (0.0%) | 39 (100.0%) |
| Mobile Home / Other | 95 (70.4%) | 40 (29.6%) |
| Total | 881 (82.3%) | 190 (17.7%) |
Housing Structures by Number of Rooms in Welsh
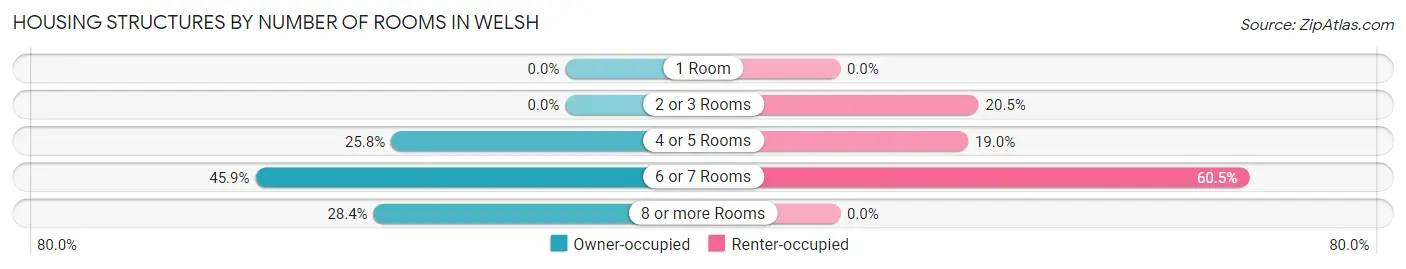
| Number of Rooms | Owner-occupied | Renter-occupied |
| 1 Room | 0 (0.0%) | 0 (0.0%) |
| 2 or 3 Rooms | 0 (0.0%) | 39 (20.5%) |
| 4 or 5 Rooms | 227 (25.8%) | 36 (19.0%) |
| 6 or 7 Rooms | 404 (45.9%) | 115 (60.5%) |
| 8 or more Rooms | 250 (28.4%) | 0 (0.0%) |
| Total | 881 (100.0%) | 190 (100.0%) |
Housing Structure by Heating Type in Welsh
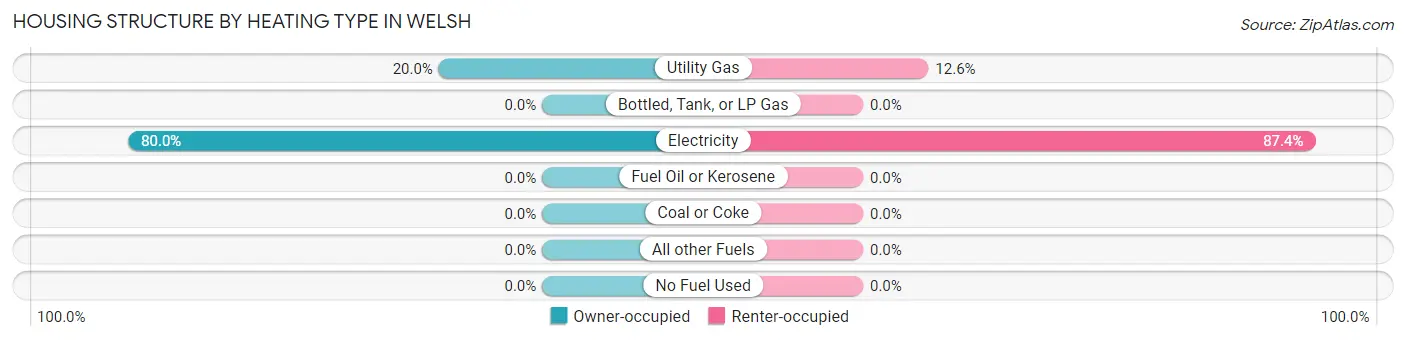
| Heating Type | Owner-occupied | Renter-occupied |
| Utility Gas | 176 (20.0%) | 24 (12.6%) |
| Bottled, Tank, or LP Gas | 0 (0.0%) | 0 (0.0%) |
| Electricity | 705 (80.0%) | 166 (87.4%) |
| Fuel Oil or Kerosene | 0 (0.0%) | 0 (0.0%) |
| Coal or Coke | 0 (0.0%) | 0 (0.0%) |
| All other Fuels | 0 (0.0%) | 0 (0.0%) |
| No Fuel Used | 0 (0.0%) | 0 (0.0%) |
| Total | 881 (100.0%) | 190 (100.0%) |
Household Vehicle Usage in Welsh
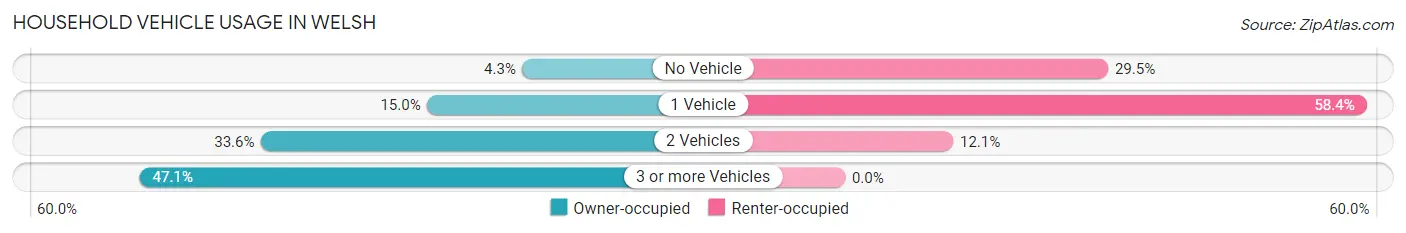
| Vehicles per Household | Owner-occupied | Renter-occupied |
| No Vehicle | 38 (4.3%) | 56 (29.5%) |
| 1 Vehicle | 132 (15.0%) | 111 (58.4%) |
| 2 Vehicles | 296 (33.6%) | 23 (12.1%) |
| 3 or more Vehicles | 415 (47.1%) | 0 (0.0%) |
| Total | 881 (100.0%) | 190 (100.0%) |
Real Estate & Mortgages in Welsh
Real Estate and Mortgage Overview in Welsh
| Characteristic | Without Mortgage | With Mortgage |
| Housing Units | 414 | 467 |
| Median Property Value | $147,200 | $161,100 |
| Median Household Income | $58,125 | $155 |
| Monthly Housing Costs | $374 | $31 |
| Real Estate Taxes | $250 | $0 |
Property Value by Mortgage Status in Welsh
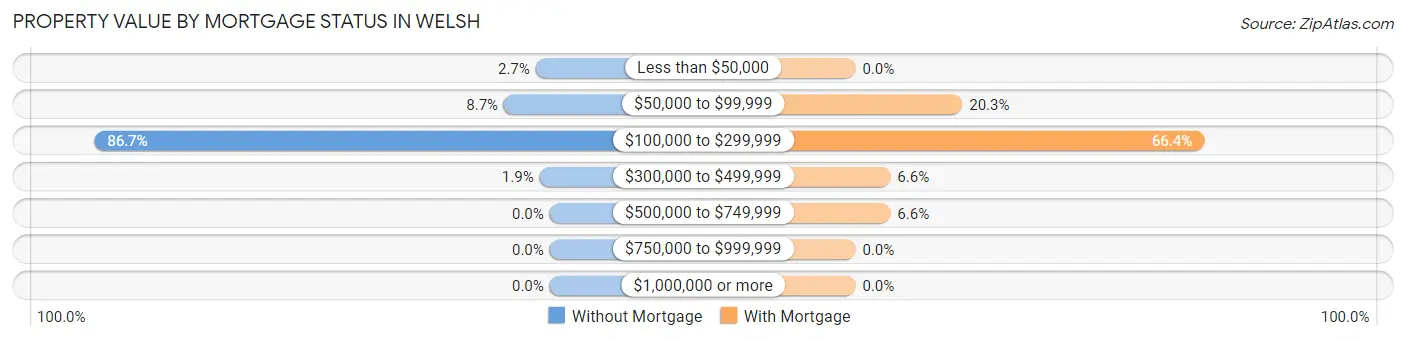
| Property Value | Without Mortgage | With Mortgage |
| Less than $50,000 | 11 (2.7%) | 0 (0.0%) |
| $50,000 to $99,999 | 36 (8.7%) | 95 (20.3%) |
| $100,000 to $299,999 | 359 (86.7%) | 310 (66.4%) |
| $300,000 to $499,999 | 8 (1.9%) | 31 (6.6%) |
| $500,000 to $749,999 | 0 (0.0%) | 31 (6.6%) |
| $750,000 to $999,999 | 0 (0.0%) | 0 (0.0%) |
| $1,000,000 or more | 0 (0.0%) | 0 (0.0%) |
| Total | 414 (100.0%) | 467 (100.0%) |
Household Income by Mortgage Status in Welsh
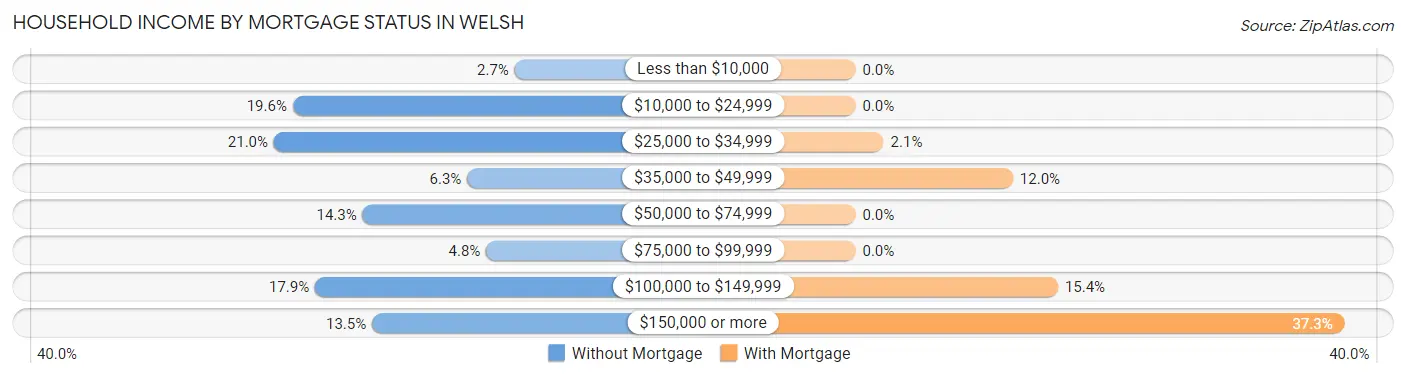
| Household Income | Without Mortgage | With Mortgage |
| Less than $10,000 | 11 (2.7%) | 0 (0.0%) |
| $10,000 to $24,999 | 81 (19.6%) | 0 (0.0%) |
| $25,000 to $34,999 | 87 (21.0%) | 10 (2.1%) |
| $35,000 to $49,999 | 26 (6.3%) | 56 (12.0%) |
| $50,000 to $74,999 | 59 (14.2%) | 0 (0.0%) |
| $75,000 to $99,999 | 20 (4.8%) | 0 (0.0%) |
| $100,000 to $149,999 | 74 (17.9%) | 72 (15.4%) |
| $150,000 or more | 56 (13.5%) | 174 (37.3%) |
| Total | 414 (100.0%) | 467 (100.0%) |
Property Value to Household Income Ratio in Welsh
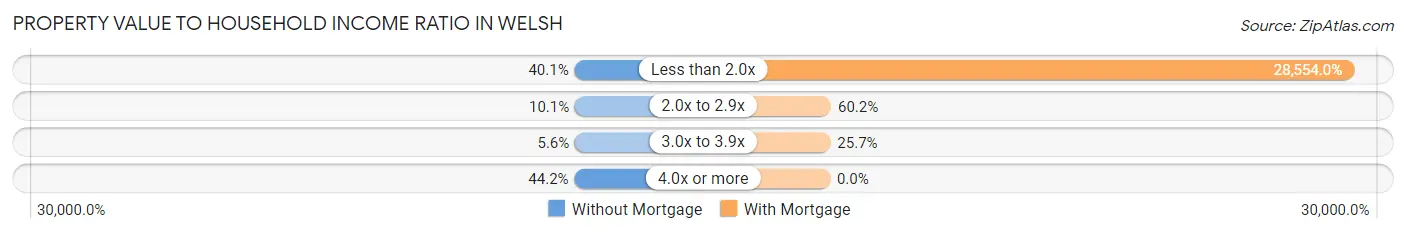
| Value-to-Income Ratio | Without Mortgage | With Mortgage |
| Less than 2.0x | 166 (40.1%) | 133,347 (28,554.0%) |
| 2.0x to 2.9x | 42 (10.1%) | 281 (60.2%) |
| 3.0x to 3.9x | 23 (5.6%) | 120 (25.7%) |
| 4.0x or more | 183 (44.2%) | 0 (0.0%) |
| Total | 414 (100.0%) | 467 (100.0%) |
Real Estate Taxes by Mortgage Status in Welsh
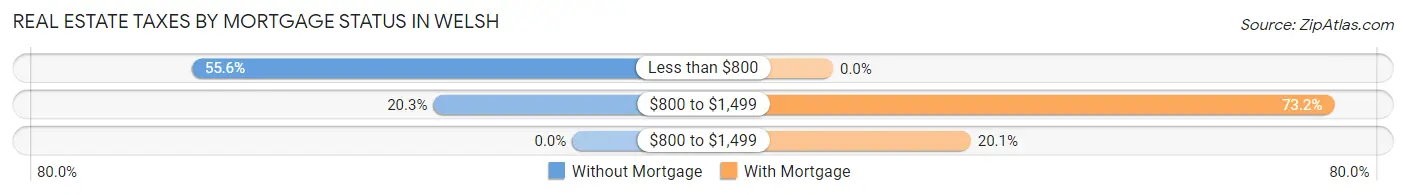
| Property Taxes | Without Mortgage | With Mortgage |
| Less than $800 | 230 (55.6%) | 0 (0.0%) |
| $800 to $1,499 | 84 (20.3%) | 342 (73.2%) |
| $800 to $1,499 | 0 (0.0%) | 94 (20.1%) |
| Total | 414 (100.0%) | 467 (100.0%) |
Health & Disability in Welsh
Health Insurance Coverage by Age in Welsh
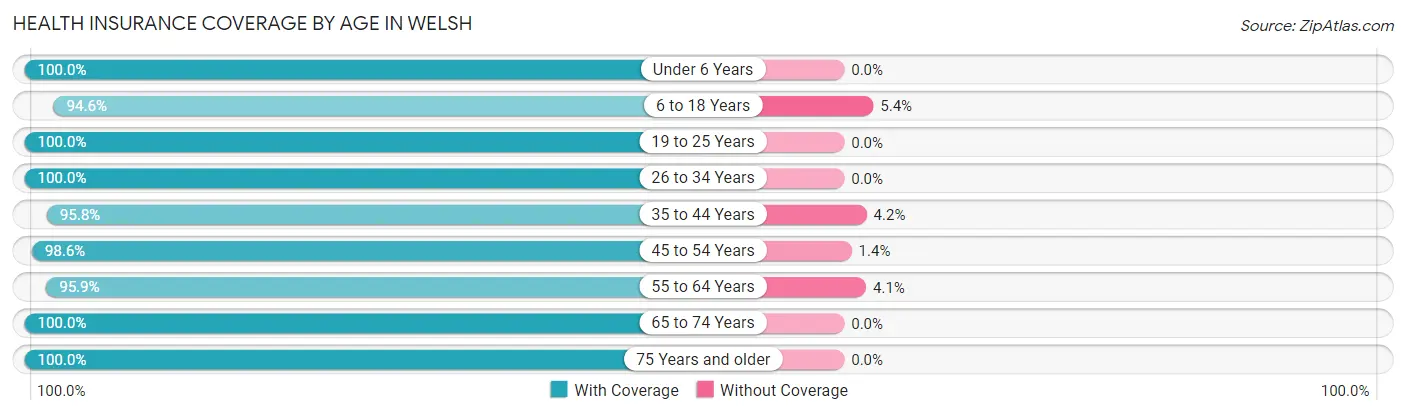
| Age Bracket | With Coverage | Without Coverage |
| Under 6 Years | 209 (100.0%) | 0 (0.0%) |
| 6 to 18 Years | 716 (94.6%) | 41 (5.4%) |
| 19 to 25 Years | 321 (100.0%) | 0 (0.0%) |
| 26 to 34 Years | 258 (100.0%) | 0 (0.0%) |
| 35 to 44 Years | 391 (95.8%) | 17 (4.2%) |
| 45 to 54 Years | 504 (98.6%) | 7 (1.4%) |
| 55 to 64 Years | 425 (95.9%) | 18 (4.1%) |
| 65 to 74 Years | 177 (100.0%) | 0 (0.0%) |
| 75 Years and older | 168 (100.0%) | 0 (0.0%) |
| Total | 3,169 (97.5%) | 83 (2.5%) |
Health Insurance Coverage by Citizenship Status in Welsh
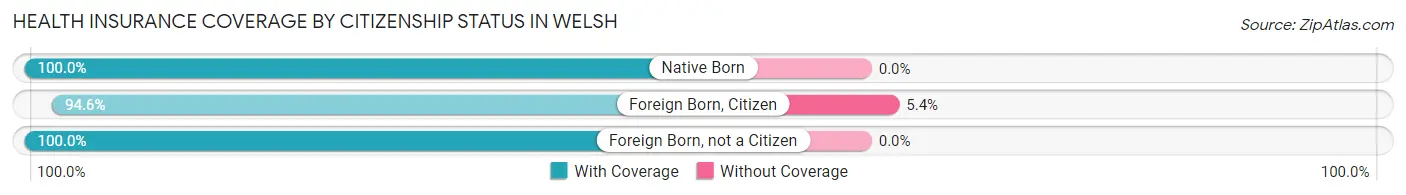
| Citizenship Status | With Coverage | Without Coverage |
| Native Born | 209 (100.0%) | 0 (0.0%) |
| Foreign Born, Citizen | 716 (94.6%) | 41 (5.4%) |
| Foreign Born, not a Citizen | 321 (100.0%) | 0 (0.0%) |
Health Insurance Coverage by Household Income in Welsh
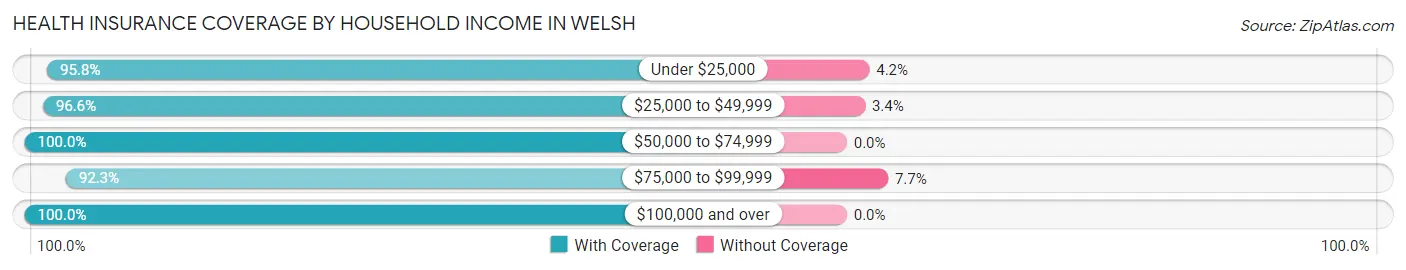
| Household Income | With Coverage | Without Coverage |
| Under $25,000 | 410 (95.8%) | 18 (4.2%) |
| $25,000 to $49,999 | 679 (96.6%) | 24 (3.4%) |
| $50,000 to $74,999 | 166 (100.0%) | 0 (0.0%) |
| $75,000 to $99,999 | 490 (92.3%) | 41 (7.7%) |
| $100,000 and over | 1,424 (100.0%) | 0 (0.0%) |
Public vs Private Health Insurance Coverage by Age in Welsh
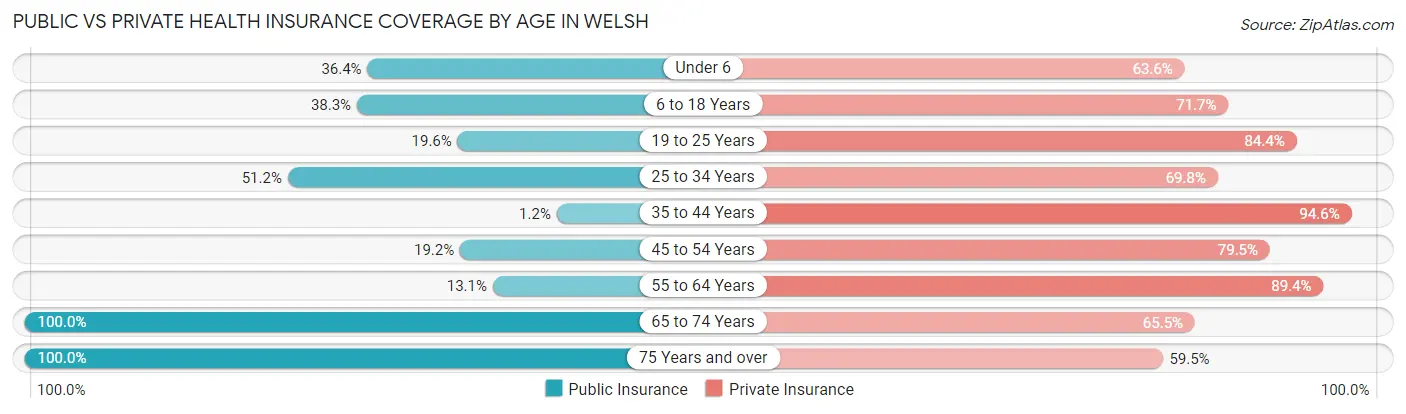
| Age Bracket | Public Insurance | Private Insurance |
| Under 6 | 76 (36.4%) | 133 (63.6%) |
| 6 to 18 Years | 290 (38.3%) | 543 (71.7%) |
| 19 to 25 Years | 63 (19.6%) | 271 (84.4%) |
| 25 to 34 Years | 132 (51.2%) | 180 (69.8%) |
| 35 to 44 Years | 5 (1.2%) | 386 (94.6%) |
| 45 to 54 Years | 98 (19.2%) | 406 (79.4%) |
| 55 to 64 Years | 58 (13.1%) | 396 (89.4%) |
| 65 to 74 Years | 177 (100.0%) | 116 (65.5%) |
| 75 Years and over | 168 (100.0%) | 100 (59.5%) |
| Total | 1,067 (32.8%) | 2,531 (77.8%) |
Disability Status by Sex by Age in Welsh
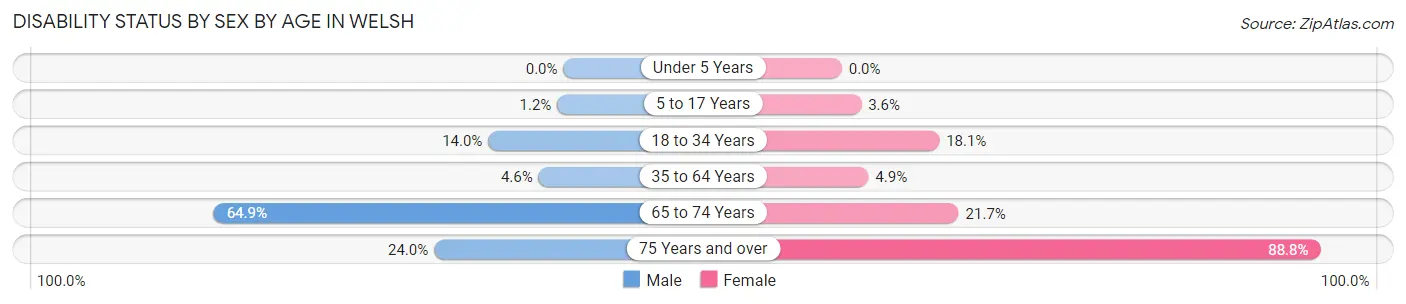
| Age Bracket | Male | Female |
| Under 5 Years | 0 (0.0%) | 0 (0.0%) |
| 5 to 17 Years | 5 (1.1%) | 12 (3.6%) |
| 18 to 34 Years | 36 (14.0%) | 62 (18.1%) |
| 35 to 64 Years | 31 (4.6%) | 34 (4.9%) |
| 65 to 74 Years | 61 (64.9%) | 18 (21.7%) |
| 75 Years and over | 6 (24.0%) | 127 (88.8%) |
Disability Class by Sex by Age in Welsh
Disability Class: Hearing Difficulty
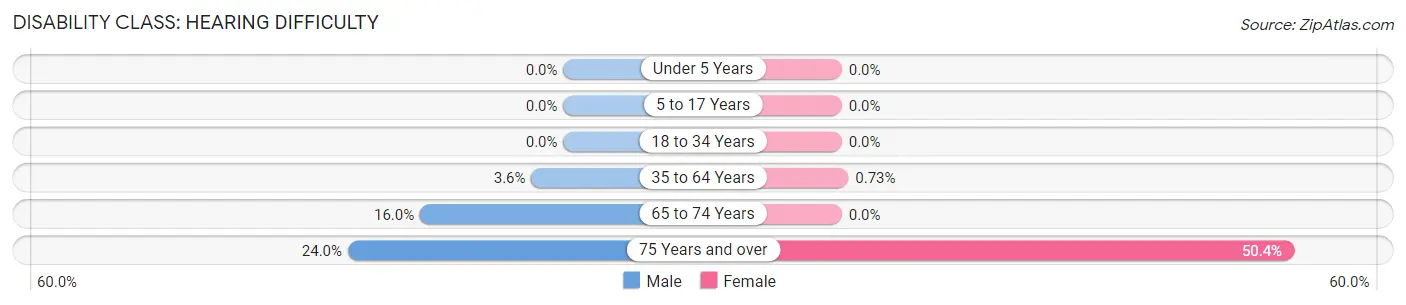
| Age Bracket | Male | Female |
| Under 5 Years | 0 (0.0%) | 0 (0.0%) |
| 5 to 17 Years | 0 (0.0%) | 0 (0.0%) |
| 18 to 34 Years | 0 (0.0%) | 0 (0.0%) |
| 35 to 64 Years | 24 (3.6%) | 5 (0.7%) |
| 65 to 74 Years | 15 (16.0%) | 0 (0.0%) |
| 75 Years and over | 6 (24.0%) | 72 (50.3%) |
Disability Class: Vision Difficulty
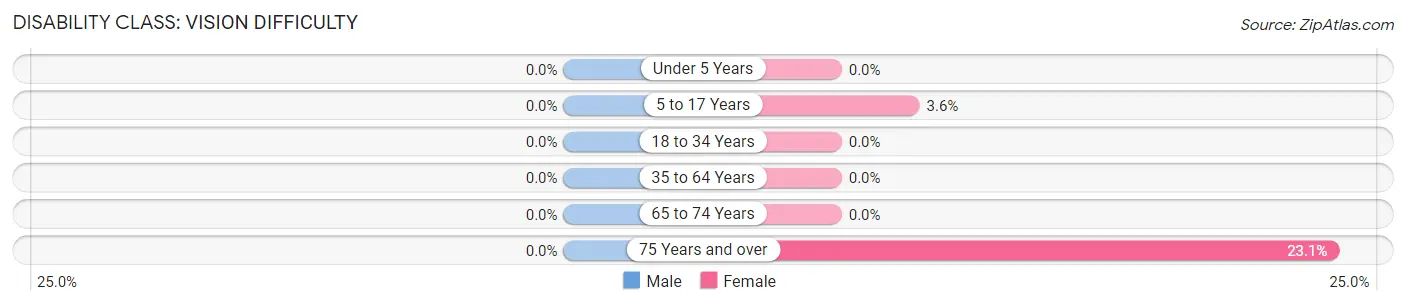
| Age Bracket | Male | Female |
| Under 5 Years | 0 (0.0%) | 0 (0.0%) |
| 5 to 17 Years | 0 (0.0%) | 12 (3.6%) |
| 18 to 34 Years | 0 (0.0%) | 0 (0.0%) |
| 35 to 64 Years | 0 (0.0%) | 0 (0.0%) |
| 65 to 74 Years | 0 (0.0%) | 0 (0.0%) |
| 75 Years and over | 0 (0.0%) | 33 (23.1%) |
Disability Class: Cognitive Difficulty
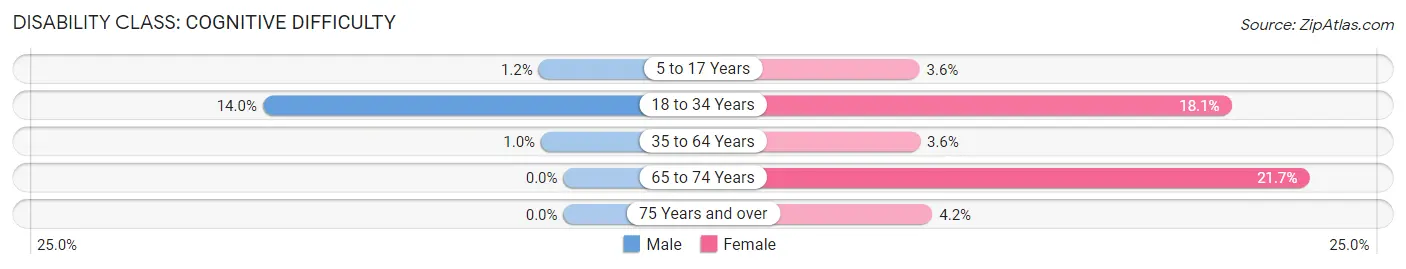
| Age Bracket | Male | Female |
| 5 to 17 Years | 5 (1.1%) | 12 (3.6%) |
| 18 to 34 Years | 36 (14.0%) | 62 (18.1%) |
| 35 to 64 Years | 7 (1.0%) | 25 (3.6%) |
| 65 to 74 Years | 0 (0.0%) | 18 (21.7%) |
| 75 Years and over | 0 (0.0%) | 6 (4.2%) |
Disability Class: Ambulatory Difficulty
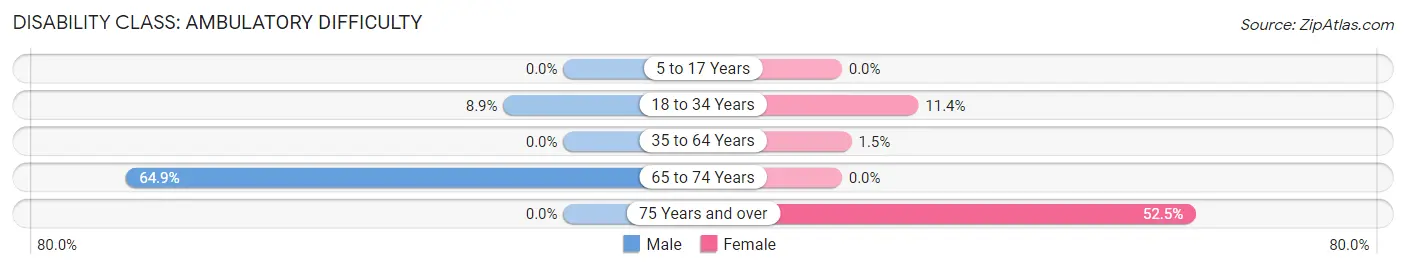
| Age Bracket | Male | Female |
| 5 to 17 Years | 0 (0.0%) | 0 (0.0%) |
| 18 to 34 Years | 23 (8.9%) | 39 (11.4%) |
| 35 to 64 Years | 0 (0.0%) | 10 (1.5%) |
| 65 to 74 Years | 61 (64.9%) | 0 (0.0%) |
| 75 Years and over | 0 (0.0%) | 75 (52.4%) |
Disability Class: Self-Care Difficulty
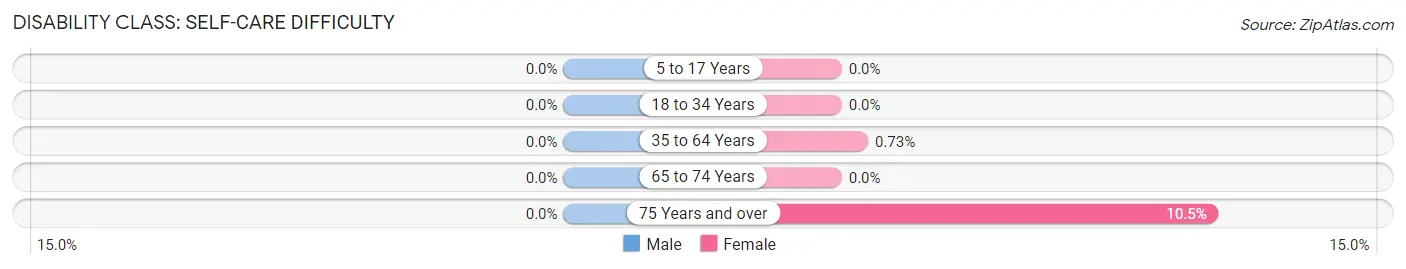
| Age Bracket | Male | Female |
| 5 to 17 Years | 0 (0.0%) | 0 (0.0%) |
| 18 to 34 Years | 0 (0.0%) | 0 (0.0%) |
| 35 to 64 Years | 0 (0.0%) | 5 (0.7%) |
| 65 to 74 Years | 0 (0.0%) | 0 (0.0%) |
| 75 Years and over | 0 (0.0%) | 15 (10.5%) |
Technology Access in Welsh
Computing Device Access in Welsh
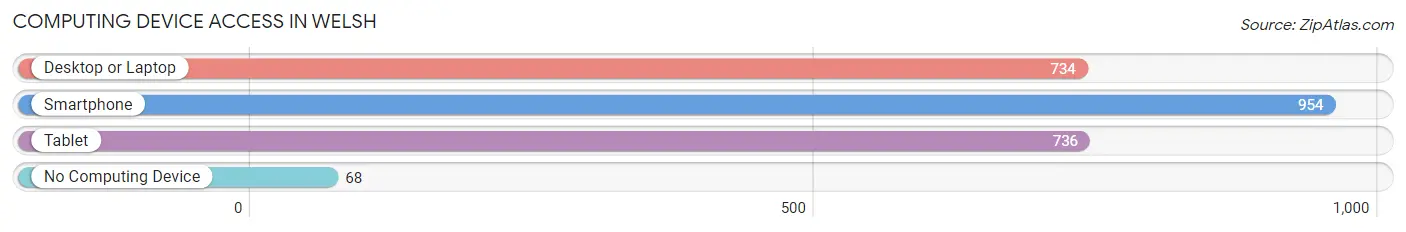
| Device Type | # Households | % Households |
| Desktop or Laptop | 734 | 68.5% |
| Smartphone | 954 | 89.1% |
| Tablet | 736 | 68.7% |
| No Computing Device | 68 | 6.4% |
| Total | 1,071 | 100.0% |
Internet Access in Welsh
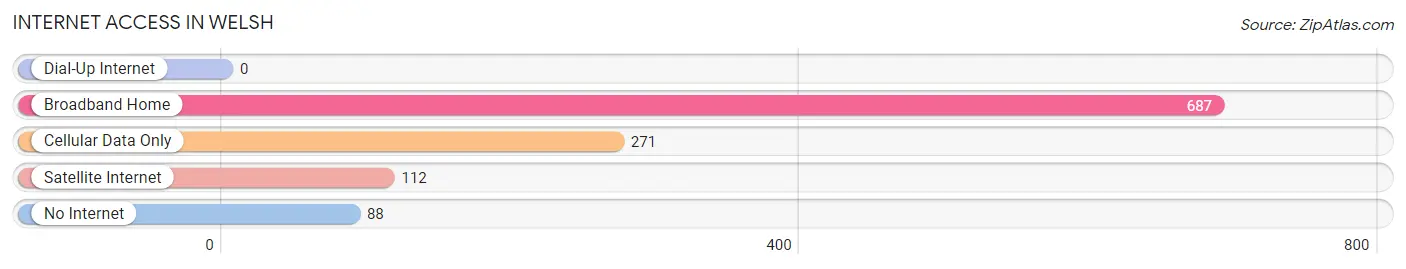
| Internet Type | # Households | % Households |
| Dial-Up Internet | 0 | 0.0% |
| Broadband Home | 687 | 64.1% |
| Cellular Data Only | 271 | 25.3% |
| Satellite Internet | 112 | 10.5% |
| No Internet | 88 | 8.2% |
| Total | 1,071 | 100.0% |
Welsh Summary
Wales is a country located in the United Kingdom, and is bordered by England to the east, the Irish Sea to the north and west, and the Bristol Channel to the south. It has a population of approximately 3 million people, and is divided into 22 local government areas. Wales is a country with a rich history, diverse geography, and a vibrant economy.
History
The history of Wales dates back to the Iron Age, when the Celtic Britons inhabited the region. The Romans invaded in the first century AD, and the region was later conquered by the Anglo-Saxons in the 5th century. Wales was then divided into several kingdoms, and in the 11th century, the Normans invaded and established a unified kingdom. In the 13th century, Wales was annexed by England, and the Welsh language and culture were suppressed. In the 15th century, the Welsh people rose up in revolt against the English, but were ultimately unsuccessful.
In the 16th century, Wales was incorporated into the Kingdom of England, and the Welsh language and culture were further suppressed. In the 19th century, the Industrial Revolution brought economic prosperity to Wales, and the Welsh language and culture began to revive. In the 20th century, Wales gained autonomy from England, and in 1999, the Welsh Assembly was established.
Geography
Wales is a country of diverse geography, with mountains, valleys, and coastline. The highest mountain in Wales is Snowdon, which stands at 1,085 metres (3,560 feet). The country is also home to several national parks, including Snowdonia National Park, Pembrokeshire Coast National Park, and Brecon Beacons National Park. Wales also has a long coastline, with over 1,200 kilometres (745 miles) of coastline.
Economy
The economy of Wales is largely based on services, with the largest sector being the public sector. Other important sectors include manufacturing, tourism, and agriculture. Wales is also home to several major companies, including Airbus, BT, and Ford.
The Welsh economy has seen steady growth in recent years, with GDP growth of 2.2% in 2018. The unemployment rate in Wales is also lower than the UK average, at 4.2% in 2018.
Demographics
The population of Wales is approximately 3 million people, with the majority of the population living in the south of the country. The largest city in Wales is Cardiff, with a population of approximately 350,000 people. The Welsh language is spoken by approximately 20% of the population, and is an official language of the country. The majority of the population is Christian, with the Church in Wales being the largest denomination.
Common Questions
What is Per Capita Income in Welsh?
Per Capita income in Welsh is $28,345.
What is the Median Family Income in Welsh?
Median Family Income in Welsh is $111,000.
What is the Median Household income in Welsh?
Median Household Income in Welsh is $94,196.
What is Income or Wage Gap in Welsh?
Income or Wage Gap in Welsh is 40.2%.
Women in Welsh earn 59.8 cents for every dollar earned by a man.
What is Inequality or Gini Index in Welsh?
Inequality or Gini Index in Welsh is 0.39.
What is the Total Population of Welsh?
Total Population of Welsh is 3,336.
What is the Total Male Population of Welsh?
Total Male Population of Welsh is 1,625.
What is the Total Female Population of Welsh?
Total Female Population of Welsh is 1,711.
What is the Ratio of Males per 100 Females in Welsh?
There are 94.97 Males per 100 Females in Welsh.
What is the Ratio of Females per 100 Males in Welsh?
There are 105.29 Females per 100 Males in Welsh.
What is the Median Population Age in Welsh?
Median Population Age in Welsh is 36.5 Years.
What is the Average Family Size in Welsh
Average Family Size in Welsh is 3.5 People.
What is the Average Household Size in Welsh
Average Household Size in Welsh is 3.0 People.
How Large is the Labor Force in Welsh?
There are 1,341 People in the Labor Forcein in Welsh.
What is the Percentage of People in the Labor Force in Welsh?
54.0% of People are in the Labor Force in Welsh.