Vinton, LA Map & Demographics
Vinton Map
Vinton Overview
$16,725
PER CAPITA INCOME
$45,156
AVG FAMILY INCOME
$40,859
AVG HOUSEHOLD INCOME
44.5%
WAGE / INCOME GAP [ % ]
55.5¢/ $1
WAGE / INCOME GAP [ $ ]
$10,526
FAMILY INCOME DEFICIT
0.42
INEQUALITY / GINI INDEX
3,314
TOTAL POPULATION
1,709
MALE POPULATION
1,605
FEMALE POPULATION
106.48
MALES / 100 FEMALES
93.91
FEMALES / 100 MALES
33.6
MEDIAN AGE
4.4
AVG FAMILY SIZE
3.3
AVG HOUSEHOLD SIZE
1,220
LABOR FORCE [ PEOPLE ]
52.8%
PERCENT IN LABOR FORCE
1.4%
UNEMPLOYMENT RATE
Vinton Zip Codes
Vinton Area Codes
Income in Vinton
Income Overview in Vinton
Per Capita Income in Vinton is $16,725, while median incomes of families and households are $45,156 and $40,859 respectively.
| Characteristic | Number | Measure |
| Per Capita Income | 3,314 | $16,725 |
| Median Family Income | 600 | $45,156 |
| Mean Family Income | 600 | $57,249 |
| Median Household Income | 998 | $40,859 |
| Mean Household Income | 998 | $51,876 |
| Income Deficit | 600 | $10,526 |
| Wage / Income Gap (%) | 3,314 | 44.48% |
| Wage / Income Gap ($) | 3,314 | 55.52¢ per $1 |
| Gini / Inequality Index | 3,314 | 0.42 |
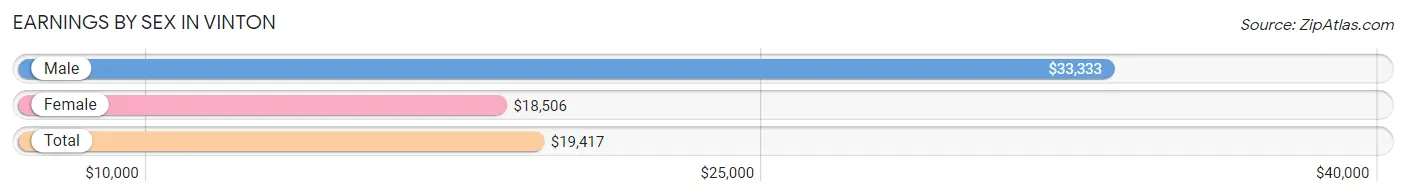
Earnings by Sex in Vinton
Average Earnings in Vinton are $19,417, $33,333 for men and $18,506 for women, a difference of 44.5%.
| Sex | Number | Average Earnings |
| Male | 800 (55.2%) | $33,333 |
| Female | 649 (44.8%) | $18,506 |
| Total | 1,449 (100.0%) | $19,417 |
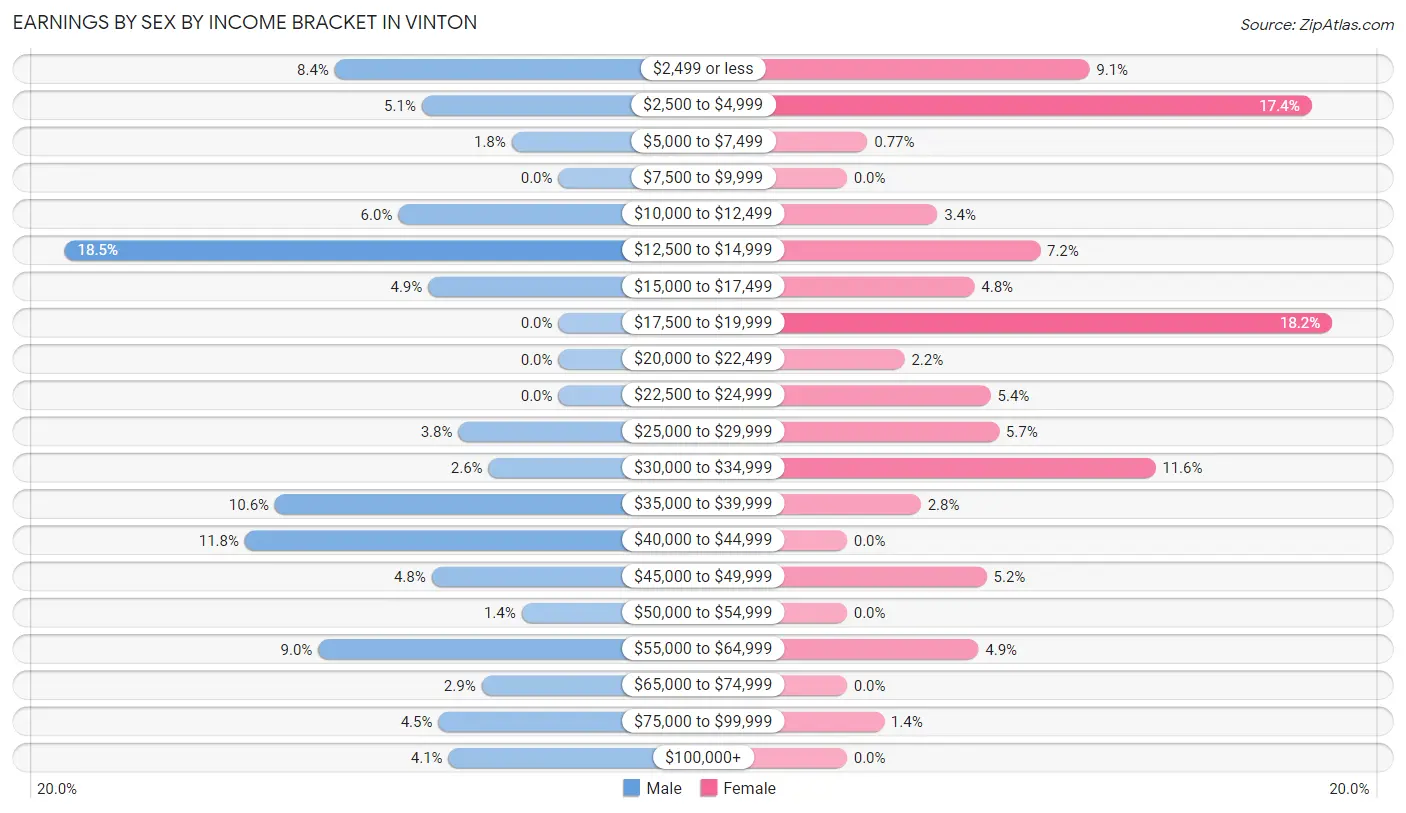
Earnings by Sex by Income Bracket in Vinton
The most common earnings brackets in Vinton are $12,500 to $14,999 for men (148 | 18.5%) and $17,500 to $19,999 for women (118 | 18.2%).
| Income | Male | Female |
| $2,499 or less | 67 (8.4%) | 59 (9.1%) |
| $2,500 to $4,999 | 41 (5.1%) | 113 (17.4%) |
| $5,000 to $7,499 | 14 (1.8%) | 5 (0.8%) |
| $7,500 to $9,999 | 0 (0.0%) | 0 (0.0%) |
| $10,000 to $12,499 | 48 (6.0%) | 22 (3.4%) |
| $12,500 to $14,999 | 148 (18.5%) | 47 (7.2%) |
| $15,000 to $17,499 | 39 (4.9%) | 31 (4.8%) |
| $17,500 to $19,999 | 0 (0.0%) | 118 (18.2%) |
| $20,000 to $22,499 | 0 (0.0%) | 14 (2.2%) |
| $22,500 to $24,999 | 0 (0.0%) | 35 (5.4%) |
| $25,000 to $29,999 | 30 (3.7%) | 37 (5.7%) |
| $30,000 to $34,999 | 21 (2.6%) | 75 (11.6%) |
| $35,000 to $39,999 | 85 (10.6%) | 18 (2.8%) |
| $40,000 to $44,999 | 94 (11.7%) | 0 (0.0%) |
| $45,000 to $49,999 | 38 (4.8%) | 34 (5.2%) |
| $50,000 to $54,999 | 11 (1.4%) | 0 (0.0%) |
| $55,000 to $64,999 | 72 (9.0%) | 32 (4.9%) |
| $65,000 to $74,999 | 23 (2.9%) | 0 (0.0%) |
| $75,000 to $99,999 | 36 (4.5%) | 9 (1.4%) |
| $100,000+ | 33 (4.1%) | 0 (0.0%) |
| Total | 800 (100.0%) | 649 (100.0%) |
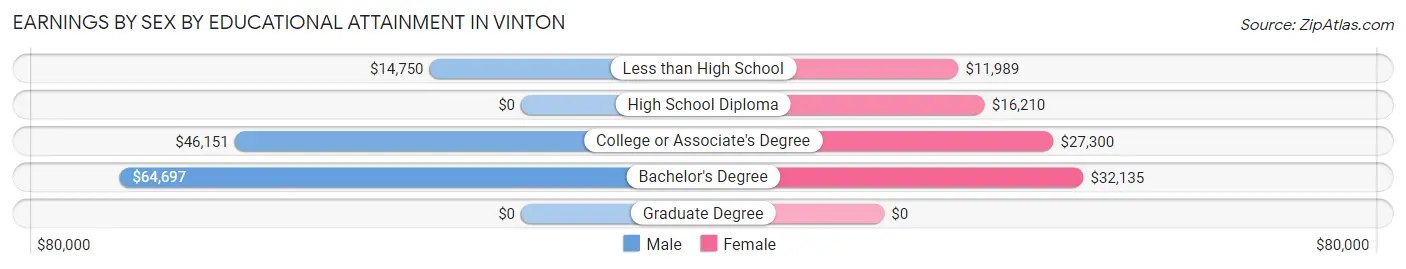
Earnings by Sex by Educational Attainment in Vinton
Average earnings in Vinton are $36,411 for men and $19,417 for women, a difference of 46.7%. Men with an educational attainment of bachelor's degree enjoy the highest average annual earnings of $64,697, while those with less than high school education earn the least with $14,750. Women with an educational attainment of bachelor's degree earn the most with the average annual earnings of $32,135, while those with less than high school education have the smallest earnings of $11,989.
| Educational Attainment | Male Income | Female Income |
| Less than High School | $14,750 | $11,989 |
| High School Diploma | - | - |
| College or Associate's Degree | $46,151 | $27,300 |
| Bachelor's Degree | $64,697 | $32,135 |
| Graduate Degree | - | - |
| Total | $36,411 | $19,417 |
Family Income in Vinton
Family Income Brackets in Vinton
According to the Vinton family income data, there are 126 families falling into the $35,000 to $49,999 income range, which is the most common income bracket and makes up 21.0% of all families.
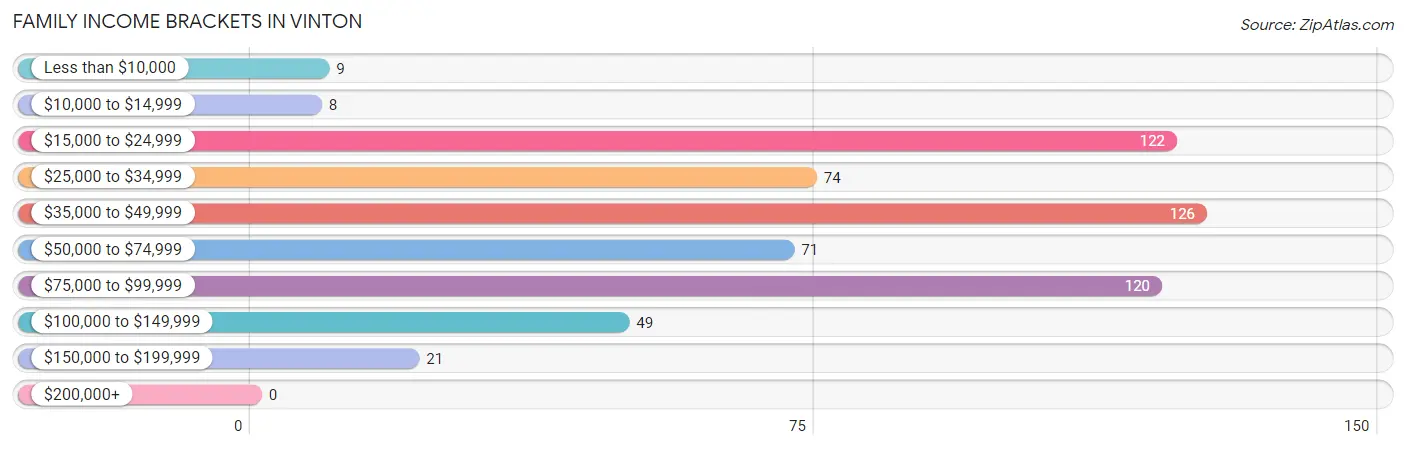
| Income Bracket | # Families | % Families |
| Less than $10,000 | 9 | 1.5% |
| $10,000 to $14,999 | 8 | 1.3% |
| $15,000 to $24,999 | 122 | 20.3% |
| $25,000 to $34,999 | 74 | 12.3% |
| $35,000 to $49,999 | 126 | 21.0% |
| $50,000 to $74,999 | 71 | 11.8% |
| $75,000 to $99,999 | 120 | 20.0% |
| $100,000 to $149,999 | 49 | 8.2% |
| $150,000 to $199,999 | 21 | 3.5% |
| $200,000+ | 0 | 0.0% |
Family Income by Famaliy Size in Vinton
2-person families (285 | 47.5%) account for the highest median family income in Vinton with $49,323 per family, while 2-person families (285 | 47.5%) have the highest median income of $24,662 per family member.
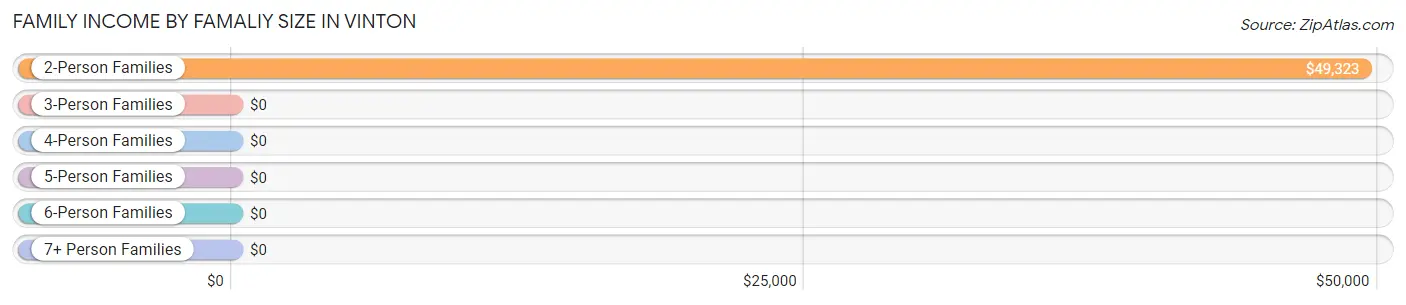
| Income Bracket | # Families | Median Income |
| 2-Person Families | 285 (47.5%) | $49,323 |
| 3-Person Families | 76 (12.7%) | $0 |
| 4-Person Families | 7 (1.2%) | $0 |
| 5-Person Families | 128 (21.3%) | $0 |
| 6-Person Families | 48 (8.0%) | $0 |
| 7+ Person Families | 56 (9.3%) | $0 |
| Total | 600 (100.0%) | $45,156 |
Family Income by Number of Earners in Vinton
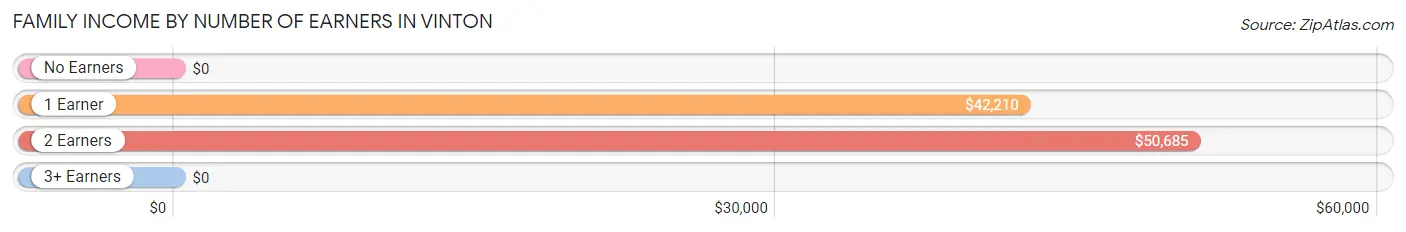
| Number of Earners | # Families | Median Income |
| No Earners | 67 (11.2%) | $0 |
| 1 Earner | 235 (39.2%) | $42,210 |
| 2 Earners | 231 (38.5%) | $50,685 |
| 3+ Earners | 67 (11.2%) | $0 |
| Total | 600 (100.0%) | $45,156 |
Household Income in Vinton
Household Income Brackets in Vinton
With 199 households falling in the category, the $15,000 to $24,999 income range is the most frequent in Vinton, accounting for 19.9% of all households.
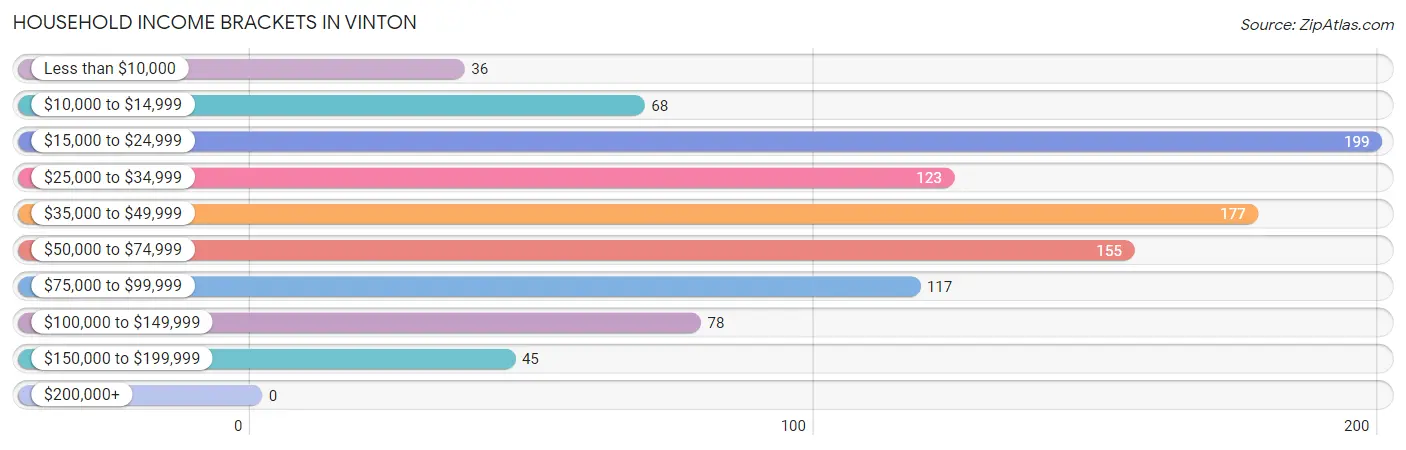
| Income Bracket | # Households | % Households |
| Less than $10,000 | 36 | 3.6% |
| $10,000 to $14,999 | 68 | 6.8% |
| $15,000 to $24,999 | 199 | 19.9% |
| $25,000 to $34,999 | 123 | 12.3% |
| $35,000 to $49,999 | 177 | 17.7% |
| $50,000 to $74,999 | 155 | 15.5% |
| $75,000 to $99,999 | 117 | 11.7% |
| $100,000 to $149,999 | 78 | 7.8% |
| $150,000 to $199,999 | 45 | 4.5% |
| $200,000+ | 0 | 0.0% |
Household Income by Householder Age in Vinton
The median household income in Vinton is $40,859, with the highest median household income of $41,585 found in the 25 to 44 years age bracket for the primary householder. A total of 397 households (39.8%) fall into this category.
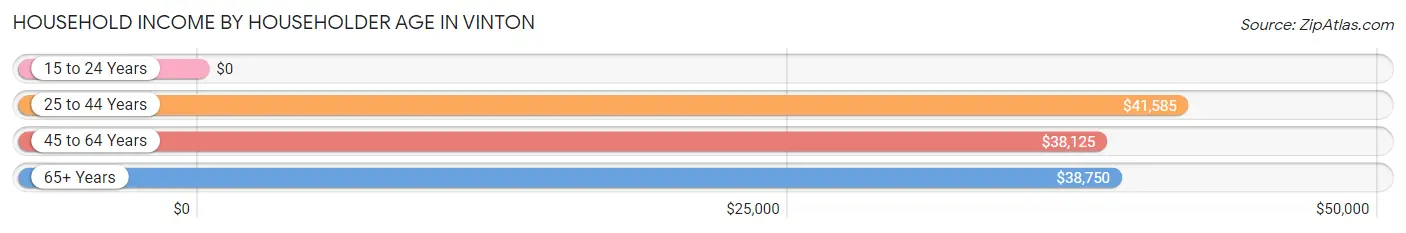
| Income Bracket | # Households | Median Income |
| 15 to 24 Years | 0 (0.0%) | $0 |
| 25 to 44 Years | 397 (39.8%) | $41,585 |
| 45 to 64 Years | 339 (34.0%) | $38,125 |
| 65+ Years | 262 (26.3%) | $38,750 |
| Total | 998 (100.0%) | $40,859 |
Poverty in Vinton
Income Below Poverty by Sex and Age in Vinton
With 46.1% poverty level for males and 43.4% for females among the residents of Vinton, 15 year old males and 6 to 11 year old females are the most vulnerable to poverty, with 53 males (100.0%) and 186 females (78.5%) in their respective age groups living below the poverty level.
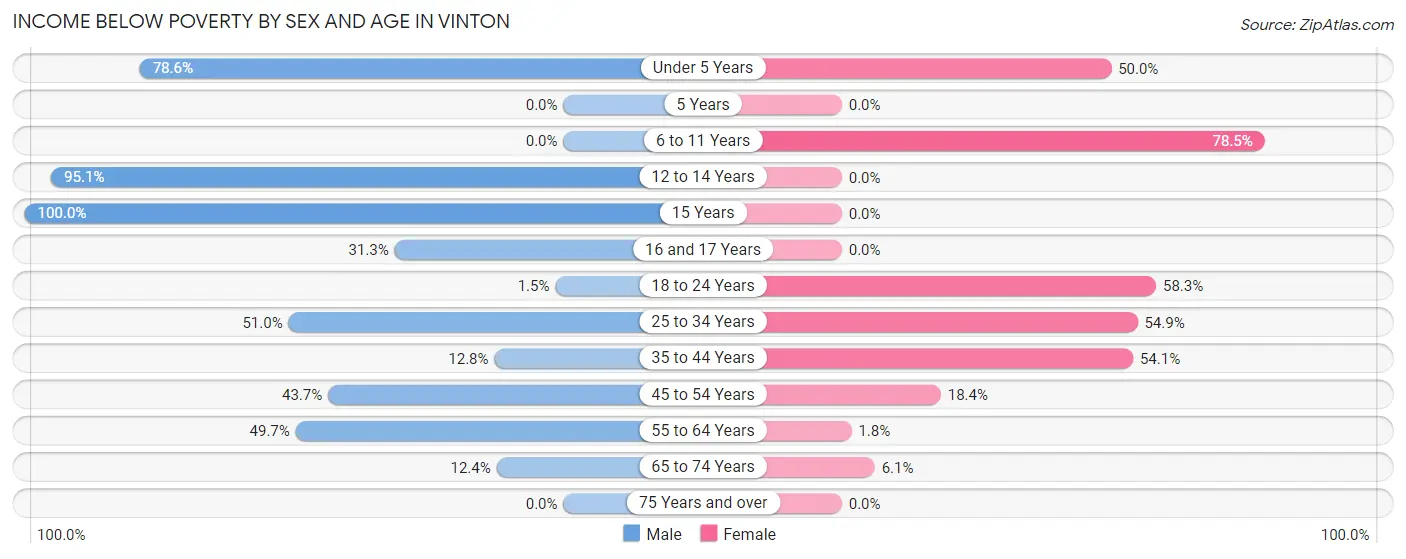
| Age Bracket | Male | Female |
| Under 5 Years | 228 (78.6%) | 59 (50.0%) |
| 5 Years | 0 (0.0%) | 0 (0.0%) |
| 6 to 11 Years | 0 (0.0%) | 186 (78.5%) |
| 12 to 14 Years | 154 (95.1%) | 0 (0.0%) |
| 15 Years | 53 (100.0%) | 0 (0.0%) |
| 16 and 17 Years | 21 (31.3%) | 0 (0.0%) |
| 18 to 24 Years | 1 (1.5%) | 91 (58.3%) |
| 25 to 34 Years | 125 (51.0%) | 163 (54.9%) |
| 35 to 44 Years | 31 (12.8%) | 160 (54.0%) |
| 45 to 54 Years | 76 (43.7%) | 27 (18.4%) |
| 55 to 64 Years | 83 (49.7%) | 2 (1.8%) |
| 65 to 74 Years | 16 (12.4%) | 8 (6.1%) |
| 75 Years and over | 0 (0.0%) | 0 (0.0%) |
| Total | 788 (46.1%) | 696 (43.4%) |
Income Above Poverty by Sex and Age in Vinton
According to the poverty statistics in Vinton, males aged 6 to 11 years and females aged 12 to 14 years are the age groups that are most secure financially, with 100.0% of males and 100.0% of females in these age groups living above the poverty line.
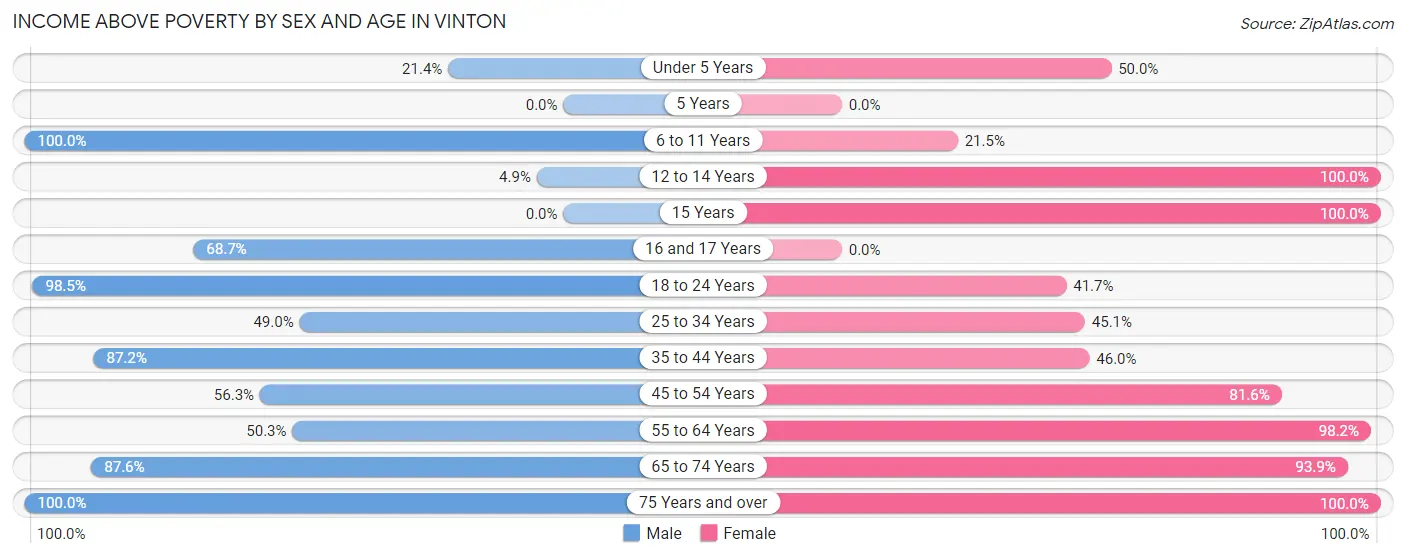
| Age Bracket | Male | Female |
| Under 5 Years | 62 (21.4%) | 59 (50.0%) |
| 5 Years | 0 (0.0%) | 0 (0.0%) |
| 6 to 11 Years | 86 (100.0%) | 51 (21.5%) |
| 12 to 14 Years | 8 (4.9%) | 21 (100.0%) |
| 15 Years | 0 (0.0%) | 36 (100.0%) |
| 16 and 17 Years | 46 (68.7%) | 0 (0.0%) |
| 18 to 24 Years | 66 (98.5%) | 65 (41.7%) |
| 25 to 34 Years | 120 (49.0%) | 134 (45.1%) |
| 35 to 44 Years | 211 (87.2%) | 136 (46.0%) |
| 45 to 54 Years | 98 (56.3%) | 120 (81.6%) |
| 55 to 64 Years | 84 (50.3%) | 109 (98.2%) |
| 65 to 74 Years | 113 (87.6%) | 123 (93.9%) |
| 75 Years and over | 27 (100.0%) | 55 (100.0%) |
| Total | 921 (53.9%) | 909 (56.6%) |
Income Below Poverty Among Married-Couple Families in Vinton
The poverty statistics for married-couple families in Vinton show that 33.7% or 128 of the total 380 families live below the poverty line. Families with 3 or 4 children have the highest poverty rate of 70.0%, comprising of 56 families. On the other hand, families with no children have the lowest poverty rate of 0.8%, which includes 1 families.
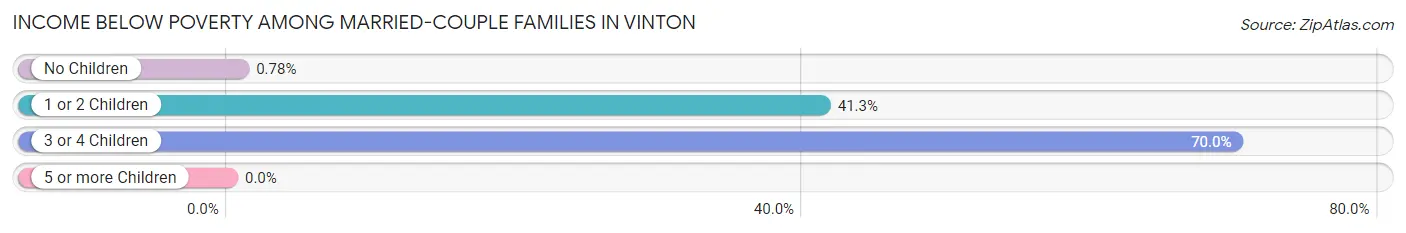
| Children | Above Poverty | Below Poverty |
| No Children | 127 (99.2%) | 1 (0.8%) |
| 1 or 2 Children | 101 (58.7%) | 71 (41.3%) |
| 3 or 4 Children | 24 (30.0%) | 56 (70.0%) |
| 5 or more Children | 0 (0.0%) | 0 (0.0%) |
| Total | 252 (66.3%) | 128 (33.7%) |
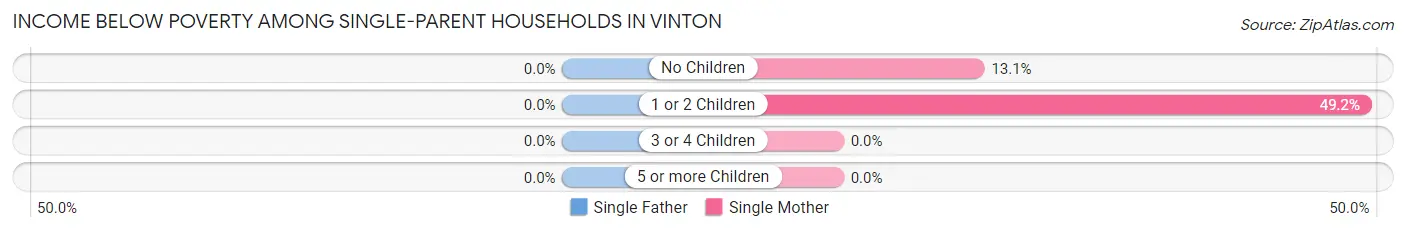
Income Below Poverty Among Single-Parent Households in Vinton
| Children | Single Father | Single Mother |
| No Children | 0 (0.0%) | 8 (13.1%) |
| 1 or 2 Children | 0 (0.0%) | 60 (49.2%) |
| 3 or 4 Children | 0 (0.0%) | 0 (0.0%) |
| 5 or more Children | 0 (0.0%) | 0 (0.0%) |
| Total | 0 (0.0%) | 68 (35.2%) |
Income Below Poverty Among Married-Couple vs Single-Parent Households in Vinton
The poverty data for Vinton shows that 128 of the married-couple family households (33.7%) and 68 of the single-parent households (30.9%) are living below the poverty level. Within the married-couple family households, those with 3 or 4 children have the highest poverty rate, with 56 households (70.0%) falling below the poverty line. Among the single-parent households, those with 1 or 2 children have the highest poverty rate, with 60 household (49.2%) living below poverty.
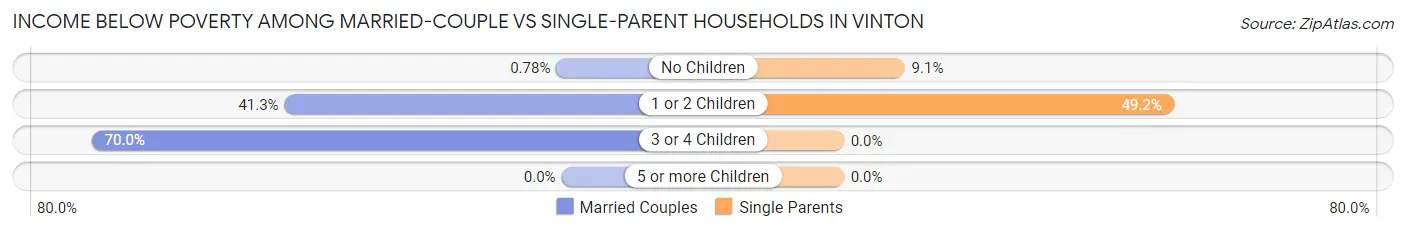
| Children | Married-Couple Families | Single-Parent Households |
| No Children | 1 (0.8%) | 8 (9.1%) |
| 1 or 2 Children | 71 (41.3%) | 60 (49.2%) |
| 3 or 4 Children | 56 (70.0%) | 0 (0.0%) |
| 5 or more Children | 0 (0.0%) | 0 (0.0%) |
| Total | 128 (33.7%) | 68 (30.9%) |
Race in Vinton
The most populous races in Vinton are White / Caucasian (2,838 | 85.6%), Hispanic or Latino (537 | 16.2%), and Black / African American (327 | 9.9%).
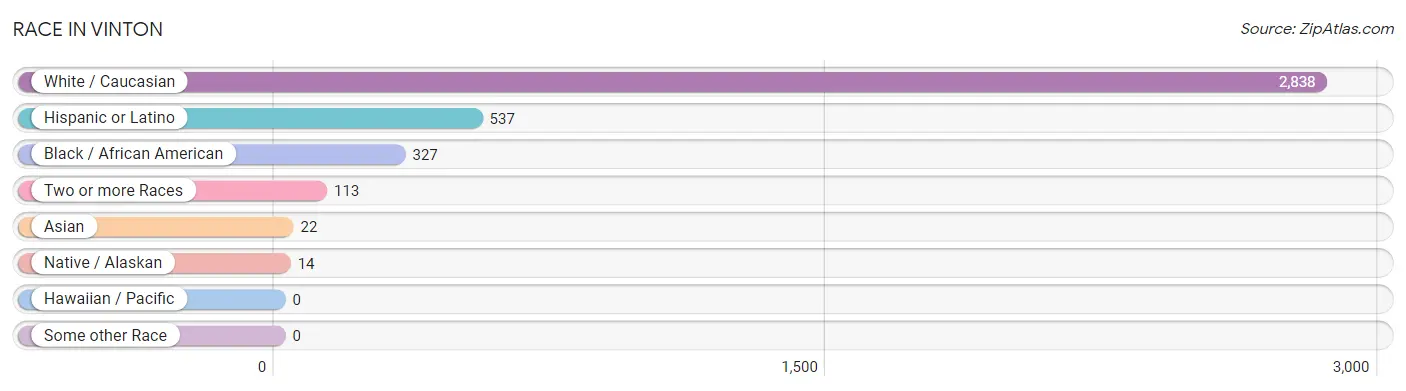
| Race | # Population | % Population |
| Asian | 22 | 0.7% |
| Black / African American | 327 | 9.9% |
| Hawaiian / Pacific | 0 | 0.0% |
| Hispanic or Latino | 537 | 16.2% |
| Native / Alaskan | 14 | 0.4% |
| White / Caucasian | 2,838 | 85.6% |
| Two or more Races | 113 | 3.4% |
| Some other Race | 0 | 0.0% |
| Total | 3,314 | 100.0% |
Ancestry in Vinton
The most populous ancestries reported in Vinton are Mexican (412 | 12.4%), American (290 | 8.7%), Irish (191 | 5.8%), French Canadian (186 | 5.6%), and German (133 | 4.0%), together accounting for 36.6% of all Vinton residents.
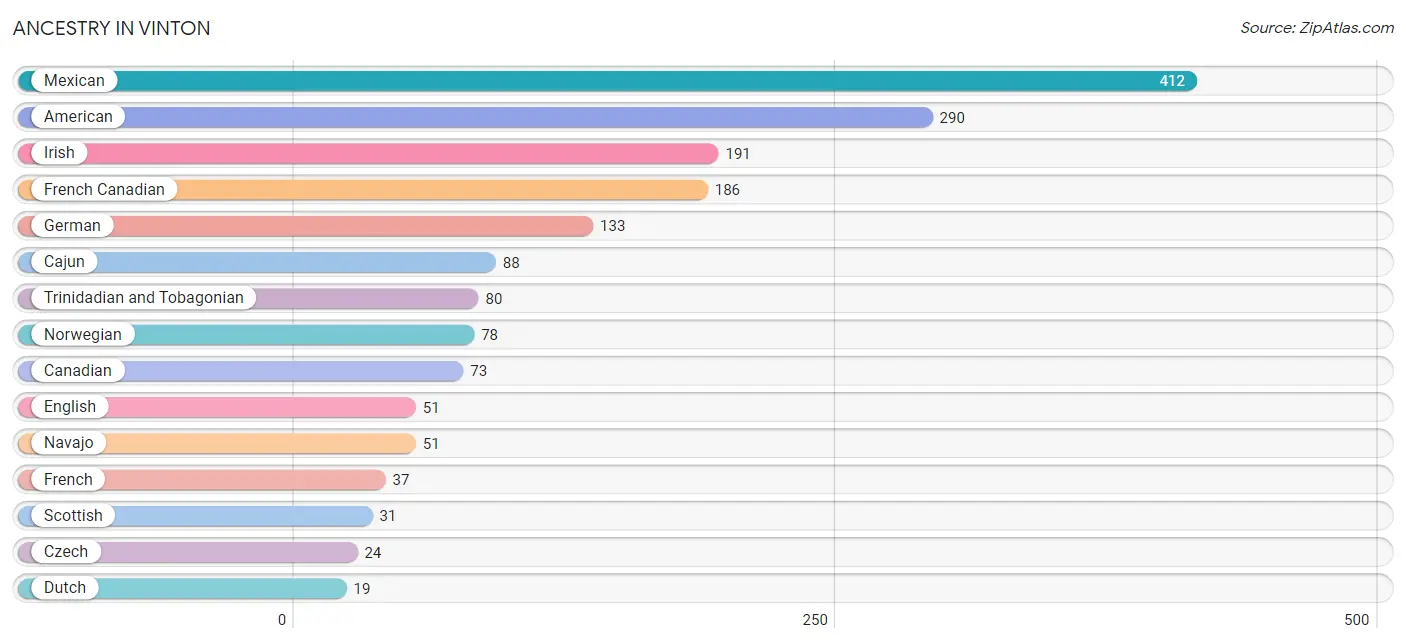
| Ancestry | # Population | % Population |
| American | 290 | 8.7% |
| Bhutanese | 17 | 0.5% |
| Cajun | 88 | 2.7% |
| Canadian | 73 | 2.2% |
| Cherokee | 2 | 0.1% |
| Czech | 24 | 0.7% |
| Dutch | 19 | 0.6% |
| English | 51 | 1.5% |
| French | 37 | 1.1% |
| French Canadian | 186 | 5.6% |
| German | 133 | 4.0% |
| Irish | 191 | 5.8% |
| Italian | 16 | 0.5% |
| Korean | 5 | 0.2% |
| Mexican | 412 | 12.4% |
| Navajo | 51 | 1.5% |
| Norwegian | 78 | 2.4% |
| Scottish | 31 | 0.9% |
| Swedish | 2 | 0.1% |
| Trinidadian and Tobagonian | 80 | 2.4% | View All 20 Rows |
Immigrants in Vinton
The most numerous immigrant groups reported in Vinton came from Asia (22 | 0.7%), Canada (21 | 0.6%), Eastern Asia (17 | 0.5%), Japan (17 | 0.5%), and Philippines (5 | 0.2%), together accounting for 2.5% of all Vinton residents.
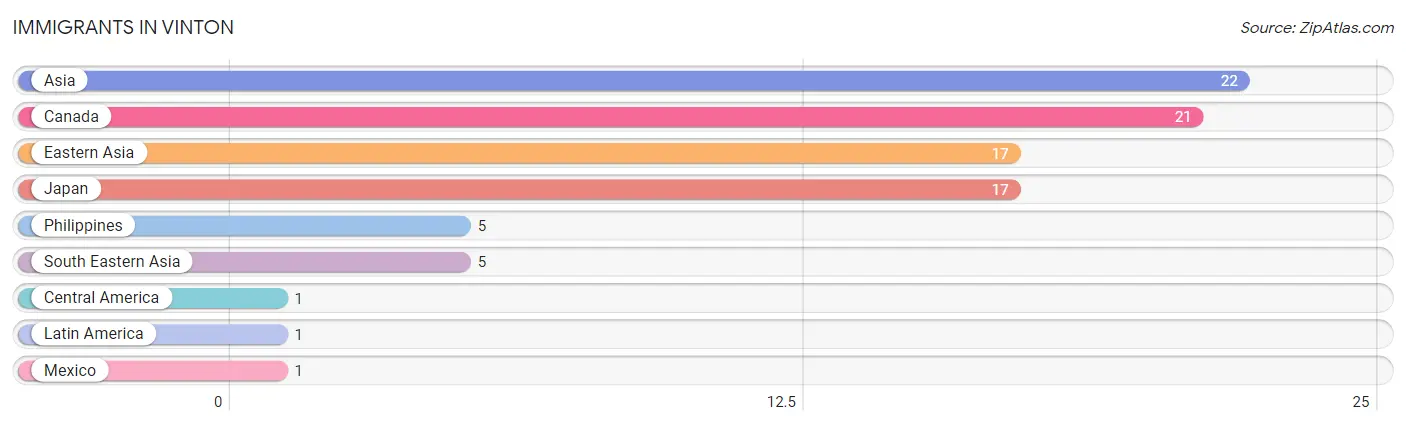
| Immigration Origin | # Population | % Population |
| Asia | 22 | 0.7% |
| Canada | 21 | 0.6% |
| Central America | 1 | 0.0% |
| Eastern Asia | 17 | 0.5% |
| Japan | 17 | 0.5% |
| Latin America | 1 | 0.0% |
| Mexico | 1 | 0.0% |
| Philippines | 5 | 0.2% |
| South Eastern Asia | 5 | 0.2% | View All 9 Rows |
Sex and Age in Vinton
Sex and Age in Vinton
The most populous age groups in Vinton are Under 5 Years (290 | 17.0%) for men and 10 to 14 Years (207 | 12.9%) for women.
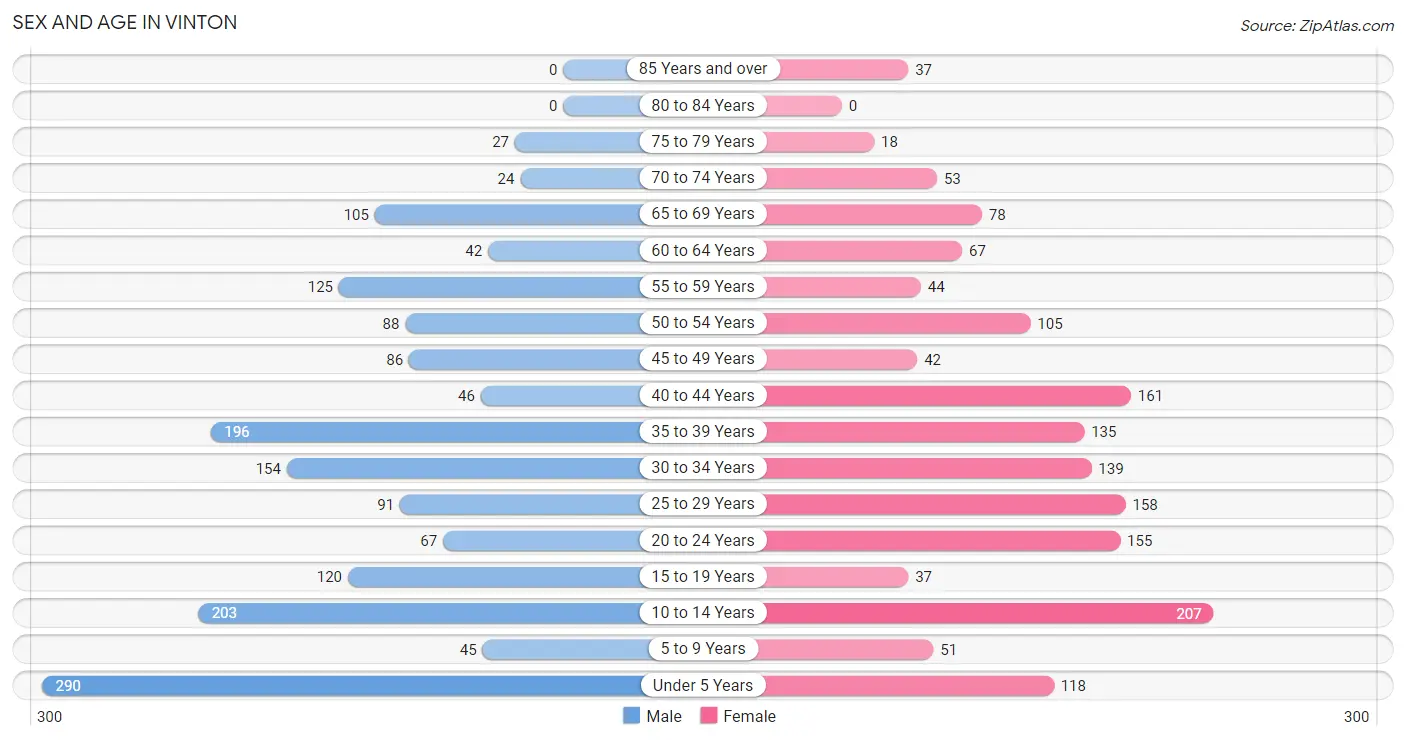
| Age Bracket | Male | Female |
| Under 5 Years | 290 (17.0%) | 118 (7.3%) |
| 5 to 9 Years | 45 (2.6%) | 51 (3.2%) |
| 10 to 14 Years | 203 (11.9%) | 207 (12.9%) |
| 15 to 19 Years | 120 (7.0%) | 37 (2.3%) |
| 20 to 24 Years | 67 (3.9%) | 155 (9.7%) |
| 25 to 29 Years | 91 (5.3%) | 158 (9.8%) |
| 30 to 34 Years | 154 (9.0%) | 139 (8.7%) |
| 35 to 39 Years | 196 (11.5%) | 135 (8.4%) |
| 40 to 44 Years | 46 (2.7%) | 161 (10.0%) |
| 45 to 49 Years | 86 (5.0%) | 42 (2.6%) |
| 50 to 54 Years | 88 (5.1%) | 105 (6.5%) |
| 55 to 59 Years | 125 (7.3%) | 44 (2.7%) |
| 60 to 64 Years | 42 (2.5%) | 67 (4.2%) |
| 65 to 69 Years | 105 (6.1%) | 78 (4.9%) |
| 70 to 74 Years | 24 (1.4%) | 53 (3.3%) |
| 75 to 79 Years | 27 (1.6%) | 18 (1.1%) |
| 80 to 84 Years | 0 (0.0%) | 0 (0.0%) |
| 85 Years and over | 0 (0.0%) | 37 (2.3%) |
| Total | 1,709 (100.0%) | 1,605 (100.0%) |
Families and Households in Vinton
Median Family Size in Vinton
The median family size in Vinton is 4.37 persons per family, with married-couple families (380 | 63.3%) accounting for the largest median family size of 5.3 persons per family. On the other hand, single male/father families (27 | 4.5%) represent the smallest median family size with 2.33 persons per family.
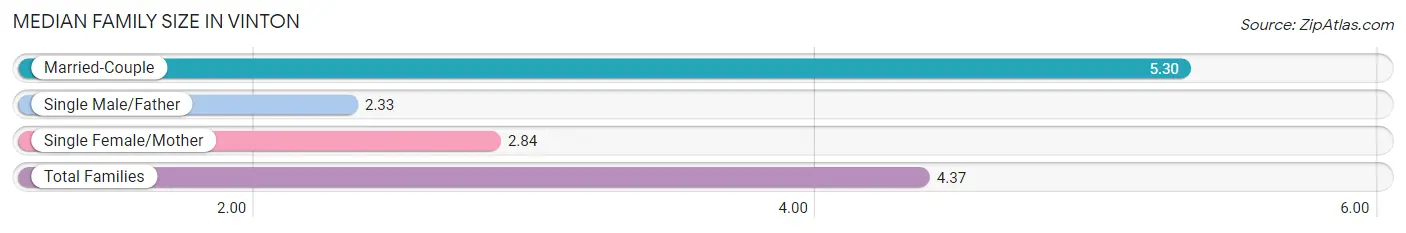
| Family Type | # Families | Family Size |
| Married-Couple | 380 (63.3%) | 5.30 |
| Single Male/Father | 27 (4.5%) | 2.33 |
| Single Female/Mother | 193 (32.2%) | 2.84 |
| Total Families | 600 (100.0%) | 4.37 |
Median Household Size in Vinton
The median household size in Vinton is 3.28 persons per household, with married-couple households (380 | 38.1%) accounting for the largest median household size of 5.42 persons per household. non-family households (398 | 39.9%) represent the smallest median household size with 1.47 persons per household.
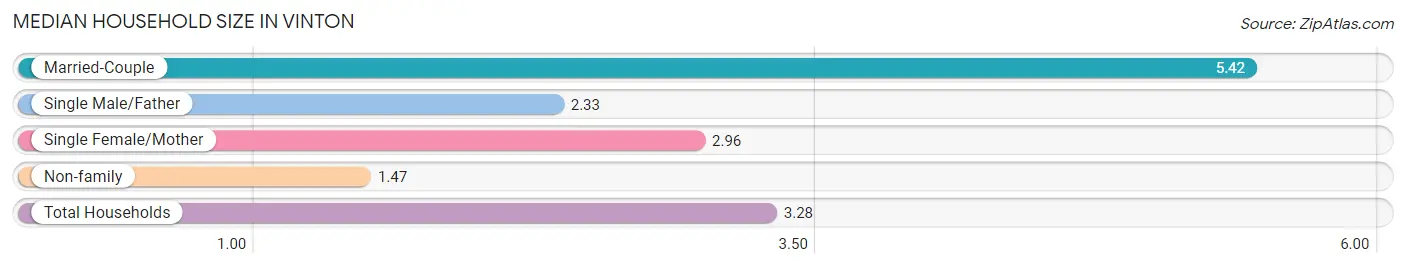
| Household Type | # Households | Household Size |
| Married-Couple | 380 (38.1%) | 5.42 |
| Single Male/Father | 27 (2.7%) | 2.33 |
| Single Female/Mother | 193 (19.3%) | 2.96 |
| Non-family | 398 (39.9%) | 1.47 |
| Total Households | 998 (100.0%) | 3.28 |
Household Size by Marriage Status in Vinton
Out of a total of 998 households in Vinton, 600 (60.1%) are family households, while 398 (39.9%) are nonfamily households. The most numerous type of family households are 2-person households, comprising 276, and the most common type of nonfamily households are 1-person households, comprising 263.
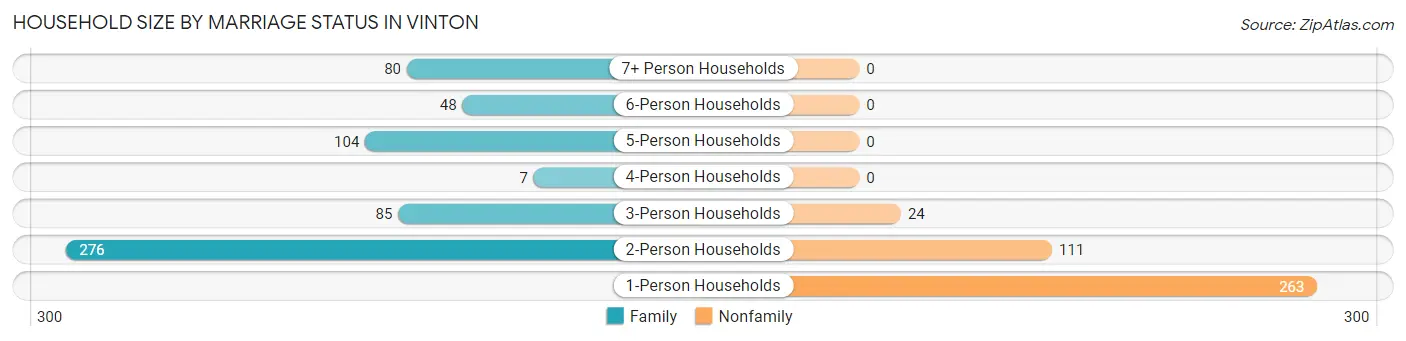
| Household Size | Family Households | Nonfamily Households |
| 1-Person Households | - | 263 (26.4%) |
| 2-Person Households | 276 (27.7%) | 111 (11.1%) |
| 3-Person Households | 85 (8.5%) | 24 (2.4%) |
| 4-Person Households | 7 (0.7%) | 0 (0.0%) |
| 5-Person Households | 104 (10.4%) | 0 (0.0%) |
| 6-Person Households | 48 (4.8%) | 0 (0.0%) |
| 7+ Person Households | 80 (8.0%) | 0 (0.0%) |
| Total | 600 (60.1%) | 398 (39.9%) |
Female Fertility in Vinton
Fertility by Age in Vinton
Average fertility rate in Vinton is 216.0 births per 1,000 women. Women in the age bracket of 20 to 34 years have the highest fertility rate with 405.0 births per 1,000 women. Women in the age bracket of 20 to 34 years acount for 100.0% of all women with births.
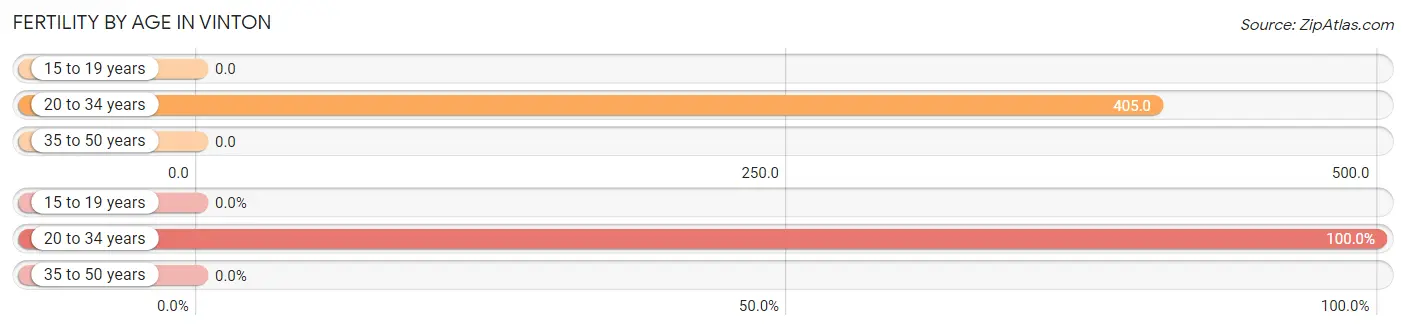
| Age Bracket | Women with Births | Births / 1,000 Women |
| 15 to 19 years | 0 (0.0%) | 0.0 |
| 20 to 34 years | 183 (100.0%) | 405.0 |
| 35 to 50 years | 0 (0.0%) | 0.0 |
| Total | 183 (100.0%) | 216.0 |
Fertility by Age by Marriage Status in Vinton
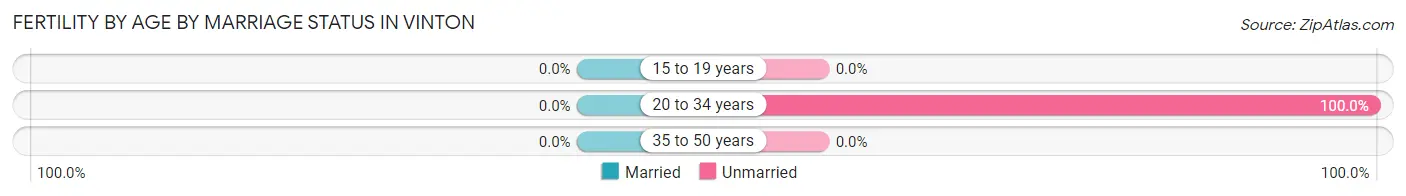
| Age Bracket | Married | Unmarried |
| 15 to 19 years | 0 (0.0%) | 0 (0.0%) |
| 20 to 34 years | 0 (0.0%) | 183 (100.0%) |
| 35 to 50 years | 0 (0.0%) | 0 (0.0%) |
| Total | 0 (0.0%) | 183 (100.0%) |
Fertility by Education in Vinton
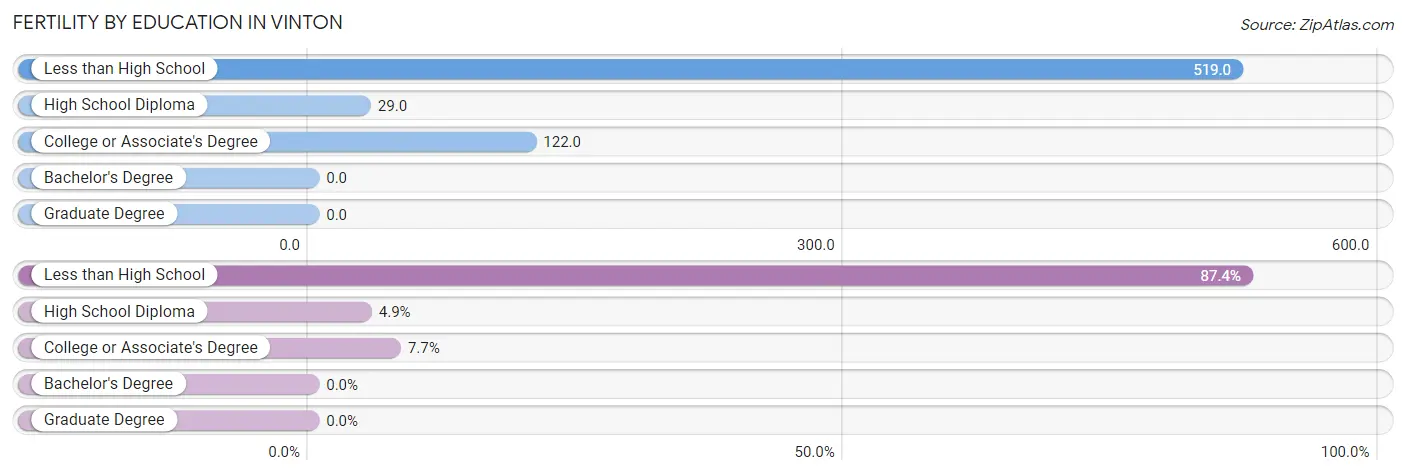
| Educational Attainment | Women with Births | Births / 1,000 Women |
| Less than High School | 160 (87.4%) | 519.0 |
| High School Diploma | 9 (4.9%) | 29.0 |
| College or Associate's Degree | 14 (7.6%) | 122.0 |
| Bachelor's Degree | 0 (0.0%) | 0.0 |
| Graduate Degree | 0 (0.0%) | 0.0 |
| Total | 183 (100.0%) | 216.0 |
Fertility by Education by Marriage Status in Vinton
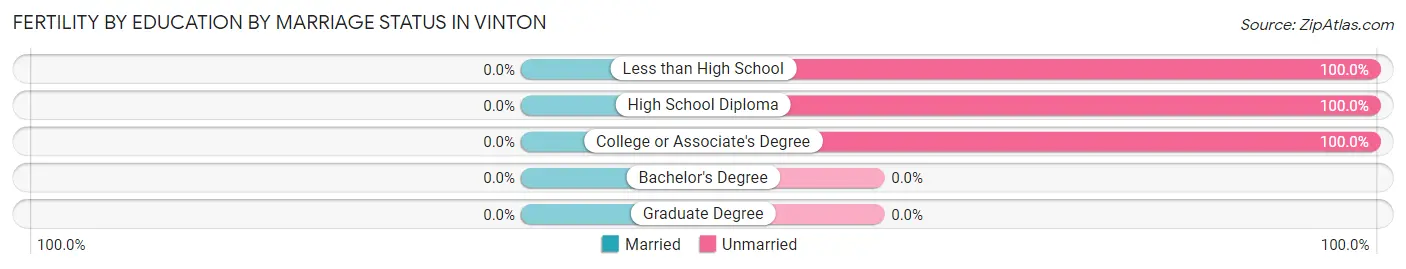
| Educational Attainment | Married | Unmarried |
| Less than High School | 0 (0.0%) | 160 (100.0%) |
| High School Diploma | 0 (0.0%) | 9 (100.0%) |
| College or Associate's Degree | 0 (0.0%) | 14 (100.0%) |
| Bachelor's Degree | 0 (0.0%) | 0 (0.0%) |
| Graduate Degree | 0 (0.0%) | 0 (0.0%) |
| Total | 0 (0.0%) | 183 (100.0%) |
Employment Characteristics in Vinton
Employment by Class of Employer in Vinton
Among the 1,204 employed individuals in Vinton, private company employees (893 | 74.2%), local government employees (161 | 13.4%), and self-employed (incorporated) (70 | 5.8%) make up the most common classes of employment.
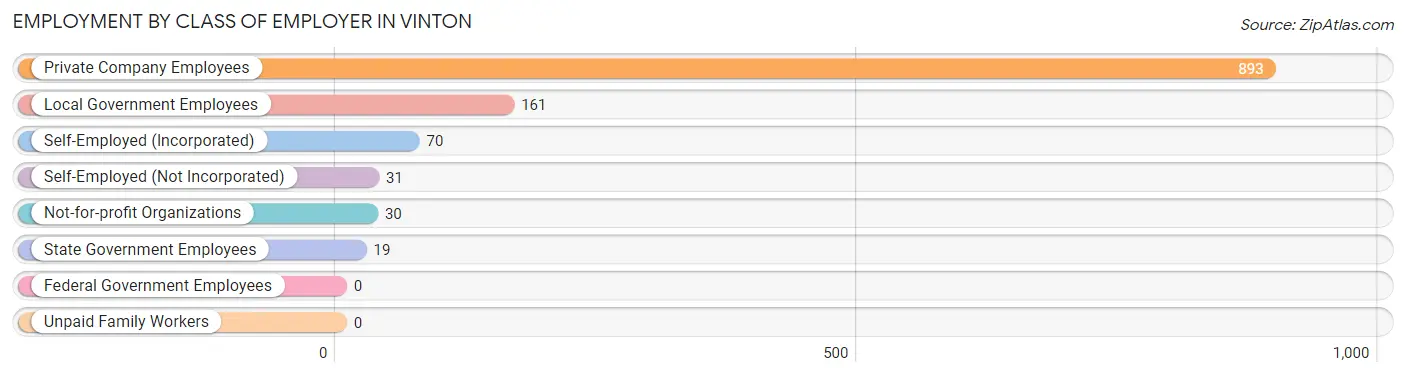
| Employer Class | # Employees | % Employees |
| Private Company Employees | 893 | 74.2% |
| Self-Employed (Incorporated) | 70 | 5.8% |
| Self-Employed (Not Incorporated) | 31 | 2.6% |
| Not-for-profit Organizations | 30 | 2.5% |
| Local Government Employees | 161 | 13.4% |
| State Government Employees | 19 | 1.6% |
| Federal Government Employees | 0 | 0.0% |
| Unpaid Family Workers | 0 | 0.0% |
| Total | 1,204 | 100.0% |
Employment Status by Age in Vinton
According to the labor force statistics for Vinton, out of the total population over 16 years of age (2,311), 52.8% or 1,220 individuals are in the labor force, with 1.4% or 17 of them unemployed. The age group with the highest labor force participation rate is 30 to 34 years, with 95.6% or 280 individuals in the labor force. Within the labor force, the 35 to 44 years age range has the highest percentage of unemployed individuals, with 5.3% or 17 of them being unemployed.
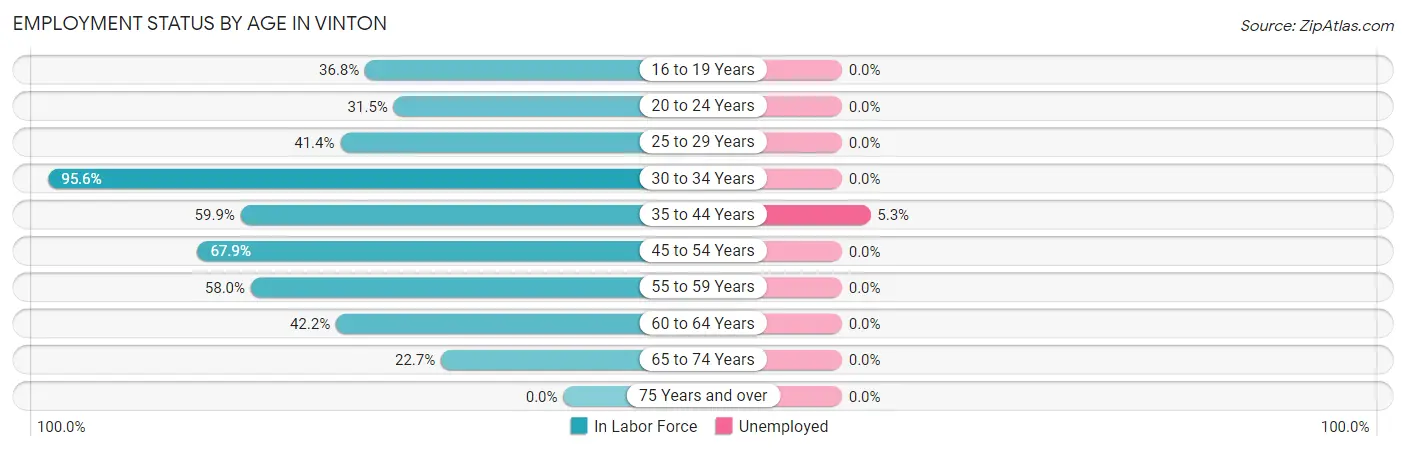
| Age Bracket | In Labor Force | Unemployed |
| 16 to 19 Years | 25 (36.8%) | 0 (0.0%) |
| 20 to 24 Years | 70 (31.5%) | 0 (0.0%) |
| 25 to 29 Years | 103 (41.4%) | 0 (0.0%) |
| 30 to 34 Years | 280 (95.6%) | 0 (0.0%) |
| 35 to 44 Years | 322 (59.9%) | 17 (5.3%) |
| 45 to 54 Years | 218 (67.9%) | 0 (0.0%) |
| 55 to 59 Years | 98 (58.0%) | 0 (0.0%) |
| 60 to 64 Years | 46 (42.2%) | 0 (0.0%) |
| 65 to 74 Years | 59 (22.7%) | 0 (0.0%) |
| 75 Years and over | 0 (0.0%) | 0 (0.0%) |
| Total | 1,220 (52.8%) | 17 (1.4%) |
Employment Status by Educational Attainment in Vinton
According to labor force statistics for Vinton, 63.5% of individuals (1,066) out of the total population between 25 and 64 years of age (1,679) are in the labor force, with 1.6% or 17 of them being unemployed. The group with the highest labor force participation rate are those with the educational attainment of college / associate degree, with 91.7% or 308 individuals in the labor force. Within the labor force, individuals with high school diploma education have the highest percentage of unemployment, with 3.2% or 17 of them being unemployed.
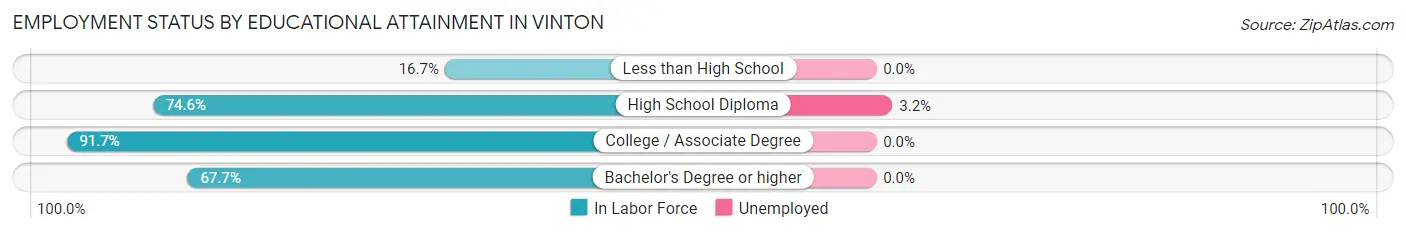
| Educational Attainment | In Labor Force | Unemployed |
| Less than High School | 65 (16.7%) | 0 (0.0%) |
| High School Diploma | 524 (74.6%) | 22 (3.2%) |
| College / Associate Degree | 308 (91.7%) | 0 (0.0%) |
| Bachelor's Degree or higher | 170 (67.7%) | 0 (0.0%) |
| Total | 1,066 (63.5%) | 27 (1.6%) |
Employment Occupations by Sex in Vinton
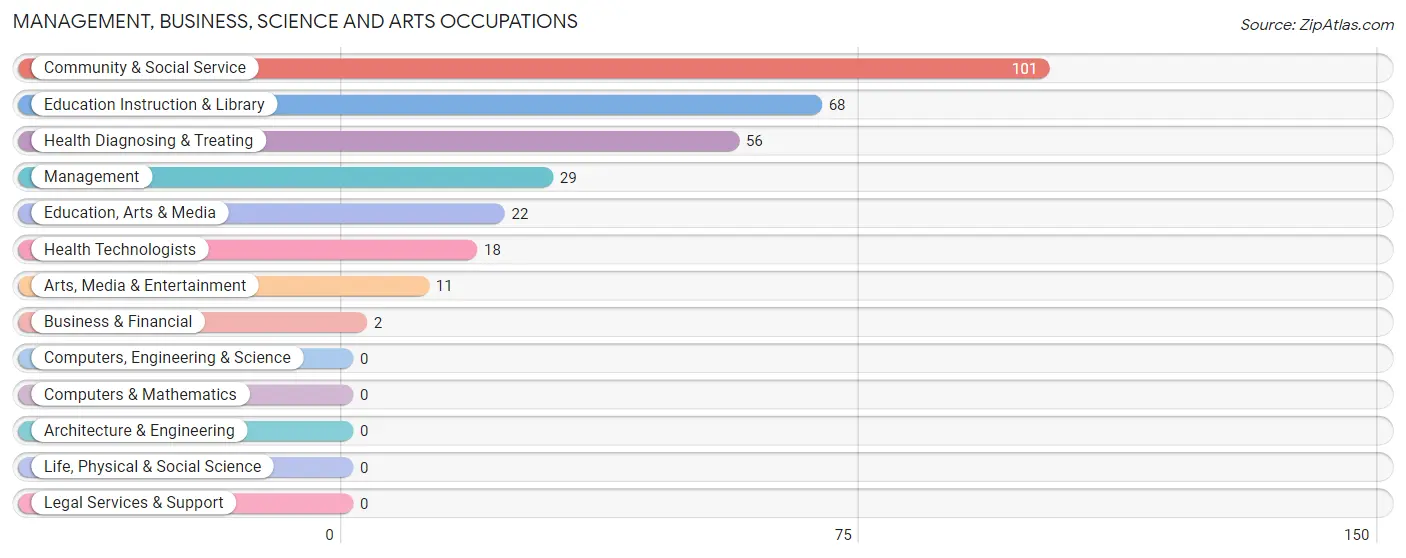
Management, Business, Science and Arts Occupations
The most common Management, Business, Science and Arts occupations in Vinton are Community & Social Service (101 | 8.4%), Education Instruction & Library (68 | 5.7%), Health Diagnosing & Treating (56 | 4.6%), Management (29 | 2.4%), and Education, Arts & Media (22 | 1.8%).
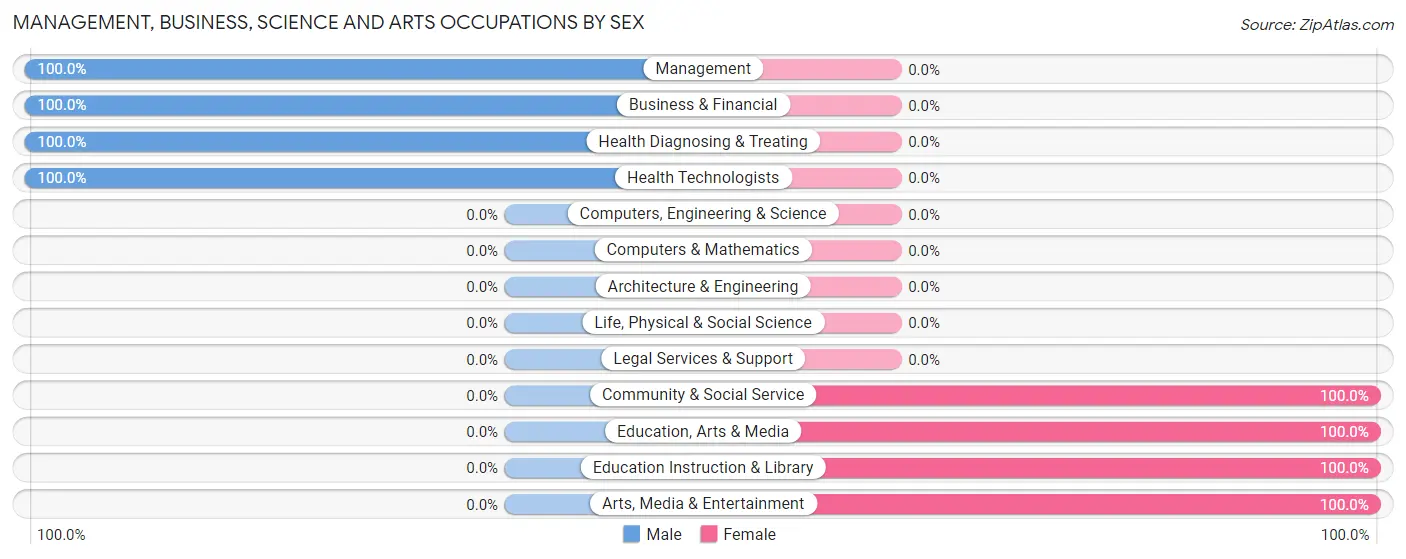
Management, Business, Science and Arts Occupations by Sex
Within the Management, Business, Science and Arts occupations in Vinton, the most male-oriented occupations are Management (100.0%), Business & Financial (100.0%), and Health Diagnosing & Treating (100.0%), while the most female-oriented occupations are Community & Social Service (100.0%), Education, Arts & Media (100.0%), and Education Instruction & Library (100.0%).
| Occupation | Male | Female |
| Management | 29 (100.0%) | 0 (0.0%) |
| Business & Financial | 2 (100.0%) | 0 (0.0%) |
| Computers, Engineering & Science | 0 (0.0%) | 0 (0.0%) |
| Computers & Mathematics | 0 (0.0%) | 0 (0.0%) |
| Architecture & Engineering | 0 (0.0%) | 0 (0.0%) |
| Life, Physical & Social Science | 0 (0.0%) | 0 (0.0%) |
| Community & Social Service | 0 (0.0%) | 101 (100.0%) |
| Education, Arts & Media | 0 (0.0%) | 22 (100.0%) |
| Legal Services & Support | 0 (0.0%) | 0 (0.0%) |
| Education Instruction & Library | 0 (0.0%) | 68 (100.0%) |
| Arts, Media & Entertainment | 0 (0.0%) | 11 (100.0%) |
| Health Diagnosing & Treating | 56 (100.0%) | 0 (0.0%) |
| Health Technologists | 18 (100.0%) | 0 (0.0%) |
| Total (Category) | 87 (46.3%) | 101 (53.7%) |
| Total (Overall) | 620 (51.5%) | 584 (48.5%) |
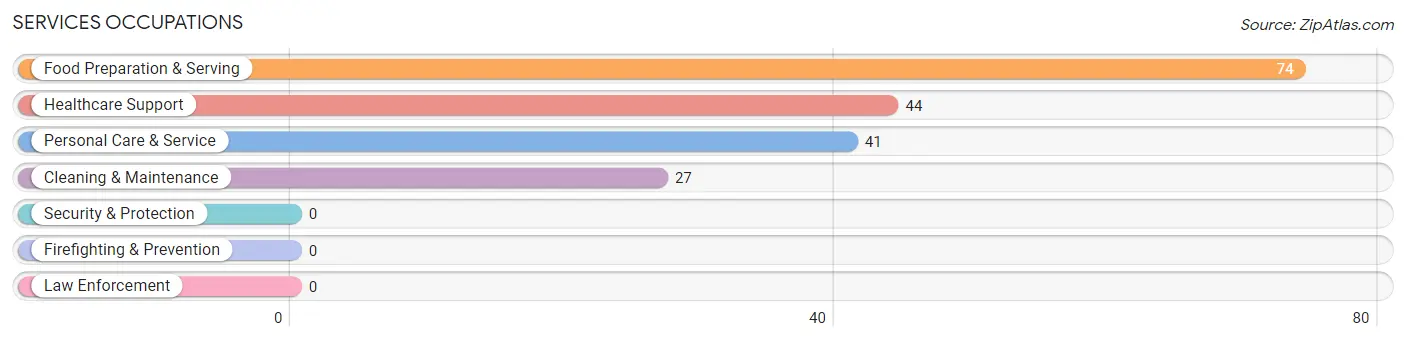
Services Occupations
The most common Services occupations in Vinton are Food Preparation & Serving (74 | 6.1%), Healthcare Support (44 | 3.6%), Personal Care & Service (41 | 3.4%), and Cleaning & Maintenance (27 | 2.2%).
Services Occupations by Sex
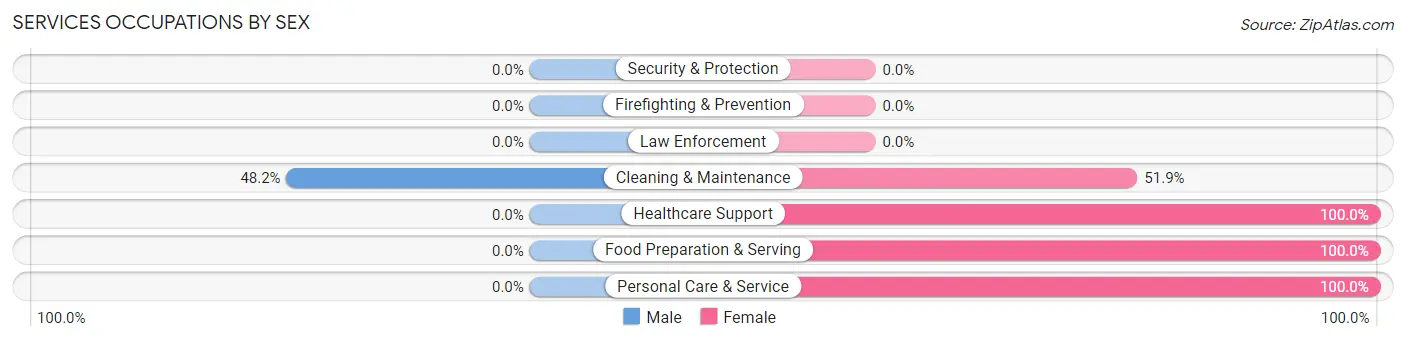
| Occupation | Male | Female |
| Healthcare Support | 0 (0.0%) | 44 (100.0%) |
| Security & Protection | 0 (0.0%) | 0 (0.0%) |
| Firefighting & Prevention | 0 (0.0%) | 0 (0.0%) |
| Law Enforcement | 0 (0.0%) | 0 (0.0%) |
| Food Preparation & Serving | 0 (0.0%) | 74 (100.0%) |
| Cleaning & Maintenance | 13 (48.1%) | 14 (51.8%) |
| Personal Care & Service | 0 (0.0%) | 41 (100.0%) |
| Total (Category) | 13 (7.0%) | 173 (93.0%) |
| Total (Overall) | 620 (51.5%) | 584 (48.5%) |
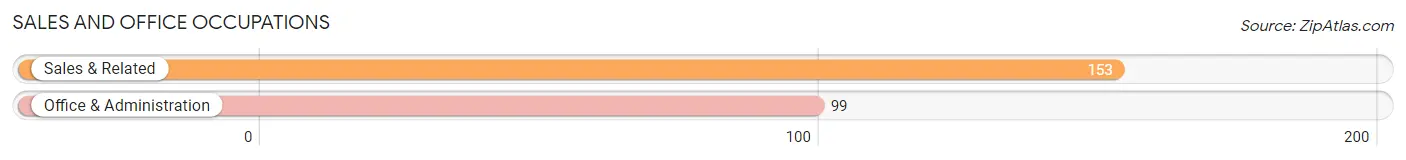
Sales and Office Occupations
The most common Sales and Office occupations in Vinton are Sales & Related (153 | 12.7%), and Office & Administration (99 | 8.2%).
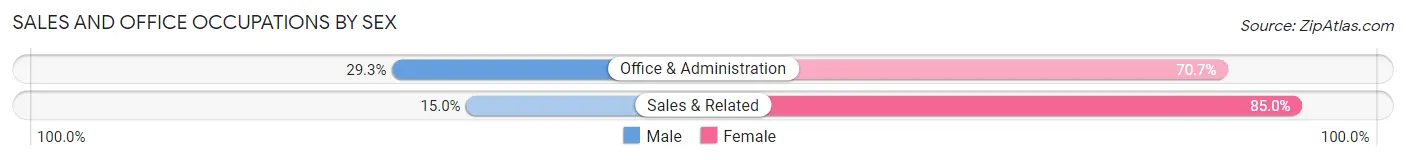
Sales and Office Occupations by Sex
| Occupation | Male | Female |
| Sales & Related | 23 (15.0%) | 130 (85.0%) |
| Office & Administration | 29 (29.3%) | 70 (70.7%) |
| Total (Category) | 52 (20.6%) | 200 (79.4%) |
| Total (Overall) | 620 (51.5%) | 584 (48.5%) |
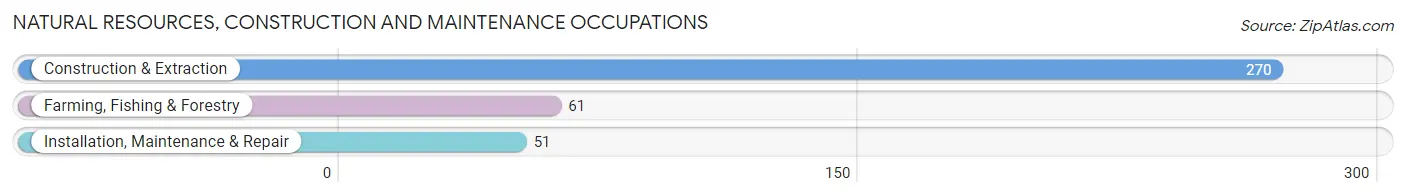
Natural Resources, Construction and Maintenance Occupations
The most common Natural Resources, Construction and Maintenance occupations in Vinton are Construction & Extraction (270 | 22.4%), Farming, Fishing & Forestry (61 | 5.1%), and Installation, Maintenance & Repair (51 | 4.2%).
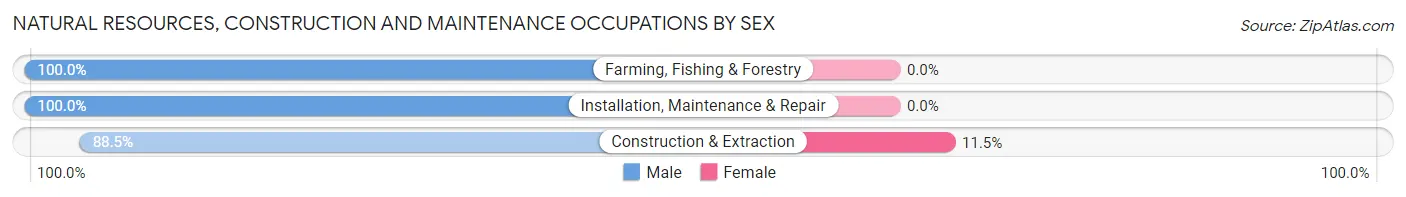
Natural Resources, Construction and Maintenance Occupations by Sex
| Occupation | Male | Female |
| Farming, Fishing & Forestry | 61 (100.0%) | 0 (0.0%) |
| Construction & Extraction | 239 (88.5%) | 31 (11.5%) |
| Installation, Maintenance & Repair | 51 (100.0%) | 0 (0.0%) |
| Total (Category) | 351 (91.9%) | 31 (8.1%) |
| Total (Overall) | 620 (51.5%) | 584 (48.5%) |
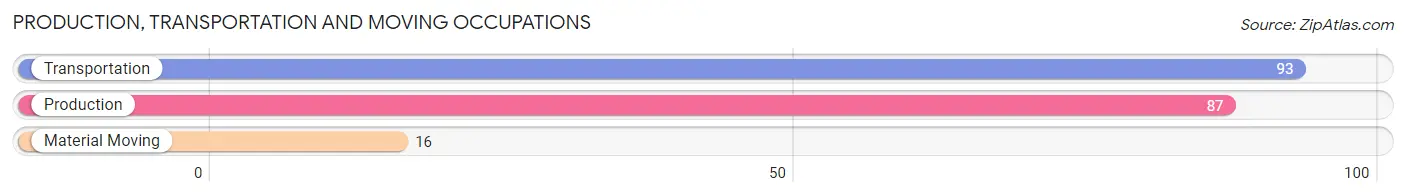
Production, Transportation and Moving Occupations
The most common Production, Transportation and Moving occupations in Vinton are Transportation (93 | 7.7%), Production (87 | 7.2%), and Material Moving (16 | 1.3%).
Production, Transportation and Moving Occupations by Sex
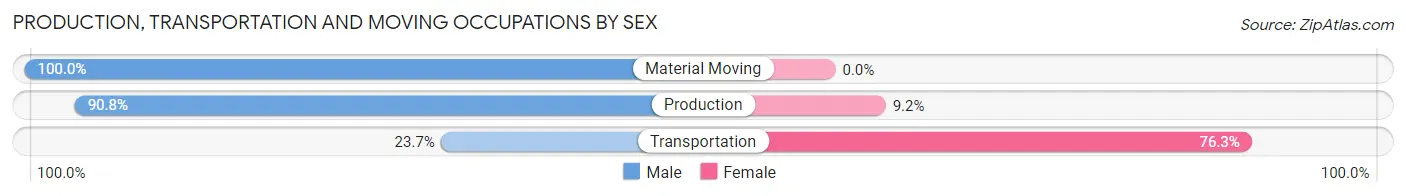
| Occupation | Male | Female |
| Production | 79 (90.8%) | 8 (9.2%) |
| Transportation | 22 (23.7%) | 71 (76.3%) |
| Material Moving | 16 (100.0%) | 0 (0.0%) |
| Total (Category) | 117 (59.7%) | 79 (40.3%) |
| Total (Overall) | 620 (51.5%) | 584 (48.5%) |
Employment Industries by Sex in Vinton
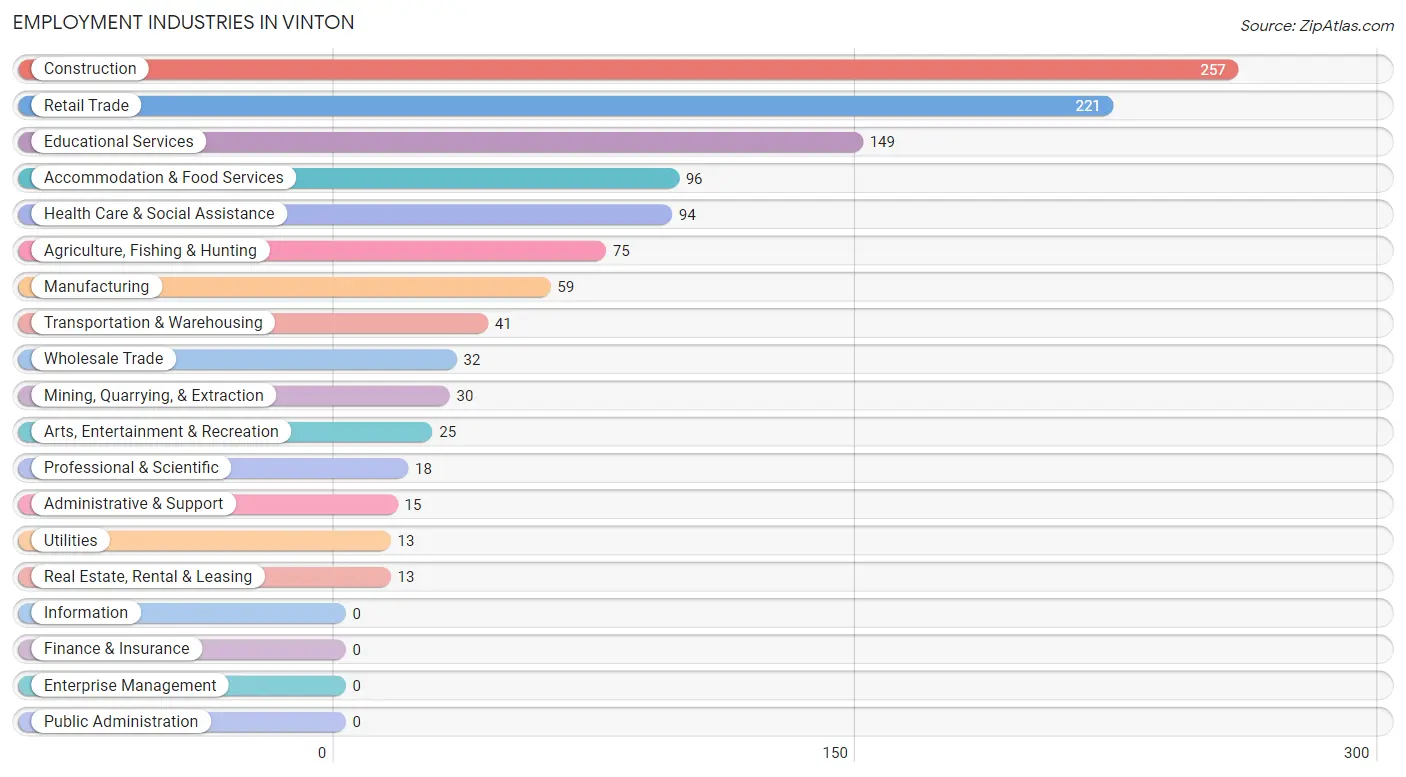
Employment Industries in Vinton
The major employment industries in Vinton include Construction (257 | 21.3%), Retail Trade (221 | 18.4%), Educational Services (149 | 12.4%), Accommodation & Food Services (96 | 8.0%), and Health Care & Social Assistance (94 | 7.8%).
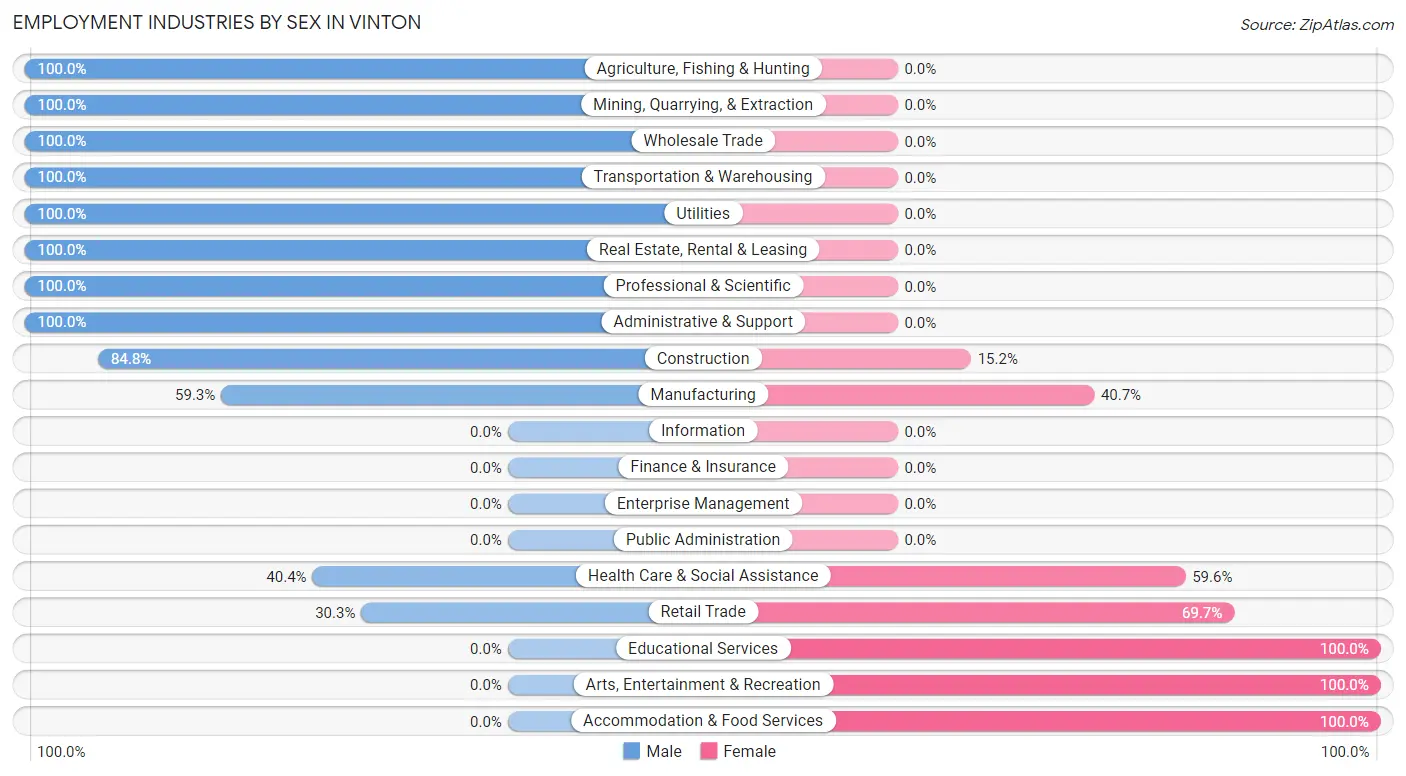
Employment Industries by Sex in Vinton
The Vinton industries that see more men than women are Agriculture, Fishing & Hunting (100.0%), Mining, Quarrying, & Extraction (100.0%), and Wholesale Trade (100.0%), whereas the industries that tend to have a higher number of women are Educational Services (100.0%), Arts, Entertainment & Recreation (100.0%), and Accommodation & Food Services (100.0%).
| Industry | Male | Female |
| Agriculture, Fishing & Hunting | 75 (100.0%) | 0 (0.0%) |
| Mining, Quarrying, & Extraction | 30 (100.0%) | 0 (0.0%) |
| Construction | 218 (84.8%) | 39 (15.2%) |
| Manufacturing | 35 (59.3%) | 24 (40.7%) |
| Wholesale Trade | 32 (100.0%) | 0 (0.0%) |
| Retail Trade | 67 (30.3%) | 154 (69.7%) |
| Transportation & Warehousing | 41 (100.0%) | 0 (0.0%) |
| Utilities | 13 (100.0%) | 0 (0.0%) |
| Information | 0 (0.0%) | 0 (0.0%) |
| Finance & Insurance | 0 (0.0%) | 0 (0.0%) |
| Real Estate, Rental & Leasing | 13 (100.0%) | 0 (0.0%) |
| Professional & Scientific | 18 (100.0%) | 0 (0.0%) |
| Enterprise Management | 0 (0.0%) | 0 (0.0%) |
| Administrative & Support | 15 (100.0%) | 0 (0.0%) |
| Educational Services | 0 (0.0%) | 149 (100.0%) |
| Health Care & Social Assistance | 38 (40.4%) | 56 (59.6%) |
| Arts, Entertainment & Recreation | 0 (0.0%) | 25 (100.0%) |
| Accommodation & Food Services | 0 (0.0%) | 96 (100.0%) |
| Public Administration | 0 (0.0%) | 0 (0.0%) |
| Total | 620 (51.5%) | 584 (48.5%) |
Education in Vinton
School Enrollment in Vinton
The most common levels of schooling among the 726 students in Vinton are middle school (449 | 61.9%), elementary school (110 | 15.1%), and high school (92 | 12.7%).
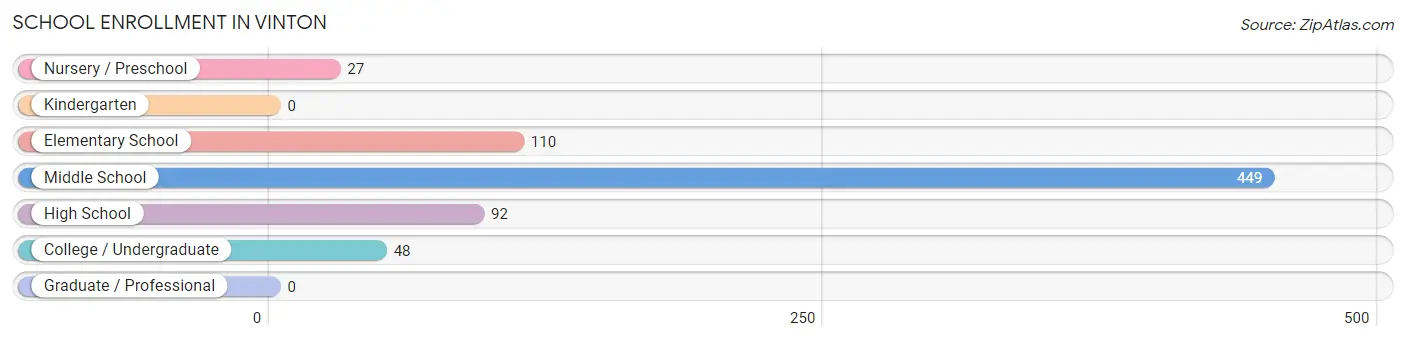
| School Level | # Students | % Students |
| Nursery / Preschool | 27 | 3.7% |
| Kindergarten | 0 | 0.0% |
| Elementary School | 110 | 15.1% |
| Middle School | 449 | 61.9% |
| High School | 92 | 12.7% |
| College / Undergraduate | 48 | 6.6% |
| Graduate / Professional | 0 | 0.0% |
| Total | 726 | 100.0% |
School Enrollment by Age by Funding Source in Vinton
Out of a total of 726 students who are enrolled in schools in Vinton, 359 (49.4%) attend a private institution, while the remaining 367 (50.6%) are enrolled in public schools. The age group of 10 to 14 year olds has the highest likelihood of being enrolled in private schools, with 340 (82.9% in the age bracket) enrolled. Conversely, the age group of 5 to 9 year old has the lowest likelihood of being enrolled in a private school, with 96 (100.0% in the age bracket) attending a public institution.
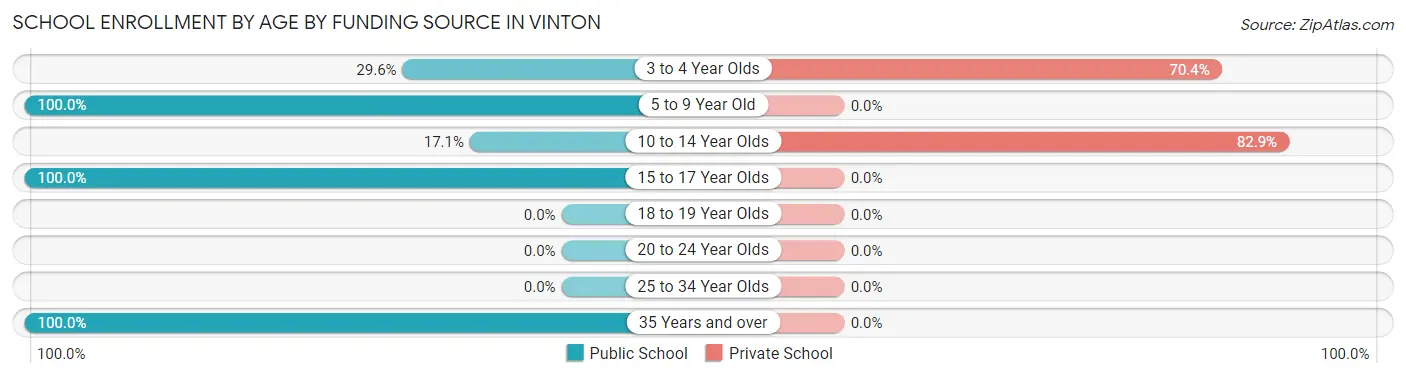
| Age Bracket | Public School | Private School |
| 3 to 4 Year Olds | 8 (29.6%) | 19 (70.4%) |
| 5 to 9 Year Old | 96 (100.0%) | 0 (0.0%) |
| 10 to 14 Year Olds | 70 (17.1%) | 340 (82.9%) |
| 15 to 17 Year Olds | 145 (100.0%) | 0 (0.0%) |
| 18 to 19 Year Olds | 0 (0.0%) | 0 (0.0%) |
| 20 to 24 Year Olds | 0 (0.0%) | 0 (0.0%) |
| 25 to 34 Year Olds | 0 (0.0%) | 0 (0.0%) |
| 35 Years and over | 48 (100.0%) | 0 (0.0%) |
| Total | 367 (50.6%) | 359 (49.4%) |
Educational Attainment by Field of Study in Vinton
Liberal arts & history (81 | 27.7%), social sciences (62 | 21.2%), arts & humanities (34 | 11.6%), business (33 | 11.3%), and education (27 | 9.2%) are the most common fields of study among 293 individuals in Vinton who have obtained a bachelor's degree or higher.
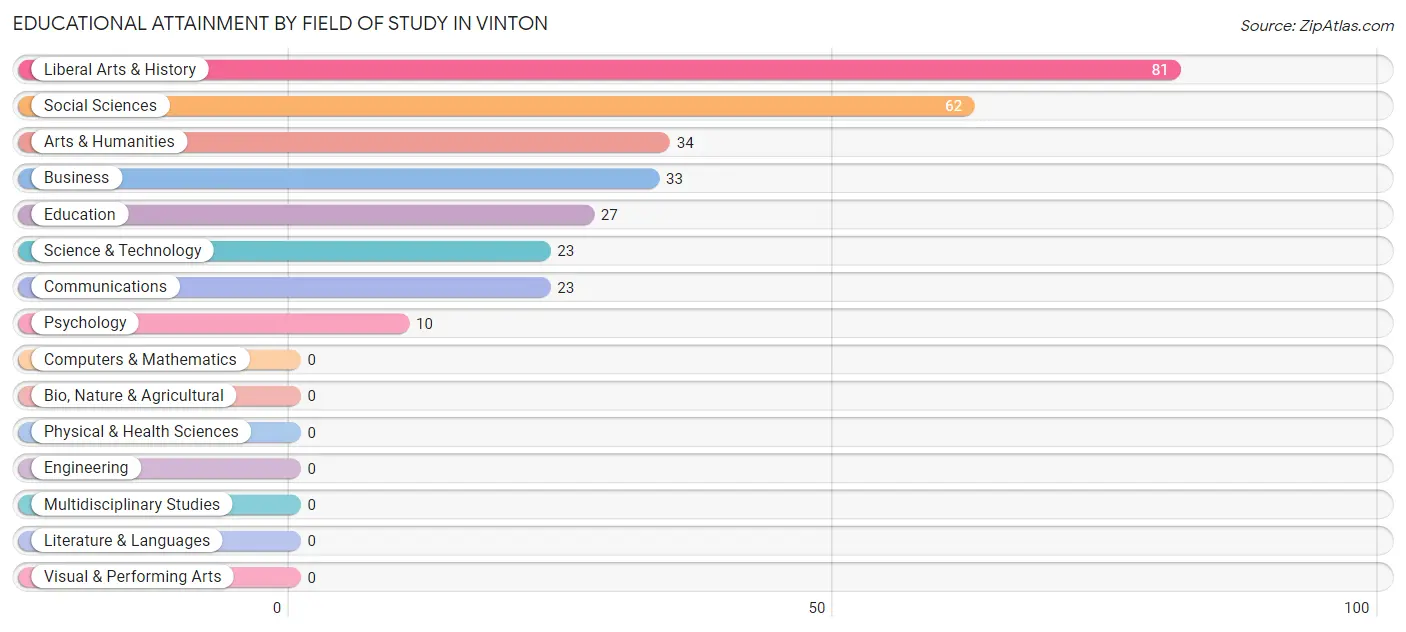
| Field of Study | # Graduates | % Graduates |
| Computers & Mathematics | 0 | 0.0% |
| Bio, Nature & Agricultural | 0 | 0.0% |
| Physical & Health Sciences | 0 | 0.0% |
| Psychology | 10 | 3.4% |
| Social Sciences | 62 | 21.2% |
| Engineering | 0 | 0.0% |
| Multidisciplinary Studies | 0 | 0.0% |
| Science & Technology | 23 | 7.9% |
| Business | 33 | 11.3% |
| Education | 27 | 9.2% |
| Literature & Languages | 0 | 0.0% |
| Liberal Arts & History | 81 | 27.7% |
| Visual & Performing Arts | 0 | 0.0% |
| Communications | 23 | 7.9% |
| Arts & Humanities | 34 | 11.6% |
| Total | 293 | 100.0% |
Transportation & Commute in Vinton
Vehicle Availability by Sex in Vinton
The most prevalent vehicle ownership categories in Vinton are males with 2 vehicles (234, accounting for 37.7%) and females with 2 vehicles (233, making up 40.1%).
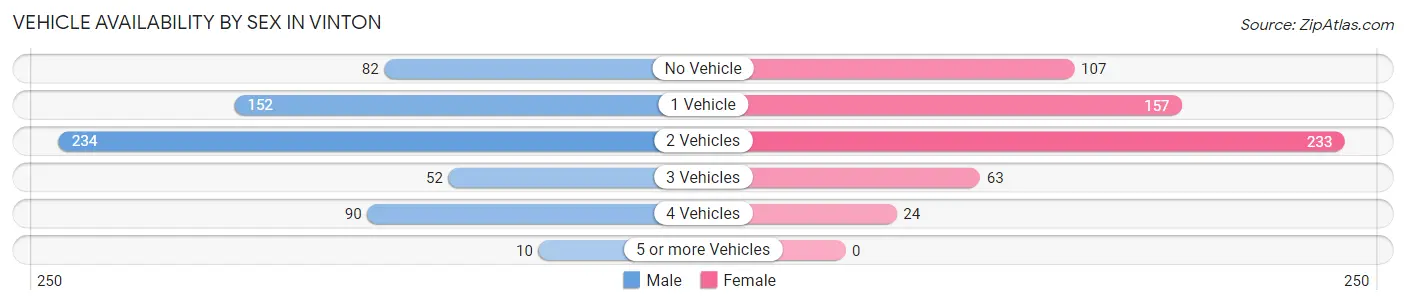
| Vehicles Available | Male | Female |
| No Vehicle | 82 (13.2%) | 107 (18.3%) |
| 1 Vehicle | 152 (24.5%) | 157 (26.9%) |
| 2 Vehicles | 234 (37.7%) | 233 (39.9%) |
| 3 Vehicles | 52 (8.4%) | 63 (10.8%) |
| 4 Vehicles | 90 (14.5%) | 24 (4.1%) |
| 5 or more Vehicles | 10 (1.6%) | 0 (0.0%) |
| Total | 620 (100.0%) | 584 (100.0%) |
Commute Time in Vinton
The most frequently occuring commute durations in Vinton are 15 to 19 minutes (321 commuters, 26.7%), 30 to 34 minutes (254 commuters, 21.1%), and 5 to 9 minutes (237 commuters, 19.7%).
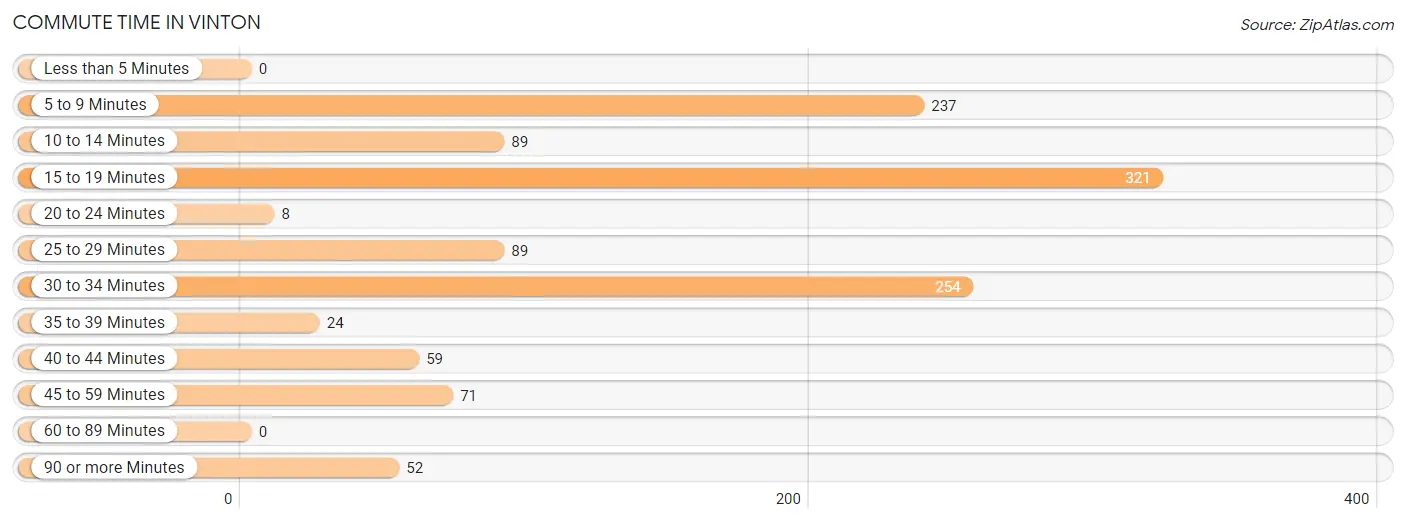
| Commute Time | # Commuters | % Commuters |
| Less than 5 Minutes | 0 | 0.0% |
| 5 to 9 Minutes | 237 | 19.7% |
| 10 to 14 Minutes | 89 | 7.4% |
| 15 to 19 Minutes | 321 | 26.7% |
| 20 to 24 Minutes | 8 | 0.7% |
| 25 to 29 Minutes | 89 | 7.4% |
| 30 to 34 Minutes | 254 | 21.1% |
| 35 to 39 Minutes | 24 | 2.0% |
| 40 to 44 Minutes | 59 | 4.9% |
| 45 to 59 Minutes | 71 | 5.9% |
| 60 to 89 Minutes | 0 | 0.0% |
| 90 or more Minutes | 52 | 4.3% |
Commute Time by Sex in Vinton
The most common commute times in Vinton are 30 to 34 minutes (182 commuters, 29.3%) for males and 15 to 19 minutes (168 commuters, 28.8%) for females.
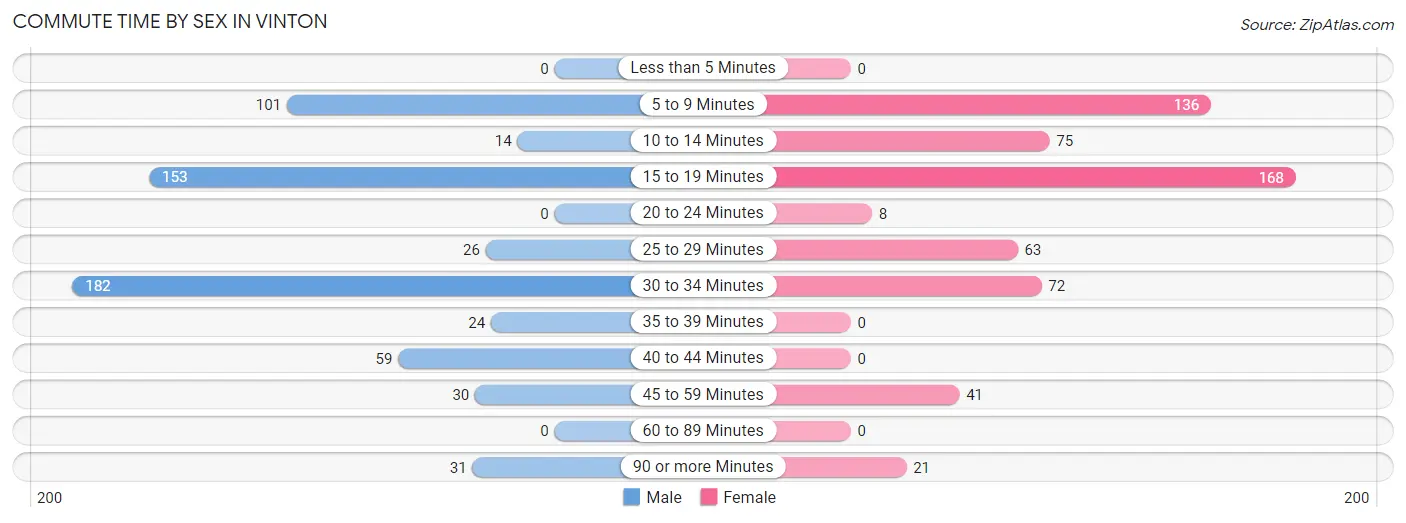
| Commute Time | Male | Female |
| Less than 5 Minutes | 0 (0.0%) | 0 (0.0%) |
| 5 to 9 Minutes | 101 (16.3%) | 136 (23.3%) |
| 10 to 14 Minutes | 14 (2.3%) | 75 (12.8%) |
| 15 to 19 Minutes | 153 (24.7%) | 168 (28.8%) |
| 20 to 24 Minutes | 0 (0.0%) | 8 (1.4%) |
| 25 to 29 Minutes | 26 (4.2%) | 63 (10.8%) |
| 30 to 34 Minutes | 182 (29.3%) | 72 (12.3%) |
| 35 to 39 Minutes | 24 (3.9%) | 0 (0.0%) |
| 40 to 44 Minutes | 59 (9.5%) | 0 (0.0%) |
| 45 to 59 Minutes | 30 (4.8%) | 41 (7.0%) |
| 60 to 89 Minutes | 0 (0.0%) | 0 (0.0%) |
| 90 or more Minutes | 31 (5.0%) | 21 (3.6%) |
Time of Departure to Work by Sex in Vinton
The most frequent times of departure to work in Vinton are 6:00 AM to 6:29 AM (335, 54.0%) for males and 5:00 AM to 5:29 AM (103, 17.6%) for females.
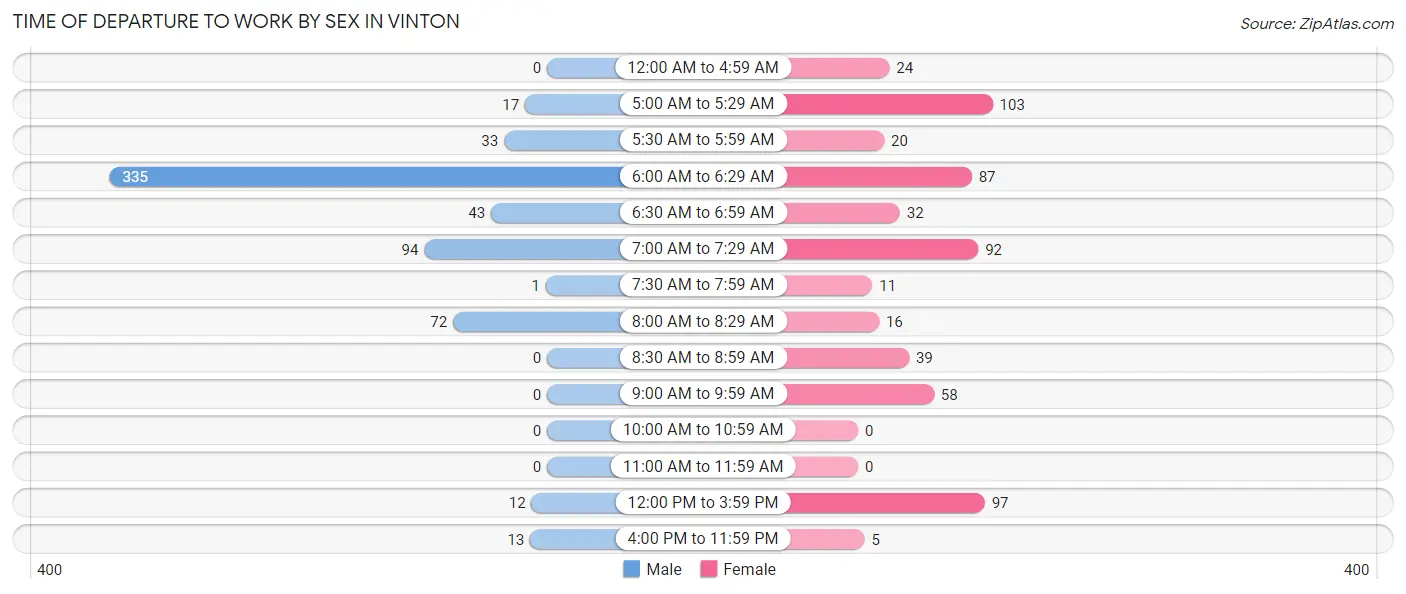
| Time of Departure | Male | Female |
| 12:00 AM to 4:59 AM | 0 (0.0%) | 24 (4.1%) |
| 5:00 AM to 5:29 AM | 17 (2.7%) | 103 (17.6%) |
| 5:30 AM to 5:59 AM | 33 (5.3%) | 20 (3.4%) |
| 6:00 AM to 6:29 AM | 335 (54.0%) | 87 (14.9%) |
| 6:30 AM to 6:59 AM | 43 (6.9%) | 32 (5.5%) |
| 7:00 AM to 7:29 AM | 94 (15.2%) | 92 (15.8%) |
| 7:30 AM to 7:59 AM | 1 (0.2%) | 11 (1.9%) |
| 8:00 AM to 8:29 AM | 72 (11.6%) | 16 (2.7%) |
| 8:30 AM to 8:59 AM | 0 (0.0%) | 39 (6.7%) |
| 9:00 AM to 9:59 AM | 0 (0.0%) | 58 (9.9%) |
| 10:00 AM to 10:59 AM | 0 (0.0%) | 0 (0.0%) |
| 11:00 AM to 11:59 AM | 0 (0.0%) | 0 (0.0%) |
| 12:00 PM to 3:59 PM | 12 (1.9%) | 97 (16.6%) |
| 4:00 PM to 11:59 PM | 13 (2.1%) | 5 (0.9%) |
| Total | 620 (100.0%) | 584 (100.0%) |
Housing Occupancy in Vinton
Occupancy by Ownership in Vinton
Of the total 998 dwellings in Vinton, owner-occupied units account for 485 (48.6%), while renter-occupied units make up 513 (51.4%).
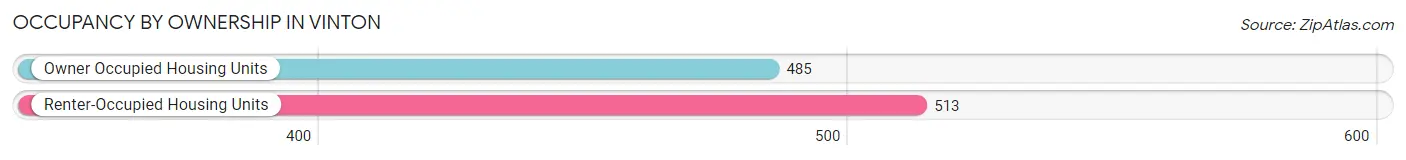
| Occupancy | # Housing Units | % Housing Units |
| Owner Occupied Housing Units | 485 | 48.6% |
| Renter-Occupied Housing Units | 513 | 51.4% |
| Total Occupied Housing Units | 998 | 100.0% |
Occupancy by Household Size in Vinton
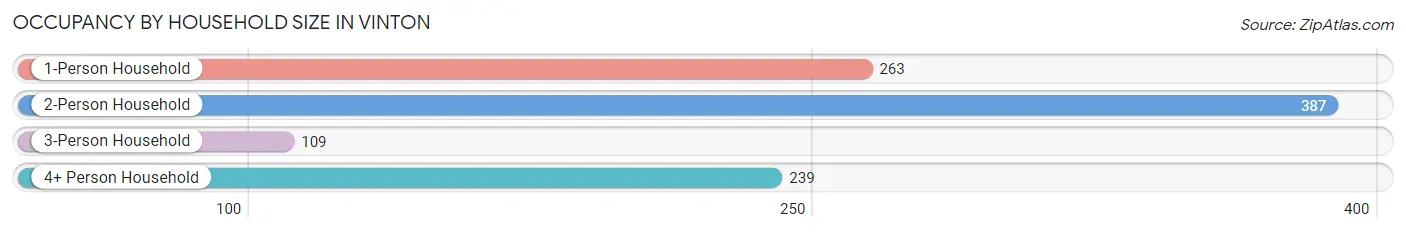
| Household Size | # Housing Units | % Housing Units |
| 1-Person Household | 263 | 26.4% |
| 2-Person Household | 387 | 38.8% |
| 3-Person Household | 109 | 10.9% |
| 4+ Person Household | 239 | 23.9% |
| Total Housing Units | 998 | 100.0% |
Occupancy by Ownership by Household Size in Vinton
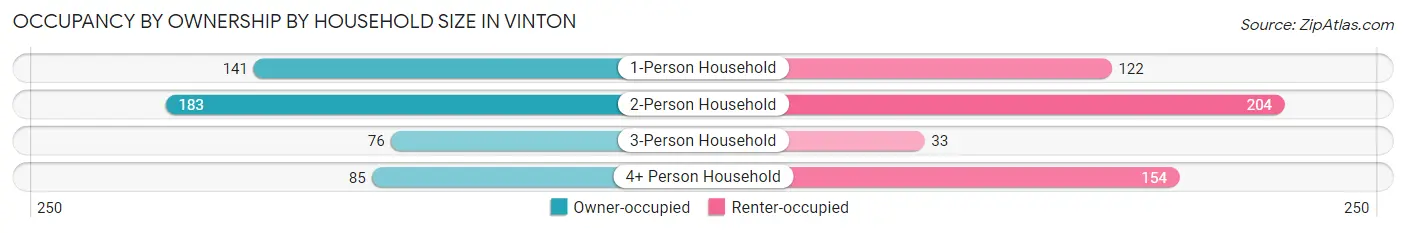
| Household Size | Owner-occupied | Renter-occupied |
| 1-Person Household | 141 (53.6%) | 122 (46.4%) |
| 2-Person Household | 183 (47.3%) | 204 (52.7%) |
| 3-Person Household | 76 (69.7%) | 33 (30.3%) |
| 4+ Person Household | 85 (35.6%) | 154 (64.4%) |
| Total Housing Units | 485 (48.6%) | 513 (51.4%) |
Occupancy by Educational Attainment in Vinton
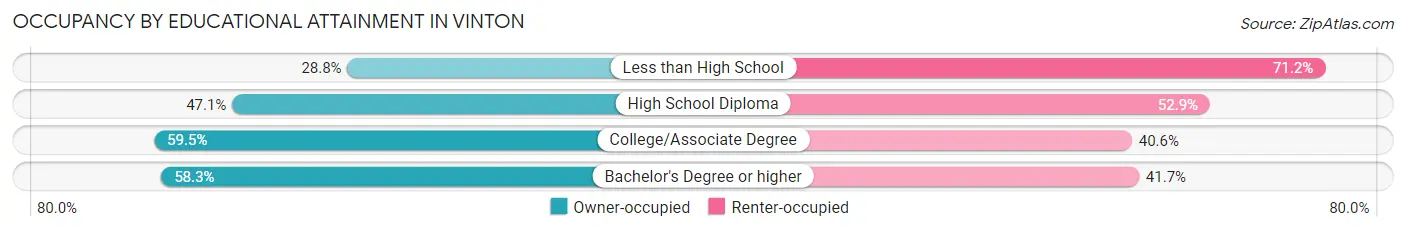
| Household Size | Owner-occupied | Renter-occupied |
| Less than High School | 57 (28.8%) | 141 (71.2%) |
| High School Diploma | 177 (47.1%) | 199 (52.9%) |
| College/Associate Degree | 195 (59.5%) | 133 (40.6%) |
| Bachelor's Degree or higher | 56 (58.3%) | 40 (41.7%) |
Occupancy by Age of Householder in Vinton
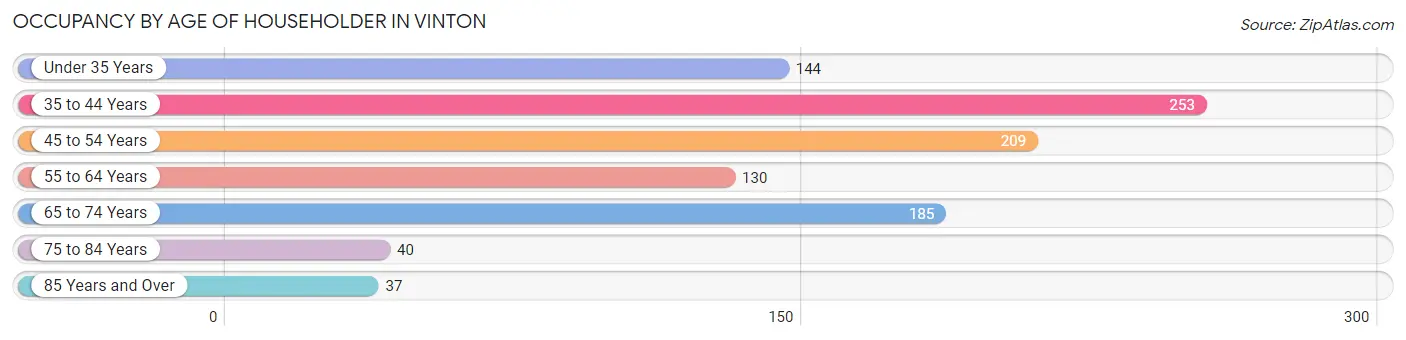
| Age Bracket | # Households | % Households |
| Under 35 Years | 144 | 14.4% |
| 35 to 44 Years | 253 | 25.4% |
| 45 to 54 Years | 209 | 20.9% |
| 55 to 64 Years | 130 | 13.0% |
| 65 to 74 Years | 185 | 18.5% |
| 75 to 84 Years | 40 | 4.0% |
| 85 Years and Over | 37 | 3.7% |
| Total | 998 | 100.0% |
Housing Finances in Vinton
Median Income by Occupancy in Vinton
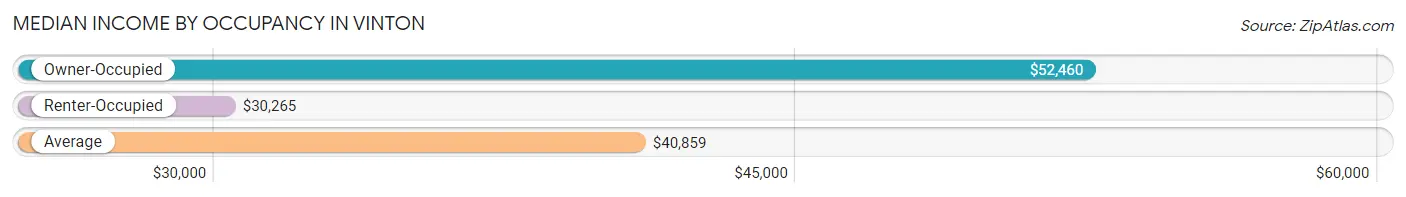
| Occupancy Type | # Households | Median Income |
| Owner-Occupied | 485 (48.6%) | $52,460 |
| Renter-Occupied | 513 (51.4%) | $30,265 |
| Average | 998 (100.0%) | $40,859 |
Occupancy by Householder Income Bracket in Vinton
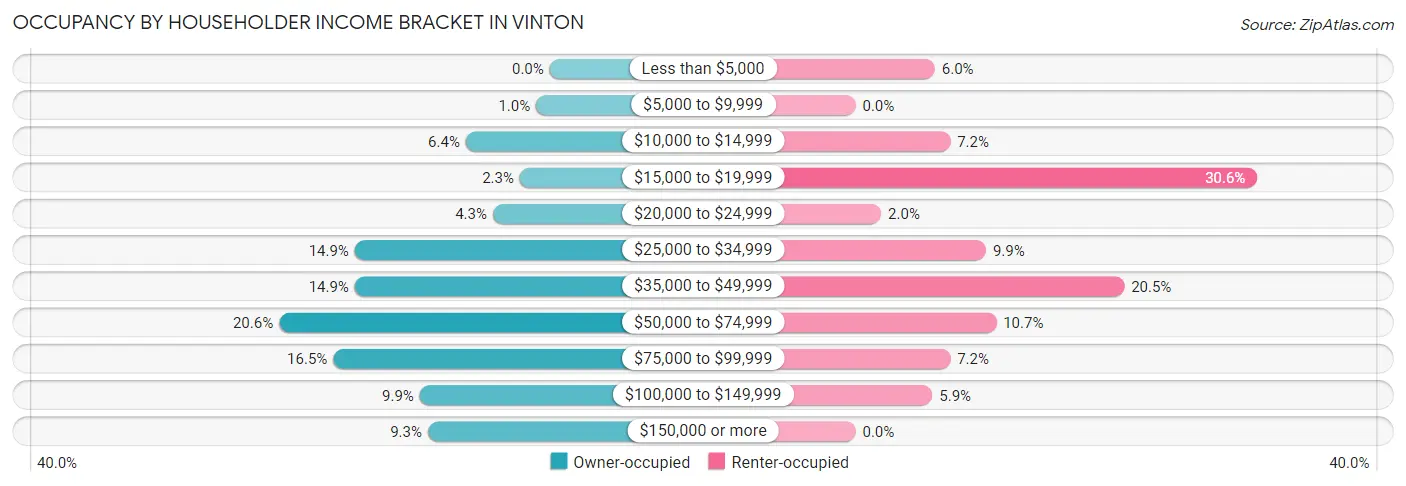
| Income Bracket | Owner-occupied | Renter-occupied |
| Less than $5,000 | 0 (0.0%) | 31 (6.0%) |
| $5,000 to $9,999 | 5 (1.0%) | 0 (0.0%) |
| $10,000 to $14,999 | 31 (6.4%) | 37 (7.2%) |
| $15,000 to $19,999 | 11 (2.3%) | 157 (30.6%) |
| $20,000 to $24,999 | 21 (4.3%) | 10 (1.9%) |
| $25,000 to $34,999 | 72 (14.8%) | 51 (9.9%) |
| $35,000 to $49,999 | 72 (14.8%) | 105 (20.5%) |
| $50,000 to $74,999 | 100 (20.6%) | 55 (10.7%) |
| $75,000 to $99,999 | 80 (16.5%) | 37 (7.2%) |
| $100,000 to $149,999 | 48 (9.9%) | 30 (5.9%) |
| $150,000 or more | 45 (9.3%) | 0 (0.0%) |
| Total | 485 (100.0%) | 513 (100.0%) |
Monthly Housing Cost Tiers in Vinton
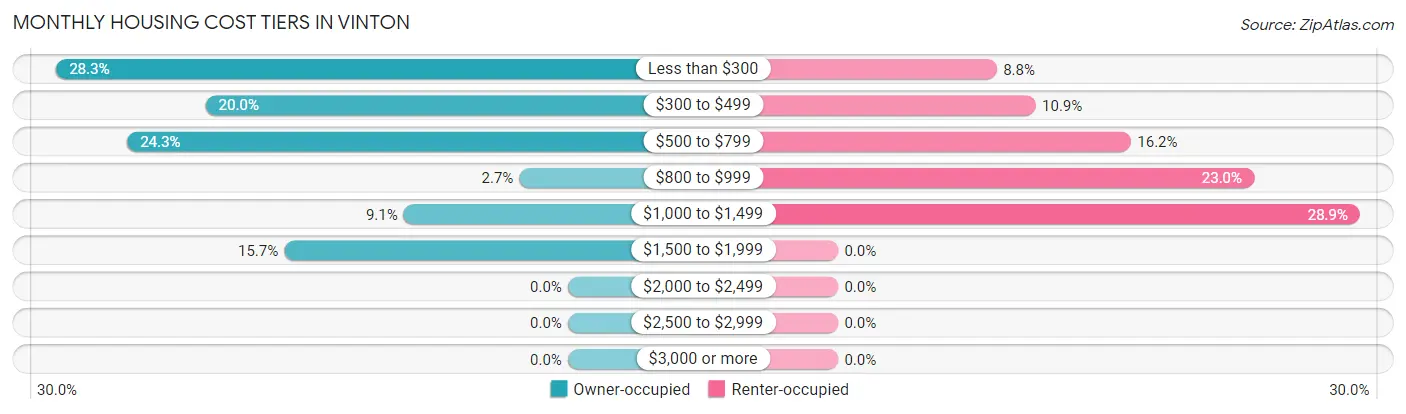
| Monthly Cost | Owner-occupied | Renter-occupied |
| Less than $300 | 137 (28.2%) | 45 (8.8%) |
| $300 to $499 | 97 (20.0%) | 56 (10.9%) |
| $500 to $799 | 118 (24.3%) | 83 (16.2%) |
| $800 to $999 | 13 (2.7%) | 118 (23.0%) |
| $1,000 to $1,499 | 44 (9.1%) | 148 (28.8%) |
| $1,500 to $1,999 | 76 (15.7%) | 0 (0.0%) |
| $2,000 to $2,499 | 0 (0.0%) | 0 (0.0%) |
| $2,500 to $2,999 | 0 (0.0%) | 0 (0.0%) |
| $3,000 or more | 0 (0.0%) | 0 (0.0%) |
| Total | 485 (100.0%) | 513 (100.0%) |
Physical Housing Characteristics in Vinton
Housing Structures in Vinton
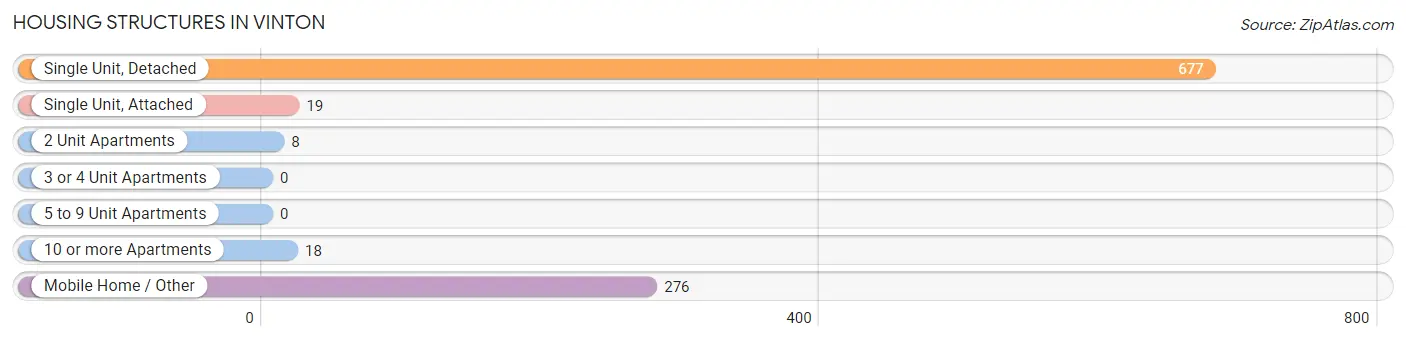
| Structure Type | # Housing Units | % Housing Units |
| Single Unit, Detached | 677 | 67.8% |
| Single Unit, Attached | 19 | 1.9% |
| 2 Unit Apartments | 8 | 0.8% |
| 3 or 4 Unit Apartments | 0 | 0.0% |
| 5 to 9 Unit Apartments | 0 | 0.0% |
| 10 or more Apartments | 18 | 1.8% |
| Mobile Home / Other | 276 | 27.7% |
| Total | 998 | 100.0% |
Housing Structures by Occupancy in Vinton
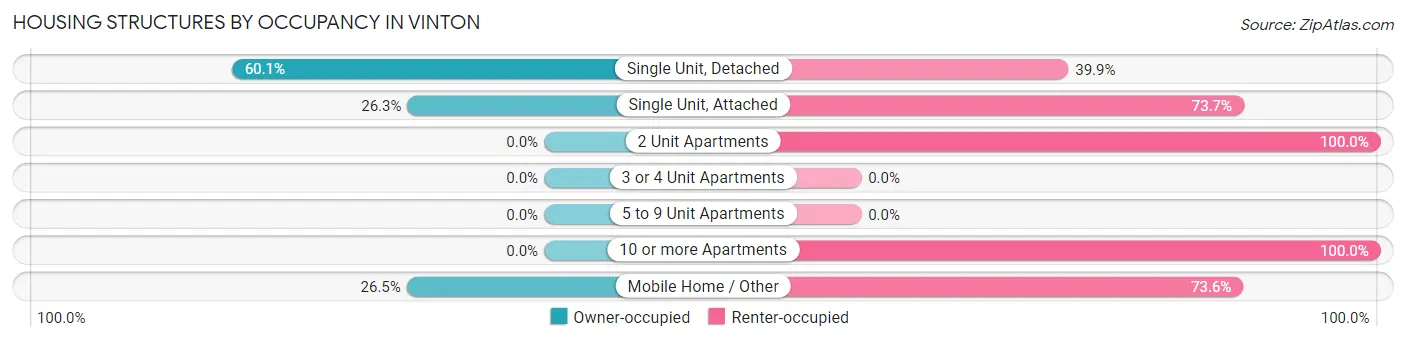
| Structure Type | Owner-occupied | Renter-occupied |
| Single Unit, Detached | 407 (60.1%) | 270 (39.9%) |
| Single Unit, Attached | 5 (26.3%) | 14 (73.7%) |
| 2 Unit Apartments | 0 (0.0%) | 8 (100.0%) |
| 3 or 4 Unit Apartments | 0 (0.0%) | 0 (0.0%) |
| 5 to 9 Unit Apartments | 0 (0.0%) | 0 (0.0%) |
| 10 or more Apartments | 0 (0.0%) | 18 (100.0%) |
| Mobile Home / Other | 73 (26.5%) | 203 (73.6%) |
| Total | 485 (48.6%) | 513 (51.4%) |
Housing Structures by Number of Rooms in Vinton
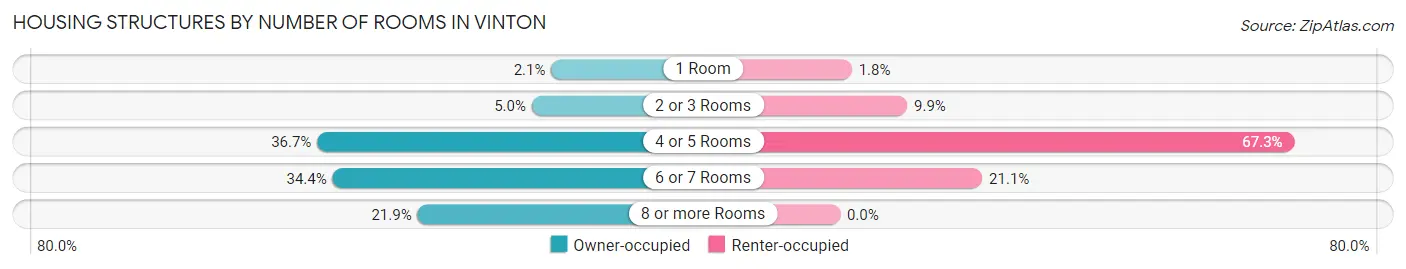
| Number of Rooms | Owner-occupied | Renter-occupied |
| 1 Room | 10 (2.1%) | 9 (1.8%) |
| 2 or 3 Rooms | 24 (5.0%) | 51 (9.9%) |
| 4 or 5 Rooms | 178 (36.7%) | 345 (67.2%) |
| 6 or 7 Rooms | 167 (34.4%) | 108 (21.0%) |
| 8 or more Rooms | 106 (21.9%) | 0 (0.0%) |
| Total | 485 (100.0%) | 513 (100.0%) |
Housing Structure by Heating Type in Vinton
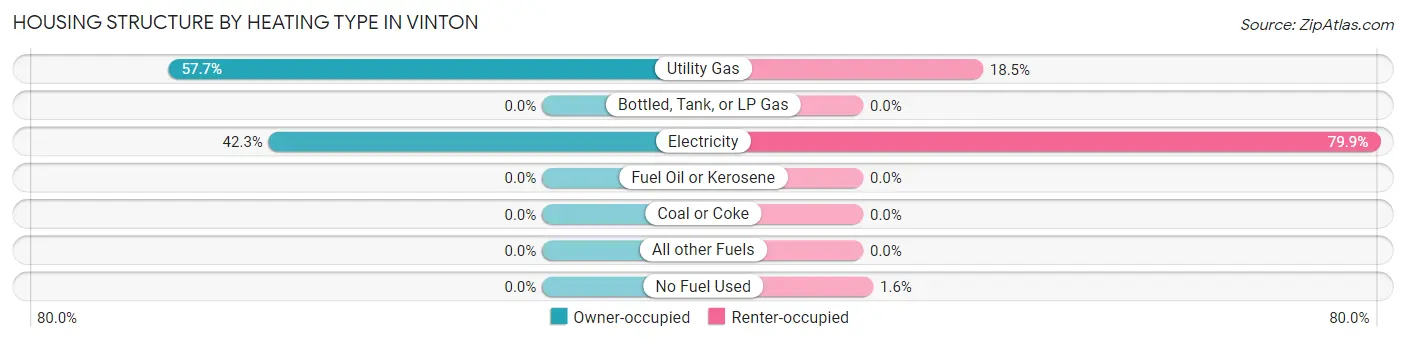
| Heating Type | Owner-occupied | Renter-occupied |
| Utility Gas | 280 (57.7%) | 95 (18.5%) |
| Bottled, Tank, or LP Gas | 0 (0.0%) | 0 (0.0%) |
| Electricity | 205 (42.3%) | 410 (79.9%) |
| Fuel Oil or Kerosene | 0 (0.0%) | 0 (0.0%) |
| Coal or Coke | 0 (0.0%) | 0 (0.0%) |
| All other Fuels | 0 (0.0%) | 0 (0.0%) |
| No Fuel Used | 0 (0.0%) | 8 (1.6%) |
| Total | 485 (100.0%) | 513 (100.0%) |
Household Vehicle Usage in Vinton
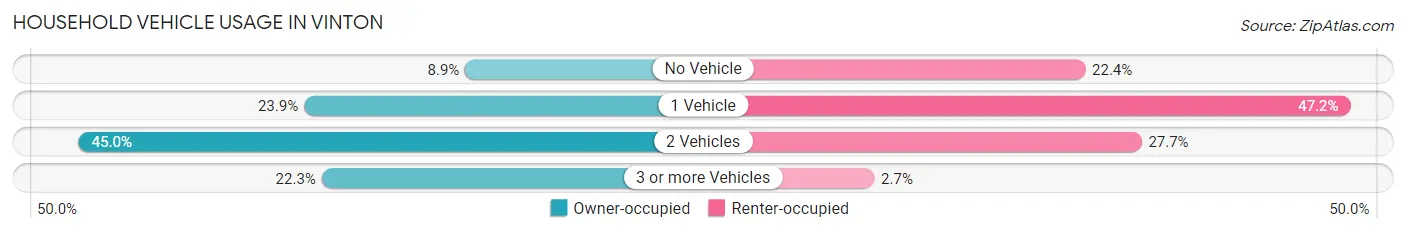
| Vehicles per Household | Owner-occupied | Renter-occupied |
| No Vehicle | 43 (8.9%) | 115 (22.4%) |
| 1 Vehicle | 116 (23.9%) | 242 (47.2%) |
| 2 Vehicles | 218 (45.0%) | 142 (27.7%) |
| 3 or more Vehicles | 108 (22.3%) | 14 (2.7%) |
| Total | 485 (100.0%) | 513 (100.0%) |
Real Estate & Mortgages in Vinton
Real Estate and Mortgage Overview in Vinton
| Characteristic | Without Mortgage | With Mortgage |
| Housing Units | 304 | 181 |
| Median Property Value | $79,600 | $147,700 |
| Median Household Income | $50,323 | $21 |
| Monthly Housing Costs | $352 | $0 |
| Real Estate Taxes | $199 | $11 |
Property Value by Mortgage Status in Vinton
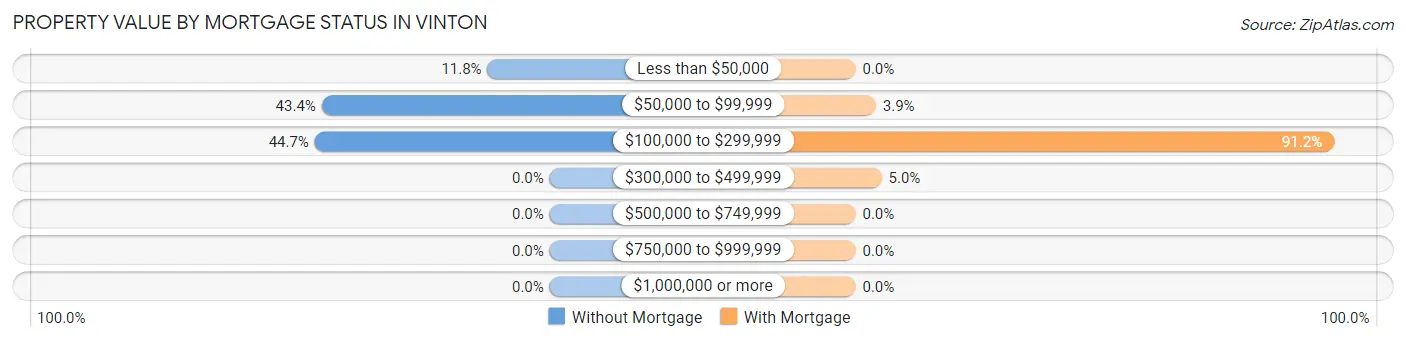
| Property Value | Without Mortgage | With Mortgage |
| Less than $50,000 | 36 (11.8%) | 0 (0.0%) |
| $50,000 to $99,999 | 132 (43.4%) | 7 (3.9%) |
| $100,000 to $299,999 | 136 (44.7%) | 165 (91.2%) |
| $300,000 to $499,999 | 0 (0.0%) | 9 (5.0%) |
| $500,000 to $749,999 | 0 (0.0%) | 0 (0.0%) |
| $750,000 to $999,999 | 0 (0.0%) | 0 (0.0%) |
| $1,000,000 or more | 0 (0.0%) | 0 (0.0%) |
| Total | 304 (100.0%) | 181 (100.0%) |
Household Income by Mortgage Status in Vinton
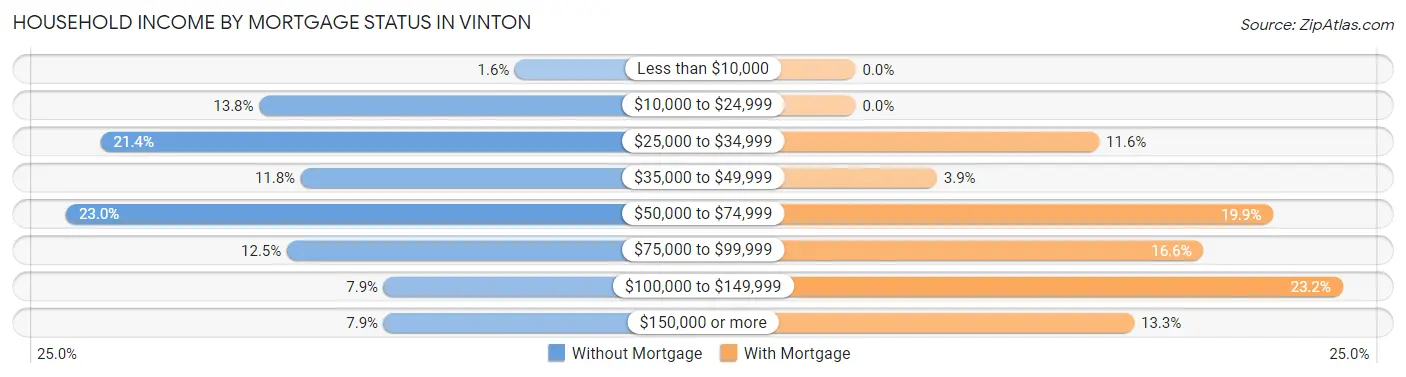
| Household Income | Without Mortgage | With Mortgage |
| Less than $10,000 | 5 (1.6%) | 0 (0.0%) |
| $10,000 to $24,999 | 42 (13.8%) | 0 (0.0%) |
| $25,000 to $34,999 | 65 (21.4%) | 21 (11.6%) |
| $35,000 to $49,999 | 36 (11.8%) | 7 (3.9%) |
| $50,000 to $74,999 | 70 (23.0%) | 36 (19.9%) |
| $75,000 to $99,999 | 38 (12.5%) | 30 (16.6%) |
| $100,000 to $149,999 | 24 (7.9%) | 42 (23.2%) |
| $150,000 or more | 24 (7.9%) | 24 (13.3%) |
| Total | 304 (100.0%) | 181 (100.0%) |
Property Value to Household Income Ratio in Vinton
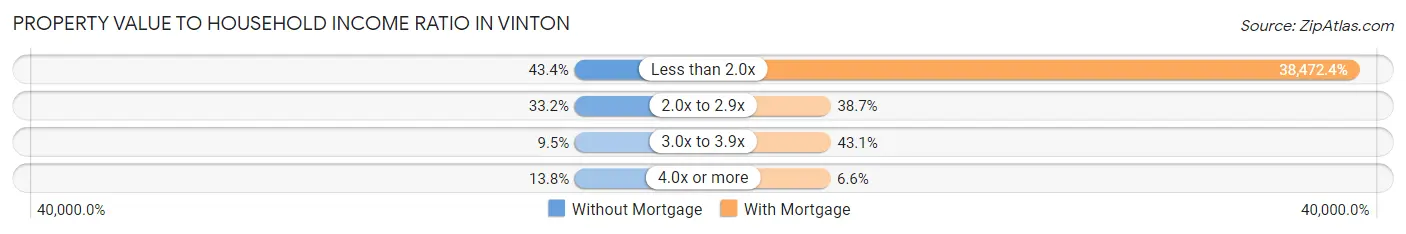
| Value-to-Income Ratio | Without Mortgage | With Mortgage |
| Less than 2.0x | 132 (43.4%) | 69,635 (38,472.4%) |
| 2.0x to 2.9x | 101 (33.2%) | 70 (38.7%) |
| 3.0x to 3.9x | 29 (9.5%) | 78 (43.1%) |
| 4.0x or more | 42 (13.8%) | 12 (6.6%) |
| Total | 304 (100.0%) | 181 (100.0%) |
Real Estate Taxes by Mortgage Status in Vinton
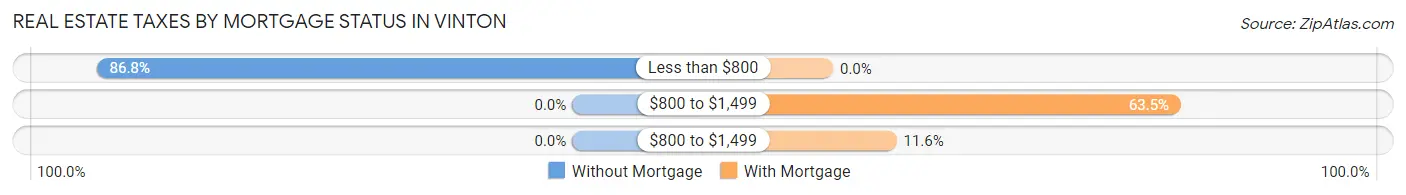
| Property Taxes | Without Mortgage | With Mortgage |
| Less than $800 | 264 (86.8%) | 0 (0.0%) |
| $800 to $1,499 | 0 (0.0%) | 115 (63.5%) |
| $800 to $1,499 | 0 (0.0%) | 21 (11.6%) |
| Total | 304 (100.0%) | 181 (100.0%) |
Health & Disability in Vinton
Health Insurance Coverage by Age in Vinton
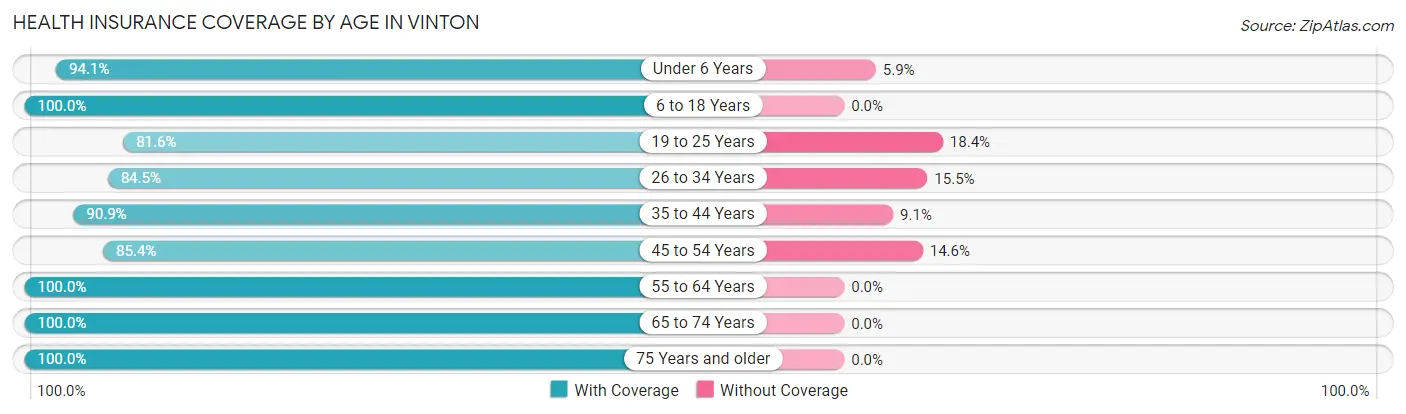
| Age Bracket | With Coverage | Without Coverage |
| Under 6 Years | 384 (94.1%) | 24 (5.9%) |
| 6 to 18 Years | 662 (100.0%) | 0 (0.0%) |
| 19 to 25 Years | 182 (81.6%) | 41 (18.4%) |
| 26 to 34 Years | 458 (84.5%) | 84 (15.5%) |
| 35 to 44 Years | 489 (90.9%) | 49 (9.1%) |
| 45 to 54 Years | 274 (85.4%) | 47 (14.6%) |
| 55 to 64 Years | 278 (100.0%) | 0 (0.0%) |
| 65 to 74 Years | 260 (100.0%) | 0 (0.0%) |
| 75 Years and older | 82 (100.0%) | 0 (0.0%) |
| Total | 3,069 (92.6%) | 245 (7.4%) |
Health Insurance Coverage by Citizenship Status in Vinton
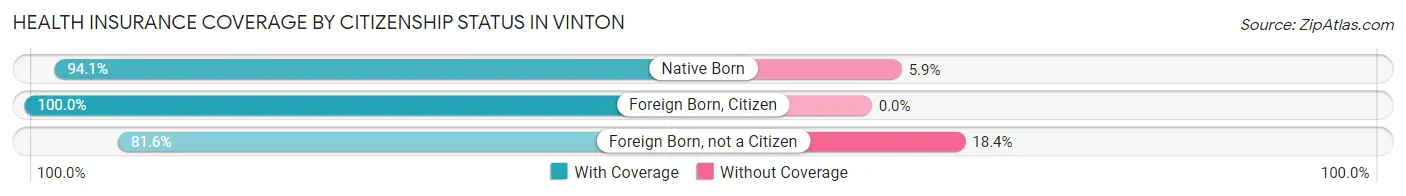
| Citizenship Status | With Coverage | Without Coverage |
| Native Born | 384 (94.1%) | 24 (5.9%) |
| Foreign Born, Citizen | 662 (100.0%) | 0 (0.0%) |
| Foreign Born, not a Citizen | 182 (81.6%) | 41 (18.4%) |
Health Insurance Coverage by Household Income in Vinton
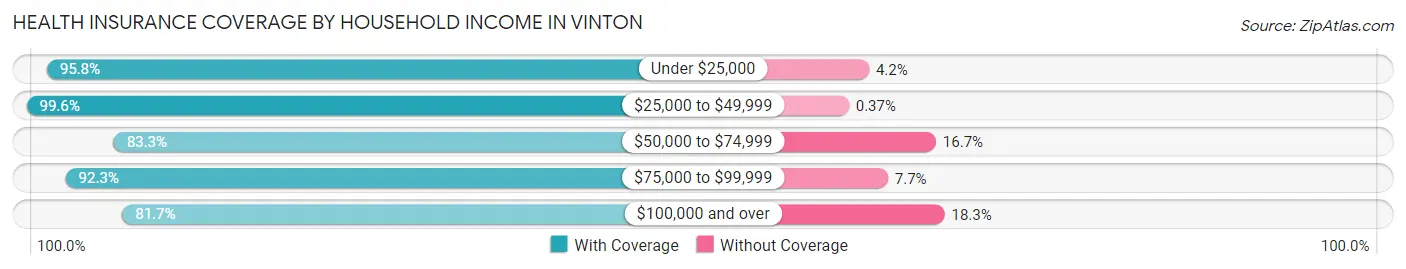
| Household Income | With Coverage | Without Coverage |
| Under $25,000 | 807 (95.8%) | 35 (4.2%) |
| $25,000 to $49,999 | 1,091 (99.6%) | 4 (0.4%) |
| $50,000 to $74,999 | 394 (83.3%) | 79 (16.7%) |
| $75,000 to $99,999 | 276 (92.3%) | 23 (7.7%) |
| $100,000 and over | 464 (81.7%) | 104 (18.3%) |
Public vs Private Health Insurance Coverage by Age in Vinton
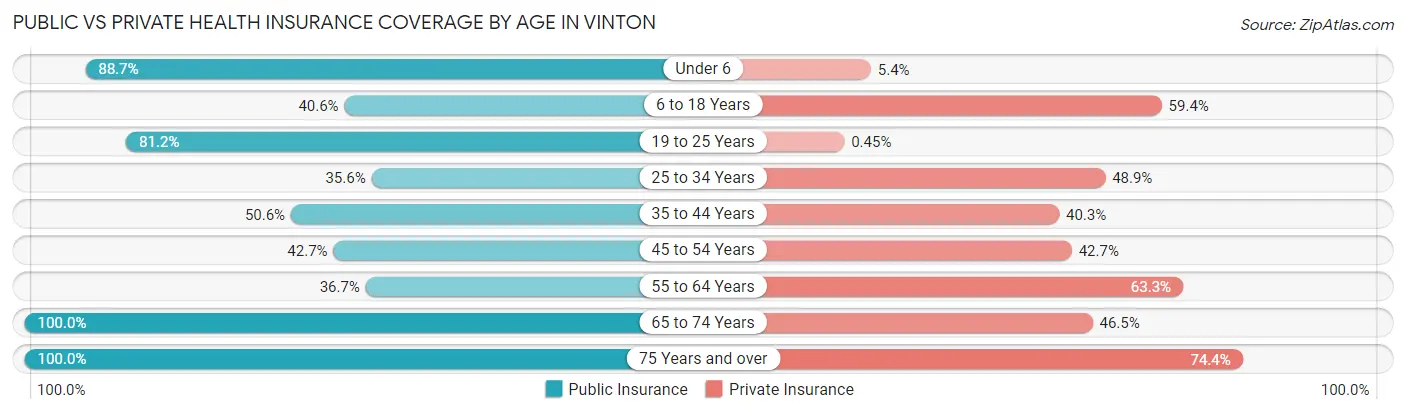
| Age Bracket | Public Insurance | Private Insurance |
| Under 6 | 362 (88.7%) | 22 (5.4%) |
| 6 to 18 Years | 269 (40.6%) | 393 (59.4%) |
| 19 to 25 Years | 181 (81.2%) | 1 (0.4%) |
| 25 to 34 Years | 193 (35.6%) | 265 (48.9%) |
| 35 to 44 Years | 272 (50.6%) | 217 (40.3%) |
| 45 to 54 Years | 137 (42.7%) | 137 (42.7%) |
| 55 to 64 Years | 102 (36.7%) | 176 (63.3%) |
| 65 to 74 Years | 260 (100.0%) | 121 (46.5%) |
| 75 Years and over | 82 (100.0%) | 61 (74.4%) |
| Total | 1,858 (56.1%) | 1,393 (42.0%) |
Disability Status by Sex by Age in Vinton
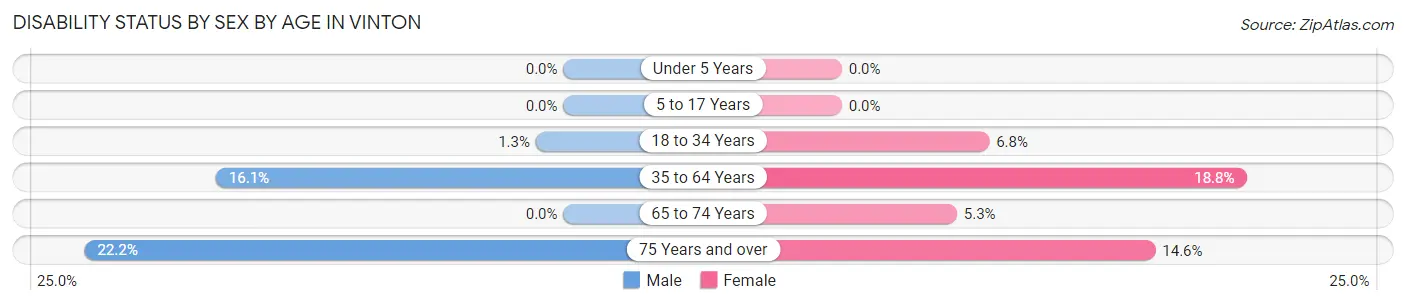
| Age Bracket | Male | Female |
| Under 5 Years | 0 (0.0%) | 0 (0.0%) |
| 5 to 17 Years | 0 (0.0%) | 0 (0.0%) |
| 18 to 34 Years | 4 (1.3%) | 31 (6.8%) |
| 35 to 64 Years | 94 (16.1%) | 104 (18.8%) |
| 65 to 74 Years | 0 (0.0%) | 7 (5.3%) |
| 75 Years and over | 6 (22.2%) | 8 (14.5%) |
Disability Class by Sex by Age in Vinton
Disability Class: Hearing Difficulty
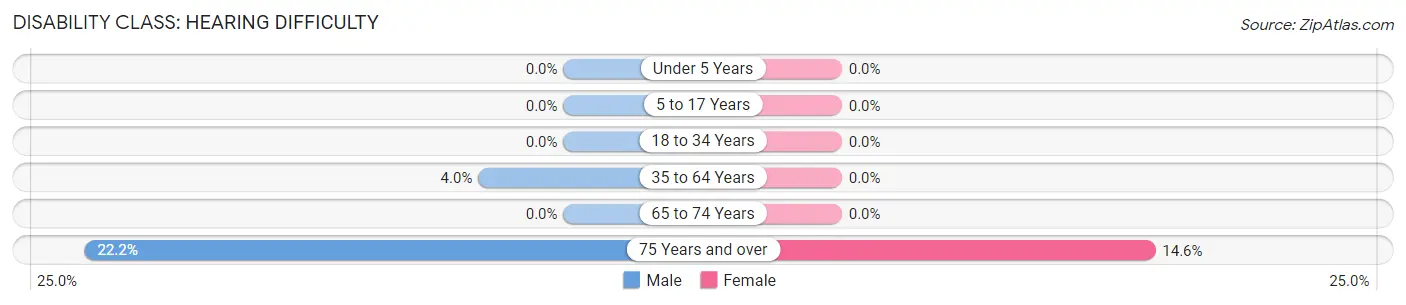
| Age Bracket | Male | Female |
| Under 5 Years | 0 (0.0%) | 0 (0.0%) |
| 5 to 17 Years | 0 (0.0%) | 0 (0.0%) |
| 18 to 34 Years | 0 (0.0%) | 0 (0.0%) |
| 35 to 64 Years | 23 (4.0%) | 0 (0.0%) |
| 65 to 74 Years | 0 (0.0%) | 0 (0.0%) |
| 75 Years and over | 6 (22.2%) | 8 (14.5%) |
Disability Class: Vision Difficulty
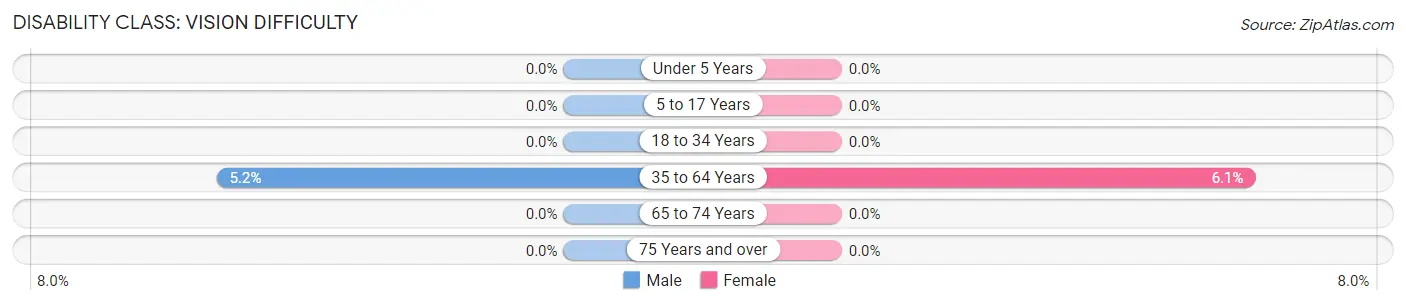
| Age Bracket | Male | Female |
| Under 5 Years | 0 (0.0%) | 0 (0.0%) |
| 5 to 17 Years | 0 (0.0%) | 0 (0.0%) |
| 18 to 34 Years | 0 (0.0%) | 0 (0.0%) |
| 35 to 64 Years | 30 (5.1%) | 34 (6.1%) |
| 65 to 74 Years | 0 (0.0%) | 0 (0.0%) |
| 75 Years and over | 0 (0.0%) | 0 (0.0%) |
Disability Class: Cognitive Difficulty
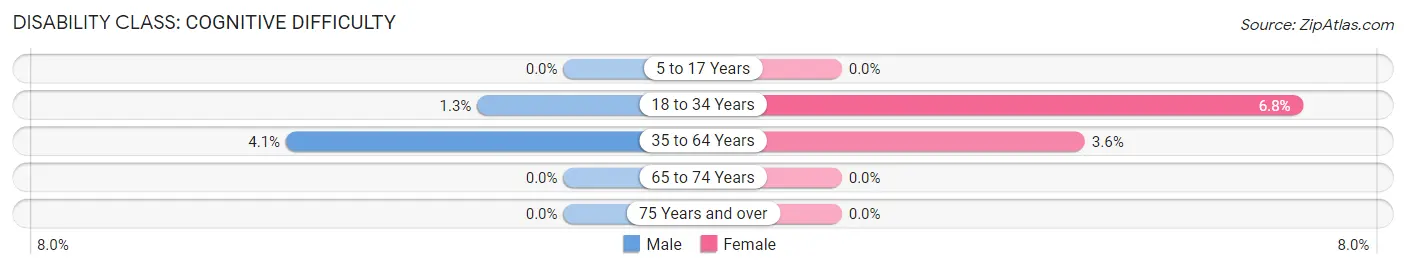
| Age Bracket | Male | Female |
| 5 to 17 Years | 0 (0.0%) | 0 (0.0%) |
| 18 to 34 Years | 4 (1.3%) | 31 (6.8%) |
| 35 to 64 Years | 24 (4.1%) | 20 (3.6%) |
| 65 to 74 Years | 0 (0.0%) | 0 (0.0%) |
| 75 Years and over | 0 (0.0%) | 0 (0.0%) |
Disability Class: Ambulatory Difficulty
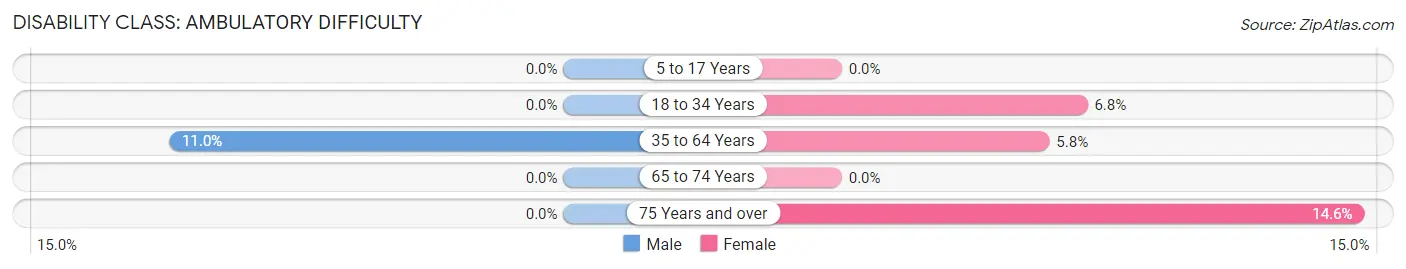
| Age Bracket | Male | Female |
| 5 to 17 Years | 0 (0.0%) | 0 (0.0%) |
| 18 to 34 Years | 0 (0.0%) | 31 (6.8%) |
| 35 to 64 Years | 64 (11.0%) | 32 (5.8%) |
| 65 to 74 Years | 0 (0.0%) | 0 (0.0%) |
| 75 Years and over | 0 (0.0%) | 8 (14.5%) |
Disability Class: Self-Care Difficulty
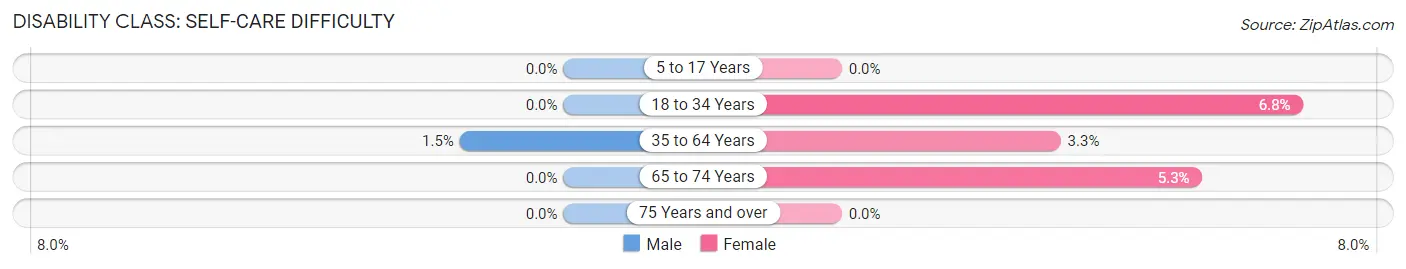
| Age Bracket | Male | Female |
| 5 to 17 Years | 0 (0.0%) | 0 (0.0%) |
| 18 to 34 Years | 0 (0.0%) | 31 (6.8%) |
| 35 to 64 Years | 9 (1.5%) | 18 (3.3%) |
| 65 to 74 Years | 0 (0.0%) | 7 (5.3%) |
| 75 Years and over | 0 (0.0%) | 0 (0.0%) |
Technology Access in Vinton
Computing Device Access in Vinton
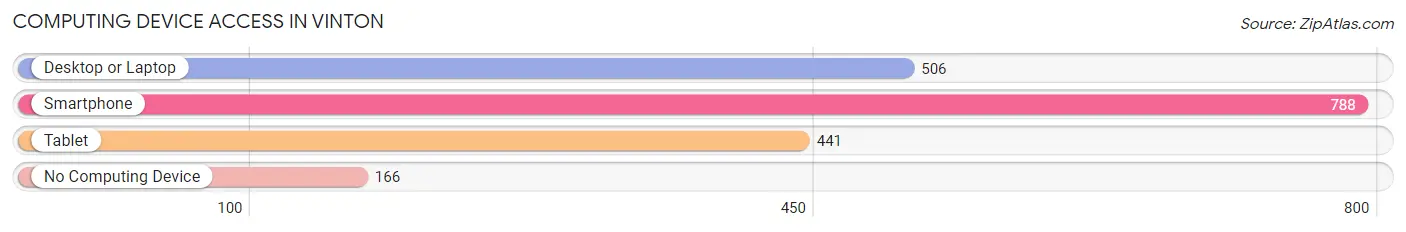
| Device Type | # Households | % Households |
| Desktop or Laptop | 506 | 50.7% |
| Smartphone | 788 | 79.0% |
| Tablet | 441 | 44.2% |
| No Computing Device | 166 | 16.6% |
| Total | 998 | 100.0% |
Internet Access in Vinton
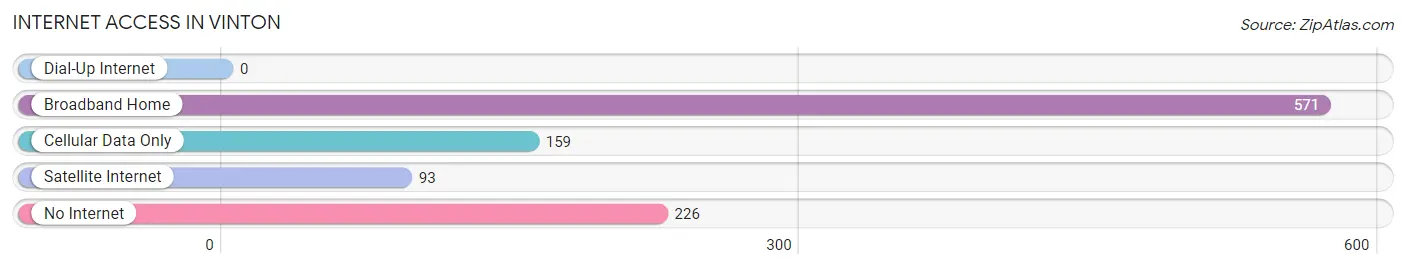
| Internet Type | # Households | % Households |
| Dial-Up Internet | 0 | 0.0% |
| Broadband Home | 571 | 57.2% |
| Cellular Data Only | 159 | 15.9% |
| Satellite Internet | 93 | 9.3% |
| No Internet | 226 | 22.7% |
| Total | 998 | 100.0% |
Vinton Summary
Vinton, Louisiana is a small town located in the southwestern corner of the state, near the Texas border. It is part of Calcasieu Parish and is situated on the banks of the Sabine River. The town was founded in 1883 and has a population of approximately 3,000 people.
Geography
Vinton is located in the southwestern corner of Louisiana, near the Texas border. It is part of Calcasieu Parish and is situated on the banks of the Sabine River. The town is located in the humid subtropical climate zone, with hot, humid summers and mild winters. The average annual temperature is around 70 degrees Fahrenheit. The town is located in the Sabine National Forest, which is home to a variety of wildlife, including deer, wild turkeys, and alligators.
Economy
Vinton’s economy is largely based on the oil and gas industry. The town is home to several oil and gas companies, including Chevron, Shell, and ExxonMobil. The town is also home to several manufacturing companies, including a paper mill and a chemical plant. The town is also home to several retail stores, restaurants, and other businesses.
Demographics
As of the 2010 census, Vinton had a population of 3,000 people. The racial makeup of the town was 79.2% White, 17.2% African American, 0.7% Native American, 0.3% Asian, 0.1% Pacific Islander, and 2.5% from other races. The median household income was $37,000, and the median family income was $45,000. The town’s poverty rate was 17.2%.
History
Vinton was founded in 1883 by a group of settlers from Texas. The town was named after a local landowner, William Vinton. The town quickly grew and became a center for the oil and gas industry. In the early 1900s, the town was home to several large oil refineries. The town was also home to a paper mill and a chemical plant.
In the 1950s, the town began to decline as the oil and gas industry moved away. The town’s population decreased and many businesses closed. In the late 1970s, the town began to experience a resurgence as the oil and gas industry returned. The town’s population began to grow again and new businesses opened.
Today, Vinton is a small town with a population of approximately 3,000 people. The town is home to several oil and gas companies, manufacturing companies, and other businesses. The town is also home to several retail stores, restaurants, and other businesses. The town is a popular tourist destination, with several parks, museums, and other attractions.
Common Questions
What is Per Capita Income in Vinton?
Per Capita income in Vinton is $16,725.
What is the Median Family Income in Vinton?
Median Family Income in Vinton is $45,156.
What is the Median Household income in Vinton?
Median Household Income in Vinton is $40,859.
What is Income or Wage Gap in Vinton?
Income or Wage Gap in Vinton is 44.5%.
Women in Vinton earn 55.5 cents for every dollar earned by a man.
What is Family Income Deficit in Vinton?
Family Income Deficit in Vinton is $10,526.
Families that are below poverty line in Vinton earn $10,526 less on average than the poverty threshold level.
What is Inequality or Gini Index in Vinton?
Inequality or Gini Index in Vinton is 0.42.
What is the Total Population of Vinton?
Total Population of Vinton is 3,314.
What is the Total Male Population of Vinton?
Total Male Population of Vinton is 1,709.
What is the Total Female Population of Vinton?
Total Female Population of Vinton is 1,605.
What is the Ratio of Males per 100 Females in Vinton?
There are 106.48 Males per 100 Females in Vinton.
What is the Ratio of Females per 100 Males in Vinton?
There are 93.91 Females per 100 Males in Vinton.
What is the Median Population Age in Vinton?
Median Population Age in Vinton is 33.6 Years.
What is the Average Family Size in Vinton
Average Family Size in Vinton is 4.4 People.
What is the Average Household Size in Vinton
Average Household Size in Vinton is 3.3 People.
How Large is the Labor Force in Vinton?
There are 1,220 People in the Labor Forcein in Vinton.
What is the Percentage of People in the Labor Force in Vinton?
52.8% of People are in the Labor Force in Vinton.
What is the Unemployment Rate in Vinton?
Unemployment Rate in Vinton is 1.4%.