Tickfaw, LA Map & Demographics
Tickfaw Map
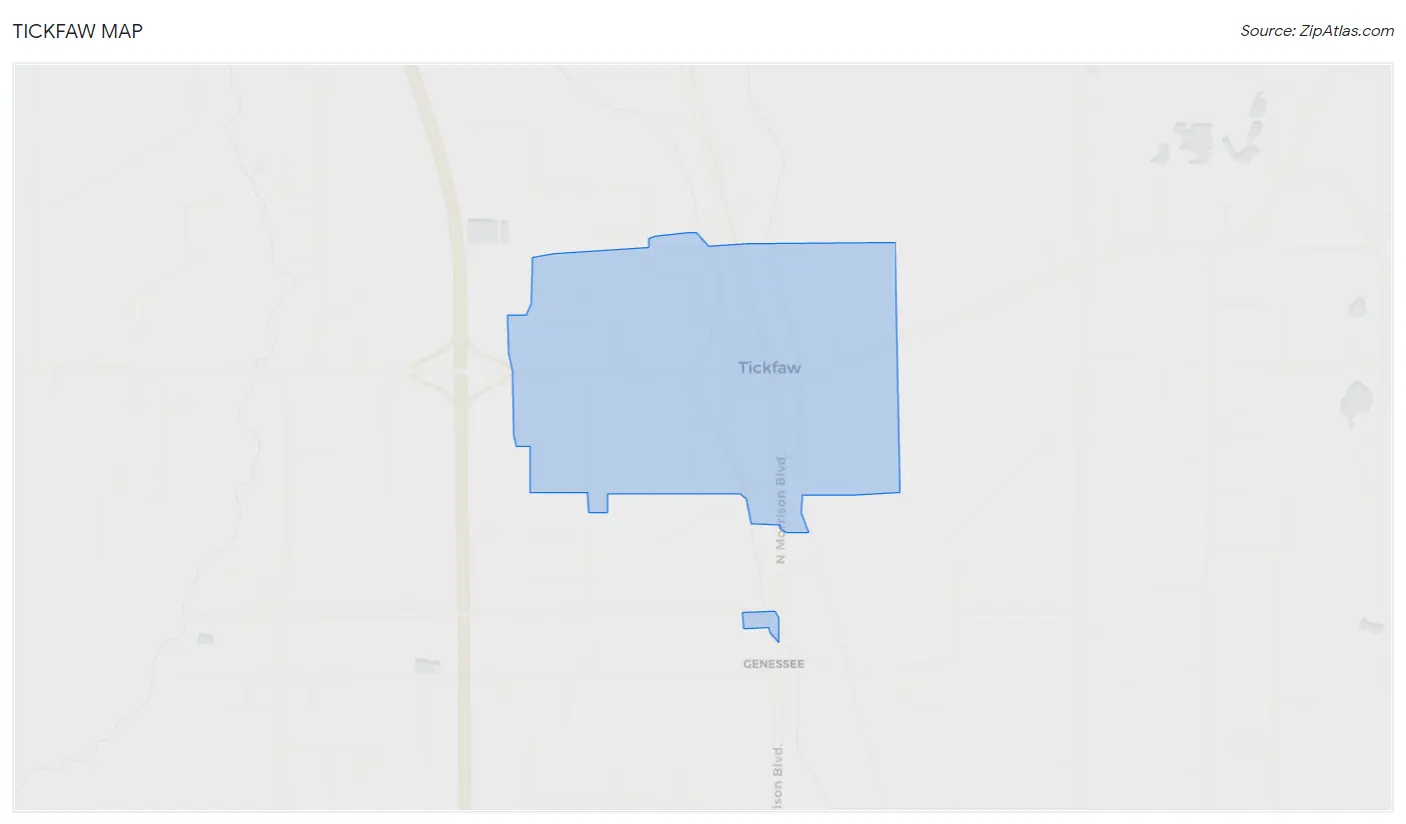
Tickfaw Overview
$21,000
PER CAPITA INCOME
$79,583
AVG FAMILY INCOME
$48,281
AVG HOUSEHOLD INCOME
32.4%
WAGE / INCOME GAP [ % ]
67.6¢/ $1
WAGE / INCOME GAP [ $ ]
0.42
INEQUALITY / GINI INDEX
857
TOTAL POPULATION
443
MALE POPULATION
414
FEMALE POPULATION
107.00
MALES / 100 FEMALES
93.45
FEMALES / 100 MALES
28.9
MEDIAN AGE
4.2
AVG FAMILY SIZE
3.2
AVG HOUSEHOLD SIZE
416
LABOR FORCE [ PEOPLE ]
63.8%
PERCENT IN LABOR FORCE
3.8%
UNEMPLOYMENT RATE
Tickfaw Zip Codes
Tickfaw Area Codes
Income in Tickfaw
Income Overview in Tickfaw
Per Capita Income in Tickfaw is $21,000, while median incomes of families and households are $79,583 and $48,281 respectively.
| Characteristic | Number | Measure |
| Per Capita Income | 857 | $21,000 |
| Median Family Income | 167 | $79,583 |
| Mean Family Income | 167 | $77,604 |
| Median Household Income | 267 | $48,281 |
| Mean Household Income | 267 | $60,174 |
| Income Deficit | 167 | $0 |
| Wage / Income Gap (%) | 857 | 32.36% |
| Wage / Income Gap ($) | 857 | 67.64¢ per $1 |
| Gini / Inequality Index | 857 | 0.42 |
Earnings by Sex in Tickfaw
Average Earnings in Tickfaw are $24,750, $29,324 for men and $19,836 for women, a difference of 32.4%.
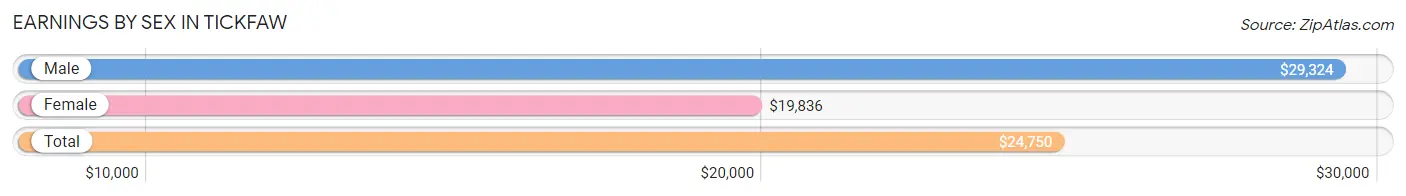
| Sex | Number | Average Earnings |
| Male | 242 (57.2%) | $29,324 |
| Female | 181 (42.8%) | $19,836 |
| Total | 423 (100.0%) | $24,750 |
Earnings by Sex by Income Bracket in Tickfaw
The most common earnings brackets in Tickfaw are $25,000 to $29,999 for men (37 | 15.3%) and $17,500 to $19,999 for women (38 | 21.0%).
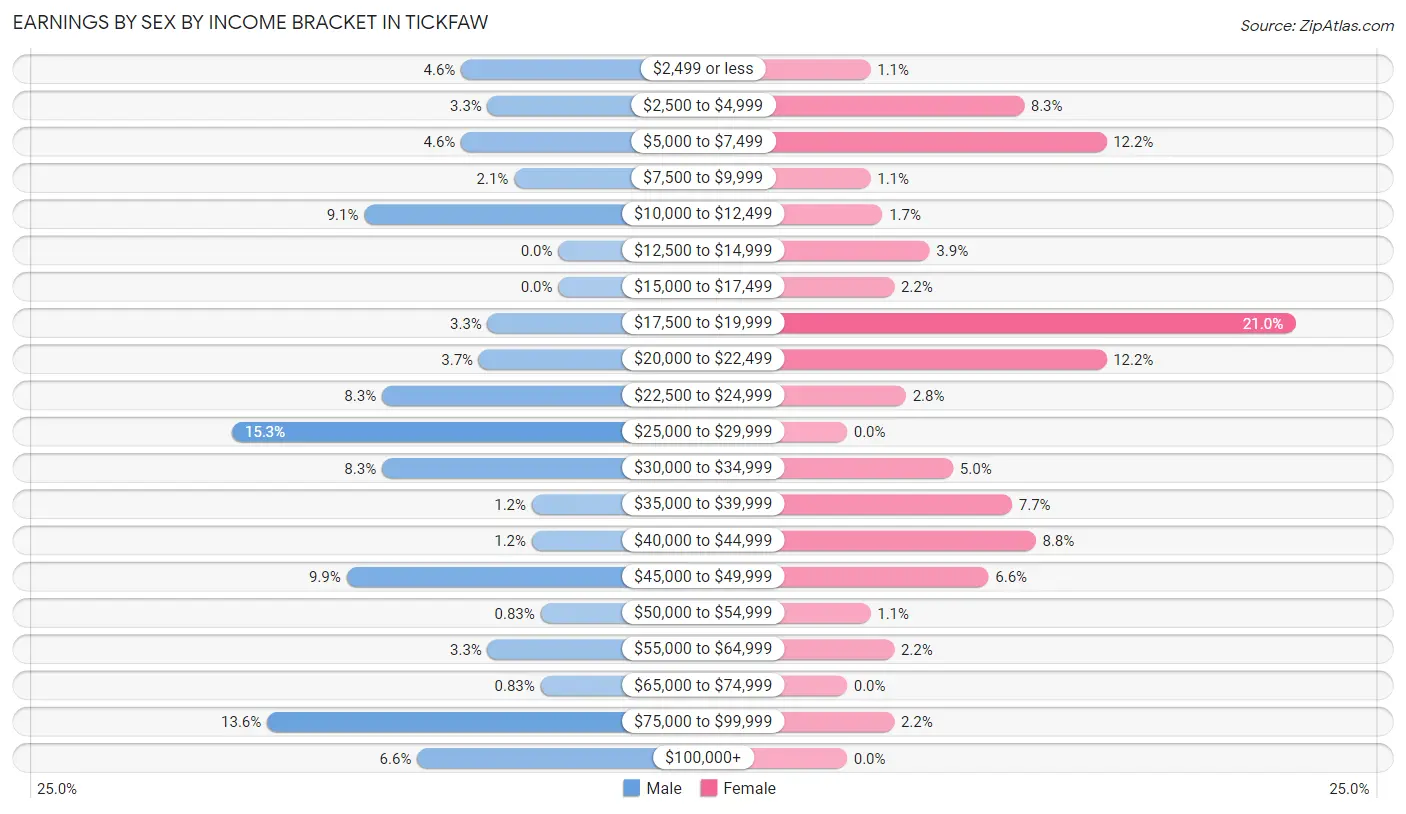
| Income | Male | Female |
| $2,499 or less | 11 (4.5%) | 2 (1.1%) |
| $2,500 to $4,999 | 8 (3.3%) | 15 (8.3%) |
| $5,000 to $7,499 | 11 (4.5%) | 22 (12.1%) |
| $7,500 to $9,999 | 5 (2.1%) | 2 (1.1%) |
| $10,000 to $12,499 | 22 (9.1%) | 3 (1.7%) |
| $12,500 to $14,999 | 0 (0.0%) | 7 (3.9%) |
| $15,000 to $17,499 | 0 (0.0%) | 4 (2.2%) |
| $17,500 to $19,999 | 8 (3.3%) | 38 (21.0%) |
| $20,000 to $22,499 | 9 (3.7%) | 22 (12.1%) |
| $22,500 to $24,999 | 20 (8.3%) | 5 (2.8%) |
| $25,000 to $29,999 | 37 (15.3%) | 0 (0.0%) |
| $30,000 to $34,999 | 20 (8.3%) | 9 (5.0%) |
| $35,000 to $39,999 | 3 (1.2%) | 14 (7.7%) |
| $40,000 to $44,999 | 3 (1.2%) | 16 (8.8%) |
| $45,000 to $49,999 | 24 (9.9%) | 12 (6.6%) |
| $50,000 to $54,999 | 2 (0.8%) | 2 (1.1%) |
| $55,000 to $64,999 | 8 (3.3%) | 4 (2.2%) |
| $65,000 to $74,999 | 2 (0.8%) | 0 (0.0%) |
| $75,000 to $99,999 | 33 (13.6%) | 4 (2.2%) |
| $100,000+ | 16 (6.6%) | 0 (0.0%) |
| Total | 242 (100.0%) | 181 (100.0%) |
Earnings by Sex by Educational Attainment in Tickfaw
Average earnings in Tickfaw are $38,750 for men and $20,313 for women, a difference of 47.6%. Men with an educational attainment of college or associate's degree enjoy the highest average annual earnings of $47,039, while those with college or associate's degree education earn the least with $47,039. Women with an educational attainment of bachelor's degree earn the most with the average annual earnings of $41,964, while those with less than high school education have the smallest earnings of $16,250.
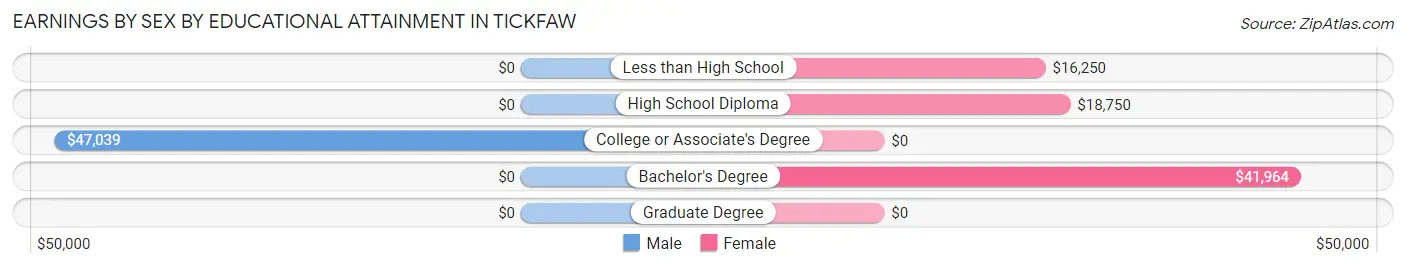
| Educational Attainment | Male Income | Female Income |
| Less than High School | - | - |
| High School Diploma | - | - |
| College or Associate's Degree | $47,039 | $0 |
| Bachelor's Degree | - | - |
| Graduate Degree | - | - |
| Total | $38,750 | $20,313 |
Family Income in Tickfaw
Family Income Brackets in Tickfaw
According to the Tickfaw family income data, there are 41 families falling into the $75,000 to $99,999 income range, which is the most common income bracket and makes up 24.5% of all families. Conversely, the $200,000+ income bracket is the least frequent group with only 2 families (1.2%) belonging to this category.
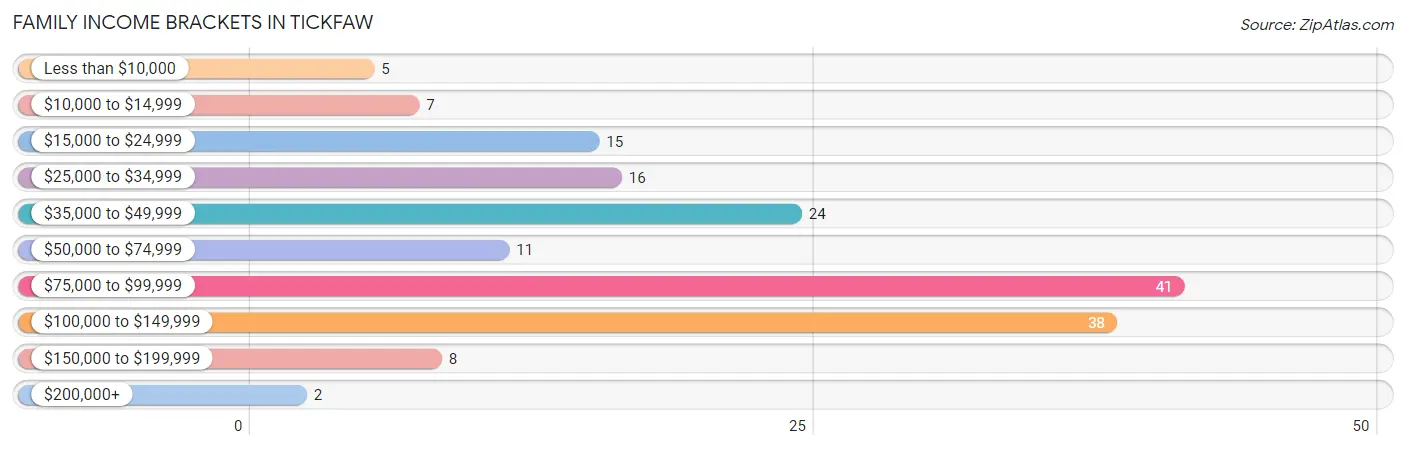
| Income Bracket | # Families | % Families |
| Less than $10,000 | 5 | 3.0% |
| $10,000 to $14,999 | 7 | 4.2% |
| $15,000 to $24,999 | 15 | 9.0% |
| $25,000 to $34,999 | 16 | 9.6% |
| $35,000 to $49,999 | 24 | 14.4% |
| $50,000 to $74,999 | 11 | 6.6% |
| $75,000 to $99,999 | 41 | 24.6% |
| $100,000 to $149,999 | 38 | 22.8% |
| $150,000 to $199,999 | 8 | 4.8% |
| $200,000+ | 2 | 1.2% |
Family Income by Famaliy Size in Tickfaw
3-person families (56 | 33.5%) account for the highest median family income in Tickfaw with $122,857 per family, while 3-person families (56 | 33.5%) have the highest median income of $40,952 per family member.
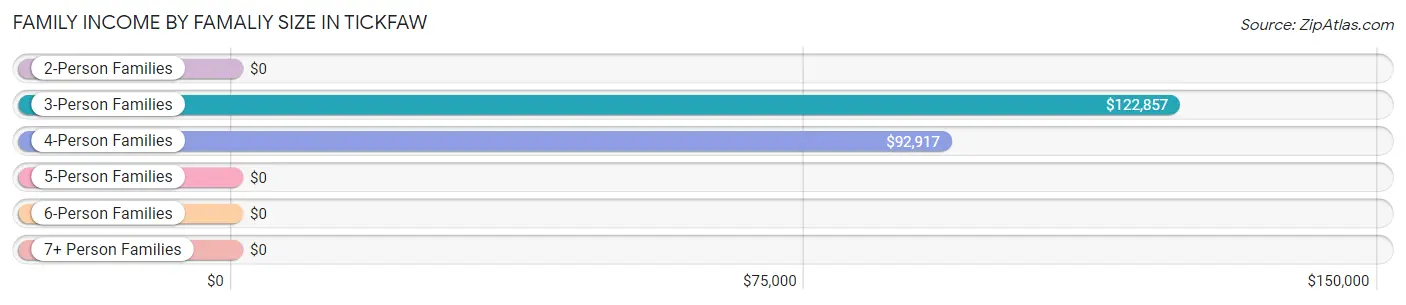
| Income Bracket | # Families | Median Income |
| 2-Person Families | 52 (31.1%) | $0 |
| 3-Person Families | 56 (33.5%) | $122,857 |
| 4-Person Families | 27 (16.2%) | $92,917 |
| 5-Person Families | 4 (2.4%) | $0 |
| 6-Person Families | 11 (6.6%) | $0 |
| 7+ Person Families | 17 (10.2%) | $0 |
| Total | 167 (100.0%) | $79,583 |
Family Income by Number of Earners in Tickfaw
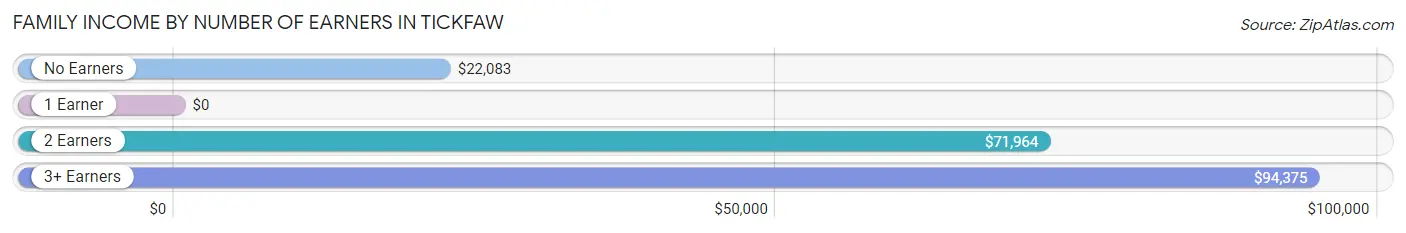
| Number of Earners | # Families | Median Income |
| No Earners | 37 (22.2%) | $22,083 |
| 1 Earner | 27 (16.2%) | $0 |
| 2 Earners | 53 (31.7%) | $71,964 |
| 3+ Earners | 50 (29.9%) | $94,375 |
| Total | 167 (100.0%) | $79,583 |
Household Income in Tickfaw
Household Income Brackets in Tickfaw
With 53 households falling in the category, the $75,000 to $99,999 income range is the most frequent in Tickfaw, accounting for 19.9% of all households. In contrast, only 2 households (0.7%) fall into the $200,000+ income bracket, making it the least populous group.
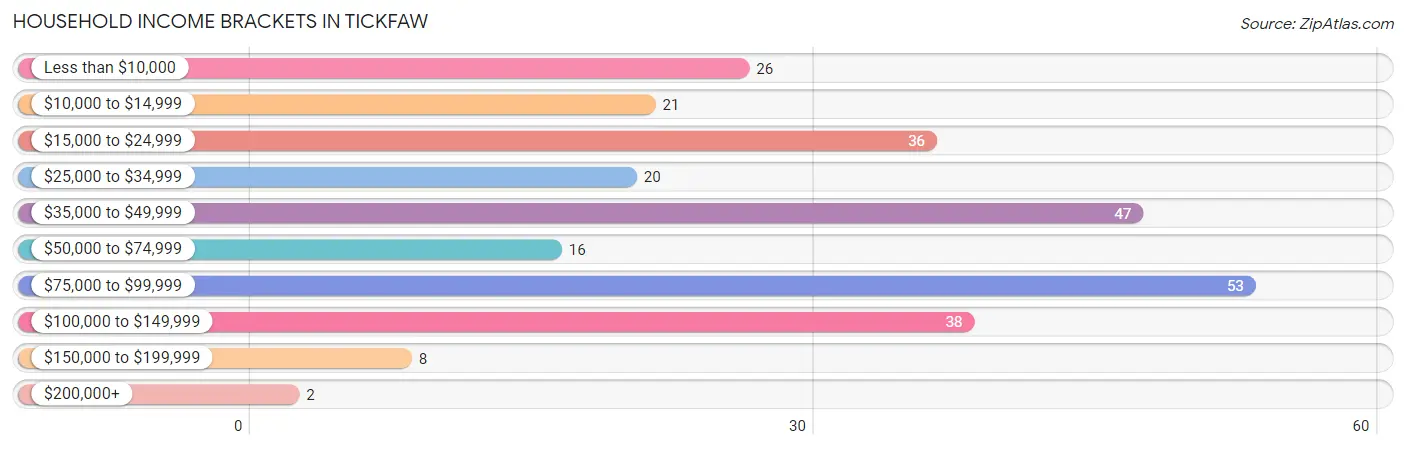
| Income Bracket | # Households | % Households |
| Less than $10,000 | 26 | 9.7% |
| $10,000 to $14,999 | 21 | 7.9% |
| $15,000 to $24,999 | 36 | 13.5% |
| $25,000 to $34,999 | 20 | 7.5% |
| $35,000 to $49,999 | 47 | 17.6% |
| $50,000 to $74,999 | 16 | 6.0% |
| $75,000 to $99,999 | 53 | 19.9% |
| $100,000 to $149,999 | 38 | 14.2% |
| $150,000 to $199,999 | 8 | 3.0% |
| $200,000+ | 2 | 0.7% |
Household Income by Householder Age in Tickfaw
The median household income in Tickfaw is $48,281, with the highest median household income of $89,375 found in the 25 to 44 years age bracket for the primary householder. A total of 65 households (24.3%) fall into this category. Meanwhile, the 15 to 24 years age bracket for the primary householder has the lowest median household income of $0, with 16 households (6.0%) in this group.
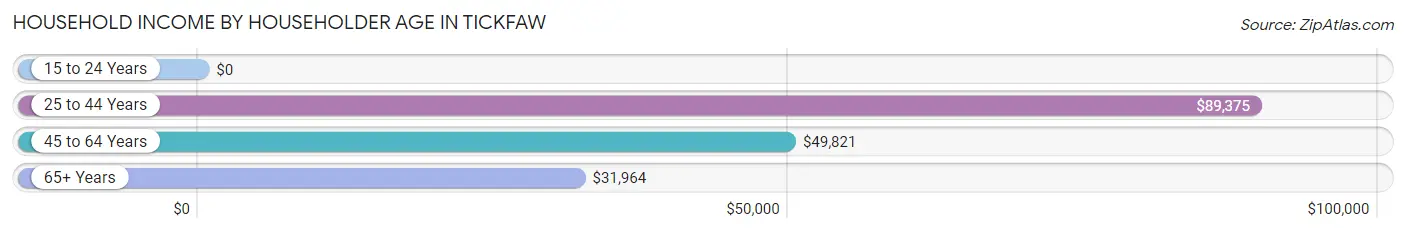
| Income Bracket | # Households | Median Income |
| 15 to 24 Years | 16 (6.0%) | $0 |
| 25 to 44 Years | 65 (24.3%) | $89,375 |
| 45 to 64 Years | 117 (43.8%) | $49,821 |
| 65+ Years | 69 (25.8%) | $31,964 |
| Total | 267 (100.0%) | $48,281 |
Poverty in Tickfaw
Income Below Poverty by Sex and Age in Tickfaw
With 17.0% poverty level for males and 20.7% for females among the residents of Tickfaw, 15 year old males and 25 to 34 year old females are the most vulnerable to poverty, with 5 males (45.5%) and 21 females (47.7%) in their respective age groups living below the poverty level.
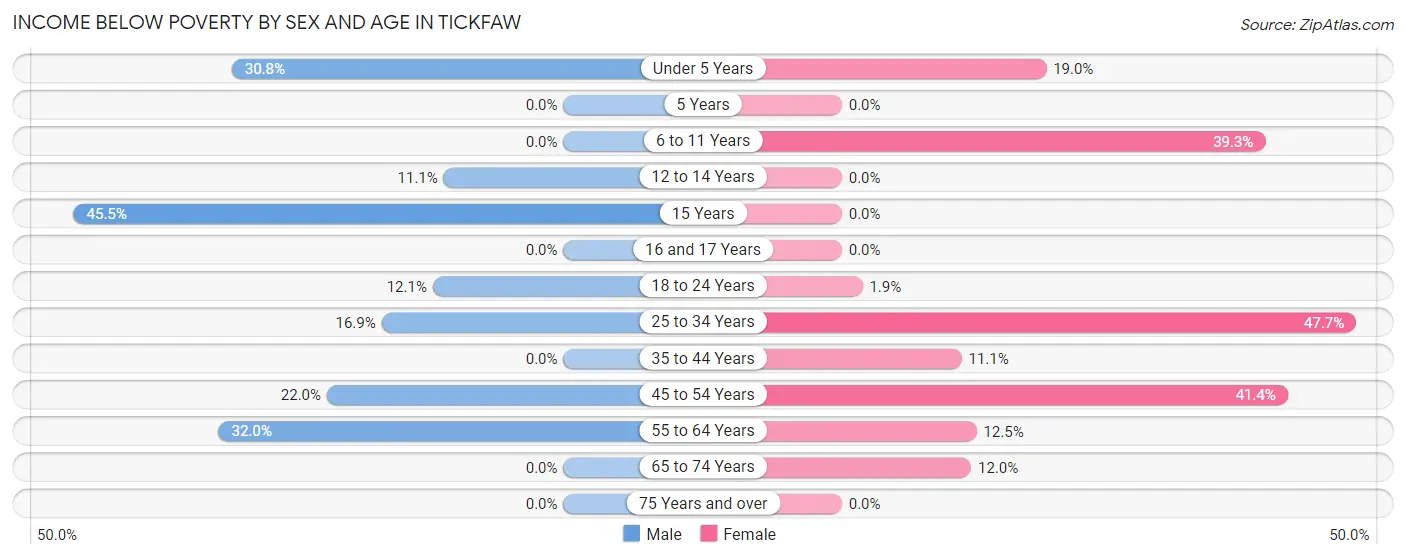
| Age Bracket | Male | Female |
| Under 5 Years | 12 (30.8%) | 11 (19.0%) |
| 5 Years | 0 (0.0%) | 0 (0.0%) |
| 6 to 11 Years | 0 (0.0%) | 11 (39.3%) |
| 12 to 14 Years | 2 (11.1%) | 0 (0.0%) |
| 15 Years | 5 (45.5%) | 0 (0.0%) |
| 16 and 17 Years | 0 (0.0%) | 0 (0.0%) |
| 18 to 24 Years | 8 (12.1%) | 1 (1.9%) |
| 25 to 34 Years | 14 (16.9%) | 21 (47.7%) |
| 35 to 44 Years | 0 (0.0%) | 3 (11.1%) |
| 45 to 54 Years | 9 (22.0%) | 24 (41.4%) |
| 55 to 64 Years | 24 (32.0%) | 7 (12.5%) |
| 65 to 74 Years | 0 (0.0%) | 6 (12.0%) |
| 75 Years and over | 0 (0.0%) | 0 (0.0%) |
| Total | 74 (17.0%) | 84 (20.7%) |
Income Above Poverty by Sex and Age in Tickfaw
According to the poverty statistics in Tickfaw, males aged 5 years and females aged 5 years are the age groups that are most secure financially, with 100.0% of males and 100.0% of females in these age groups living above the poverty line.
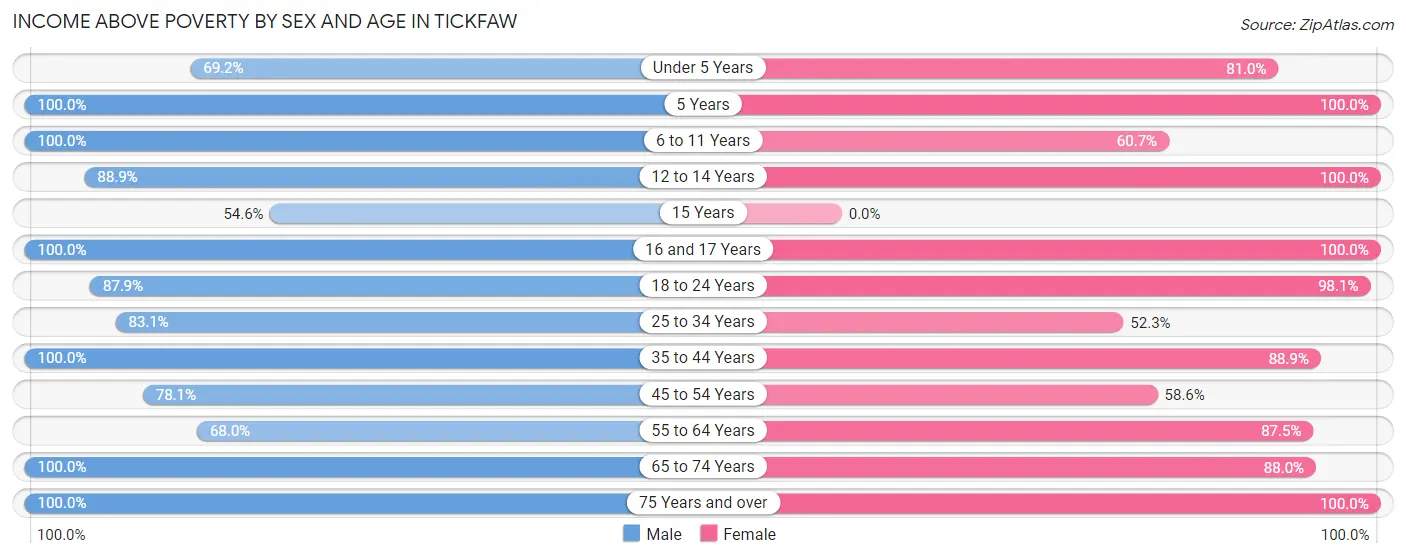
| Age Bracket | Male | Female |
| Under 5 Years | 27 (69.2%) | 47 (81.0%) |
| 5 Years | 5 (100.0%) | 2 (100.0%) |
| 6 to 11 Years | 18 (100.0%) | 17 (60.7%) |
| 12 to 14 Years | 16 (88.9%) | 9 (100.0%) |
| 15 Years | 6 (54.5%) | 0 (0.0%) |
| 16 and 17 Years | 11 (100.0%) | 2 (100.0%) |
| 18 to 24 Years | 58 (87.9%) | 51 (98.1%) |
| 25 to 34 Years | 69 (83.1%) | 23 (52.3%) |
| 35 to 44 Years | 38 (100.0%) | 24 (88.9%) |
| 45 to 54 Years | 32 (78.0%) | 34 (58.6%) |
| 55 to 64 Years | 51 (68.0%) | 49 (87.5%) |
| 65 to 74 Years | 23 (100.0%) | 44 (88.0%) |
| 75 Years and over | 7 (100.0%) | 19 (100.0%) |
| Total | 361 (83.0%) | 321 (79.3%) |
Income Below Poverty Among Married-Couple Families in Tickfaw
The poverty statistics for married-couple families in Tickfaw show that 5.1% or 7 of the total 138 families live below the poverty line. Families with 1 or 2 children have the highest poverty rate of 12.9%, comprising of 4 families. On the other hand, families with no children have the lowest poverty rate of 0.0%, which includes 0 families.
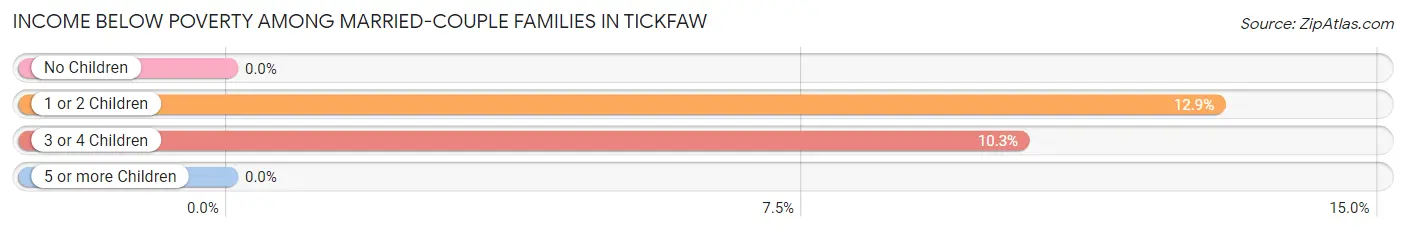
| Children | Above Poverty | Below Poverty |
| No Children | 76 (100.0%) | 0 (0.0%) |
| 1 or 2 Children | 27 (87.1%) | 4 (12.9%) |
| 3 or 4 Children | 26 (89.7%) | 3 (10.3%) |
| 5 or more Children | 2 (100.0%) | 0 (0.0%) |
| Total | 131 (94.9%) | 7 (5.1%) |
Income Below Poverty Among Single-Parent Households in Tickfaw
According to the poverty data in Tickfaw, 66.7% or 6 single-father households and 40.0% or 8 single-mother households are living below the poverty line. Among single-father households, those with no children have the highest poverty rate, with 6 households (66.7%) experiencing poverty. Likewise, among single-mother households, those with 3 or 4 children have the highest poverty rate, with 7 households (100.0%) falling below the poverty line.
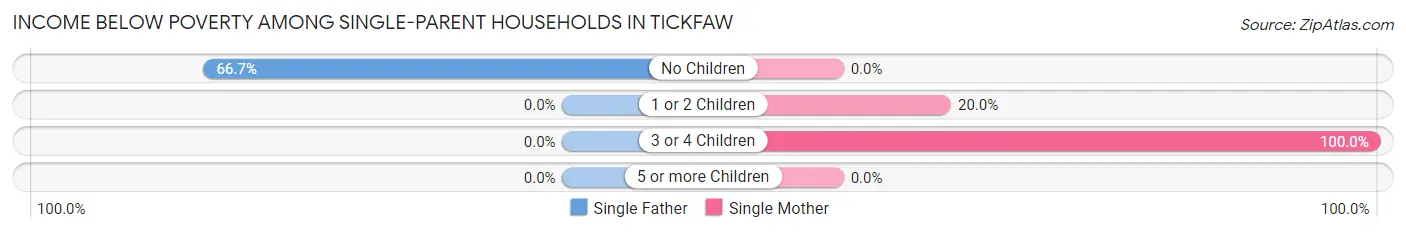
| Children | Single Father | Single Mother |
| No Children | 6 (66.7%) | 0 (0.0%) |
| 1 or 2 Children | 0 (0.0%) | 1 (20.0%) |
| 3 or 4 Children | 0 (0.0%) | 7 (100.0%) |
| 5 or more Children | 0 (0.0%) | 0 (0.0%) |
| Total | 6 (66.7%) | 8 (40.0%) |
Income Below Poverty Among Married-Couple vs Single-Parent Households in Tickfaw
The poverty data for Tickfaw shows that 7 of the married-couple family households (5.1%) and 14 of the single-parent households (48.3%) are living below the poverty level. Within the married-couple family households, those with 1 or 2 children have the highest poverty rate, with 4 households (12.9%) falling below the poverty line. Among the single-parent households, those with 3 or 4 children have the highest poverty rate, with 7 household (100.0%) living below poverty.
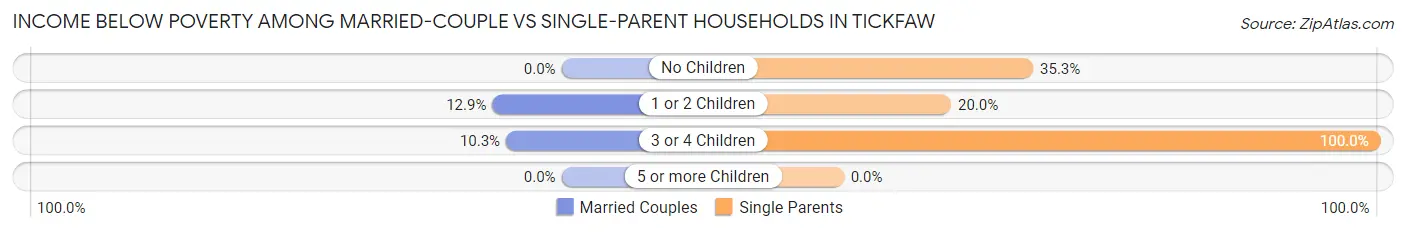
| Children | Married-Couple Families | Single-Parent Households |
| No Children | 0 (0.0%) | 6 (35.3%) |
| 1 or 2 Children | 4 (12.9%) | 1 (20.0%) |
| 3 or 4 Children | 3 (10.3%) | 7 (100.0%) |
| 5 or more Children | 0 (0.0%) | 0 (0.0%) |
| Total | 7 (5.1%) | 14 (48.3%) |
Race in Tickfaw
The most populous races in Tickfaw are White / Caucasian (651 | 76.0%), Black / African American (172 | 20.1%), and Hispanic or Latino (139 | 16.2%).
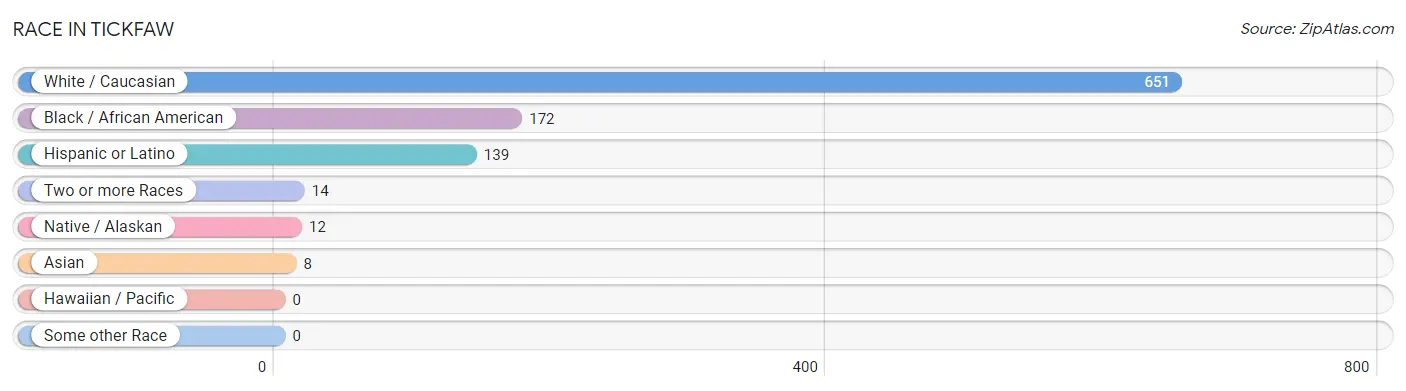
| Race | # Population | % Population |
| Asian | 8 | 0.9% |
| Black / African American | 172 | 20.1% |
| Hawaiian / Pacific | 0 | 0.0% |
| Hispanic or Latino | 139 | 16.2% |
| Native / Alaskan | 12 | 1.4% |
| White / Caucasian | 651 | 76.0% |
| Two or more Races | 14 | 1.6% |
| Some other Race | 0 | 0.0% |
| Total | 857 | 100.0% |
Ancestry in Tickfaw
The most populous ancestries reported in Tickfaw are Italian (206 | 24.0%), Mexican (134 | 15.6%), French (72 | 8.4%), German (32 | 3.7%), and American (24 | 2.8%), together accounting for 54.6% of all Tickfaw residents.
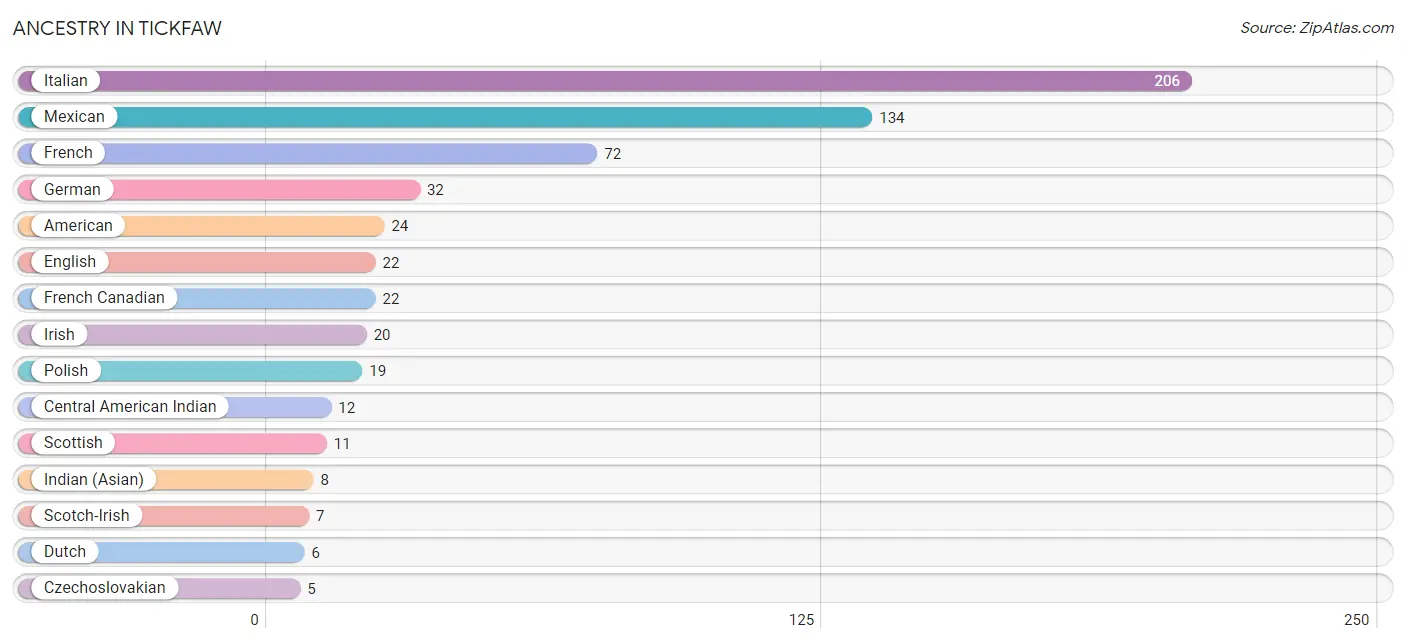
| Ancestry | # Population | % Population |
| American | 24 | 2.8% |
| Central American Indian | 12 | 1.4% |
| Czechoslovakian | 5 | 0.6% |
| Dutch | 6 | 0.7% |
| English | 22 | 2.6% |
| French | 72 | 8.4% |
| French Canadian | 22 | 2.6% |
| German | 32 | 3.7% |
| Icelander | 2 | 0.2% |
| Indian (Asian) | 8 | 0.9% |
| Irish | 20 | 2.3% |
| Italian | 206 | 24.0% |
| Mexican | 134 | 15.6% |
| Polish | 19 | 2.2% |
| Portuguese | 1 | 0.1% |
| Scotch-Irish | 7 | 0.8% |
| Scottish | 11 | 1.3% | View All 17 Rows |
Immigrants in Tickfaw
The most numerous immigrant groups reported in Tickfaw came from Central America (60 | 7.0%), Latin America (60 | 7.0%), Mexico (60 | 7.0%), Asia (6 | 0.7%), and China (6 | 0.7%), together accounting for 22.4% of all Tickfaw residents.
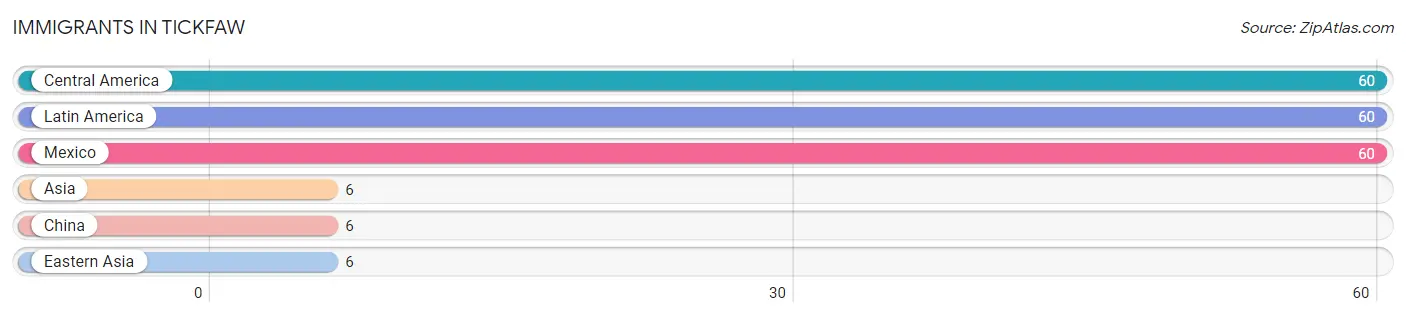
| Immigration Origin | # Population | % Population |
| Asia | 6 | 0.7% |
| Central America | 60 | 7.0% |
| China | 6 | 0.7% |
| Eastern Asia | 6 | 0.7% |
| Latin America | 60 | 7.0% |
| Mexico | 60 | 7.0% | View All 6 Rows |
Sex and Age in Tickfaw
Sex and Age in Tickfaw
The most populous age groups in Tickfaw are 25 to 29 Years (75 | 16.9%) for men and Under 5 Years (67 | 16.2%) for women.
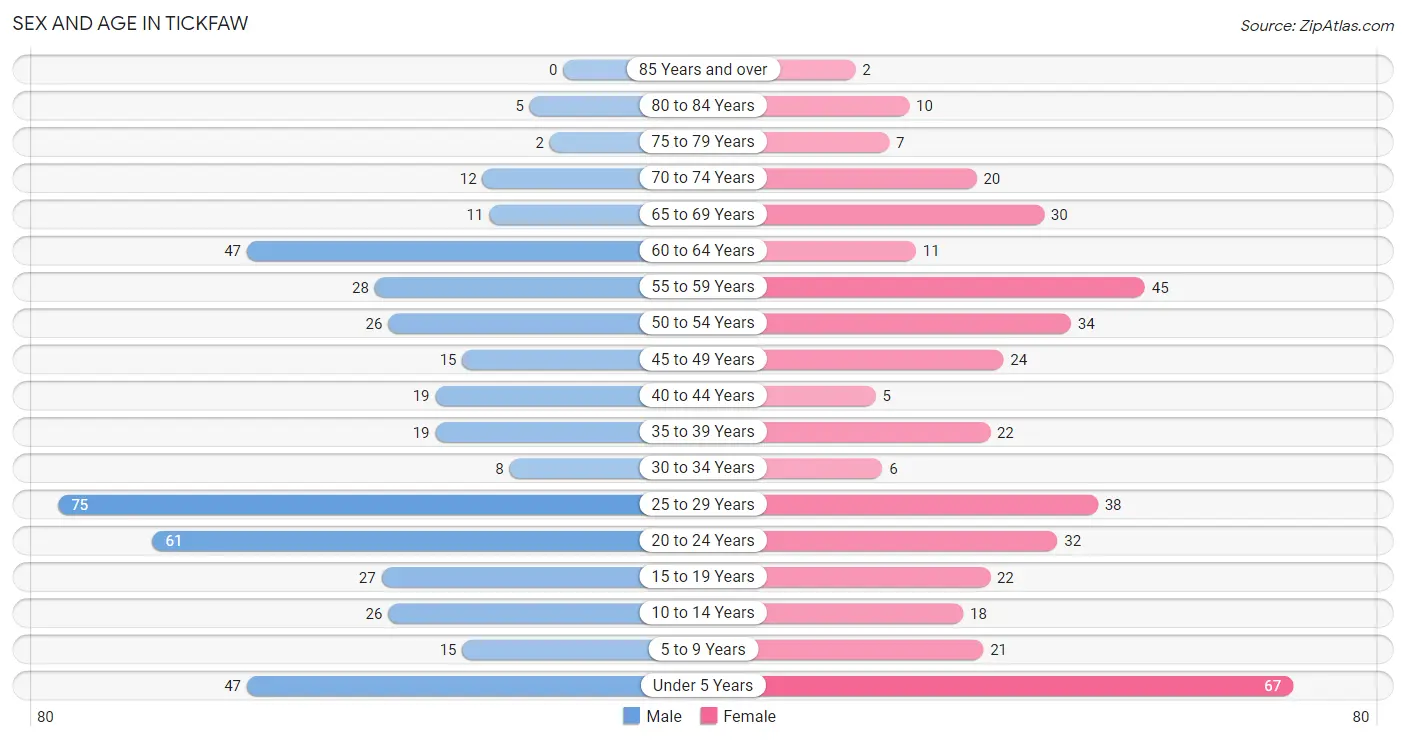
| Age Bracket | Male | Female |
| Under 5 Years | 47 (10.6%) | 67 (16.2%) |
| 5 to 9 Years | 15 (3.4%) | 21 (5.1%) |
| 10 to 14 Years | 26 (5.9%) | 18 (4.3%) |
| 15 to 19 Years | 27 (6.1%) | 22 (5.3%) |
| 20 to 24 Years | 61 (13.8%) | 32 (7.7%) |
| 25 to 29 Years | 75 (16.9%) | 38 (9.2%) |
| 30 to 34 Years | 8 (1.8%) | 6 (1.5%) |
| 35 to 39 Years | 19 (4.3%) | 22 (5.3%) |
| 40 to 44 Years | 19 (4.3%) | 5 (1.2%) |
| 45 to 49 Years | 15 (3.4%) | 24 (5.8%) |
| 50 to 54 Years | 26 (5.9%) | 34 (8.2%) |
| 55 to 59 Years | 28 (6.3%) | 45 (10.9%) |
| 60 to 64 Years | 47 (10.6%) | 11 (2.7%) |
| 65 to 69 Years | 11 (2.5%) | 30 (7.2%) |
| 70 to 74 Years | 12 (2.7%) | 20 (4.8%) |
| 75 to 79 Years | 2 (0.4%) | 7 (1.7%) |
| 80 to 84 Years | 5 (1.1%) | 10 (2.4%) |
| 85 Years and over | 0 (0.0%) | 2 (0.5%) |
| Total | 443 (100.0%) | 414 (100.0%) |
Families and Households in Tickfaw
Median Family Size in Tickfaw
The median family size in Tickfaw is 4.15 persons per family, with married-couple families (138 | 82.6%) accounting for the largest median family size of 4.3 persons per family. On the other hand, single male/father families (9 | 5.4%) represent the smallest median family size with 2.44 persons per family.
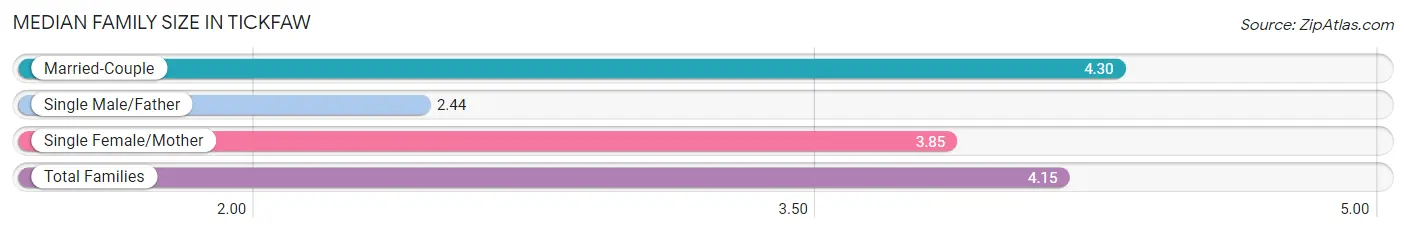
| Family Type | # Families | Family Size |
| Married-Couple | 138 (82.6%) | 4.30 |
| Single Male/Father | 9 (5.4%) | 2.44 |
| Single Female/Mother | 20 (12.0%) | 3.85 |
| Total Families | 167 (100.0%) | 4.15 |
Median Household Size in Tickfaw
The median household size in Tickfaw is 3.21 persons per household, with married-couple households (138 | 51.7%) accounting for the largest median household size of 4.3 persons per household. non-family households (100 | 37.4%) represent the smallest median household size with 1.64 persons per household.
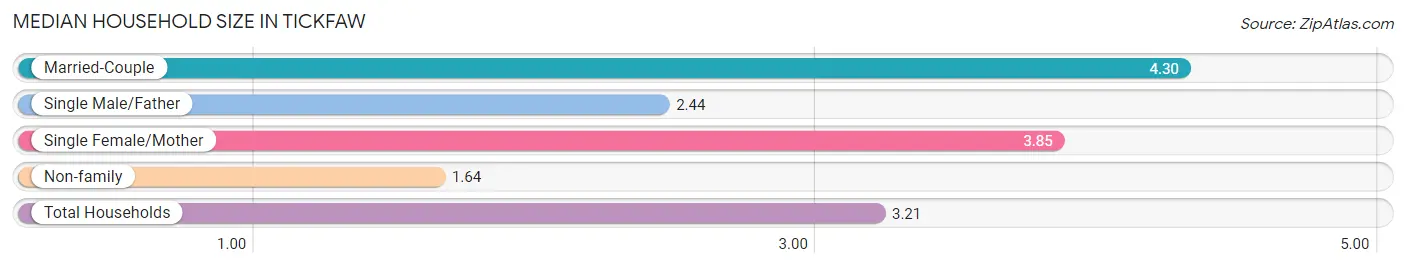
| Household Type | # Households | Household Size |
| Married-Couple | 138 (51.7%) | 4.30 |
| Single Male/Father | 9 (3.4%) | 2.44 |
| Single Female/Mother | 20 (7.5%) | 3.85 |
| Non-family | 100 (37.4%) | 1.64 |
| Total Households | 267 (100.0%) | 3.21 |
Household Size by Marriage Status in Tickfaw
Out of a total of 267 households in Tickfaw, 167 (62.5%) are family households, while 100 (37.4%) are nonfamily households. The most numerous type of family households are 3-person households, comprising 56, and the most common type of nonfamily households are 1-person households, comprising 81.
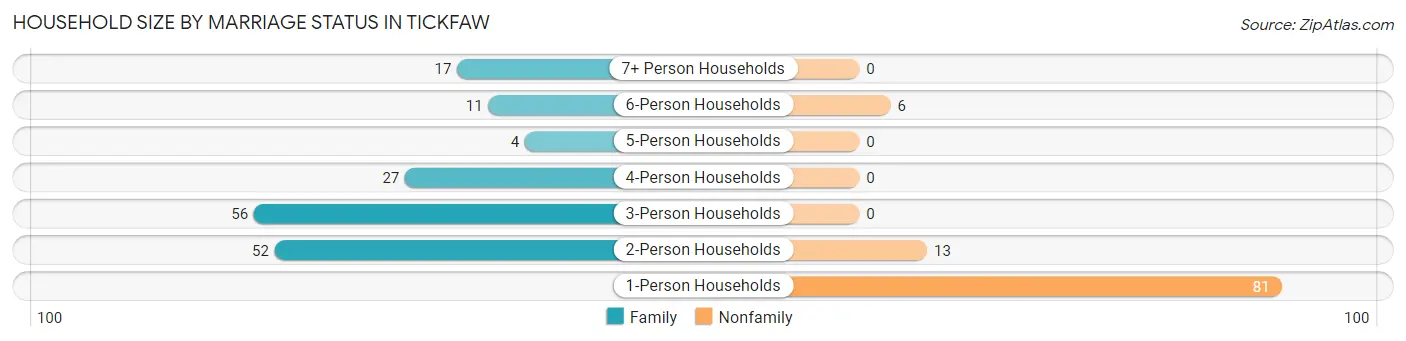
| Household Size | Family Households | Nonfamily Households |
| 1-Person Households | - | 81 (30.3%) |
| 2-Person Households | 52 (19.5%) | 13 (4.9%) |
| 3-Person Households | 56 (21.0%) | 0 (0.0%) |
| 4-Person Households | 27 (10.1%) | 0 (0.0%) |
| 5-Person Households | 4 (1.5%) | 0 (0.0%) |
| 6-Person Households | 11 (4.1%) | 6 (2.2%) |
| 7+ Person Households | 17 (6.4%) | 0 (0.0%) |
| Total | 167 (62.5%) | 100 (37.4%) |
Female Fertility in Tickfaw
Fertility by Age in Tickfaw
Average fertility rate in Tickfaw is 214.0 births per 1,000 women. Women in the age bracket of 20 to 34 years have the highest fertility rate with 447.0 births per 1,000 women. Women in the age bracket of 20 to 34 years acount for 100.0% of all women with births.
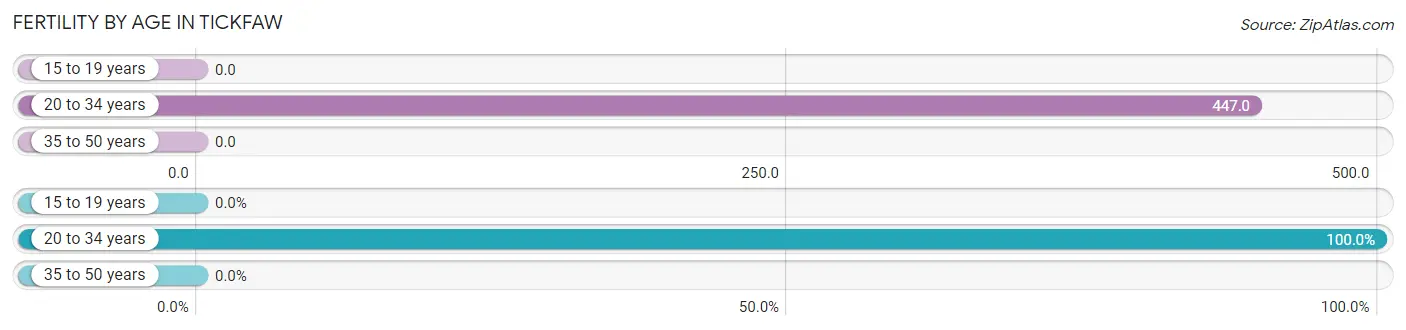
| Age Bracket | Women with Births | Births / 1,000 Women |
| 15 to 19 years | 0 (0.0%) | 0.0 |
| 20 to 34 years | 34 (100.0%) | 447.0 |
| 35 to 50 years | 0 (0.0%) | 0.0 |
| Total | 34 (100.0%) | 214.0 |
Fertility by Age by Marriage Status in Tickfaw
55.9% of women with births (34) in Tickfaw are married. The highest percentage of unmarried women with births falls into 20 to 34 years age bracket with 44.1% of them unmarried at the time of birth, while the lowest percentage of unmarried women with births belong to 20 to 34 years age bracket with 44.1% of them unmarried.
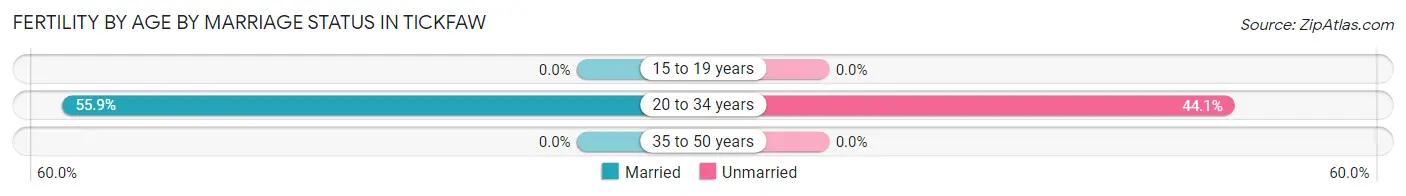
| Age Bracket | Married | Unmarried |
| 15 to 19 years | 0 (0.0%) | 0 (0.0%) |
| 20 to 34 years | 19 (55.9%) | 15 (44.1%) |
| 35 to 50 years | 0 (0.0%) | 0 (0.0%) |
| Total | 19 (55.9%) | 15 (44.1%) |
Fertility by Education in Tickfaw
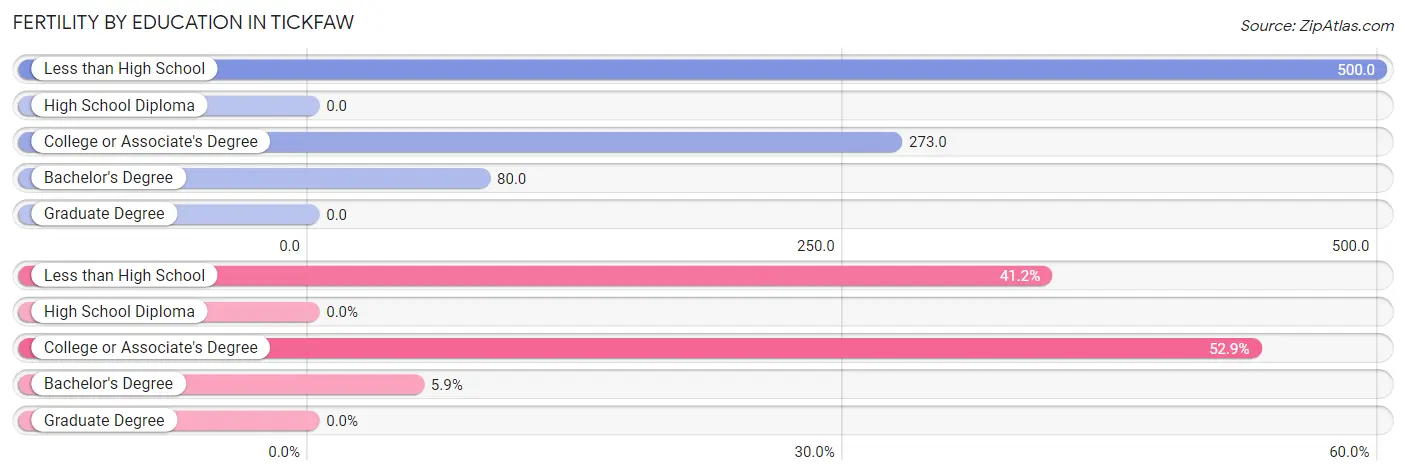
| Educational Attainment | Women with Births | Births / 1,000 Women |
| Less than High School | 14 (41.2%) | 500.0 |
| High School Diploma | 0 (0.0%) | 0.0 |
| College or Associate's Degree | 18 (52.9%) | 273.0 |
| Bachelor's Degree | 2 (5.9%) | 80.0 |
| Graduate Degree | 0 (0.0%) | 0.0 |
| Total | 34 (100.0%) | 214.0 |
Fertility by Education by Marriage Status in Tickfaw
44.1% of women with births in Tickfaw are unmarried. Women with the educational attainment of bachelor's degree are most likely to be married with 100.0% of them married at childbirth, while women with the educational attainment of less than high school are least likely to be married with 100.0% of them unmarried at childbirth.
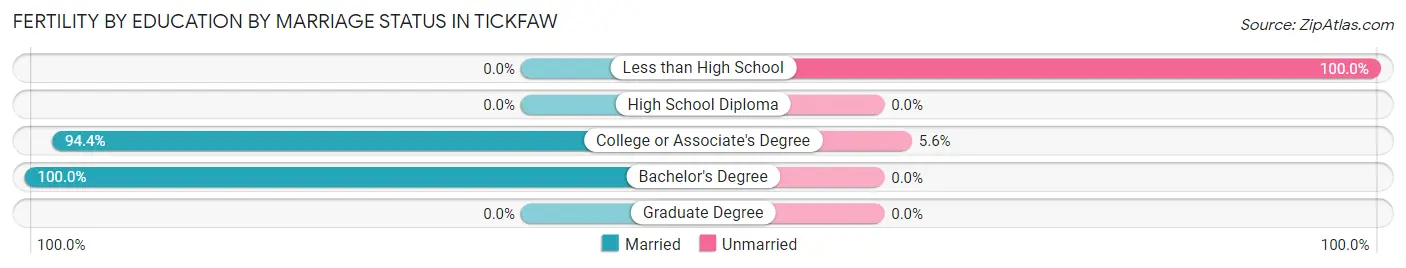
| Educational Attainment | Married | Unmarried |
| Less than High School | 0 (0.0%) | 14 (100.0%) |
| High School Diploma | 0 (0.0%) | 0 (0.0%) |
| College or Associate's Degree | 17 (94.4%) | 1 (5.6%) |
| Bachelor's Degree | 2 (100.0%) | 0 (0.0%) |
| Graduate Degree | 0 (0.0%) | 0 (0.0%) |
| Total | 19 (55.9%) | 15 (44.1%) |
Employment Characteristics in Tickfaw
Employment by Class of Employer in Tickfaw
Among the 386 employed individuals in Tickfaw, private company employees (267 | 69.2%), state government employees (45 | 11.7%), and local government employees (38 | 9.8%) make up the most common classes of employment.
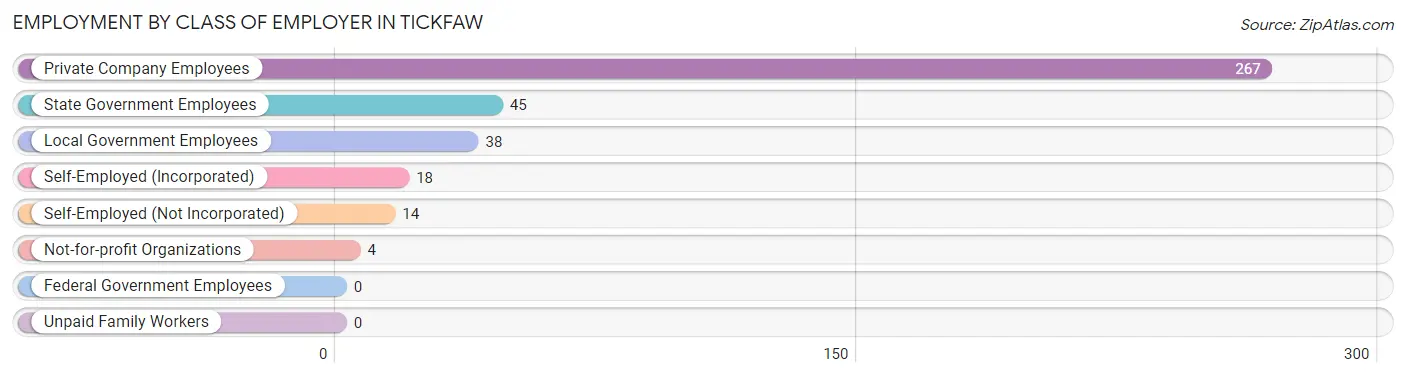
| Employer Class | # Employees | % Employees |
| Private Company Employees | 267 | 69.2% |
| Self-Employed (Incorporated) | 18 | 4.7% |
| Self-Employed (Not Incorporated) | 14 | 3.6% |
| Not-for-profit Organizations | 4 | 1.0% |
| Local Government Employees | 38 | 9.8% |
| State Government Employees | 45 | 11.7% |
| Federal Government Employees | 0 | 0.0% |
| Unpaid Family Workers | 0 | 0.0% |
| Total | 386 | 100.0% |
Employment Status by Age in Tickfaw
According to the labor force statistics for Tickfaw, out of the total population over 16 years of age (652), 63.8% or 416 individuals are in the labor force, with 3.8% or 16 of them unemployed. The age group with the highest labor force participation rate is 35 to 44 years, with 96.9% or 63 individuals in the labor force. Within the labor force, the 60 to 64 years age range has the highest percentage of unemployed individuals, with 25.0% or 3 of them being unemployed.
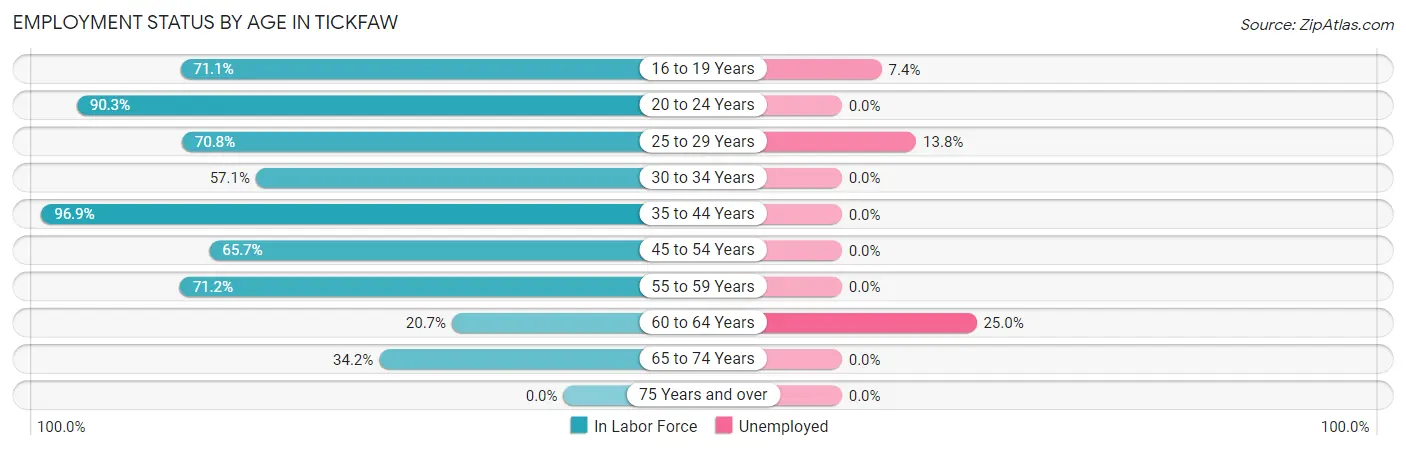
| Age Bracket | In Labor Force | Unemployed |
| 16 to 19 Years | 27 (71.1%) | 2 (7.4%) |
| 20 to 24 Years | 84 (90.3%) | 0 (0.0%) |
| 25 to 29 Years | 80 (70.8%) | 11 (13.8%) |
| 30 to 34 Years | 8 (57.1%) | 0 (0.0%) |
| 35 to 44 Years | 63 (96.9%) | 0 (0.0%) |
| 45 to 54 Years | 65 (65.7%) | 0 (0.0%) |
| 55 to 59 Years | 52 (71.2%) | 0 (0.0%) |
| 60 to 64 Years | 12 (20.7%) | 3 (25.0%) |
| 65 to 74 Years | 25 (34.2%) | 0 (0.0%) |
| 75 Years and over | 0 (0.0%) | 0 (0.0%) |
| Total | 416 (63.8%) | 16 (3.8%) |
Employment Status by Educational Attainment in Tickfaw
According to labor force statistics for Tickfaw, 66.4% of individuals (280) out of the total population between 25 and 64 years of age (422) are in the labor force, with 5.0% or 14 of them being unemployed. The group with the highest labor force participation rate are those with the educational attainment of bachelor's degree or higher, with 91.0% or 71 individuals in the labor force. Within the labor force, individuals with college / associate degree education have the highest percentage of unemployment, with 14.7% or 11 of them being unemployed.
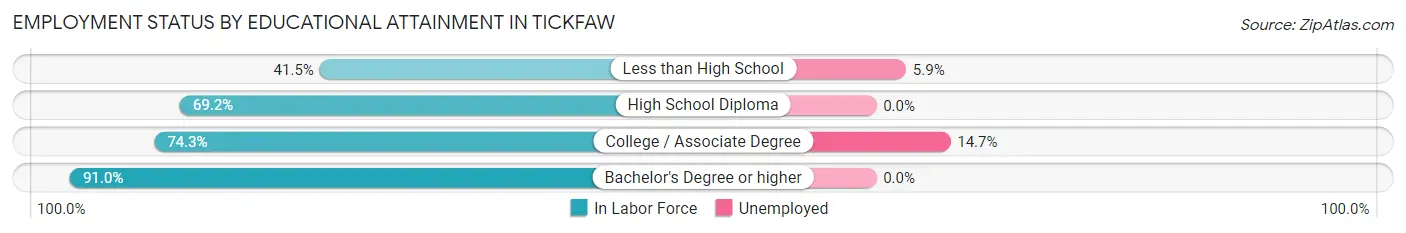
| Educational Attainment | In Labor Force | Unemployed |
| Less than High School | 51 (41.5%) | 7 (5.9%) |
| High School Diploma | 83 (69.2%) | 0 (0.0%) |
| College / Associate Degree | 75 (74.3%) | 15 (14.7%) |
| Bachelor's Degree or higher | 71 (91.0%) | 0 (0.0%) |
| Total | 280 (66.4%) | 21 (5.0%) |
Employment Occupations by Sex in Tickfaw
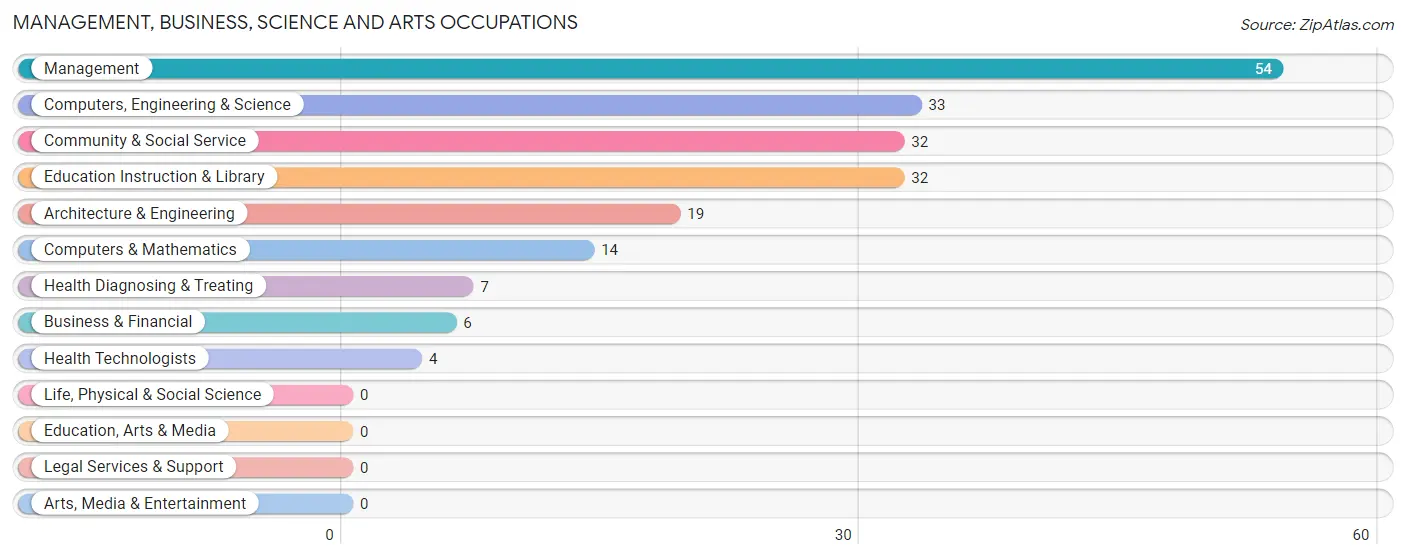
Management, Business, Science and Arts Occupations
The most common Management, Business, Science and Arts occupations in Tickfaw are Management (54 | 13.5%), Computers, Engineering & Science (33 | 8.3%), Community & Social Service (32 | 8.0%), Education Instruction & Library (32 | 8.0%), and Architecture & Engineering (19 | 4.8%).
Management, Business, Science and Arts Occupations by Sex
Within the Management, Business, Science and Arts occupations in Tickfaw, the most male-oriented occupations are Computers & Mathematics (92.9%), Computers, Engineering & Science (60.6%), and Management (55.6%), while the most female-oriented occupations are Business & Financial (100.0%), Community & Social Service (100.0%), and Education Instruction & Library (100.0%).
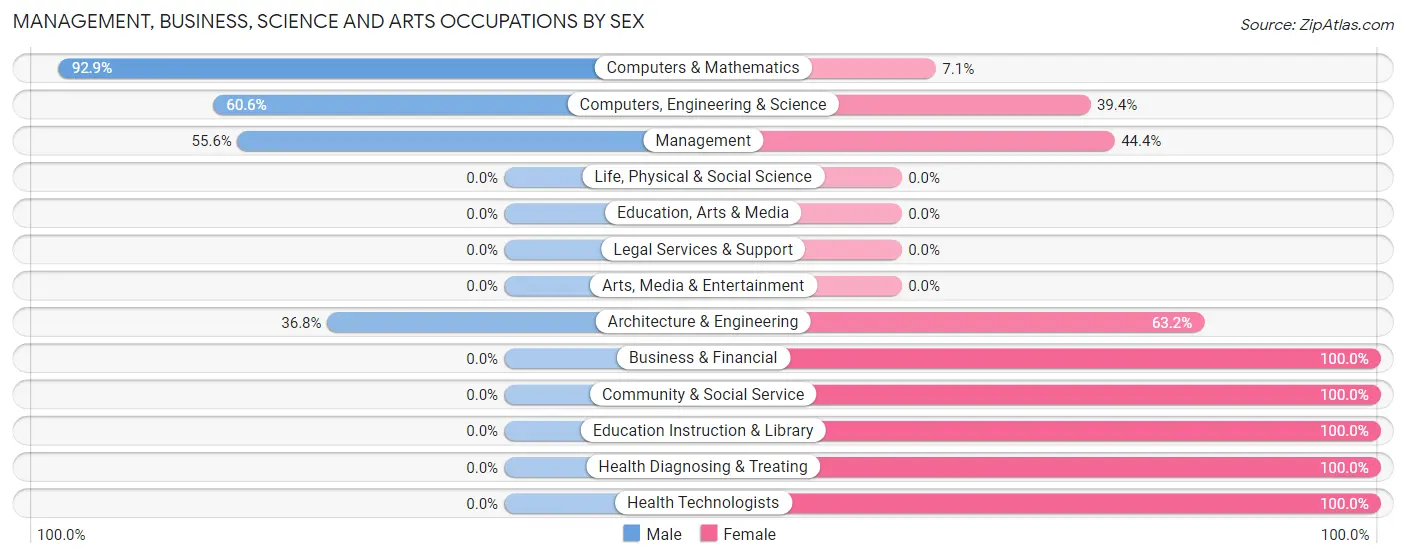
| Occupation | Male | Female |
| Management | 30 (55.6%) | 24 (44.4%) |
| Business & Financial | 0 (0.0%) | 6 (100.0%) |
| Computers, Engineering & Science | 20 (60.6%) | 13 (39.4%) |
| Computers & Mathematics | 13 (92.9%) | 1 (7.1%) |
| Architecture & Engineering | 7 (36.8%) | 12 (63.2%) |
| Life, Physical & Social Science | 0 (0.0%) | 0 (0.0%) |
| Community & Social Service | 0 (0.0%) | 32 (100.0%) |
| Education, Arts & Media | 0 (0.0%) | 0 (0.0%) |
| Legal Services & Support | 0 (0.0%) | 0 (0.0%) |
| Education Instruction & Library | 0 (0.0%) | 32 (100.0%) |
| Arts, Media & Entertainment | 0 (0.0%) | 0 (0.0%) |
| Health Diagnosing & Treating | 0 (0.0%) | 7 (100.0%) |
| Health Technologists | 0 (0.0%) | 4 (100.0%) |
| Total (Category) | 50 (37.9%) | 82 (62.1%) |
| Total (Overall) | 234 (58.5%) | 166 (41.5%) |
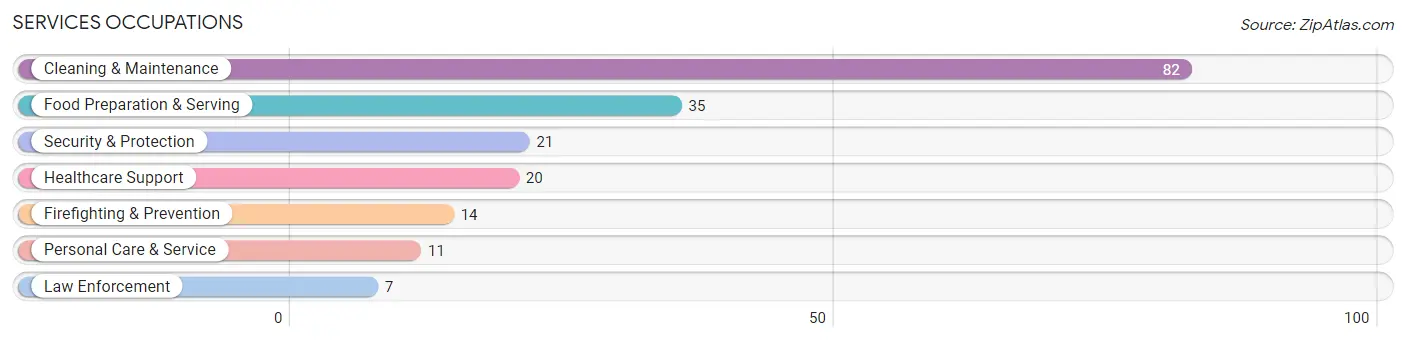
Services Occupations
The most common Services occupations in Tickfaw are Cleaning & Maintenance (82 | 20.5%), Food Preparation & Serving (35 | 8.7%), Security & Protection (21 | 5.2%), Healthcare Support (20 | 5.0%), and Firefighting & Prevention (14 | 3.5%).
Services Occupations by Sex
Within the Services occupations in Tickfaw, the most male-oriented occupations are Security & Protection (100.0%), Firefighting & Prevention (100.0%), and Law Enforcement (100.0%), while the most female-oriented occupations are Food Preparation & Serving (100.0%), Personal Care & Service (100.0%), and Healthcare Support (30.0%).
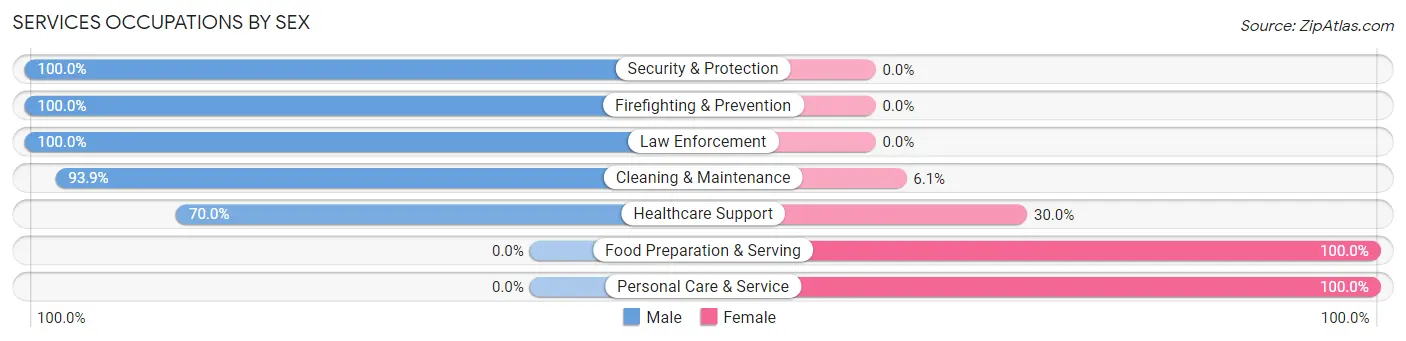
| Occupation | Male | Female |
| Healthcare Support | 14 (70.0%) | 6 (30.0%) |
| Security & Protection | 21 (100.0%) | 0 (0.0%) |
| Firefighting & Prevention | 14 (100.0%) | 0 (0.0%) |
| Law Enforcement | 7 (100.0%) | 0 (0.0%) |
| Food Preparation & Serving | 0 (0.0%) | 35 (100.0%) |
| Cleaning & Maintenance | 77 (93.9%) | 5 (6.1%) |
| Personal Care & Service | 0 (0.0%) | 11 (100.0%) |
| Total (Category) | 112 (66.3%) | 57 (33.7%) |
| Total (Overall) | 234 (58.5%) | 166 (41.5%) |
Sales and Office Occupations
The most common Sales and Office occupations in Tickfaw are Sales & Related (33 | 8.3%), and Office & Administration (20 | 5.0%).
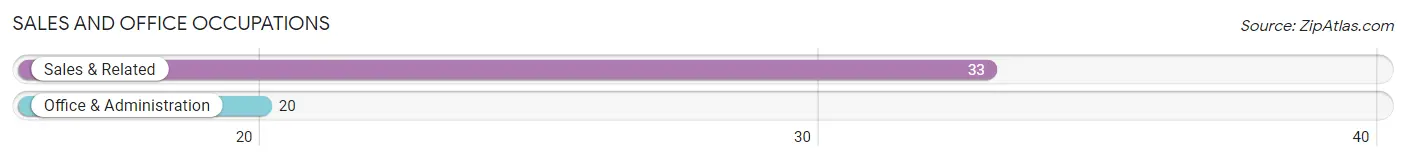
Sales and Office Occupations by Sex
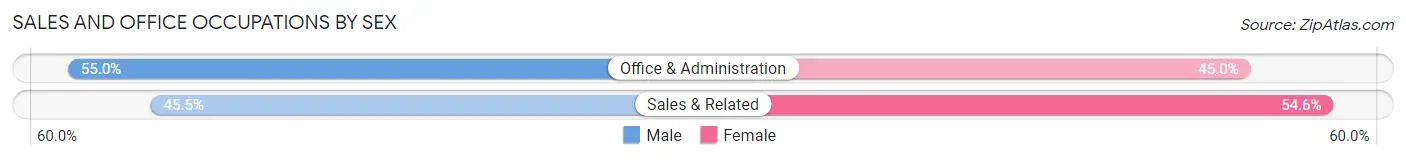
| Occupation | Male | Female |
| Sales & Related | 15 (45.5%) | 18 (54.5%) |
| Office & Administration | 11 (55.0%) | 9 (45.0%) |
| Total (Category) | 26 (49.1%) | 27 (50.9%) |
| Total (Overall) | 234 (58.5%) | 166 (41.5%) |
Natural Resources, Construction and Maintenance Occupations
The most common Natural Resources, Construction and Maintenance occupations in Tickfaw are Construction & Extraction (25 | 6.2%), and Installation, Maintenance & Repair (9 | 2.2%).
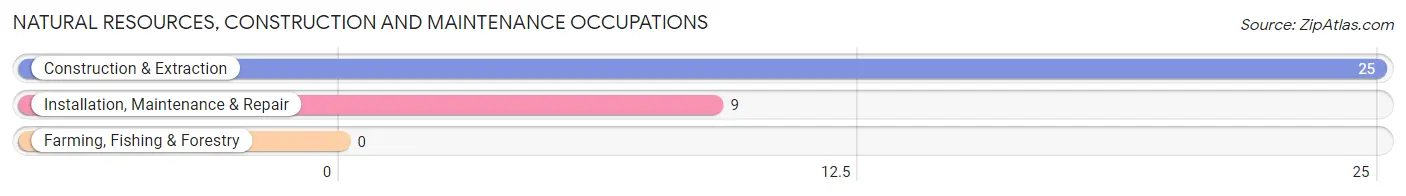
Natural Resources, Construction and Maintenance Occupations by Sex
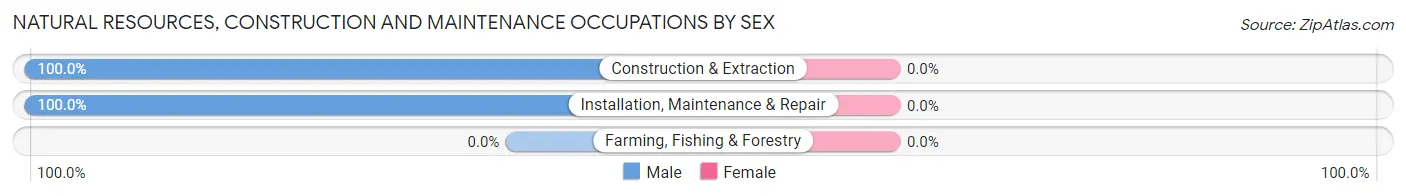
| Occupation | Male | Female |
| Farming, Fishing & Forestry | 0 (0.0%) | 0 (0.0%) |
| Construction & Extraction | 25 (100.0%) | 0 (0.0%) |
| Installation, Maintenance & Repair | 9 (100.0%) | 0 (0.0%) |
| Total (Category) | 34 (100.0%) | 0 (0.0%) |
| Total (Overall) | 234 (58.5%) | 166 (41.5%) |
Production, Transportation and Moving Occupations
The most common Production, Transportation and Moving occupations in Tickfaw are Production (8 | 2.0%), and Transportation (4 | 1.0%).
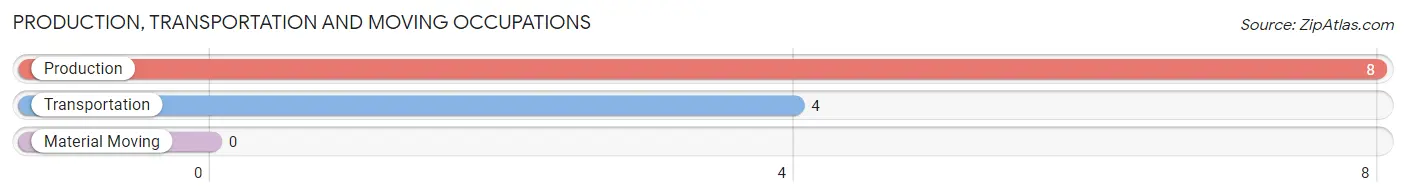
Production, Transportation and Moving Occupations by Sex
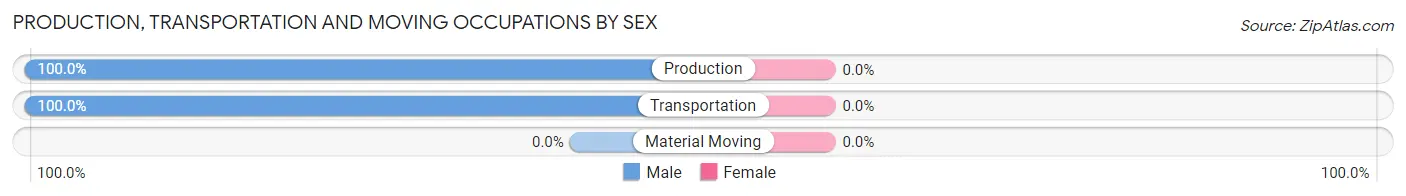
| Occupation | Male | Female |
| Production | 8 (100.0%) | 0 (0.0%) |
| Transportation | 4 (100.0%) | 0 (0.0%) |
| Material Moving | 0 (0.0%) | 0 (0.0%) |
| Total (Category) | 12 (100.0%) | 0 (0.0%) |
| Total (Overall) | 234 (58.5%) | 166 (41.5%) |
Employment Industries by Sex in Tickfaw
Employment Industries in Tickfaw
The major employment industries in Tickfaw include Accommodation & Food Services (121 | 30.2%), Educational Services (47 | 11.7%), Health Care & Social Assistance (41 | 10.2%), Construction (35 | 8.7%), and Administrative & Support (34 | 8.5%).
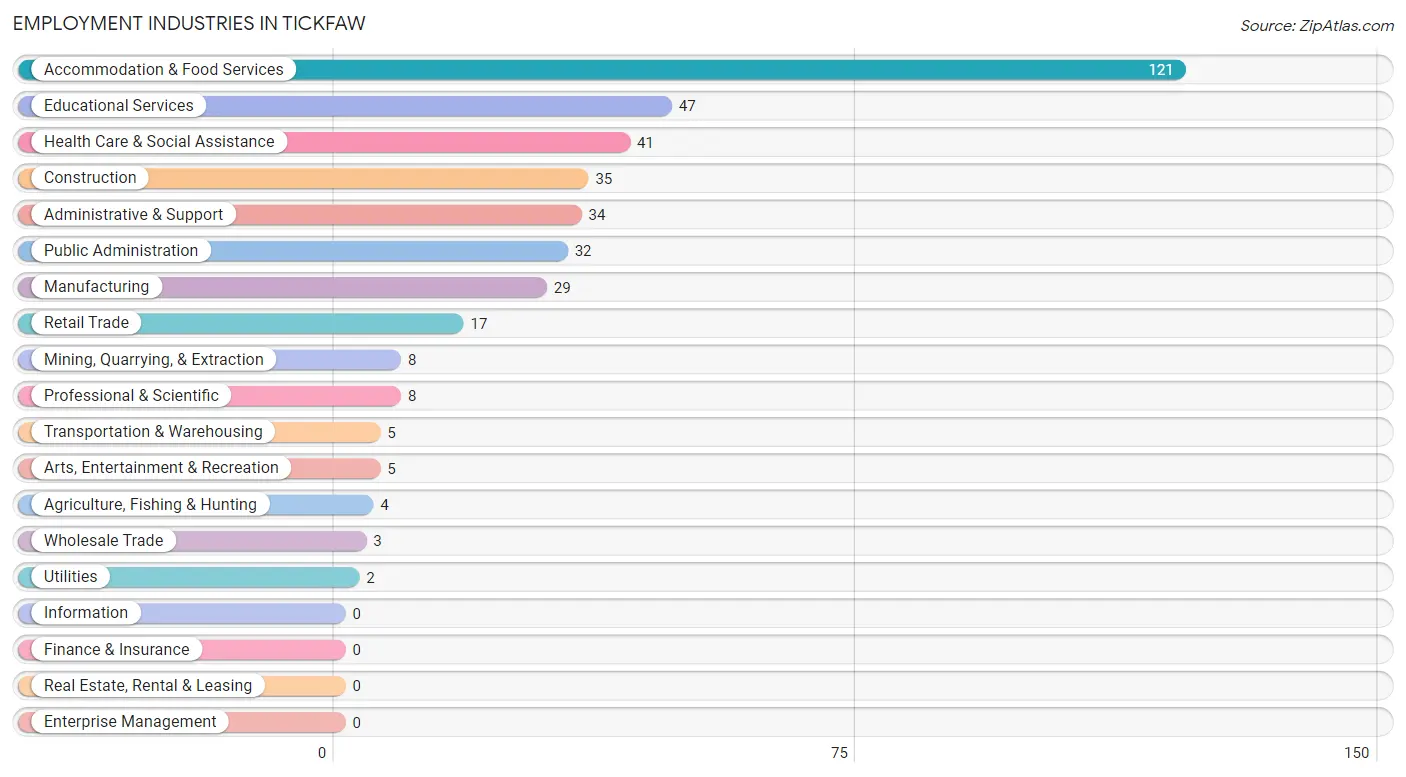
Employment Industries by Sex in Tickfaw
The Tickfaw industries that see more men than women are Agriculture, Fishing & Hunting (100.0%), Mining, Quarrying, & Extraction (100.0%), and Manufacturing (100.0%), whereas the industries that tend to have a higher number of women are Transportation & Warehousing (100.0%), Utilities (100.0%), and Educational Services (70.2%).
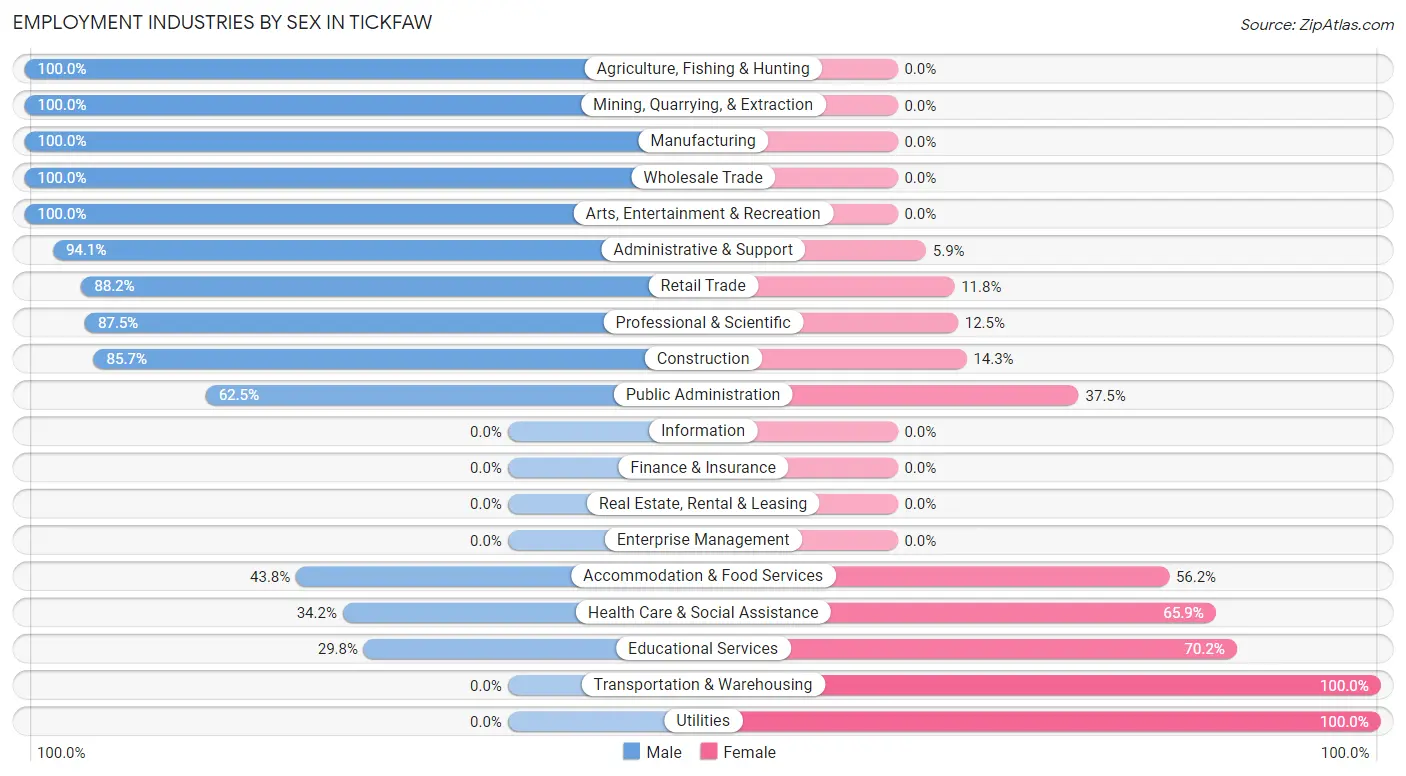
| Industry | Male | Female |
| Agriculture, Fishing & Hunting | 4 (100.0%) | 0 (0.0%) |
| Mining, Quarrying, & Extraction | 8 (100.0%) | 0 (0.0%) |
| Construction | 30 (85.7%) | 5 (14.3%) |
| Manufacturing | 29 (100.0%) | 0 (0.0%) |
| Wholesale Trade | 3 (100.0%) | 0 (0.0%) |
| Retail Trade | 15 (88.2%) | 2 (11.8%) |
| Transportation & Warehousing | 0 (0.0%) | 5 (100.0%) |
| Utilities | 0 (0.0%) | 2 (100.0%) |
| Information | 0 (0.0%) | 0 (0.0%) |
| Finance & Insurance | 0 (0.0%) | 0 (0.0%) |
| Real Estate, Rental & Leasing | 0 (0.0%) | 0 (0.0%) |
| Professional & Scientific | 7 (87.5%) | 1 (12.5%) |
| Enterprise Management | 0 (0.0%) | 0 (0.0%) |
| Administrative & Support | 32 (94.1%) | 2 (5.9%) |
| Educational Services | 14 (29.8%) | 33 (70.2%) |
| Health Care & Social Assistance | 14 (34.2%) | 27 (65.8%) |
| Arts, Entertainment & Recreation | 5 (100.0%) | 0 (0.0%) |
| Accommodation & Food Services | 53 (43.8%) | 68 (56.2%) |
| Public Administration | 20 (62.5%) | 12 (37.5%) |
| Total | 234 (58.5%) | 166 (41.5%) |
Education in Tickfaw
School Enrollment in Tickfaw
The most common levels of schooling among the 223 students in Tickfaw are college / undergraduate (77 | 34.5%), high school (42 | 18.8%), and middle school (35 | 15.7%).
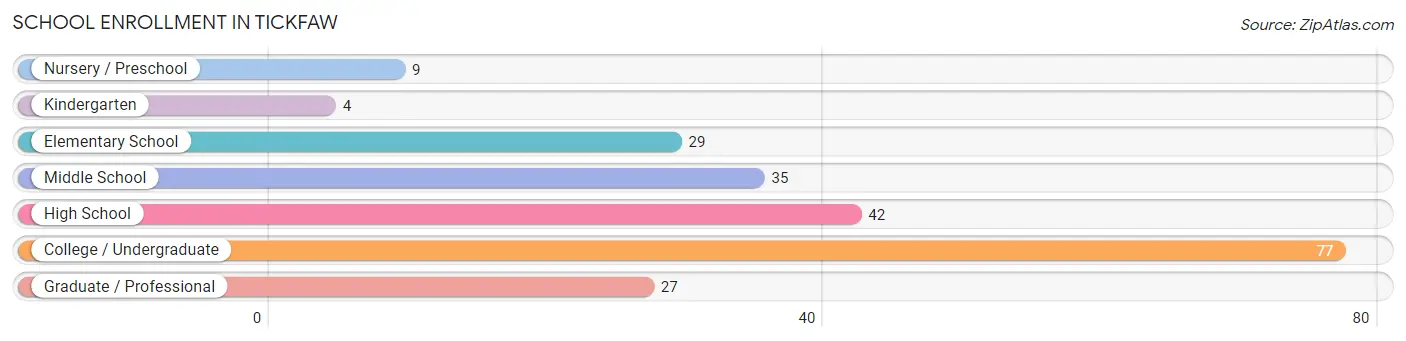
| School Level | # Students | % Students |
| Nursery / Preschool | 9 | 4.0% |
| Kindergarten | 4 | 1.8% |
| Elementary School | 29 | 13.0% |
| Middle School | 35 | 15.7% |
| High School | 42 | 18.8% |
| College / Undergraduate | 77 | 34.5% |
| Graduate / Professional | 27 | 12.1% |
| Total | 223 | 100.0% |
School Enrollment by Age by Funding Source in Tickfaw
Out of a total of 223 students who are enrolled in schools in Tickfaw, 16 (7.2%) attend a private institution, while the remaining 207 (92.8%) are enrolled in public schools. The age group of 25 to 34 year olds has the highest likelihood of being enrolled in private schools, with 7 (16.7% in the age bracket) enrolled. Conversely, the age group of 3 to 4 year olds has the lowest likelihood of being enrolled in a private school, with 9 (100.0% in the age bracket) attending a public institution.
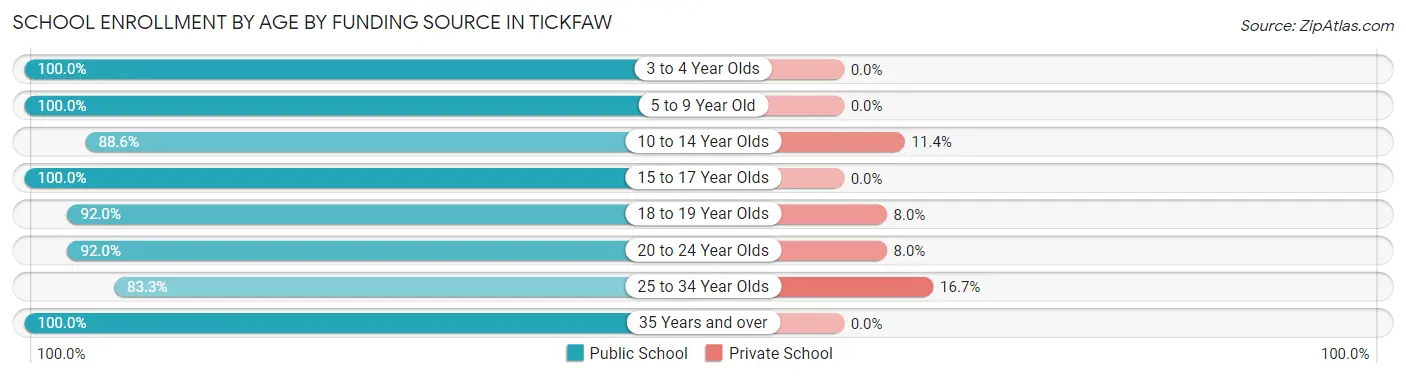
| Age Bracket | Public School | Private School |
| 3 to 4 Year Olds | 9 (100.0%) | 0 (0.0%) |
| 5 to 9 Year Old | 33 (100.0%) | 0 (0.0%) |
| 10 to 14 Year Olds | 39 (88.6%) | 5 (11.4%) |
| 15 to 17 Year Olds | 24 (100.0%) | 0 (0.0%) |
| 18 to 19 Year Olds | 23 (92.0%) | 2 (8.0%) |
| 20 to 24 Year Olds | 23 (92.0%) | 2 (8.0%) |
| 25 to 34 Year Olds | 35 (83.3%) | 7 (16.7%) |
| 35 Years and over | 21 (100.0%) | 0 (0.0%) |
| Total | 207 (92.8%) | 16 (7.2%) |
Educational Attainment by Field of Study in Tickfaw
Education (16 | 18.8%), science & technology (15 | 17.6%), computers & mathematics (13 | 15.3%), multidisciplinary studies (11 | 12.9%), and business (11 | 12.9%) are the most common fields of study among 85 individuals in Tickfaw who have obtained a bachelor's degree or higher.
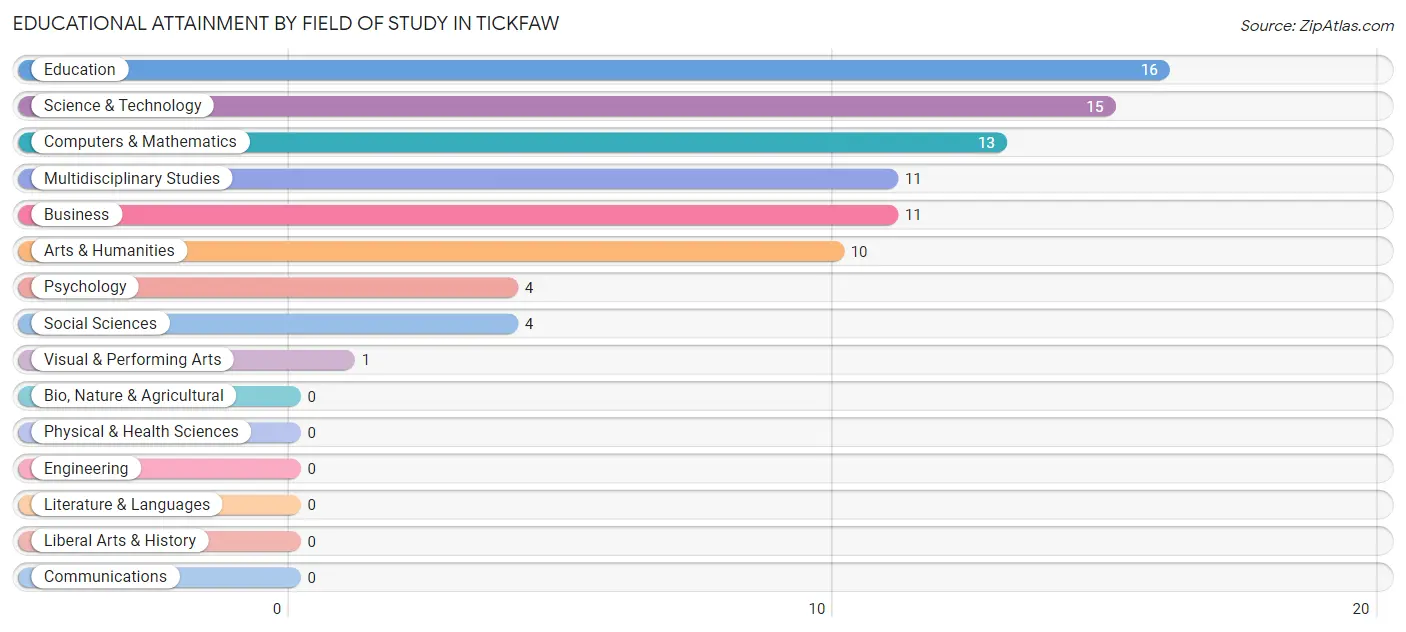
| Field of Study | # Graduates | % Graduates |
| Computers & Mathematics | 13 | 15.3% |
| Bio, Nature & Agricultural | 0 | 0.0% |
| Physical & Health Sciences | 0 | 0.0% |
| Psychology | 4 | 4.7% |
| Social Sciences | 4 | 4.7% |
| Engineering | 0 | 0.0% |
| Multidisciplinary Studies | 11 | 12.9% |
| Science & Technology | 15 | 17.6% |
| Business | 11 | 12.9% |
| Education | 16 | 18.8% |
| Literature & Languages | 0 | 0.0% |
| Liberal Arts & History | 0 | 0.0% |
| Visual & Performing Arts | 1 | 1.2% |
| Communications | 0 | 0.0% |
| Arts & Humanities | 10 | 11.8% |
| Total | 85 | 100.0% |
Transportation & Commute in Tickfaw
Vehicle Availability by Sex in Tickfaw
The most prevalent vehicle ownership categories in Tickfaw are males with 3 vehicles (84, accounting for 38.2%) and females with 3 vehicles (61, making up 50.6%).
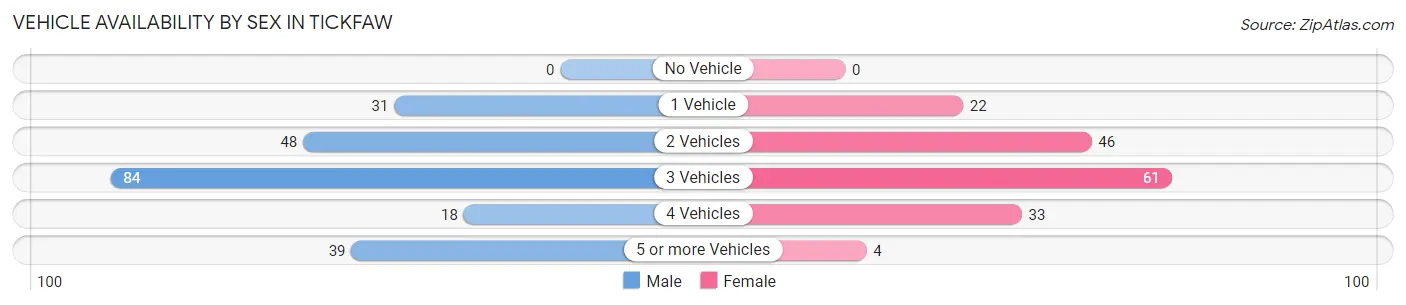
| Vehicles Available | Male | Female |
| No Vehicle | 0 (0.0%) | 0 (0.0%) |
| 1 Vehicle | 31 (14.1%) | 22 (13.3%) |
| 2 Vehicles | 48 (21.8%) | 46 (27.7%) |
| 3 Vehicles | 84 (38.2%) | 61 (36.7%) |
| 4 Vehicles | 18 (8.2%) | 33 (19.9%) |
| 5 or more Vehicles | 39 (17.7%) | 4 (2.4%) |
| Total | 220 (100.0%) | 166 (100.0%) |
Commute Time in Tickfaw
The most frequently occuring commute durations in Tickfaw are 15 to 19 minutes (118 commuters, 33.3%), less than 5 minutes (106 commuters, 29.9%), and 60 to 89 minutes (32 commuters, 9.0%).
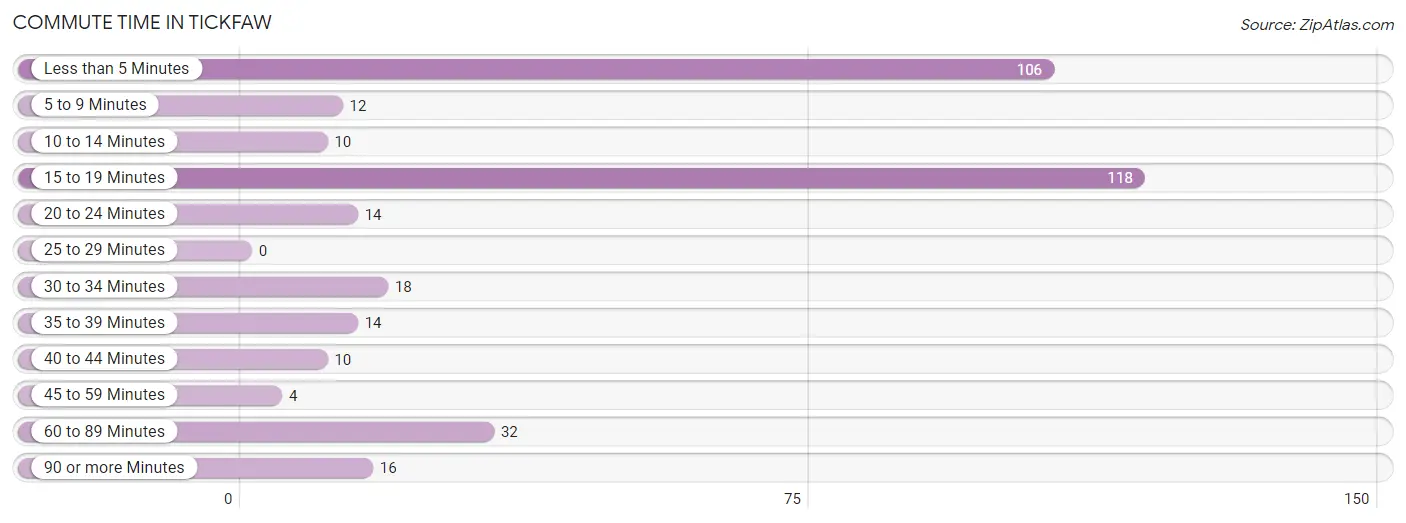
| Commute Time | # Commuters | % Commuters |
| Less than 5 Minutes | 106 | 29.9% |
| 5 to 9 Minutes | 12 | 3.4% |
| 10 to 14 Minutes | 10 | 2.8% |
| 15 to 19 Minutes | 118 | 33.3% |
| 20 to 24 Minutes | 14 | 4.0% |
| 25 to 29 Minutes | 0 | 0.0% |
| 30 to 34 Minutes | 18 | 5.1% |
| 35 to 39 Minutes | 14 | 4.0% |
| 40 to 44 Minutes | 10 | 2.8% |
| 45 to 59 Minutes | 4 | 1.1% |
| 60 to 89 Minutes | 32 | 9.0% |
| 90 or more Minutes | 16 | 4.5% |
Commute Time by Sex in Tickfaw
The most common commute times in Tickfaw are less than 5 minutes (73 commuters, 35.8%) for males and 15 to 19 minutes (70 commuters, 46.7%) for females.
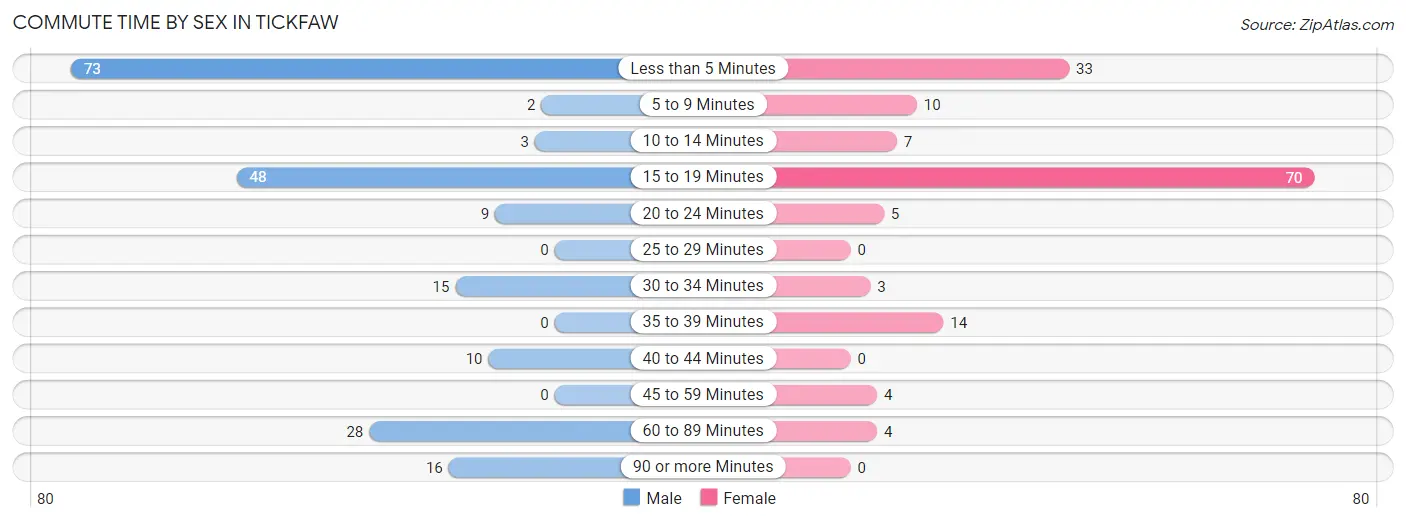
| Commute Time | Male | Female |
| Less than 5 Minutes | 73 (35.8%) | 33 (22.0%) |
| 5 to 9 Minutes | 2 (1.0%) | 10 (6.7%) |
| 10 to 14 Minutes | 3 (1.5%) | 7 (4.7%) |
| 15 to 19 Minutes | 48 (23.5%) | 70 (46.7%) |
| 20 to 24 Minutes | 9 (4.4%) | 5 (3.3%) |
| 25 to 29 Minutes | 0 (0.0%) | 0 (0.0%) |
| 30 to 34 Minutes | 15 (7.3%) | 3 (2.0%) |
| 35 to 39 Minutes | 0 (0.0%) | 14 (9.3%) |
| 40 to 44 Minutes | 10 (4.9%) | 0 (0.0%) |
| 45 to 59 Minutes | 0 (0.0%) | 4 (2.7%) |
| 60 to 89 Minutes | 28 (13.7%) | 4 (2.7%) |
| 90 or more Minutes | 16 (7.8%) | 0 (0.0%) |
Time of Departure to Work by Sex in Tickfaw
The most frequent times of departure to work in Tickfaw are 8:00 AM to 8:29 AM (53, 26.0%) for males and 8:00 AM to 8:29 AM (28, 18.7%) for females.
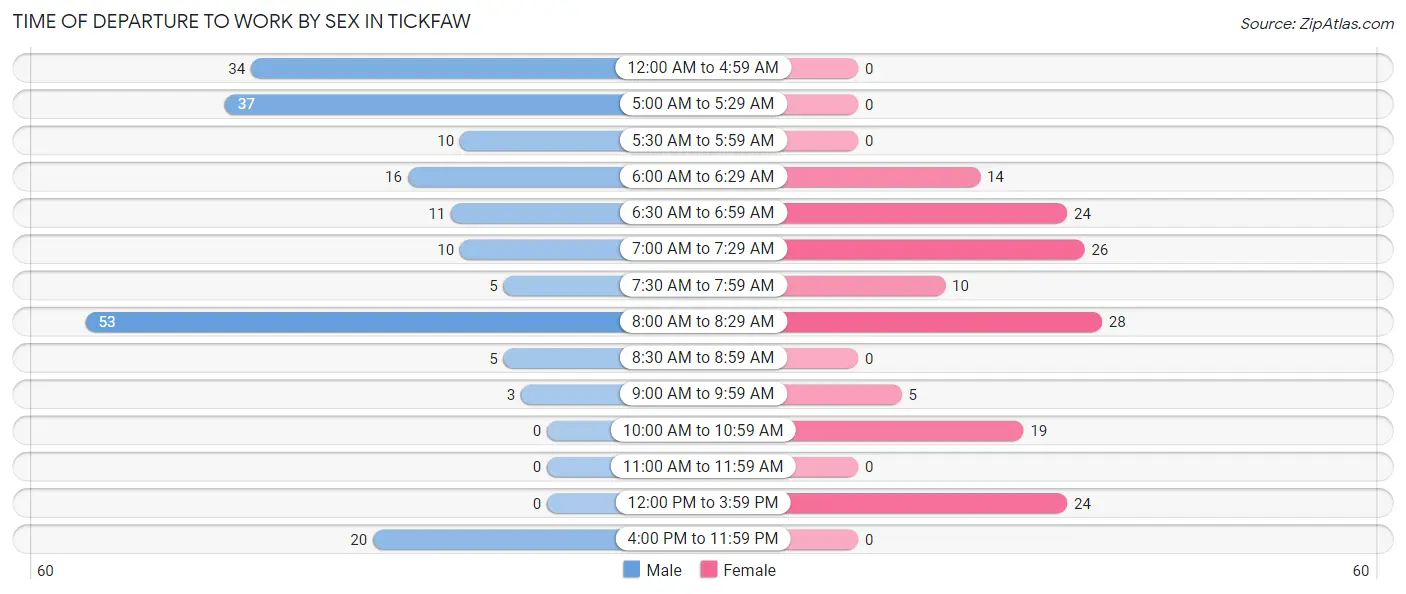
| Time of Departure | Male | Female |
| 12:00 AM to 4:59 AM | 34 (16.7%) | 0 (0.0%) |
| 5:00 AM to 5:29 AM | 37 (18.1%) | 0 (0.0%) |
| 5:30 AM to 5:59 AM | 10 (4.9%) | 0 (0.0%) |
| 6:00 AM to 6:29 AM | 16 (7.8%) | 14 (9.3%) |
| 6:30 AM to 6:59 AM | 11 (5.4%) | 24 (16.0%) |
| 7:00 AM to 7:29 AM | 10 (4.9%) | 26 (17.3%) |
| 7:30 AM to 7:59 AM | 5 (2.5%) | 10 (6.7%) |
| 8:00 AM to 8:29 AM | 53 (26.0%) | 28 (18.7%) |
| 8:30 AM to 8:59 AM | 5 (2.5%) | 0 (0.0%) |
| 9:00 AM to 9:59 AM | 3 (1.5%) | 5 (3.3%) |
| 10:00 AM to 10:59 AM | 0 (0.0%) | 19 (12.7%) |
| 11:00 AM to 11:59 AM | 0 (0.0%) | 0 (0.0%) |
| 12:00 PM to 3:59 PM | 0 (0.0%) | 24 (16.0%) |
| 4:00 PM to 11:59 PM | 20 (9.8%) | 0 (0.0%) |
| Total | 204 (100.0%) | 150 (100.0%) |
Housing Occupancy in Tickfaw
Occupancy by Ownership in Tickfaw
Of the total 267 dwellings in Tickfaw, owner-occupied units account for 161 (60.3%), while renter-occupied units make up 106 (39.7%).
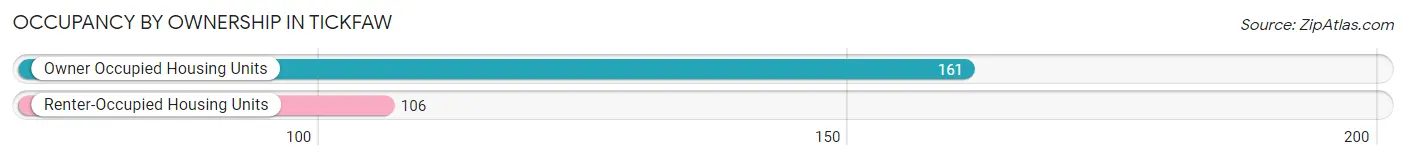
| Occupancy | # Housing Units | % Housing Units |
| Owner Occupied Housing Units | 161 | 60.3% |
| Renter-Occupied Housing Units | 106 | 39.7% |
| Total Occupied Housing Units | 267 | 100.0% |
Occupancy by Household Size in Tickfaw
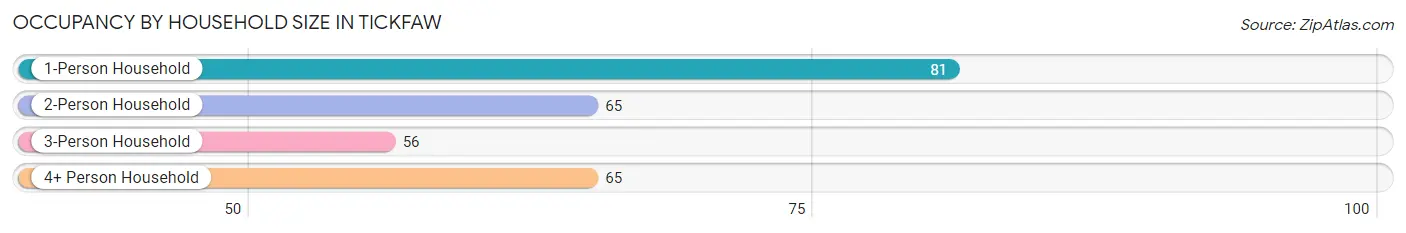
| Household Size | # Housing Units | % Housing Units |
| 1-Person Household | 81 | 30.3% |
| 2-Person Household | 65 | 24.3% |
| 3-Person Household | 56 | 21.0% |
| 4+ Person Household | 65 | 24.3% |
| Total Housing Units | 267 | 100.0% |
Occupancy by Ownership by Household Size in Tickfaw
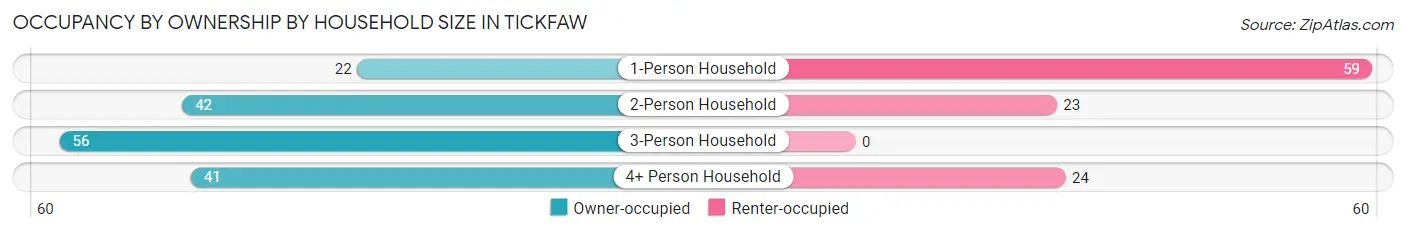
| Household Size | Owner-occupied | Renter-occupied |
| 1-Person Household | 22 (27.2%) | 59 (72.8%) |
| 2-Person Household | 42 (64.6%) | 23 (35.4%) |
| 3-Person Household | 56 (100.0%) | 0 (0.0%) |
| 4+ Person Household | 41 (63.1%) | 24 (36.9%) |
| Total Housing Units | 161 (60.3%) | 106 (39.7%) |
Occupancy by Educational Attainment in Tickfaw
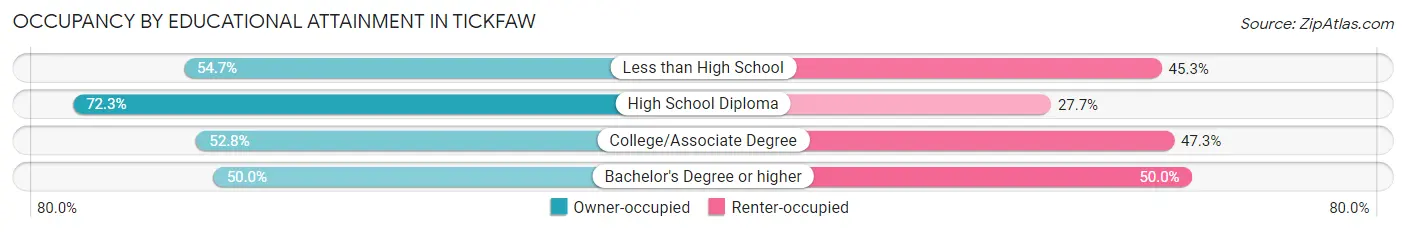
| Household Size | Owner-occupied | Renter-occupied |
| Less than High School | 29 (54.7%) | 24 (45.3%) |
| High School Diploma | 73 (72.3%) | 28 (27.7%) |
| College/Associate Degree | 48 (52.7%) | 43 (47.2%) |
| Bachelor's Degree or higher | 11 (50.0%) | 11 (50.0%) |
Occupancy by Age of Householder in Tickfaw
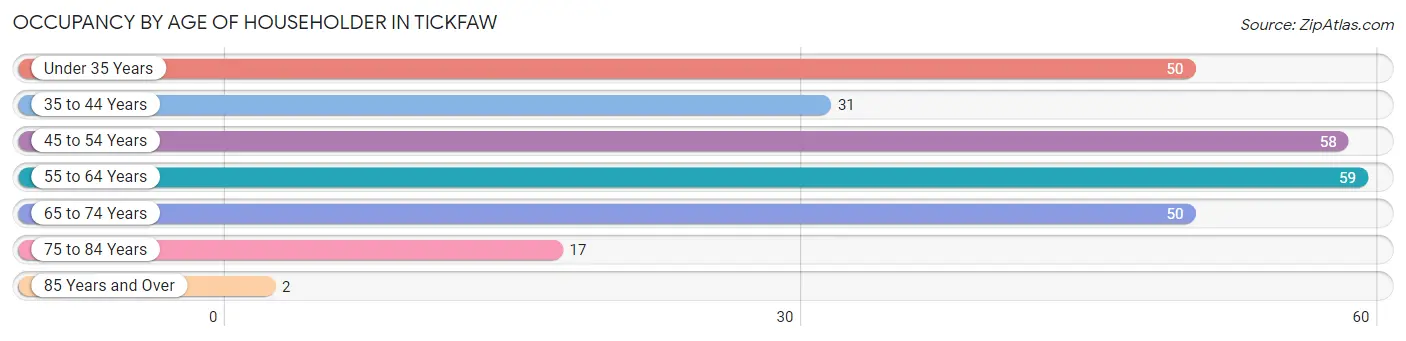
| Age Bracket | # Households | % Households |
| Under 35 Years | 50 | 18.7% |
| 35 to 44 Years | 31 | 11.6% |
| 45 to 54 Years | 58 | 21.7% |
| 55 to 64 Years | 59 | 22.1% |
| 65 to 74 Years | 50 | 18.7% |
| 75 to 84 Years | 17 | 6.4% |
| 85 Years and Over | 2 | 0.7% |
| Total | 267 | 100.0% |
Housing Finances in Tickfaw
Median Income by Occupancy in Tickfaw
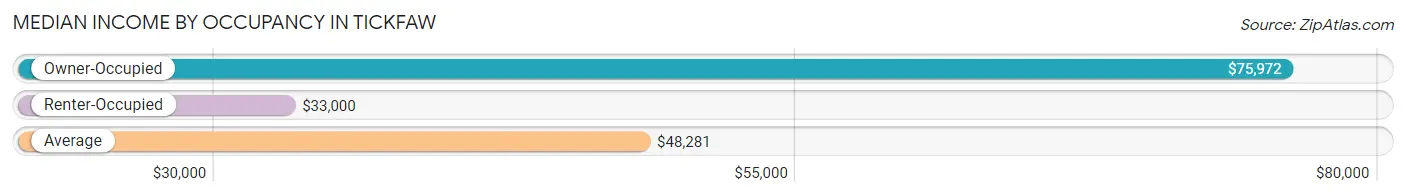
| Occupancy Type | # Households | Median Income |
| Owner-Occupied | 161 (60.3%) | $75,972 |
| Renter-Occupied | 106 (39.7%) | $33,000 |
| Average | 267 (100.0%) | $48,281 |
Occupancy by Householder Income Bracket in Tickfaw
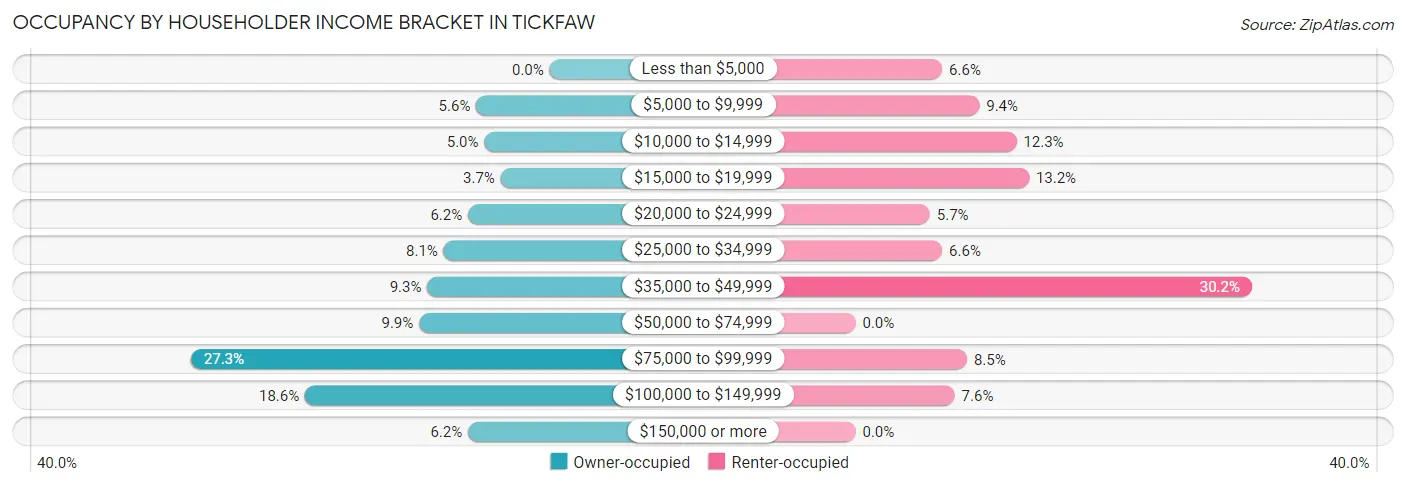
| Income Bracket | Owner-occupied | Renter-occupied |
| Less than $5,000 | 0 (0.0%) | 7 (6.6%) |
| $5,000 to $9,999 | 9 (5.6%) | 10 (9.4%) |
| $10,000 to $14,999 | 8 (5.0%) | 13 (12.3%) |
| $15,000 to $19,999 | 6 (3.7%) | 14 (13.2%) |
| $20,000 to $24,999 | 10 (6.2%) | 6 (5.7%) |
| $25,000 to $34,999 | 13 (8.1%) | 7 (6.6%) |
| $35,000 to $49,999 | 15 (9.3%) | 32 (30.2%) |
| $50,000 to $74,999 | 16 (9.9%) | 0 (0.0%) |
| $75,000 to $99,999 | 44 (27.3%) | 9 (8.5%) |
| $100,000 to $149,999 | 30 (18.6%) | 8 (7.5%) |
| $150,000 or more | 10 (6.2%) | 0 (0.0%) |
| Total | 161 (100.0%) | 106 (100.0%) |
Monthly Housing Cost Tiers in Tickfaw
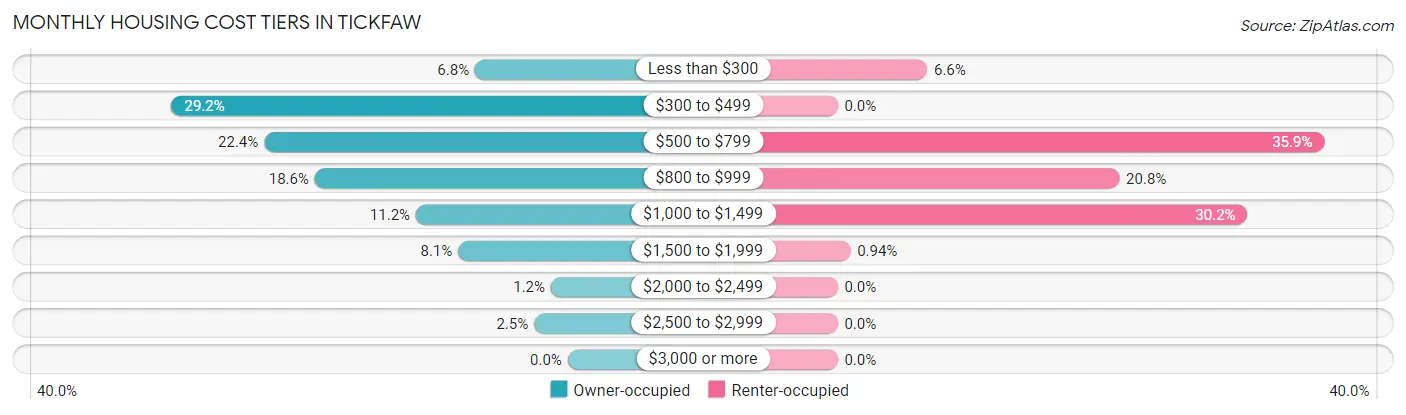
| Monthly Cost | Owner-occupied | Renter-occupied |
| Less than $300 | 11 (6.8%) | 7 (6.6%) |
| $300 to $499 | 47 (29.2%) | 0 (0.0%) |
| $500 to $799 | 36 (22.4%) | 38 (35.8%) |
| $800 to $999 | 30 (18.6%) | 22 (20.7%) |
| $1,000 to $1,499 | 18 (11.2%) | 32 (30.2%) |
| $1,500 to $1,999 | 13 (8.1%) | 1 (0.9%) |
| $2,000 to $2,499 | 2 (1.2%) | 0 (0.0%) |
| $2,500 to $2,999 | 4 (2.5%) | 0 (0.0%) |
| $3,000 or more | 0 (0.0%) | 0 (0.0%) |
| Total | 161 (100.0%) | 106 (100.0%) |
Physical Housing Characteristics in Tickfaw
Housing Structures in Tickfaw
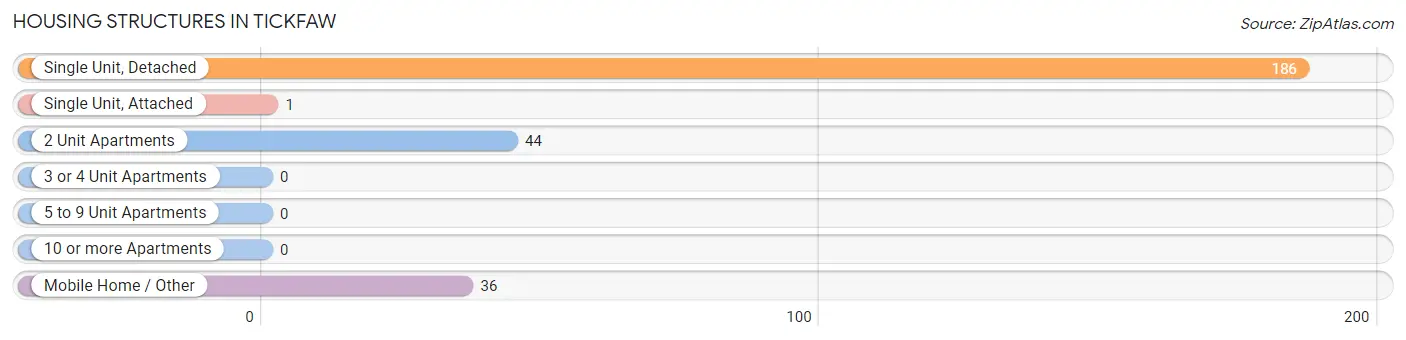
| Structure Type | # Housing Units | % Housing Units |
| Single Unit, Detached | 186 | 69.7% |
| Single Unit, Attached | 1 | 0.4% |
| 2 Unit Apartments | 44 | 16.5% |
| 3 or 4 Unit Apartments | 0 | 0.0% |
| 5 to 9 Unit Apartments | 0 | 0.0% |
| 10 or more Apartments | 0 | 0.0% |
| Mobile Home / Other | 36 | 13.5% |
| Total | 267 | 100.0% |
Housing Structures by Occupancy in Tickfaw
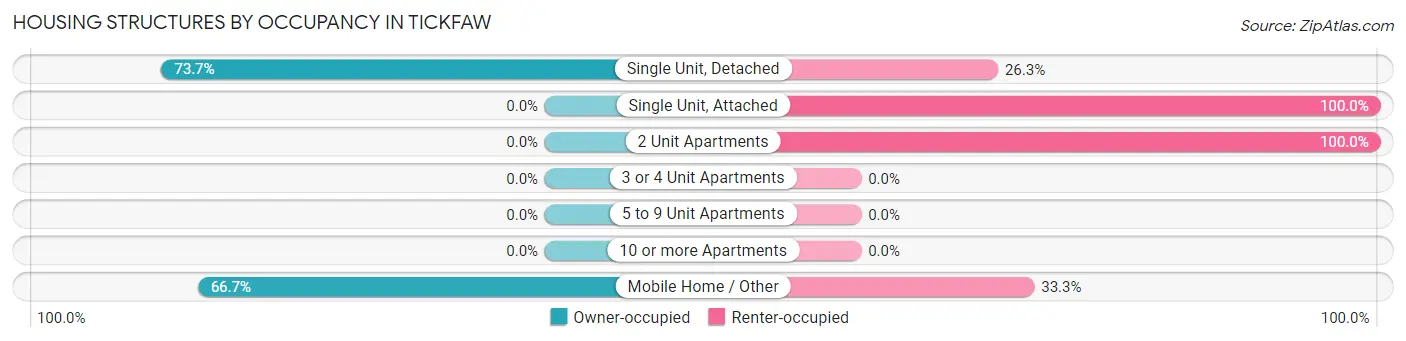
| Structure Type | Owner-occupied | Renter-occupied |
| Single Unit, Detached | 137 (73.7%) | 49 (26.3%) |
| Single Unit, Attached | 0 (0.0%) | 1 (100.0%) |
| 2 Unit Apartments | 0 (0.0%) | 44 (100.0%) |
| 3 or 4 Unit Apartments | 0 (0.0%) | 0 (0.0%) |
| 5 to 9 Unit Apartments | 0 (0.0%) | 0 (0.0%) |
| 10 or more Apartments | 0 (0.0%) | 0 (0.0%) |
| Mobile Home / Other | 24 (66.7%) | 12 (33.3%) |
| Total | 161 (60.3%) | 106 (39.7%) |
Housing Structures by Number of Rooms in Tickfaw
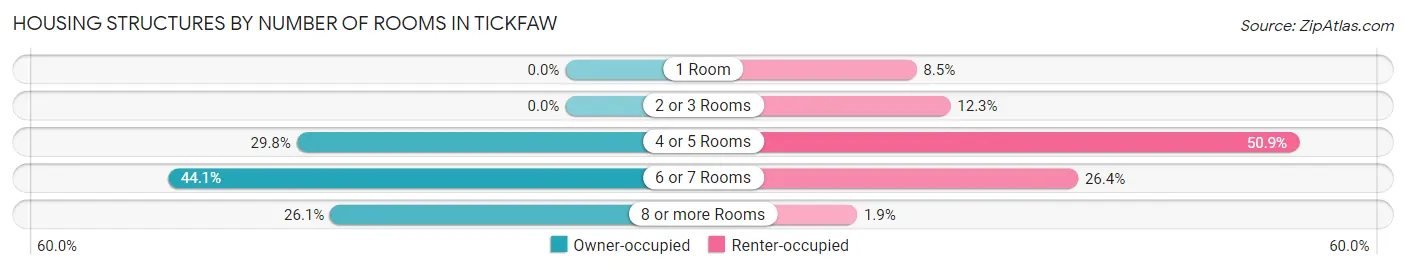
| Number of Rooms | Owner-occupied | Renter-occupied |
| 1 Room | 0 (0.0%) | 9 (8.5%) |
| 2 or 3 Rooms | 0 (0.0%) | 13 (12.3%) |
| 4 or 5 Rooms | 48 (29.8%) | 54 (50.9%) |
| 6 or 7 Rooms | 71 (44.1%) | 28 (26.4%) |
| 8 or more Rooms | 42 (26.1%) | 2 (1.9%) |
| Total | 161 (100.0%) | 106 (100.0%) |
Housing Structure by Heating Type in Tickfaw
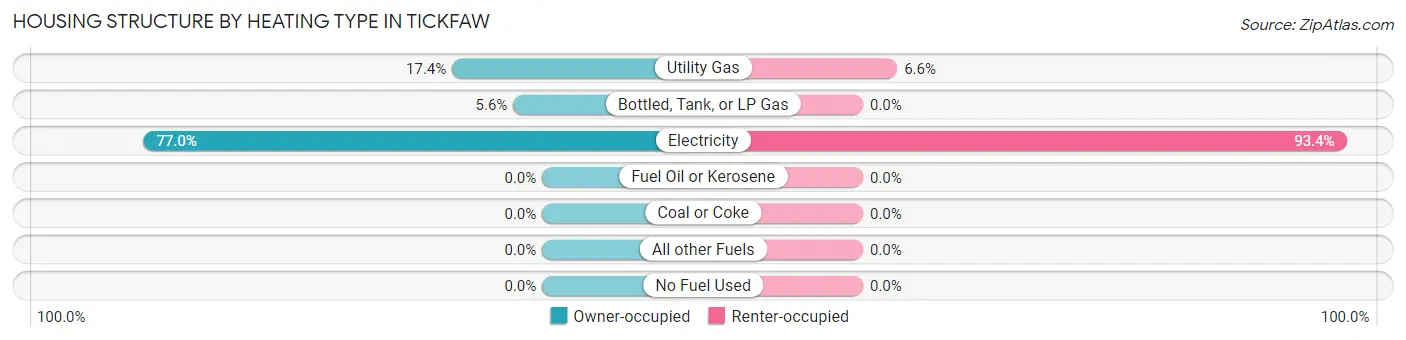
| Heating Type | Owner-occupied | Renter-occupied |
| Utility Gas | 28 (17.4%) | 7 (6.6%) |
| Bottled, Tank, or LP Gas | 9 (5.6%) | 0 (0.0%) |
| Electricity | 124 (77.0%) | 99 (93.4%) |
| Fuel Oil or Kerosene | 0 (0.0%) | 0 (0.0%) |
| Coal or Coke | 0 (0.0%) | 0 (0.0%) |
| All other Fuels | 0 (0.0%) | 0 (0.0%) |
| No Fuel Used | 0 (0.0%) | 0 (0.0%) |
| Total | 161 (100.0%) | 106 (100.0%) |
Household Vehicle Usage in Tickfaw
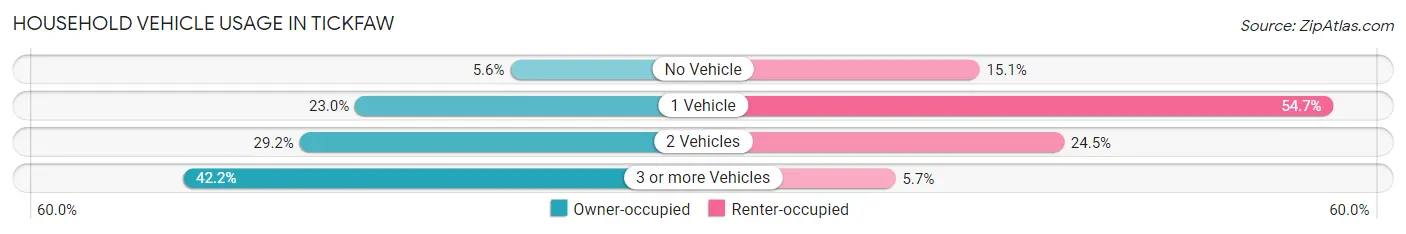
| Vehicles per Household | Owner-occupied | Renter-occupied |
| No Vehicle | 9 (5.6%) | 16 (15.1%) |
| 1 Vehicle | 37 (23.0%) | 58 (54.7%) |
| 2 Vehicles | 47 (29.2%) | 26 (24.5%) |
| 3 or more Vehicles | 68 (42.2%) | 6 (5.7%) |
| Total | 161 (100.0%) | 106 (100.0%) |
Real Estate & Mortgages in Tickfaw
Real Estate and Mortgage Overview in Tickfaw
| Characteristic | Without Mortgage | With Mortgage |
| Housing Units | 85 | 76 |
| Median Property Value | $186,300 | $183,800 |
| Median Household Income | $61,250 | $0 |
| Monthly Housing Costs | $353 | $0 |
| Real Estate Taxes | - | - |
Property Value by Mortgage Status in Tickfaw
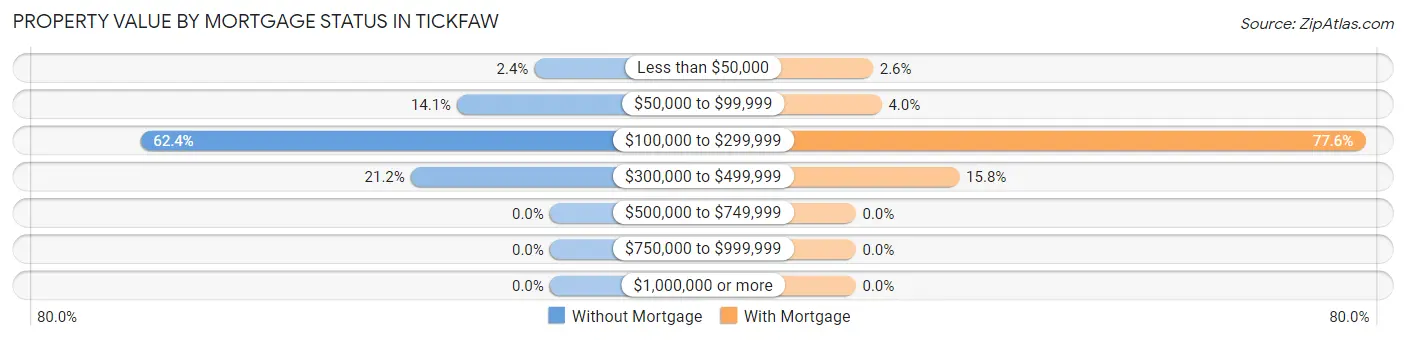
| Property Value | Without Mortgage | With Mortgage |
| Less than $50,000 | 2 (2.4%) | 2 (2.6%) |
| $50,000 to $99,999 | 12 (14.1%) | 3 (4.0%) |
| $100,000 to $299,999 | 53 (62.4%) | 59 (77.6%) |
| $300,000 to $499,999 | 18 (21.2%) | 12 (15.8%) |
| $500,000 to $749,999 | 0 (0.0%) | 0 (0.0%) |
| $750,000 to $999,999 | 0 (0.0%) | 0 (0.0%) |
| $1,000,000 or more | 0 (0.0%) | 0 (0.0%) |
| Total | 85 (100.0%) | 76 (100.0%) |
Household Income by Mortgage Status in Tickfaw
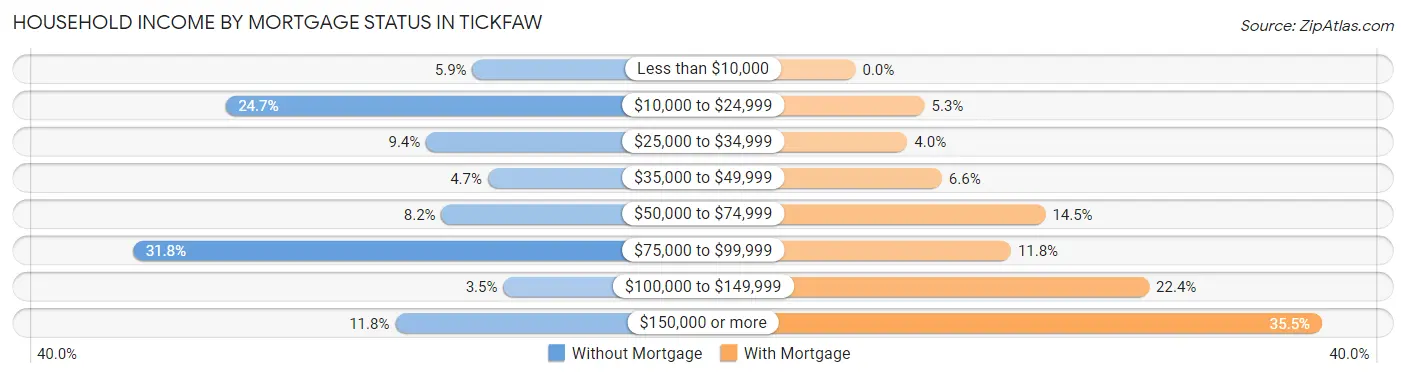
| Household Income | Without Mortgage | With Mortgage |
| Less than $10,000 | 5 (5.9%) | 0 (0.0%) |
| $10,000 to $24,999 | 21 (24.7%) | 4 (5.3%) |
| $25,000 to $34,999 | 8 (9.4%) | 3 (4.0%) |
| $35,000 to $49,999 | 4 (4.7%) | 5 (6.6%) |
| $50,000 to $74,999 | 7 (8.2%) | 11 (14.5%) |
| $75,000 to $99,999 | 27 (31.8%) | 9 (11.8%) |
| $100,000 to $149,999 | 3 (3.5%) | 17 (22.4%) |
| $150,000 or more | 10 (11.8%) | 27 (35.5%) |
| Total | 85 (100.0%) | 76 (100.0%) |
Property Value to Household Income Ratio in Tickfaw
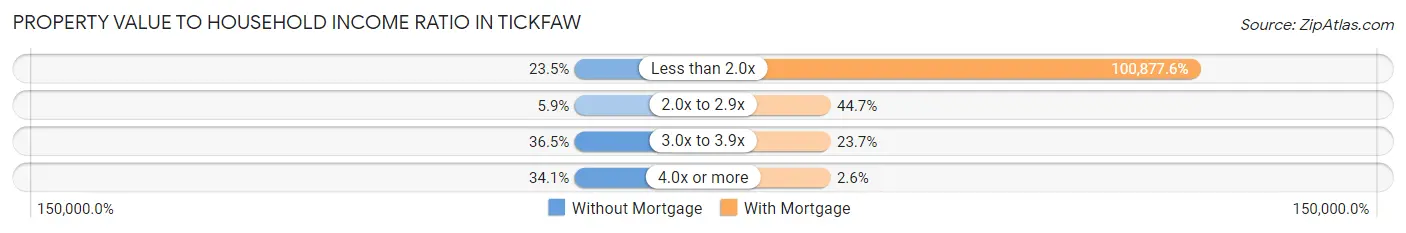
| Value-to-Income Ratio | Without Mortgage | With Mortgage |
| Less than 2.0x | 20 (23.5%) | 76,667 (100,877.6%) |
| 2.0x to 2.9x | 5 (5.9%) | 34 (44.7%) |
| 3.0x to 3.9x | 31 (36.5%) | 18 (23.7%) |
| 4.0x or more | 29 (34.1%) | 2 (2.6%) |
| Total | 85 (100.0%) | 76 (100.0%) |
Real Estate Taxes by Mortgage Status in Tickfaw
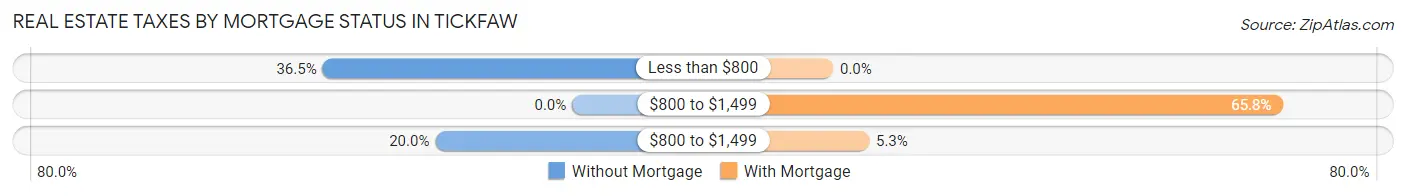
| Property Taxes | Without Mortgage | With Mortgage |
| Less than $800 | 31 (36.5%) | 0 (0.0%) |
| $800 to $1,499 | 0 (0.0%) | 50 (65.8%) |
| $800 to $1,499 | 17 (20.0%) | 4 (5.3%) |
| Total | 85 (100.0%) | 76 (100.0%) |
Health & Disability in Tickfaw
Health Insurance Coverage by Age in Tickfaw
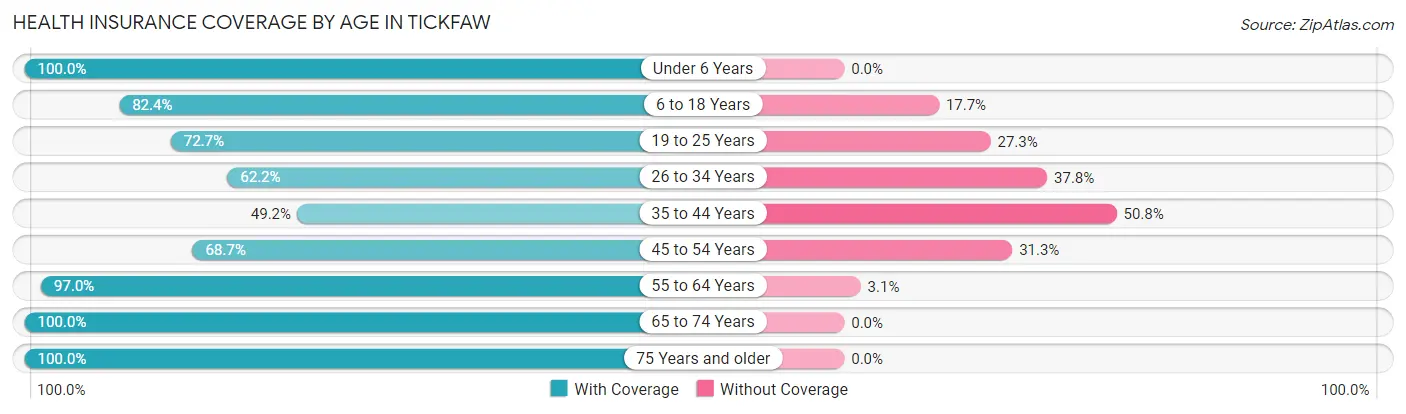
| Age Bracket | With Coverage | Without Coverage |
| Under 6 Years | 121 (100.0%) | 0 (0.0%) |
| 6 to 18 Years | 84 (82.4%) | 18 (17.6%) |
| 19 to 25 Years | 88 (72.7%) | 33 (27.3%) |
| 26 to 34 Years | 74 (62.2%) | 45 (37.8%) |
| 35 to 44 Years | 32 (49.2%) | 33 (50.8%) |
| 45 to 54 Years | 68 (68.7%) | 31 (31.3%) |
| 55 to 64 Years | 127 (97.0%) | 4 (3.0%) |
| 65 to 74 Years | 73 (100.0%) | 0 (0.0%) |
| 75 Years and older | 26 (100.0%) | 0 (0.0%) |
| Total | 693 (80.9%) | 164 (19.1%) |
Health Insurance Coverage by Citizenship Status in Tickfaw
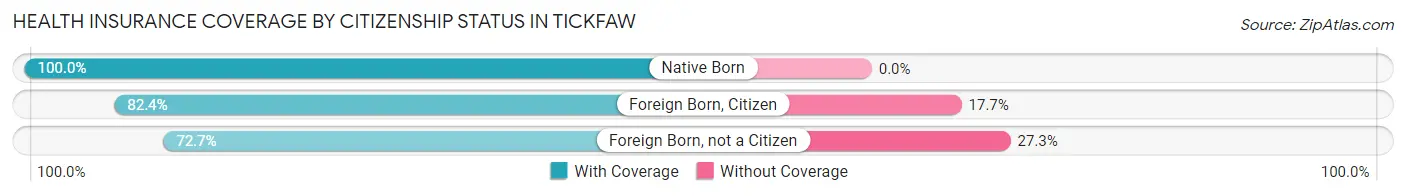
| Citizenship Status | With Coverage | Without Coverage |
| Native Born | 121 (100.0%) | 0 (0.0%) |
| Foreign Born, Citizen | 84 (82.4%) | 18 (17.6%) |
| Foreign Born, not a Citizen | 88 (72.7%) | 33 (27.3%) |
Health Insurance Coverage by Household Income in Tickfaw
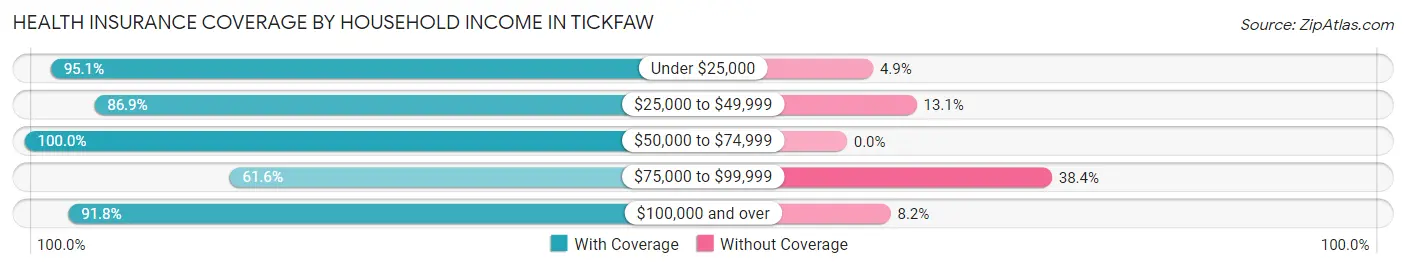
| Household Income | With Coverage | Without Coverage |
| Under $25,000 | 136 (95.1%) | 7 (4.9%) |
| $25,000 to $49,999 | 173 (86.9%) | 26 (13.1%) |
| $50,000 to $74,999 | 30 (100.0%) | 0 (0.0%) |
| $75,000 to $99,999 | 186 (61.6%) | 116 (38.4%) |
| $100,000 and over | 168 (91.8%) | 15 (8.2%) |
Public vs Private Health Insurance Coverage by Age in Tickfaw
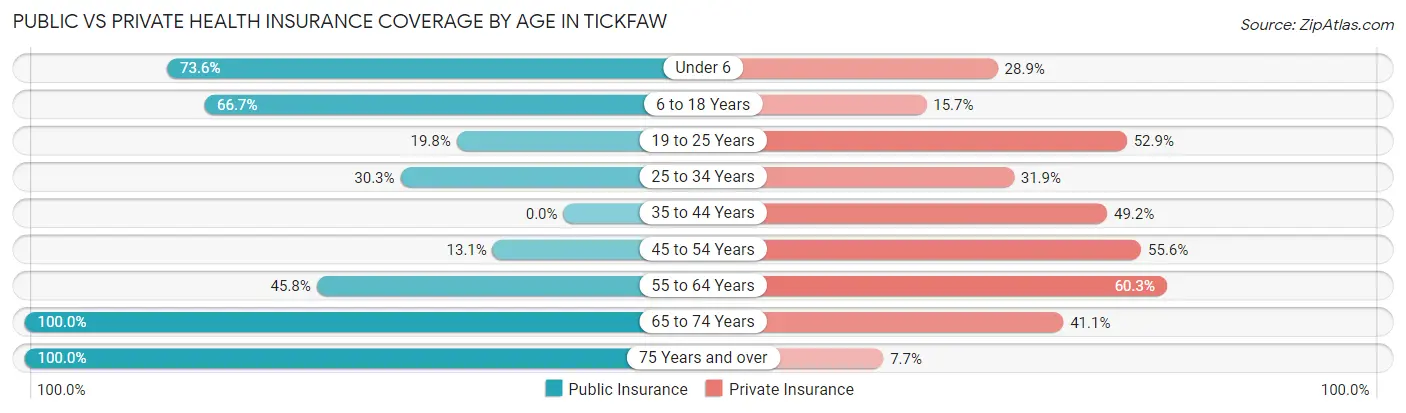
| Age Bracket | Public Insurance | Private Insurance |
| Under 6 | 89 (73.6%) | 35 (28.9%) |
| 6 to 18 Years | 68 (66.7%) | 16 (15.7%) |
| 19 to 25 Years | 24 (19.8%) | 64 (52.9%) |
| 25 to 34 Years | 36 (30.2%) | 38 (31.9%) |
| 35 to 44 Years | 0 (0.0%) | 32 (49.2%) |
| 45 to 54 Years | 13 (13.1%) | 55 (55.6%) |
| 55 to 64 Years | 60 (45.8%) | 79 (60.3%) |
| 65 to 74 Years | 73 (100.0%) | 30 (41.1%) |
| 75 Years and over | 26 (100.0%) | 2 (7.7%) |
| Total | 389 (45.4%) | 351 (41.0%) |
Disability Status by Sex by Age in Tickfaw
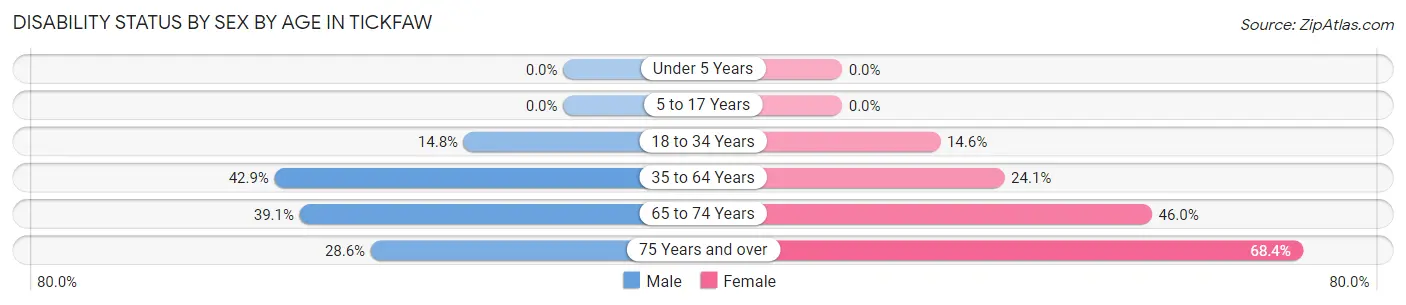
| Age Bracket | Male | Female |
| Under 5 Years | 0 (0.0%) | 0 (0.0%) |
| 5 to 17 Years | 0 (0.0%) | 0 (0.0%) |
| 18 to 34 Years | 22 (14.8%) | 14 (14.6%) |
| 35 to 64 Years | 66 (42.9%) | 34 (24.1%) |
| 65 to 74 Years | 9 (39.1%) | 23 (46.0%) |
| 75 Years and over | 2 (28.6%) | 13 (68.4%) |
Disability Class by Sex by Age in Tickfaw
Disability Class: Hearing Difficulty
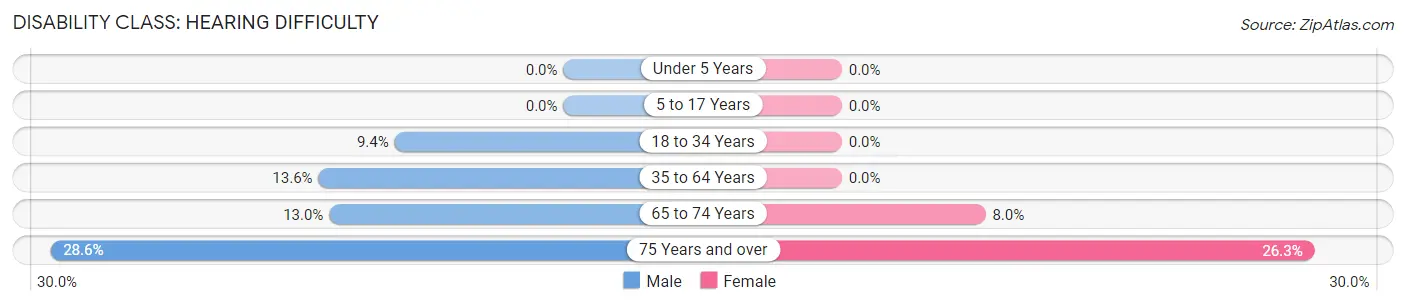
| Age Bracket | Male | Female |
| Under 5 Years | 0 (0.0%) | 0 (0.0%) |
| 5 to 17 Years | 0 (0.0%) | 0 (0.0%) |
| 18 to 34 Years | 14 (9.4%) | 0 (0.0%) |
| 35 to 64 Years | 21 (13.6%) | 0 (0.0%) |
| 65 to 74 Years | 3 (13.0%) | 4 (8.0%) |
| 75 Years and over | 2 (28.6%) | 5 (26.3%) |
Disability Class: Vision Difficulty
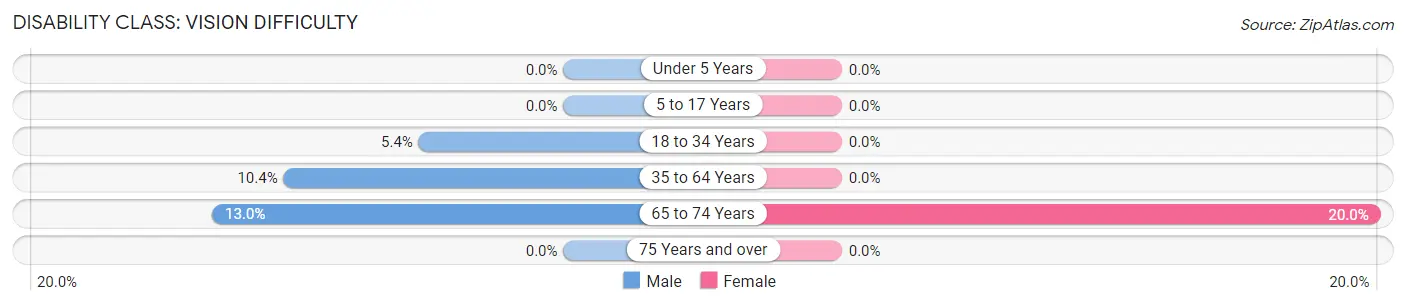
| Age Bracket | Male | Female |
| Under 5 Years | 0 (0.0%) | 0 (0.0%) |
| 5 to 17 Years | 0 (0.0%) | 0 (0.0%) |
| 18 to 34 Years | 8 (5.4%) | 0 (0.0%) |
| 35 to 64 Years | 16 (10.4%) | 0 (0.0%) |
| 65 to 74 Years | 3 (13.0%) | 10 (20.0%) |
| 75 Years and over | 0 (0.0%) | 0 (0.0%) |
Disability Class: Cognitive Difficulty
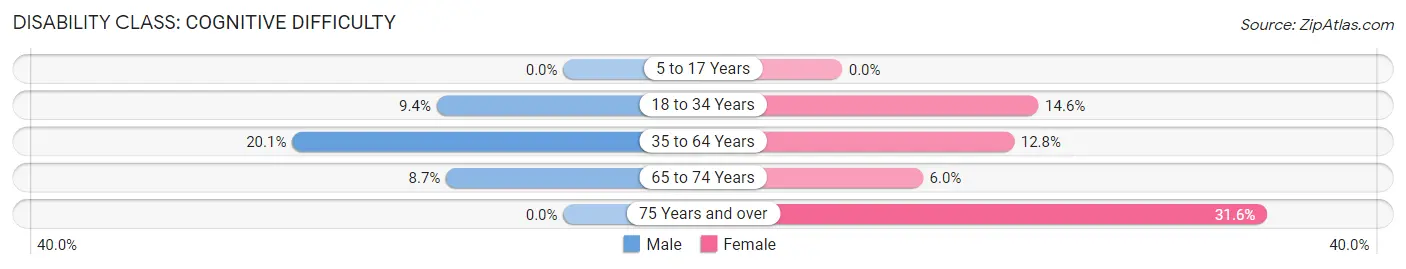
| Age Bracket | Male | Female |
| 5 to 17 Years | 0 (0.0%) | 0 (0.0%) |
| 18 to 34 Years | 14 (9.4%) | 14 (14.6%) |
| 35 to 64 Years | 31 (20.1%) | 18 (12.8%) |
| 65 to 74 Years | 2 (8.7%) | 3 (6.0%) |
| 75 Years and over | 0 (0.0%) | 6 (31.6%) |
Disability Class: Ambulatory Difficulty
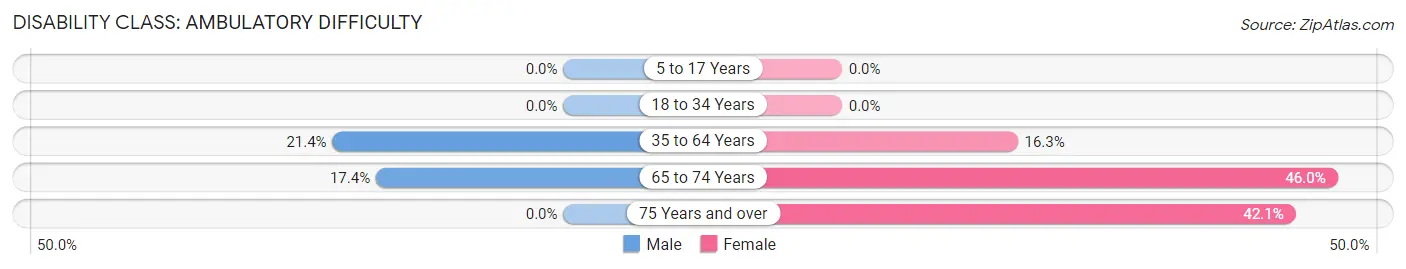
| Age Bracket | Male | Female |
| 5 to 17 Years | 0 (0.0%) | 0 (0.0%) |
| 18 to 34 Years | 0 (0.0%) | 0 (0.0%) |
| 35 to 64 Years | 33 (21.4%) | 23 (16.3%) |
| 65 to 74 Years | 4 (17.4%) | 23 (46.0%) |
| 75 Years and over | 0 (0.0%) | 8 (42.1%) |
Disability Class: Self-Care Difficulty
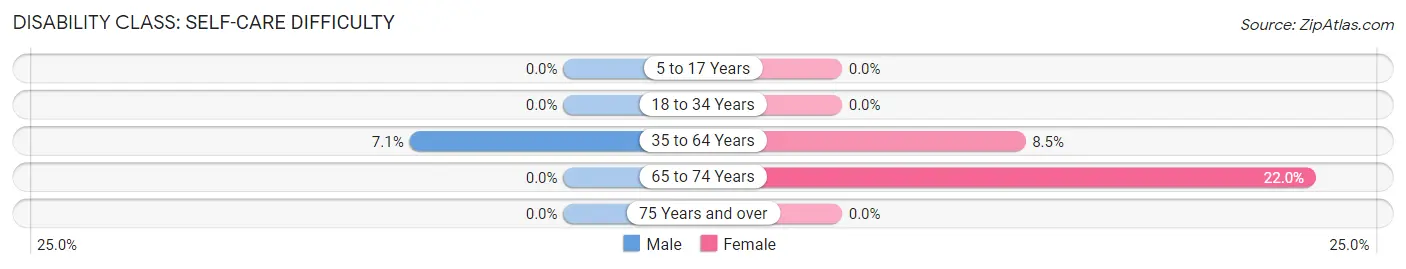
| Age Bracket | Male | Female |
| 5 to 17 Years | 0 (0.0%) | 0 (0.0%) |
| 18 to 34 Years | 0 (0.0%) | 0 (0.0%) |
| 35 to 64 Years | 11 (7.1%) | 12 (8.5%) |
| 65 to 74 Years | 0 (0.0%) | 11 (22.0%) |
| 75 Years and over | 0 (0.0%) | 0 (0.0%) |
Technology Access in Tickfaw
Computing Device Access in Tickfaw
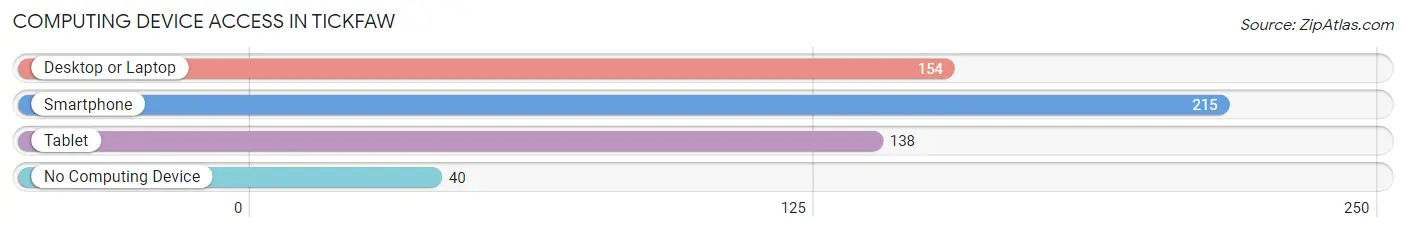
| Device Type | # Households | % Households |
| Desktop or Laptop | 154 | 57.7% |
| Smartphone | 215 | 80.5% |
| Tablet | 138 | 51.7% |
| No Computing Device | 40 | 15.0% |
| Total | 267 | 100.0% |
Internet Access in Tickfaw
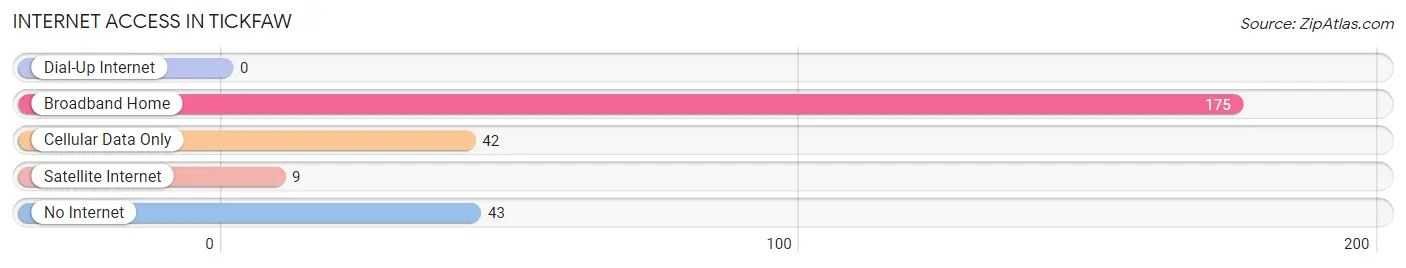
| Internet Type | # Households | % Households |
| Dial-Up Internet | 0 | 0.0% |
| Broadband Home | 175 | 65.5% |
| Cellular Data Only | 42 | 15.7% |
| Satellite Internet | 9 | 3.4% |
| No Internet | 43 | 16.1% |
| Total | 267 | 100.0% |
Tickfaw Summary
Tickfaw is a small unincorporated community located in Tangipahoa Parish, Louisiana. It is situated along the Tickfaw River, which is a tributary of the larger Pearl River. The town is located approximately 40 miles north of New Orleans and is part of the Hammond Metropolitan Statistical Area. As of the 2010 census, the population of Tickfaw was 1,279.
History
The area that is now Tickfaw was first settled by Native Americans, who used the area for hunting and fishing. The first European settlers arrived in the area in the early 1800s. The town was originally known as “Tickfaw Landing” and was a popular stop for steamboats traveling up and down the river. The town was officially incorporated in 1845 and was named after the nearby Tickfaw River.
In the late 1800s, the town began to grow and prosper due to the lumber industry. The town was home to several sawmills and lumberyards, which provided employment for many of the town’s residents. The town also had a thriving agricultural industry, with many of the town’s residents growing cotton, corn, and other crops.
In the early 1900s, the town began to decline due to the decline of the lumber industry. Many of the town’s residents moved away in search of better economic opportunities. The town’s population continued to decline until the 1950s, when the town began to experience a resurgence due to the growth of the nearby city of Hammond.
Geography
Tickfaw is located in southeastern Louisiana, approximately 40 miles north of New Orleans. The town is situated along the Tickfaw River, which is a tributary of the larger Pearl River. The town is located in Tangipahoa Parish and is part of the Hammond Metropolitan Statistical Area.
The town has a total area of 1.3 square miles, all of which is land. The town is located at an elevation of 25 feet above sea level. The climate in Tickfaw is humid subtropical, with hot, humid summers and mild winters.
Economy
The economy of Tickfaw is largely based on agriculture and tourism. The town is home to several farms, which produce cotton, corn, and other crops. The town is also home to several tourist attractions, including the Tickfaw State Park and the Tickfaw River.
The town is also home to several small businesses, including restaurants, shops, and other services. The town is also home to several manufacturing companies, which produce a variety of products, including furniture, clothing, and other items.
Demographics
As of the 2010 census, the population of Tickfaw was 1,279. The racial makeup of the town was 79.3% White, 17.2% African American, 0.2% Native American, 0.2% Asian, 0.1% Pacific Islander, and 2.2% from other races. Hispanic or Latino of any race were 2.7% of the population.
The median household income in Tickfaw was $37,917, and the median family income was $45,625. The per capita income in Tickfaw was $17,917. About 17.2% of families and 20.2% of the population were below the poverty line, including 28.2% of those under age 18 and 11.2% of those age 65 or over.
Common Questions
What is Per Capita Income in Tickfaw?
Per Capita income in Tickfaw is $21,000.
What is the Median Family Income in Tickfaw?
Median Family Income in Tickfaw is $79,583.
What is the Median Household income in Tickfaw?
Median Household Income in Tickfaw is $48,281.
What is Income or Wage Gap in Tickfaw?
Income or Wage Gap in Tickfaw is 32.4%.
Women in Tickfaw earn 67.6 cents for every dollar earned by a man.
What is Inequality or Gini Index in Tickfaw?
Inequality or Gini Index in Tickfaw is 0.42.
What is the Total Population of Tickfaw?
Total Population of Tickfaw is 857.
What is the Total Male Population of Tickfaw?
Total Male Population of Tickfaw is 443.
What is the Total Female Population of Tickfaw?
Total Female Population of Tickfaw is 414.
What is the Ratio of Males per 100 Females in Tickfaw?
There are 107.00 Males per 100 Females in Tickfaw.
What is the Ratio of Females per 100 Males in Tickfaw?
There are 93.45 Females per 100 Males in Tickfaw.
What is the Median Population Age in Tickfaw?
Median Population Age in Tickfaw is 28.9 Years.
What is the Average Family Size in Tickfaw
Average Family Size in Tickfaw is 4.2 People.
What is the Average Household Size in Tickfaw
Average Household Size in Tickfaw is 3.2 People.
How Large is the Labor Force in Tickfaw?
There are 416 People in the Labor Forcein in Tickfaw.
What is the Percentage of People in the Labor Force in Tickfaw?
63.8% of People are in the Labor Force in Tickfaw.
What is the Unemployment Rate in Tickfaw?
Unemployment Rate in Tickfaw is 3.8%.