Sulphur, LA Map & Demographics
Sulphur Map
Sulphur Overview
$28,405
PER CAPITA INCOME
$66,007
AVG FAMILY INCOME
$53,606
AVG HOUSEHOLD INCOME
56.4%
WAGE / INCOME GAP [ % ]
43.6¢/ $1
WAGE / INCOME GAP [ $ ]
$8,882
FAMILY INCOME DEFICIT
0.44
INEQUALITY / GINI INDEX
21,286
TOTAL POPULATION
10,070
MALE POPULATION
11,216
FEMALE POPULATION
89.78
MALES / 100 FEMALES
111.38
FEMALES / 100 MALES
38.9
MEDIAN AGE
3.4
AVG FAMILY SIZE
2.5
AVG HOUSEHOLD SIZE
9,274
LABOR FORCE [ PEOPLE ]
55.9%
PERCENT IN LABOR FORCE
5.6%
UNEMPLOYMENT RATE
Sulphur Area Codes
Income in Sulphur
Income Overview in Sulphur
Per Capita Income in Sulphur is $28,405, while median incomes of families and households are $66,007 and $53,606 respectively.
| Characteristic | Number | Measure |
| Per Capita Income | 21,286 | $28,405 |
| Median Family Income | 4,912 | $66,007 |
| Mean Family Income | 4,912 | $81,403 |
| Median Household Income | 8,407 | $53,606 |
| Mean Household Income | 8,407 | $68,893 |
| Income Deficit | 4,912 | $8,882 |
| Wage / Income Gap (%) | 21,286 | 56.36% |
| Wage / Income Gap ($) | 21,286 | 43.64¢ per $1 |
| Gini / Inequality Index | 21,286 | 0.44 |
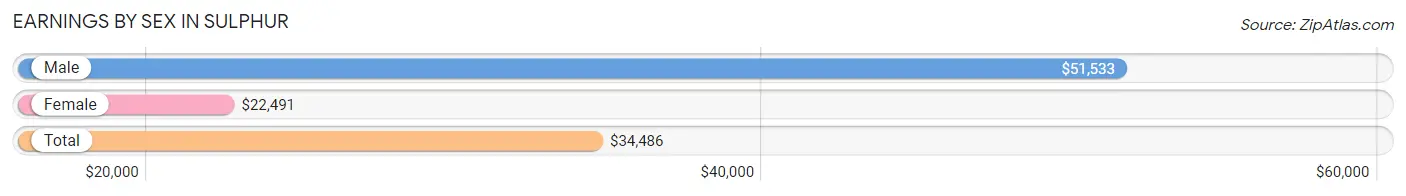
Earnings by Sex in Sulphur
Average Earnings in Sulphur are $34,486, $51,533 for men and $22,491 for women, a difference of 56.4%.
| Sex | Number | Average Earnings |
| Male | 5,429 (55.5%) | $51,533 |
| Female | 4,348 (44.5%) | $22,491 |
| Total | 9,777 (100.0%) | $34,486 |
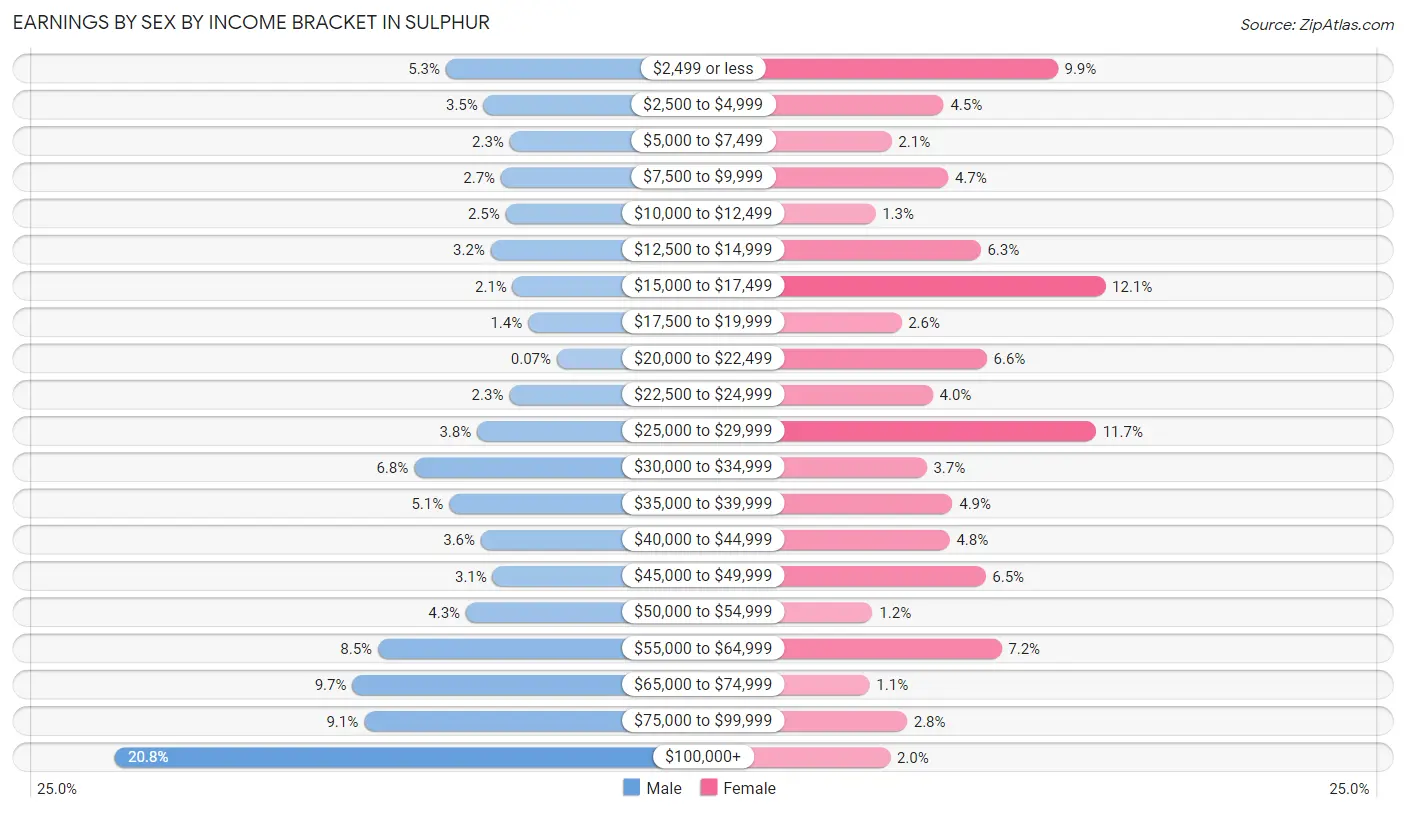
Earnings by Sex by Income Bracket in Sulphur
The most common earnings brackets in Sulphur are $100,000+ for men (1,127 | 20.8%) and $15,000 to $17,499 for women (526 | 12.1%).
| Income | Male | Female |
| $2,499 or less | 286 (5.3%) | 429 (9.9%) |
| $2,500 to $4,999 | 190 (3.5%) | 197 (4.5%) |
| $5,000 to $7,499 | 124 (2.3%) | 91 (2.1%) |
| $7,500 to $9,999 | 146 (2.7%) | 206 (4.7%) |
| $10,000 to $12,499 | 134 (2.5%) | 58 (1.3%) |
| $12,500 to $14,999 | 172 (3.2%) | 272 (6.3%) |
| $15,000 to $17,499 | 116 (2.1%) | 526 (12.1%) |
| $17,500 to $19,999 | 77 (1.4%) | 111 (2.5%) |
| $20,000 to $22,499 | 4 (0.1%) | 285 (6.6%) |
| $22,500 to $24,999 | 125 (2.3%) | 175 (4.0%) |
| $25,000 to $29,999 | 207 (3.8%) | 507 (11.7%) |
| $30,000 to $34,999 | 367 (6.8%) | 162 (3.7%) |
| $35,000 to $39,999 | 278 (5.1%) | 215 (4.9%) |
| $40,000 to $44,999 | 197 (3.6%) | 209 (4.8%) |
| $45,000 to $49,999 | 167 (3.1%) | 282 (6.5%) |
| $50,000 to $54,999 | 235 (4.3%) | 52 (1.2%) |
| $55,000 to $64,999 | 459 (8.5%) | 315 (7.2%) |
| $65,000 to $74,999 | 524 (9.7%) | 46 (1.1%) |
| $75,000 to $99,999 | 494 (9.1%) | 122 (2.8%) |
| $100,000+ | 1,127 (20.8%) | 88 (2.0%) |
| Total | 5,429 (100.0%) | 4,348 (100.0%) |
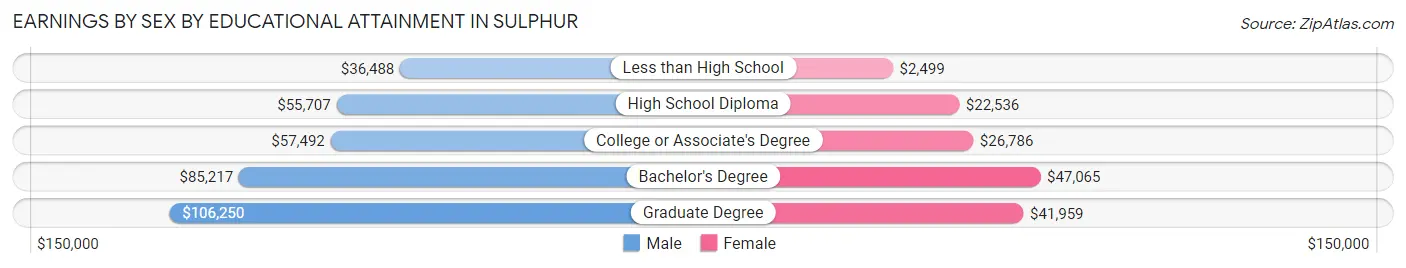
Earnings by Sex by Educational Attainment in Sulphur
Average earnings in Sulphur are $56,487 for men and $25,094 for women, a difference of 55.6%. Men with an educational attainment of graduate degree enjoy the highest average annual earnings of $106,250, while those with less than high school education earn the least with $36,488. Women with an educational attainment of bachelor's degree earn the most with the average annual earnings of $47,065, while those with less than high school education have the smallest earnings of $2,499.
| Educational Attainment | Male Income | Female Income |
| Less than High School | $36,488 | $2,499 |
| High School Diploma | $55,707 | $22,536 |
| College or Associate's Degree | $57,492 | $26,786 |
| Bachelor's Degree | $85,217 | $47,065 |
| Graduate Degree | $106,250 | $41,959 |
| Total | $56,487 | $25,094 |
Family Income in Sulphur
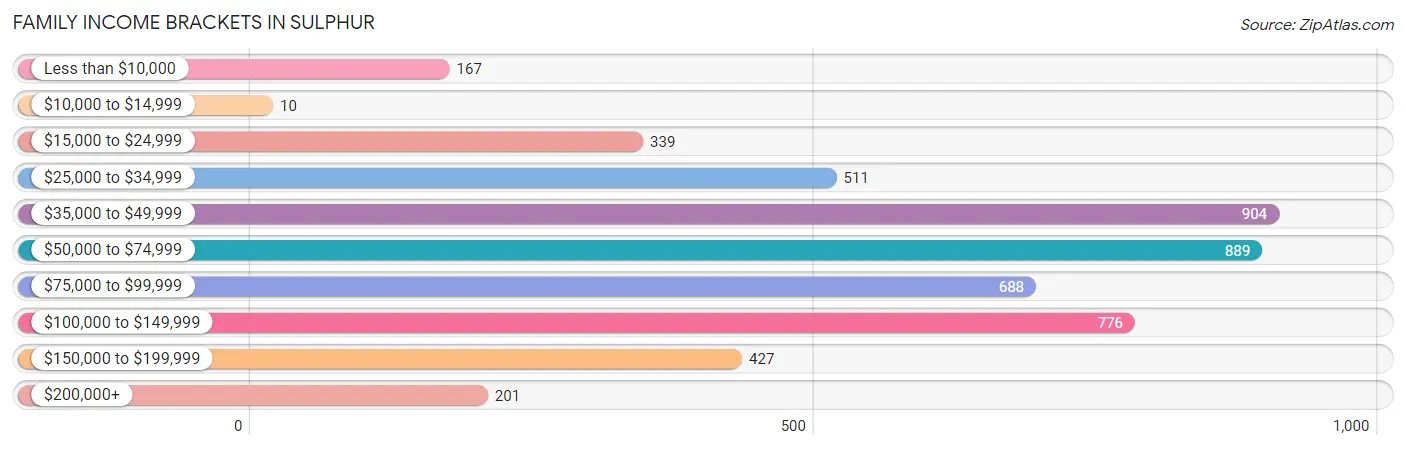
Family Income Brackets in Sulphur
According to the Sulphur family income data, there are 904 families falling into the $35,000 to $49,999 income range, which is the most common income bracket and makes up 18.4% of all families. Conversely, the $10,000 to $14,999 income bracket is the least frequent group with only 10 families (0.2%) belonging to this category.
| Income Bracket | # Families | % Families |
| Less than $10,000 | 167 | 3.4% |
| $10,000 to $14,999 | 10 | 0.2% |
| $15,000 to $24,999 | 339 | 6.9% |
| $25,000 to $34,999 | 511 | 10.4% |
| $35,000 to $49,999 | 904 | 18.4% |
| $50,000 to $74,999 | 889 | 18.1% |
| $75,000 to $99,999 | 688 | 14.0% |
| $100,000 to $149,999 | 776 | 15.8% |
| $150,000 to $199,999 | 427 | 8.7% |
| $200,000+ | 201 | 4.1% |
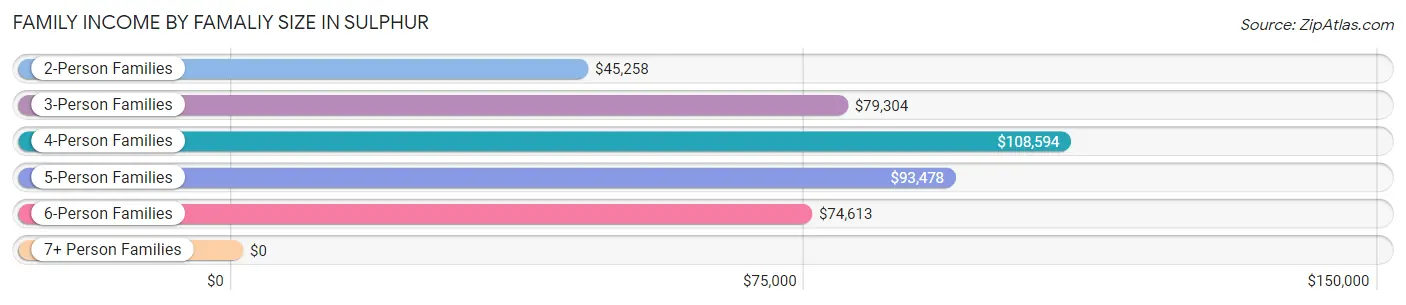
Family Income by Famaliy Size in Sulphur
4-person families (572 | 11.6%) account for the highest median family income in Sulphur with $108,594 per family, while 4-person families (572 | 11.6%) have the highest median income of $27,148 per family member.
| Income Bracket | # Families | Median Income |
| 2-Person Families | 2,292 (46.7%) | $45,258 |
| 3-Person Families | 1,100 (22.4%) | $79,304 |
| 4-Person Families | 572 (11.6%) | $108,594 |
| 5-Person Families | 394 (8.0%) | $93,478 |
| 6-Person Families | 510 (10.4%) | $74,613 |
| 7+ Person Families | 44 (0.9%) | $0 |
| Total | 4,912 (100.0%) | $66,007 |
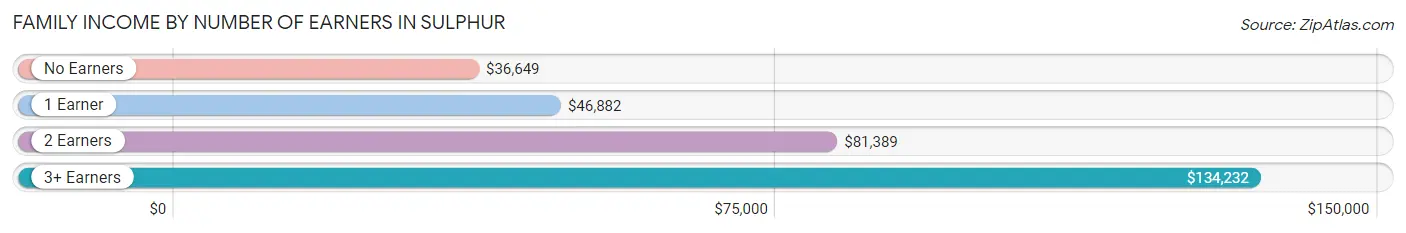
Family Income by Number of Earners in Sulphur
The median family income in Sulphur is $66,007, with families comprising 3+ earners (485) having the highest median family income of $134,232, while families with no earners (1,019) have the lowest median family income of $36,649, accounting for 9.9% and 20.7% of families, respectively.
| Number of Earners | # Families | Median Income |
| No Earners | 1,019 (20.7%) | $36,649 |
| 1 Earner | 1,710 (34.8%) | $46,882 |
| 2 Earners | 1,698 (34.6%) | $81,389 |
| 3+ Earners | 485 (9.9%) | $134,232 |
| Total | 4,912 (100.0%) | $66,007 |
Household Income in Sulphur
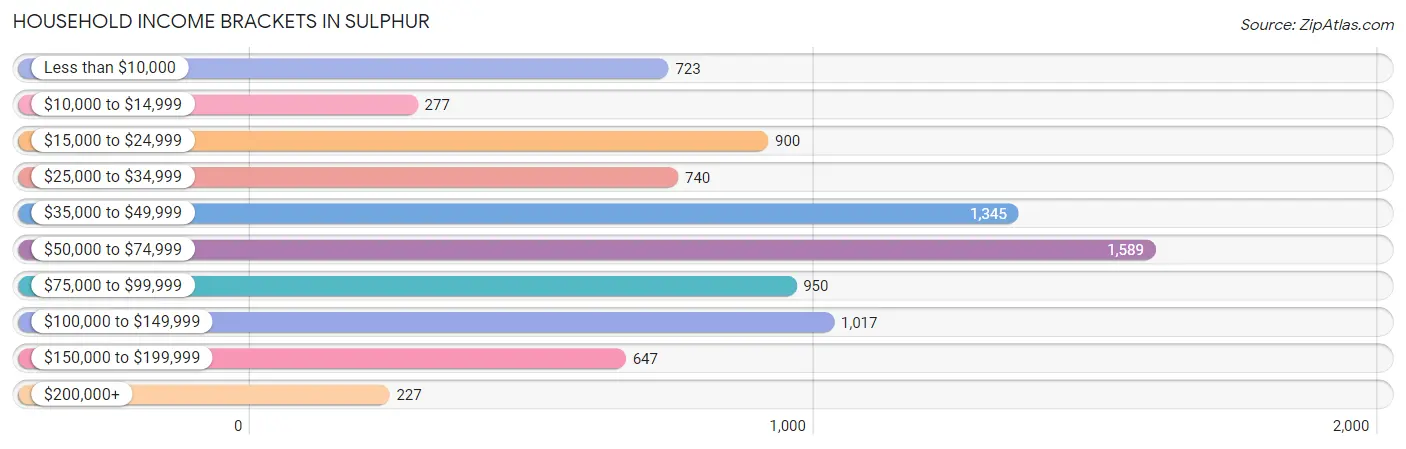
Household Income Brackets in Sulphur
With 1,589 households falling in the category, the $50,000 to $74,999 income range is the most frequent in Sulphur, accounting for 18.9% of all households. In contrast, only 227 households (2.7%) fall into the $200,000+ income bracket, making it the least populous group.
| Income Bracket | # Households | % Households |
| Less than $10,000 | 723 | 8.6% |
| $10,000 to $14,999 | 277 | 3.3% |
| $15,000 to $24,999 | 900 | 10.7% |
| $25,000 to $34,999 | 740 | 8.8% |
| $35,000 to $49,999 | 1,345 | 16.0% |
| $50,000 to $74,999 | 1,589 | 18.9% |
| $75,000 to $99,999 | 950 | 11.3% |
| $100,000 to $149,999 | 1,017 | 12.1% |
| $150,000 to $199,999 | 647 | 7.7% |
| $200,000+ | 227 | 2.7% |
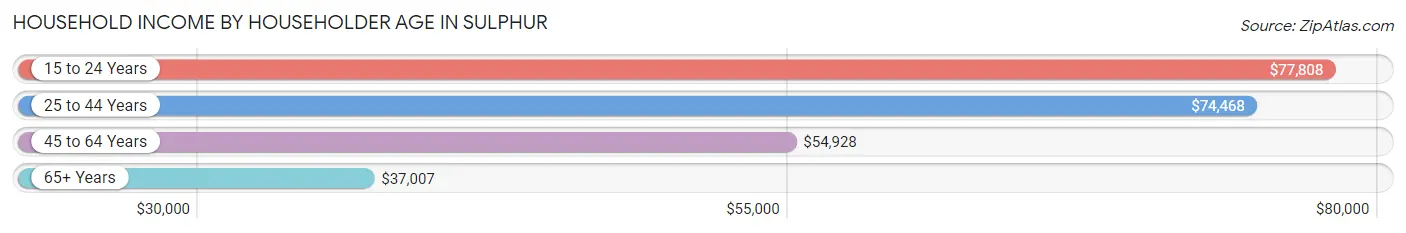
Household Income by Householder Age in Sulphur
The median household income in Sulphur is $53,606, with the highest median household income of $77,808 found in the 15 to 24 years age bracket for the primary householder. A total of 271 households (3.2%) fall into this category. Meanwhile, the 65+ years age bracket for the primary householder has the lowest median household income of $37,007, with 2,505 households (29.8%) in this group.
| Income Bracket | # Households | Median Income |
| 15 to 24 Years | 271 (3.2%) | $77,808 |
| 25 to 44 Years | 2,716 (32.3%) | $74,468 |
| 45 to 64 Years | 2,915 (34.7%) | $54,928 |
| 65+ Years | 2,505 (29.8%) | $37,007 |
| Total | 8,407 (100.0%) | $53,606 |
Poverty in Sulphur
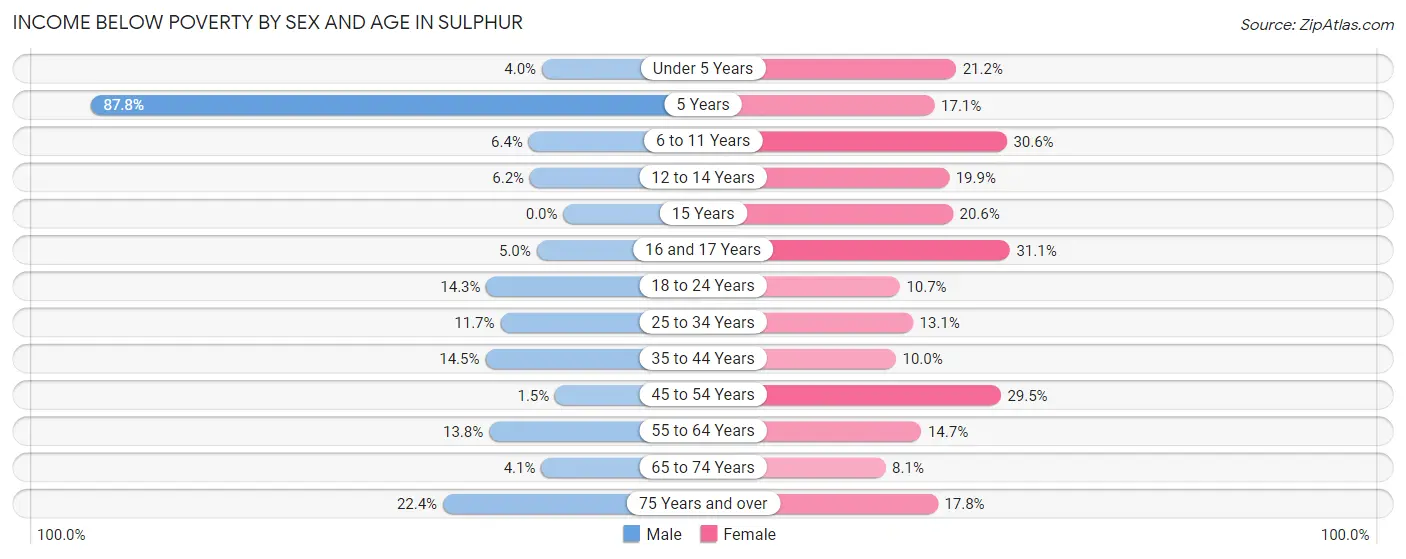
Income Below Poverty by Sex and Age in Sulphur
With 10.9% poverty level for males and 17.0% for females among the residents of Sulphur, 5 year old males and 16 and 17 year old females are the most vulnerable to poverty, with 179 males (87.7%) and 80 females (31.1%) in their respective age groups living below the poverty level.
| Age Bracket | Male | Female |
| Under 5 Years | 24 (4.0%) | 192 (21.1%) |
| 5 Years | 179 (87.7%) | 24 (17.1%) |
| 6 to 11 Years | 47 (6.4%) | 213 (30.6%) |
| 12 to 14 Years | 25 (6.2%) | 80 (19.9%) |
| 15 Years | 0 (0.0%) | 59 (20.6%) |
| 16 and 17 Years | 6 (5.0%) | 80 (31.1%) |
| 18 to 24 Years | 115 (14.3%) | 98 (10.7%) |
| 25 to 34 Years | 148 (11.7%) | 200 (13.1%) |
| 35 to 44 Years | 212 (14.5%) | 131 (10.0%) |
| 45 to 54 Years | 20 (1.5%) | 374 (29.4%) |
| 55 to 64 Years | 143 (13.8%) | 204 (14.7%) |
| 65 to 74 Years | 52 (4.1%) | 105 (8.1%) |
| 75 Years and over | 118 (22.4%) | 134 (17.7%) |
| Total | 1,089 (10.9%) | 1,894 (17.0%) |
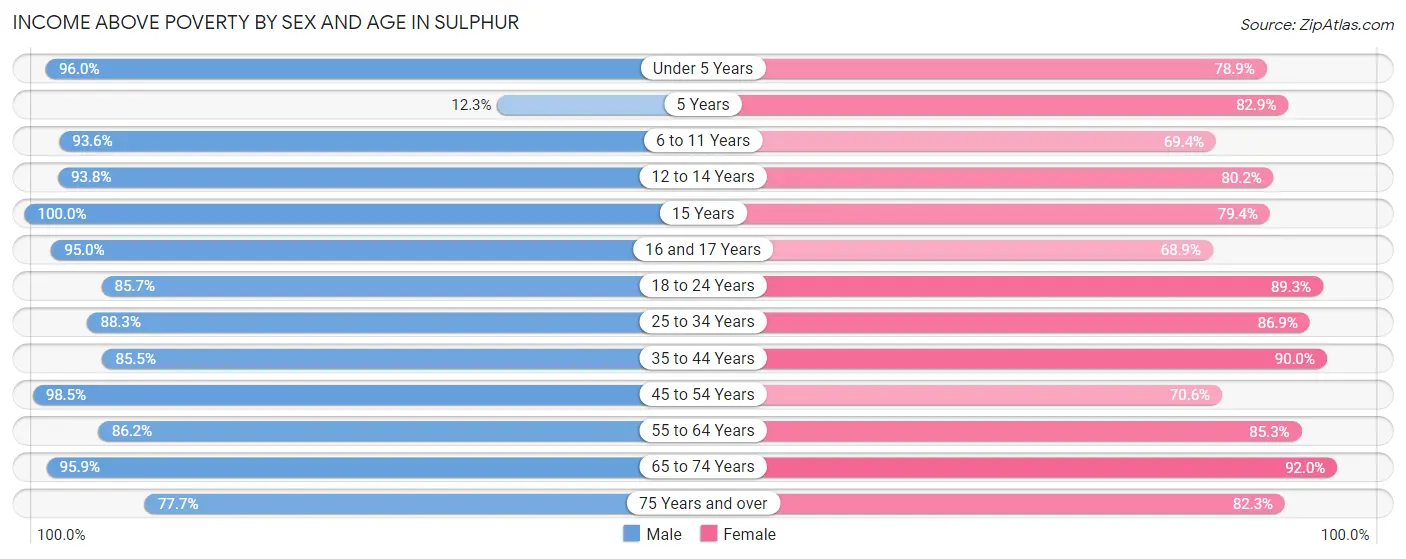
Income Above Poverty by Sex and Age in Sulphur
According to the poverty statistics in Sulphur, males aged 15 years and females aged 65 to 74 years are the age groups that are most secure financially, with 100.0% of males and 91.9% of females in these age groups living above the poverty line.
| Age Bracket | Male | Female |
| Under 5 Years | 579 (96.0%) | 716 (78.8%) |
| 5 Years | 25 (12.2%) | 116 (82.9%) |
| 6 to 11 Years | 683 (93.6%) | 484 (69.4%) |
| 12 to 14 Years | 378 (93.8%) | 323 (80.1%) |
| 15 Years | 282 (100.0%) | 228 (79.4%) |
| 16 and 17 Years | 115 (95.0%) | 177 (68.9%) |
| 18 to 24 Years | 690 (85.7%) | 818 (89.3%) |
| 25 to 34 Years | 1,118 (88.3%) | 1,322 (86.9%) |
| 35 to 44 Years | 1,252 (85.5%) | 1,183 (90.0%) |
| 45 to 54 Years | 1,289 (98.5%) | 896 (70.6%) |
| 55 to 64 Years | 894 (86.2%) | 1,184 (85.3%) |
| 65 to 74 Years | 1,217 (95.9%) | 1,199 (91.9%) |
| 75 Years and over | 410 (77.6%) | 621 (82.3%) |
| Total | 8,932 (89.1%) | 9,267 (83.0%) |
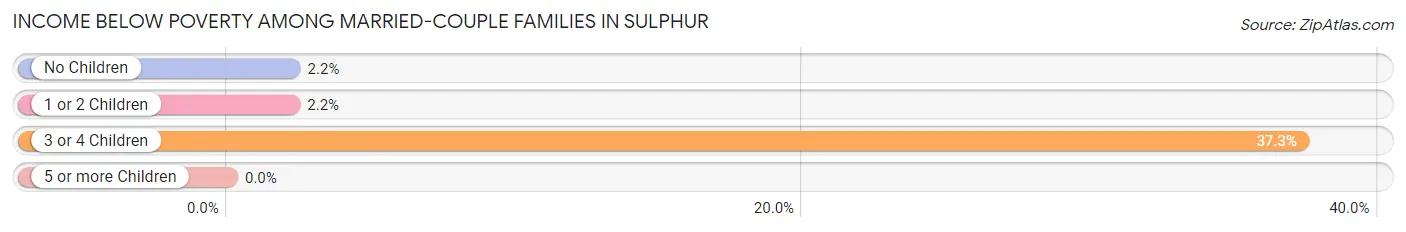
Income Below Poverty Among Married-Couple Families in Sulphur
The poverty statistics for married-couple families in Sulphur show that 6.2% or 217 of the total 3,484 families live below the poverty line. Families with 3 or 4 children have the highest poverty rate of 37.3%, comprising of 151 families. On the other hand, families with 5 or more children have the lowest poverty rate of 0.0%, which includes 0 families.
| Children | Above Poverty | Below Poverty |
| No Children | 1,888 (97.8%) | 42 (2.2%) |
| 1 or 2 Children | 1,081 (97.8%) | 24 (2.2%) |
| 3 or 4 Children | 254 (62.7%) | 151 (37.3%) |
| 5 or more Children | 44 (100.0%) | 0 (0.0%) |
| Total | 3,267 (93.8%) | 217 (6.2%) |
Income Below Poverty Among Single-Parent Households in Sulphur
According to the poverty data in Sulphur, 11.3% or 30 single-father households and 24.1% or 280 single-mother households are living below the poverty line. Among single-father households, those with no children have the highest poverty rate, with 17 households (18.9%) experiencing poverty. Likewise, among single-mother households, those with 1 or 2 children have the highest poverty rate, with 252 households (40.7%) falling below the poverty line.
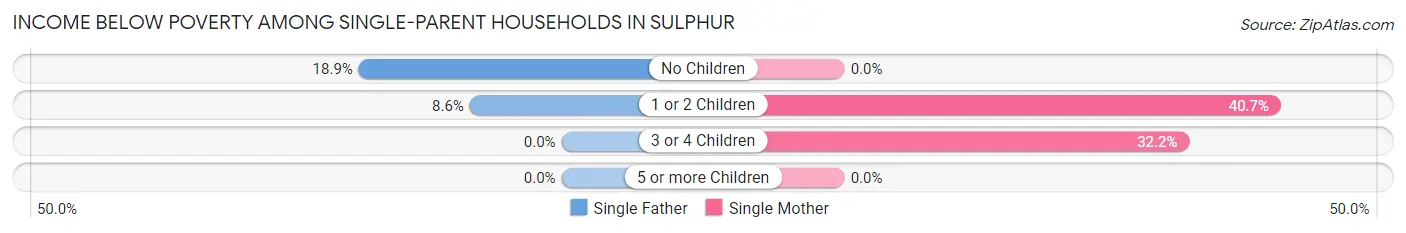
| Children | Single Father | Single Mother |
| No Children | 17 (18.9%) | 0 (0.0%) |
| 1 or 2 Children | 13 (8.6%) | 252 (40.7%) |
| 3 or 4 Children | 0 (0.0%) | 28 (32.2%) |
| 5 or more Children | 0 (0.0%) | 0 (0.0%) |
| Total | 30 (11.3%) | 280 (24.1%) |
Income Below Poverty Among Married-Couple vs Single-Parent Households in Sulphur
The poverty data for Sulphur shows that 217 of the married-couple family households (6.2%) and 310 of the single-parent households (21.7%) are living below the poverty level. Within the married-couple family households, those with 3 or 4 children have the highest poverty rate, with 151 households (37.3%) falling below the poverty line. Among the single-parent households, those with 1 or 2 children have the highest poverty rate, with 265 household (34.4%) living below poverty.
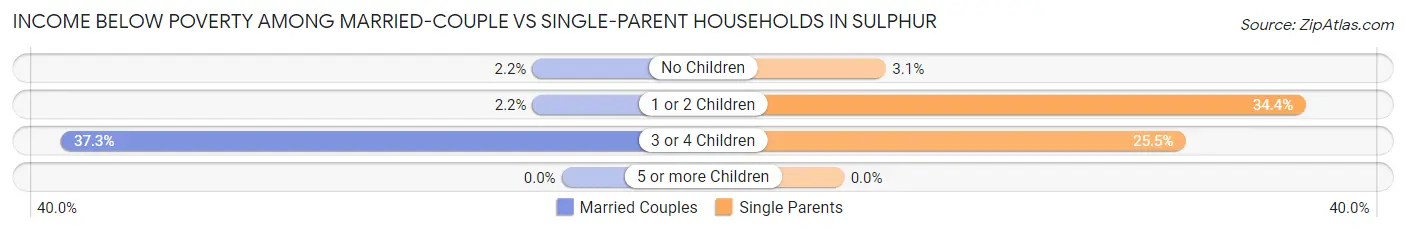
| Children | Married-Couple Families | Single-Parent Households |
| No Children | 42 (2.2%) | 17 (3.1%) |
| 1 or 2 Children | 24 (2.2%) | 265 (34.4%) |
| 3 or 4 Children | 151 (37.3%) | 28 (25.5%) |
| 5 or more Children | 0 (0.0%) | 0 (0.0%) |
| Total | 217 (6.2%) | 310 (21.7%) |
Race in Sulphur
The most populous races in Sulphur are White / Caucasian (18,271 | 85.8%), Black / African American (1,776 | 8.3%), and Hispanic or Latino (1,001 | 4.7%).
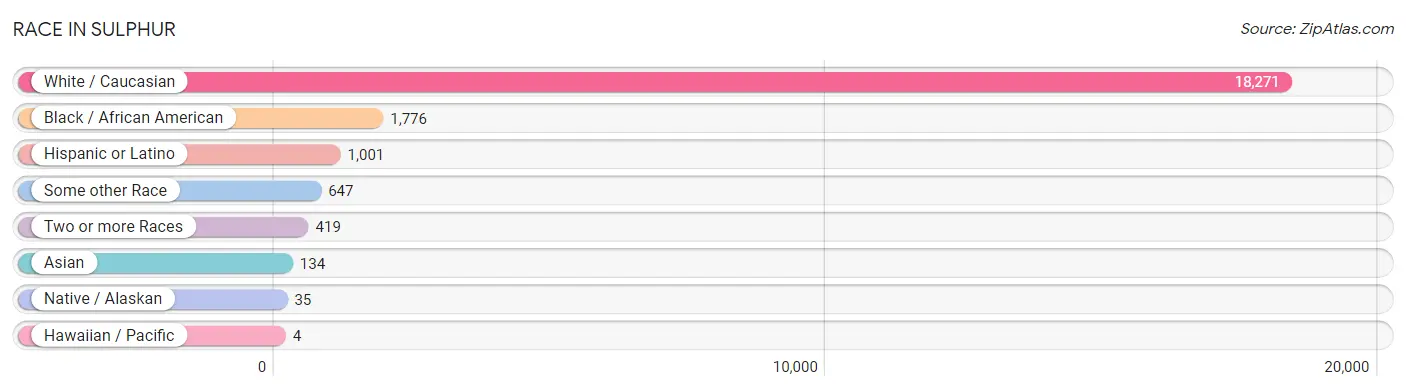
| Race | # Population | % Population |
| Asian | 134 | 0.6% |
| Black / African American | 1,776 | 8.3% |
| Hawaiian / Pacific | 4 | 0.0% |
| Hispanic or Latino | 1,001 | 4.7% |
| Native / Alaskan | 35 | 0.2% |
| White / Caucasian | 18,271 | 85.8% |
| Two or more Races | 419 | 2.0% |
| Some other Race | 647 | 3.0% |
| Total | 21,286 | 100.0% |
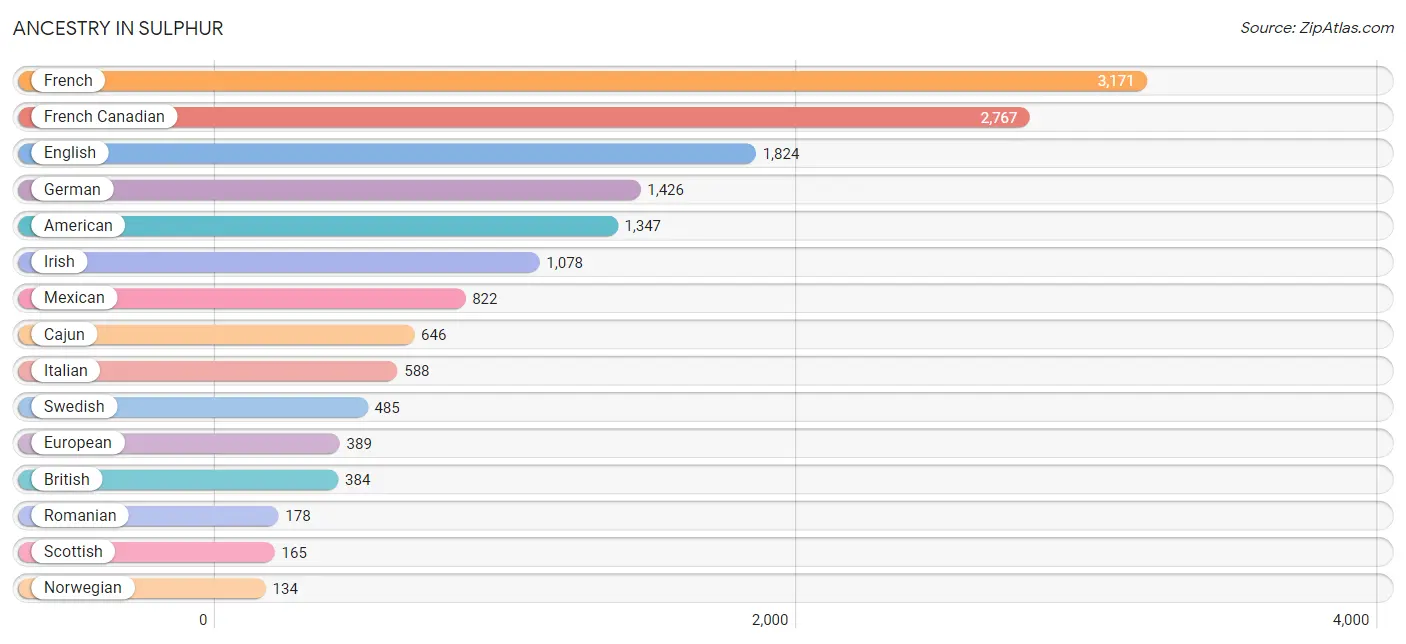
Ancestry in Sulphur
The most populous ancestries reported in Sulphur are French (3,171 | 14.9%), French Canadian (2,767 | 13.0%), English (1,824 | 8.6%), German (1,426 | 6.7%), and American (1,347 | 6.3%), together accounting for 49.5% of all Sulphur residents.
| Ancestry | # Population | % Population |
| African | 6 | 0.0% |
| American | 1,347 | 6.3% |
| Arab | 27 | 0.1% |
| Bhutanese | 43 | 0.2% |
| British | 384 | 1.8% |
| Burmese | 28 | 0.1% |
| Cajun | 646 | 3.0% |
| Canadian | 1 | 0.0% |
| Central American | 17 | 0.1% |
| Cherokee | 59 | 0.3% |
| Choctaw | 8 | 0.0% |
| Colombian | 17 | 0.1% |
| Croatian | 6 | 0.0% |
| Cuban | 50 | 0.2% |
| Czech | 11 | 0.1% |
| Danish | 13 | 0.1% |
| Dutch | 48 | 0.2% |
| Eastern European | 26 | 0.1% |
| English | 1,824 | 8.6% |
| European | 389 | 1.8% |
| French | 3,171 | 14.9% |
| French Canadian | 2,767 | 13.0% |
| German | 1,426 | 6.7% |
| Greek | 126 | 0.6% |
| Guamanian / Chamorro | 4 | 0.0% |
| Haitian | 36 | 0.2% |
| Honduran | 13 | 0.1% |
| Irish | 1,078 | 5.1% |
| Iroquois | 6 | 0.0% |
| Italian | 588 | 2.8% |
| Korean | 80 | 0.4% |
| Lebanese | 20 | 0.1% |
| Mexican | 822 | 3.9% |
| Nigerian | 110 | 0.5% |
| Norwegian | 134 | 0.6% |
| Pakistani | 13 | 0.1% |
| Panamanian | 4 | 0.0% |
| Peruvian | 81 | 0.4% |
| Polish | 103 | 0.5% |
| Portuguese | 52 | 0.2% |
| Puerto Rican | 5 | 0.0% |
| Romanian | 178 | 0.8% |
| Scandinavian | 26 | 0.1% |
| Scotch-Irish | 85 | 0.4% |
| Scottish | 165 | 0.8% |
| South American | 98 | 0.5% |
| Spaniard | 9 | 0.0% |
| Subsaharan African | 116 | 0.5% |
| Swedish | 485 | 2.3% |
| Swiss | 21 | 0.1% |
| Syrian | 7 | 0.0% |
| Thai | 3 | 0.0% |
| Turkish | 7 | 0.0% |
| Welsh | 33 | 0.2% |
| West Indian | 2 | 0.0% | View All 55 Rows |
Immigrants in Sulphur
The most numerous immigrant groups reported in Sulphur came from Latin America (332 | 1.6%), Europe (207 | 1.0%), Central America (197 | 0.9%), Mexico (193 | 0.9%), and Eastern Europe (178 | 0.8%), together accounting for 5.2% of all Sulphur residents.
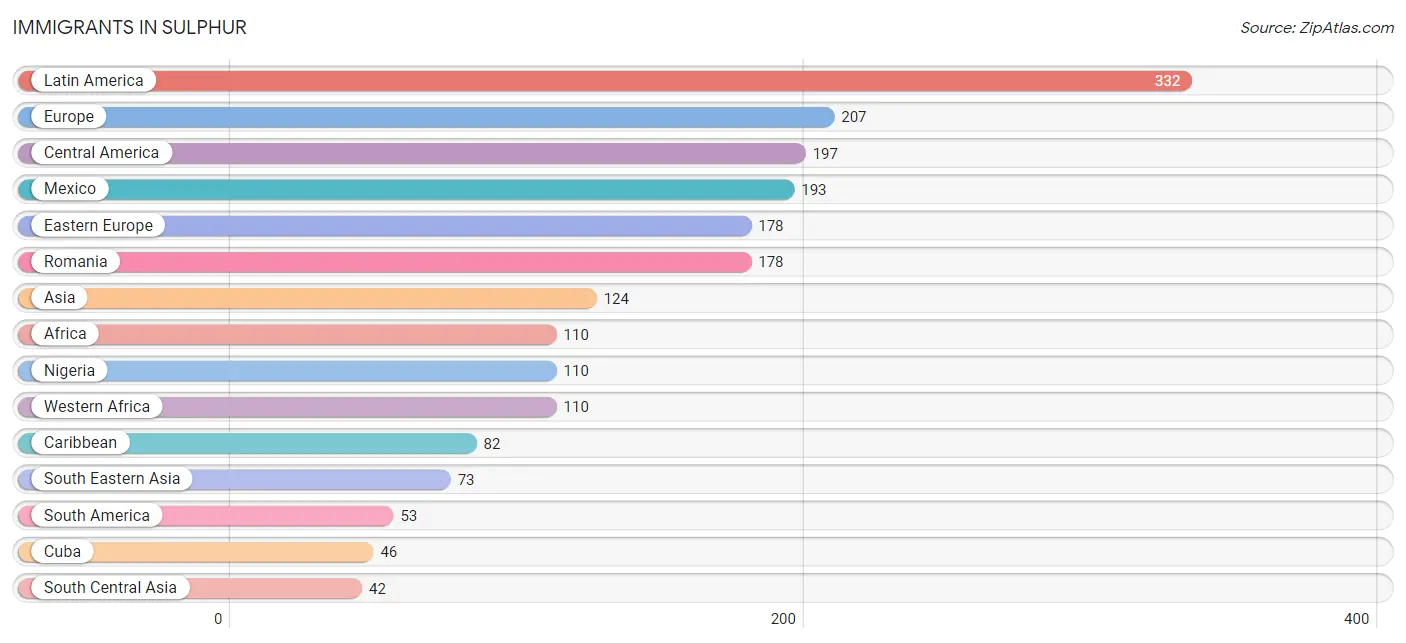
| Immigration Origin | # Population | % Population |
| Africa | 110 | 0.5% |
| Asia | 124 | 0.6% |
| Canada | 4 | 0.0% |
| Caribbean | 82 | 0.4% |
| Central America | 197 | 0.9% |
| Colombia | 17 | 0.1% |
| Cuba | 46 | 0.2% |
| Eastern Asia | 9 | 0.0% |
| Eastern Europe | 178 | 0.8% |
| Europe | 207 | 1.0% |
| Greece | 24 | 0.1% |
| Haiti | 36 | 0.2% |
| India | 23 | 0.1% |
| Korea | 9 | 0.0% |
| Laos | 10 | 0.1% |
| Latin America | 332 | 1.6% |
| Mexico | 193 | 0.9% |
| Nigeria | 110 | 0.5% |
| Northern Europe | 5 | 0.0% |
| Pakistan | 19 | 0.1% |
| Panama | 4 | 0.0% |
| Peru | 29 | 0.1% |
| Philippines | 19 | 0.1% |
| Romania | 178 | 0.8% |
| South America | 53 | 0.3% |
| South Central Asia | 42 | 0.2% |
| South Eastern Asia | 73 | 0.3% |
| Southern Europe | 24 | 0.1% |
| Thailand | 3 | 0.0% |
| Vietnam | 41 | 0.2% |
| Western Africa | 110 | 0.5% | View All 31 Rows |
Sex and Age in Sulphur
Sex and Age in Sulphur
The most populous age groups in Sulphur are 35 to 39 Years (858 | 8.5%) for men and Under 5 Years (919 | 8.2%) for women.
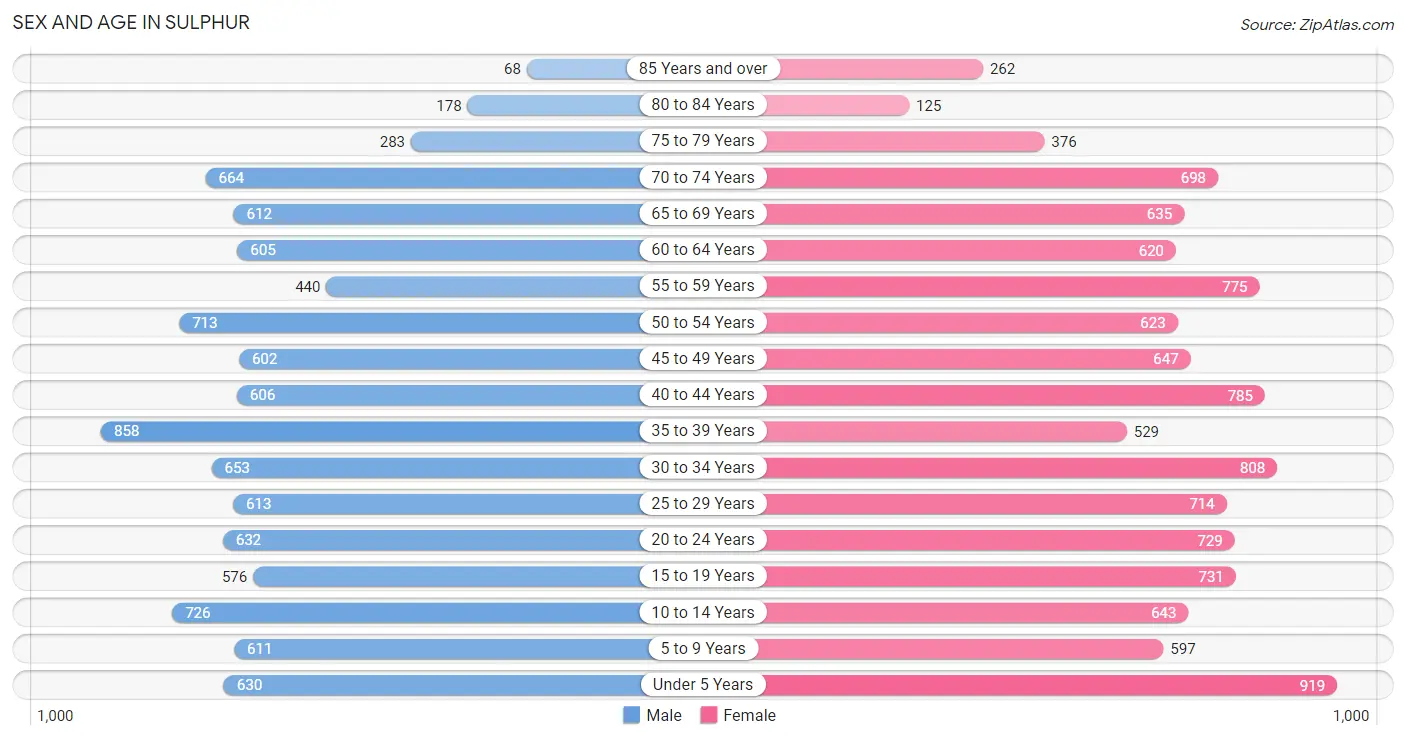
| Age Bracket | Male | Female |
| Under 5 Years | 630 (6.3%) | 919 (8.2%) |
| 5 to 9 Years | 611 (6.1%) | 597 (5.3%) |
| 10 to 14 Years | 726 (7.2%) | 643 (5.7%) |
| 15 to 19 Years | 576 (5.7%) | 731 (6.5%) |
| 20 to 24 Years | 632 (6.3%) | 729 (6.5%) |
| 25 to 29 Years | 613 (6.1%) | 714 (6.4%) |
| 30 to 34 Years | 653 (6.5%) | 808 (7.2%) |
| 35 to 39 Years | 858 (8.5%) | 529 (4.7%) |
| 40 to 44 Years | 606 (6.0%) | 785 (7.0%) |
| 45 to 49 Years | 602 (6.0%) | 647 (5.8%) |
| 50 to 54 Years | 713 (7.1%) | 623 (5.6%) |
| 55 to 59 Years | 440 (4.4%) | 775 (6.9%) |
| 60 to 64 Years | 605 (6.0%) | 620 (5.5%) |
| 65 to 69 Years | 612 (6.1%) | 635 (5.7%) |
| 70 to 74 Years | 664 (6.6%) | 698 (6.2%) |
| 75 to 79 Years | 283 (2.8%) | 376 (3.4%) |
| 80 to 84 Years | 178 (1.8%) | 125 (1.1%) |
| 85 Years and over | 68 (0.7%) | 262 (2.3%) |
| Total | 10,070 (100.0%) | 11,216 (100.0%) |
Families and Households in Sulphur
Median Family Size in Sulphur
The median family size in Sulphur is 3.40 persons per family, with single male/father families (265 | 5.4%) accounting for the largest median family size of 3.56 persons per family. On the other hand, married-couple families (3,484 | 70.9%) represent the smallest median family size with 3.34 persons per family.
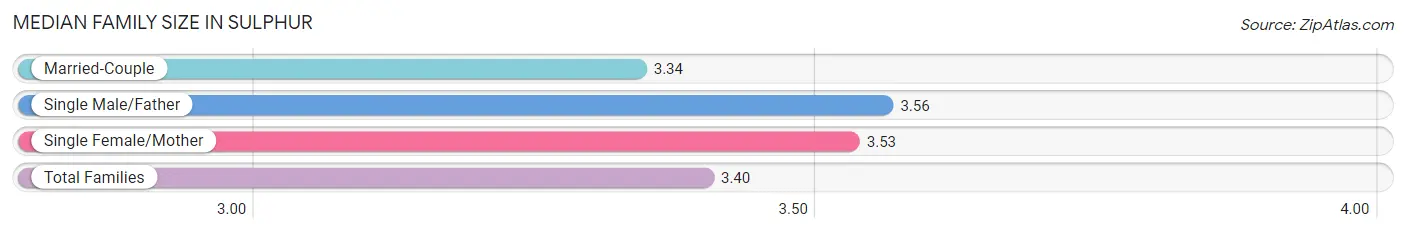
| Family Type | # Families | Family Size |
| Married-Couple | 3,484 (70.9%) | 3.34 |
| Single Male/Father | 265 (5.4%) | 3.56 |
| Single Female/Mother | 1,163 (23.7%) | 3.53 |
| Total Families | 4,912 (100.0%) | 3.40 |
Median Household Size in Sulphur
The median household size in Sulphur is 2.52 persons per household, with single female/mother households (1,163 | 13.8%) accounting for the largest median household size of 3.76 persons per household. non-family households (3,495 | 41.6%) represent the smallest median household size with 1.17 persons per household.
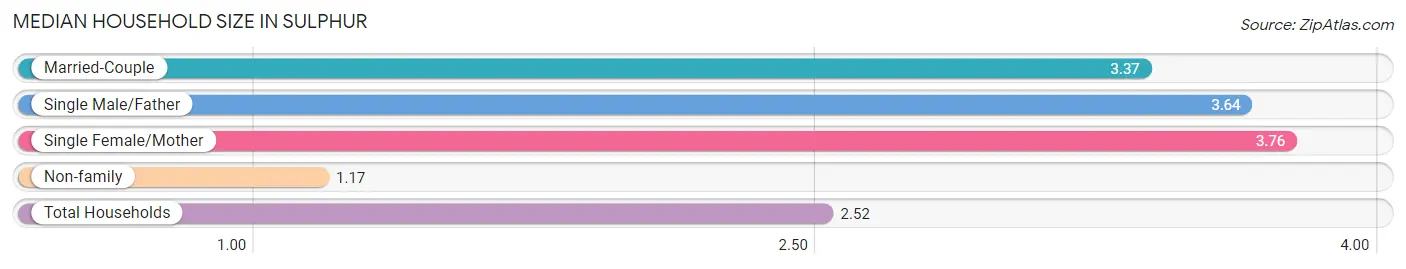
| Household Type | # Households | Household Size |
| Married-Couple | 3,484 (41.4%) | 3.37 |
| Single Male/Father | 265 (3.2%) | 3.64 |
| Single Female/Mother | 1,163 (13.8%) | 3.76 |
| Non-family | 3,495 (41.6%) | 1.17 |
| Total Households | 8,407 (100.0%) | 2.52 |
Household Size by Marriage Status in Sulphur
Out of a total of 8,407 households in Sulphur, 4,912 (58.4%) are family households, while 3,495 (41.6%) are nonfamily households. The most numerous type of family households are 2-person households, comprising 2,129, and the most common type of nonfamily households are 1-person households, comprising 3,166.
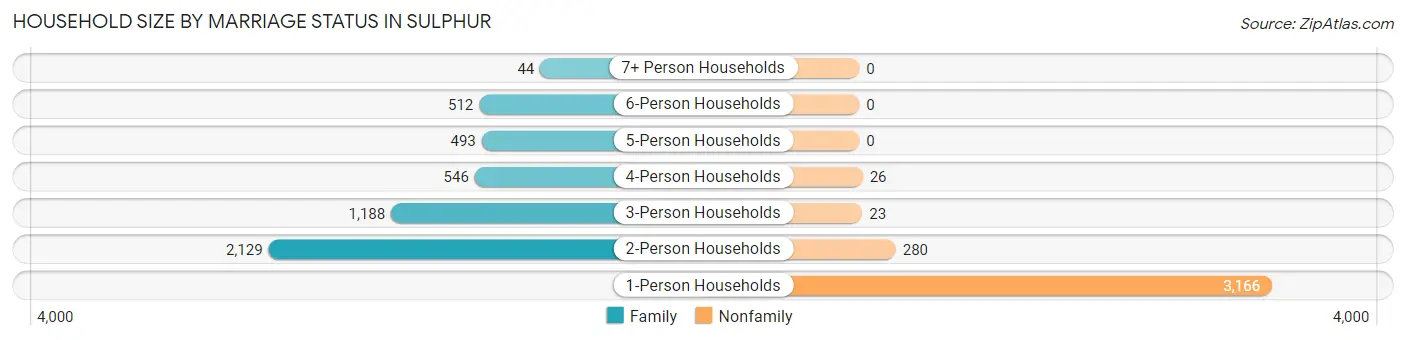
| Household Size | Family Households | Nonfamily Households |
| 1-Person Households | - | 3,166 (37.7%) |
| 2-Person Households | 2,129 (25.3%) | 280 (3.3%) |
| 3-Person Households | 1,188 (14.1%) | 23 (0.3%) |
| 4-Person Households | 546 (6.5%) | 26 (0.3%) |
| 5-Person Households | 493 (5.9%) | 0 (0.0%) |
| 6-Person Households | 512 (6.1%) | 0 (0.0%) |
| 7+ Person Households | 44 (0.5%) | 0 (0.0%) |
| Total | 4,912 (58.4%) | 3,495 (41.6%) |
Female Fertility in Sulphur
Fertility by Age in Sulphur
Average fertility rate in Sulphur is 67.0 births per 1,000 women. Women in the age bracket of 20 to 34 years have the highest fertility rate with 123.0 births per 1,000 women. Women in the age bracket of 20 to 34 years acount for 80.1% of all women with births.
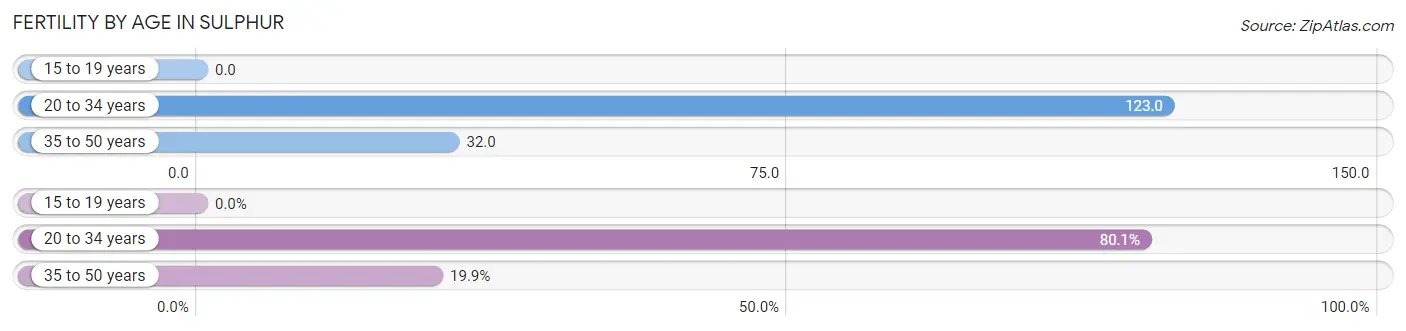
| Age Bracket | Women with Births | Births / 1,000 Women |
| 15 to 19 years | 0 (0.0%) | 0.0 |
| 20 to 34 years | 277 (80.1%) | 123.0 |
| 35 to 50 years | 69 (19.9%) | 32.0 |
| Total | 346 (100.0%) | 67.0 |
Fertility by Age by Marriage Status in Sulphur
48.6% of women with births (346) in Sulphur are married. The highest percentage of unmarried women with births falls into 20 to 34 years age bracket with 55.6% of them unmarried at the time of birth, while the lowest percentage of unmarried women with births belong to 35 to 50 years age bracket with 34.8% of them unmarried.
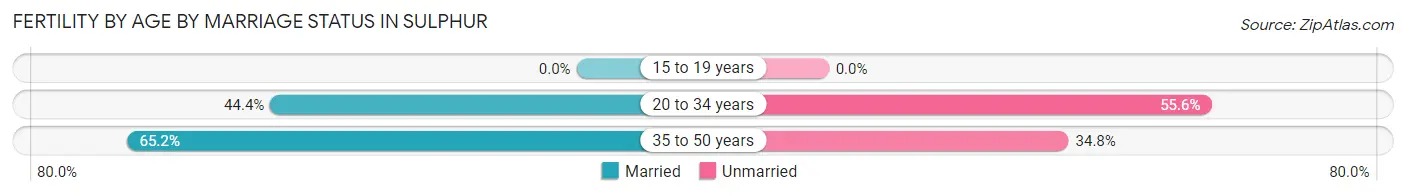
| Age Bracket | Married | Unmarried |
| 15 to 19 years | 0 (0.0%) | 0 (0.0%) |
| 20 to 34 years | 123 (44.4%) | 154 (55.6%) |
| 35 to 50 years | 45 (65.2%) | 24 (34.8%) |
| Total | 168 (48.5%) | 178 (51.4%) |
Fertility by Education in Sulphur
Average fertility rate in Sulphur is 67.0 births per 1,000 women. Women with the education attainment of bachelor's degree have the highest fertility rate of 118.0 births per 1,000 women, while women with the education attainment of less than high school have the lowest fertility at 9.0 births per 1,000 women. Women with the education attainment of high school diploma represent 43.1% of all women with births.
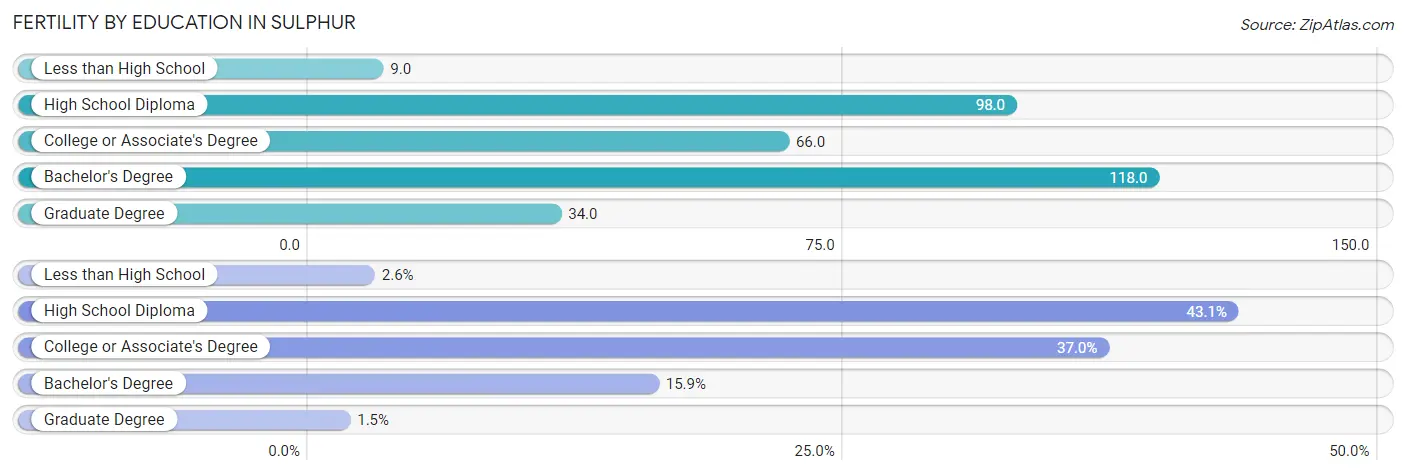
| Educational Attainment | Women with Births | Births / 1,000 Women |
| Less than High School | 9 (2.6%) | 9.0 |
| High School Diploma | 149 (43.1%) | 98.0 |
| College or Associate's Degree | 128 (37.0%) | 66.0 |
| Bachelor's Degree | 55 (15.9%) | 118.0 |
| Graduate Degree | 5 (1.5%) | 34.0 |
| Total | 346 (100.0%) | 67.0 |
Fertility by Education by Marriage Status in Sulphur
51.4% of women with births in Sulphur are unmarried. Women with the educational attainment of graduate degree are most likely to be married with 100.0% of them married at childbirth, while women with the educational attainment of less than high school are least likely to be married with 100.0% of them unmarried at childbirth.
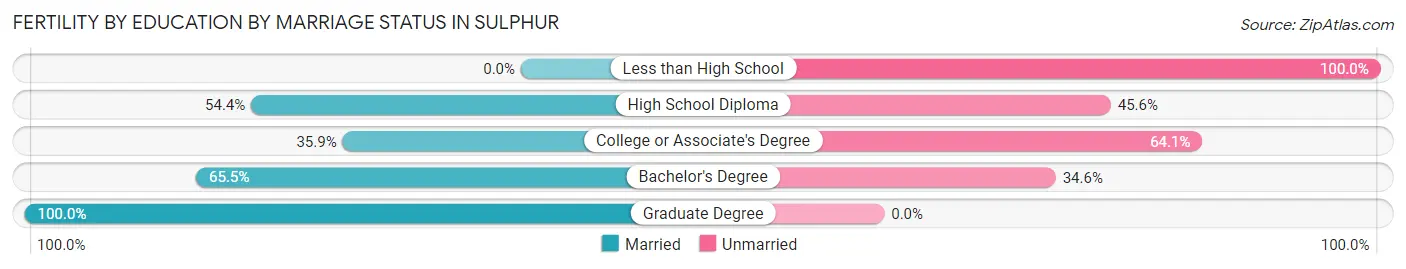
| Educational Attainment | Married | Unmarried |
| Less than High School | 0 (0.0%) | 9 (100.0%) |
| High School Diploma | 81 (54.4%) | 68 (45.6%) |
| College or Associate's Degree | 46 (35.9%) | 82 (64.1%) |
| Bachelor's Degree | 36 (65.4%) | 19 (34.5%) |
| Graduate Degree | 5 (100.0%) | 0 (0.0%) |
| Total | 168 (48.5%) | 178 (51.4%) |
Employment Characteristics in Sulphur
Employment by Class of Employer in Sulphur
Among the 8,690 employed individuals in Sulphur, private company employees (6,486 | 74.6%), local government employees (771 | 8.9%), and state government employees (449 | 5.2%) make up the most common classes of employment.
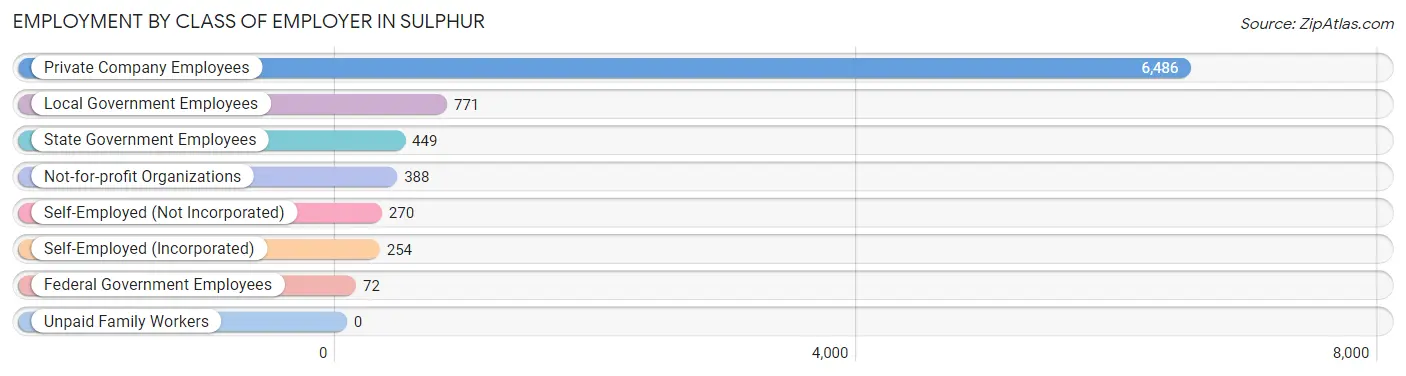
| Employer Class | # Employees | % Employees |
| Private Company Employees | 6,486 | 74.6% |
| Self-Employed (Incorporated) | 254 | 2.9% |
| Self-Employed (Not Incorporated) | 270 | 3.1% |
| Not-for-profit Organizations | 388 | 4.5% |
| Local Government Employees | 771 | 8.9% |
| State Government Employees | 449 | 5.2% |
| Federal Government Employees | 72 | 0.8% |
| Unpaid Family Workers | 0 | 0.0% |
| Total | 8,690 | 100.0% |
Employment Status by Age in Sulphur
According to the labor force statistics for Sulphur, out of the total population over 16 years of age (16,591), 55.9% or 9,274 individuals are in the labor force, with 5.6% or 519 of them unemployed. The age group with the highest labor force participation rate is 35 to 44 years, with 81.3% or 2,259 individuals in the labor force. Within the labor force, the 65 to 74 years age range has the highest percentage of unemployed individuals, with 18.6% or 81 of them being unemployed.
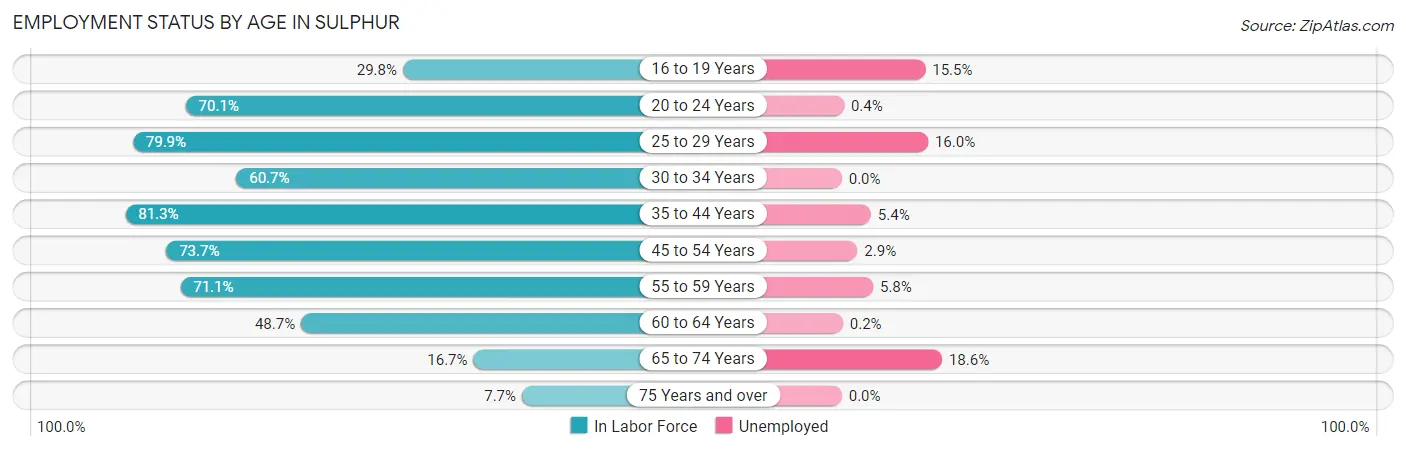
| Age Bracket | In Labor Force | Unemployed |
| 16 to 19 Years | 220 (29.8%) | 34 (15.5%) |
| 20 to 24 Years | 954 (70.1%) | 4 (0.4%) |
| 25 to 29 Years | 1,060 (79.9%) | 170 (16.0%) |
| 30 to 34 Years | 887 (60.7%) | 0 (0.0%) |
| 35 to 44 Years | 2,259 (81.3%) | 122 (5.4%) |
| 45 to 54 Years | 1,905 (73.7%) | 55 (2.9%) |
| 55 to 59 Years | 864 (71.1%) | 50 (5.8%) |
| 60 to 64 Years | 597 (48.7%) | 1 (0.2%) |
| 65 to 74 Years | 436 (16.7%) | 81 (18.6%) |
| 75 Years and over | 99 (7.7%) | 0 (0.0%) |
| Total | 9,274 (55.9%) | 519 (5.6%) |
Employment Status by Educational Attainment in Sulphur
According to labor force statistics for Sulphur, 71.5% of individuals (7,573) out of the total population between 25 and 64 years of age (10,591) are in the labor force, with 5.2% or 394 of them being unemployed. The group with the highest labor force participation rate are those with the educational attainment of bachelor's degree or higher, with 80.7% or 1,452 individuals in the labor force. Within the labor force, individuals with bachelor's degree or higher education have the highest percentage of unemployment, with 7.6% or 110 of them being unemployed.
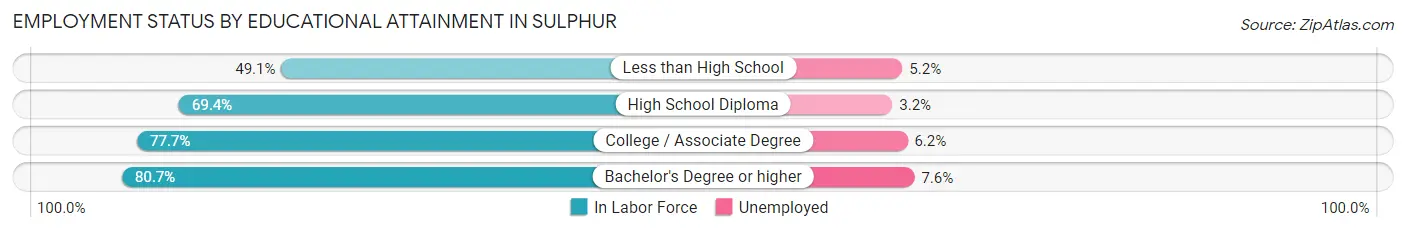
| Educational Attainment | In Labor Force | Unemployed |
| Less than High School | 635 (49.1%) | 67 (5.2%) |
| High School Diploma | 2,863 (69.4%) | 132 (3.2%) |
| College / Associate Degree | 2,622 (77.7%) | 209 (6.2%) |
| Bachelor's Degree or higher | 1,452 (80.7%) | 137 (7.6%) |
| Total | 7,573 (71.5%) | 551 (5.2%) |
Employment Occupations by Sex in Sulphur
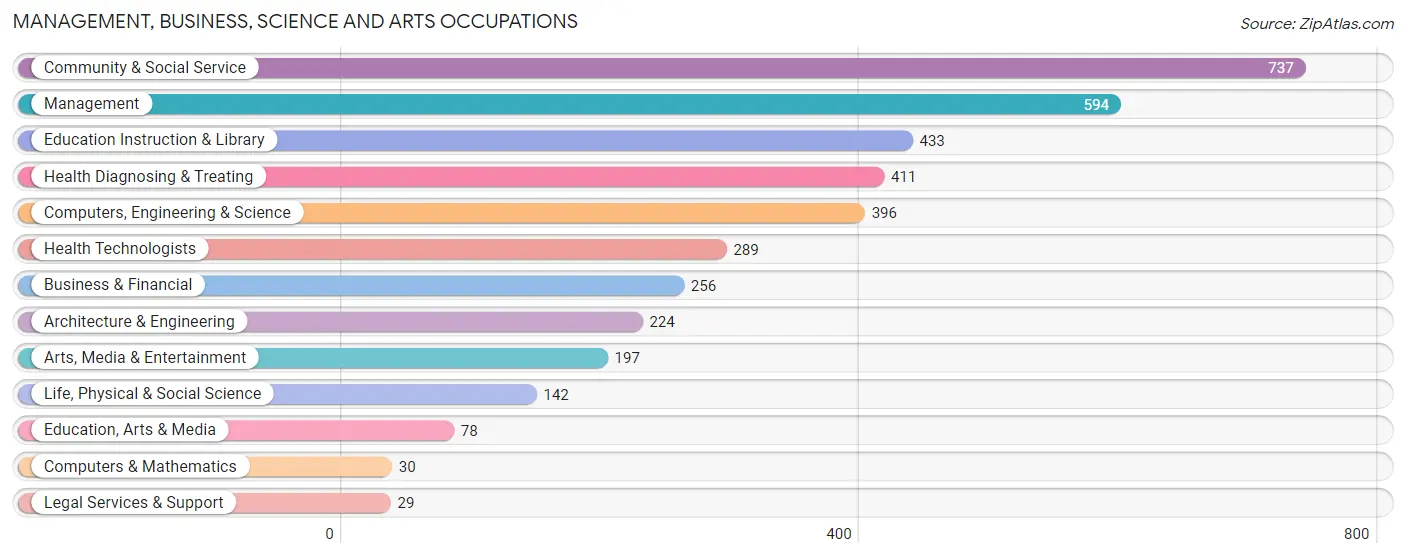
Management, Business, Science and Arts Occupations
The most common Management, Business, Science and Arts occupations in Sulphur are Community & Social Service (737 | 8.4%), Management (594 | 6.8%), Education Instruction & Library (433 | 4.9%), Health Diagnosing & Treating (411 | 4.7%), and Computers, Engineering & Science (396 | 4.5%).
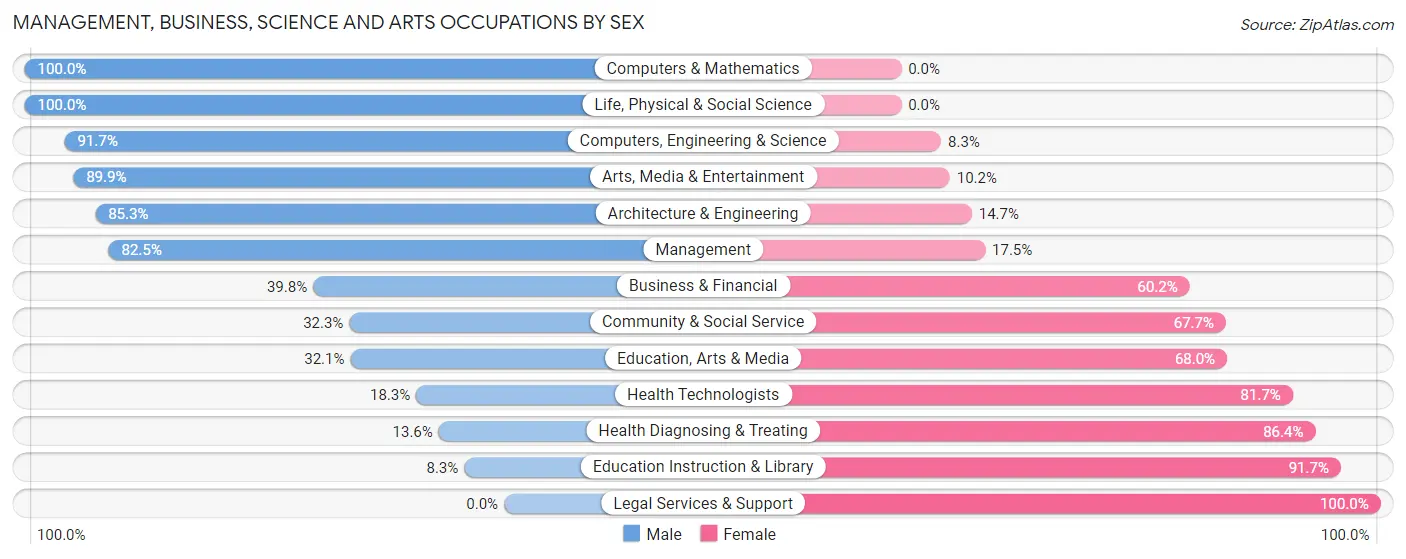
Management, Business, Science and Arts Occupations by Sex
Within the Management, Business, Science and Arts occupations in Sulphur, the most male-oriented occupations are Computers & Mathematics (100.0%), Life, Physical & Social Science (100.0%), and Computers, Engineering & Science (91.7%), while the most female-oriented occupations are Legal Services & Support (100.0%), Education Instruction & Library (91.7%), and Health Diagnosing & Treating (86.4%).
| Occupation | Male | Female |
| Management | 490 (82.5%) | 104 (17.5%) |
| Business & Financial | 102 (39.8%) | 154 (60.2%) |
| Computers, Engineering & Science | 363 (91.7%) | 33 (8.3%) |
| Computers & Mathematics | 30 (100.0%) | 0 (0.0%) |
| Architecture & Engineering | 191 (85.3%) | 33 (14.7%) |
| Life, Physical & Social Science | 142 (100.0%) | 0 (0.0%) |
| Community & Social Service | 238 (32.3%) | 499 (67.7%) |
| Education, Arts & Media | 25 (32.1%) | 53 (67.9%) |
| Legal Services & Support | 0 (0.0%) | 29 (100.0%) |
| Education Instruction & Library | 36 (8.3%) | 397 (91.7%) |
| Arts, Media & Entertainment | 177 (89.8%) | 20 (10.2%) |
| Health Diagnosing & Treating | 56 (13.6%) | 355 (86.4%) |
| Health Technologists | 53 (18.3%) | 236 (81.7%) |
| Total (Category) | 1,249 (52.2%) | 1,145 (47.8%) |
| Total (Overall) | 4,886 (55.8%) | 3,877 (44.2%) |
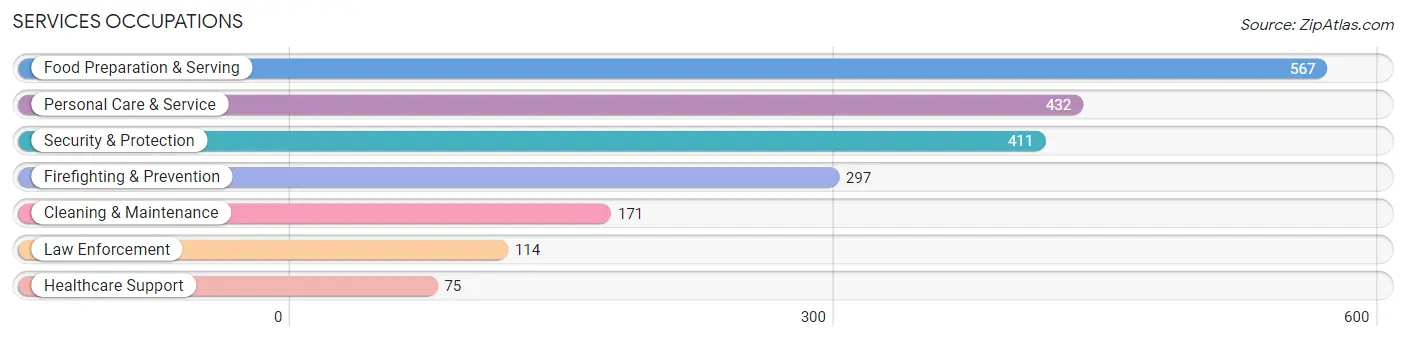
Services Occupations
The most common Services occupations in Sulphur are Food Preparation & Serving (567 | 6.5%), Personal Care & Service (432 | 4.9%), Security & Protection (411 | 4.7%), Firefighting & Prevention (297 | 3.4%), and Cleaning & Maintenance (171 | 1.9%).
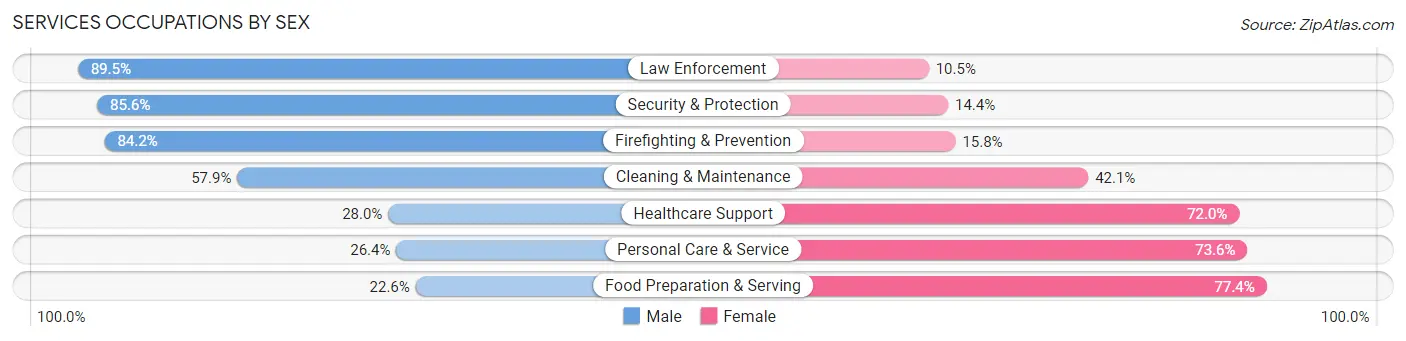
Services Occupations by Sex
Within the Services occupations in Sulphur, the most male-oriented occupations are Law Enforcement (89.5%), Security & Protection (85.6%), and Firefighting & Prevention (84.2%), while the most female-oriented occupations are Food Preparation & Serving (77.4%), Personal Care & Service (73.6%), and Healthcare Support (72.0%).
| Occupation | Male | Female |
| Healthcare Support | 21 (28.0%) | 54 (72.0%) |
| Security & Protection | 352 (85.6%) | 59 (14.4%) |
| Firefighting & Prevention | 250 (84.2%) | 47 (15.8%) |
| Law Enforcement | 102 (89.5%) | 12 (10.5%) |
| Food Preparation & Serving | 128 (22.6%) | 439 (77.4%) |
| Cleaning & Maintenance | 99 (57.9%) | 72 (42.1%) |
| Personal Care & Service | 114 (26.4%) | 318 (73.6%) |
| Total (Category) | 714 (43.1%) | 942 (56.9%) |
| Total (Overall) | 4,886 (55.8%) | 3,877 (44.2%) |
Sales and Office Occupations
The most common Sales and Office occupations in Sulphur are Office & Administration (1,575 | 18.0%), and Sales & Related (612 | 7.0%).

Sales and Office Occupations by Sex
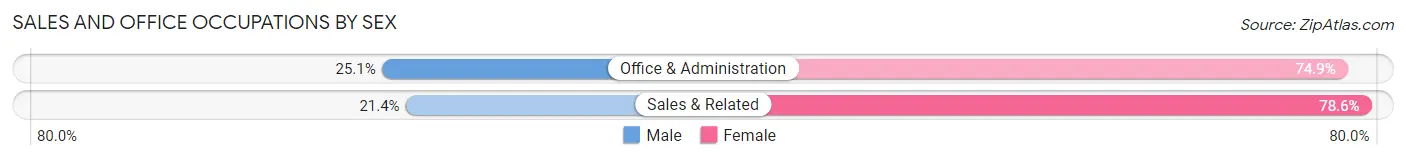
| Occupation | Male | Female |
| Sales & Related | 131 (21.4%) | 481 (78.6%) |
| Office & Administration | 395 (25.1%) | 1,180 (74.9%) |
| Total (Category) | 526 (24.0%) | 1,661 (75.9%) |
| Total (Overall) | 4,886 (55.8%) | 3,877 (44.2%) |
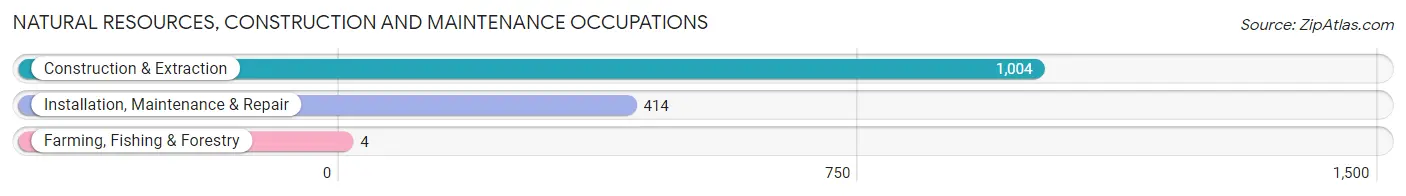
Natural Resources, Construction and Maintenance Occupations
The most common Natural Resources, Construction and Maintenance occupations in Sulphur are Construction & Extraction (1,004 | 11.5%), Installation, Maintenance & Repair (414 | 4.7%), and Farming, Fishing & Forestry (4 | 0.1%).
Natural Resources, Construction and Maintenance Occupations by Sex
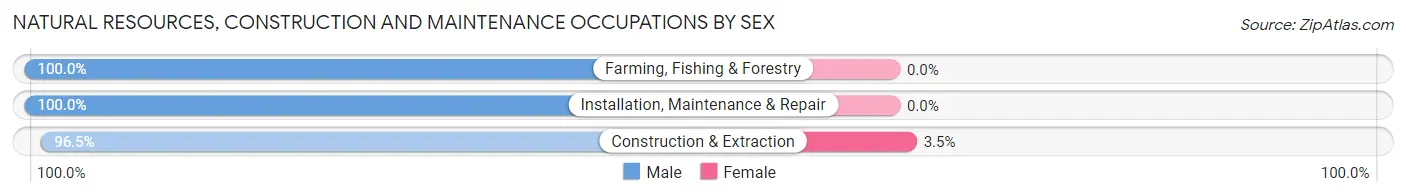
| Occupation | Male | Female |
| Farming, Fishing & Forestry | 4 (100.0%) | 0 (0.0%) |
| Construction & Extraction | 969 (96.5%) | 35 (3.5%) |
| Installation, Maintenance & Repair | 414 (100.0%) | 0 (0.0%) |
| Total (Category) | 1,387 (97.5%) | 35 (2.5%) |
| Total (Overall) | 4,886 (55.8%) | 3,877 (44.2%) |
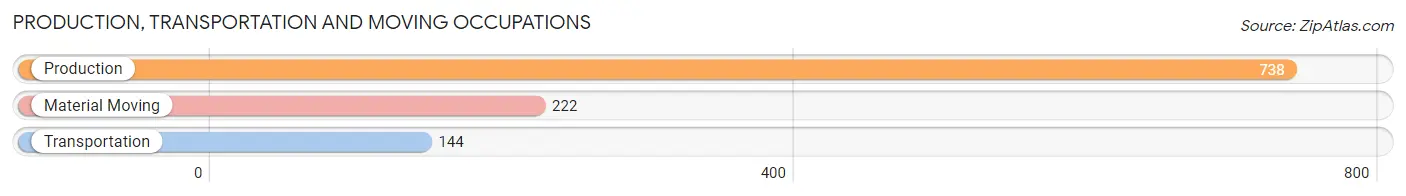
Production, Transportation and Moving Occupations
The most common Production, Transportation and Moving occupations in Sulphur are Production (738 | 8.4%), Material Moving (222 | 2.5%), and Transportation (144 | 1.6%).
Production, Transportation and Moving Occupations by Sex
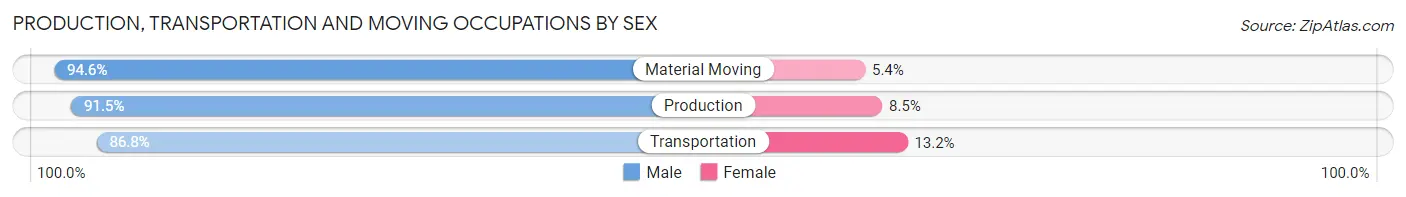
| Occupation | Male | Female |
| Production | 675 (91.5%) | 63 (8.5%) |
| Transportation | 125 (86.8%) | 19 (13.2%) |
| Material Moving | 210 (94.6%) | 12 (5.4%) |
| Total (Category) | 1,010 (91.5%) | 94 (8.5%) |
| Total (Overall) | 4,886 (55.8%) | 3,877 (44.2%) |
Employment Industries by Sex in Sulphur
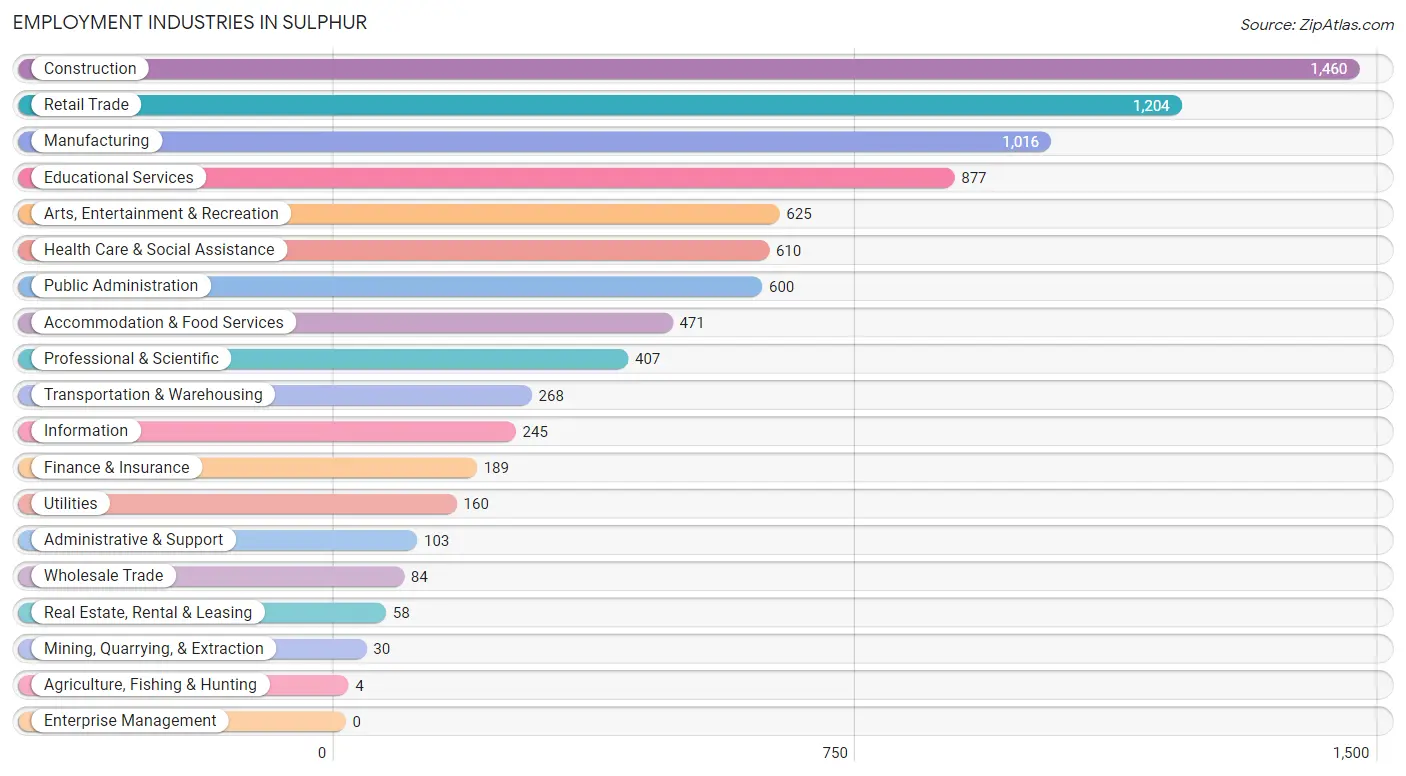
Employment Industries in Sulphur
The major employment industries in Sulphur include Construction (1,460 | 16.7%), Retail Trade (1,204 | 13.7%), Manufacturing (1,016 | 11.6%), Educational Services (877 | 10.0%), and Arts, Entertainment & Recreation (625 | 7.1%).
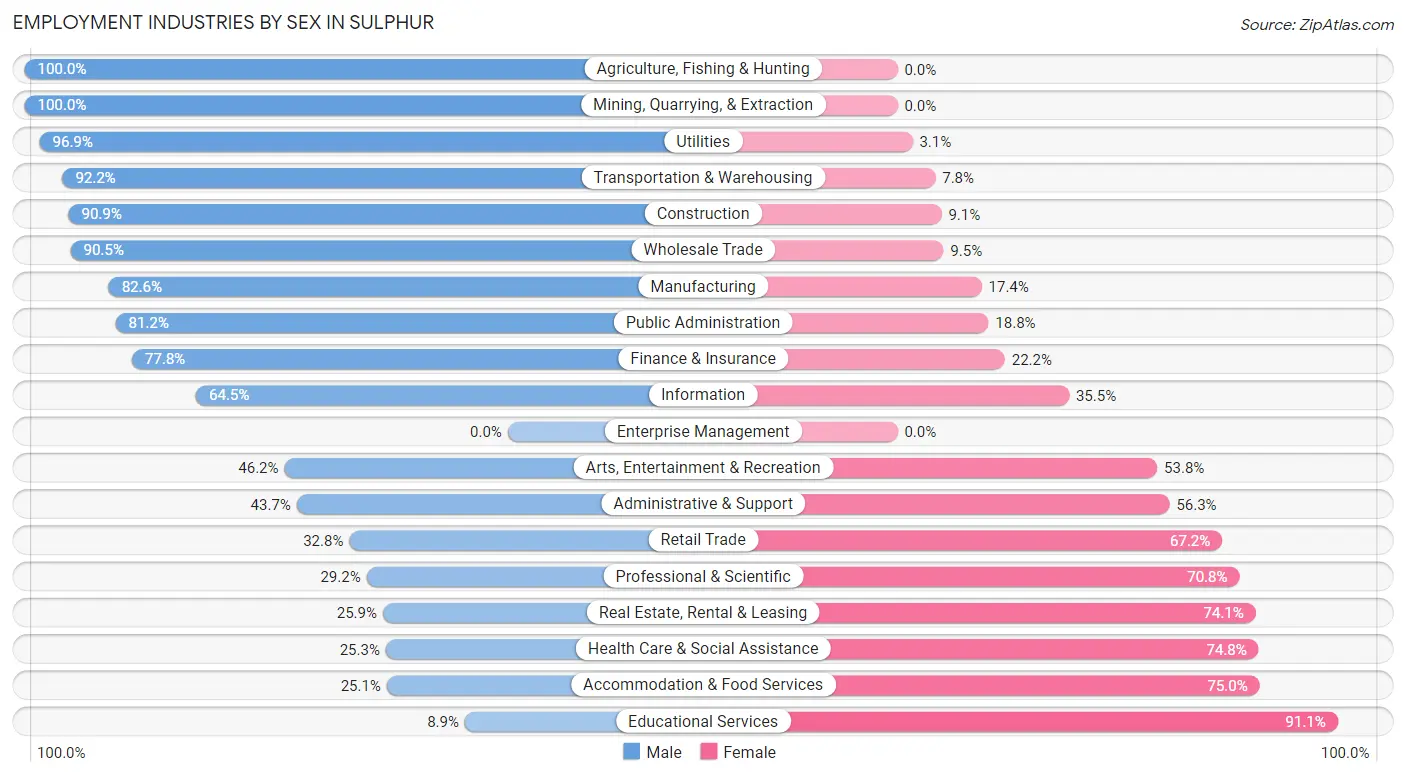
Employment Industries by Sex in Sulphur
The Sulphur industries that see more men than women are Agriculture, Fishing & Hunting (100.0%), Mining, Quarrying, & Extraction (100.0%), and Utilities (96.9%), whereas the industries that tend to have a higher number of women are Educational Services (91.1%), Accommodation & Food Services (75.0%), and Health Care & Social Assistance (74.8%).
| Industry | Male | Female |
| Agriculture, Fishing & Hunting | 4 (100.0%) | 0 (0.0%) |
| Mining, Quarrying, & Extraction | 30 (100.0%) | 0 (0.0%) |
| Construction | 1,327 (90.9%) | 133 (9.1%) |
| Manufacturing | 839 (82.6%) | 177 (17.4%) |
| Wholesale Trade | 76 (90.5%) | 8 (9.5%) |
| Retail Trade | 395 (32.8%) | 809 (67.2%) |
| Transportation & Warehousing | 247 (92.2%) | 21 (7.8%) |
| Utilities | 155 (96.9%) | 5 (3.1%) |
| Information | 158 (64.5%) | 87 (35.5%) |
| Finance & Insurance | 147 (77.8%) | 42 (22.2%) |
| Real Estate, Rental & Leasing | 15 (25.9%) | 43 (74.1%) |
| Professional & Scientific | 119 (29.2%) | 288 (70.8%) |
| Enterprise Management | 0 (0.0%) | 0 (0.0%) |
| Administrative & Support | 45 (43.7%) | 58 (56.3%) |
| Educational Services | 78 (8.9%) | 799 (91.1%) |
| Health Care & Social Assistance | 154 (25.3%) | 456 (74.8%) |
| Arts, Entertainment & Recreation | 289 (46.2%) | 336 (53.8%) |
| Accommodation & Food Services | 118 (25.1%) | 353 (75.0%) |
| Public Administration | 487 (81.2%) | 113 (18.8%) |
| Total | 4,886 (55.8%) | 3,877 (44.2%) |
Education in Sulphur
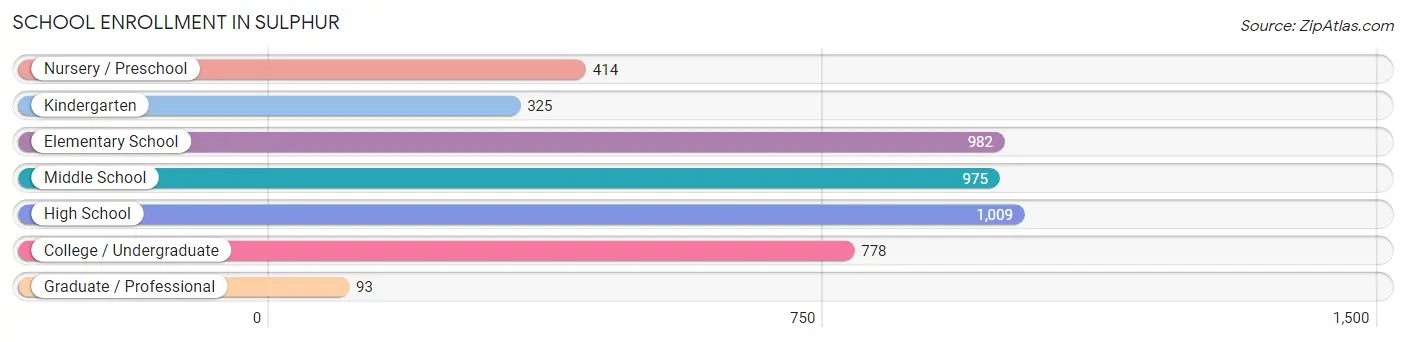
School Enrollment in Sulphur
The most common levels of schooling among the 4,576 students in Sulphur are high school (1,009 | 22.1%), elementary school (982 | 21.5%), and middle school (975 | 21.3%).
| School Level | # Students | % Students |
| Nursery / Preschool | 414 | 9.0% |
| Kindergarten | 325 | 7.1% |
| Elementary School | 982 | 21.5% |
| Middle School | 975 | 21.3% |
| High School | 1,009 | 22.1% |
| College / Undergraduate | 778 | 17.0% |
| Graduate / Professional | 93 | 2.0% |
| Total | 4,576 | 100.0% |
School Enrollment by Age by Funding Source in Sulphur
Out of a total of 4,576 students who are enrolled in schools in Sulphur, 924 (20.2%) attend a private institution, while the remaining 3,652 (79.8%) are enrolled in public schools. The age group of 10 to 14 year olds has the highest likelihood of being enrolled in private schools, with 335 (25.0% in the age bracket) enrolled. Conversely, the age group of 18 to 19 year olds has the lowest likelihood of being enrolled in a private school, with 221 (100.0% in the age bracket) attending a public institution.
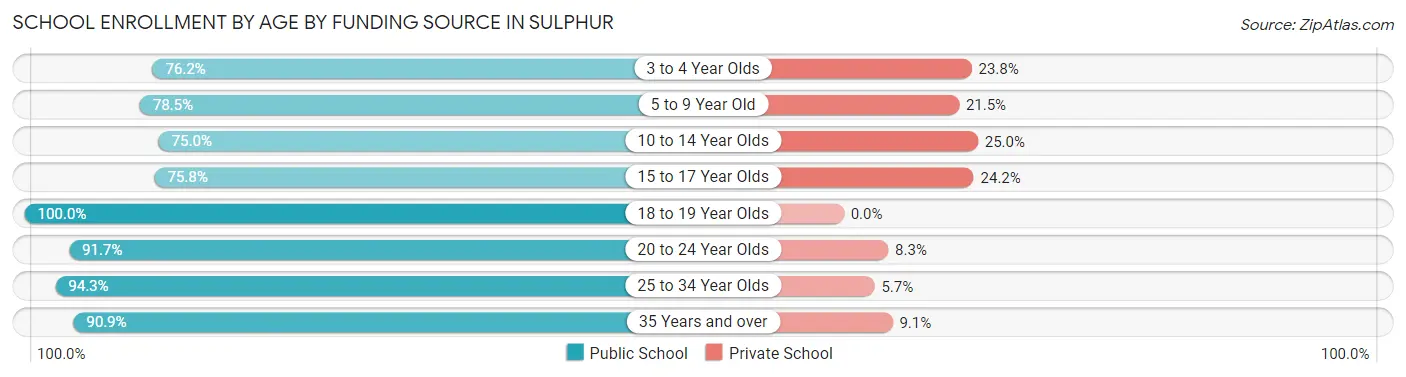
| Age Bracket | Public School | Private School |
| 3 to 4 Year Olds | 307 (76.2%) | 96 (23.8%) |
| 5 to 9 Year Old | 856 (78.5%) | 234 (21.5%) |
| 10 to 14 Year Olds | 1,006 (75.0%) | 335 (25.0%) |
| 15 to 17 Year Olds | 636 (75.8%) | 203 (24.2%) |
| 18 to 19 Year Olds | 221 (100.0%) | 0 (0.0%) |
| 20 to 24 Year Olds | 332 (91.7%) | 30 (8.3%) |
| 25 to 34 Year Olds | 115 (94.3%) | 7 (5.7%) |
| 35 Years and over | 180 (90.9%) | 18 (9.1%) |
| Total | 3,652 (79.8%) | 924 (20.2%) |
Educational Attainment by Field of Study in Sulphur
Education (512 | 20.5%), science & technology (337 | 13.5%), business (327 | 13.1%), arts & humanities (296 | 11.9%), and bio, nature & agricultural (242 | 9.7%) are the most common fields of study among 2,494 individuals in Sulphur who have obtained a bachelor's degree or higher.
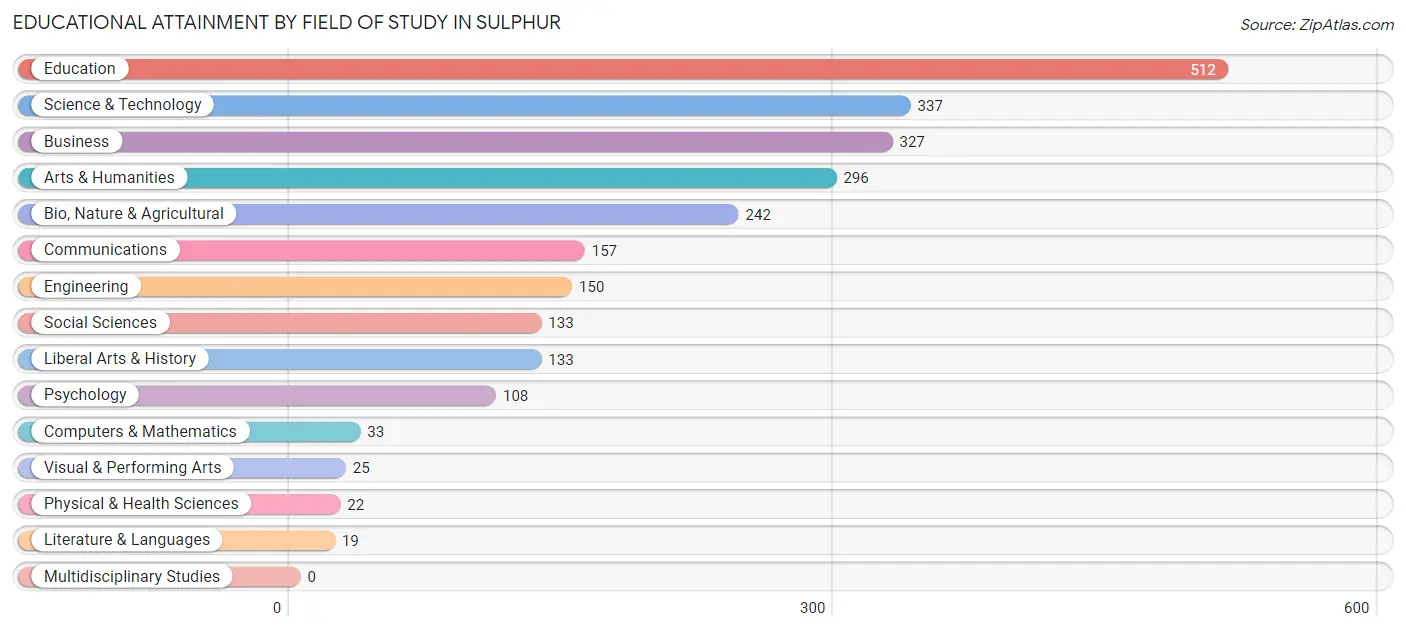
| Field of Study | # Graduates | % Graduates |
| Computers & Mathematics | 33 | 1.3% |
| Bio, Nature & Agricultural | 242 | 9.7% |
| Physical & Health Sciences | 22 | 0.9% |
| Psychology | 108 | 4.3% |
| Social Sciences | 133 | 5.3% |
| Engineering | 150 | 6.0% |
| Multidisciplinary Studies | 0 | 0.0% |
| Science & Technology | 337 | 13.5% |
| Business | 327 | 13.1% |
| Education | 512 | 20.5% |
| Literature & Languages | 19 | 0.8% |
| Liberal Arts & History | 133 | 5.3% |
| Visual & Performing Arts | 25 | 1.0% |
| Communications | 157 | 6.3% |
| Arts & Humanities | 296 | 11.9% |
| Total | 2,494 | 100.0% |
Transportation & Commute in Sulphur
Vehicle Availability by Sex in Sulphur
The most prevalent vehicle ownership categories in Sulphur are males with 2 vehicles (1,917, accounting for 39.5%) and females with 2 vehicles (1,280, making up 50.0%).
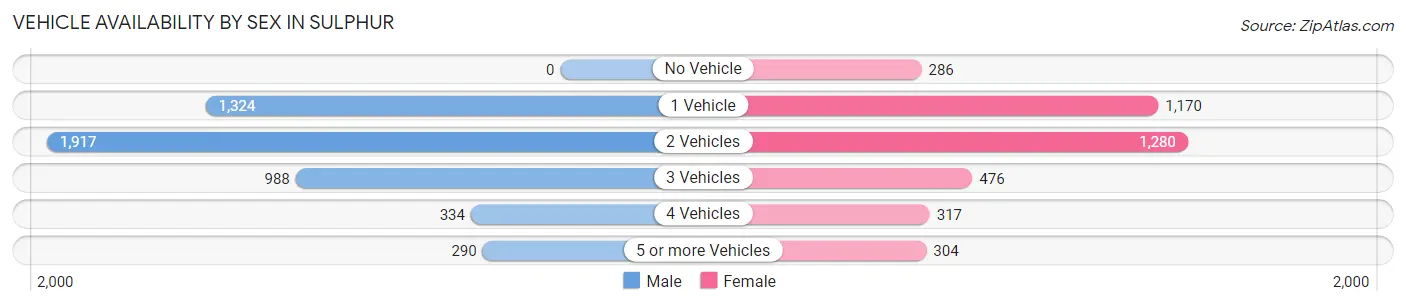
| Vehicles Available | Male | Female |
| No Vehicle | 0 (0.0%) | 286 (7.5%) |
| 1 Vehicle | 1,324 (27.3%) | 1,170 (30.5%) |
| 2 Vehicles | 1,917 (39.5%) | 1,280 (33.4%) |
| 3 Vehicles | 988 (20.4%) | 476 (12.4%) |
| 4 Vehicles | 334 (6.9%) | 317 (8.3%) |
| 5 or more Vehicles | 290 (6.0%) | 304 (7.9%) |
| Total | 4,853 (100.0%) | 3,833 (100.0%) |
Commute Time in Sulphur
The most frequently occuring commute durations in Sulphur are 15 to 19 minutes (2,050 commuters, 24.4%), 5 to 9 minutes (1,866 commuters, 22.2%), and 10 to 14 minutes (1,465 commuters, 17.4%).
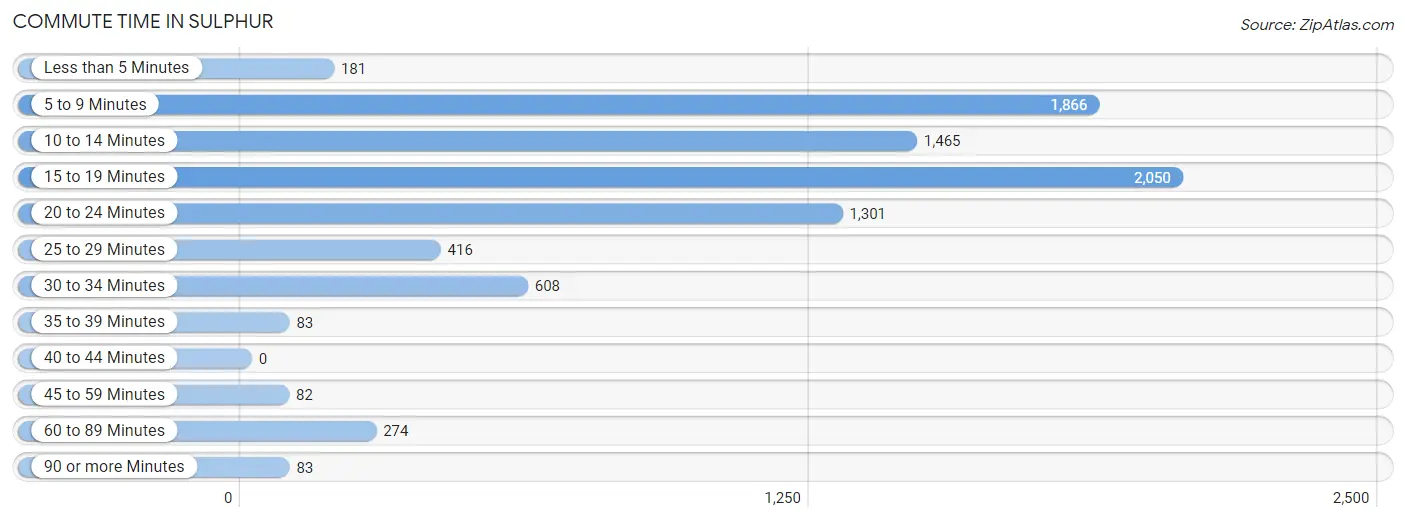
| Commute Time | # Commuters | % Commuters |
| Less than 5 Minutes | 181 | 2.1% |
| 5 to 9 Minutes | 1,866 | 22.2% |
| 10 to 14 Minutes | 1,465 | 17.4% |
| 15 to 19 Minutes | 2,050 | 24.4% |
| 20 to 24 Minutes | 1,301 | 15.5% |
| 25 to 29 Minutes | 416 | 5.0% |
| 30 to 34 Minutes | 608 | 7.2% |
| 35 to 39 Minutes | 83 | 1.0% |
| 40 to 44 Minutes | 0 | 0.0% |
| 45 to 59 Minutes | 82 | 1.0% |
| 60 to 89 Minutes | 274 | 3.3% |
| 90 or more Minutes | 83 | 1.0% |
Commute Time by Sex in Sulphur
The most common commute times in Sulphur are 15 to 19 minutes (1,115 commuters, 23.4%) for males and 15 to 19 minutes (935 commuters, 25.6%) for females.
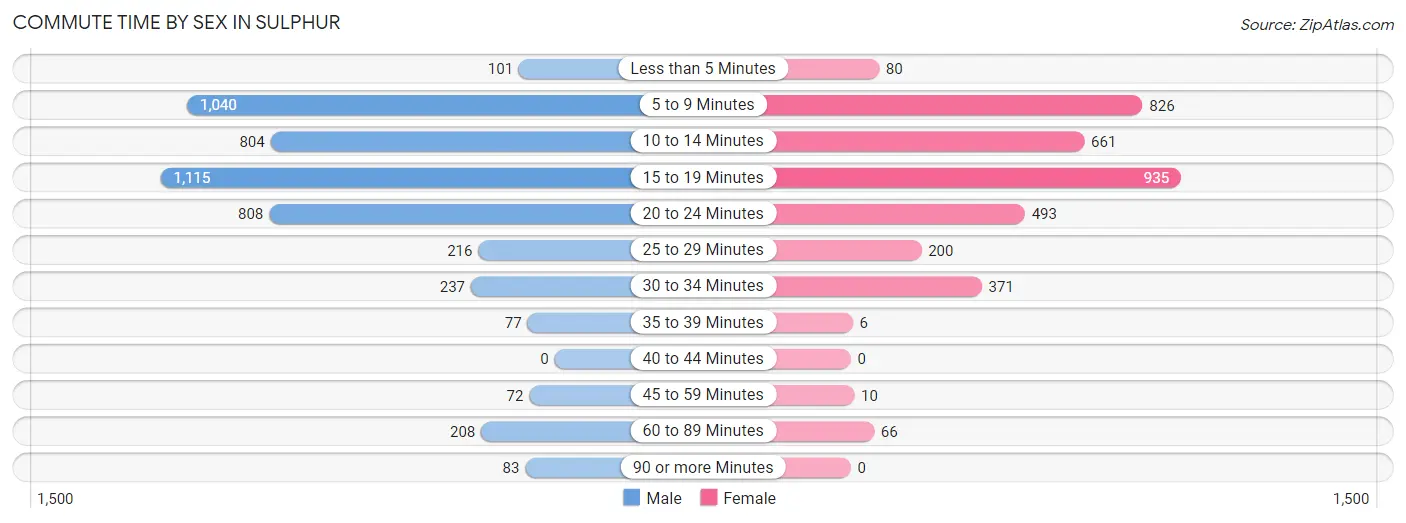
| Commute Time | Male | Female |
| Less than 5 Minutes | 101 (2.1%) | 80 (2.2%) |
| 5 to 9 Minutes | 1,040 (21.8%) | 826 (22.6%) |
| 10 to 14 Minutes | 804 (16.9%) | 661 (18.1%) |
| 15 to 19 Minutes | 1,115 (23.4%) | 935 (25.6%) |
| 20 to 24 Minutes | 808 (17.0%) | 493 (13.5%) |
| 25 to 29 Minutes | 216 (4.5%) | 200 (5.5%) |
| 30 to 34 Minutes | 237 (5.0%) | 371 (10.2%) |
| 35 to 39 Minutes | 77 (1.6%) | 6 (0.2%) |
| 40 to 44 Minutes | 0 (0.0%) | 0 (0.0%) |
| 45 to 59 Minutes | 72 (1.5%) | 10 (0.3%) |
| 60 to 89 Minutes | 208 (4.4%) | 66 (1.8%) |
| 90 or more Minutes | 83 (1.7%) | 0 (0.0%) |
Time of Departure to Work by Sex in Sulphur
The most frequent times of departure to work in Sulphur are 5:00 AM to 5:29 AM (688, 14.4%) for males and 7:00 AM to 7:29 AM (749, 20.5%) for females.
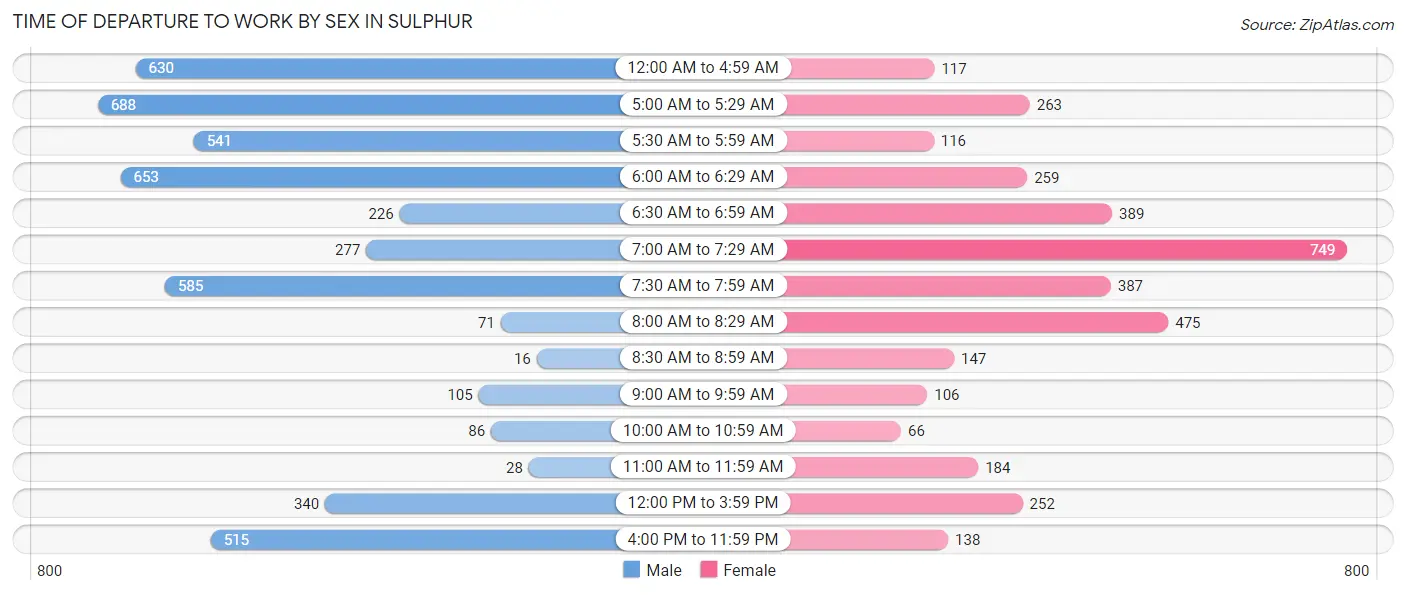
| Time of Departure | Male | Female |
| 12:00 AM to 4:59 AM | 630 (13.2%) | 117 (3.2%) |
| 5:00 AM to 5:29 AM | 688 (14.4%) | 263 (7.2%) |
| 5:30 AM to 5:59 AM | 541 (11.4%) | 116 (3.2%) |
| 6:00 AM to 6:29 AM | 653 (13.7%) | 259 (7.1%) |
| 6:30 AM to 6:59 AM | 226 (4.8%) | 389 (10.7%) |
| 7:00 AM to 7:29 AM | 277 (5.8%) | 749 (20.5%) |
| 7:30 AM to 7:59 AM | 585 (12.3%) | 387 (10.6%) |
| 8:00 AM to 8:29 AM | 71 (1.5%) | 475 (13.0%) |
| 8:30 AM to 8:59 AM | 16 (0.3%) | 147 (4.0%) |
| 9:00 AM to 9:59 AM | 105 (2.2%) | 106 (2.9%) |
| 10:00 AM to 10:59 AM | 86 (1.8%) | 66 (1.8%) |
| 11:00 AM to 11:59 AM | 28 (0.6%) | 184 (5.0%) |
| 12:00 PM to 3:59 PM | 340 (7.1%) | 252 (6.9%) |
| 4:00 PM to 11:59 PM | 515 (10.8%) | 138 (3.8%) |
| Total | 4,761 (100.0%) | 3,648 (100.0%) |
Housing Occupancy in Sulphur
Occupancy by Ownership in Sulphur
Of the total 8,407 dwellings in Sulphur, owner-occupied units account for 6,020 (71.6%), while renter-occupied units make up 2,387 (28.4%).
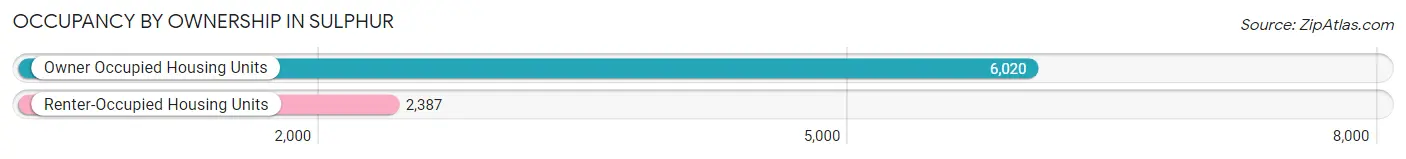
| Occupancy | # Housing Units | % Housing Units |
| Owner Occupied Housing Units | 6,020 | 71.6% |
| Renter-Occupied Housing Units | 2,387 | 28.4% |
| Total Occupied Housing Units | 8,407 | 100.0% |
Occupancy by Household Size in Sulphur
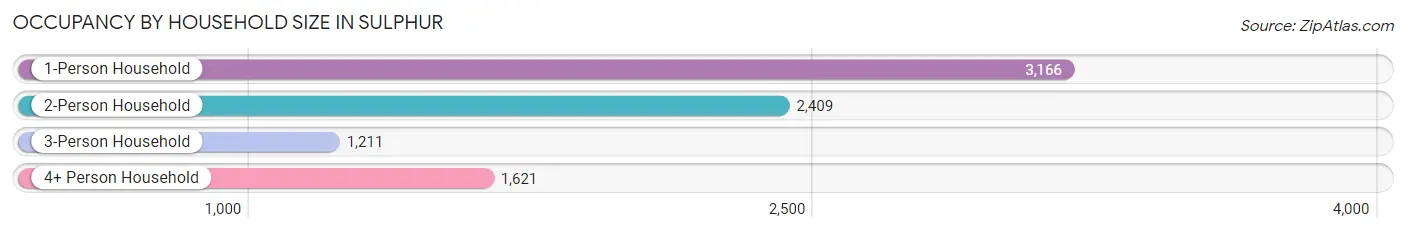
| Household Size | # Housing Units | % Housing Units |
| 1-Person Household | 3,166 | 37.7% |
| 2-Person Household | 2,409 | 28.6% |
| 3-Person Household | 1,211 | 14.4% |
| 4+ Person Household | 1,621 | 19.3% |
| Total Housing Units | 8,407 | 100.0% |
Occupancy by Ownership by Household Size in Sulphur
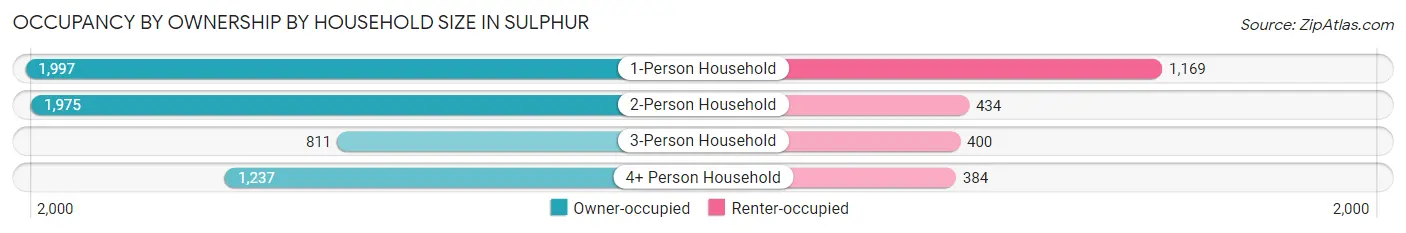
| Household Size | Owner-occupied | Renter-occupied |
| 1-Person Household | 1,997 (63.1%) | 1,169 (36.9%) |
| 2-Person Household | 1,975 (82.0%) | 434 (18.0%) |
| 3-Person Household | 811 (67.0%) | 400 (33.0%) |
| 4+ Person Household | 1,237 (76.3%) | 384 (23.7%) |
| Total Housing Units | 6,020 (71.6%) | 2,387 (28.4%) |
Occupancy by Educational Attainment in Sulphur
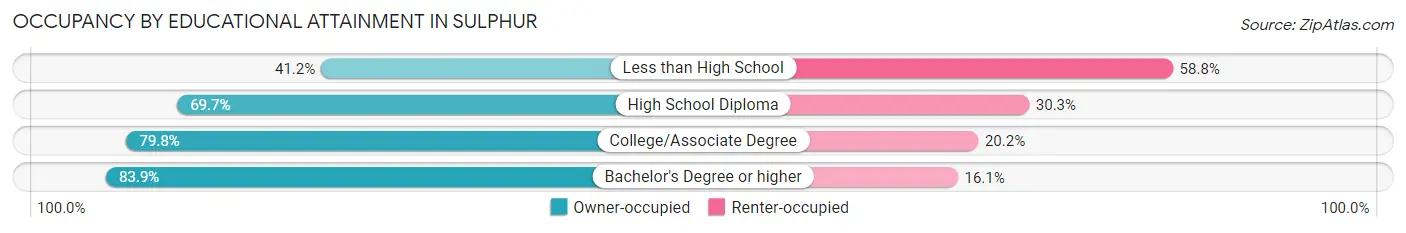
| Household Size | Owner-occupied | Renter-occupied |
| Less than High School | 505 (41.2%) | 720 (58.8%) |
| High School Diploma | 1,942 (69.7%) | 843 (30.3%) |
| College/Associate Degree | 2,253 (79.8%) | 570 (20.2%) |
| Bachelor's Degree or higher | 1,320 (83.9%) | 254 (16.1%) |
Occupancy by Age of Householder in Sulphur
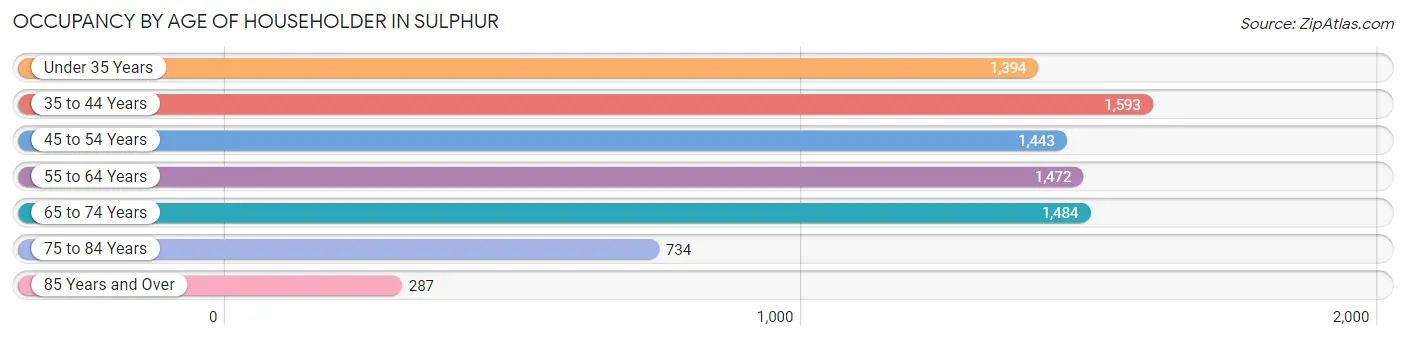
| Age Bracket | # Households | % Households |
| Under 35 Years | 1,394 | 16.6% |
| 35 to 44 Years | 1,593 | 19.0% |
| 45 to 54 Years | 1,443 | 17.2% |
| 55 to 64 Years | 1,472 | 17.5% |
| 65 to 74 Years | 1,484 | 17.6% |
| 75 to 84 Years | 734 | 8.7% |
| 85 Years and Over | 287 | 3.4% |
| Total | 8,407 | 100.0% |
Housing Finances in Sulphur
Median Income by Occupancy in Sulphur
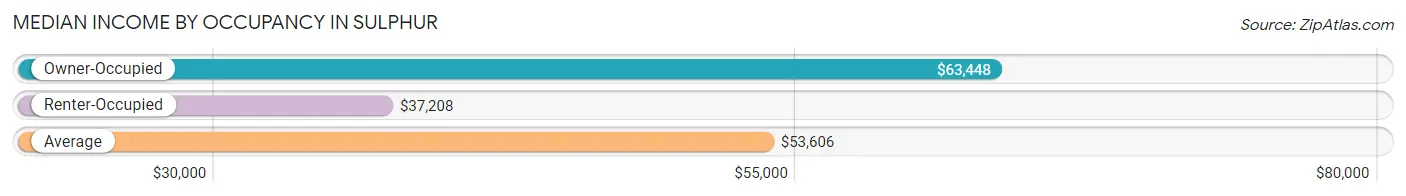
| Occupancy Type | # Households | Median Income |
| Owner-Occupied | 6,020 (71.6%) | $63,448 |
| Renter-Occupied | 2,387 (28.4%) | $37,208 |
| Average | 8,407 (100.0%) | $53,606 |
Occupancy by Householder Income Bracket in Sulphur
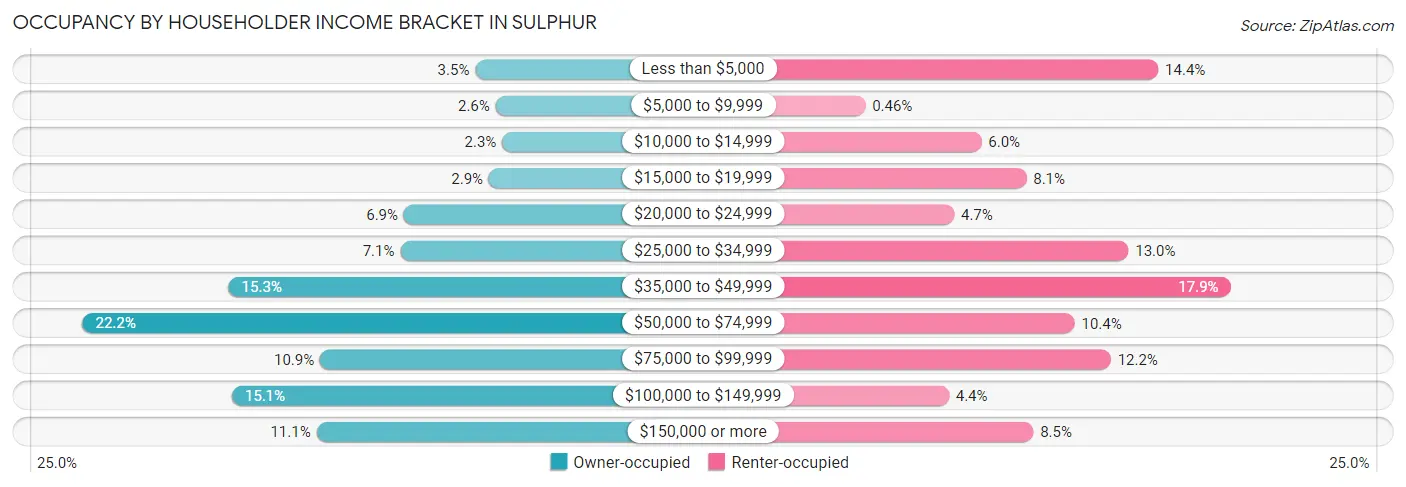
| Income Bracket | Owner-occupied | Renter-occupied |
| Less than $5,000 | 213 (3.5%) | 344 (14.4%) |
| $5,000 to $9,999 | 155 (2.6%) | 11 (0.5%) |
| $10,000 to $14,999 | 136 (2.3%) | 143 (6.0%) |
| $15,000 to $19,999 | 174 (2.9%) | 194 (8.1%) |
| $20,000 to $24,999 | 418 (6.9%) | 112 (4.7%) |
| $25,000 to $34,999 | 428 (7.1%) | 310 (13.0%) |
| $35,000 to $49,999 | 920 (15.3%) | 426 (17.8%) |
| $50,000 to $74,999 | 1,339 (22.2%) | 249 (10.4%) |
| $75,000 to $99,999 | 658 (10.9%) | 290 (12.1%) |
| $100,000 to $149,999 | 911 (15.1%) | 106 (4.4%) |
| $150,000 or more | 668 (11.1%) | 202 (8.5%) |
| Total | 6,020 (100.0%) | 2,387 (100.0%) |
Monthly Housing Cost Tiers in Sulphur
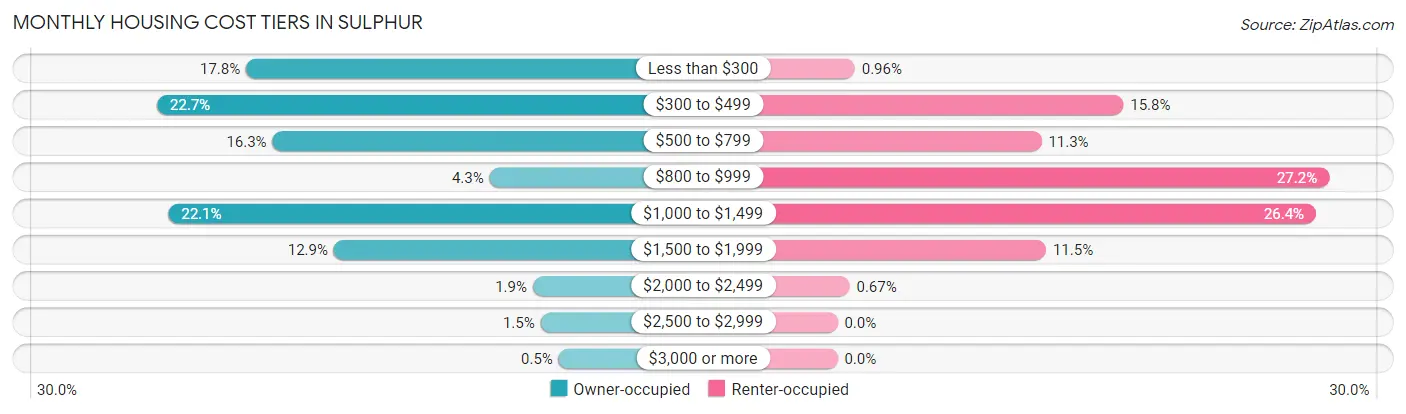
| Monthly Cost | Owner-occupied | Renter-occupied |
| Less than $300 | 1,070 (17.8%) | 23 (1.0%) |
| $300 to $499 | 1,366 (22.7%) | 377 (15.8%) |
| $500 to $799 | 982 (16.3%) | 269 (11.3%) |
| $800 to $999 | 260 (4.3%) | 648 (27.2%) |
| $1,000 to $1,499 | 1,328 (22.1%) | 631 (26.4%) |
| $1,500 to $1,999 | 778 (12.9%) | 275 (11.5%) |
| $2,000 to $2,499 | 116 (1.9%) | 16 (0.7%) |
| $2,500 to $2,999 | 90 (1.5%) | 0 (0.0%) |
| $3,000 or more | 30 (0.5%) | 0 (0.0%) |
| Total | 6,020 (100.0%) | 2,387 (100.0%) |
Physical Housing Characteristics in Sulphur
Housing Structures in Sulphur
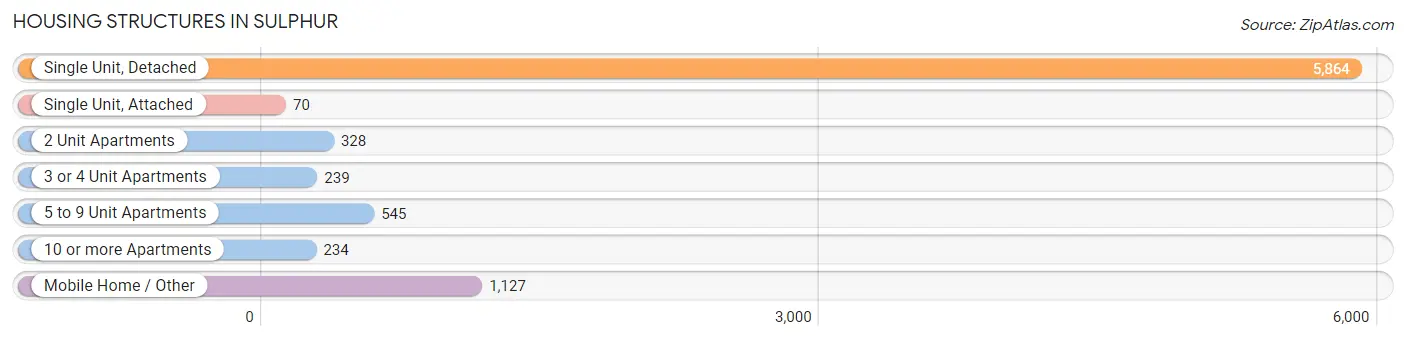
| Structure Type | # Housing Units | % Housing Units |
| Single Unit, Detached | 5,864 | 69.8% |
| Single Unit, Attached | 70 | 0.8% |
| 2 Unit Apartments | 328 | 3.9% |
| 3 or 4 Unit Apartments | 239 | 2.8% |
| 5 to 9 Unit Apartments | 545 | 6.5% |
| 10 or more Apartments | 234 | 2.8% |
| Mobile Home / Other | 1,127 | 13.4% |
| Total | 8,407 | 100.0% |
Housing Structures by Occupancy in Sulphur
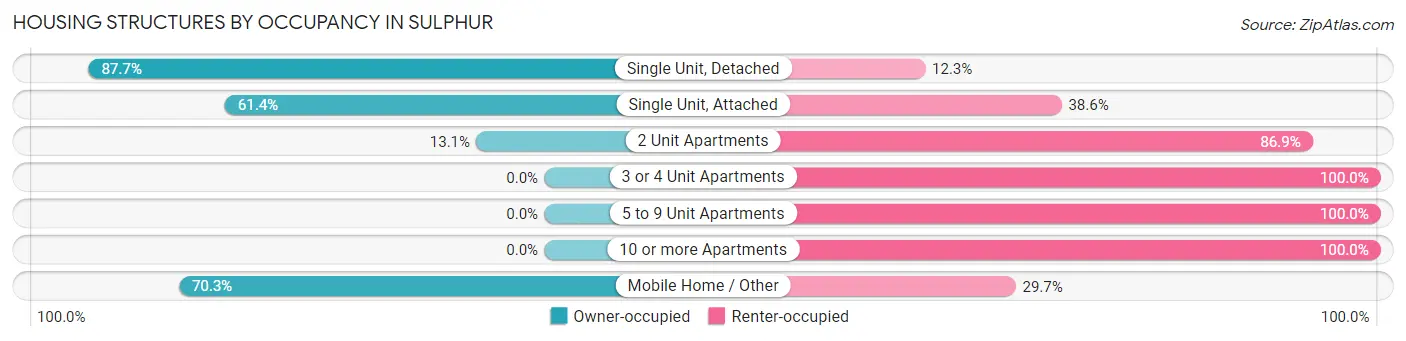
| Structure Type | Owner-occupied | Renter-occupied |
| Single Unit, Detached | 5,142 (87.7%) | 722 (12.3%) |
| Single Unit, Attached | 43 (61.4%) | 27 (38.6%) |
| 2 Unit Apartments | 43 (13.1%) | 285 (86.9%) |
| 3 or 4 Unit Apartments | 0 (0.0%) | 239 (100.0%) |
| 5 to 9 Unit Apartments | 0 (0.0%) | 545 (100.0%) |
| 10 or more Apartments | 0 (0.0%) | 234 (100.0%) |
| Mobile Home / Other | 792 (70.3%) | 335 (29.7%) |
| Total | 6,020 (71.6%) | 2,387 (28.4%) |
Housing Structures by Number of Rooms in Sulphur
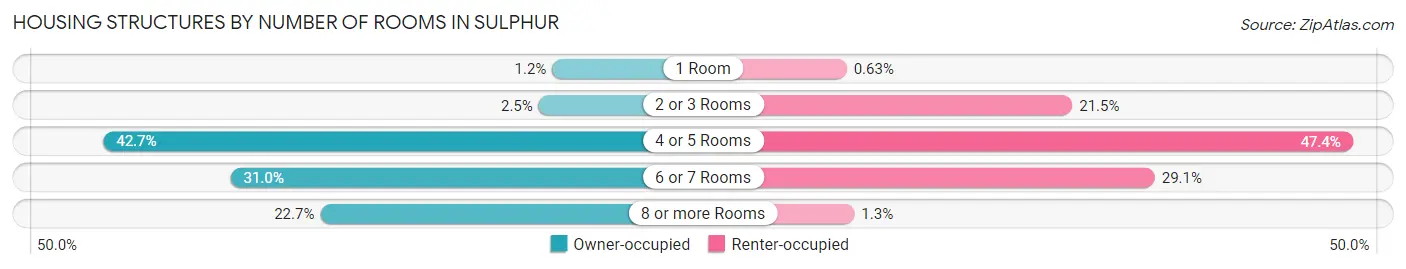
| Number of Rooms | Owner-occupied | Renter-occupied |
| 1 Room | 73 (1.2%) | 15 (0.6%) |
| 2 or 3 Rooms | 148 (2.5%) | 513 (21.5%) |
| 4 or 5 Rooms | 2,572 (42.7%) | 1,132 (47.4%) |
| 6 or 7 Rooms | 1,863 (30.9%) | 695 (29.1%) |
| 8 or more Rooms | 1,364 (22.7%) | 32 (1.3%) |
| Total | 6,020 (100.0%) | 2,387 (100.0%) |
Housing Structure by Heating Type in Sulphur
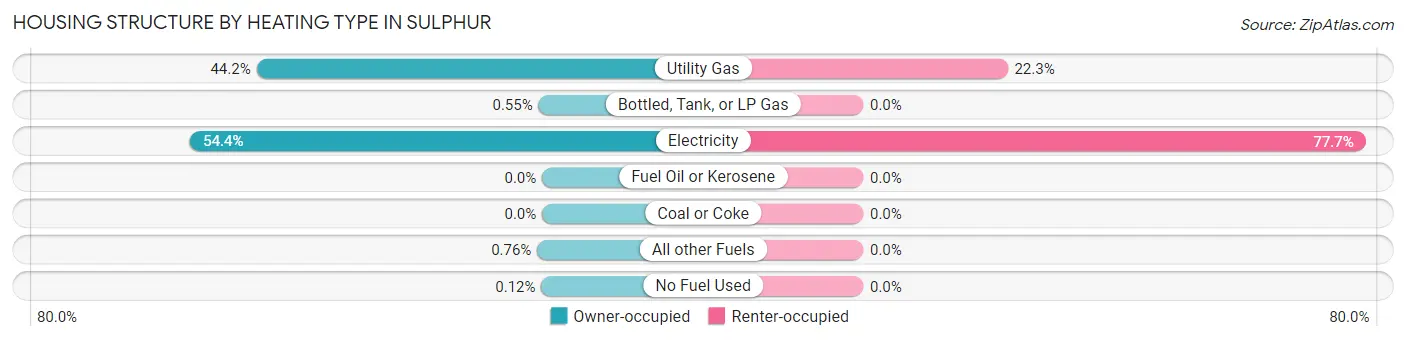
| Heating Type | Owner-occupied | Renter-occupied |
| Utility Gas | 2,658 (44.2%) | 533 (22.3%) |
| Bottled, Tank, or LP Gas | 33 (0.5%) | 0 (0.0%) |
| Electricity | 3,276 (54.4%) | 1,854 (77.7%) |
| Fuel Oil or Kerosene | 0 (0.0%) | 0 (0.0%) |
| Coal or Coke | 0 (0.0%) | 0 (0.0%) |
| All other Fuels | 46 (0.8%) | 0 (0.0%) |
| No Fuel Used | 7 (0.1%) | 0 (0.0%) |
| Total | 6,020 (100.0%) | 2,387 (100.0%) |
Household Vehicle Usage in Sulphur
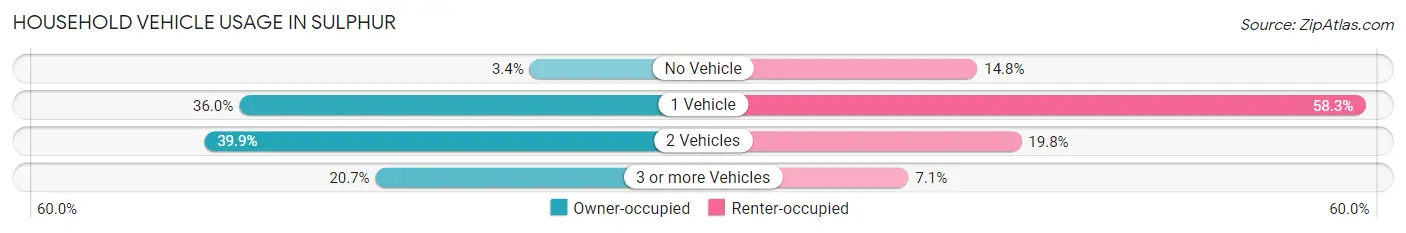
| Vehicles per Household | Owner-occupied | Renter-occupied |
| No Vehicle | 207 (3.4%) | 354 (14.8%) |
| 1 Vehicle | 2,166 (36.0%) | 1,391 (58.3%) |
| 2 Vehicles | 2,401 (39.9%) | 472 (19.8%) |
| 3 or more Vehicles | 1,246 (20.7%) | 170 (7.1%) |
| Total | 6,020 (100.0%) | 2,387 (100.0%) |
Real Estate & Mortgages in Sulphur
Real Estate and Mortgage Overview in Sulphur
| Characteristic | Without Mortgage | With Mortgage |
| Housing Units | 2,908 | 3,112 |
| Median Property Value | $154,100 | $165,300 |
| Median Household Income | $40,183 | $425 |
| Monthly Housing Costs | $380 | $30 |
| Real Estate Taxes | $370 | $428 |
Property Value by Mortgage Status in Sulphur
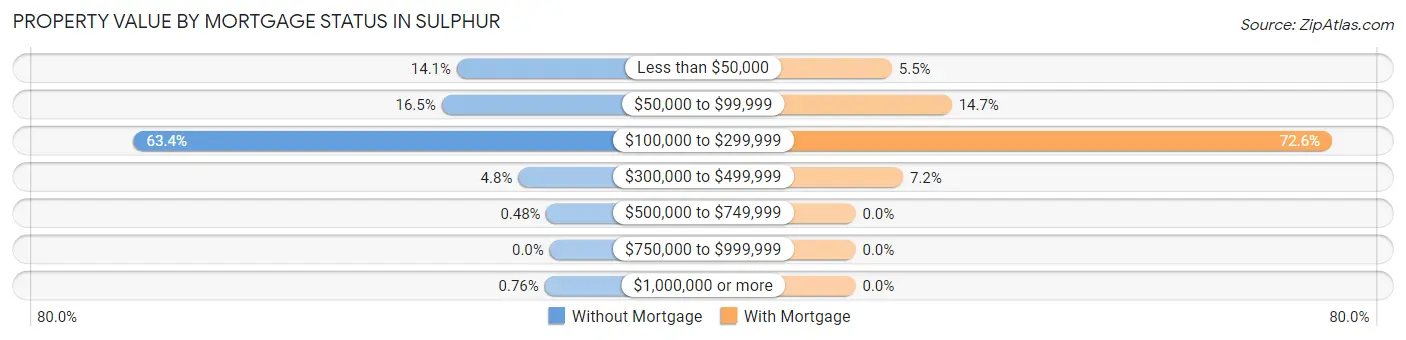
| Property Value | Without Mortgage | With Mortgage |
| Less than $50,000 | 411 (14.1%) | 172 (5.5%) |
| $50,000 to $99,999 | 479 (16.5%) | 456 (14.6%) |
| $100,000 to $299,999 | 1,843 (63.4%) | 2,259 (72.6%) |
| $300,000 to $499,999 | 139 (4.8%) | 225 (7.2%) |
| $500,000 to $749,999 | 14 (0.5%) | 0 (0.0%) |
| $750,000 to $999,999 | 0 (0.0%) | 0 (0.0%) |
| $1,000,000 or more | 22 (0.8%) | 0 (0.0%) |
| Total | 2,908 (100.0%) | 3,112 (100.0%) |
Household Income by Mortgage Status in Sulphur
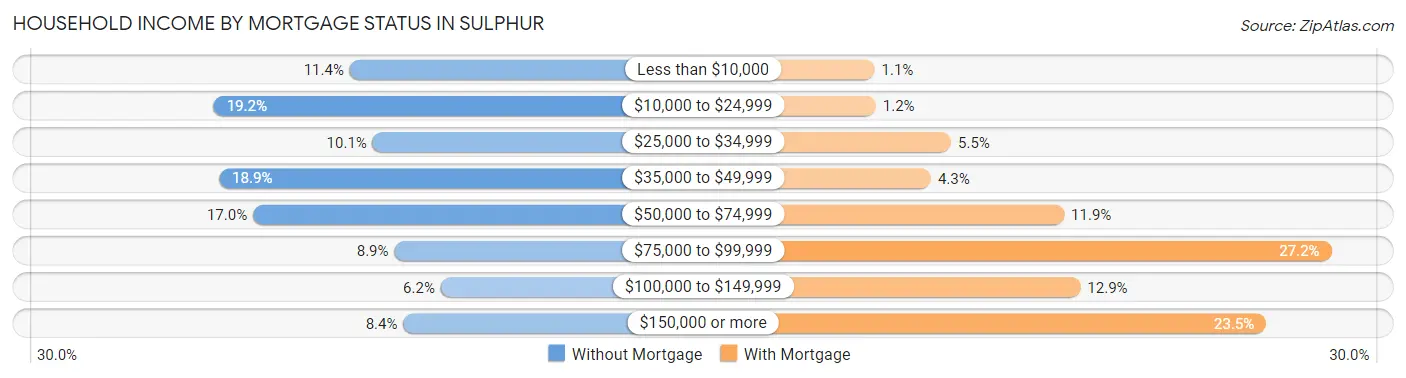
| Household Income | Without Mortgage | With Mortgage |
| Less than $10,000 | 332 (11.4%) | 34 (1.1%) |
| $10,000 to $24,999 | 558 (19.2%) | 36 (1.2%) |
| $25,000 to $34,999 | 294 (10.1%) | 170 (5.5%) |
| $35,000 to $49,999 | 549 (18.9%) | 134 (4.3%) |
| $50,000 to $74,999 | 493 (17.0%) | 371 (11.9%) |
| $75,000 to $99,999 | 258 (8.9%) | 846 (27.2%) |
| $100,000 to $149,999 | 181 (6.2%) | 400 (12.9%) |
| $150,000 or more | 243 (8.4%) | 730 (23.5%) |
| Total | 2,908 (100.0%) | 3,112 (100.0%) |
Property Value to Household Income Ratio in Sulphur
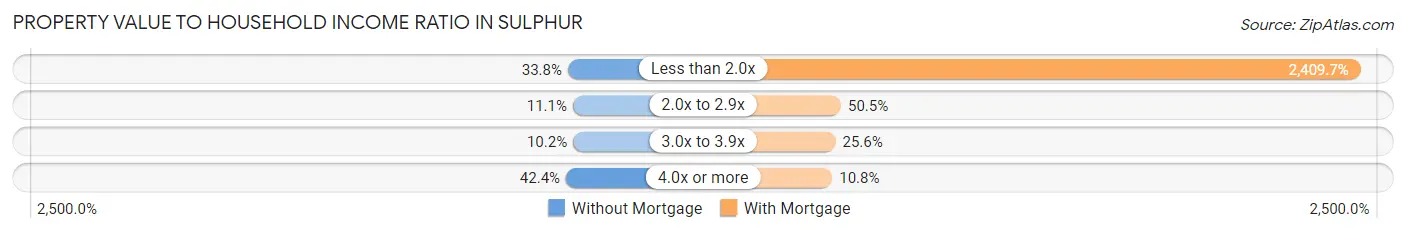
| Value-to-Income Ratio | Without Mortgage | With Mortgage |
| Less than 2.0x | 984 (33.8%) | 74,990 (2,409.7%) |
| 2.0x to 2.9x | 322 (11.1%) | 1,572 (50.5%) |
| 3.0x to 3.9x | 296 (10.2%) | 795 (25.6%) |
| 4.0x or more | 1,232 (42.4%) | 336 (10.8%) |
| Total | 2,908 (100.0%) | 3,112 (100.0%) |
Real Estate Taxes by Mortgage Status in Sulphur
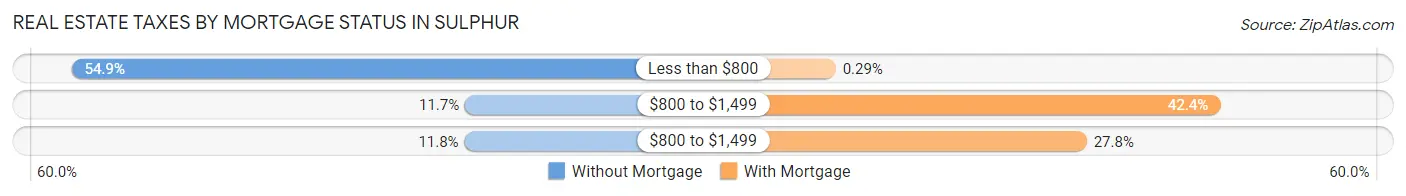
| Property Taxes | Without Mortgage | With Mortgage |
| Less than $800 | 1,595 (54.8%) | 9 (0.3%) |
| $800 to $1,499 | 341 (11.7%) | 1,320 (42.4%) |
| $800 to $1,499 | 343 (11.8%) | 865 (27.8%) |
| Total | 2,908 (100.0%) | 3,112 (100.0%) |
Health & Disability in Sulphur
Health Insurance Coverage by Age in Sulphur
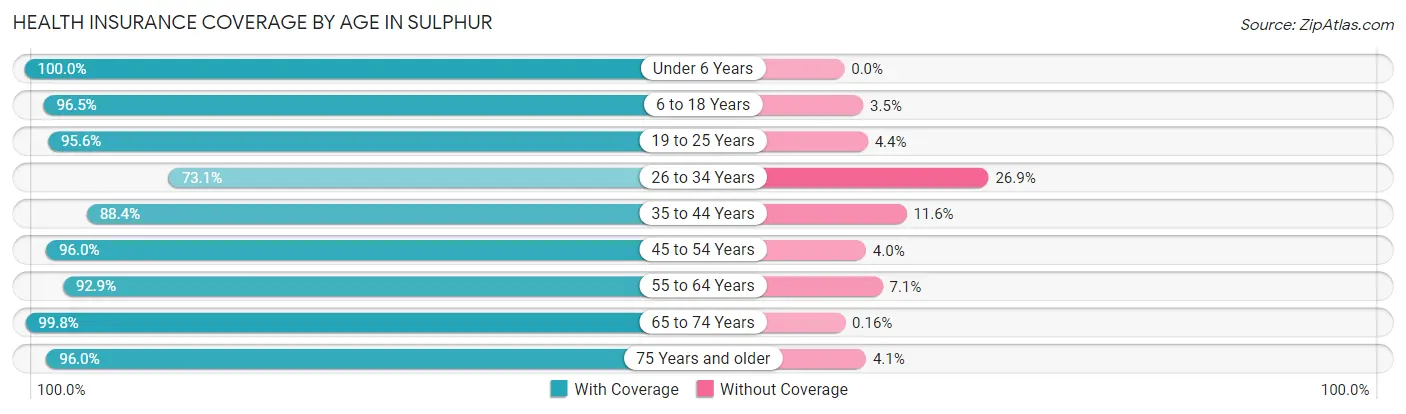
| Age Bracket | With Coverage | Without Coverage |
| Under 6 Years | 1,893 (100.0%) | 0 (0.0%) |
| 6 to 18 Years | 3,209 (96.5%) | 117 (3.5%) |
| 19 to 25 Years | 1,909 (95.6%) | 87 (4.4%) |
| 26 to 34 Years | 1,729 (73.1%) | 636 (26.9%) |
| 35 to 44 Years | 2,456 (88.4%) | 322 (11.6%) |
| 45 to 54 Years | 2,475 (96.0%) | 104 (4.0%) |
| 55 to 64 Years | 2,252 (92.9%) | 173 (7.1%) |
| 65 to 74 Years | 2,569 (99.8%) | 4 (0.2%) |
| 75 Years and older | 1,231 (96.0%) | 52 (4.1%) |
| Total | 19,723 (92.9%) | 1,495 (7.0%) |
Health Insurance Coverage by Citizenship Status in Sulphur
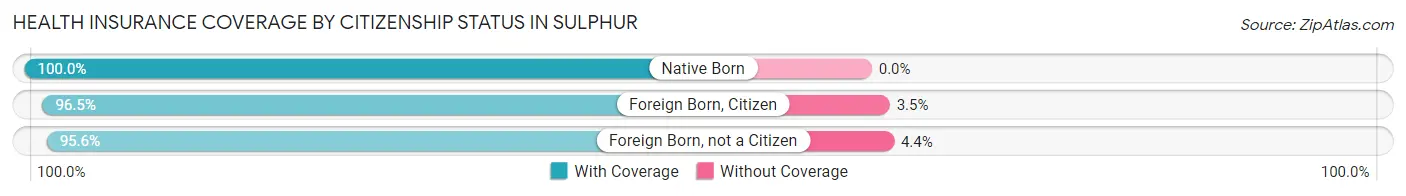
| Citizenship Status | With Coverage | Without Coverage |
| Native Born | 1,893 (100.0%) | 0 (0.0%) |
| Foreign Born, Citizen | 3,209 (96.5%) | 117 (3.5%) |
| Foreign Born, not a Citizen | 1,909 (95.6%) | 87 (4.4%) |
Health Insurance Coverage by Household Income in Sulphur
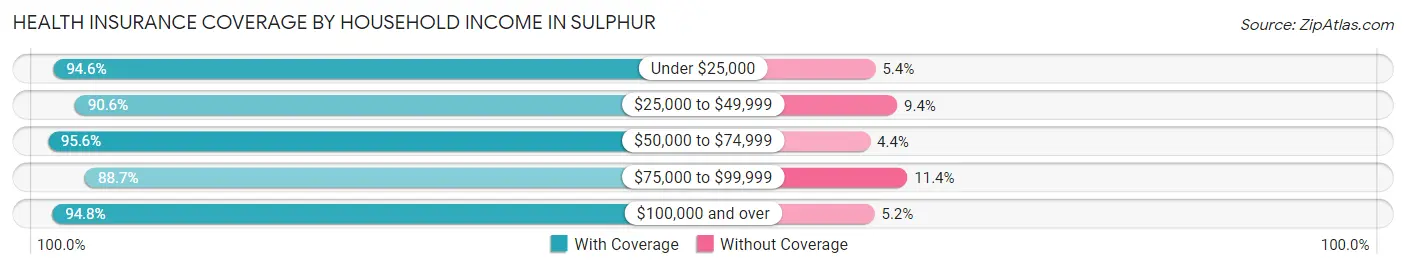
| Household Income | With Coverage | Without Coverage |
| Under $25,000 | 2,520 (94.6%) | 143 (5.4%) |
| $25,000 to $49,999 | 4,585 (90.6%) | 477 (9.4%) |
| $50,000 to $74,999 | 3,530 (95.6%) | 161 (4.4%) |
| $75,000 to $99,999 | 2,959 (88.6%) | 379 (11.4%) |
| $100,000 and over | 6,083 (94.8%) | 334 (5.2%) |
Public vs Private Health Insurance Coverage by Age in Sulphur
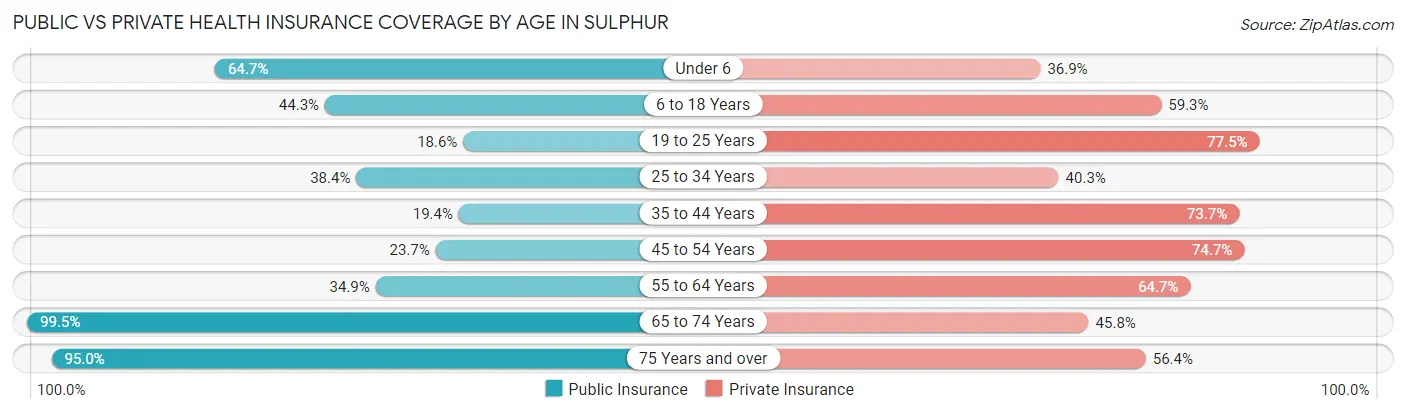
| Age Bracket | Public Insurance | Private Insurance |
| Under 6 | 1,224 (64.7%) | 698 (36.9%) |
| 6 to 18 Years | 1,472 (44.3%) | 1,973 (59.3%) |
| 19 to 25 Years | 371 (18.6%) | 1,547 (77.5%) |
| 25 to 34 Years | 909 (38.4%) | 952 (40.3%) |
| 35 to 44 Years | 539 (19.4%) | 2,048 (73.7%) |
| 45 to 54 Years | 612 (23.7%) | 1,926 (74.7%) |
| 55 to 64 Years | 845 (34.8%) | 1,568 (64.7%) |
| 65 to 74 Years | 2,561 (99.5%) | 1,179 (45.8%) |
| 75 Years and over | 1,219 (95.0%) | 724 (56.4%) |
| Total | 9,752 (46.0%) | 12,615 (59.5%) |
Disability Status by Sex by Age in Sulphur
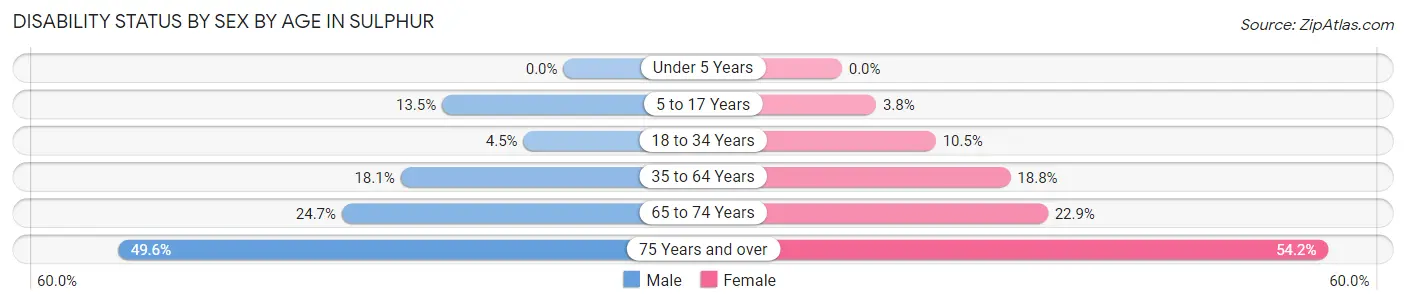
| Age Bracket | Male | Female |
| Under 5 Years | 0 (0.0%) | 0 (0.0%) |
| 5 to 17 Years | 235 (13.5%) | 68 (3.8%) |
| 18 to 34 Years | 92 (4.4%) | 255 (10.5%) |
| 35 to 64 Years | 691 (18.1%) | 746 (18.8%) |
| 65 to 74 Years | 313 (24.7%) | 299 (22.9%) |
| 75 Years and over | 262 (49.6%) | 409 (54.2%) |
Disability Class by Sex by Age in Sulphur
Disability Class: Hearing Difficulty
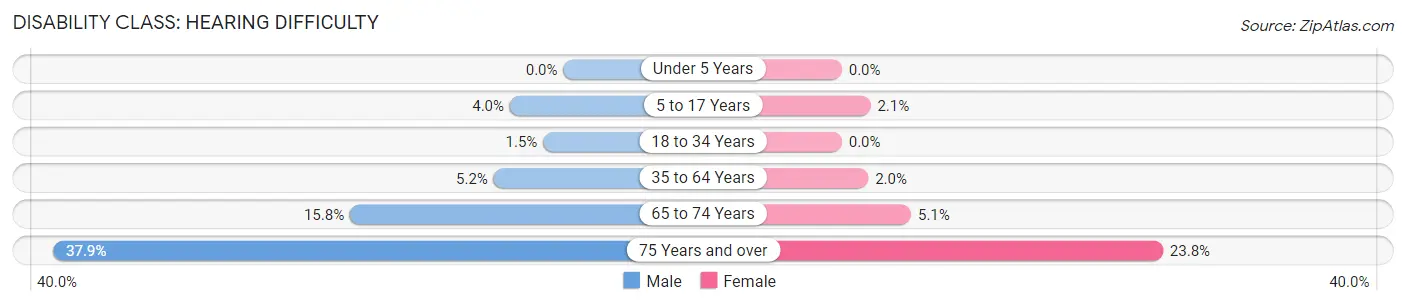
| Age Bracket | Male | Female |
| Under 5 Years | 0 (0.0%) | 0 (0.0%) |
| 5 to 17 Years | 69 (4.0%) | 38 (2.1%) |
| 18 to 34 Years | 31 (1.5%) | 0 (0.0%) |
| 35 to 64 Years | 197 (5.2%) | 78 (2.0%) |
| 65 to 74 Years | 201 (15.8%) | 67 (5.1%) |
| 75 Years and over | 200 (37.9%) | 180 (23.8%) |
Disability Class: Vision Difficulty
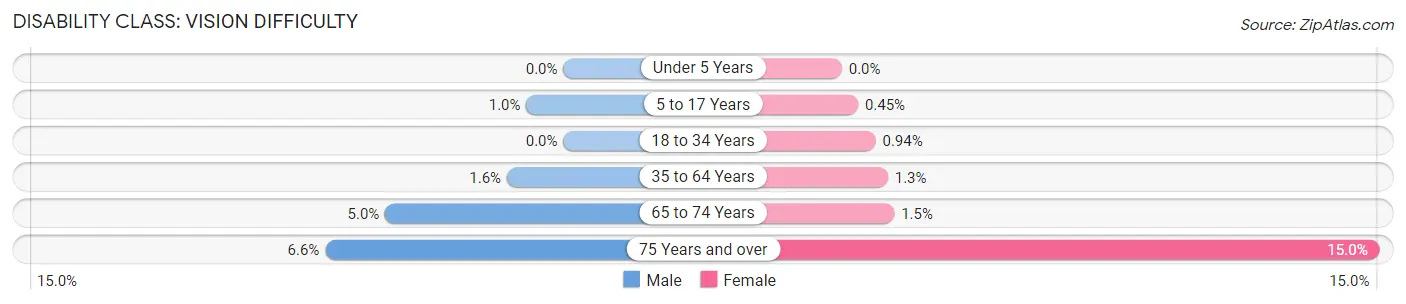
| Age Bracket | Male | Female |
| Under 5 Years | 0 (0.0%) | 0 (0.0%) |
| 5 to 17 Years | 18 (1.0%) | 8 (0.4%) |
| 18 to 34 Years | 0 (0.0%) | 23 (0.9%) |
| 35 to 64 Years | 60 (1.6%) | 51 (1.3%) |
| 65 to 74 Years | 63 (5.0%) | 19 (1.5%) |
| 75 Years and over | 35 (6.6%) | 113 (15.0%) |
Disability Class: Cognitive Difficulty
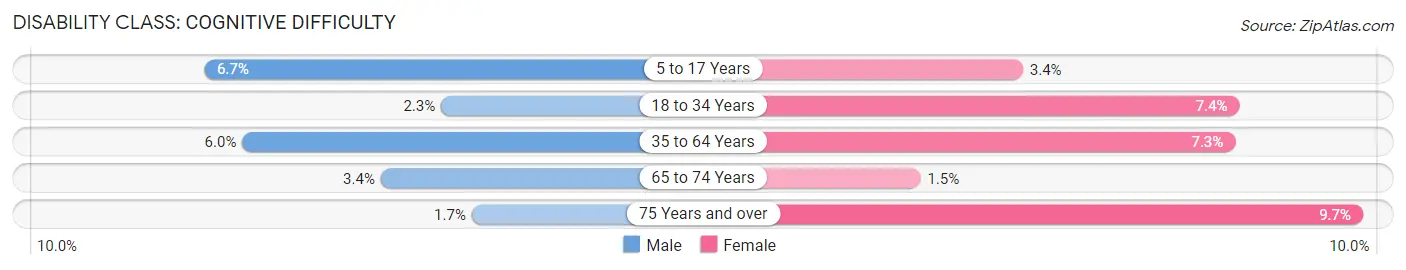
| Age Bracket | Male | Female |
| 5 to 17 Years | 116 (6.7%) | 60 (3.4%) |
| 18 to 34 Years | 47 (2.3%) | 180 (7.4%) |
| 35 to 64 Years | 227 (6.0%) | 290 (7.3%) |
| 65 to 74 Years | 43 (3.4%) | 19 (1.5%) |
| 75 Years and over | 9 (1.7%) | 73 (9.7%) |
Disability Class: Ambulatory Difficulty
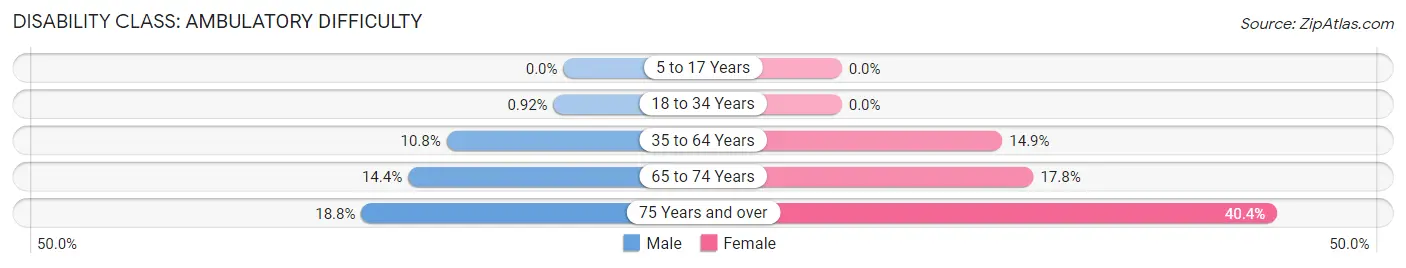
| Age Bracket | Male | Female |
| 5 to 17 Years | 0 (0.0%) | 0 (0.0%) |
| 18 to 34 Years | 19 (0.9%) | 0 (0.0%) |
| 35 to 64 Years | 413 (10.8%) | 592 (14.9%) |
| 65 to 74 Years | 183 (14.4%) | 232 (17.8%) |
| 75 Years and over | 99 (18.8%) | 305 (40.4%) |
Disability Class: Self-Care Difficulty
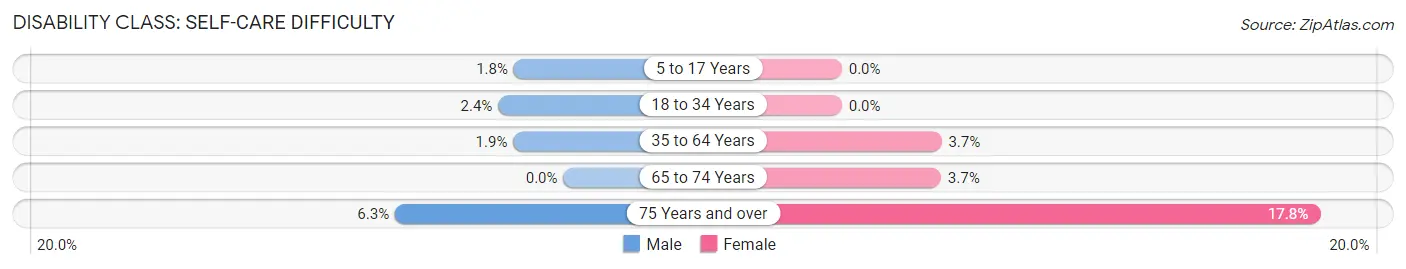
| Age Bracket | Male | Female |
| 5 to 17 Years | 32 (1.8%) | 0 (0.0%) |
| 18 to 34 Years | 50 (2.4%) | 0 (0.0%) |
| 35 to 64 Years | 71 (1.9%) | 147 (3.7%) |
| 65 to 74 Years | 0 (0.0%) | 48 (3.7%) |
| 75 Years and over | 33 (6.2%) | 134 (17.7%) |
Technology Access in Sulphur
Computing Device Access in Sulphur
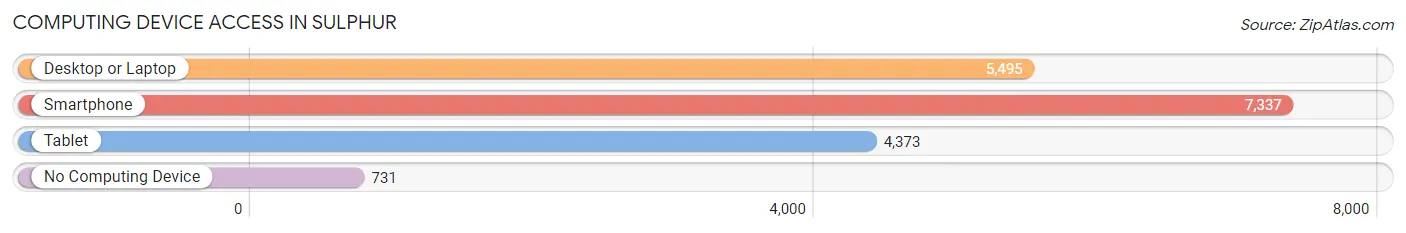
| Device Type | # Households | % Households |
| Desktop or Laptop | 5,495 | 65.4% |
| Smartphone | 7,337 | 87.3% |
| Tablet | 4,373 | 52.0% |
| No Computing Device | 731 | 8.7% |
| Total | 8,407 | 100.0% |
Internet Access in Sulphur
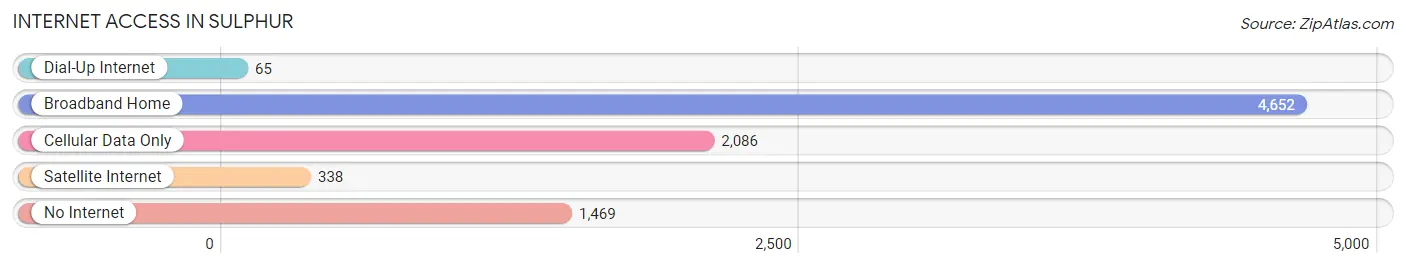
| Internet Type | # Households | % Households |
| Dial-Up Internet | 65 | 0.8% |
| Broadband Home | 4,652 | 55.3% |
| Cellular Data Only | 2,086 | 24.8% |
| Satellite Internet | 338 | 4.0% |
| No Internet | 1,469 | 17.5% |
| Total | 8,407 | 100.0% |
Sulphur Summary
Sulphur, Louisiana is a city located in Calcasieu Parish, Louisiana. It is the largest city in the parish and the fifth largest city in the state. The city is located on the Gulf Coast, approximately 30 miles east of Lake Charles and about 90 miles west of New Orleans. The population of Sulphur was 20,410 as of the 2010 census.
History
Sulphur was founded in 1852 by the Sulphur Mining Company, which was established to mine the area’s abundant sulfur deposits. The city was named after the sulfur deposits, which were used to produce sulfuric acid, a key ingredient in the production of gunpowder. The city was incorporated in 1887 and has since grown to become the largest city in Calcasieu Parish.
Geography
Sulphur is located in southwestern Louisiana, approximately 30 miles east of Lake Charles and 90 miles west of New Orleans. The city is situated on the Gulf Coast, near the Calcasieu River. The city has a total area of 11.2 square miles, of which 10.9 square miles is land and 0.3 square miles is water.
Economy
Sulphur’s economy is largely based on the oil and gas industry. The city is home to several major oil and gas companies, including Chevron, ConocoPhillips, and Shell. The city is also home to several chemical plants, including the Westlake Chemical Corporation and the Dow Chemical Company. In addition, Sulphur is home to several manufacturing companies, including the Sulphur Industrial Park and the Sulphur Industrial Center.
Demographics
As of the 2010 census, the population of Sulphur was 20,410. The racial makeup of the city was 79.2% White, 15.3% African American, 0.7% Native American, 1.2% Asian, 0.1% Pacific Islander, 1.3% from other races, and 2.4% from two or more races. Hispanic or Latino of any race were 4.2% of the population.
The median income for a household in the city was $37,945, and the median income for a family was $45,945. The per capita income for the city was $20,845. About 17.2% of families and 20.3% of the population were below the poverty line, including 28.2% of those under age 18 and 11.2% of those age 65 or over.
Sulphur is a diverse city with a rich history and a vibrant economy. The city is home to several major oil and gas companies, chemical plants, and manufacturing companies, and is a major contributor to the economy of Calcasieu Parish. The city’s population is diverse, with a mix of races and ethnicities, and a median income that is slightly higher than the state average.
Common Questions
What is Per Capita Income in Sulphur?
Per Capita income in Sulphur is $28,405.
What is the Median Family Income in Sulphur?
Median Family Income in Sulphur is $66,007.
What is the Median Household income in Sulphur?
Median Household Income in Sulphur is $53,606.
What is Income or Wage Gap in Sulphur?
Income or Wage Gap in Sulphur is 56.4%.
Women in Sulphur earn 43.6 cents for every dollar earned by a man.
What is Family Income Deficit in Sulphur?
Family Income Deficit in Sulphur is $8,882.
Families that are below poverty line in Sulphur earn $8,882 less on average than the poverty threshold level.
What is Inequality or Gini Index in Sulphur?
Inequality or Gini Index in Sulphur is 0.44.
What is the Total Population of Sulphur?
Total Population of Sulphur is 21,286.
What is the Total Male Population of Sulphur?
Total Male Population of Sulphur is 10,070.
What is the Total Female Population of Sulphur?
Total Female Population of Sulphur is 11,216.
What is the Ratio of Males per 100 Females in Sulphur?
There are 89.78 Males per 100 Females in Sulphur.
What is the Ratio of Females per 100 Males in Sulphur?
There are 111.38 Females per 100 Males in Sulphur.
What is the Median Population Age in Sulphur?
Median Population Age in Sulphur is 38.9 Years.
What is the Average Family Size in Sulphur
Average Family Size in Sulphur is 3.4 People.
What is the Average Household Size in Sulphur
Average Household Size in Sulphur is 2.5 People.
How Large is the Labor Force in Sulphur?
There are 9,274 People in the Labor Forcein in Sulphur.
What is the Percentage of People in the Labor Force in Sulphur?
55.9% of People are in the Labor Force in Sulphur.
What is the Unemployment Rate in Sulphur?
Unemployment Rate in Sulphur is 5.6%.