St James, LA Map & Demographics
St James Map
St James Overview
$27,364
PER CAPITA INCOME
$62,083
AVG FAMILY INCOME
$52,266
AVG HOUSEHOLD INCOME
23.1%
WAGE / INCOME GAP [ % ]
76.9¢/ $1
WAGE / INCOME GAP [ $ ]
0.48
INEQUALITY / GINI INDEX
622
TOTAL POPULATION
329
MALE POPULATION
293
FEMALE POPULATION
112.29
MALES / 100 FEMALES
89.06
FEMALES / 100 MALES
55.4
MEDIAN AGE
3.4
AVG FAMILY SIZE
2.8
AVG HOUSEHOLD SIZE
261
LABOR FORCE [ PEOPLE ]
47.0%
PERCENT IN LABOR FORCE
3.1%
UNEMPLOYMENT RATE
Income in St James
Income Overview in St James
Per Capita Income in St James is $27,364, while median incomes of families and households are $62,083 and $52,266 respectively.
| Characteristic | Number | Measure |
| Per Capita Income | 622 | $27,364 |
| Median Family Income | 164 | $62,083 |
| Mean Family Income | 164 | $82,970 |
| Median Household Income | 223 | $52,266 |
| Mean Household Income | 223 | $71,539 |
| Income Deficit | 164 | $0 |
| Wage / Income Gap (%) | 622 | 23.11% |
| Wage / Income Gap ($) | 622 | 76.89¢ per $1 |
| Gini / Inequality Index | 622 | 0.48 |
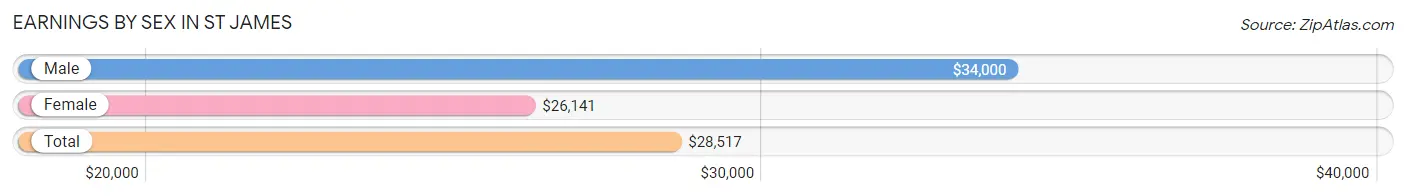
Earnings by Sex in St James
Average Earnings in St James are $28,517, $34,000 for men and $26,141 for women, a difference of 23.1%.
| Sex | Number | Average Earnings |
| Male | 134 (49.4%) | $34,000 |
| Female | 137 (50.5%) | $26,141 |
| Total | 271 (100.0%) | $28,517 |
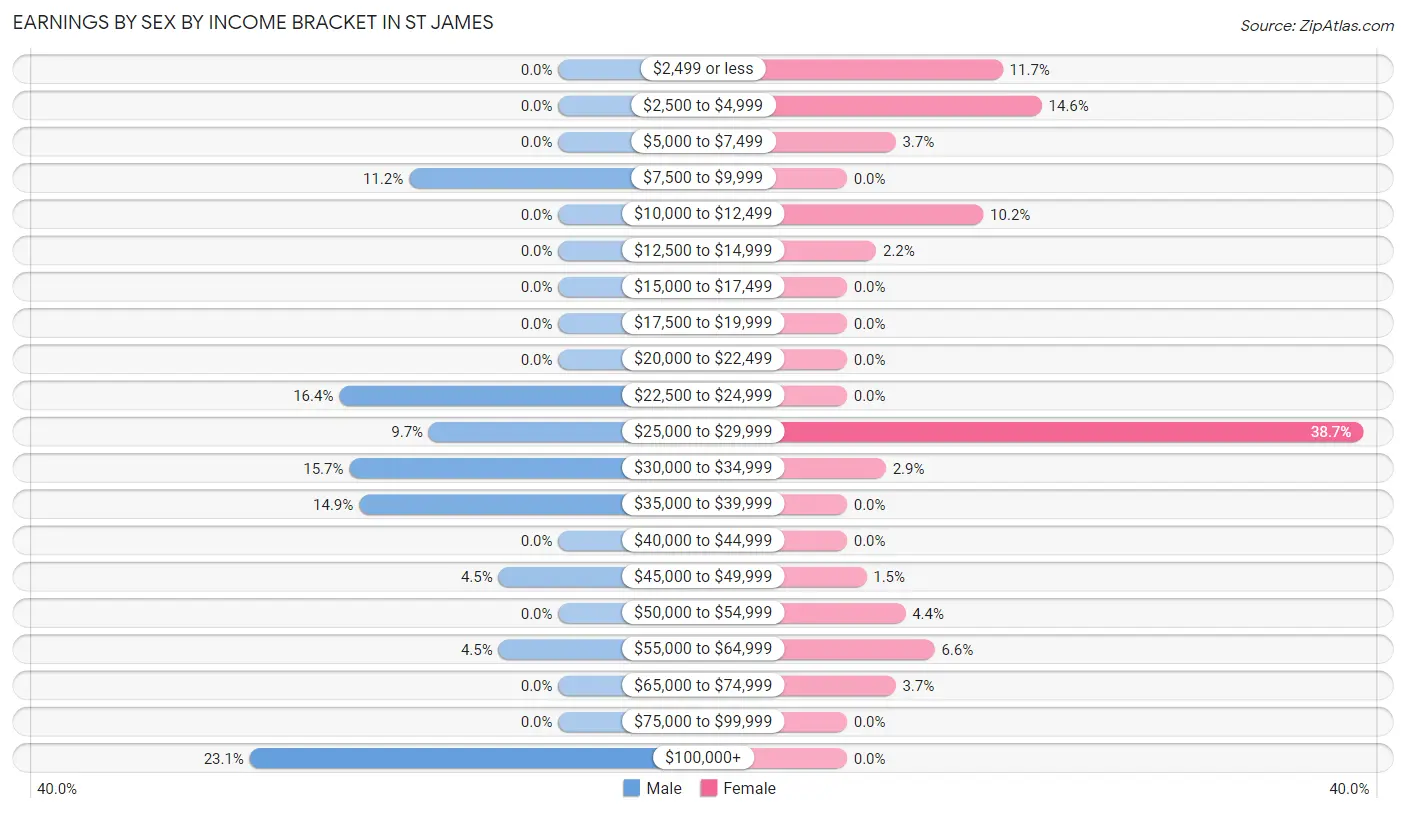
Earnings by Sex by Income Bracket in St James
The most common earnings brackets in St James are $100,000+ for men (31 | 23.1%) and $25,000 to $29,999 for women (53 | 38.7%).
| Income | Male | Female |
| $2,499 or less | 0 (0.0%) | 16 (11.7%) |
| $2,500 to $4,999 | 0 (0.0%) | 20 (14.6%) |
| $5,000 to $7,499 | 0 (0.0%) | 5 (3.6%) |
| $7,500 to $9,999 | 15 (11.2%) | 0 (0.0%) |
| $10,000 to $12,499 | 0 (0.0%) | 14 (10.2%) |
| $12,500 to $14,999 | 0 (0.0%) | 3 (2.2%) |
| $15,000 to $17,499 | 0 (0.0%) | 0 (0.0%) |
| $17,500 to $19,999 | 0 (0.0%) | 0 (0.0%) |
| $20,000 to $22,499 | 0 (0.0%) | 0 (0.0%) |
| $22,500 to $24,999 | 22 (16.4%) | 0 (0.0%) |
| $25,000 to $29,999 | 13 (9.7%) | 53 (38.7%) |
| $30,000 to $34,999 | 21 (15.7%) | 4 (2.9%) |
| $35,000 to $39,999 | 20 (14.9%) | 0 (0.0%) |
| $40,000 to $44,999 | 0 (0.0%) | 0 (0.0%) |
| $45,000 to $49,999 | 6 (4.5%) | 2 (1.5%) |
| $50,000 to $54,999 | 0 (0.0%) | 6 (4.4%) |
| $55,000 to $64,999 | 6 (4.5%) | 9 (6.6%) |
| $65,000 to $74,999 | 0 (0.0%) | 5 (3.6%) |
| $75,000 to $99,999 | 0 (0.0%) | 0 (0.0%) |
| $100,000+ | 31 (23.1%) | 0 (0.0%) |
| Total | 134 (100.0%) | 137 (100.0%) |
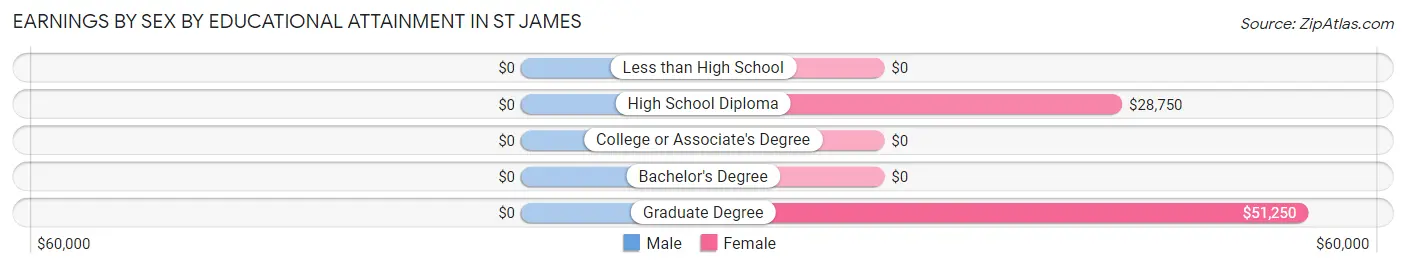
Earnings by Sex by Educational Attainment in St James
| Educational Attainment | Male Income | Female Income |
| Less than High School | - | - |
| High School Diploma | - | - |
| College or Associate's Degree | - | - |
| Bachelor's Degree | - | - |
| Graduate Degree | - | - |
| Total | $34,000 | $27,120 |
Family Income in St James
Family Income Brackets in St James
According to the St James family income data, there are 38 families falling into the $50,000 to $74,999 income range, which is the most common income bracket and makes up 23.2% of all families.
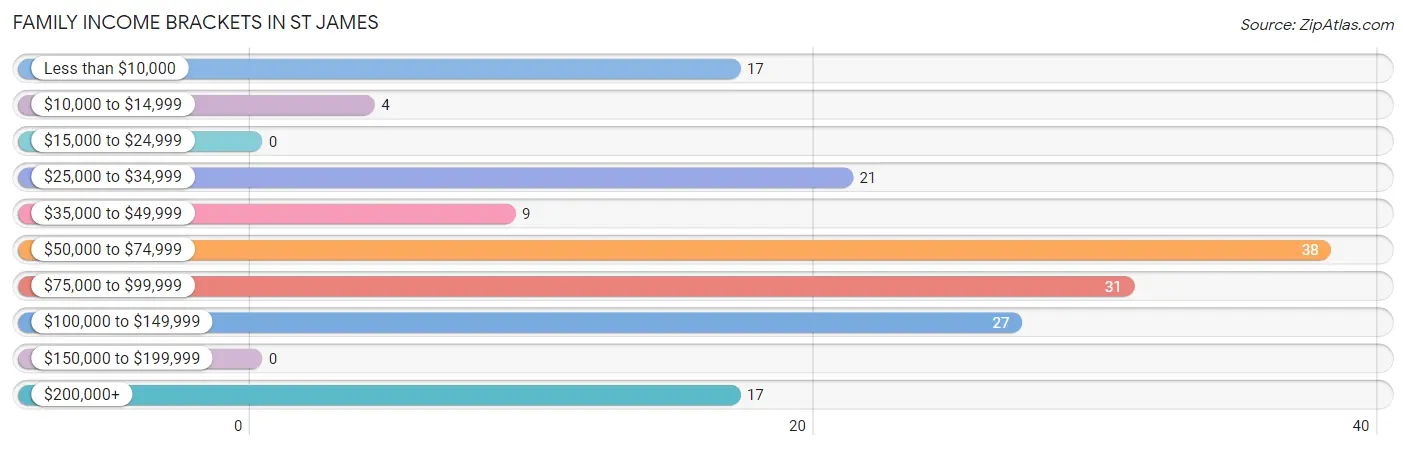
| Income Bracket | # Families | % Families |
| Less than $10,000 | 17 | 10.4% |
| $10,000 to $14,999 | 4 | 2.4% |
| $15,000 to $24,999 | 0 | 0.0% |
| $25,000 to $34,999 | 21 | 12.8% |
| $35,000 to $49,999 | 9 | 5.5% |
| $50,000 to $74,999 | 38 | 23.2% |
| $75,000 to $99,999 | 31 | 18.9% |
| $100,000 to $149,999 | 27 | 16.5% |
| $150,000 to $199,999 | 0 | 0.0% |
| $200,000+ | 17 | 10.4% |
Family Income by Famaliy Size in St James
3-person families (34 | 20.7%) account for the highest median family income in St James with $85,781 per family, while 3-person families (34 | 20.7%) have the highest median income of $28,594 per family member.
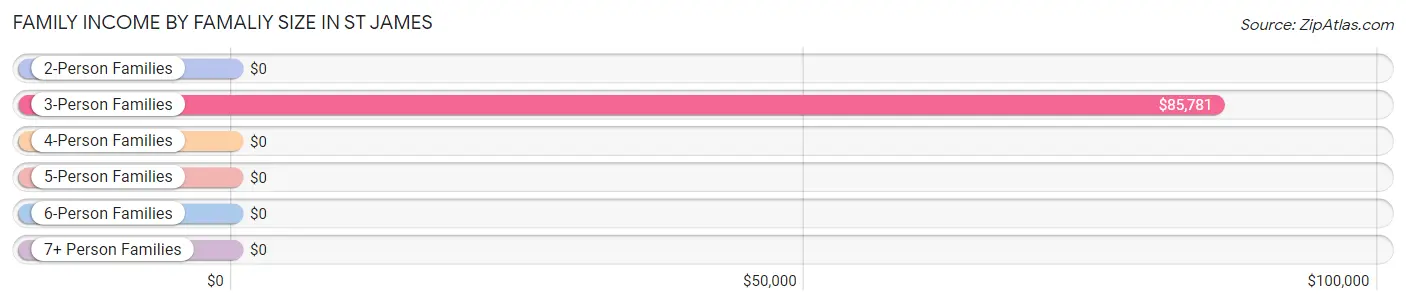
| Income Bracket | # Families | Median Income |
| 2-Person Families | 72 (43.9%) | $0 |
| 3-Person Families | 34 (20.7%) | $85,781 |
| 4-Person Families | 34 (20.7%) | $0 |
| 5-Person Families | 0 (0.0%) | $0 |
| 6-Person Families | 24 (14.6%) | $0 |
| 7+ Person Families | 0 (0.0%) | $0 |
| Total | 164 (100.0%) | $62,083 |
Family Income by Number of Earners in St James
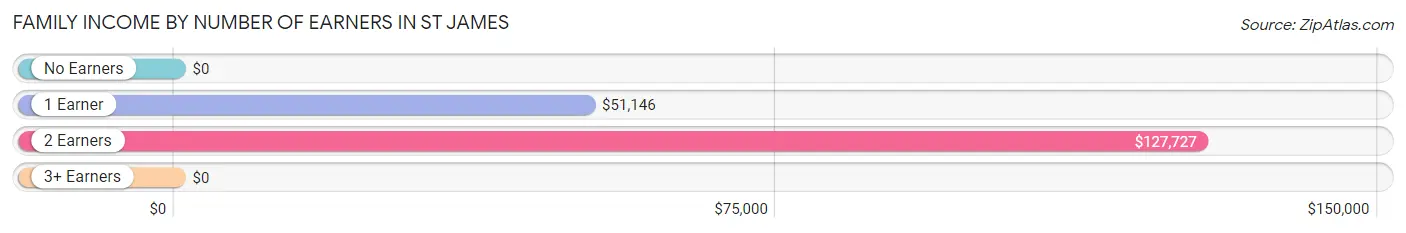
| Number of Earners | # Families | Median Income |
| No Earners | 37 (22.6%) | $0 |
| 1 Earner | 53 (32.3%) | $51,146 |
| 2 Earners | 74 (45.1%) | $127,727 |
| 3+ Earners | 0 (0.0%) | $0 |
| Total | 164 (100.0%) | $62,083 |
Household Income in St James
Household Income Brackets in St James
With 43 households falling in the category, the $50,000 to $74,999 income range is the most frequent in St James, accounting for 19.3% of all households.
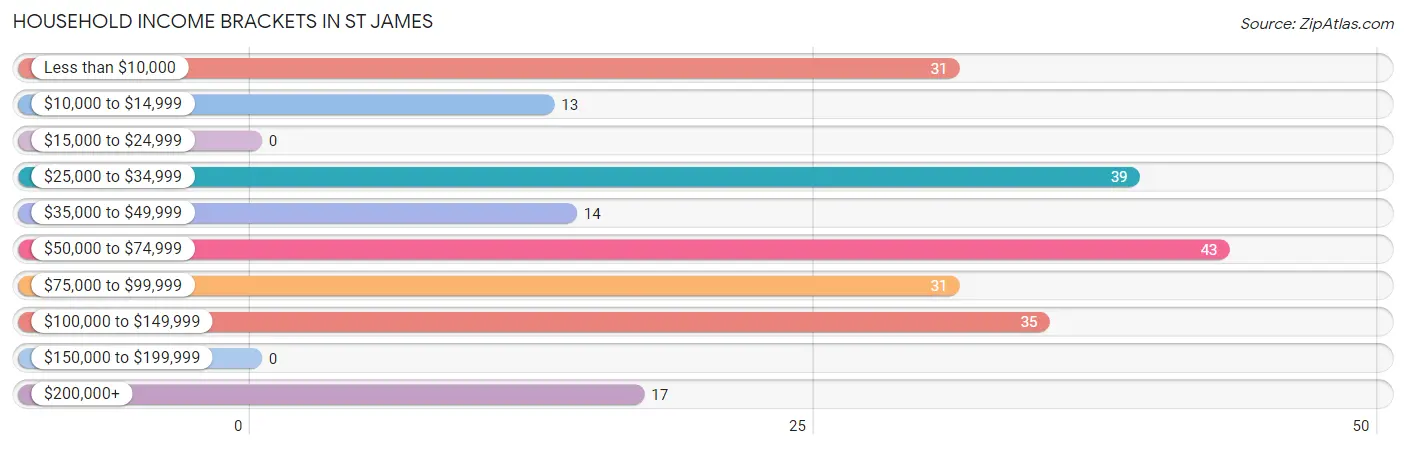
| Income Bracket | # Households | % Households |
| Less than $10,000 | 31 | 13.9% |
| $10,000 to $14,999 | 13 | 5.8% |
| $15,000 to $24,999 | 0 | 0.0% |
| $25,000 to $34,999 | 39 | 17.5% |
| $35,000 to $49,999 | 14 | 6.3% |
| $50,000 to $74,999 | 43 | 19.3% |
| $75,000 to $99,999 | 31 | 13.9% |
| $100,000 to $149,999 | 35 | 15.7% |
| $150,000 to $199,999 | 0 | 0.0% |
| $200,000+ | 17 | 7.6% |
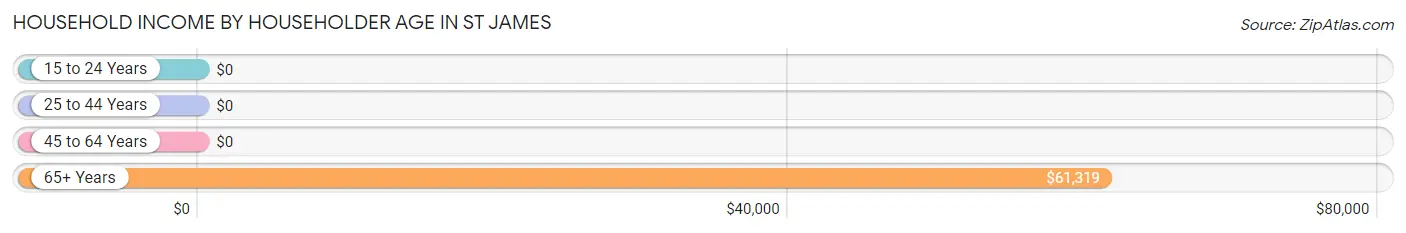
Household Income by Householder Age in St James
The median household income in St James is $52,266, with the highest median household income of $61,319 found in the 65+ years age bracket for the primary householder. A total of 143 households (64.1%) fall into this category.
| Income Bracket | # Households | Median Income |
| 15 to 24 Years | 0 (0.0%) | $0 |
| 25 to 44 Years | 22 (9.9%) | $0 |
| 45 to 64 Years | 58 (26.0%) | $0 |
| 65+ Years | 143 (64.1%) | $61,319 |
| Total | 223 (100.0%) | $52,266 |
Poverty in St James
Income Below Poverty by Sex and Age in St James
With 7.3% poverty level for males and 13.0% for females among the residents of St James, 65 to 74 year old males and 45 to 54 year old females are the most vulnerable to poverty, with 17 males (21.2%) and 9 females (50.0%) in their respective age groups living below the poverty level.
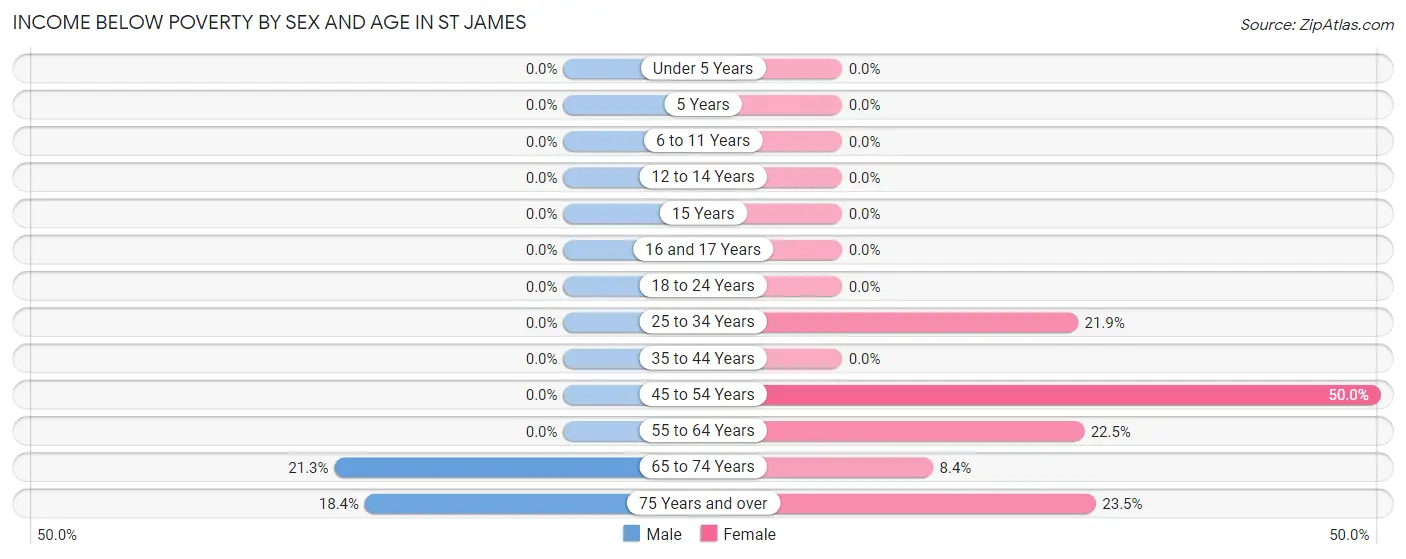
| Age Bracket | Male | Female |
| Under 5 Years | 0 (0.0%) | 0 (0.0%) |
| 5 Years | 0 (0.0%) | 0 (0.0%) |
| 6 to 11 Years | 0 (0.0%) | 0 (0.0%) |
| 12 to 14 Years | 0 (0.0%) | 0 (0.0%) |
| 15 Years | 0 (0.0%) | 0 (0.0%) |
| 16 and 17 Years | 0 (0.0%) | 0 (0.0%) |
| 18 to 24 Years | 0 (0.0%) | 0 (0.0%) |
| 25 to 34 Years | 0 (0.0%) | 7 (21.9%) |
| 35 to 44 Years | 0 (0.0%) | 0 (0.0%) |
| 45 to 54 Years | 0 (0.0%) | 9 (50.0%) |
| 55 to 64 Years | 0 (0.0%) | 11 (22.5%) |
| 65 to 74 Years | 17 (21.2%) | 7 (8.4%) |
| 75 Years and over | 7 (18.4%) | 4 (23.5%) |
| Total | 24 (7.3%) | 38 (13.0%) |
Income Above Poverty by Sex and Age in St James
According to the poverty statistics in St James, males aged 6 to 11 years and females aged 6 to 11 years are the age groups that are most secure financially, with 100.0% of males and 100.0% of females in these age groups living above the poverty line.
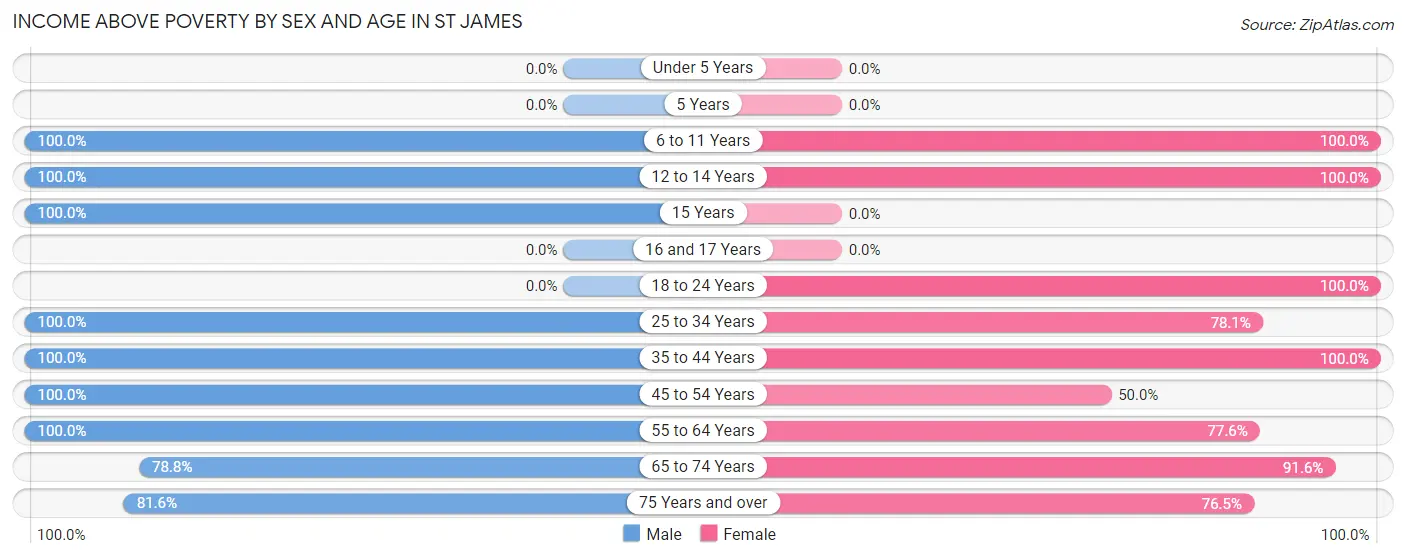
| Age Bracket | Male | Female |
| Under 5 Years | 0 (0.0%) | 0 (0.0%) |
| 5 Years | 0 (0.0%) | 0 (0.0%) |
| 6 to 11 Years | 13 (100.0%) | 25 (100.0%) |
| 12 to 14 Years | 14 (100.0%) | 5 (100.0%) |
| 15 Years | 10 (100.0%) | 0 (0.0%) |
| 16 and 17 Years | 0 (0.0%) | 0 (0.0%) |
| 18 to 24 Years | 0 (0.0%) | 42 (100.0%) |
| 25 to 34 Years | 56 (100.0%) | 25 (78.1%) |
| 35 to 44 Years | 14 (100.0%) | 22 (100.0%) |
| 45 to 54 Years | 55 (100.0%) | 9 (50.0%) |
| 55 to 64 Years | 49 (100.0%) | 38 (77.5%) |
| 65 to 74 Years | 63 (78.7%) | 76 (91.6%) |
| 75 Years and over | 31 (81.6%) | 13 (76.5%) |
| Total | 305 (92.7%) | 255 (87.0%) |
Income Below Poverty Among Married-Couple Families in St James
The poverty statistics for married-couple families in St James show that 14.1% or 17 of the total 121 families live below the poverty line. Families with no children have the highest poverty rate of 24.3%, comprising of 17 families. On the other hand, families with 1 or 2 children have the lowest poverty rate of 0.0%, which includes 0 families.
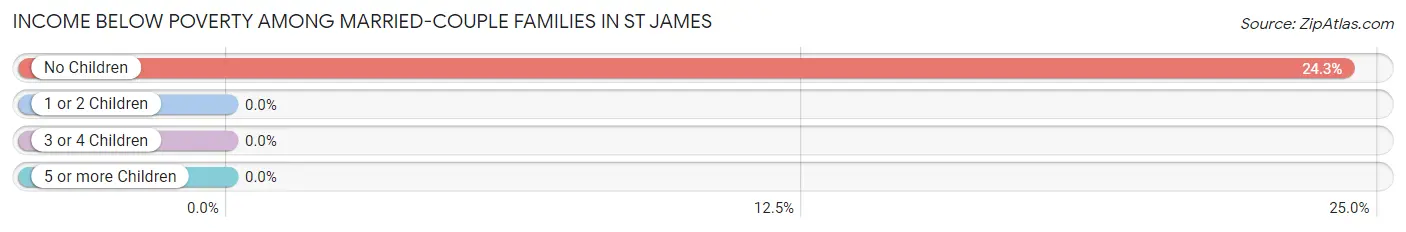
| Children | Above Poverty | Below Poverty |
| No Children | 53 (75.7%) | 17 (24.3%) |
| 1 or 2 Children | 45 (100.0%) | 0 (0.0%) |
| 3 or 4 Children | 6 (100.0%) | 0 (0.0%) |
| 5 or more Children | 0 (0.0%) | 0 (0.0%) |
| Total | 104 (86.0%) | 17 (14.1%) |
Income Below Poverty Among Single-Parent Households in St James
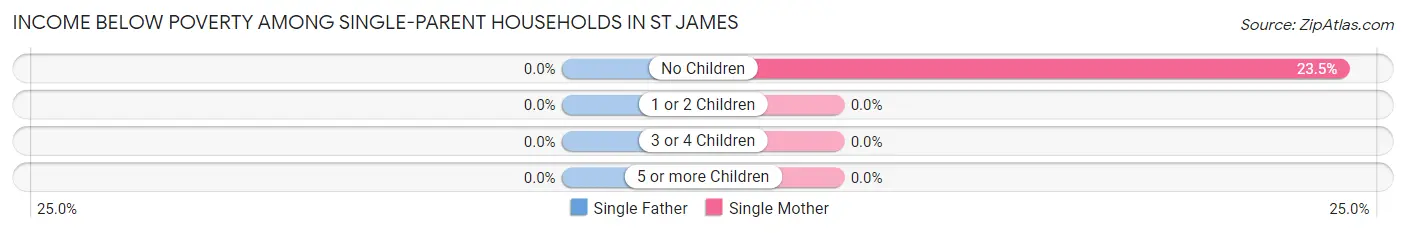
| Children | Single Father | Single Mother |
| No Children | 0 (0.0%) | 4 (23.5%) |
| 1 or 2 Children | 0 (0.0%) | 0 (0.0%) |
| 3 or 4 Children | 0 (0.0%) | 0 (0.0%) |
| 5 or more Children | 0 (0.0%) | 0 (0.0%) |
| Total | 0 (0.0%) | 4 (13.8%) |
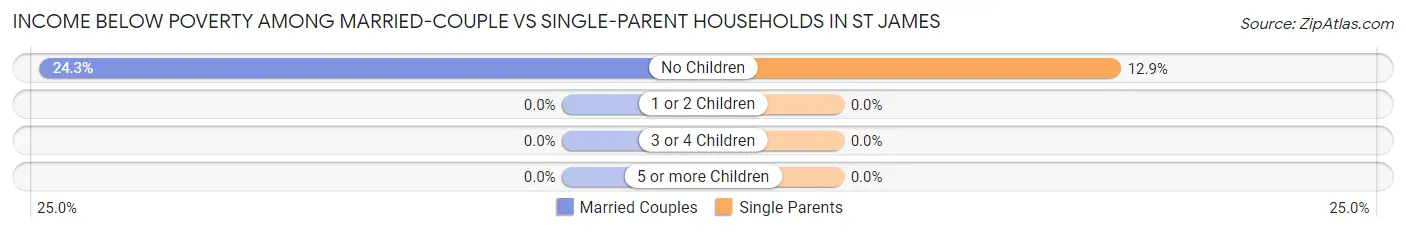
Income Below Poverty Among Married-Couple vs Single-Parent Households in St James
The poverty data for St James shows that 17 of the married-couple family households (14.1%) and 4 of the single-parent households (9.3%) are living below the poverty level. Within the married-couple family households, those with no children have the highest poverty rate, with 17 households (24.3%) falling below the poverty line. Among the single-parent households, those with no children have the highest poverty rate, with 4 household (12.9%) living below poverty.
| Children | Married-Couple Families | Single-Parent Households |
| No Children | 17 (24.3%) | 4 (12.9%) |
| 1 or 2 Children | 0 (0.0%) | 0 (0.0%) |
| 3 or 4 Children | 0 (0.0%) | 0 (0.0%) |
| 5 or more Children | 0 (0.0%) | 0 (0.0%) |
| Total | 17 (14.1%) | 4 (9.3%) |
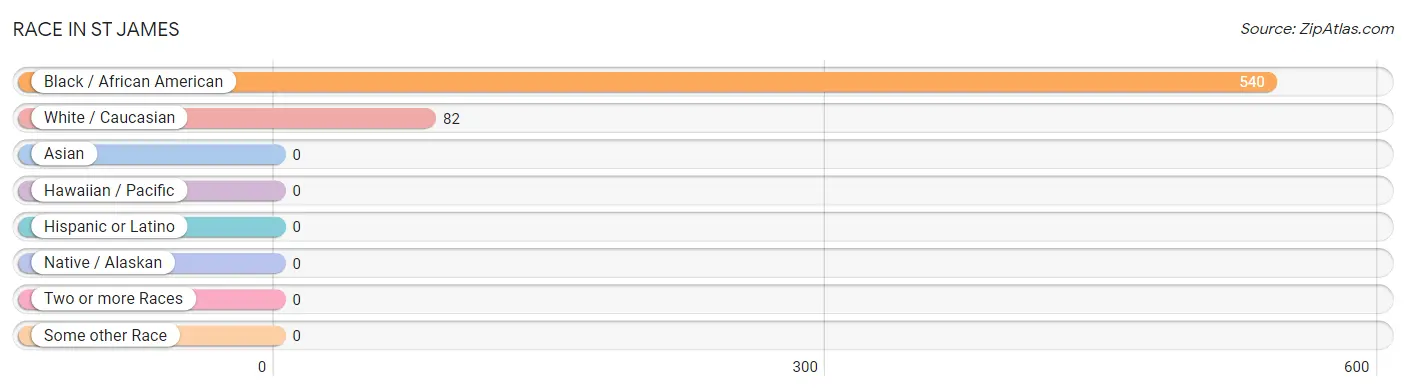
Race in St James
The most populous races in St James are Black / African American (540 | 86.8%), and White / Caucasian (82 | 13.2%).
| Race | # Population | % Population |
| Asian | 0 | 0.0% |
| Black / African American | 540 | 86.8% |
| Hawaiian / Pacific | 0 | 0.0% |
| Hispanic or Latino | 0 | 0.0% |
| Native / Alaskan | 0 | 0.0% |
| White / Caucasian | 82 | 13.2% |
| Two or more Races | 0 | 0.0% |
| Some other Race | 0 | 0.0% |
| Total | 622 | 100.0% |
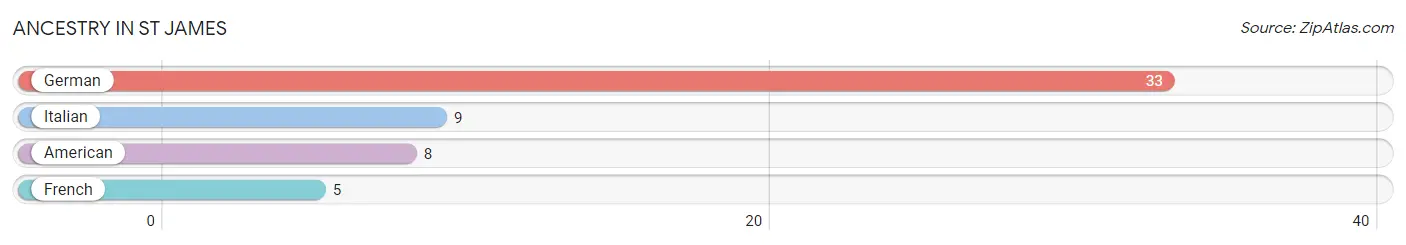
Ancestry in St James
The most populous ancestries reported in St James are German (33 | 5.3%), Italian (9 | 1.5%), American (8 | 1.3%), and French (5 | 0.8%), together accounting for 8.8% of all St James residents.
| Ancestry | # Population | % Population |
| American | 8 | 1.3% |
| French | 5 | 0.8% |
| German | 33 | 5.3% |
| Italian | 9 | 1.5% | View All 4 Rows |
Immigrants in St James

| Immigration Origin | # Population | % Population | View All 0 Rows |
Sex and Age in St James
Sex and Age in St James
The most populous age groups in St James are 70 to 74 Years (46 | 14.0%) for men and 65 to 69 Years (54 | 18.4%) for women.
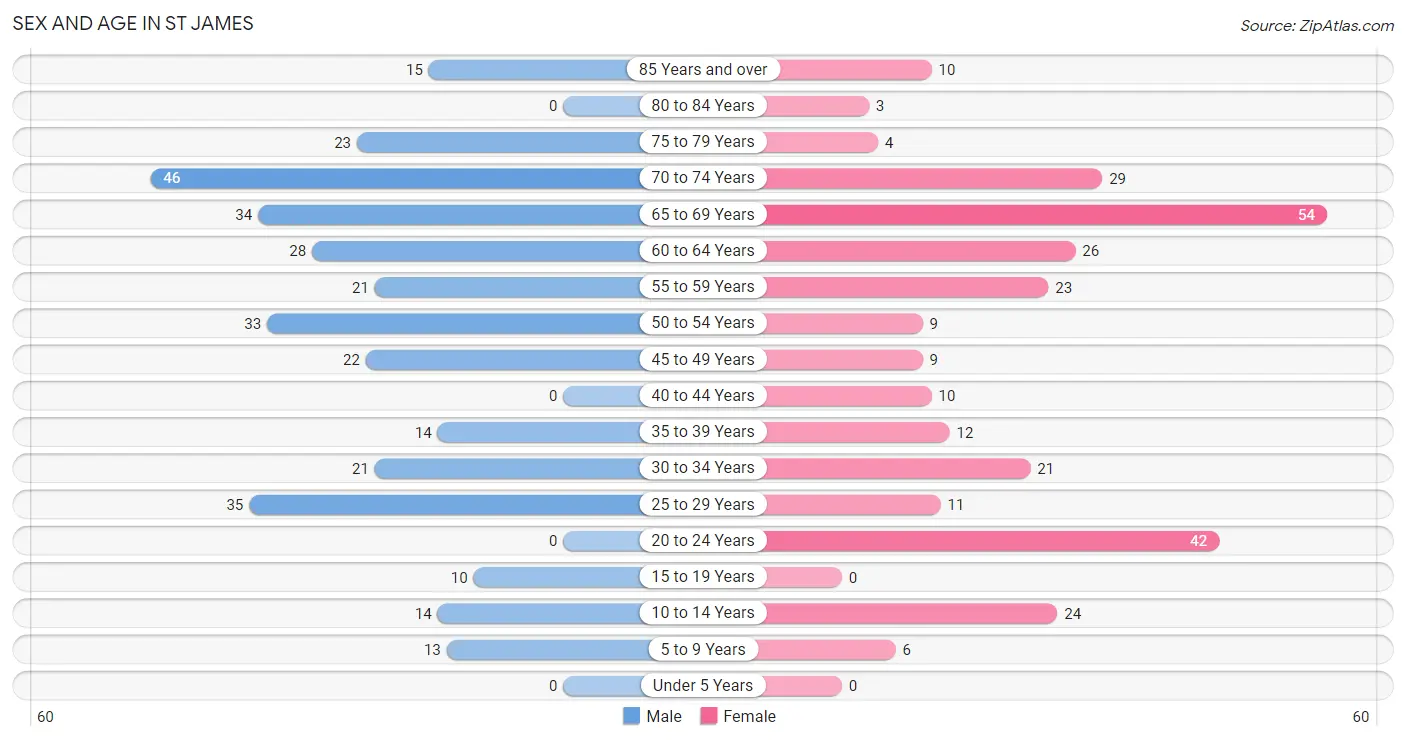
| Age Bracket | Male | Female |
| Under 5 Years | 0 (0.0%) | 0 (0.0%) |
| 5 to 9 Years | 13 (4.0%) | 6 (2.1%) |
| 10 to 14 Years | 14 (4.3%) | 24 (8.2%) |
| 15 to 19 Years | 10 (3.0%) | 0 (0.0%) |
| 20 to 24 Years | 0 (0.0%) | 42 (14.3%) |
| 25 to 29 Years | 35 (10.6%) | 11 (3.7%) |
| 30 to 34 Years | 21 (6.4%) | 21 (7.2%) |
| 35 to 39 Years | 14 (4.3%) | 12 (4.1%) |
| 40 to 44 Years | 0 (0.0%) | 10 (3.4%) |
| 45 to 49 Years | 22 (6.7%) | 9 (3.1%) |
| 50 to 54 Years | 33 (10.0%) | 9 (3.1%) |
| 55 to 59 Years | 21 (6.4%) | 23 (7.9%) |
| 60 to 64 Years | 28 (8.5%) | 26 (8.9%) |
| 65 to 69 Years | 34 (10.3%) | 54 (18.4%) |
| 70 to 74 Years | 46 (14.0%) | 29 (9.9%) |
| 75 to 79 Years | 23 (7.0%) | 4 (1.4%) |
| 80 to 84 Years | 0 (0.0%) | 3 (1.0%) |
| 85 Years and over | 15 (4.6%) | 10 (3.4%) |
| Total | 329 (100.0%) | 293 (100.0%) |
Families and Households in St James
Median Family Size in St James
The median family size in St James is 3.43 persons per family, with married-couple families (121 | 73.8%) accounting for the largest median family size of 3.66 persons per family. On the other hand, single female/mother families (29 | 17.7%) represent the smallest median family size with 2.72 persons per family.
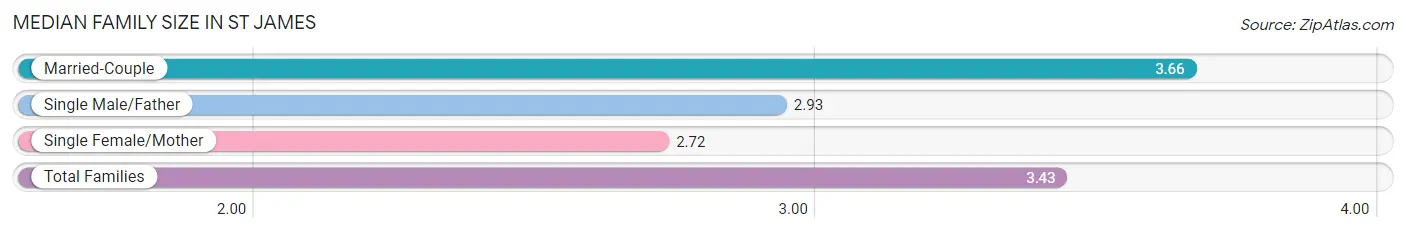
| Family Type | # Families | Family Size |
| Married-Couple | 121 (73.8%) | 3.66 |
| Single Male/Father | 14 (8.5%) | 2.93 |
| Single Female/Mother | 29 (17.7%) | 2.72 |
| Total Families | 164 (100.0%) | 3.43 |
Median Household Size in St James
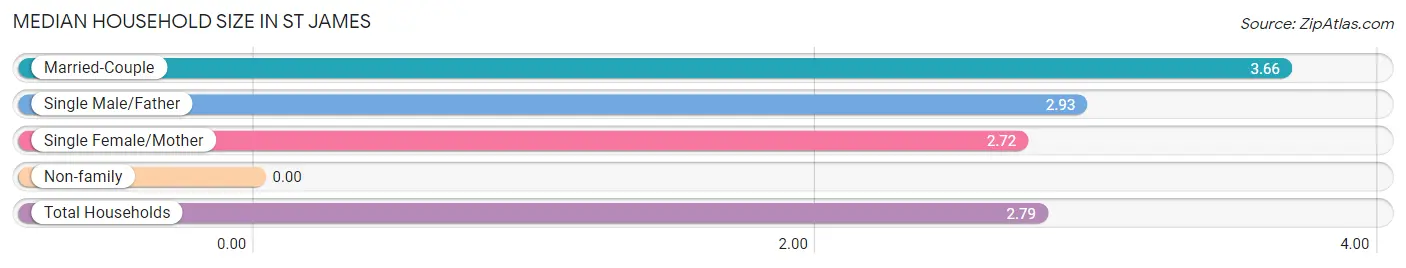
| Household Type | # Households | Household Size |
| Married-Couple | 121 (54.3%) | 3.66 |
| Single Male/Father | 14 (6.3%) | 2.93 |
| Single Female/Mother | 29 (13.0%) | 2.72 |
| Non-family | 59 (26.5%) | - |
| Total Households | 223 (100.0%) | 2.79 |
Household Size by Marriage Status in St James
Out of a total of 223 households in St James, 164 (73.5%) are family households, while 59 (26.5%) are nonfamily households. The most numerous type of family households are 2-person households, comprising 72, and the most common type of nonfamily households are 1-person households, comprising 59.
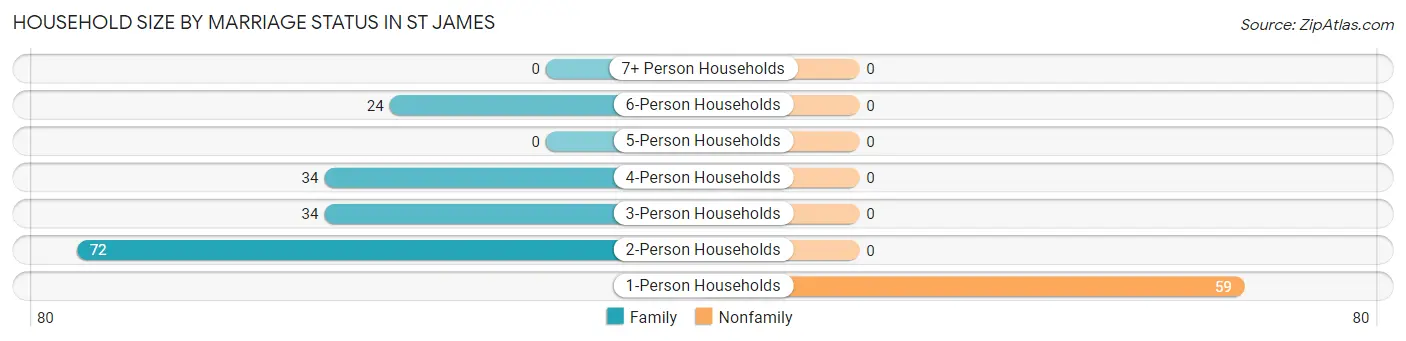
| Household Size | Family Households | Nonfamily Households |
| 1-Person Households | - | 59 (26.5%) |
| 2-Person Households | 72 (32.3%) | 0 (0.0%) |
| 3-Person Households | 34 (15.2%) | 0 (0.0%) |
| 4-Person Households | 34 (15.2%) | 0 (0.0%) |
| 5-Person Households | 0 (0.0%) | 0 (0.0%) |
| 6-Person Households | 24 (10.8%) | 0 (0.0%) |
| 7+ Person Households | 0 (0.0%) | 0 (0.0%) |
| Total | 164 (73.5%) | 59 (26.5%) |
Female Fertility in St James
Fertility by Age in St James
| Age Bracket | Women with Births | Births / 1,000 Women |
| 15 to 19 years | 0 (0.0%) | 0.0 |
| 20 to 34 years | 0 (0.0%) | 0.0 |
| 35 to 50 years | 0 (0.0%) | 0.0 |
| Total | 0 (0.0%) | 0.0 |
Fertility by Age by Marriage Status in St James
| Age Bracket | Married | Unmarried |
| 15 to 19 years | 0 (0.0%) | 0 (0.0%) |
| 20 to 34 years | 0 (0.0%) | 0 (0.0%) |
| 35 to 50 years | 0 (0.0%) | 0 (0.0%) |
| Total | 0 (0.0%) | 0 (0.0%) |
Fertility by Education in St James
| Educational Attainment | Women with Births | Births / 1,000 Women |
| Less than High School | 0 (0.0%) | 0.0 |
| High School Diploma | 0 (0.0%) | 0.0 |
| College or Associate's Degree | 0 (0.0%) | 0.0 |
| Bachelor's Degree | 0 (0.0%) | 0.0 |
| Graduate Degree | 0 (0.0%) | 0.0 |
| Total | 0 (0.0%) | 0.0 |
Fertility by Education by Marriage Status in St James
| Educational Attainment | Married | Unmarried |
| Less than High School | 0 (0.0%) | 0 (0.0%) |
| High School Diploma | 0 (0.0%) | 0 (0.0%) |
| College or Associate's Degree | 0 (0.0%) | 0 (0.0%) |
| Bachelor's Degree | 0 (0.0%) | 0 (0.0%) |
| Graduate Degree | 0 (0.0%) | 0 (0.0%) |
| Total | 0 (0.0%) | 0 (0.0%) |
Employment Characteristics in St James
Employment by Class of Employer in St James
Among the 253 employed individuals in St James, private company employees (138 | 54.5%), local government employees (59 | 23.3%), and not-for-profit organizations (20 | 7.9%) make up the most common classes of employment.
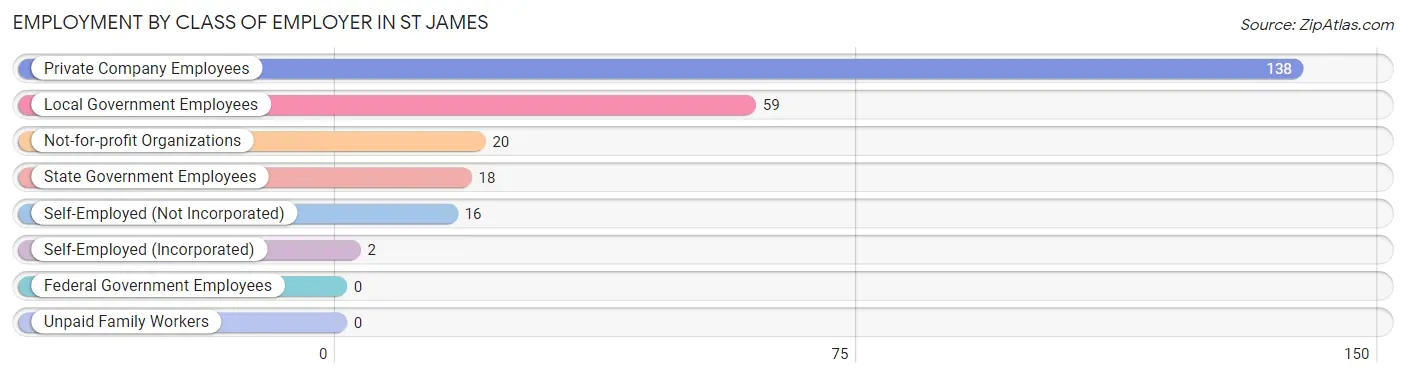
| Employer Class | # Employees | % Employees |
| Private Company Employees | 138 | 54.5% |
| Self-Employed (Incorporated) | 2 | 0.8% |
| Self-Employed (Not Incorporated) | 16 | 6.3% |
| Not-for-profit Organizations | 20 | 7.9% |
| Local Government Employees | 59 | 23.3% |
| State Government Employees | 18 | 7.1% |
| Federal Government Employees | 0 | 0.0% |
| Unpaid Family Workers | 0 | 0.0% |
| Total | 253 | 100.0% |
Employment Status by Age in St James
According to the labor force statistics for St James, out of the total population over 16 years of age (555), 47.0% or 261 individuals are in the labor force, with 3.1% or 8 of them unemployed. The age group with the highest labor force participation rate is 35 to 44 years, with 77.8% or 28 individuals in the labor force. Within the labor force, the 55 to 59 years age range has the highest percentage of unemployed individuals, with 42.1% or 8 of them being unemployed.
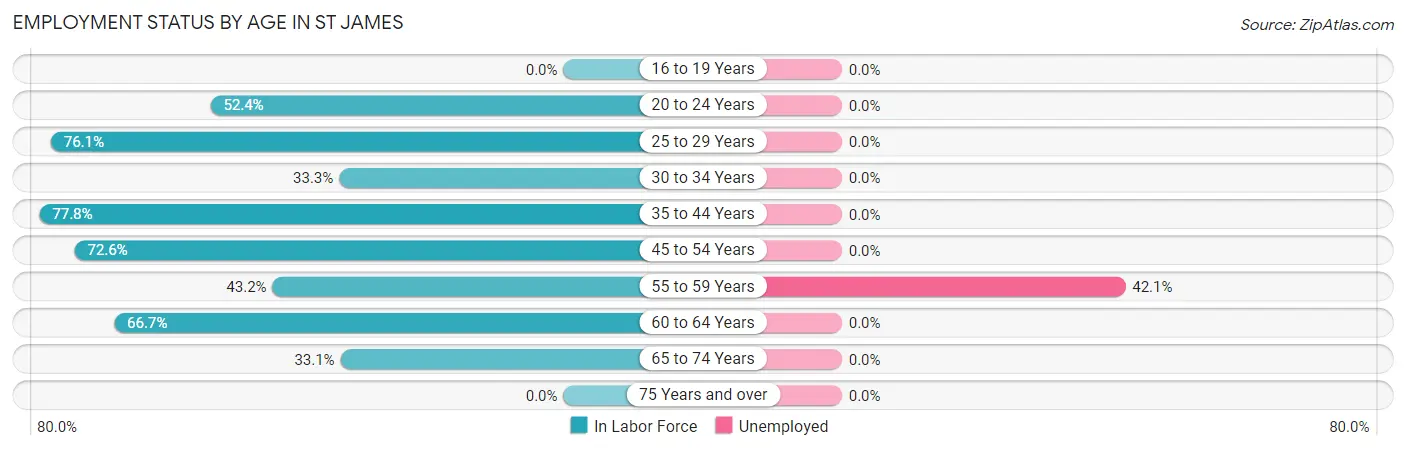
| Age Bracket | In Labor Force | Unemployed |
| 16 to 19 Years | 0 (0.0%) | 0 (0.0%) |
| 20 to 24 Years | 22 (52.4%) | 0 (0.0%) |
| 25 to 29 Years | 35 (76.1%) | 0 (0.0%) |
| 30 to 34 Years | 14 (33.3%) | 0 (0.0%) |
| 35 to 44 Years | 28 (77.8%) | 0 (0.0%) |
| 45 to 54 Years | 53 (72.6%) | 0 (0.0%) |
| 55 to 59 Years | 19 (43.2%) | 8 (42.1%) |
| 60 to 64 Years | 36 (66.7%) | 0 (0.0%) |
| 65 to 74 Years | 54 (33.1%) | 0 (0.0%) |
| 75 Years and over | 0 (0.0%) | 0 (0.0%) |
| Total | 261 (47.0%) | 8 (3.1%) |
Employment Status by Educational Attainment in St James
According to labor force statistics for St James, 62.7% of individuals (185) out of the total population between 25 and 64 years of age (295) are in the labor force, with 4.3% or 8 of them being unemployed. The group with the highest labor force participation rate are those with the educational attainment of college / associate degree, with 95.7% or 66 individuals in the labor force. Within the labor force, individuals with high school diploma education have the highest percentage of unemployment, with 12.5% or 8 of them being unemployed.
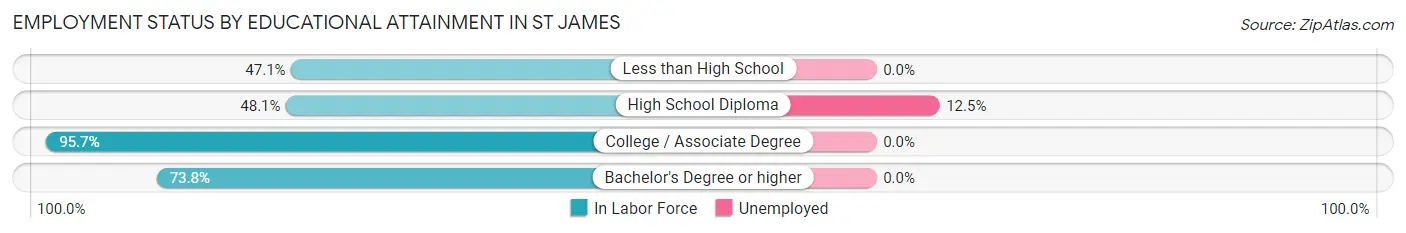
| Educational Attainment | In Labor Force | Unemployed |
| Less than High School | 24 (47.1%) | 0 (0.0%) |
| High School Diploma | 64 (48.1%) | 17 (12.5%) |
| College / Associate Degree | 66 (95.7%) | 0 (0.0%) |
| Bachelor's Degree or higher | 31 (73.8%) | 0 (0.0%) |
| Total | 185 (62.7%) | 13 (4.3%) |
Employment Occupations by Sex in St James
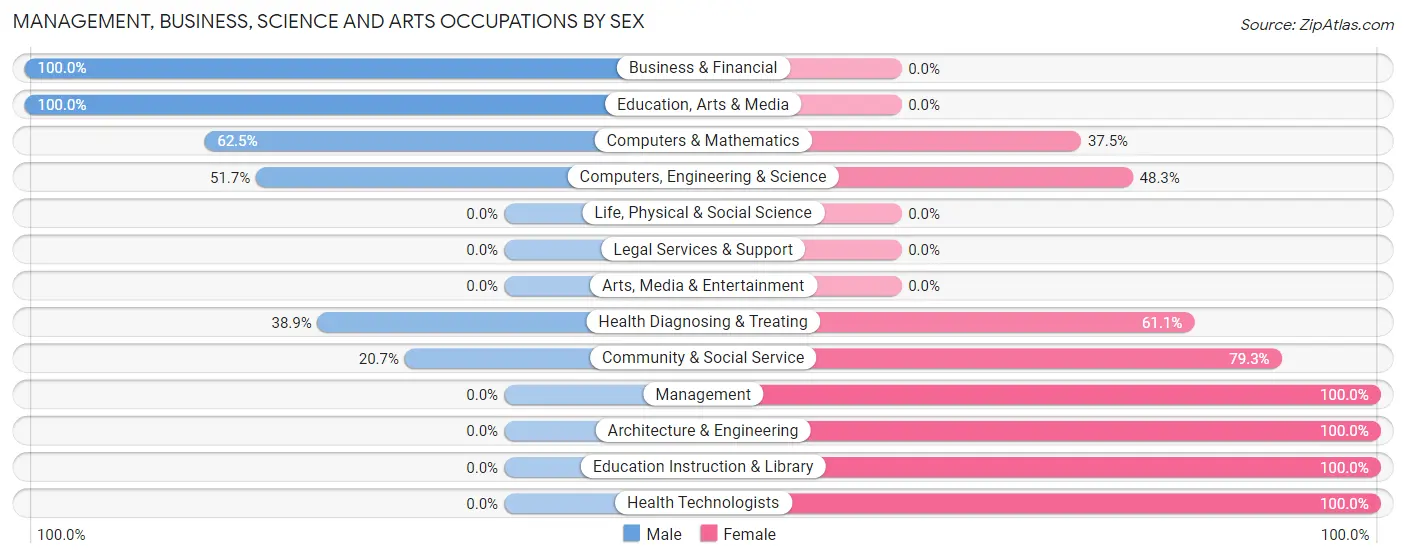
Management, Business, Science and Arts Occupations
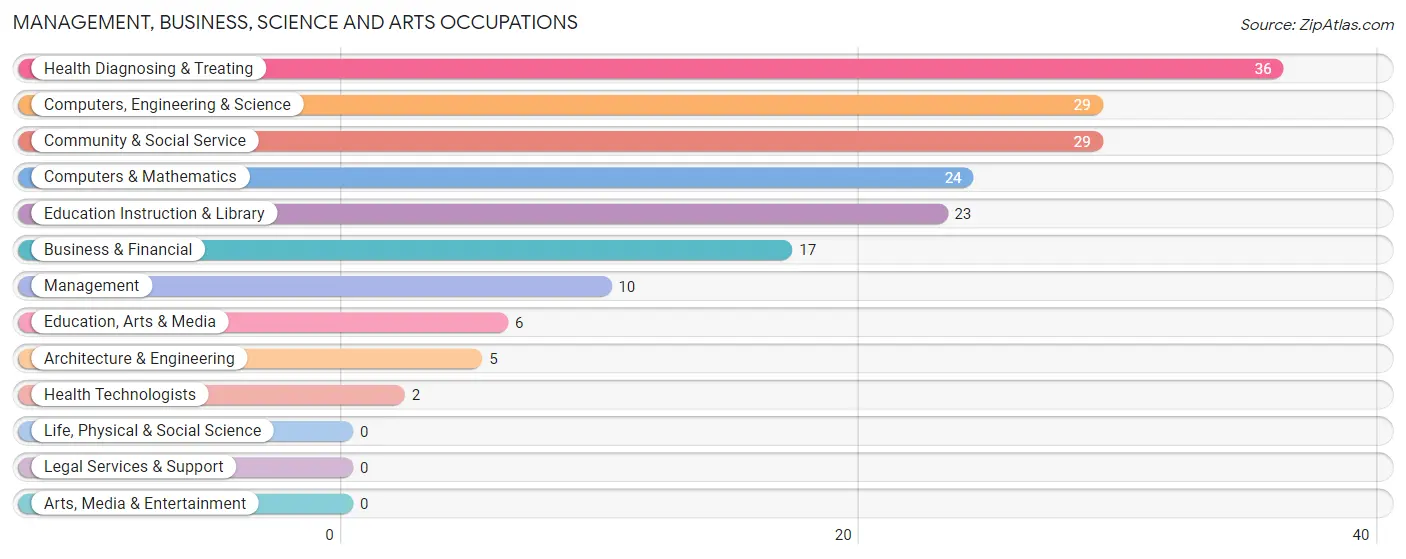
The most common Management, Business, Science and Arts occupations in St James are Health Diagnosing & Treating (36 | 14.2%), Computers, Engineering & Science (29 | 11.5%), Community & Social Service (29 | 11.5%), Computers & Mathematics (24 | 9.5%), and Education Instruction & Library (23 | 9.1%).
Management, Business, Science and Arts Occupations by Sex
Within the Management, Business, Science and Arts occupations in St James, the most male-oriented occupations are Business & Financial (100.0%), Education, Arts & Media (100.0%), and Computers & Mathematics (62.5%), while the most female-oriented occupations are Management (100.0%), Architecture & Engineering (100.0%), and Education Instruction & Library (100.0%).
| Occupation | Male | Female |
| Management | 0 (0.0%) | 10 (100.0%) |
| Business & Financial | 17 (100.0%) | 0 (0.0%) |
| Computers, Engineering & Science | 15 (51.7%) | 14 (48.3%) |
| Computers & Mathematics | 15 (62.5%) | 9 (37.5%) |
| Architecture & Engineering | 0 (0.0%) | 5 (100.0%) |
| Life, Physical & Social Science | 0 (0.0%) | 0 (0.0%) |
| Community & Social Service | 6 (20.7%) | 23 (79.3%) |
| Education, Arts & Media | 6 (100.0%) | 0 (0.0%) |
| Legal Services & Support | 0 (0.0%) | 0 (0.0%) |
| Education Instruction & Library | 0 (0.0%) | 23 (100.0%) |
| Arts, Media & Entertainment | 0 (0.0%) | 0 (0.0%) |
| Health Diagnosing & Treating | 14 (38.9%) | 22 (61.1%) |
| Health Technologists | 0 (0.0%) | 2 (100.0%) |
| Total (Category) | 52 (43.0%) | 69 (57.0%) |
| Total (Overall) | 134 (53.0%) | 119 (47.0%) |
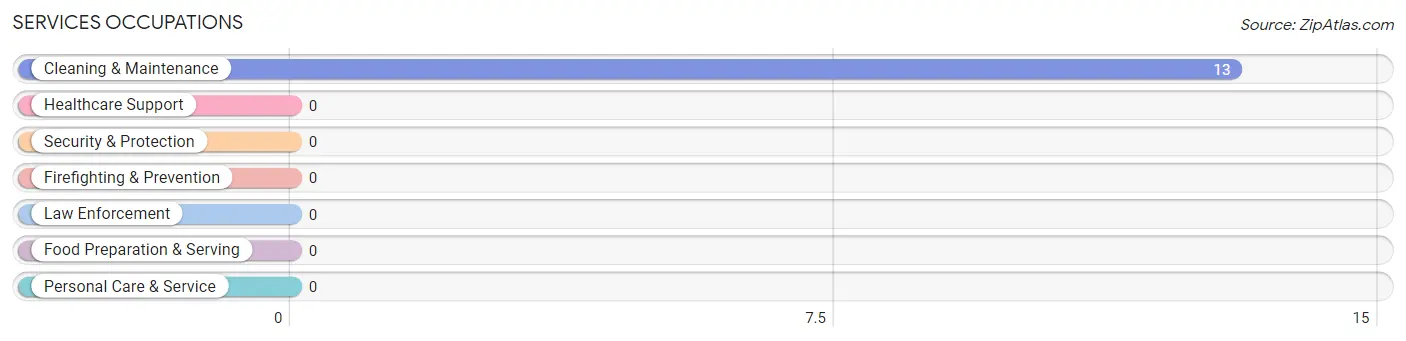
Services Occupations
The most common Services occupations in St James are , and Cleaning & Maintenance (13 | 5.1%).
Services Occupations by Sex
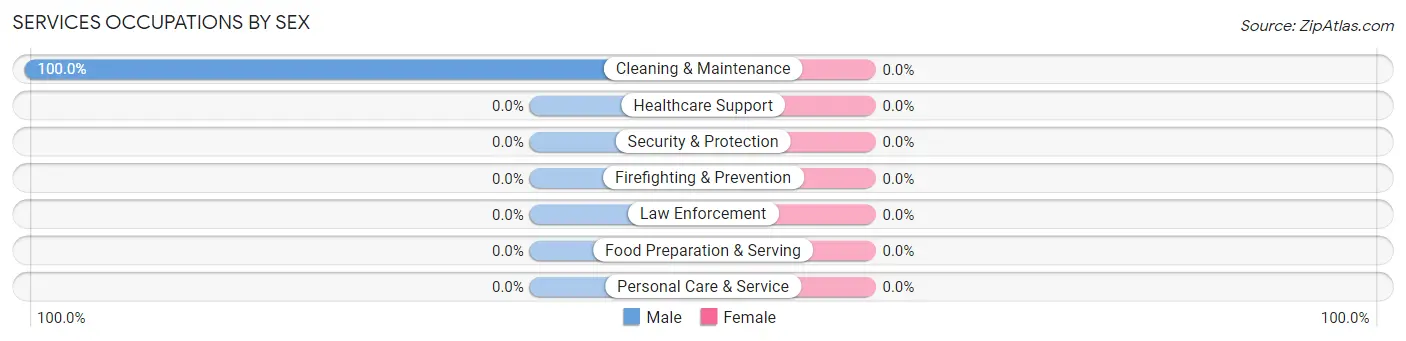
| Occupation | Male | Female |
| Healthcare Support | 0 (0.0%) | 0 (0.0%) |
| Security & Protection | 0 (0.0%) | 0 (0.0%) |
| Firefighting & Prevention | 0 (0.0%) | 0 (0.0%) |
| Law Enforcement | 0 (0.0%) | 0 (0.0%) |
| Food Preparation & Serving | 0 (0.0%) | 0 (0.0%) |
| Cleaning & Maintenance | 13 (100.0%) | 0 (0.0%) |
| Personal Care & Service | 0 (0.0%) | 0 (0.0%) |
| Total (Category) | 13 (100.0%) | 0 (0.0%) |
| Total (Overall) | 134 (53.0%) | 119 (47.0%) |
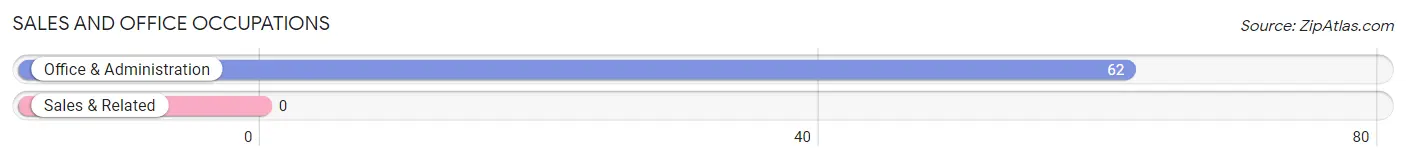
Sales and Office Occupations
The most common Sales and Office occupations in St James are , and Office & Administration (62 | 24.5%).
Sales and Office Occupations by Sex
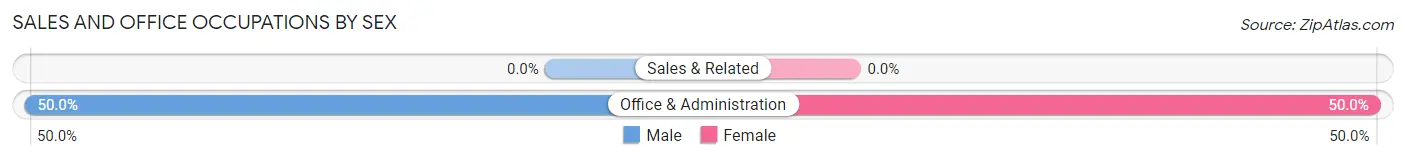
| Occupation | Male | Female |
| Sales & Related | 0 (0.0%) | 0 (0.0%) |
| Office & Administration | 31 (50.0%) | 31 (50.0%) |
| Total (Category) | 31 (50.0%) | 31 (50.0%) |
| Total (Overall) | 134 (53.0%) | 119 (47.0%) |
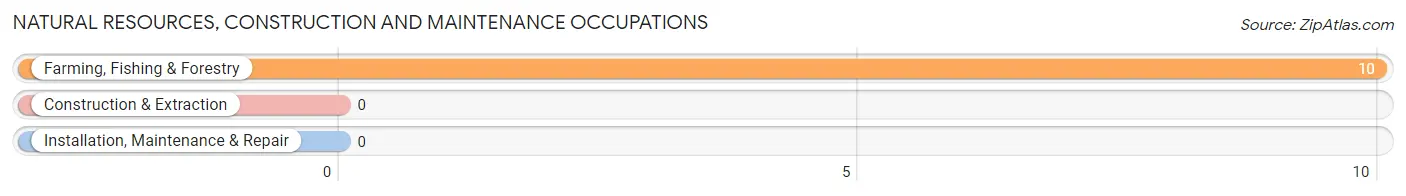
Natural Resources, Construction and Maintenance Occupations
The most common Natural Resources, Construction and Maintenance occupations in St James are , and Farming, Fishing & Forestry (10 | 4.0%).
Natural Resources, Construction and Maintenance Occupations by Sex
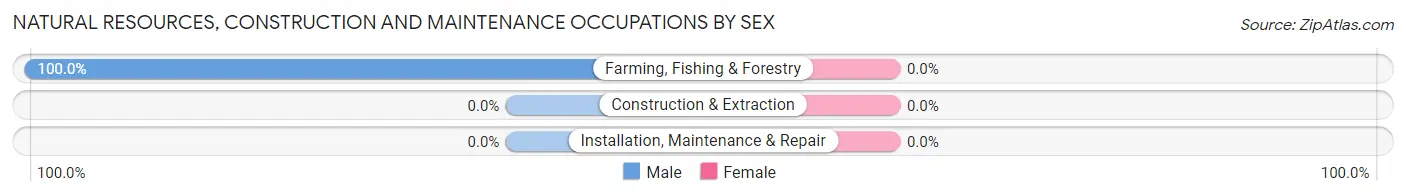
| Occupation | Male | Female |
| Farming, Fishing & Forestry | 10 (100.0%) | 0 (0.0%) |
| Construction & Extraction | 0 (0.0%) | 0 (0.0%) |
| Installation, Maintenance & Repair | 0 (0.0%) | 0 (0.0%) |
| Total (Category) | 10 (100.0%) | 0 (0.0%) |
| Total (Overall) | 134 (53.0%) | 119 (47.0%) |
Production, Transportation and Moving Occupations
The most common Production, Transportation and Moving occupations in St James are Transportation (25 | 9.9%), Production (16 | 6.3%), and Material Moving (6 | 2.4%).
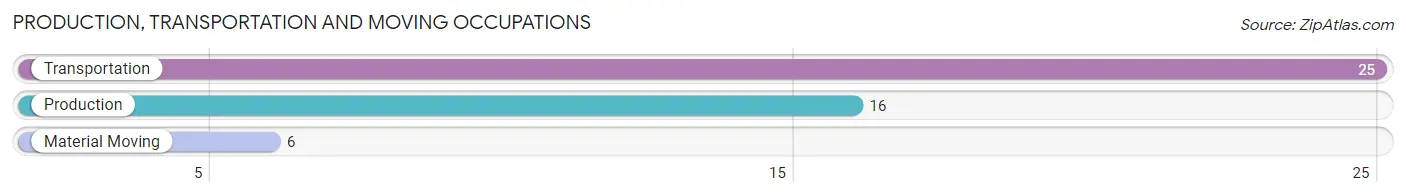
Production, Transportation and Moving Occupations by Sex
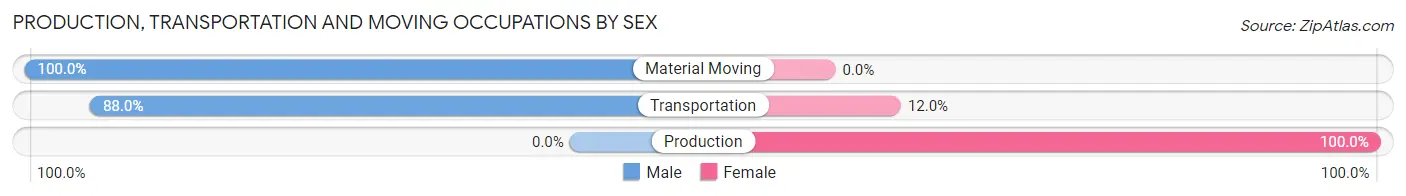
| Occupation | Male | Female |
| Production | 0 (0.0%) | 16 (100.0%) |
| Transportation | 22 (88.0%) | 3 (12.0%) |
| Material Moving | 6 (100.0%) | 0 (0.0%) |
| Total (Category) | 28 (59.6%) | 19 (40.4%) |
| Total (Overall) | 134 (53.0%) | 119 (47.0%) |
Employment Industries by Sex in St James
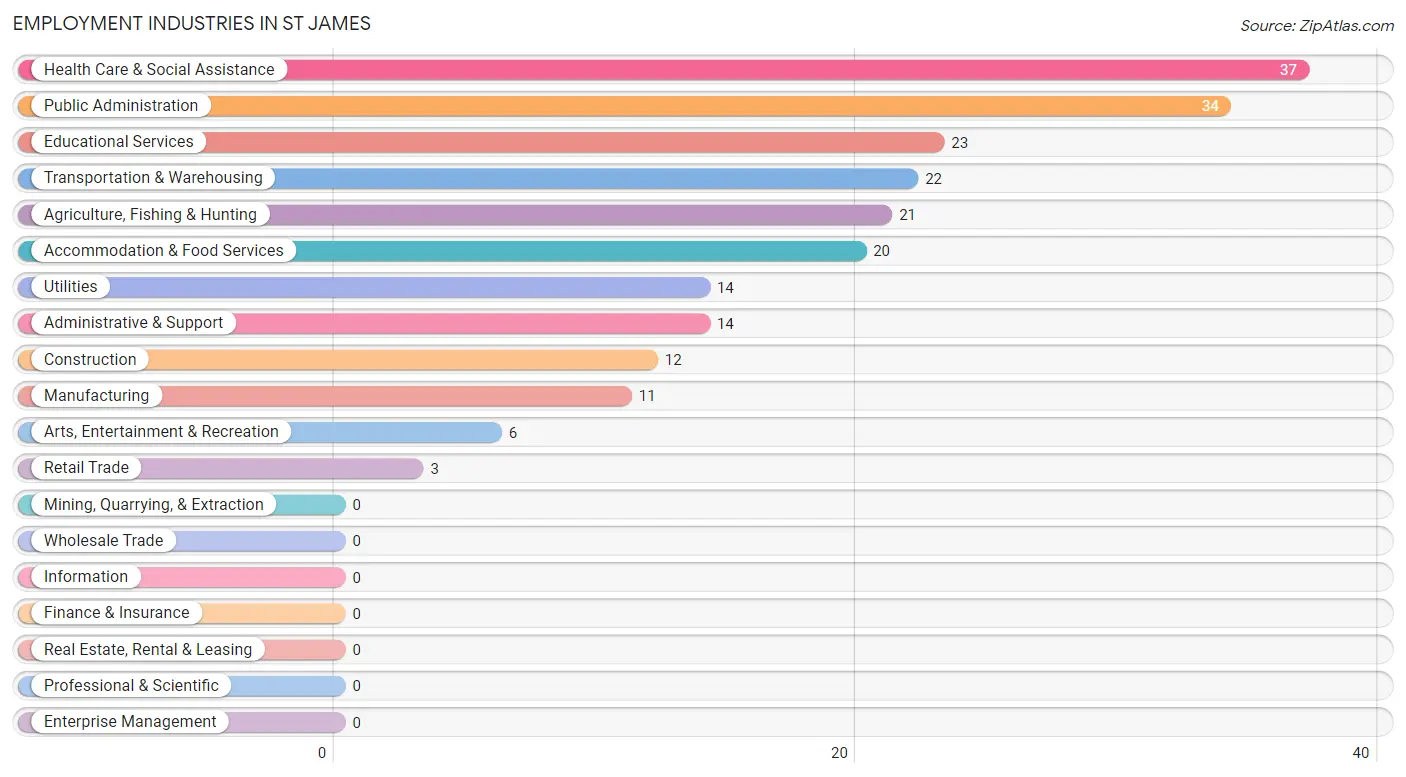
Employment Industries in St James
The major employment industries in St James include Health Care & Social Assistance (37 | 14.6%), Public Administration (34 | 13.4%), Educational Services (23 | 9.1%), Transportation & Warehousing (22 | 8.7%), and Agriculture, Fishing & Hunting (21 | 8.3%).
Employment Industries by Sex in St James
The St James industries that see more men than women are Agriculture, Fishing & Hunting (100.0%), Transportation & Warehousing (100.0%), and Administrative & Support (100.0%), whereas the industries that tend to have a higher number of women are Construction (100.0%), Retail Trade (100.0%), and Utilities (100.0%).
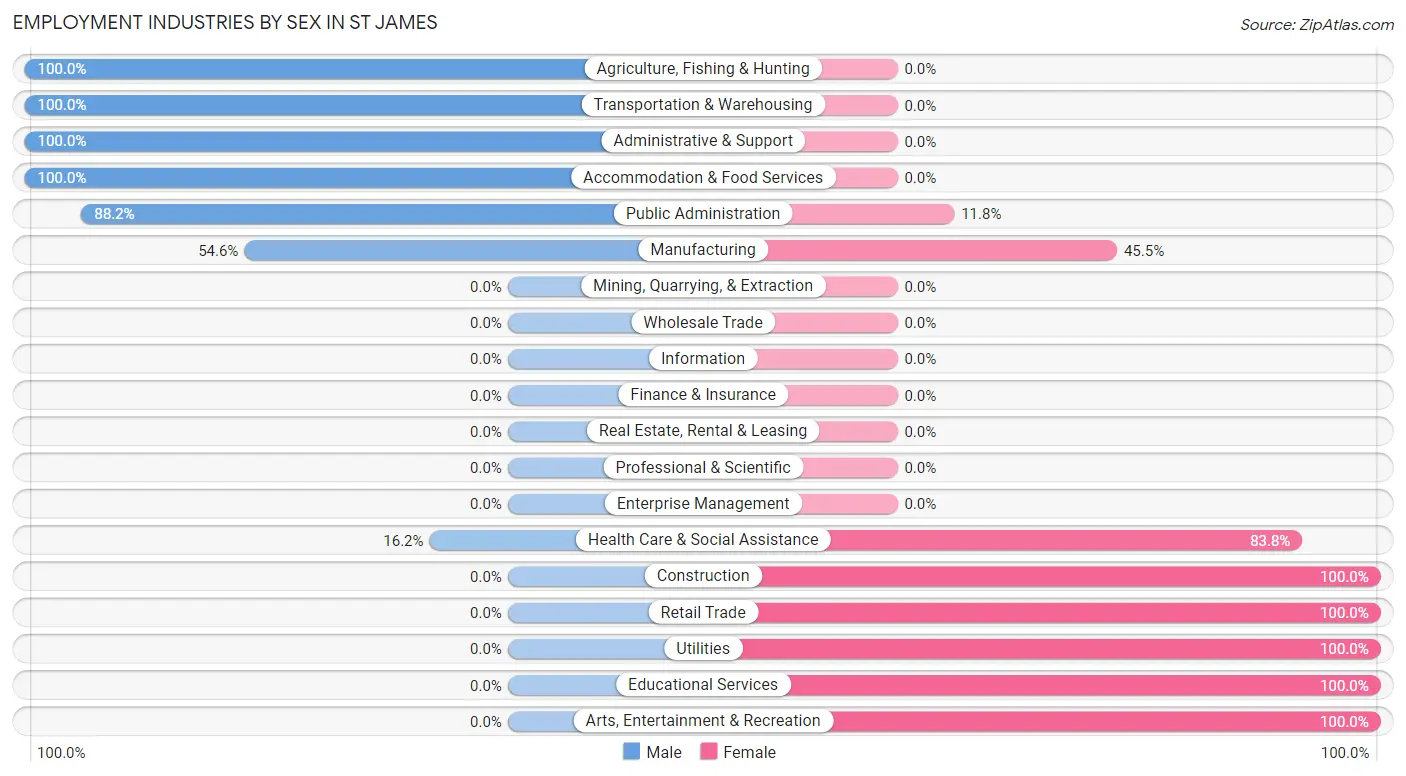
| Industry | Male | Female |
| Agriculture, Fishing & Hunting | 21 (100.0%) | 0 (0.0%) |
| Mining, Quarrying, & Extraction | 0 (0.0%) | 0 (0.0%) |
| Construction | 0 (0.0%) | 12 (100.0%) |
| Manufacturing | 6 (54.5%) | 5 (45.5%) |
| Wholesale Trade | 0 (0.0%) | 0 (0.0%) |
| Retail Trade | 0 (0.0%) | 3 (100.0%) |
| Transportation & Warehousing | 22 (100.0%) | 0 (0.0%) |
| Utilities | 0 (0.0%) | 14 (100.0%) |
| Information | 0 (0.0%) | 0 (0.0%) |
| Finance & Insurance | 0 (0.0%) | 0 (0.0%) |
| Real Estate, Rental & Leasing | 0 (0.0%) | 0 (0.0%) |
| Professional & Scientific | 0 (0.0%) | 0 (0.0%) |
| Enterprise Management | 0 (0.0%) | 0 (0.0%) |
| Administrative & Support | 14 (100.0%) | 0 (0.0%) |
| Educational Services | 0 (0.0%) | 23 (100.0%) |
| Health Care & Social Assistance | 6 (16.2%) | 31 (83.8%) |
| Arts, Entertainment & Recreation | 0 (0.0%) | 6 (100.0%) |
| Accommodation & Food Services | 20 (100.0%) | 0 (0.0%) |
| Public Administration | 30 (88.2%) | 4 (11.8%) |
| Total | 134 (53.0%) | 119 (47.0%) |
Education in St James
School Enrollment in St James
The most common levels of schooling among the 124 students in St James are college / undergraduate (40 | 32.3%), middle school (38 | 30.6%), and elementary school (19 | 15.3%).
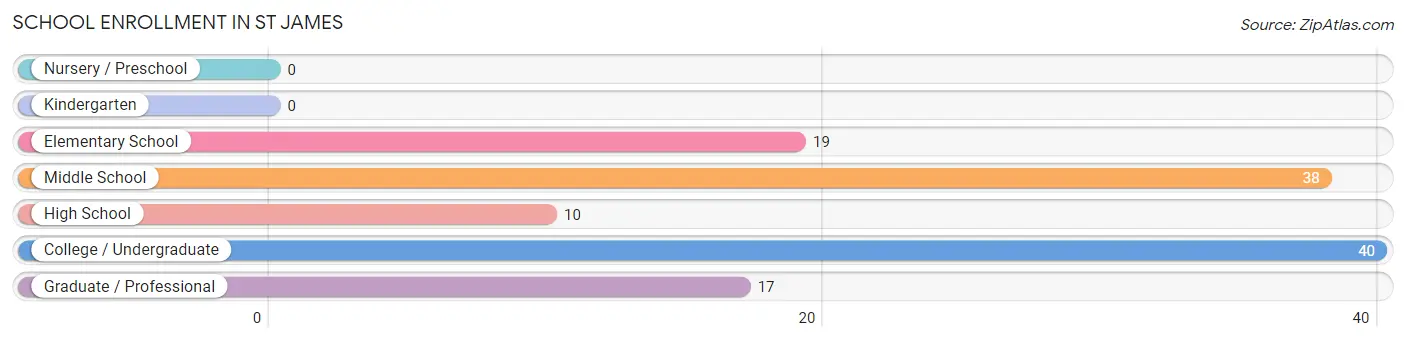
| School Level | # Students | % Students |
| Nursery / Preschool | 0 | 0.0% |
| Kindergarten | 0 | 0.0% |
| Elementary School | 19 | 15.3% |
| Middle School | 38 | 30.6% |
| High School | 10 | 8.1% |
| College / Undergraduate | 40 | 32.3% |
| Graduate / Professional | 17 | 13.7% |
| Total | 124 | 100.0% |
School Enrollment by Age by Funding Source in St James
Out of a total of 124 students who are enrolled in schools in St James, 5 (4.0%) attend a private institution, while the remaining 119 (96.0%) are enrolled in public schools. The age group of 10 to 14 year olds has the highest likelihood of being enrolled in private schools, with 5 (13.2% in the age bracket) enrolled. Conversely, the age group of 5 to 9 year old has the lowest likelihood of being enrolled in a private school, with 19 (100.0% in the age bracket) attending a public institution.
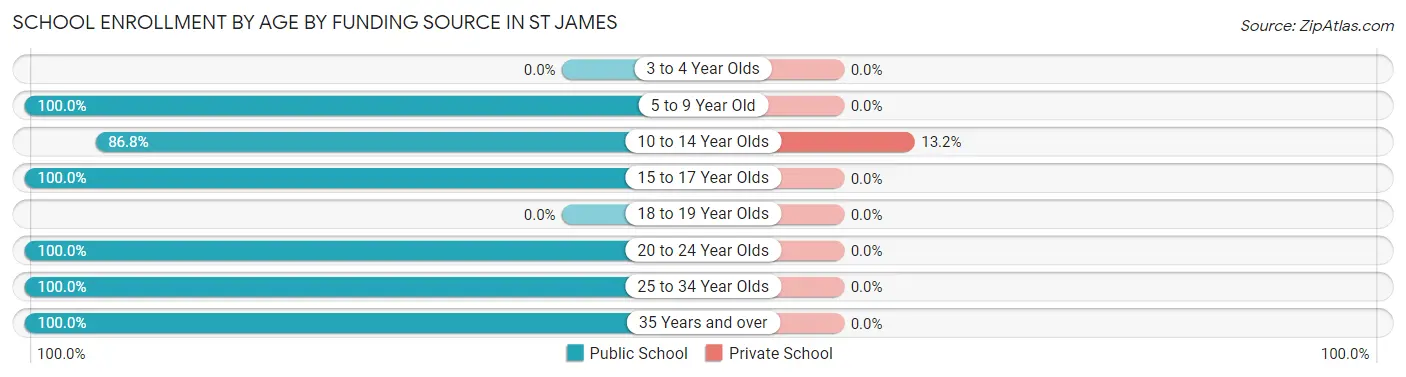
| Age Bracket | Public School | Private School |
| 3 to 4 Year Olds | 0 (0.0%) | 0 (0.0%) |
| 5 to 9 Year Old | 19 (100.0%) | 0 (0.0%) |
| 10 to 14 Year Olds | 33 (86.8%) | 5 (13.2%) |
| 15 to 17 Year Olds | 10 (100.0%) | 0 (0.0%) |
| 18 to 19 Year Olds | 0 (0.0%) | 0 (0.0%) |
| 20 to 24 Year Olds | 29 (100.0%) | 0 (0.0%) |
| 25 to 34 Year Olds | 11 (100.0%) | 0 (0.0%) |
| 35 Years and over | 17 (100.0%) | 0 (0.0%) |
| Total | 119 (96.0%) | 5 (4.0%) |
Educational Attainment by Field of Study in St James
Education (41 | 45.1%), psychology (17 | 18.7%), business (15 | 16.5%), science & technology (9 | 9.9%), and engineering (6 | 6.6%) are the most common fields of study among 91 individuals in St James who have obtained a bachelor's degree or higher.
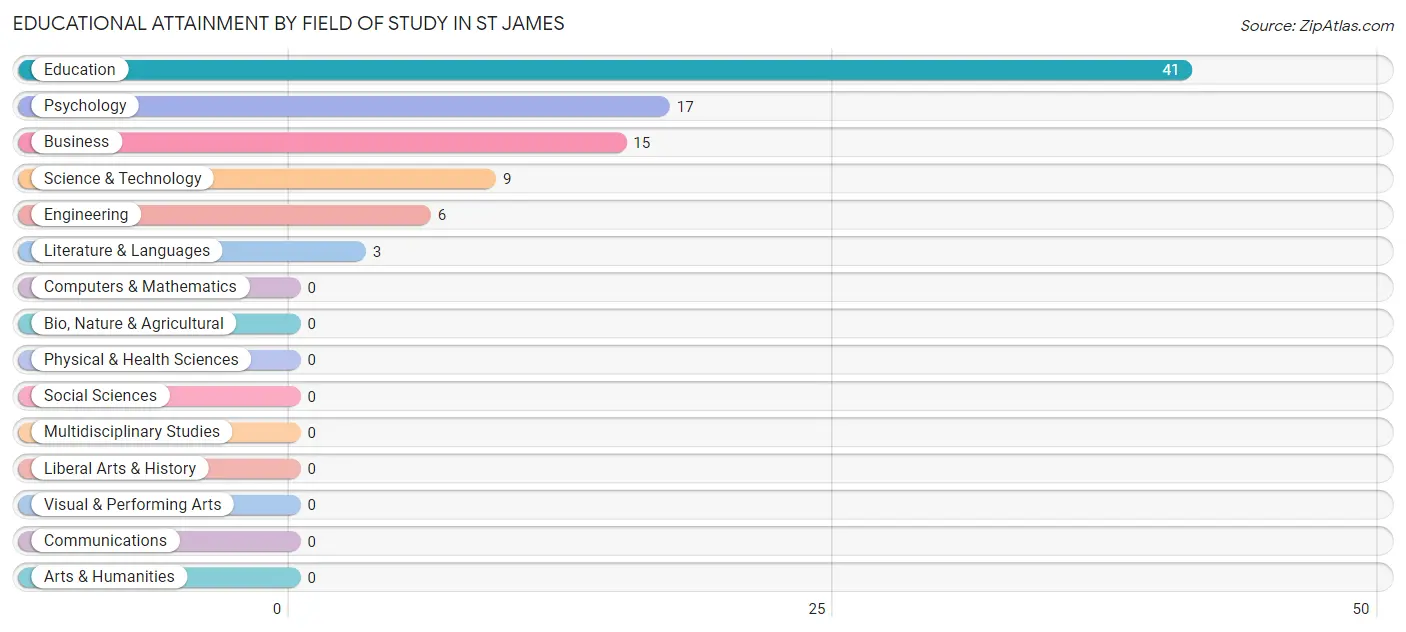
| Field of Study | # Graduates | % Graduates |
| Computers & Mathematics | 0 | 0.0% |
| Bio, Nature & Agricultural | 0 | 0.0% |
| Physical & Health Sciences | 0 | 0.0% |
| Psychology | 17 | 18.7% |
| Social Sciences | 0 | 0.0% |
| Engineering | 6 | 6.6% |
| Multidisciplinary Studies | 0 | 0.0% |
| Science & Technology | 9 | 9.9% |
| Business | 15 | 16.5% |
| Education | 41 | 45.1% |
| Literature & Languages | 3 | 3.3% |
| Liberal Arts & History | 0 | 0.0% |
| Visual & Performing Arts | 0 | 0.0% |
| Communications | 0 | 0.0% |
| Arts & Humanities | 0 | 0.0% |
| Total | 91 | 100.0% |
Transportation & Commute in St James
Vehicle Availability by Sex in St James
The most prevalent vehicle ownership categories in St James are males with 2 vehicles (58, accounting for 43.3%) and females with 2 vehicles (50, making up 48.7%).
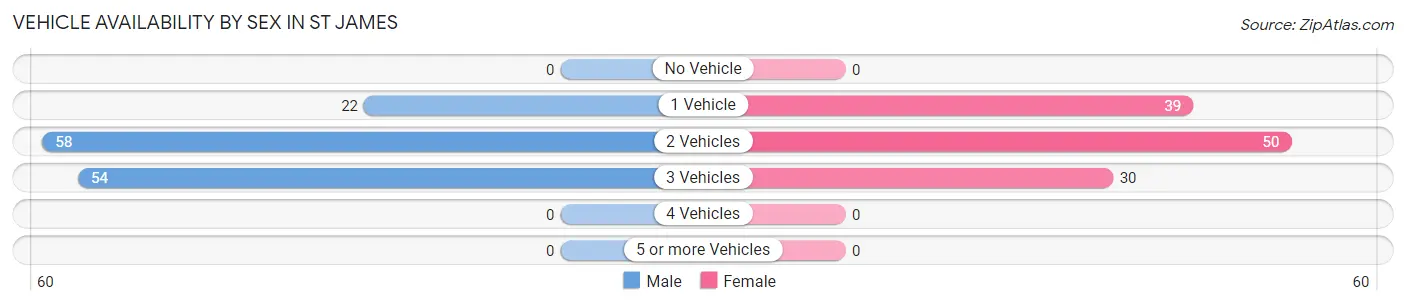
| Vehicles Available | Male | Female |
| No Vehicle | 0 (0.0%) | 0 (0.0%) |
| 1 Vehicle | 22 (16.4%) | 39 (32.8%) |
| 2 Vehicles | 58 (43.3%) | 50 (42.0%) |
| 3 Vehicles | 54 (40.3%) | 30 (25.2%) |
| 4 Vehicles | 0 (0.0%) | 0 (0.0%) |
| 5 or more Vehicles | 0 (0.0%) | 0 (0.0%) |
| Total | 134 (100.0%) | 119 (100.0%) |
Commute Time in St James
The most frequently occuring commute durations in St James are 10 to 14 minutes (52 commuters, 21.3%), 20 to 24 minutes (36 commuters, 14.7%), and 30 to 34 minutes (36 commuters, 14.7%).
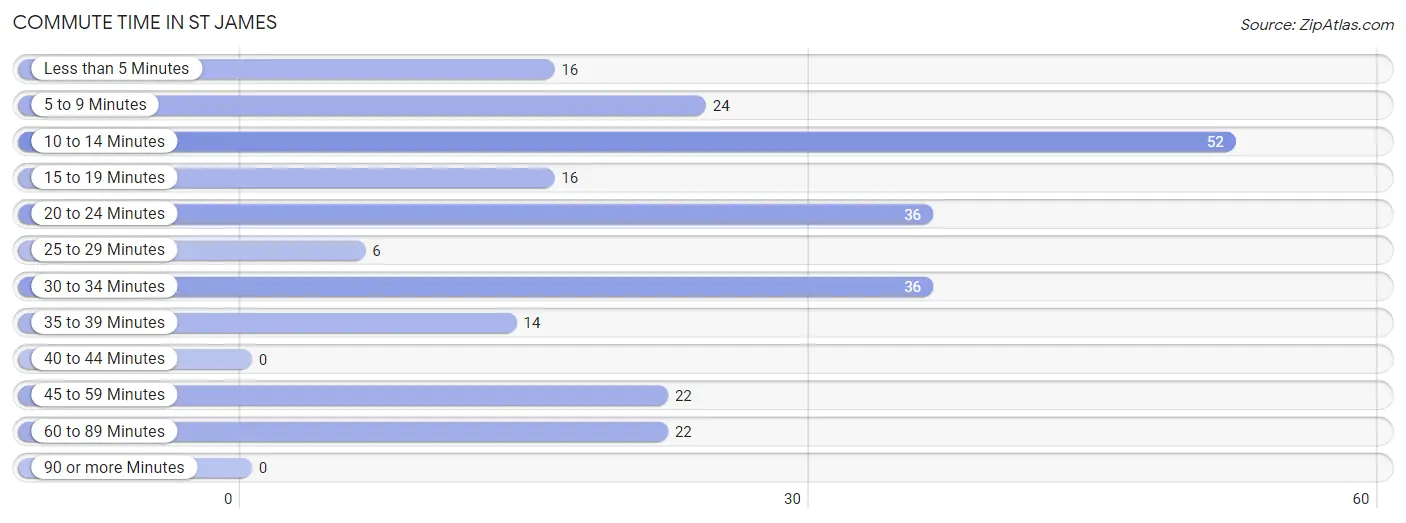
| Commute Time | # Commuters | % Commuters |
| Less than 5 Minutes | 16 | 6.6% |
| 5 to 9 Minutes | 24 | 9.8% |
| 10 to 14 Minutes | 52 | 21.3% |
| 15 to 19 Minutes | 16 | 6.6% |
| 20 to 24 Minutes | 36 | 14.7% |
| 25 to 29 Minutes | 6 | 2.5% |
| 30 to 34 Minutes | 36 | 14.7% |
| 35 to 39 Minutes | 14 | 5.7% |
| 40 to 44 Minutes | 0 | 0.0% |
| 45 to 59 Minutes | 22 | 9.0% |
| 60 to 89 Minutes | 22 | 9.0% |
| 90 or more Minutes | 0 | 0.0% |
Commute Time by Sex in St James
The most common commute times in St James are 30 to 34 minutes (32 commuters, 23.9%) for males and 10 to 14 minutes (32 commuters, 29.1%) for females.
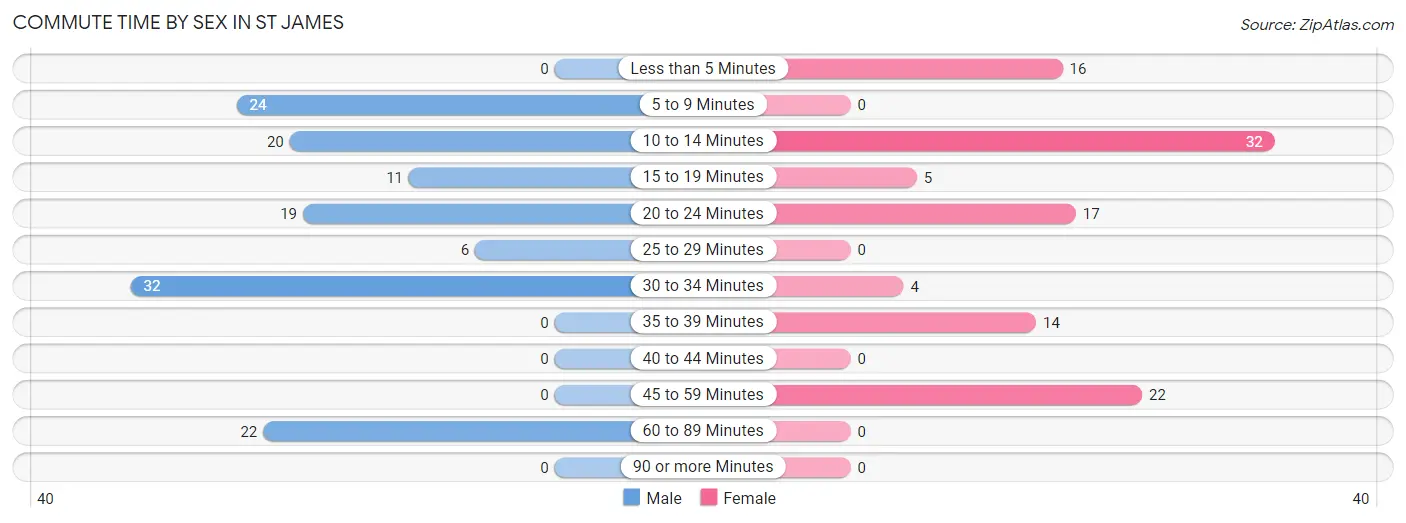
| Commute Time | Male | Female |
| Less than 5 Minutes | 0 (0.0%) | 16 (14.5%) |
| 5 to 9 Minutes | 24 (17.9%) | 0 (0.0%) |
| 10 to 14 Minutes | 20 (14.9%) | 32 (29.1%) |
| 15 to 19 Minutes | 11 (8.2%) | 5 (4.5%) |
| 20 to 24 Minutes | 19 (14.2%) | 17 (15.4%) |
| 25 to 29 Minutes | 6 (4.5%) | 0 (0.0%) |
| 30 to 34 Minutes | 32 (23.9%) | 4 (3.6%) |
| 35 to 39 Minutes | 0 (0.0%) | 14 (12.7%) |
| 40 to 44 Minutes | 0 (0.0%) | 0 (0.0%) |
| 45 to 59 Minutes | 0 (0.0%) | 22 (20.0%) |
| 60 to 89 Minutes | 22 (16.4%) | 0 (0.0%) |
| 90 or more Minutes | 0 (0.0%) | 0 (0.0%) |
Time of Departure to Work by Sex in St James
The most frequent times of departure to work in St James are 5:30 AM to 5:59 AM (63, 47.0%) for males and 5:30 AM to 5:59 AM (26, 23.6%) for females.
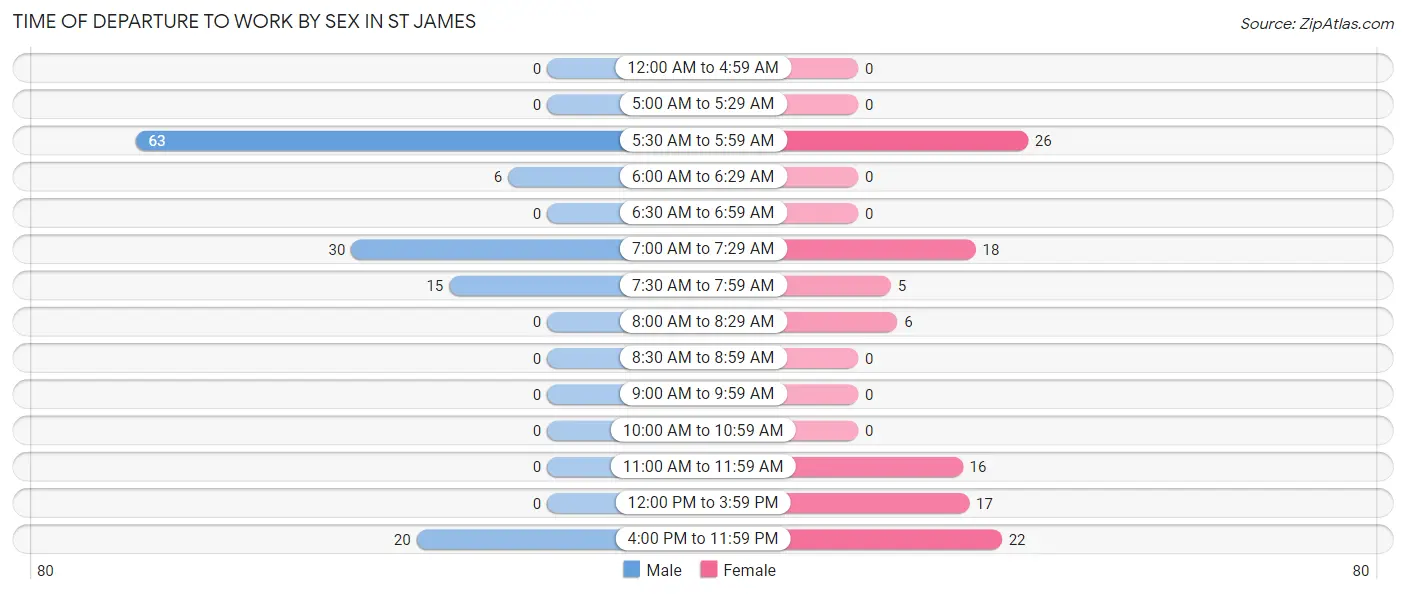
| Time of Departure | Male | Female |
| 12:00 AM to 4:59 AM | 0 (0.0%) | 0 (0.0%) |
| 5:00 AM to 5:29 AM | 0 (0.0%) | 0 (0.0%) |
| 5:30 AM to 5:59 AM | 63 (47.0%) | 26 (23.6%) |
| 6:00 AM to 6:29 AM | 6 (4.5%) | 0 (0.0%) |
| 6:30 AM to 6:59 AM | 0 (0.0%) | 0 (0.0%) |
| 7:00 AM to 7:29 AM | 30 (22.4%) | 18 (16.4%) |
| 7:30 AM to 7:59 AM | 15 (11.2%) | 5 (4.5%) |
| 8:00 AM to 8:29 AM | 0 (0.0%) | 6 (5.4%) |
| 8:30 AM to 8:59 AM | 0 (0.0%) | 0 (0.0%) |
| 9:00 AM to 9:59 AM | 0 (0.0%) | 0 (0.0%) |
| 10:00 AM to 10:59 AM | 0 (0.0%) | 0 (0.0%) |
| 11:00 AM to 11:59 AM | 0 (0.0%) | 16 (14.5%) |
| 12:00 PM to 3:59 PM | 0 (0.0%) | 17 (15.4%) |
| 4:00 PM to 11:59 PM | 20 (14.9%) | 22 (20.0%) |
| Total | 134 (100.0%) | 110 (100.0%) |
Housing Occupancy in St James
Occupancy by Ownership in St James
Of the total 223 dwellings in St James, owner-occupied units account for 200 (89.7%), while renter-occupied units make up 23 (10.3%).
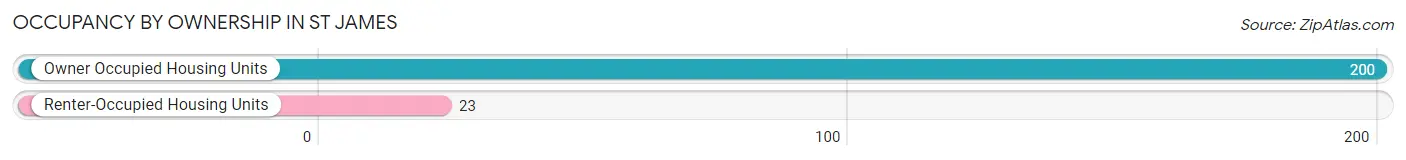
| Occupancy | # Housing Units | % Housing Units |
| Owner Occupied Housing Units | 200 | 89.7% |
| Renter-Occupied Housing Units | 23 | 10.3% |
| Total Occupied Housing Units | 223 | 100.0% |
Occupancy by Household Size in St James
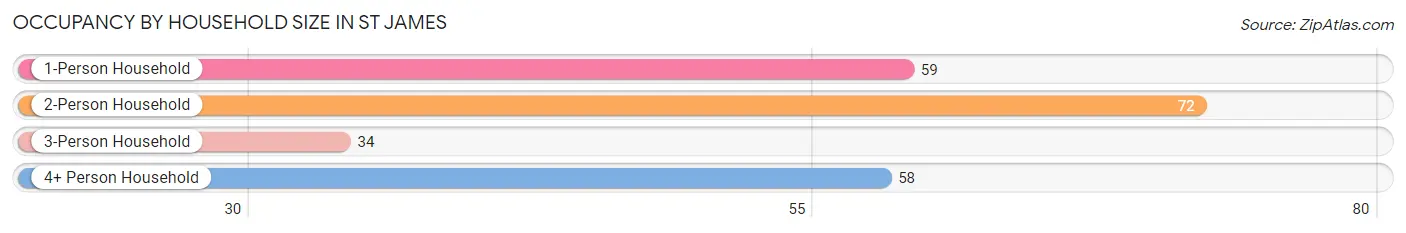
| Household Size | # Housing Units | % Housing Units |
| 1-Person Household | 59 | 26.5% |
| 2-Person Household | 72 | 32.3% |
| 3-Person Household | 34 | 15.2% |
| 4+ Person Household | 58 | 26.0% |
| Total Housing Units | 223 | 100.0% |
Occupancy by Ownership by Household Size in St James
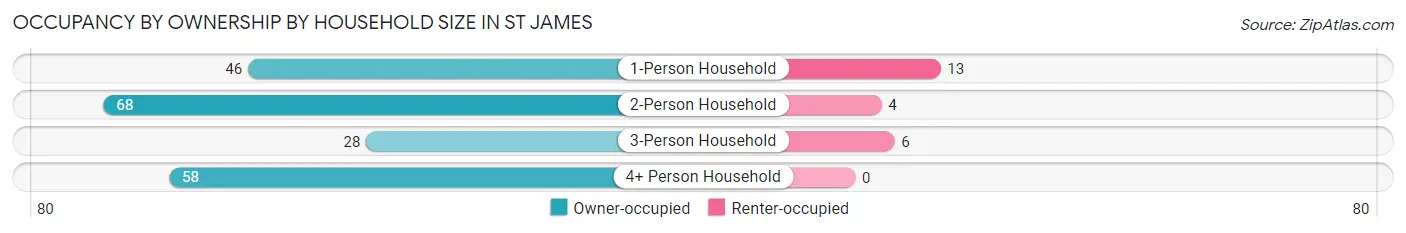
| Household Size | Owner-occupied | Renter-occupied |
| 1-Person Household | 46 (78.0%) | 13 (22.0%) |
| 2-Person Household | 68 (94.4%) | 4 (5.6%) |
| 3-Person Household | 28 (82.4%) | 6 (17.6%) |
| 4+ Person Household | 58 (100.0%) | 0 (0.0%) |
| Total Housing Units | 200 (89.7%) | 23 (10.3%) |
Occupancy by Educational Attainment in St James
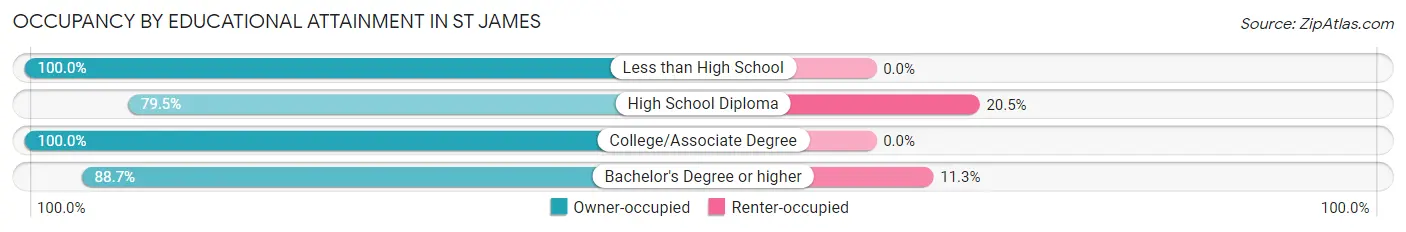
| Household Size | Owner-occupied | Renter-occupied |
| Less than High School | 32 (100.0%) | 0 (0.0%) |
| High School Diploma | 66 (79.5%) | 17 (20.5%) |
| College/Associate Degree | 55 (100.0%) | 0 (0.0%) |
| Bachelor's Degree or higher | 47 (88.7%) | 6 (11.3%) |
Occupancy by Age of Householder in St James
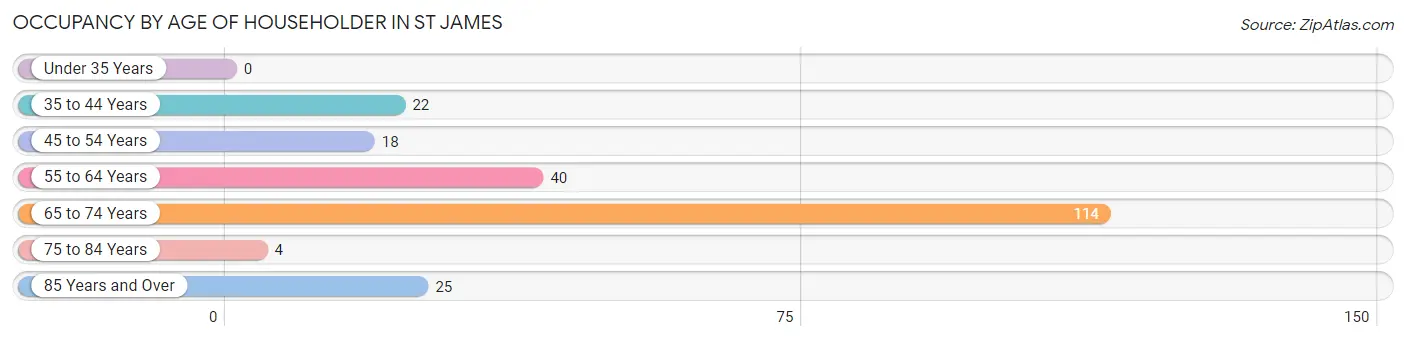
| Age Bracket | # Households | % Households |
| Under 35 Years | 0 | 0.0% |
| 35 to 44 Years | 22 | 9.9% |
| 45 to 54 Years | 18 | 8.1% |
| 55 to 64 Years | 40 | 17.9% |
| 65 to 74 Years | 114 | 51.1% |
| 75 to 84 Years | 4 | 1.8% |
| 85 Years and Over | 25 | 11.2% |
| Total | 223 | 100.0% |
Housing Finances in St James
Median Income by Occupancy in St James
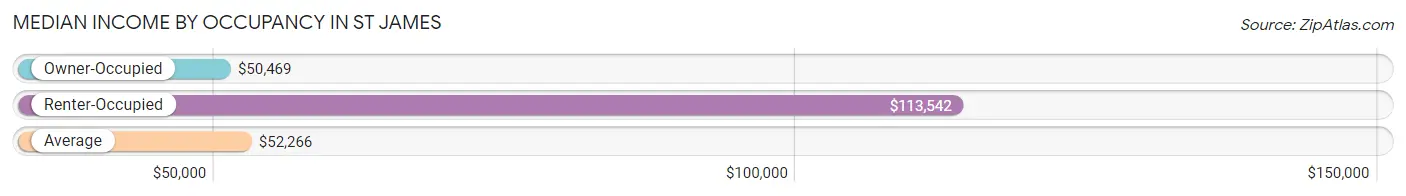
| Occupancy Type | # Households | Median Income |
| Owner-Occupied | 200 (89.7%) | $50,469 |
| Renter-Occupied | 23 (10.3%) | $113,542 |
| Average | 223 (100.0%) | $52,266 |
Occupancy by Householder Income Bracket in St James
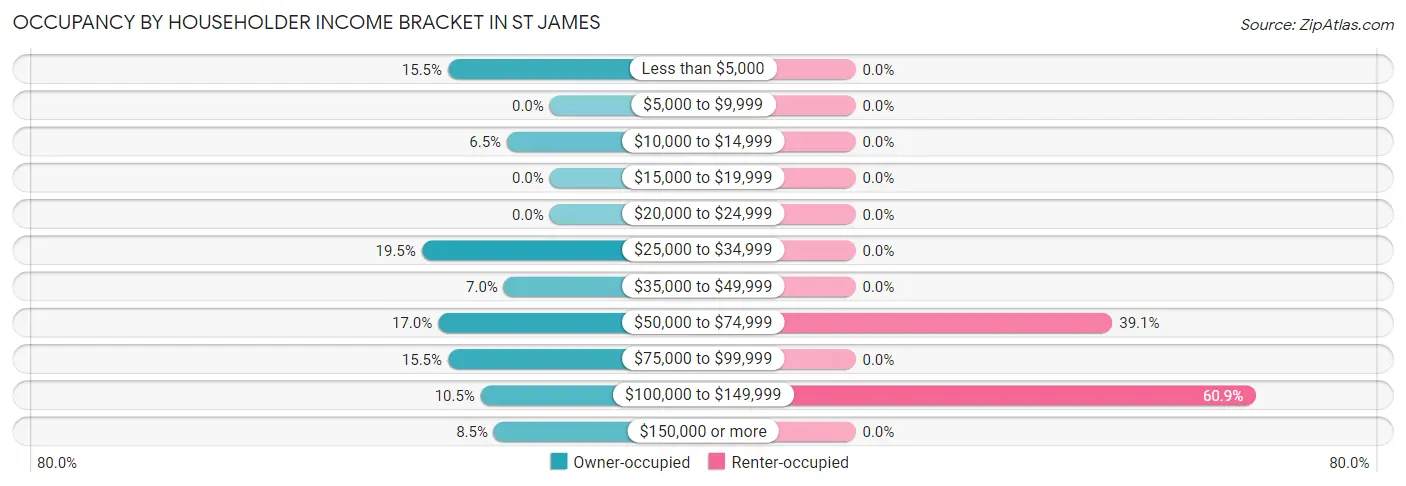
| Income Bracket | Owner-occupied | Renter-occupied |
| Less than $5,000 | 31 (15.5%) | 0 (0.0%) |
| $5,000 to $9,999 | 0 (0.0%) | 0 (0.0%) |
| $10,000 to $14,999 | 13 (6.5%) | 0 (0.0%) |
| $15,000 to $19,999 | 0 (0.0%) | 0 (0.0%) |
| $20,000 to $24,999 | 0 (0.0%) | 0 (0.0%) |
| $25,000 to $34,999 | 39 (19.5%) | 0 (0.0%) |
| $35,000 to $49,999 | 14 (7.0%) | 0 (0.0%) |
| $50,000 to $74,999 | 34 (17.0%) | 9 (39.1%) |
| $75,000 to $99,999 | 31 (15.5%) | 0 (0.0%) |
| $100,000 to $149,999 | 21 (10.5%) | 14 (60.9%) |
| $150,000 or more | 17 (8.5%) | 0 (0.0%) |
| Total | 200 (100.0%) | 23 (100.0%) |
Monthly Housing Cost Tiers in St James
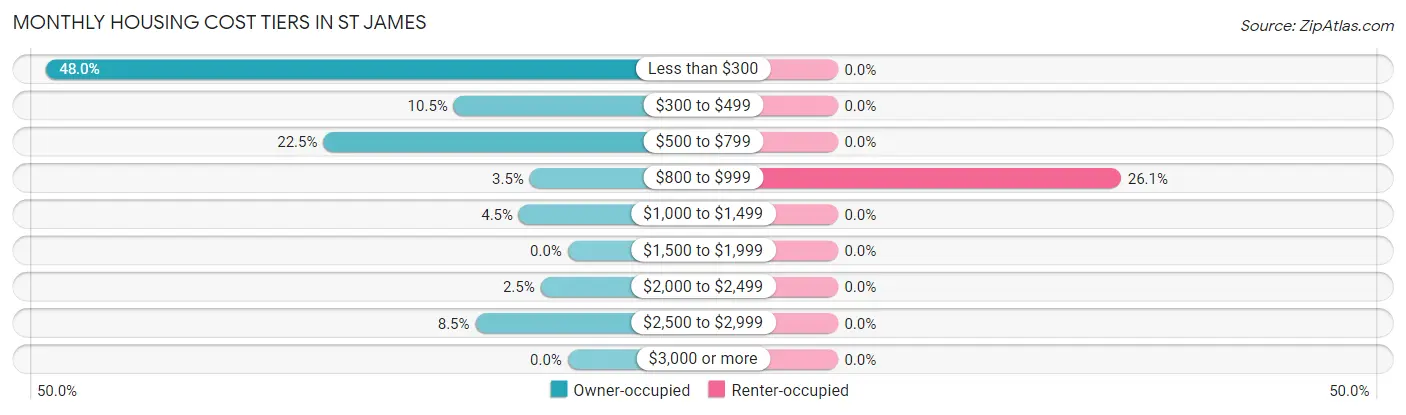
| Monthly Cost | Owner-occupied | Renter-occupied |
| Less than $300 | 96 (48.0%) | 0 (0.0%) |
| $300 to $499 | 21 (10.5%) | 0 (0.0%) |
| $500 to $799 | 45 (22.5%) | 0 (0.0%) |
| $800 to $999 | 7 (3.5%) | 6 (26.1%) |
| $1,000 to $1,499 | 9 (4.5%) | 0 (0.0%) |
| $1,500 to $1,999 | 0 (0.0%) | 0 (0.0%) |
| $2,000 to $2,499 | 5 (2.5%) | 0 (0.0%) |
| $2,500 to $2,999 | 17 (8.5%) | 0 (0.0%) |
| $3,000 or more | 0 (0.0%) | 0 (0.0%) |
| Total | 200 (100.0%) | 23 (100.0%) |
Physical Housing Characteristics in St James
Housing Structures in St James
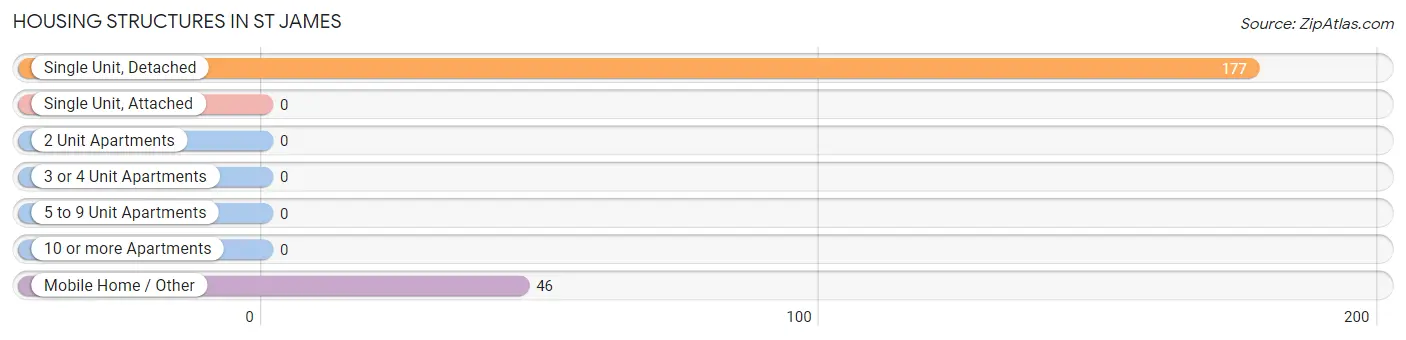
| Structure Type | # Housing Units | % Housing Units |
| Single Unit, Detached | 177 | 79.4% |
| Single Unit, Attached | 0 | 0.0% |
| 2 Unit Apartments | 0 | 0.0% |
| 3 or 4 Unit Apartments | 0 | 0.0% |
| 5 to 9 Unit Apartments | 0 | 0.0% |
| 10 or more Apartments | 0 | 0.0% |
| Mobile Home / Other | 46 | 20.6% |
| Total | 223 | 100.0% |
Housing Structures by Occupancy in St James
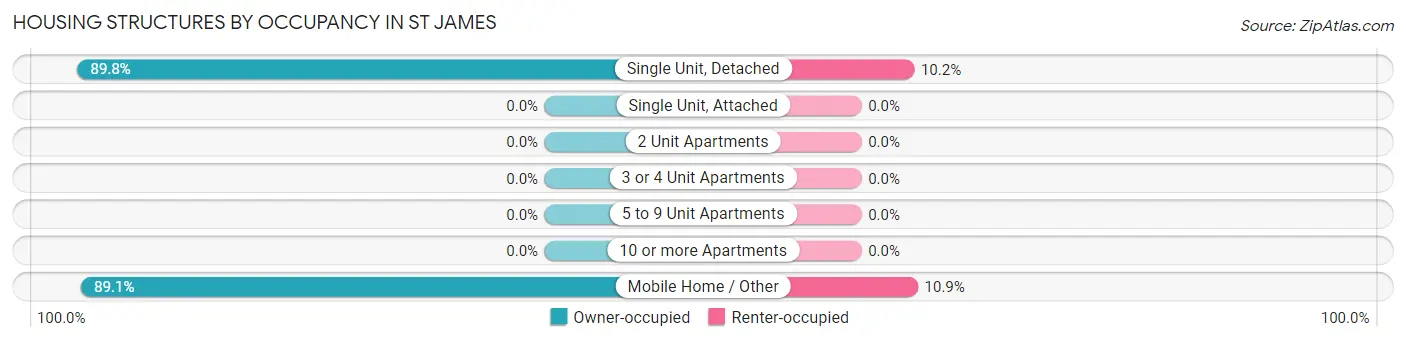
| Structure Type | Owner-occupied | Renter-occupied |
| Single Unit, Detached | 159 (89.8%) | 18 (10.2%) |
| Single Unit, Attached | 0 (0.0%) | 0 (0.0%) |
| 2 Unit Apartments | 0 (0.0%) | 0 (0.0%) |
| 3 or 4 Unit Apartments | 0 (0.0%) | 0 (0.0%) |
| 5 to 9 Unit Apartments | 0 (0.0%) | 0 (0.0%) |
| 10 or more Apartments | 0 (0.0%) | 0 (0.0%) |
| Mobile Home / Other | 41 (89.1%) | 5 (10.9%) |
| Total | 200 (89.7%) | 23 (10.3%) |
Housing Structures by Number of Rooms in St James
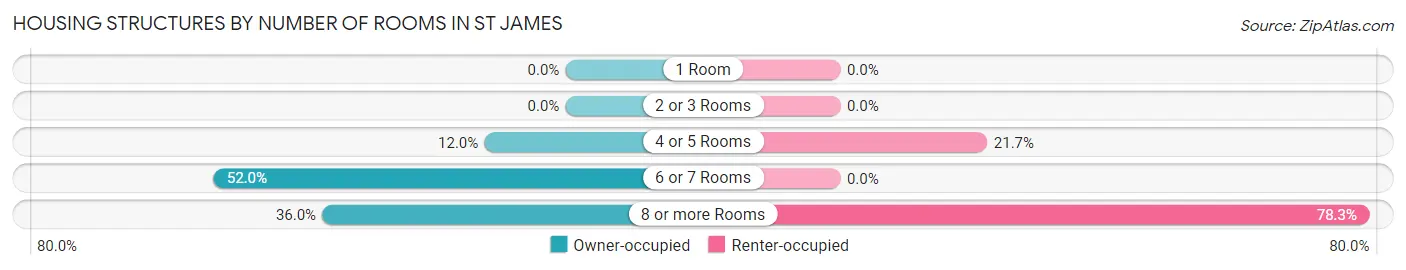
| Number of Rooms | Owner-occupied | Renter-occupied |
| 1 Room | 0 (0.0%) | 0 (0.0%) |
| 2 or 3 Rooms | 0 (0.0%) | 0 (0.0%) |
| 4 or 5 Rooms | 24 (12.0%) | 5 (21.7%) |
| 6 or 7 Rooms | 104 (52.0%) | 0 (0.0%) |
| 8 or more Rooms | 72 (36.0%) | 18 (78.3%) |
| Total | 200 (100.0%) | 23 (100.0%) |
Housing Structure by Heating Type in St James
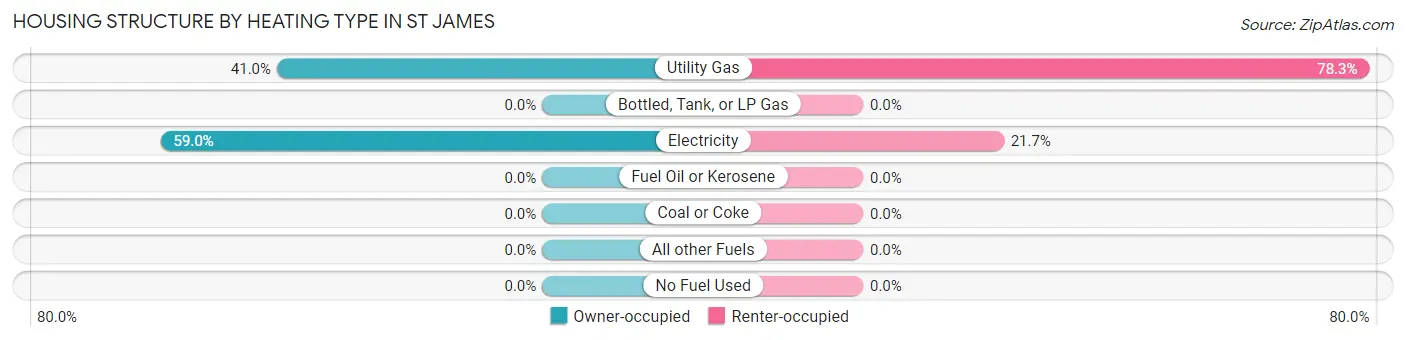
| Heating Type | Owner-occupied | Renter-occupied |
| Utility Gas | 82 (41.0%) | 18 (78.3%) |
| Bottled, Tank, or LP Gas | 0 (0.0%) | 0 (0.0%) |
| Electricity | 118 (59.0%) | 5 (21.7%) |
| Fuel Oil or Kerosene | 0 (0.0%) | 0 (0.0%) |
| Coal or Coke | 0 (0.0%) | 0 (0.0%) |
| All other Fuels | 0 (0.0%) | 0 (0.0%) |
| No Fuel Used | 0 (0.0%) | 0 (0.0%) |
| Total | 200 (100.0%) | 23 (100.0%) |
Household Vehicle Usage in St James
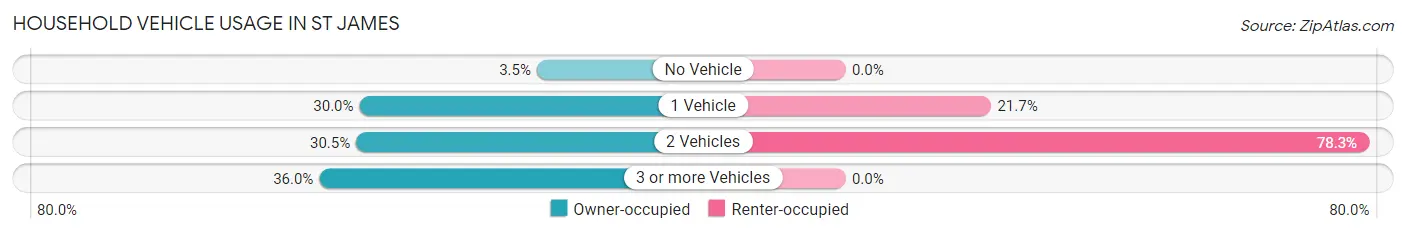
| Vehicles per Household | Owner-occupied | Renter-occupied |
| No Vehicle | 7 (3.5%) | 0 (0.0%) |
| 1 Vehicle | 60 (30.0%) | 5 (21.7%) |
| 2 Vehicles | 61 (30.5%) | 18 (78.3%) |
| 3 or more Vehicles | 72 (36.0%) | 0 (0.0%) |
| Total | 200 (100.0%) | 23 (100.0%) |
Real Estate & Mortgages in St James
Real Estate and Mortgage Overview in St James
| Characteristic | Without Mortgage | With Mortgage |
| Housing Units | 158 | 42 |
| Median Property Value | $134,100 | $305,900 |
| Median Household Income | $49,000 | $17 |
| Monthly Housing Costs | $278 | $0 |
| Real Estate Taxes | $1,135 | $4 |
Property Value by Mortgage Status in St James
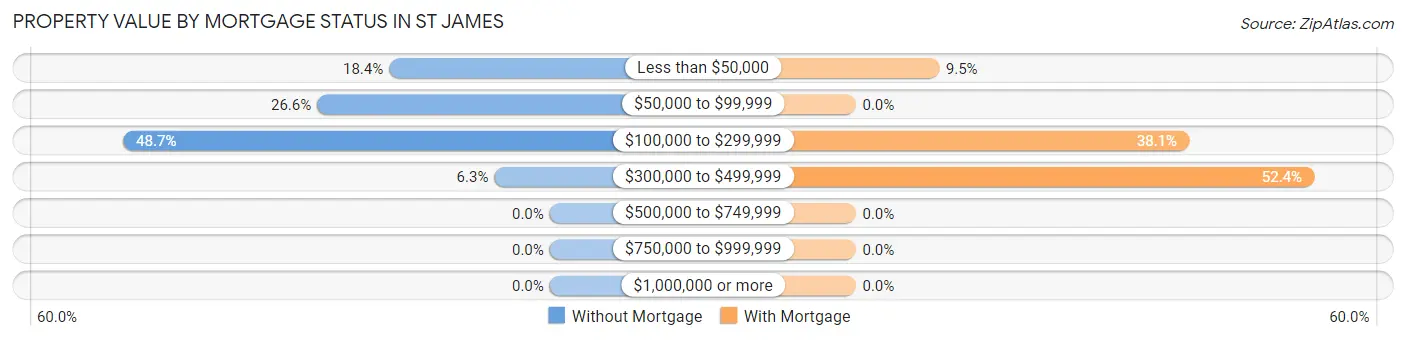
| Property Value | Without Mortgage | With Mortgage |
| Less than $50,000 | 29 (18.3%) | 4 (9.5%) |
| $50,000 to $99,999 | 42 (26.6%) | 0 (0.0%) |
| $100,000 to $299,999 | 77 (48.7%) | 16 (38.1%) |
| $300,000 to $499,999 | 10 (6.3%) | 22 (52.4%) |
| $500,000 to $749,999 | 0 (0.0%) | 0 (0.0%) |
| $750,000 to $999,999 | 0 (0.0%) | 0 (0.0%) |
| $1,000,000 or more | 0 (0.0%) | 0 (0.0%) |
| Total | 158 (100.0%) | 42 (100.0%) |
Household Income by Mortgage Status in St James
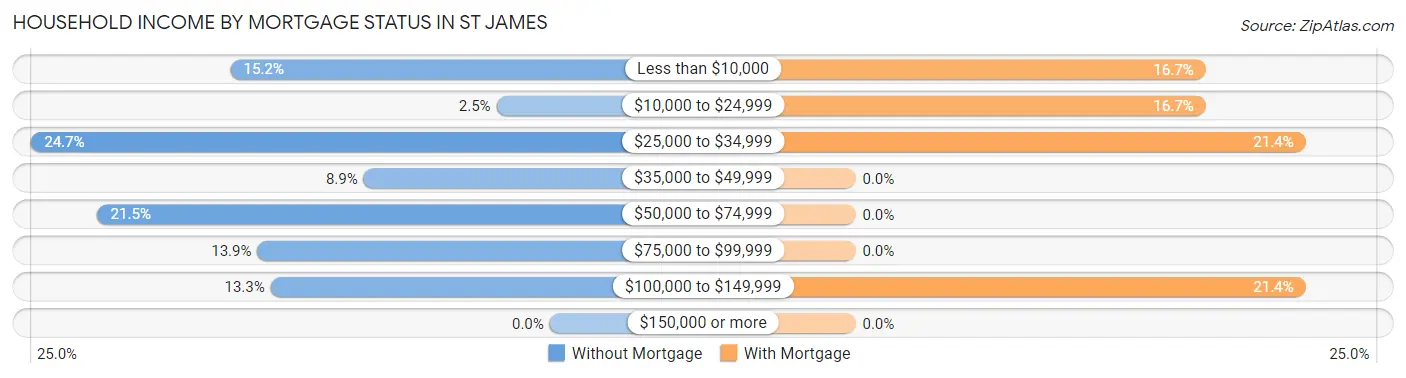
| Household Income | Without Mortgage | With Mortgage |
| Less than $10,000 | 24 (15.2%) | 7 (16.7%) |
| $10,000 to $24,999 | 4 (2.5%) | 7 (16.7%) |
| $25,000 to $34,999 | 39 (24.7%) | 9 (21.4%) |
| $35,000 to $49,999 | 14 (8.9%) | 0 (0.0%) |
| $50,000 to $74,999 | 34 (21.5%) | 0 (0.0%) |
| $75,000 to $99,999 | 22 (13.9%) | 0 (0.0%) |
| $100,000 to $149,999 | 21 (13.3%) | 9 (21.4%) |
| $150,000 or more | 0 (0.0%) | 0 (0.0%) |
| Total | 158 (100.0%) | 42 (100.0%) |
Property Value to Household Income Ratio in St James
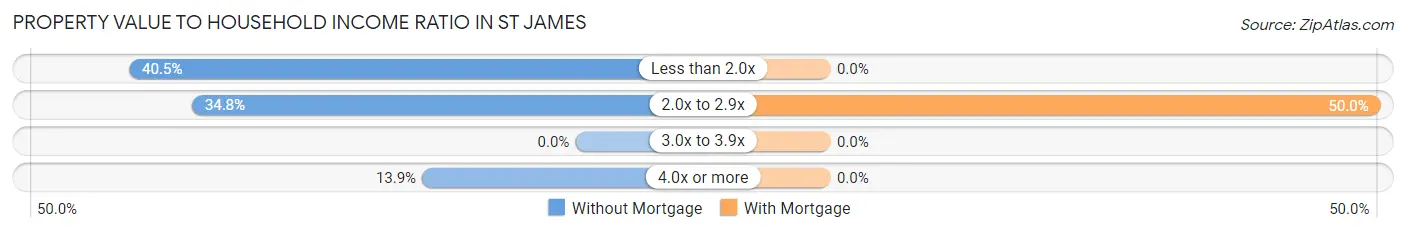
| Value-to-Income Ratio | Without Mortgage | With Mortgage |
| Less than 2.0x | 64 (40.5%) | 0 (0.0%) |
| 2.0x to 2.9x | 55 (34.8%) | 21 (50.0%) |
| 3.0x to 3.9x | 0 (0.0%) | 0 (0.0%) |
| 4.0x or more | 22 (13.9%) | 0 (0.0%) |
| Total | 158 (100.0%) | 42 (100.0%) |
Real Estate Taxes by Mortgage Status in St James
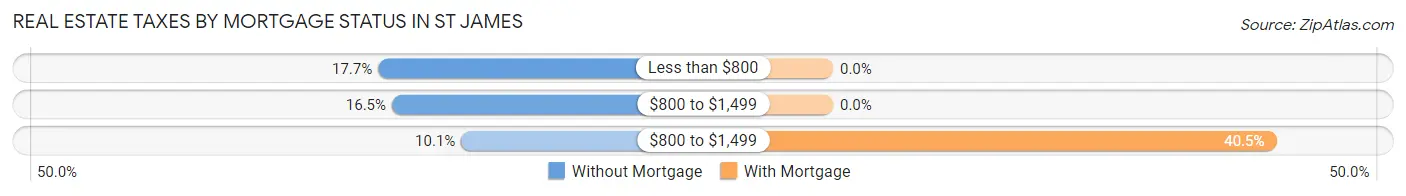
| Property Taxes | Without Mortgage | With Mortgage |
| Less than $800 | 28 (17.7%) | 0 (0.0%) |
| $800 to $1,499 | 26 (16.5%) | 0 (0.0%) |
| $800 to $1,499 | 16 (10.1%) | 17 (40.5%) |
| Total | 158 (100.0%) | 42 (100.0%) |
Health & Disability in St James
Health Insurance Coverage by Age in St James
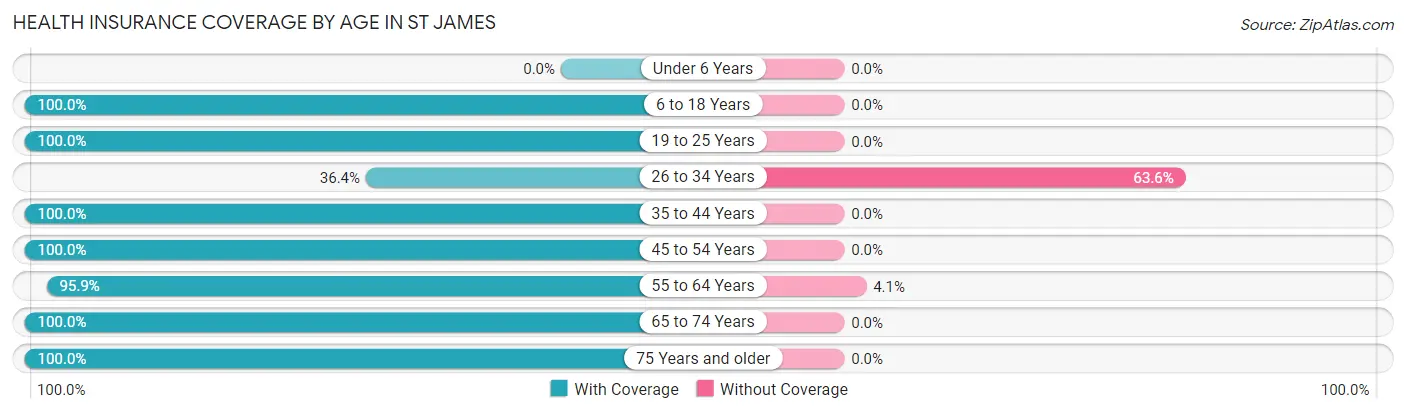
| Age Bracket | With Coverage | Without Coverage |
| Under 6 Years | 0 (0.0%) | 0 (0.0%) |
| 6 to 18 Years | 67 (100.0%) | 0 (0.0%) |
| 19 to 25 Years | 42 (100.0%) | 0 (0.0%) |
| 26 to 34 Years | 32 (36.4%) | 56 (63.6%) |
| 35 to 44 Years | 36 (100.0%) | 0 (0.0%) |
| 45 to 54 Years | 73 (100.0%) | 0 (0.0%) |
| 55 to 64 Years | 94 (95.9%) | 4 (4.1%) |
| 65 to 74 Years | 163 (100.0%) | 0 (0.0%) |
| 75 Years and older | 55 (100.0%) | 0 (0.0%) |
| Total | 562 (90.3%) | 60 (9.7%) |
Health Insurance Coverage by Citizenship Status in St James
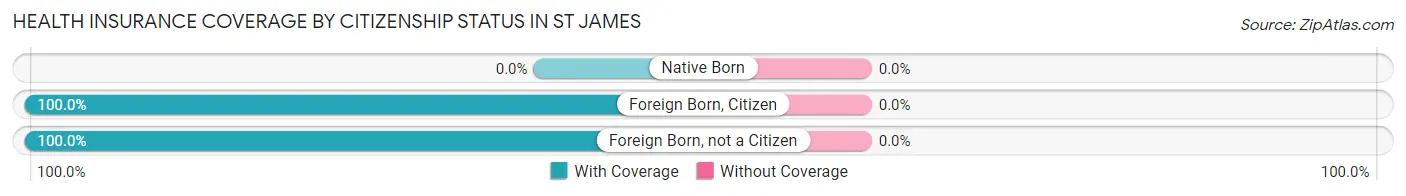
| Citizenship Status | With Coverage | Without Coverage |
| Native Born | 0 (0.0%) | 0 (0.0%) |
| Foreign Born, Citizen | 67 (100.0%) | 0 (0.0%) |
| Foreign Born, not a Citizen | 42 (100.0%) | 0 (0.0%) |
Health Insurance Coverage by Household Income in St James
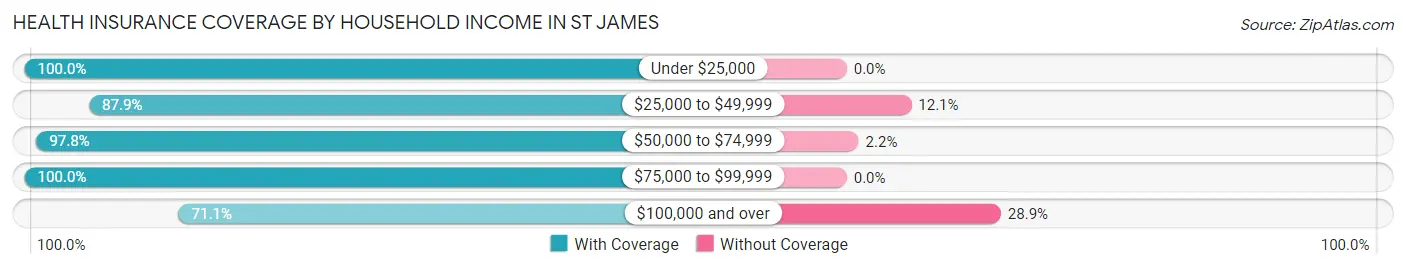
| Household Income | With Coverage | Without Coverage |
| Under $25,000 | 62 (100.0%) | 0 (0.0%) |
| $25,000 to $49,999 | 109 (87.9%) | 15 (12.1%) |
| $50,000 to $74,999 | 176 (97.8%) | 4 (2.2%) |
| $75,000 to $99,999 | 114 (100.0%) | 0 (0.0%) |
| $100,000 and over | 101 (71.1%) | 41 (28.9%) |
Public vs Private Health Insurance Coverage by Age in St James
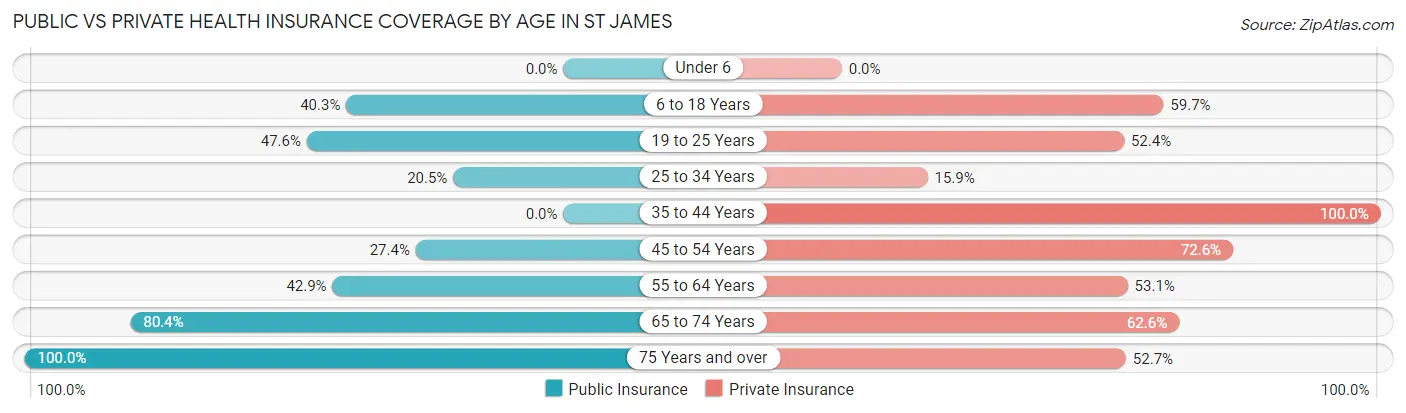
| Age Bracket | Public Insurance | Private Insurance |
| Under 6 | 0 (0.0%) | 0 (0.0%) |
| 6 to 18 Years | 27 (40.3%) | 40 (59.7%) |
| 19 to 25 Years | 20 (47.6%) | 22 (52.4%) |
| 25 to 34 Years | 18 (20.4%) | 14 (15.9%) |
| 35 to 44 Years | 0 (0.0%) | 36 (100.0%) |
| 45 to 54 Years | 20 (27.4%) | 53 (72.6%) |
| 55 to 64 Years | 42 (42.9%) | 52 (53.1%) |
| 65 to 74 Years | 131 (80.4%) | 102 (62.6%) |
| 75 Years and over | 55 (100.0%) | 29 (52.7%) |
| Total | 313 (50.3%) | 348 (55.9%) |
Disability Status by Sex by Age in St James
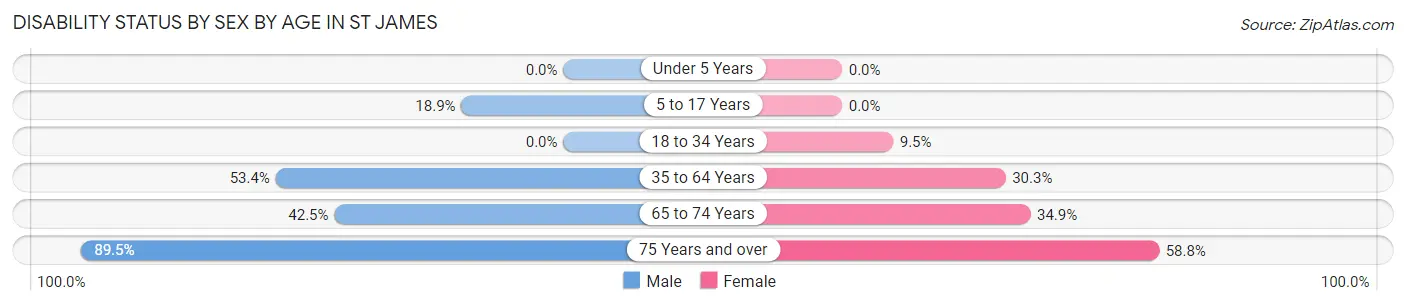
| Age Bracket | Male | Female |
| Under 5 Years | 0 (0.0%) | 0 (0.0%) |
| 5 to 17 Years | 7 (18.9%) | 0 (0.0%) |
| 18 to 34 Years | 0 (0.0%) | 7 (9.5%) |
| 35 to 64 Years | 63 (53.4%) | 27 (30.3%) |
| 65 to 74 Years | 34 (42.5%) | 29 (34.9%) |
| 75 Years and over | 34 (89.5%) | 10 (58.8%) |
Disability Class by Sex by Age in St James
Disability Class: Hearing Difficulty
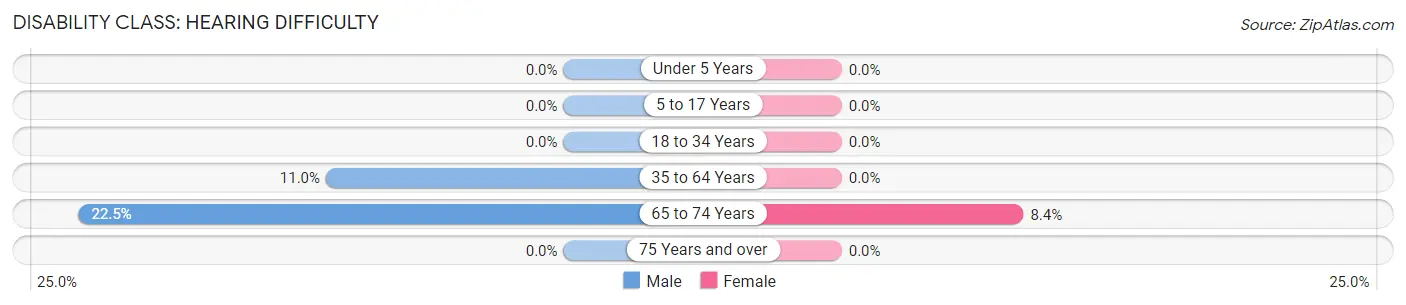
| Age Bracket | Male | Female |
| Under 5 Years | 0 (0.0%) | 0 (0.0%) |
| 5 to 17 Years | 0 (0.0%) | 0 (0.0%) |
| 18 to 34 Years | 0 (0.0%) | 0 (0.0%) |
| 35 to 64 Years | 13 (11.0%) | 0 (0.0%) |
| 65 to 74 Years | 18 (22.5%) | 7 (8.4%) |
| 75 Years and over | 0 (0.0%) | 0 (0.0%) |
Disability Class: Vision Difficulty
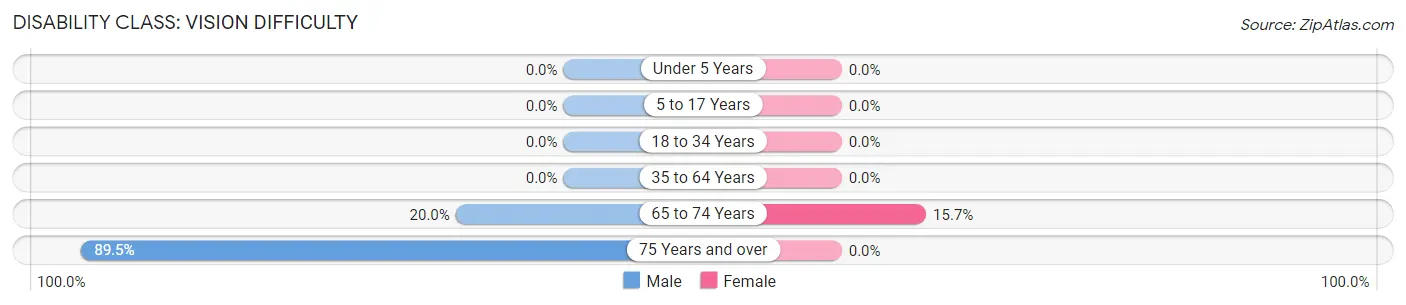
| Age Bracket | Male | Female |
| Under 5 Years | 0 (0.0%) | 0 (0.0%) |
| 5 to 17 Years | 0 (0.0%) | 0 (0.0%) |
| 18 to 34 Years | 0 (0.0%) | 0 (0.0%) |
| 35 to 64 Years | 0 (0.0%) | 0 (0.0%) |
| 65 to 74 Years | 16 (20.0%) | 13 (15.7%) |
| 75 Years and over | 34 (89.5%) | 0 (0.0%) |
Disability Class: Cognitive Difficulty
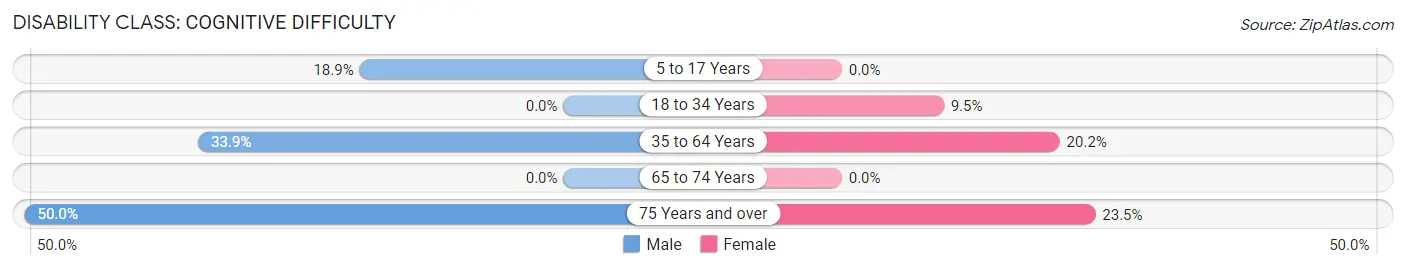
| Age Bracket | Male | Female |
| 5 to 17 Years | 7 (18.9%) | 0 (0.0%) |
| 18 to 34 Years | 0 (0.0%) | 7 (9.5%) |
| 35 to 64 Years | 40 (33.9%) | 18 (20.2%) |
| 65 to 74 Years | 0 (0.0%) | 0 (0.0%) |
| 75 Years and over | 19 (50.0%) | 4 (23.5%) |
Disability Class: Ambulatory Difficulty
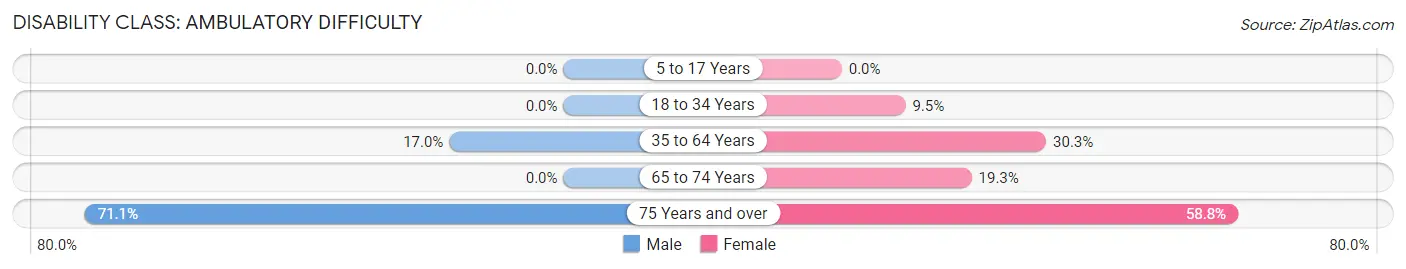
| Age Bracket | Male | Female |
| 5 to 17 Years | 0 (0.0%) | 0 (0.0%) |
| 18 to 34 Years | 0 (0.0%) | 7 (9.5%) |
| 35 to 64 Years | 20 (17.0%) | 27 (30.3%) |
| 65 to 74 Years | 0 (0.0%) | 16 (19.3%) |
| 75 Years and over | 27 (71.1%) | 10 (58.8%) |
Disability Class: Self-Care Difficulty
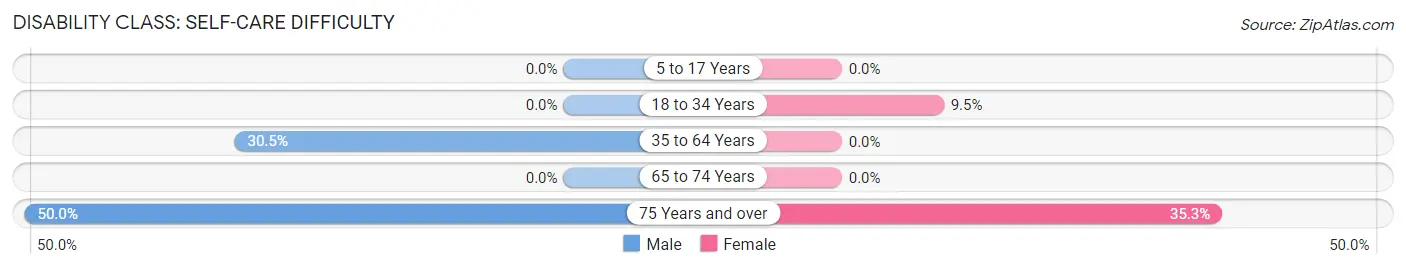
| Age Bracket | Male | Female |
| 5 to 17 Years | 0 (0.0%) | 0 (0.0%) |
| 18 to 34 Years | 0 (0.0%) | 7 (9.5%) |
| 35 to 64 Years | 36 (30.5%) | 0 (0.0%) |
| 65 to 74 Years | 0 (0.0%) | 0 (0.0%) |
| 75 Years and over | 19 (50.0%) | 6 (35.3%) |
Technology Access in St James
Computing Device Access in St James
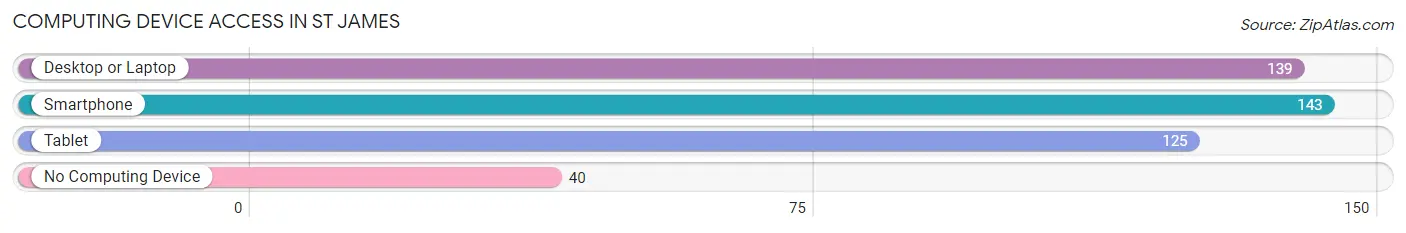
| Device Type | # Households | % Households |
| Desktop or Laptop | 139 | 62.3% |
| Smartphone | 143 | 64.1% |
| Tablet | 125 | 56.0% |
| No Computing Device | 40 | 17.9% |
| Total | 223 | 100.0% |
Internet Access in St James
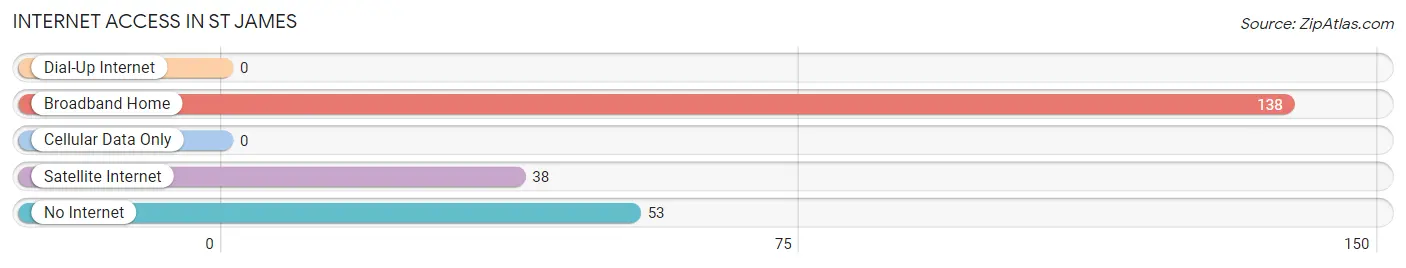
| Internet Type | # Households | % Households |
| Dial-Up Internet | 0 | 0.0% |
| Broadband Home | 138 | 61.9% |
| Cellular Data Only | 0 | 0.0% |
| Satellite Internet | 38 | 17.0% |
| No Internet | 53 | 23.8% |
| Total | 223 | 100.0% |
St James Summary
St. James is a parish located in the southeastern region of Louisiana. It is bordered by Ascension, Assumption, and St. John the Baptist parishes. The parish seat is Convent, and the largest city is Lutcher. The parish has a total area of 545 square miles and a population of 22,102 as of the 2010 census.
History
St. James Parish was established in 1807, making it one of the oldest parishes in Louisiana. The parish was named after the patron saint of Spain, St. James the Greater. The parish was originally part of the German Coast, a settlement of German immigrants who arrived in the area in the early 1700s. The parish was also home to many French settlers who arrived in the late 1700s.
The parish was an important center of the sugar cane industry in the 19th century. The area was also home to many plantations, which were worked by enslaved African Americans. After the Civil War, the parish became a major center of the timber industry.
Geography
St. James Parish is located in the southeastern region of Louisiana. It is bordered by Ascension, Assumption, and St. John the Baptist parishes. The parish has a total area of 545 square miles and a population of 22,102 as of the 2010 census.
The parish is located in the Mississippi River Delta region and is home to many swamps and bayous. The parish is also home to the Atchafalaya Basin, the largest wetland in the United States. The basin is home to many species of wildlife, including alligators, turtles, and birds.
Economy
St. James Parish is home to a diverse economy. The parish is home to many sugar cane and timber farms, as well as oil and gas production. The parish is also home to many chemical plants, which produce products such as fertilizers and plastics.
The parish is also home to many small businesses, including restaurants, retail stores, and service providers. The parish is also home to many tourist attractions, including the St. James Parish Museum and the St. James Parish Fair.
Demographics
As of the 2010 census, St. James Parish had a population of 22,102. The racial makeup of the parish was 68.3% White, 28.2% African American, 0.5% Native American, 0.3% Asian, 0.1% Pacific Islander, 0.7% from other races, and 1.9% from two or more races. Hispanic or Latino of any race were 2.7% of the population.
The median income for a household in the parish was $37,945, and the median income for a family was $45,945. The per capita income for the parish was $18,945. About 17.2% of families and 20.7% of the population were below the poverty line, including 28.2% of those under age 18 and 16.2% of those age 65 or over.
Common Questions
What is Per Capita Income in St James?
Per Capita income in St James is $27,364.
What is the Median Family Income in St James?
Median Family Income in St James is $62,083.
What is the Median Household income in St James?
Median Household Income in St James is $52,266.
What is Income or Wage Gap in St James?
Income or Wage Gap in St James is 23.1%.
Women in St James earn 76.9 cents for every dollar earned by a man.
What is Inequality or Gini Index in St James?
Inequality or Gini Index in St James is 0.48.
What is the Total Population of St James?
Total Population of St James is 622.
What is the Total Male Population of St James?
Total Male Population of St James is 329.
What is the Total Female Population of St James?
Total Female Population of St James is 293.
What is the Ratio of Males per 100 Females in St James?
There are 112.29 Males per 100 Females in St James.
What is the Ratio of Females per 100 Males in St James?
There are 89.06 Females per 100 Males in St James.
What is the Median Population Age in St James?
Median Population Age in St James is 55.4 Years.
What is the Average Family Size in St James
Average Family Size in St James is 3.4 People.
What is the Average Household Size in St James
Average Household Size in St James is 2.8 People.
How Large is the Labor Force in St James?
There are 261 People in the Labor Forcein in St James.
What is the Percentage of People in the Labor Force in St James?
47.0% of People are in the Labor Force in St James.
What is the Unemployment Rate in St James?
Unemployment Rate in St James is 3.1%.