Simpson, LA Map & Demographics
Simpson Map
Simpson Overview
$36,254
PER CAPITA INCOME
$84,583
AVG FAMILY INCOME
$85,769
AVG HOUSEHOLD INCOME
32.3%
WAGE / INCOME GAP [ % ]
67.7¢/ $1
WAGE / INCOME GAP [ $ ]
0.36
INEQUALITY / GINI INDEX
389
TOTAL POPULATION
178
MALE POPULATION
211
FEMALE POPULATION
84.36
MALES / 100 FEMALES
118.54
FEMALES / 100 MALES
44.1
MEDIAN AGE
3.0
AVG FAMILY SIZE
2.7
AVG HOUSEHOLD SIZE
185
LABOR FORCE [ PEOPLE ]
56.1%
PERCENT IN LABOR FORCE
7.0%
UNEMPLOYMENT RATE
Simpson Zip Codes
Income in Simpson
Income Overview in Simpson
Per Capita Income in Simpson is $36,254, while median incomes of families and households are $84,583 and $85,769 respectively.
| Characteristic | Number | Measure |
| Per Capita Income | 389 | $36,254 |
| Median Family Income | 116 | $84,583 |
| Mean Family Income | 116 | $102,655 |
| Median Household Income | 146 | $85,769 |
| Mean Household Income | 146 | $96,684 |
| Income Deficit | 116 | $0 |
| Wage / Income Gap (%) | 389 | 32.32% |
| Wage / Income Gap ($) | 389 | 67.68¢ per $1 |
| Gini / Inequality Index | 389 | 0.36 |
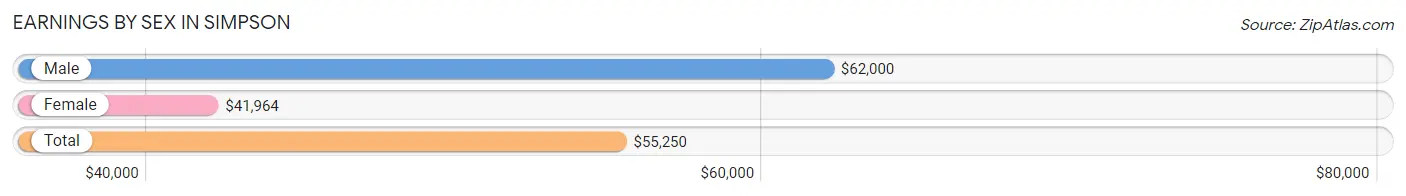
Earnings by Sex in Simpson
Average Earnings in Simpson are $55,250, $62,000 for men and $41,964 for women, a difference of 32.3%.
| Sex | Number | Average Earnings |
| Male | 108 (58.4%) | $62,000 |
| Female | 77 (41.6%) | $41,964 |
| Total | 185 (100.0%) | $55,250 |
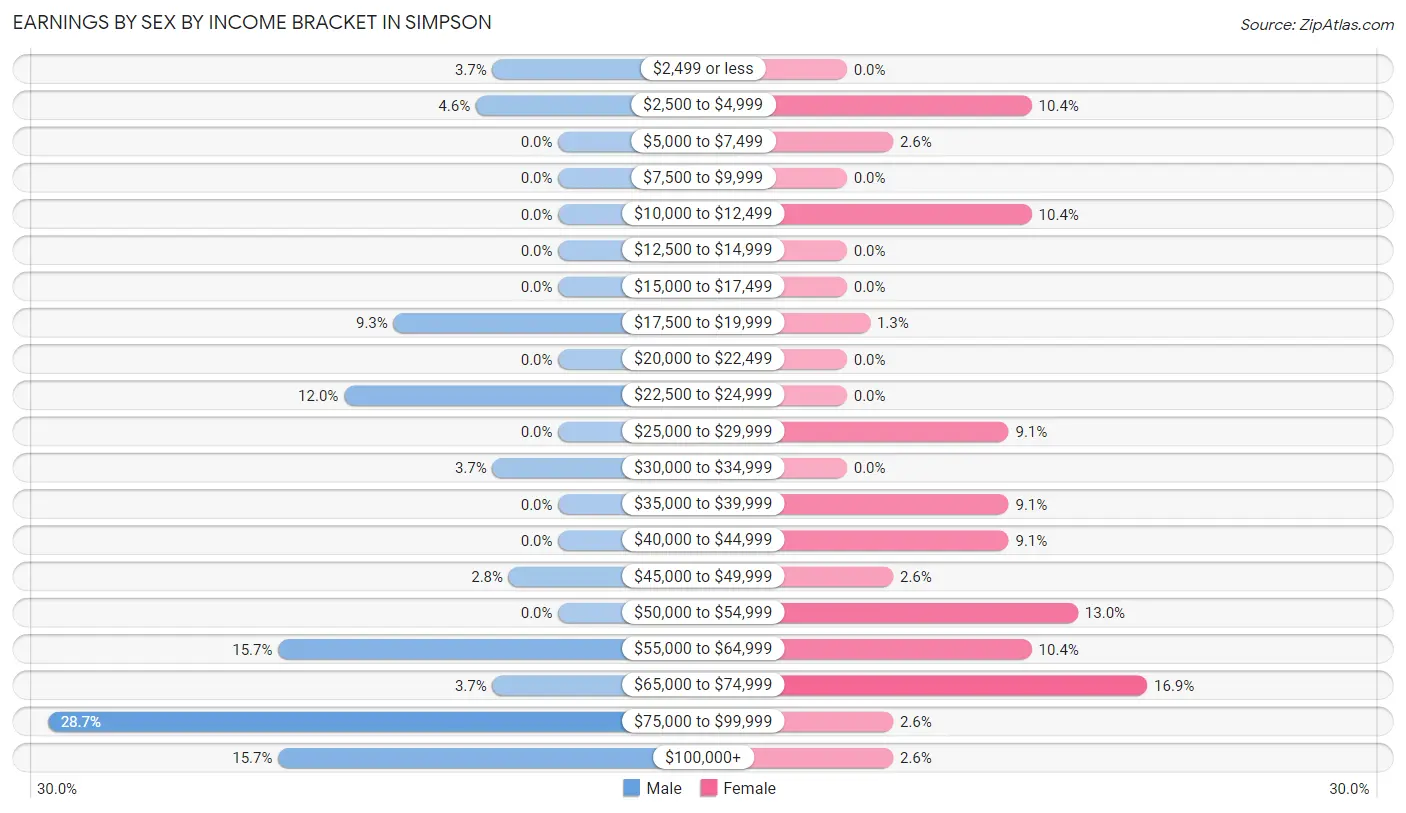
Earnings by Sex by Income Bracket in Simpson
The most common earnings brackets in Simpson are $75,000 to $99,999 for men (31 | 28.7%) and $65,000 to $74,999 for women (13 | 16.9%).
| Income | Male | Female |
| $2,499 or less | 4 (3.7%) | 0 (0.0%) |
| $2,500 to $4,999 | 5 (4.6%) | 8 (10.4%) |
| $5,000 to $7,499 | 0 (0.0%) | 2 (2.6%) |
| $7,500 to $9,999 | 0 (0.0%) | 0 (0.0%) |
| $10,000 to $12,499 | 0 (0.0%) | 8 (10.4%) |
| $12,500 to $14,999 | 0 (0.0%) | 0 (0.0%) |
| $15,000 to $17,499 | 0 (0.0%) | 0 (0.0%) |
| $17,500 to $19,999 | 10 (9.3%) | 1 (1.3%) |
| $20,000 to $22,499 | 0 (0.0%) | 0 (0.0%) |
| $22,500 to $24,999 | 13 (12.0%) | 0 (0.0%) |
| $25,000 to $29,999 | 0 (0.0%) | 7 (9.1%) |
| $30,000 to $34,999 | 4 (3.7%) | 0 (0.0%) |
| $35,000 to $39,999 | 0 (0.0%) | 7 (9.1%) |
| $40,000 to $44,999 | 0 (0.0%) | 7 (9.1%) |
| $45,000 to $49,999 | 3 (2.8%) | 2 (2.6%) |
| $50,000 to $54,999 | 0 (0.0%) | 10 (13.0%) |
| $55,000 to $64,999 | 17 (15.7%) | 8 (10.4%) |
| $65,000 to $74,999 | 4 (3.7%) | 13 (16.9%) |
| $75,000 to $99,999 | 31 (28.7%) | 2 (2.6%) |
| $100,000+ | 17 (15.7%) | 2 (2.6%) |
| Total | 108 (100.0%) | 77 (100.0%) |
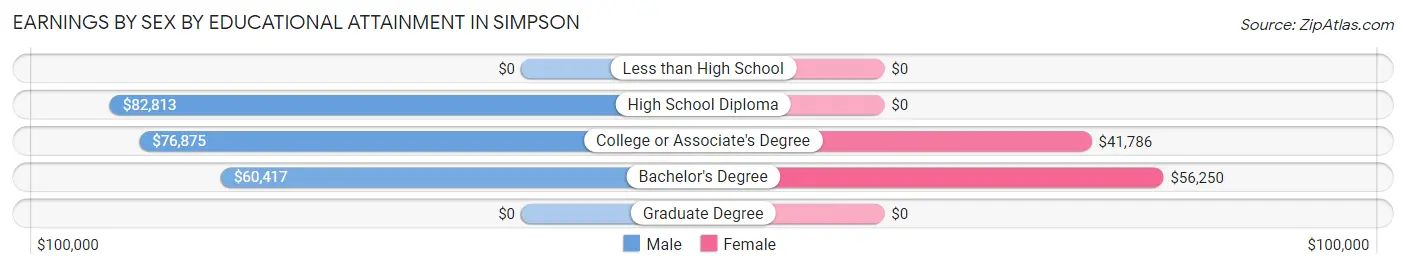
Earnings by Sex by Educational Attainment in Simpson
Average earnings in Simpson are $82,813 for men and $50,179 for women, a difference of 39.4%. Men with an educational attainment of high school diploma enjoy the highest average annual earnings of $82,813, while those with bachelor's degree education earn the least with $60,417. Women with an educational attainment of bachelor's degree earn the most with the average annual earnings of $56,250, while those with college or associate's degree education have the smallest earnings of $41,786.
| Educational Attainment | Male Income | Female Income |
| Less than High School | - | - |
| High School Diploma | $82,813 | $0 |
| College or Associate's Degree | $76,875 | $41,786 |
| Bachelor's Degree | $60,417 | $56,250 |
| Graduate Degree | - | - |
| Total | $82,813 | $50,179 |
Family Income in Simpson
Family Income Brackets in Simpson
According to the Simpson family income data, there are 31 families falling into the $75,000 to $99,999 income range, which is the most common income bracket and makes up 26.7% of all families.
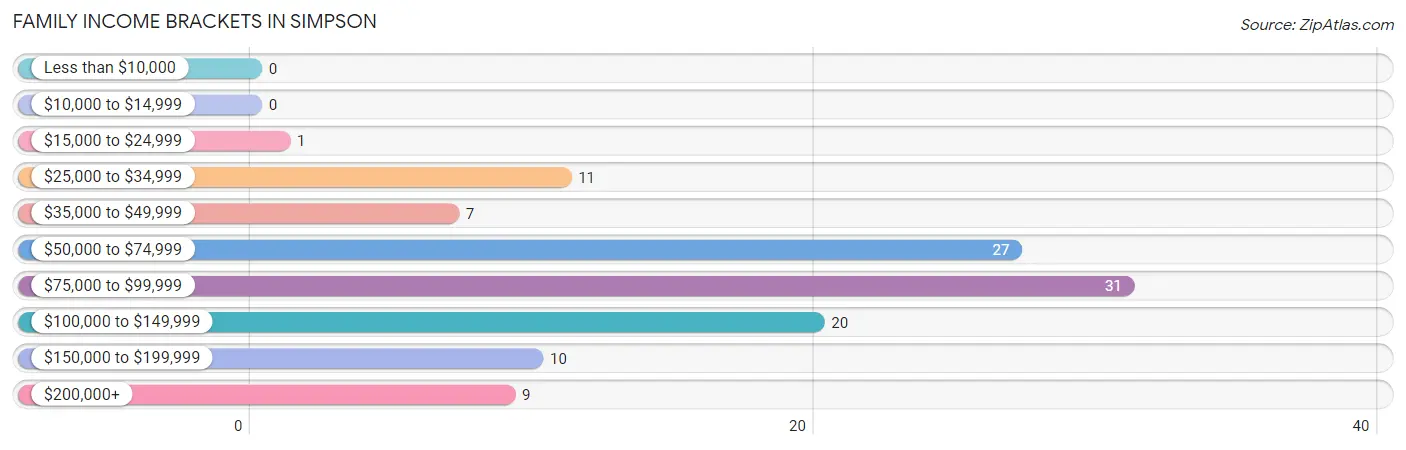
| Income Bracket | # Families | % Families |
| Less than $10,000 | 0 | 0.0% |
| $10,000 to $14,999 | 0 | 0.0% |
| $15,000 to $24,999 | 1 | 0.9% |
| $25,000 to $34,999 | 11 | 9.5% |
| $35,000 to $49,999 | 7 | 6.0% |
| $50,000 to $74,999 | 27 | 23.3% |
| $75,000 to $99,999 | 31 | 26.7% |
| $100,000 to $149,999 | 20 | 17.2% |
| $150,000 to $199,999 | 10 | 8.6% |
| $200,000+ | 9 | 7.8% |
Family Income by Famaliy Size in Simpson
5-person families (15 | 12.9%) account for the highest median family income in Simpson with $250,001 per family, while 5-person families (15 | 12.9%) have the highest median income of $50,000 per family member.
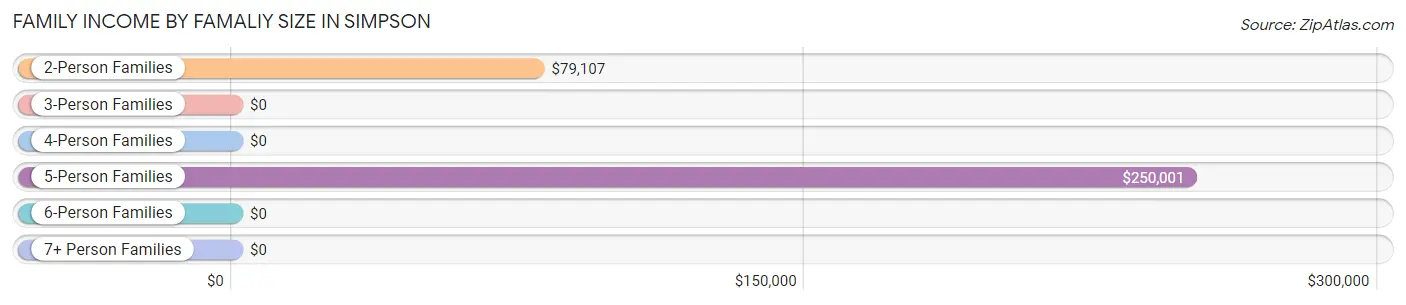
| Income Bracket | # Families | Median Income |
| 2-Person Families | 77 (66.4%) | $79,107 |
| 3-Person Families | 7 (6.0%) | $0 |
| 4-Person Families | 13 (11.2%) | $0 |
| 5-Person Families | 15 (12.9%) | $250,001 |
| 6-Person Families | 4 (3.5%) | $0 |
| 7+ Person Families | 0 (0.0%) | $0 |
| Total | 116 (100.0%) | $84,583 |
Family Income by Number of Earners in Simpson
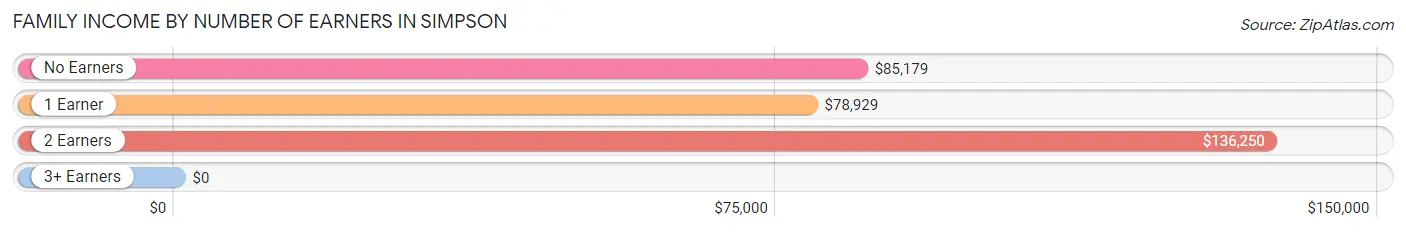
| Number of Earners | # Families | Median Income |
| No Earners | 17 (14.7%) | $85,179 |
| 1 Earner | 46 (39.7%) | $78,929 |
| 2 Earners | 50 (43.1%) | $136,250 |
| 3+ Earners | 3 (2.6%) | $0 |
| Total | 116 (100.0%) | $84,583 |
Household Income in Simpson
Household Income Brackets in Simpson
With 36 households falling in the category, the $100,000 to $149,999 income range is the most frequent in Simpson, accounting for 24.7% of all households.
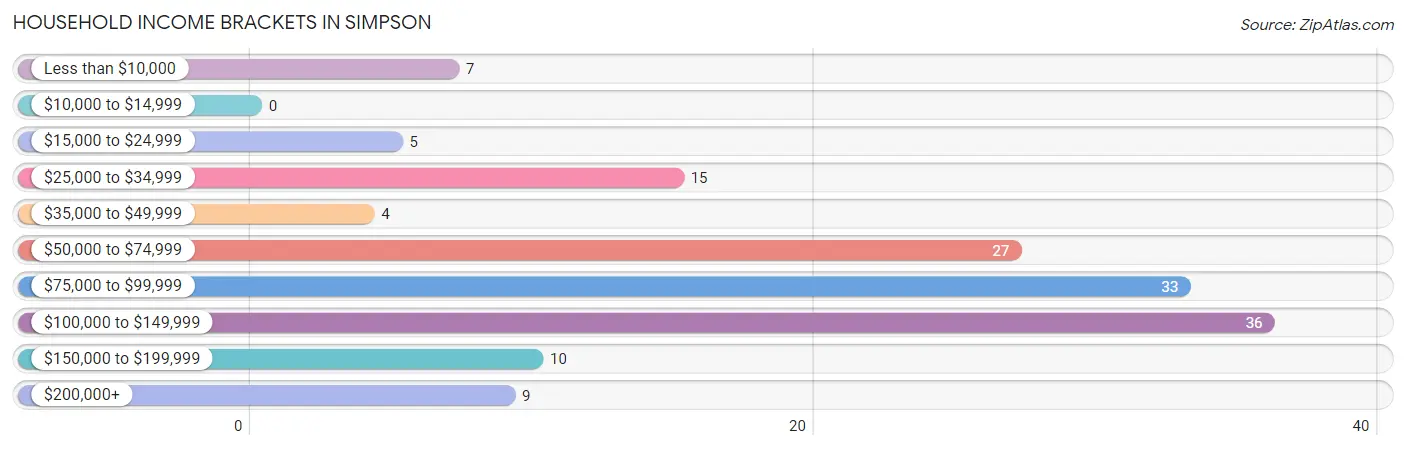
| Income Bracket | # Households | % Households |
| Less than $10,000 | 7 | 4.8% |
| $10,000 to $14,999 | 0 | 0.0% |
| $15,000 to $24,999 | 5 | 3.4% |
| $25,000 to $34,999 | 15 | 10.3% |
| $35,000 to $49,999 | 4 | 2.7% |
| $50,000 to $74,999 | 27 | 18.5% |
| $75,000 to $99,999 | 33 | 22.6% |
| $100,000 to $149,999 | 36 | 24.7% |
| $150,000 to $199,999 | 10 | 6.8% |
| $200,000+ | 9 | 6.2% |
Household Income by Householder Age in Simpson
The median household income in Simpson is $85,769, with the highest median household income of $85,833 found in the 25 to 44 years age bracket for the primary householder. A total of 50 households (34.3%) fall into this category.
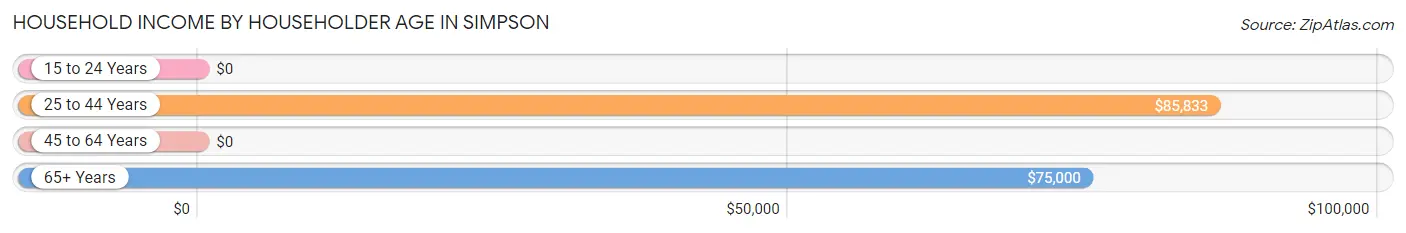
| Income Bracket | # Households | Median Income |
| 15 to 24 Years | 0 (0.0%) | $0 |
| 25 to 44 Years | 50 (34.3%) | $85,833 |
| 45 to 64 Years | 66 (45.2%) | $0 |
| 65+ Years | 30 (20.5%) | $75,000 |
| Total | 146 (100.0%) | $85,769 |
Poverty in Simpson
Income Below Poverty by Sex and Age in Simpson
With 1.1% poverty level for males and 5.2% for females among the residents of Simpson, 55 to 64 year old males and 45 to 54 year old females are the most vulnerable to poverty, with 2 males (11.8%) and 10 females (25.6%) in their respective age groups living below the poverty level.
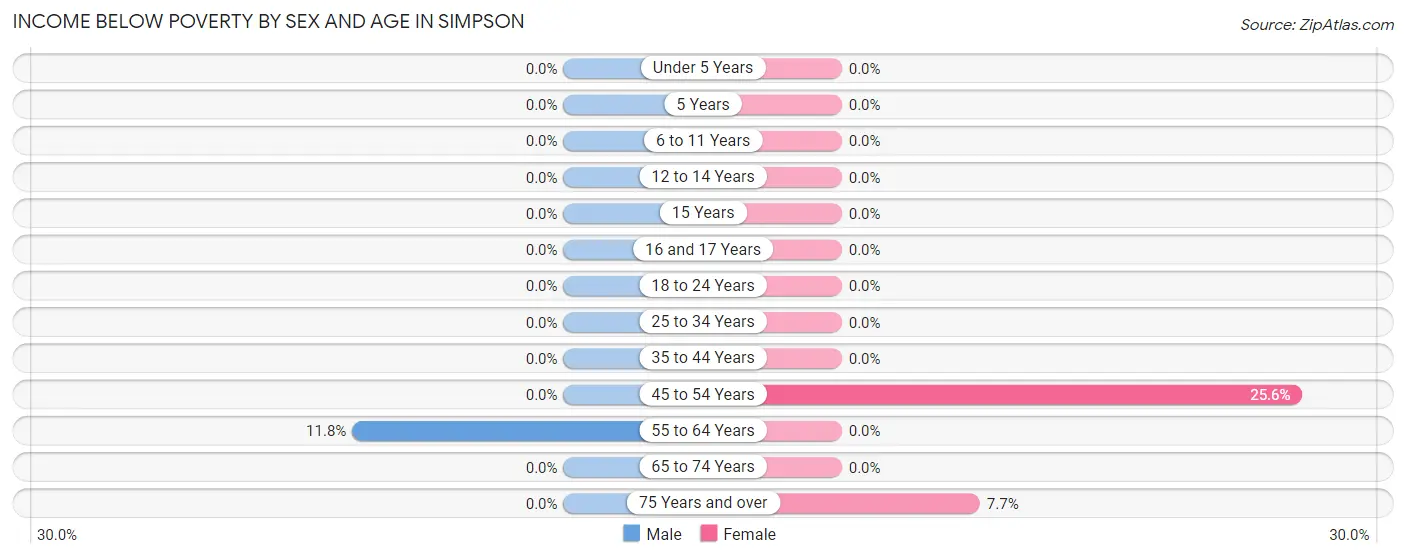
| Age Bracket | Male | Female |
| Under 5 Years | 0 (0.0%) | 0 (0.0%) |
| 5 Years | 0 (0.0%) | 0 (0.0%) |
| 6 to 11 Years | 0 (0.0%) | 0 (0.0%) |
| 12 to 14 Years | 0 (0.0%) | 0 (0.0%) |
| 15 Years | 0 (0.0%) | 0 (0.0%) |
| 16 and 17 Years | 0 (0.0%) | 0 (0.0%) |
| 18 to 24 Years | 0 (0.0%) | 0 (0.0%) |
| 25 to 34 Years | 0 (0.0%) | 0 (0.0%) |
| 35 to 44 Years | 0 (0.0%) | 0 (0.0%) |
| 45 to 54 Years | 0 (0.0%) | 10 (25.6%) |
| 55 to 64 Years | 2 (11.8%) | 0 (0.0%) |
| 65 to 74 Years | 0 (0.0%) | 0 (0.0%) |
| 75 Years and over | 0 (0.0%) | 1 (7.7%) |
| Total | 2 (1.1%) | 11 (5.2%) |
Income Above Poverty by Sex and Age in Simpson
According to the poverty statistics in Simpson, males aged under 5 years and females aged under 5 years are the age groups that are most secure financially, with 100.0% of males and 100.0% of females in these age groups living above the poverty line.
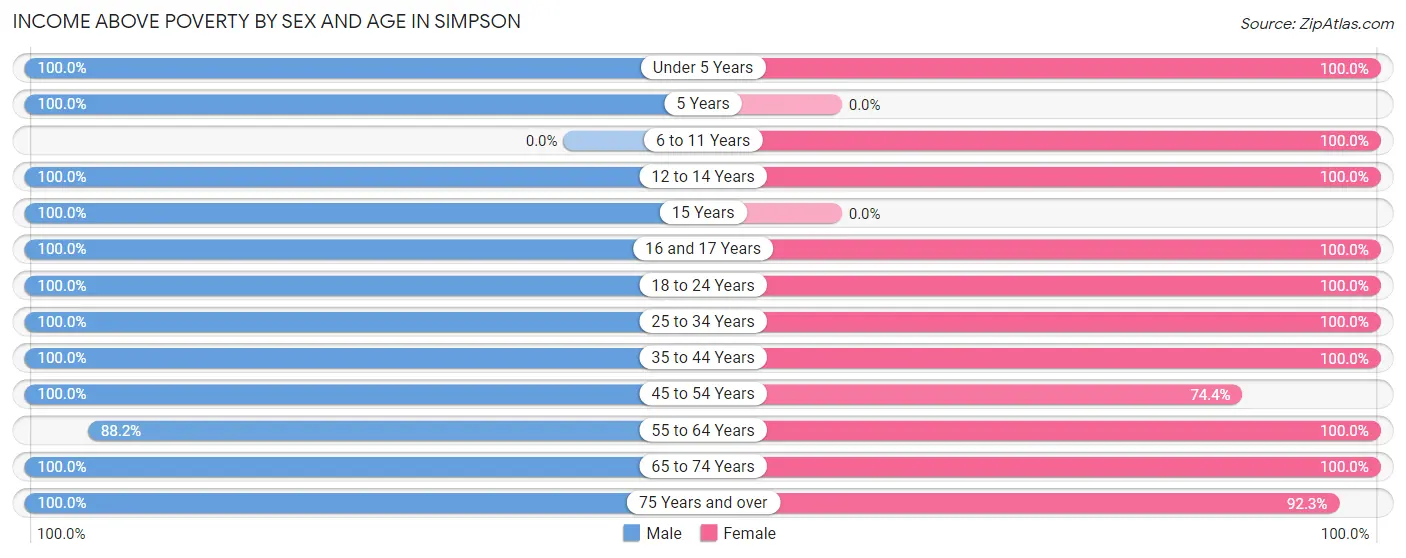
| Age Bracket | Male | Female |
| Under 5 Years | 8 (100.0%) | 10 (100.0%) |
| 5 Years | 7 (100.0%) | 0 (0.0%) |
| 6 to 11 Years | 0 (0.0%) | 18 (100.0%) |
| 12 to 14 Years | 2 (100.0%) | 11 (100.0%) |
| 15 Years | 3 (100.0%) | 0 (0.0%) |
| 16 and 17 Years | 3 (100.0%) | 3 (100.0%) |
| 18 to 24 Years | 40 (100.0%) | 18 (100.0%) |
| 25 to 34 Years | 14 (100.0%) | 12 (100.0%) |
| 35 to 44 Years | 20 (100.0%) | 38 (100.0%) |
| 45 to 54 Years | 37 (100.0%) | 29 (74.4%) |
| 55 to 64 Years | 15 (88.2%) | 41 (100.0%) |
| 65 to 74 Years | 24 (100.0%) | 8 (100.0%) |
| 75 Years and over | 3 (100.0%) | 12 (92.3%) |
| Total | 176 (98.9%) | 200 (94.8%) |
Income Below Poverty Among Married-Couple Families in Simpson
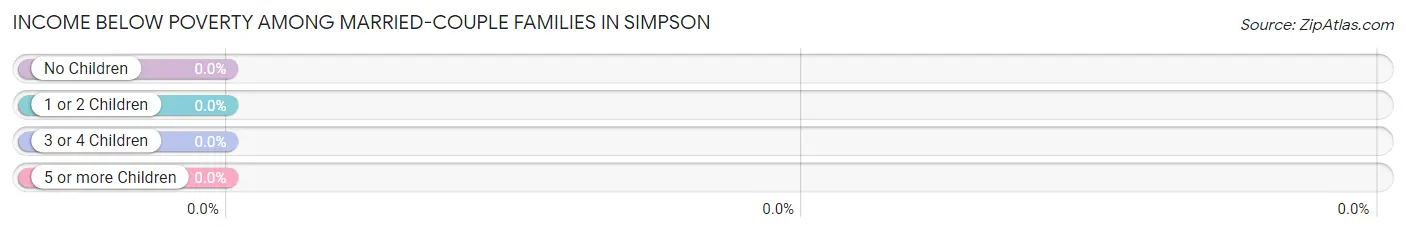
| Children | Above Poverty | Below Poverty |
| No Children | 56 (100.0%) | 0 (0.0%) |
| 1 or 2 Children | 19 (100.0%) | 0 (0.0%) |
| 3 or 4 Children | 8 (100.0%) | 0 (0.0%) |
| 5 or more Children | 0 (0.0%) | 0 (0.0%) |
| Total | 83 (100.0%) | 0 (0.0%) |
Income Below Poverty Among Single-Parent Households in Simpson
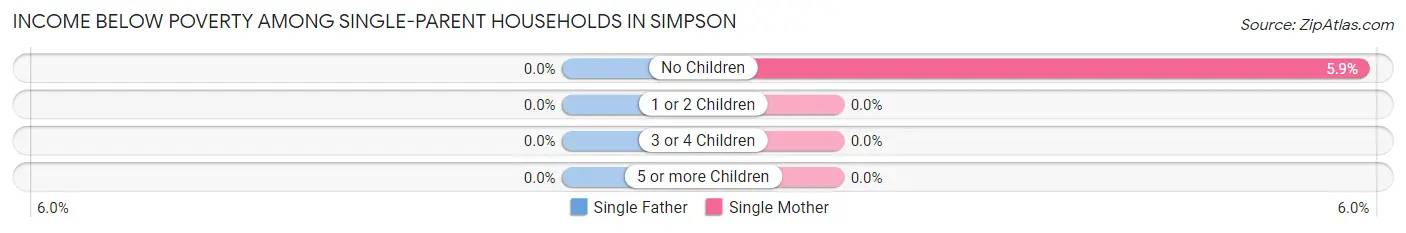
| Children | Single Father | Single Mother |
| No Children | 0 (0.0%) | 1 (5.9%) |
| 1 or 2 Children | 0 (0.0%) | 0 (0.0%) |
| 3 or 4 Children | 0 (0.0%) | 0 (0.0%) |
| 5 or more Children | 0 (0.0%) | 0 (0.0%) |
| Total | 0 (0.0%) | 1 (4.2%) |
Income Below Poverty Among Married-Couple vs Single-Parent Households in Simpson
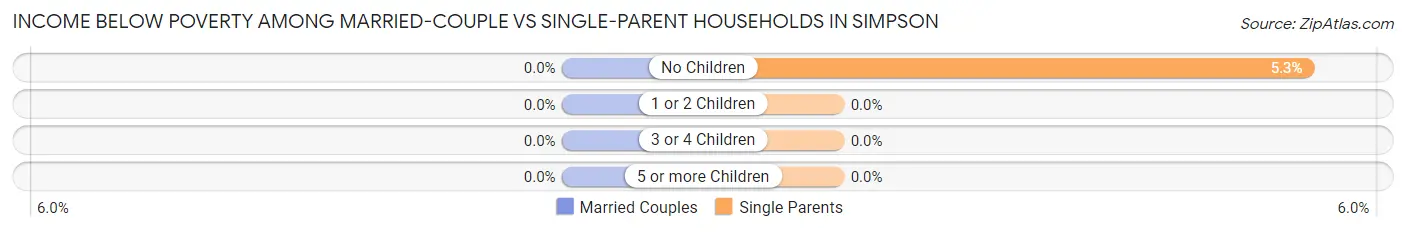
| Children | Married-Couple Families | Single-Parent Households |
| No Children | 0 (0.0%) | 1 (5.3%) |
| 1 or 2 Children | 0 (0.0%) | 0 (0.0%) |
| 3 or 4 Children | 0 (0.0%) | 0 (0.0%) |
| 5 or more Children | 0 (0.0%) | 0 (0.0%) |
| Total | 0 (0.0%) | 1 (3.0%) |
Race in Simpson
The most populous races in Simpson are White / Caucasian (380 | 97.7%), Hispanic or Latino (10 | 2.6%), and Two or more Races (8 | 2.1%).
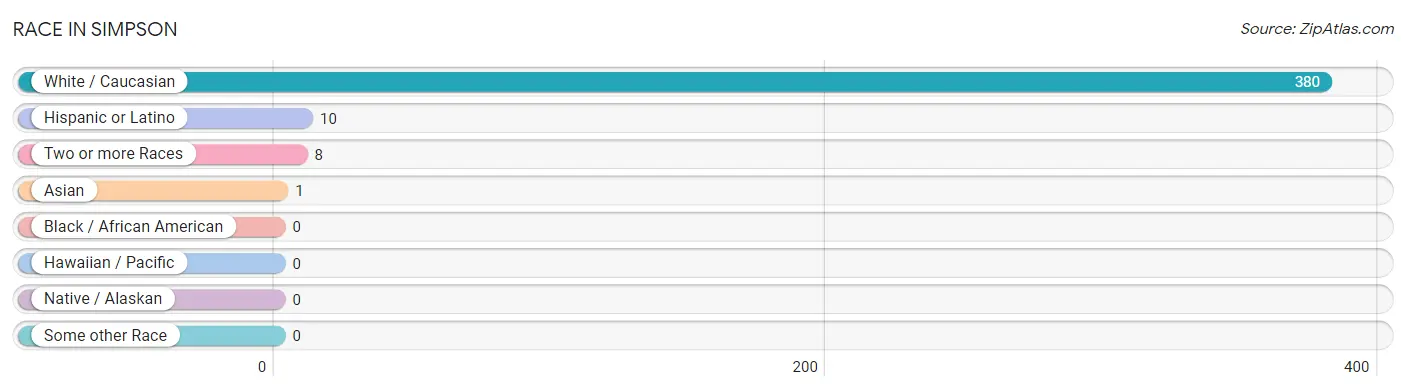
| Race | # Population | % Population |
| Asian | 1 | 0.3% |
| Black / African American | 0 | 0.0% |
| Hawaiian / Pacific | 0 | 0.0% |
| Hispanic or Latino | 10 | 2.6% |
| Native / Alaskan | 0 | 0.0% |
| White / Caucasian | 380 | 97.7% |
| Two or more Races | 8 | 2.1% |
| Some other Race | 0 | 0.0% |
| Total | 389 | 100.0% |
Ancestry in Simpson
The most populous ancestries reported in Simpson are English (135 | 34.7%), American (27 | 6.9%), Irish (21 | 5.4%), French (18 | 4.6%), and Puerto Rican (10 | 2.6%), together accounting for 54.2% of all Simpson residents.
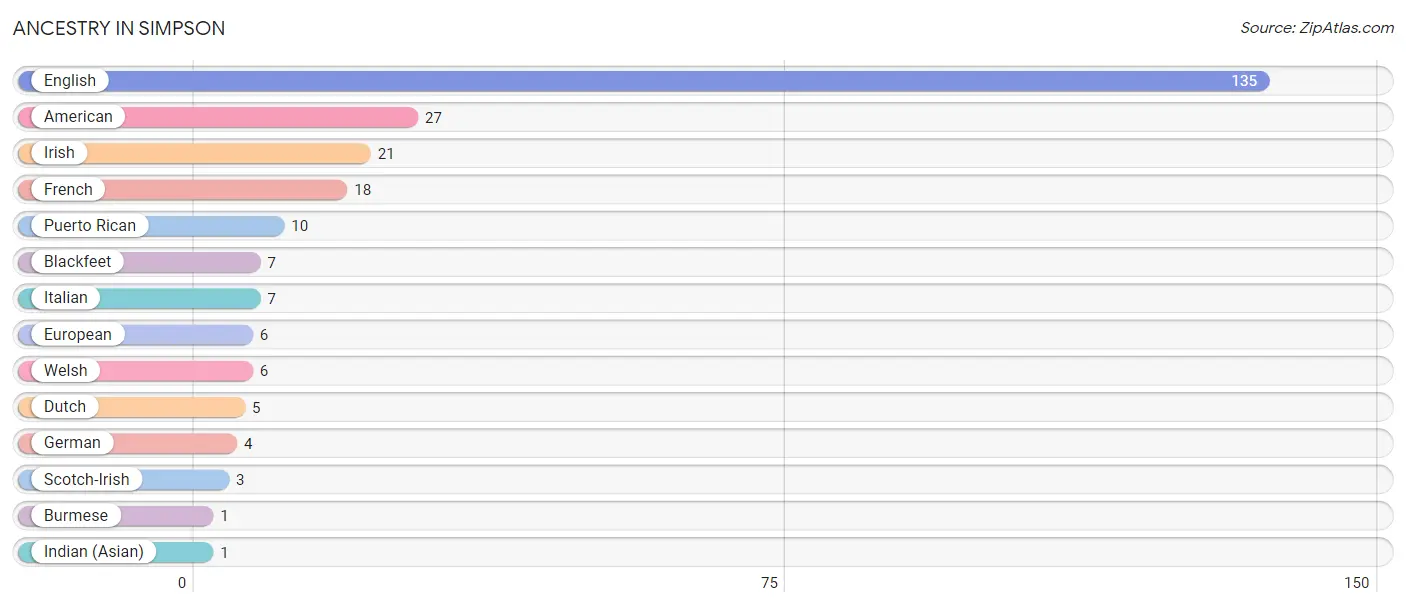
| Ancestry | # Population | % Population |
| American | 27 | 6.9% |
| Blackfeet | 7 | 1.8% |
| Burmese | 1 | 0.3% |
| Dutch | 5 | 1.3% |
| English | 135 | 34.7% |
| European | 6 | 1.5% |
| French | 18 | 4.6% |
| German | 4 | 1.0% |
| Indian (Asian) | 1 | 0.3% |
| Irish | 21 | 5.4% |
| Italian | 7 | 1.8% |
| Puerto Rican | 10 | 2.6% |
| Scotch-Irish | 3 | 0.8% |
| Welsh | 6 | 1.5% | View All 14 Rows |
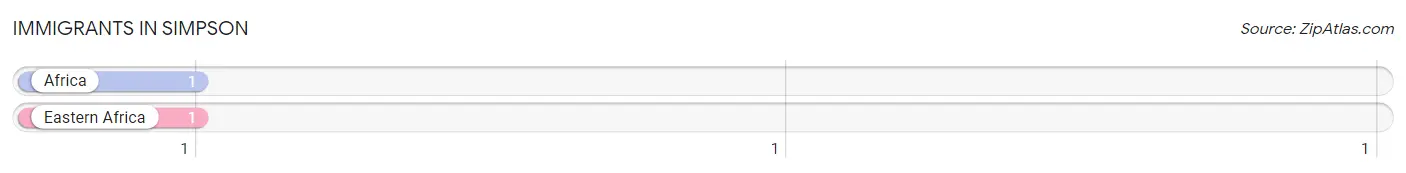
Immigrants in Simpson
The most numerous immigrant groups reported in Simpson came from Africa (1 | 0.3%), and Eastern Africa (1 | 0.3%), together accounting for 0.5% of all Simpson residents.
| Immigration Origin | # Population | % Population |
| Africa | 1 | 0.3% |
| Eastern Africa | 1 | 0.3% | View All 2 Rows |
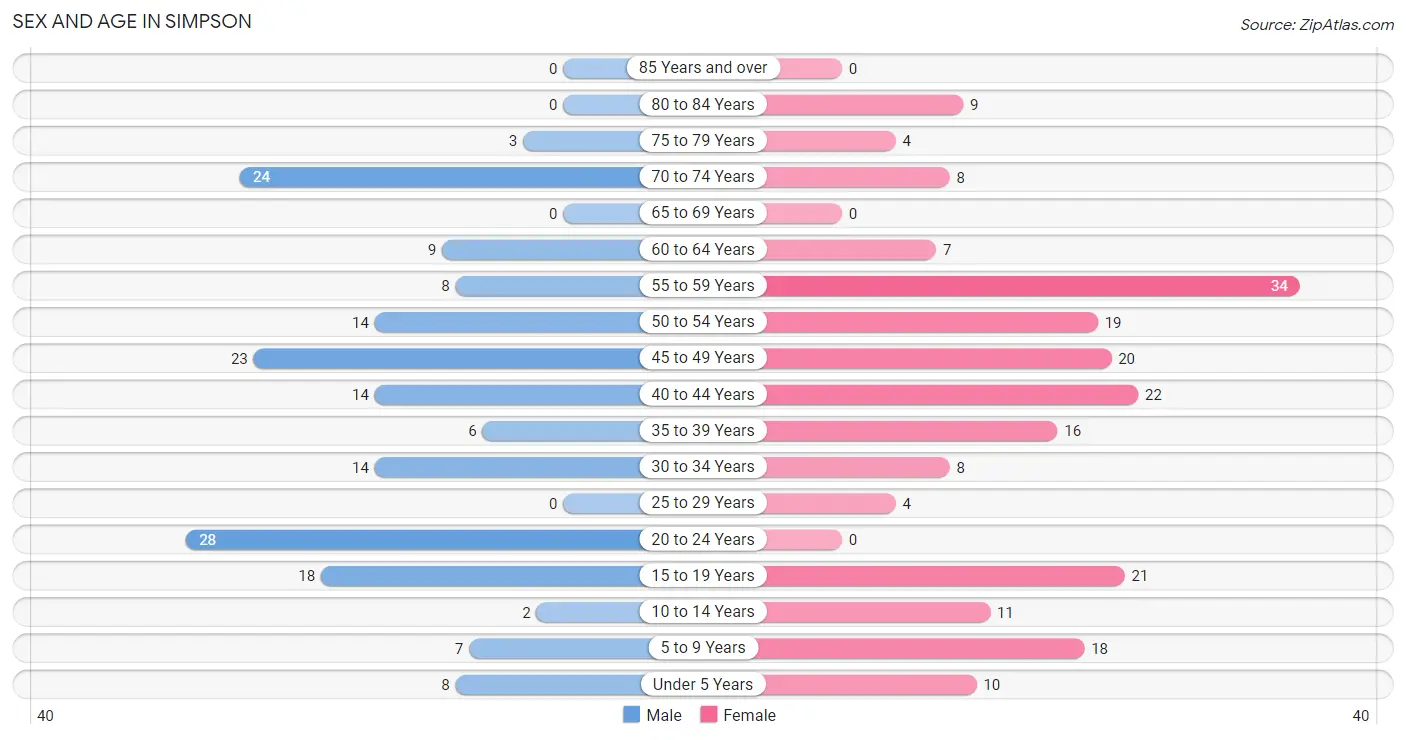
Sex and Age in Simpson
Sex and Age in Simpson
The most populous age groups in Simpson are 20 to 24 Years (28 | 15.7%) for men and 55 to 59 Years (34 | 16.1%) for women.
| Age Bracket | Male | Female |
| Under 5 Years | 8 (4.5%) | 10 (4.7%) |
| 5 to 9 Years | 7 (3.9%) | 18 (8.5%) |
| 10 to 14 Years | 2 (1.1%) | 11 (5.2%) |
| 15 to 19 Years | 18 (10.1%) | 21 (10.0%) |
| 20 to 24 Years | 28 (15.7%) | 0 (0.0%) |
| 25 to 29 Years | 0 (0.0%) | 4 (1.9%) |
| 30 to 34 Years | 14 (7.9%) | 8 (3.8%) |
| 35 to 39 Years | 6 (3.4%) | 16 (7.6%) |
| 40 to 44 Years | 14 (7.9%) | 22 (10.4%) |
| 45 to 49 Years | 23 (12.9%) | 20 (9.5%) |
| 50 to 54 Years | 14 (7.9%) | 19 (9.0%) |
| 55 to 59 Years | 8 (4.5%) | 34 (16.1%) |
| 60 to 64 Years | 9 (5.1%) | 7 (3.3%) |
| 65 to 69 Years | 0 (0.0%) | 0 (0.0%) |
| 70 to 74 Years | 24 (13.5%) | 8 (3.8%) |
| 75 to 79 Years | 3 (1.7%) | 4 (1.9%) |
| 80 to 84 Years | 0 (0.0%) | 9 (4.3%) |
| 85 Years and over | 0 (0.0%) | 0 (0.0%) |
| Total | 178 (100.0%) | 211 (100.0%) |
Families and Households in Simpson
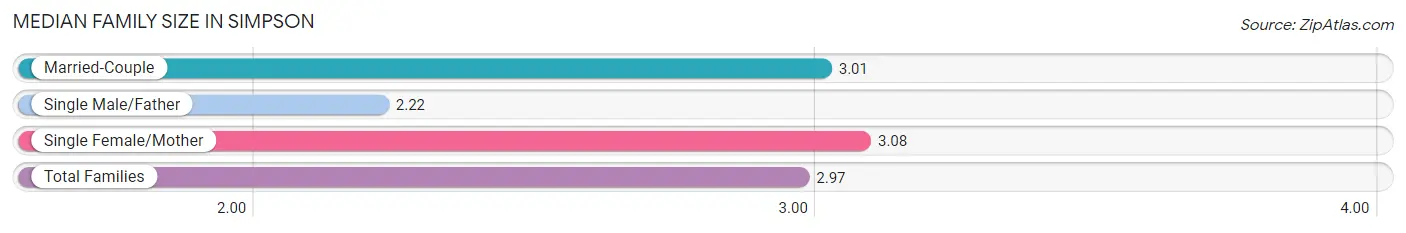
Median Family Size in Simpson
The median family size in Simpson is 2.97 persons per family, with single female/mother families (24 | 20.7%) accounting for the largest median family size of 3.08 persons per family. On the other hand, single male/father families (9 | 7.8%) represent the smallest median family size with 2.22 persons per family.
| Family Type | # Families | Family Size |
| Married-Couple | 83 (71.6%) | 3.01 |
| Single Male/Father | 9 (7.8%) | 2.22 |
| Single Female/Mother | 24 (20.7%) | 3.08 |
| Total Families | 116 (100.0%) | 2.97 |
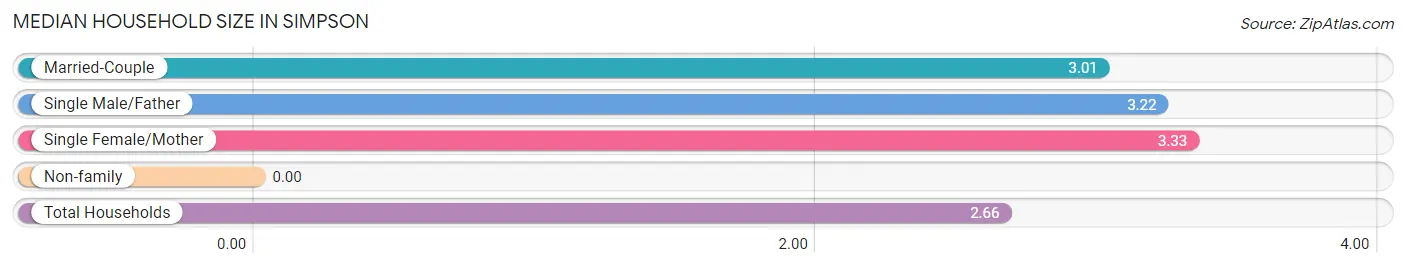
Median Household Size in Simpson
| Household Type | # Households | Household Size |
| Married-Couple | 83 (56.9%) | 3.01 |
| Single Male/Father | 9 (6.2%) | 3.22 |
| Single Female/Mother | 24 (16.4%) | 3.33 |
| Non-family | 30 (20.5%) | - |
| Total Households | 146 (100.0%) | 2.66 |
Household Size by Marriage Status in Simpson
Out of a total of 146 households in Simpson, 116 (79.4%) are family households, while 30 (20.5%) are nonfamily households. The most numerous type of family households are 2-person households, comprising 68, and the most common type of nonfamily households are 1-person households, comprising 30.
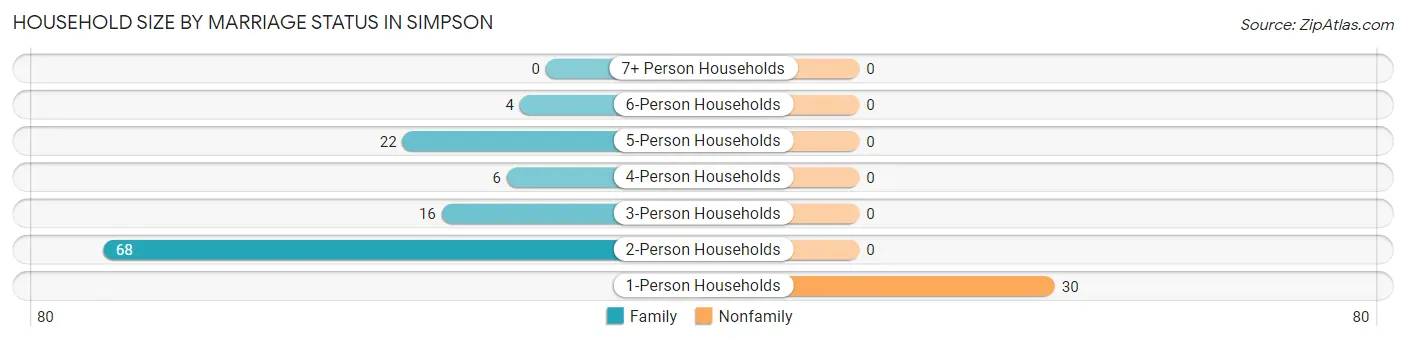
| Household Size | Family Households | Nonfamily Households |
| 1-Person Households | - | 30 (20.5%) |
| 2-Person Households | 68 (46.6%) | 0 (0.0%) |
| 3-Person Households | 16 (11.0%) | 0 (0.0%) |
| 4-Person Households | 6 (4.1%) | 0 (0.0%) |
| 5-Person Households | 22 (15.1%) | 0 (0.0%) |
| 6-Person Households | 4 (2.7%) | 0 (0.0%) |
| 7+ Person Households | 0 (0.0%) | 0 (0.0%) |
| Total | 116 (79.4%) | 30 (20.5%) |
Female Fertility in Simpson
Fertility by Age in Simpson
| Age Bracket | Women with Births | Births / 1,000 Women |
| 15 to 19 years | 0 (0.0%) | 0.0 |
| 20 to 34 years | 0 (0.0%) | 0.0 |
| 35 to 50 years | 0 (0.0%) | 0.0 |
| Total | 0 (0.0%) | 0.0 |
Fertility by Age by Marriage Status in Simpson
| Age Bracket | Married | Unmarried |
| 15 to 19 years | 0 (0.0%) | 0 (0.0%) |
| 20 to 34 years | 0 (0.0%) | 0 (0.0%) |
| 35 to 50 years | 0 (0.0%) | 0 (0.0%) |
| Total | 0 (0.0%) | 0 (0.0%) |
Fertility by Education in Simpson
| Educational Attainment | Women with Births | Births / 1,000 Women |
| Less than High School | 0 (0.0%) | 0.0 |
| High School Diploma | 0 (0.0%) | 0.0 |
| College or Associate's Degree | 0 (0.0%) | 0.0 |
| Bachelor's Degree | 0 (0.0%) | 0.0 |
| Graduate Degree | 0 (0.0%) | 0.0 |
| Total | 0 (0.0%) | 0.0 |
Fertility by Education by Marriage Status in Simpson
| Educational Attainment | Married | Unmarried |
| Less than High School | 0 (0.0%) | 0 (0.0%) |
| High School Diploma | 0 (0.0%) | 0 (0.0%) |
| College or Associate's Degree | 0 (0.0%) | 0 (0.0%) |
| Bachelor's Degree | 0 (0.0%) | 0 (0.0%) |
| Graduate Degree | 0 (0.0%) | 0 (0.0%) |
| Total | 0 (0.0%) | 0 (0.0%) |
Employment Characteristics in Simpson
Employment by Class of Employer in Simpson
Among the 171 employed individuals in Simpson, private company employees (123 | 71.9%), not-for-profit organizations (16 | 9.4%), and state government employees (10 | 5.9%) make up the most common classes of employment.
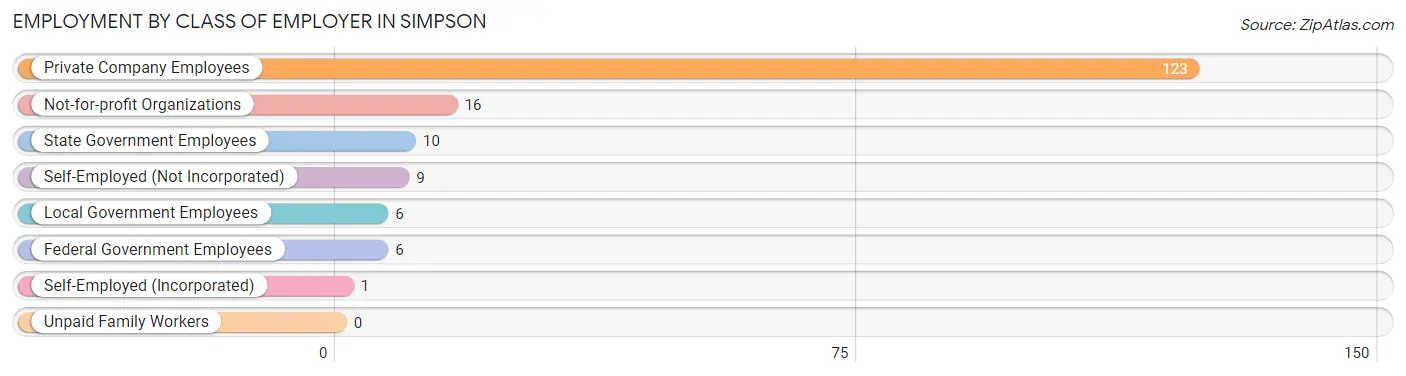
| Employer Class | # Employees | % Employees |
| Private Company Employees | 123 | 71.9% |
| Self-Employed (Incorporated) | 1 | 0.6% |
| Self-Employed (Not Incorporated) | 9 | 5.3% |
| Not-for-profit Organizations | 16 | 9.4% |
| Local Government Employees | 6 | 3.5% |
| State Government Employees | 10 | 5.9% |
| Federal Government Employees | 6 | 3.5% |
| Unpaid Family Workers | 0 | 0.0% |
| Total | 171 | 100.0% |
Employment Status by Age in Simpson
According to the labor force statistics for Simpson, out of the total population over 16 years of age (330), 56.1% or 185 individuals are in the labor force, with 7.0% or 13 of them unemployed. The age group with the highest labor force participation rate is 30 to 34 years, with 100.0% or 22 individuals in the labor force. Within the labor force, the 35 to 44 years age range has the highest percentage of unemployed individuals, with 25.5% or 13 of them being unemployed.
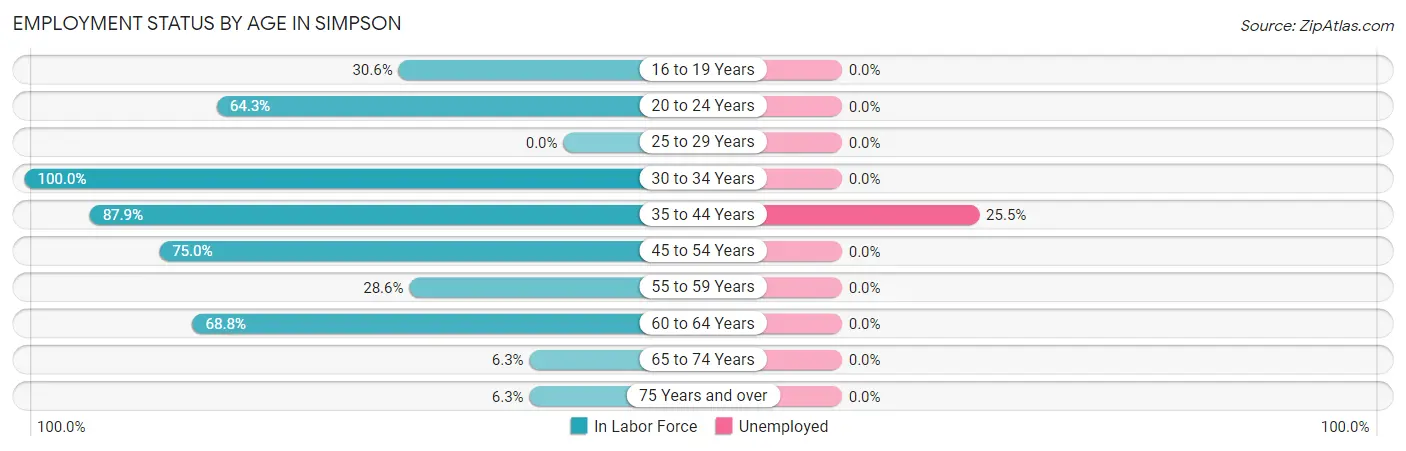
| Age Bracket | In Labor Force | Unemployed |
| 16 to 19 Years | 11 (30.6%) | 0 (0.0%) |
| 20 to 24 Years | 18 (64.3%) | 0 (0.0%) |
| 25 to 29 Years | 0 (0.0%) | 0 (0.0%) |
| 30 to 34 Years | 22 (100.0%) | 0 (0.0%) |
| 35 to 44 Years | 51 (87.9%) | 13 (25.5%) |
| 45 to 54 Years | 57 (75.0%) | 0 (0.0%) |
| 55 to 59 Years | 12 (28.6%) | 0 (0.0%) |
| 60 to 64 Years | 11 (68.8%) | 0 (0.0%) |
| 65 to 74 Years | 2 (6.3%) | 0 (0.0%) |
| 75 Years and over | 1 (6.3%) | 0 (0.0%) |
| Total | 185 (56.1%) | 13 (7.0%) |
Employment Status by Educational Attainment in Simpson
According to labor force statistics for Simpson, 70.2% of individuals (153) out of the total population between 25 and 64 years of age (218) are in the labor force, with 8.5% or 13 of them being unemployed. The group with the highest labor force participation rate are those with the educational attainment of bachelor's degree or higher, with 100.0% or 12 individuals in the labor force. Within the labor force, individuals with less than high school education have the highest percentage of unemployment, with 100.0% or 6 of them being unemployed.
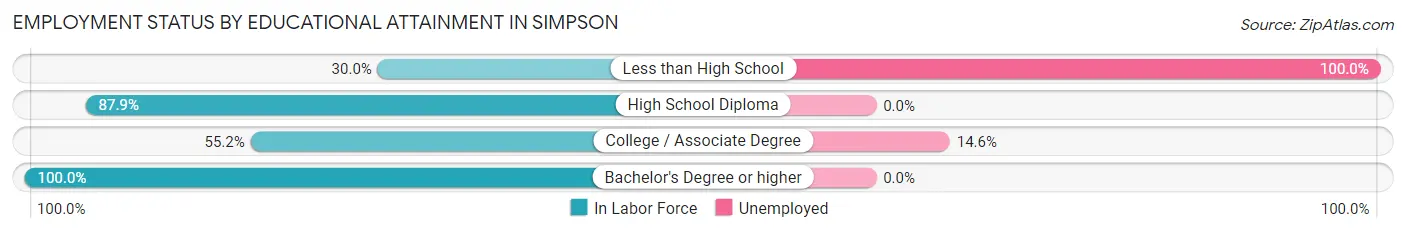
| Educational Attainment | In Labor Force | Unemployed |
| Less than High School | 6 (30.0%) | 20 (100.0%) |
| High School Diploma | 87 (87.9%) | 0 (0.0%) |
| College / Associate Degree | 48 (55.2%) | 13 (14.6%) |
| Bachelor's Degree or higher | 12 (100.0%) | 0 (0.0%) |
| Total | 153 (70.2%) | 19 (8.5%) |
Employment Occupations by Sex in Simpson
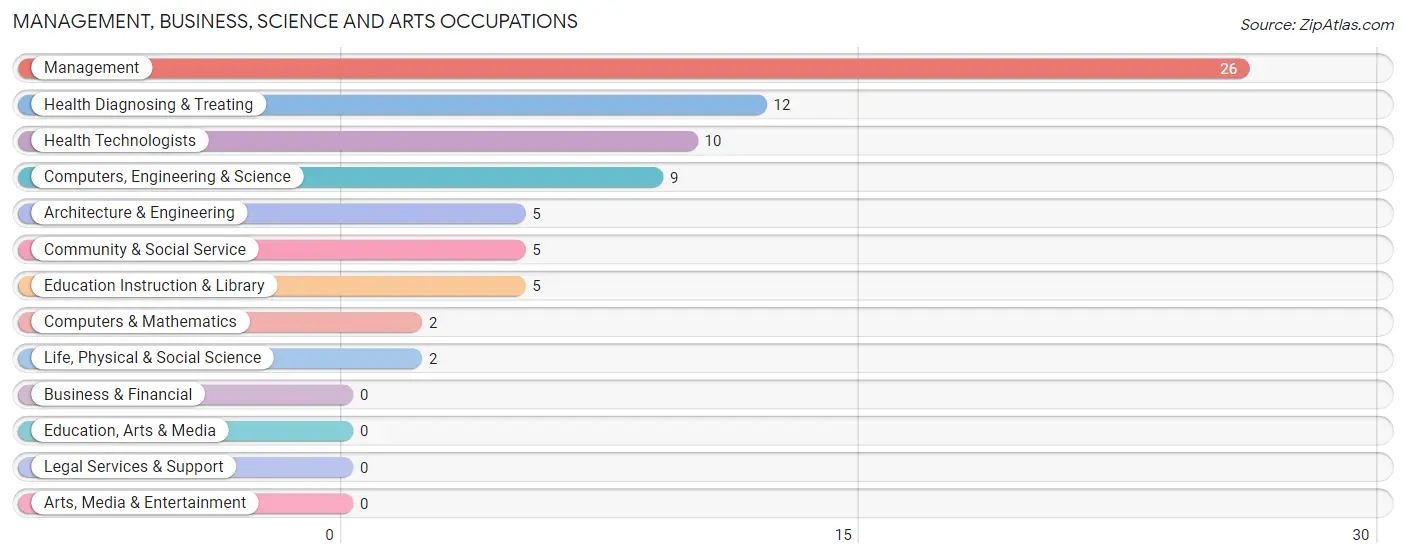
Management, Business, Science and Arts Occupations
The most common Management, Business, Science and Arts occupations in Simpson are Management (26 | 15.1%), Health Diagnosing & Treating (12 | 7.0%), Health Technologists (10 | 5.8%), Computers, Engineering & Science (9 | 5.2%), and Architecture & Engineering (5 | 2.9%).
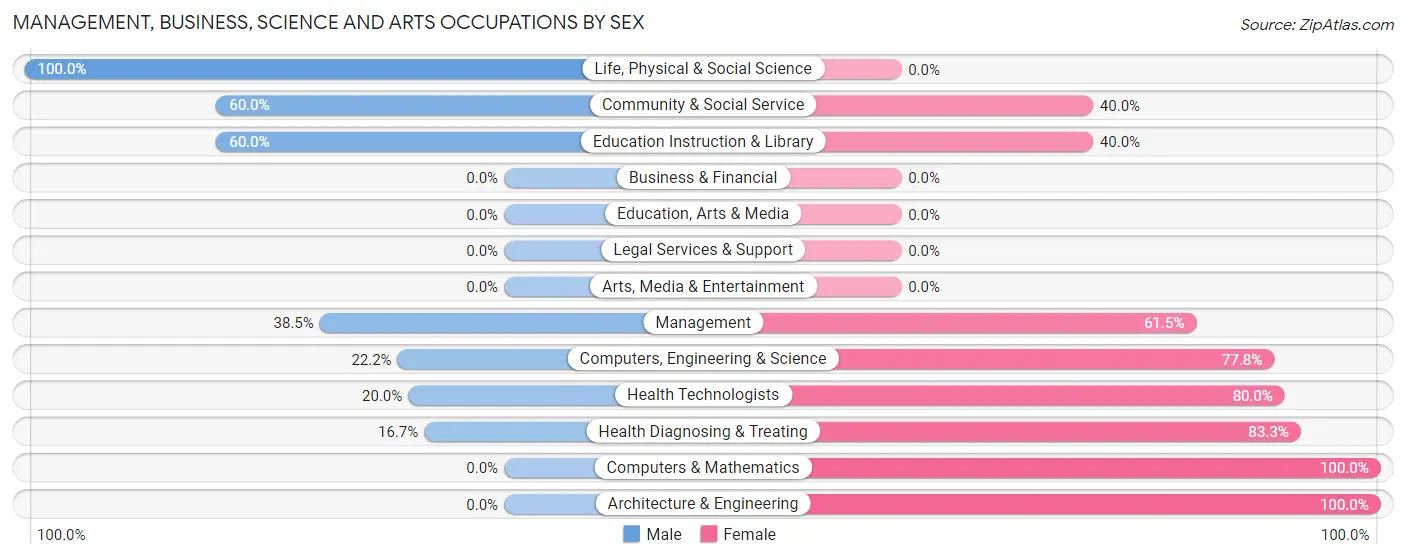
Management, Business, Science and Arts Occupations by Sex
Within the Management, Business, Science and Arts occupations in Simpson, the most male-oriented occupations are Life, Physical & Social Science (100.0%), Community & Social Service (60.0%), and Education Instruction & Library (60.0%), while the most female-oriented occupations are Computers & Mathematics (100.0%), Architecture & Engineering (100.0%), and Health Diagnosing & Treating (83.3%).
| Occupation | Male | Female |
| Management | 10 (38.5%) | 16 (61.5%) |
| Business & Financial | 0 (0.0%) | 0 (0.0%) |
| Computers, Engineering & Science | 2 (22.2%) | 7 (77.8%) |
| Computers & Mathematics | 0 (0.0%) | 2 (100.0%) |
| Architecture & Engineering | 0 (0.0%) | 5 (100.0%) |
| Life, Physical & Social Science | 2 (100.0%) | 0 (0.0%) |
| Community & Social Service | 3 (60.0%) | 2 (40.0%) |
| Education, Arts & Media | 0 (0.0%) | 0 (0.0%) |
| Legal Services & Support | 0 (0.0%) | 0 (0.0%) |
| Education Instruction & Library | 3 (60.0%) | 2 (40.0%) |
| Arts, Media & Entertainment | 0 (0.0%) | 0 (0.0%) |
| Health Diagnosing & Treating | 2 (16.7%) | 10 (83.3%) |
| Health Technologists | 2 (20.0%) | 8 (80.0%) |
| Total (Category) | 17 (32.7%) | 35 (67.3%) |
| Total (Overall) | 102 (59.3%) | 70 (40.7%) |
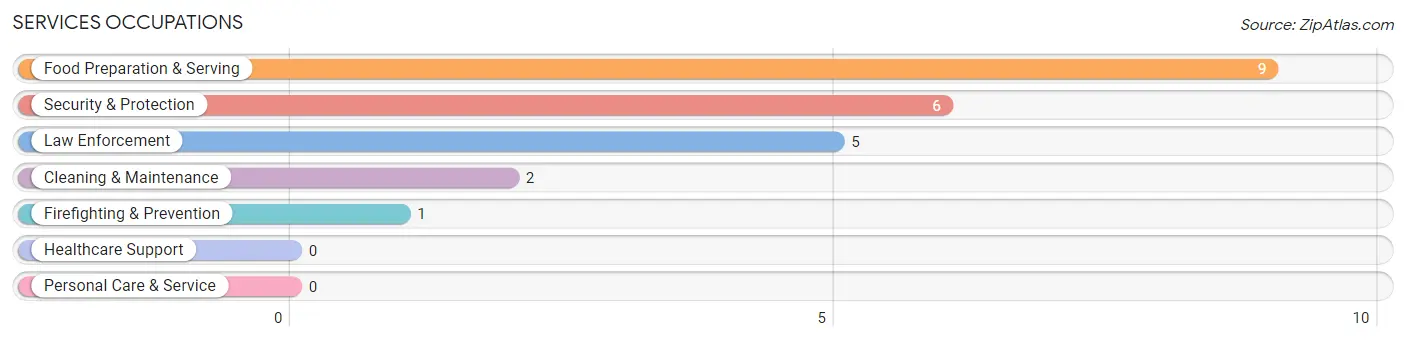
Services Occupations
The most common Services occupations in Simpson are Food Preparation & Serving (9 | 5.2%), Security & Protection (6 | 3.5%), Law Enforcement (5 | 2.9%), Cleaning & Maintenance (2 | 1.2%), and Firefighting & Prevention (1 | 0.6%).
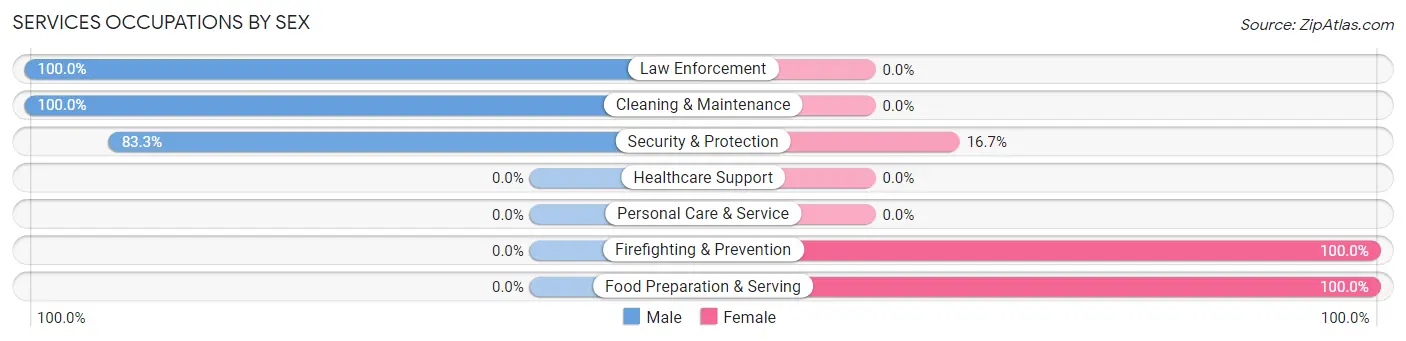
Services Occupations by Sex
Within the Services occupations in Simpson, the most male-oriented occupations are Law Enforcement (100.0%), Cleaning & Maintenance (100.0%), and Security & Protection (83.3%), while the most female-oriented occupations are Firefighting & Prevention (100.0%), Food Preparation & Serving (100.0%), and Security & Protection (16.7%).
| Occupation | Male | Female |
| Healthcare Support | 0 (0.0%) | 0 (0.0%) |
| Security & Protection | 5 (83.3%) | 1 (16.7%) |
| Firefighting & Prevention | 0 (0.0%) | 1 (100.0%) |
| Law Enforcement | 5 (100.0%) | 0 (0.0%) |
| Food Preparation & Serving | 0 (0.0%) | 9 (100.0%) |
| Cleaning & Maintenance | 2 (100.0%) | 0 (0.0%) |
| Personal Care & Service | 0 (0.0%) | 0 (0.0%) |
| Total (Category) | 7 (41.2%) | 10 (58.8%) |
| Total (Overall) | 102 (59.3%) | 70 (40.7%) |
Sales and Office Occupations
The most common Sales and Office occupations in Simpson are Office & Administration (19 | 11.1%), and Sales & Related (12 | 7.0%).
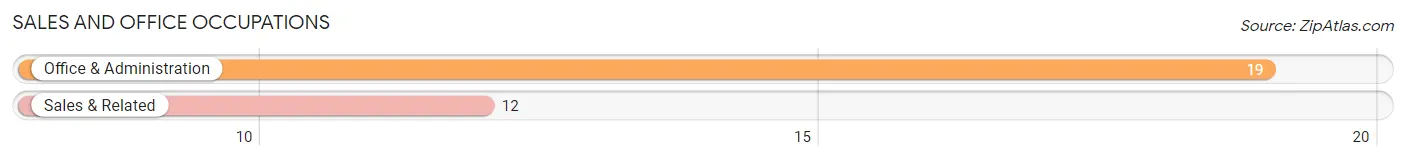
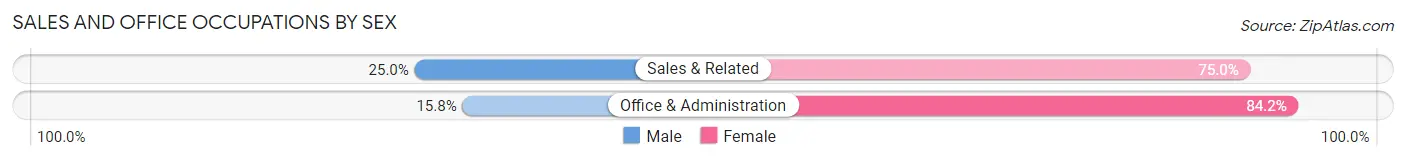
Sales and Office Occupations by Sex
| Occupation | Male | Female |
| Sales & Related | 3 (25.0%) | 9 (75.0%) |
| Office & Administration | 3 (15.8%) | 16 (84.2%) |
| Total (Category) | 6 (19.4%) | 25 (80.6%) |
| Total (Overall) | 102 (59.3%) | 70 (40.7%) |
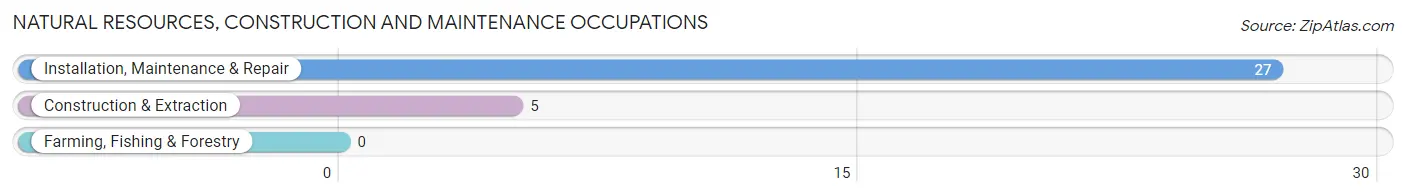
Natural Resources, Construction and Maintenance Occupations
The most common Natural Resources, Construction and Maintenance occupations in Simpson are Installation, Maintenance & Repair (27 | 15.7%), and Construction & Extraction (5 | 2.9%).
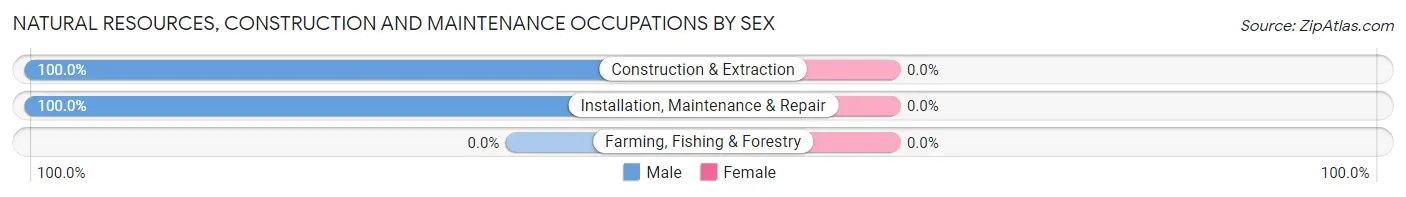
Natural Resources, Construction and Maintenance Occupations by Sex
| Occupation | Male | Female |
| Farming, Fishing & Forestry | 0 (0.0%) | 0 (0.0%) |
| Construction & Extraction | 5 (100.0%) | 0 (0.0%) |
| Installation, Maintenance & Repair | 27 (100.0%) | 0 (0.0%) |
| Total (Category) | 32 (100.0%) | 0 (0.0%) |
| Total (Overall) | 102 (59.3%) | 70 (40.7%) |
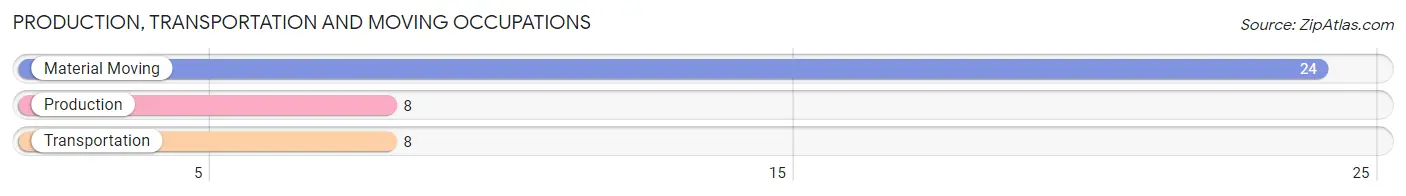
Production, Transportation and Moving Occupations
The most common Production, Transportation and Moving occupations in Simpson are Material Moving (24 | 14.0%), Production (8 | 4.6%), and Transportation (8 | 4.6%).
Production, Transportation and Moving Occupations by Sex
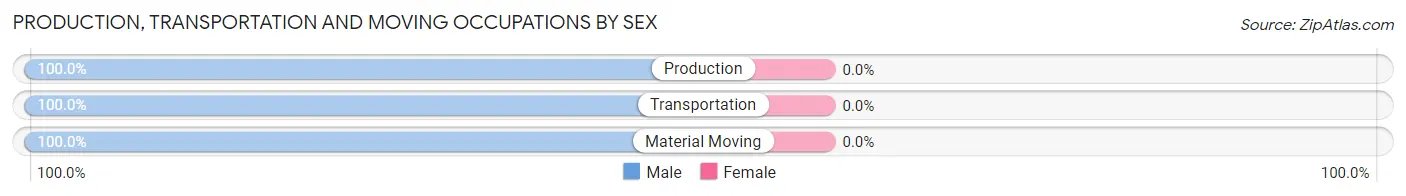
| Occupation | Male | Female |
| Production | 8 (100.0%) | 0 (0.0%) |
| Transportation | 8 (100.0%) | 0 (0.0%) |
| Material Moving | 24 (100.0%) | 0 (0.0%) |
| Total (Category) | 40 (100.0%) | 0 (0.0%) |
| Total (Overall) | 102 (59.3%) | 70 (40.7%) |
Employment Industries by Sex in Simpson
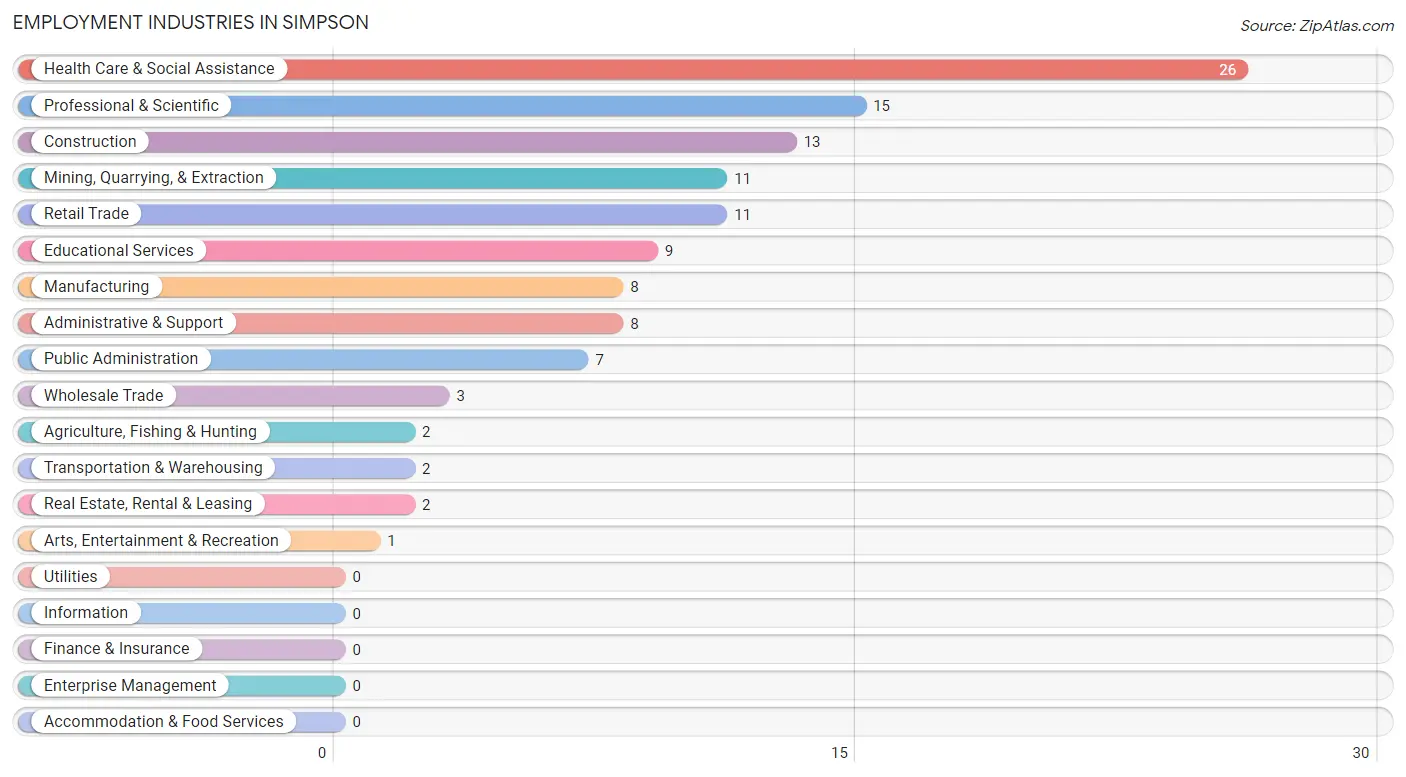
Employment Industries in Simpson
The major employment industries in Simpson include Health Care & Social Assistance (26 | 15.1%), Professional & Scientific (15 | 8.7%), Construction (13 | 7.6%), Mining, Quarrying, & Extraction (11 | 6.4%), and Retail Trade (11 | 6.4%).
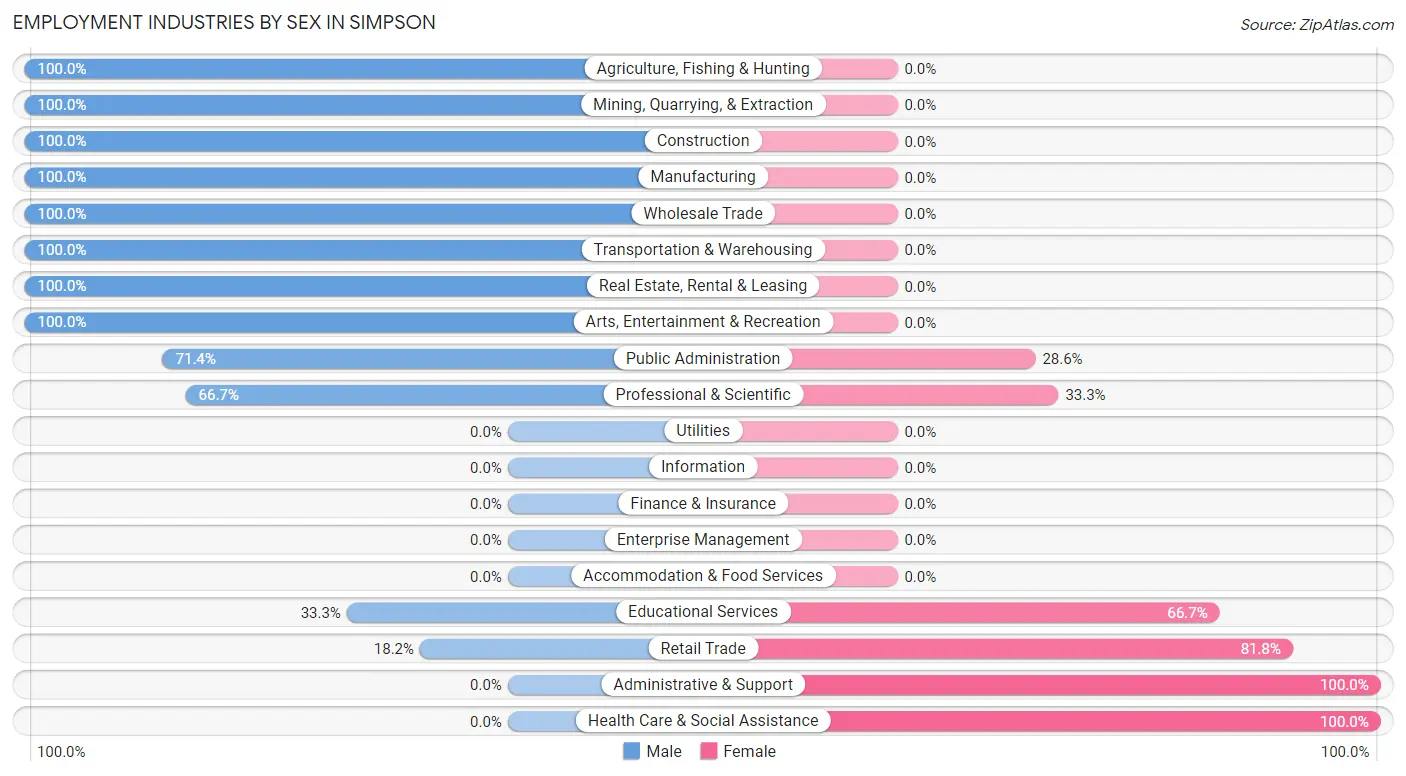
Employment Industries by Sex in Simpson
The Simpson industries that see more men than women are Agriculture, Fishing & Hunting (100.0%), Mining, Quarrying, & Extraction (100.0%), and Construction (100.0%), whereas the industries that tend to have a higher number of women are Administrative & Support (100.0%), Health Care & Social Assistance (100.0%), and Retail Trade (81.8%).
| Industry | Male | Female |
| Agriculture, Fishing & Hunting | 2 (100.0%) | 0 (0.0%) |
| Mining, Quarrying, & Extraction | 11 (100.0%) | 0 (0.0%) |
| Construction | 13 (100.0%) | 0 (0.0%) |
| Manufacturing | 8 (100.0%) | 0 (0.0%) |
| Wholesale Trade | 3 (100.0%) | 0 (0.0%) |
| Retail Trade | 2 (18.2%) | 9 (81.8%) |
| Transportation & Warehousing | 2 (100.0%) | 0 (0.0%) |
| Utilities | 0 (0.0%) | 0 (0.0%) |
| Information | 0 (0.0%) | 0 (0.0%) |
| Finance & Insurance | 0 (0.0%) | 0 (0.0%) |
| Real Estate, Rental & Leasing | 2 (100.0%) | 0 (0.0%) |
| Professional & Scientific | 10 (66.7%) | 5 (33.3%) |
| Enterprise Management | 0 (0.0%) | 0 (0.0%) |
| Administrative & Support | 0 (0.0%) | 8 (100.0%) |
| Educational Services | 3 (33.3%) | 6 (66.7%) |
| Health Care & Social Assistance | 0 (0.0%) | 26 (100.0%) |
| Arts, Entertainment & Recreation | 1 (100.0%) | 0 (0.0%) |
| Accommodation & Food Services | 0 (0.0%) | 0 (0.0%) |
| Public Administration | 5 (71.4%) | 2 (28.6%) |
| Total | 102 (59.3%) | 70 (40.7%) |
Education in Simpson
School Enrollment in Simpson
The most common levels of schooling among the 91 students in Simpson are high school (23 | 25.3%), college / undergraduate (22 | 24.2%), and elementary school (18 | 19.8%).
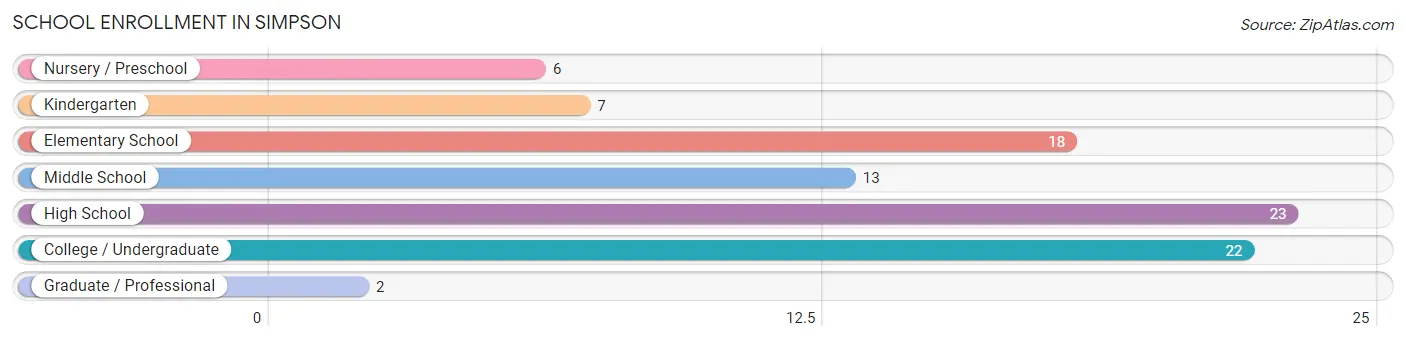
| School Level | # Students | % Students |
| Nursery / Preschool | 6 | 6.6% |
| Kindergarten | 7 | 7.7% |
| Elementary School | 18 | 19.8% |
| Middle School | 13 | 14.3% |
| High School | 23 | 25.3% |
| College / Undergraduate | 22 | 24.2% |
| Graduate / Professional | 2 | 2.2% |
| Total | 91 | 100.0% |
School Enrollment by Age by Funding Source in Simpson
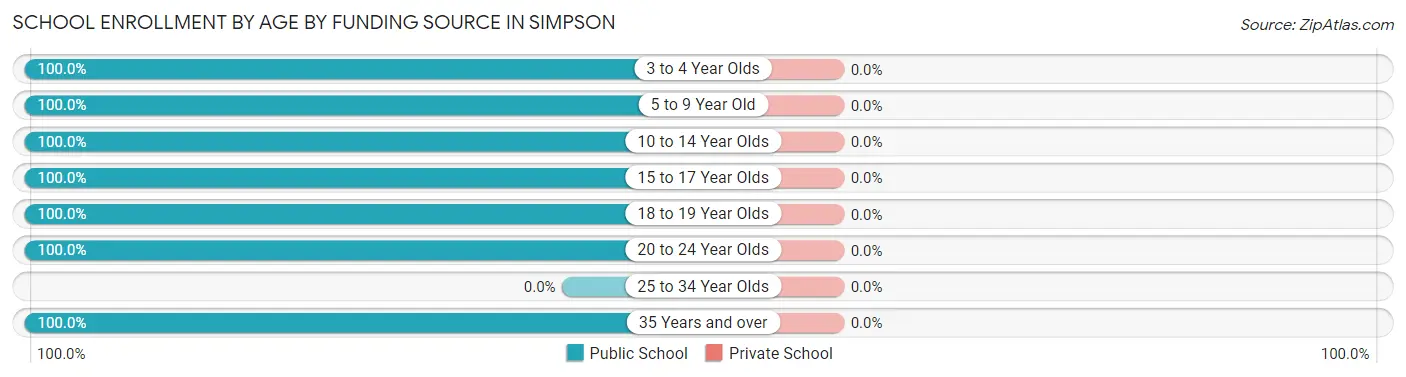
| Age Bracket | Public School | Private School |
| 3 to 4 Year Olds | 6 (100.0%) | 0 (0.0%) |
| 5 to 9 Year Old | 25 (100.0%) | 0 (0.0%) |
| 10 to 14 Year Olds | 13 (100.0%) | 0 (0.0%) |
| 15 to 17 Year Olds | 9 (100.0%) | 0 (0.0%) |
| 18 to 19 Year Olds | 16 (100.0%) | 0 (0.0%) |
| 20 to 24 Year Olds | 18 (100.0%) | 0 (0.0%) |
| 25 to 34 Year Olds | 0 (0.0%) | 0 (0.0%) |
| 35 Years and over | 4 (100.0%) | 0 (0.0%) |
| Total | 91 (100.0%) | 0 (0.0%) |
Educational Attainment by Field of Study in Simpson
Business (8 | 33.3%), education (7 | 29.2%), physical & health sciences (3 | 12.5%), science & technology (3 | 12.5%), and liberal arts & history (3 | 12.5%) are the most common fields of study among 24 individuals in Simpson who have obtained a bachelor's degree or higher.
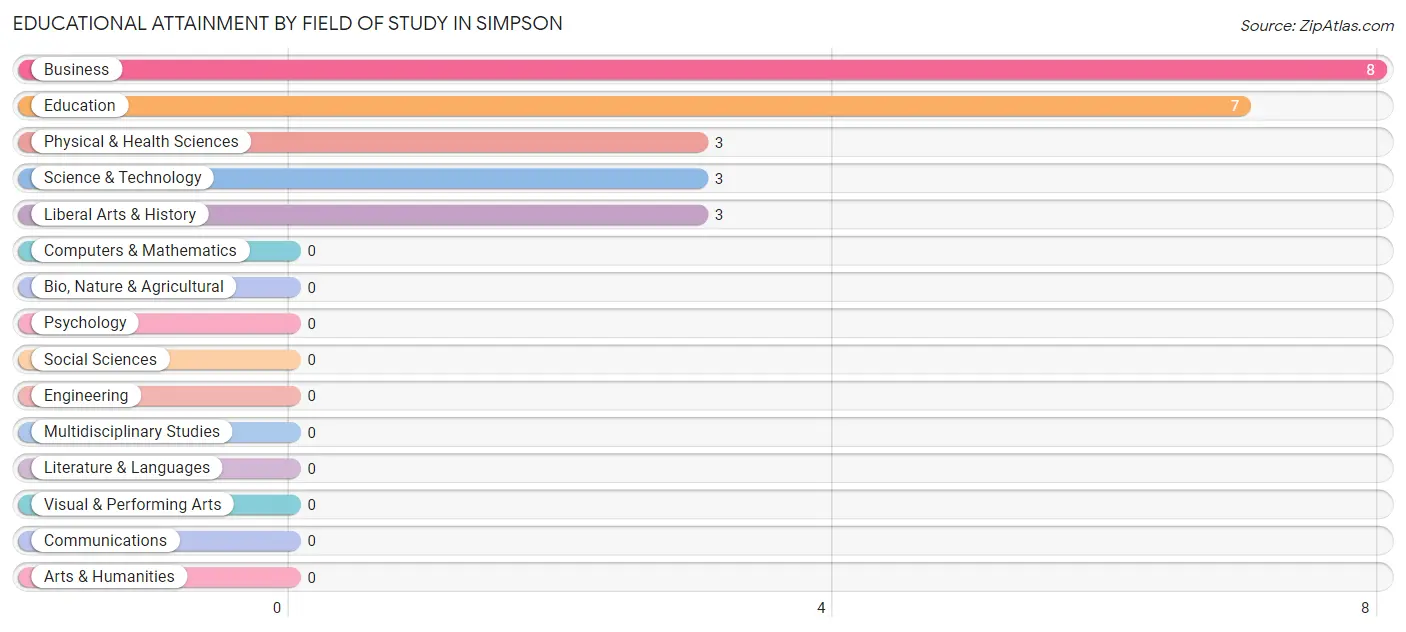
| Field of Study | # Graduates | % Graduates |
| Computers & Mathematics | 0 | 0.0% |
| Bio, Nature & Agricultural | 0 | 0.0% |
| Physical & Health Sciences | 3 | 12.5% |
| Psychology | 0 | 0.0% |
| Social Sciences | 0 | 0.0% |
| Engineering | 0 | 0.0% |
| Multidisciplinary Studies | 0 | 0.0% |
| Science & Technology | 3 | 12.5% |
| Business | 8 | 33.3% |
| Education | 7 | 29.2% |
| Literature & Languages | 0 | 0.0% |
| Liberal Arts & History | 3 | 12.5% |
| Visual & Performing Arts | 0 | 0.0% |
| Communications | 0 | 0.0% |
| Arts & Humanities | 0 | 0.0% |
| Total | 24 | 100.0% |
Transportation & Commute in Simpson
Vehicle Availability by Sex in Simpson
The most prevalent vehicle ownership categories in Simpson are males with 3 vehicles (36, accounting for 35.6%) and females with 3 vehicles (23, making up 51.4%).
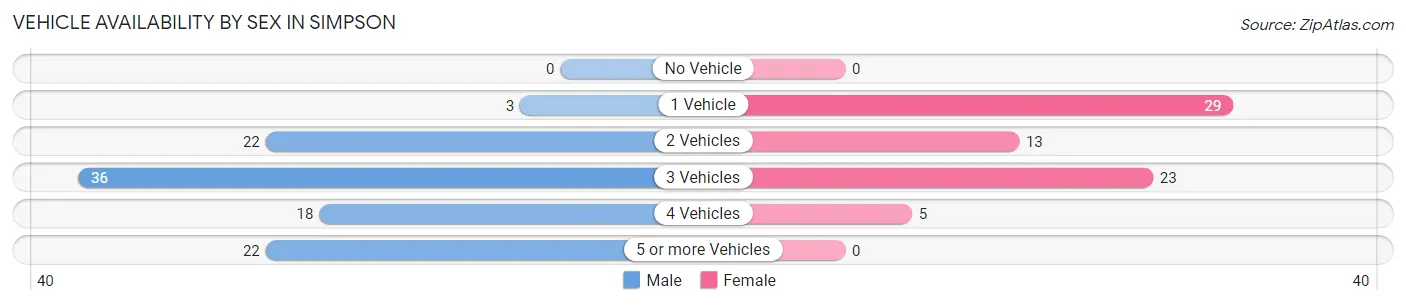
| Vehicles Available | Male | Female |
| No Vehicle | 0 (0.0%) | 0 (0.0%) |
| 1 Vehicle | 3 (3.0%) | 29 (41.4%) |
| 2 Vehicles | 22 (21.8%) | 13 (18.6%) |
| 3 Vehicles | 36 (35.6%) | 23 (32.9%) |
| 4 Vehicles | 18 (17.8%) | 5 (7.1%) |
| 5 or more Vehicles | 22 (21.8%) | 0 (0.0%) |
| Total | 101 (100.0%) | 70 (100.0%) |
Commute Time in Simpson
The most frequently occuring commute durations in Simpson are 30 to 34 minutes (43 commuters, 26.2%), 20 to 24 minutes (28 commuters, 17.1%), and 25 to 29 minutes (24 commuters, 14.6%).
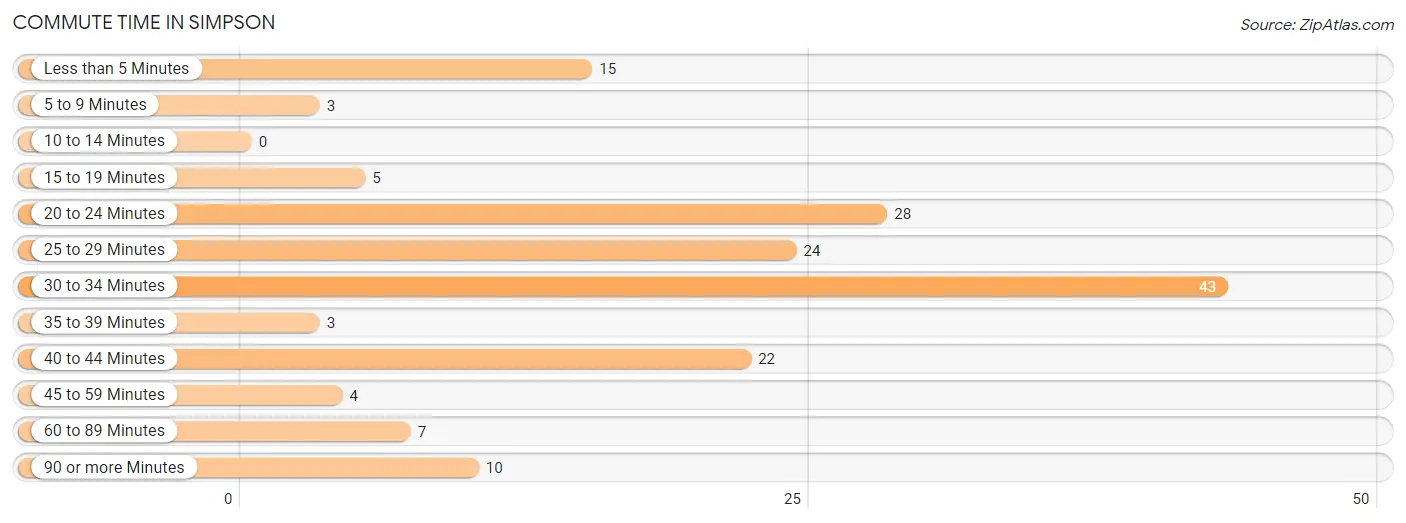
| Commute Time | # Commuters | % Commuters |
| Less than 5 Minutes | 15 | 9.1% |
| 5 to 9 Minutes | 3 | 1.8% |
| 10 to 14 Minutes | 0 | 0.0% |
| 15 to 19 Minutes | 5 | 3.0% |
| 20 to 24 Minutes | 28 | 17.1% |
| 25 to 29 Minutes | 24 | 14.6% |
| 30 to 34 Minutes | 43 | 26.2% |
| 35 to 39 Minutes | 3 | 1.8% |
| 40 to 44 Minutes | 22 | 13.4% |
| 45 to 59 Minutes | 4 | 2.4% |
| 60 to 89 Minutes | 7 | 4.3% |
| 90 or more Minutes | 10 | 6.1% |
Commute Time by Sex in Simpson
The most common commute times in Simpson are 30 to 34 minutes (41 commuters, 40.6%) for males and 25 to 29 minutes (21 commuters, 33.3%) for females.
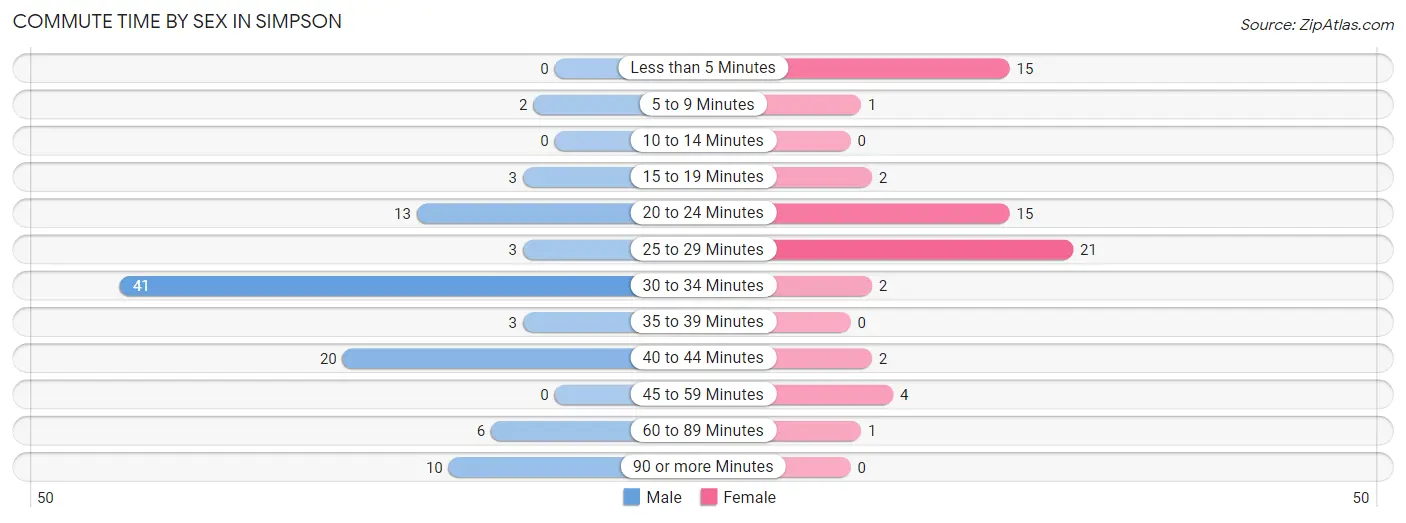
| Commute Time | Male | Female |
| Less than 5 Minutes | 0 (0.0%) | 15 (23.8%) |
| 5 to 9 Minutes | 2 (2.0%) | 1 (1.6%) |
| 10 to 14 Minutes | 0 (0.0%) | 0 (0.0%) |
| 15 to 19 Minutes | 3 (3.0%) | 2 (3.2%) |
| 20 to 24 Minutes | 13 (12.9%) | 15 (23.8%) |
| 25 to 29 Minutes | 3 (3.0%) | 21 (33.3%) |
| 30 to 34 Minutes | 41 (40.6%) | 2 (3.2%) |
| 35 to 39 Minutes | 3 (3.0%) | 0 (0.0%) |
| 40 to 44 Minutes | 20 (19.8%) | 2 (3.2%) |
| 45 to 59 Minutes | 0 (0.0%) | 4 (6.4%) |
| 60 to 89 Minutes | 6 (5.9%) | 1 (1.6%) |
| 90 or more Minutes | 10 (9.9%) | 0 (0.0%) |
Time of Departure to Work by Sex in Simpson
The most frequent times of departure to work in Simpson are 6:00 AM to 6:29 AM (43, 42.6%) for males and 12:00 PM to 3:59 PM (21, 33.3%) for females.
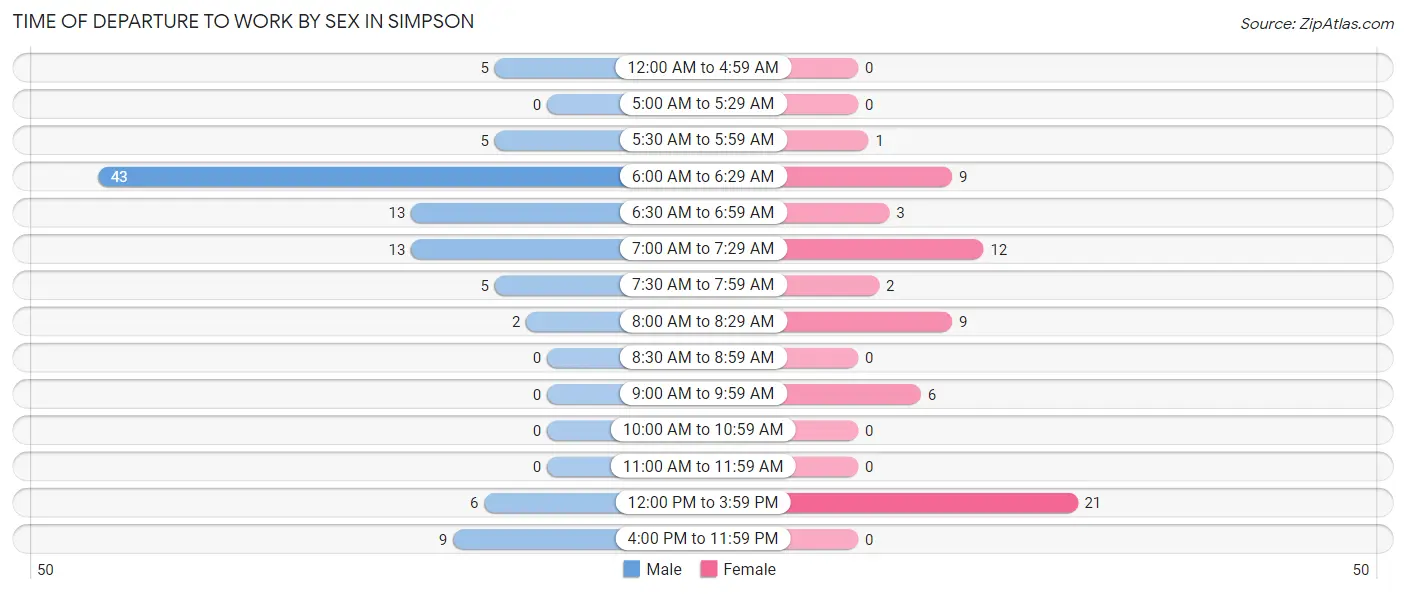
| Time of Departure | Male | Female |
| 12:00 AM to 4:59 AM | 5 (5.0%) | 0 (0.0%) |
| 5:00 AM to 5:29 AM | 0 (0.0%) | 0 (0.0%) |
| 5:30 AM to 5:59 AM | 5 (5.0%) | 1 (1.6%) |
| 6:00 AM to 6:29 AM | 43 (42.6%) | 9 (14.3%) |
| 6:30 AM to 6:59 AM | 13 (12.9%) | 3 (4.8%) |
| 7:00 AM to 7:29 AM | 13 (12.9%) | 12 (19.1%) |
| 7:30 AM to 7:59 AM | 5 (5.0%) | 2 (3.2%) |
| 8:00 AM to 8:29 AM | 2 (2.0%) | 9 (14.3%) |
| 8:30 AM to 8:59 AM | 0 (0.0%) | 0 (0.0%) |
| 9:00 AM to 9:59 AM | 0 (0.0%) | 6 (9.5%) |
| 10:00 AM to 10:59 AM | 0 (0.0%) | 0 (0.0%) |
| 11:00 AM to 11:59 AM | 0 (0.0%) | 0 (0.0%) |
| 12:00 PM to 3:59 PM | 6 (5.9%) | 21 (33.3%) |
| 4:00 PM to 11:59 PM | 9 (8.9%) | 0 (0.0%) |
| Total | 101 (100.0%) | 63 (100.0%) |
Housing Occupancy in Simpson
Occupancy by Ownership in Simpson
Of the total 146 dwellings in Simpson, owner-occupied units account for 130 (89.0%), while renter-occupied units make up 16 (11.0%).
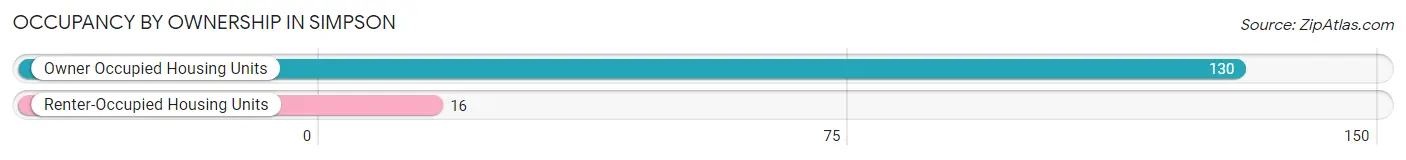
| Occupancy | # Housing Units | % Housing Units |
| Owner Occupied Housing Units | 130 | 89.0% |
| Renter-Occupied Housing Units | 16 | 11.0% |
| Total Occupied Housing Units | 146 | 100.0% |
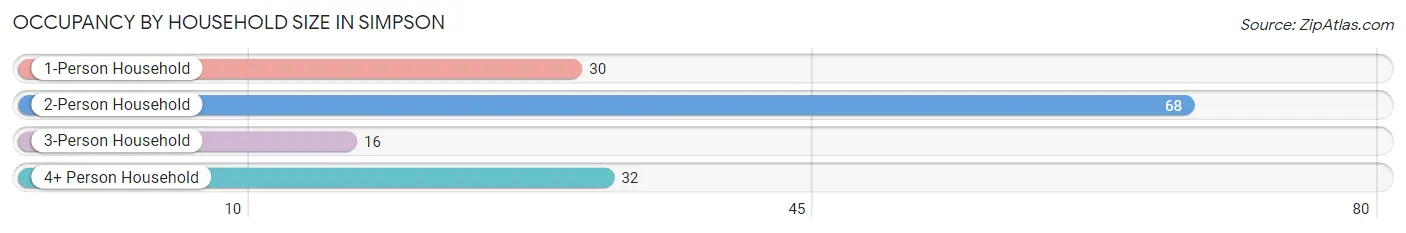
Occupancy by Household Size in Simpson
| Household Size | # Housing Units | % Housing Units |
| 1-Person Household | 30 | 20.5% |
| 2-Person Household | 68 | 46.6% |
| 3-Person Household | 16 | 11.0% |
| 4+ Person Household | 32 | 21.9% |
| Total Housing Units | 146 | 100.0% |
Occupancy by Ownership by Household Size in Simpson
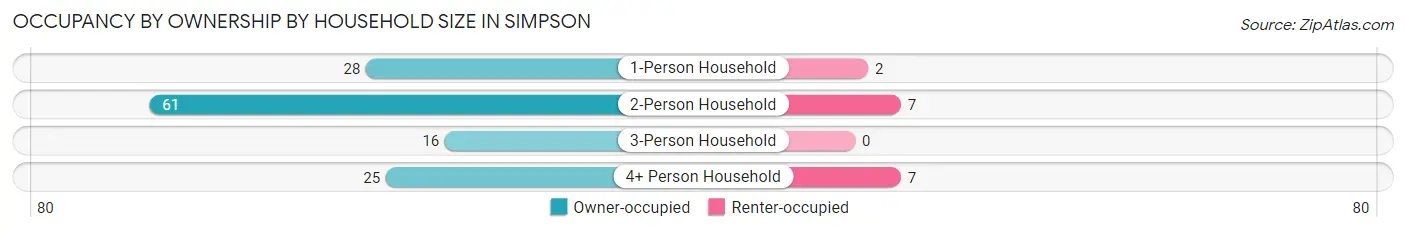
| Household Size | Owner-occupied | Renter-occupied |
| 1-Person Household | 28 (93.3%) | 2 (6.7%) |
| 2-Person Household | 61 (89.7%) | 7 (10.3%) |
| 3-Person Household | 16 (100.0%) | 0 (0.0%) |
| 4+ Person Household | 25 (78.1%) | 7 (21.9%) |
| Total Housing Units | 130 (89.0%) | 16 (11.0%) |
Occupancy by Educational Attainment in Simpson
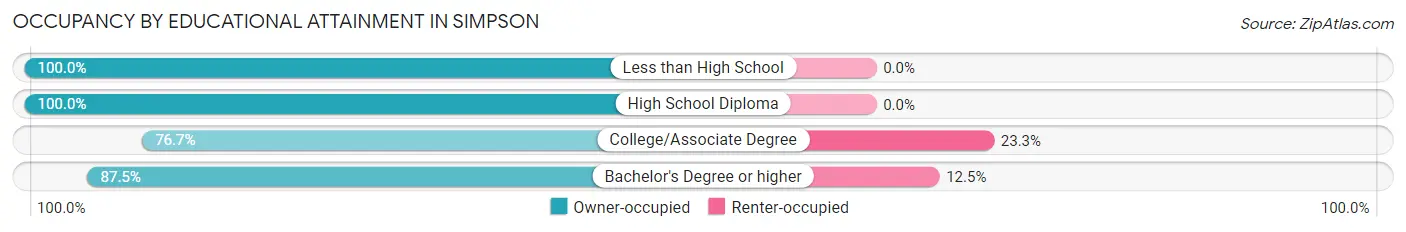
| Household Size | Owner-occupied | Renter-occupied |
| Less than High School | 8 (100.0%) | 0 (0.0%) |
| High School Diploma | 62 (100.0%) | 0 (0.0%) |
| College/Associate Degree | 46 (76.7%) | 14 (23.3%) |
| Bachelor's Degree or higher | 14 (87.5%) | 2 (12.5%) |
Occupancy by Age of Householder in Simpson
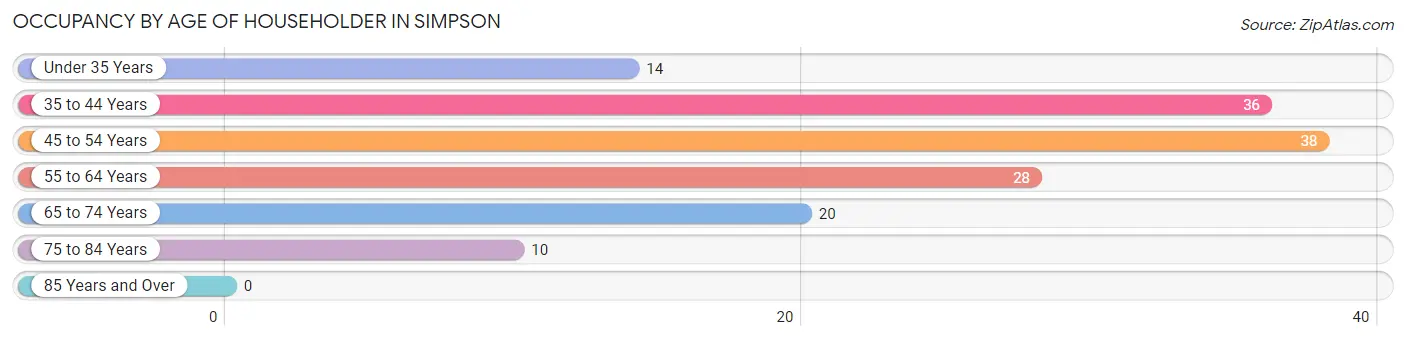
| Age Bracket | # Households | % Households |
| Under 35 Years | 14 | 9.6% |
| 35 to 44 Years | 36 | 24.7% |
| 45 to 54 Years | 38 | 26.0% |
| 55 to 64 Years | 28 | 19.2% |
| 65 to 74 Years | 20 | 13.7% |
| 75 to 84 Years | 10 | 6.9% |
| 85 Years and Over | 0 | 0.0% |
| Total | 146 | 100.0% |
Housing Finances in Simpson
Median Income by Occupancy in Simpson
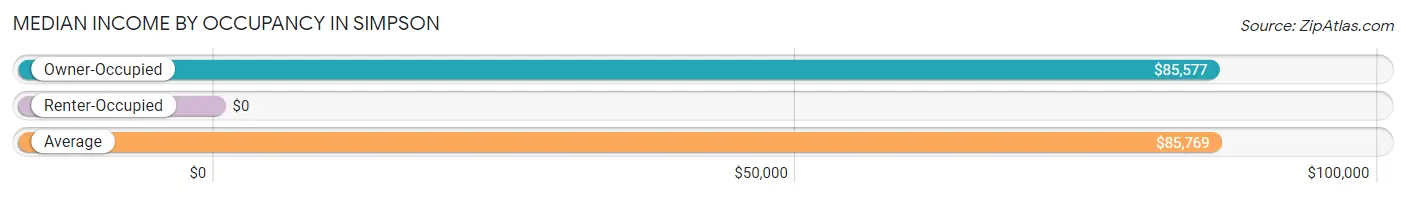
| Occupancy Type | # Households | Median Income |
| Owner-Occupied | 130 (89.0%) | $85,577 |
| Renter-Occupied | 16 (11.0%) | $0 |
| Average | 146 (100.0%) | $85,769 |
Occupancy by Householder Income Bracket in Simpson
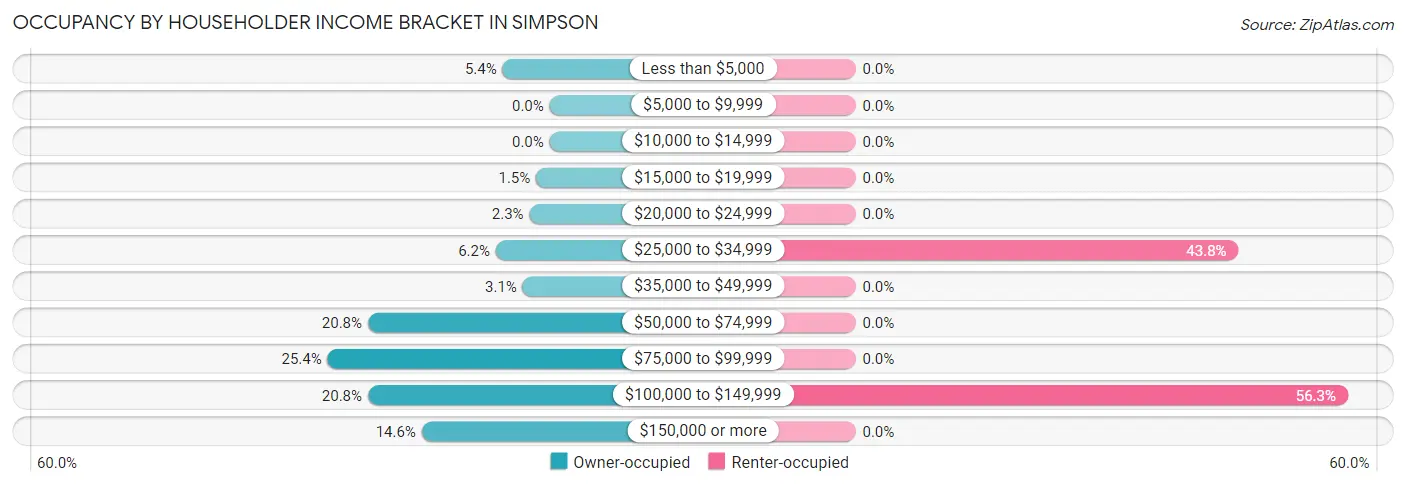
| Income Bracket | Owner-occupied | Renter-occupied |
| Less than $5,000 | 7 (5.4%) | 0 (0.0%) |
| $5,000 to $9,999 | 0 (0.0%) | 0 (0.0%) |
| $10,000 to $14,999 | 0 (0.0%) | 0 (0.0%) |
| $15,000 to $19,999 | 2 (1.5%) | 0 (0.0%) |
| $20,000 to $24,999 | 3 (2.3%) | 0 (0.0%) |
| $25,000 to $34,999 | 8 (6.1%) | 7 (43.8%) |
| $35,000 to $49,999 | 4 (3.1%) | 0 (0.0%) |
| $50,000 to $74,999 | 27 (20.8%) | 0 (0.0%) |
| $75,000 to $99,999 | 33 (25.4%) | 0 (0.0%) |
| $100,000 to $149,999 | 27 (20.8%) | 9 (56.2%) |
| $150,000 or more | 19 (14.6%) | 0 (0.0%) |
| Total | 130 (100.0%) | 16 (100.0%) |
Monthly Housing Cost Tiers in Simpson
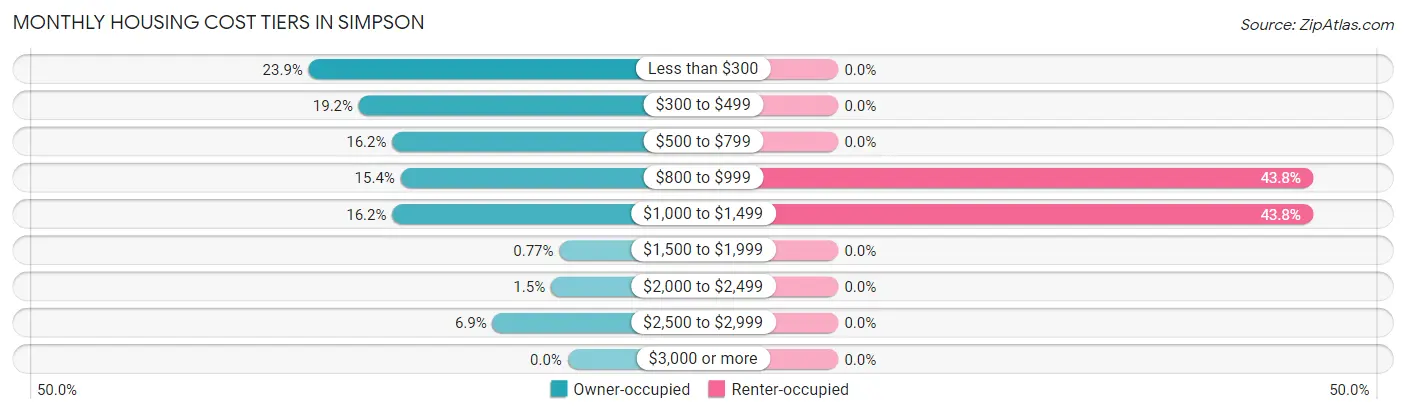
| Monthly Cost | Owner-occupied | Renter-occupied |
| Less than $300 | 31 (23.8%) | 0 (0.0%) |
| $300 to $499 | 25 (19.2%) | 0 (0.0%) |
| $500 to $799 | 21 (16.2%) | 0 (0.0%) |
| $800 to $999 | 20 (15.4%) | 7 (43.8%) |
| $1,000 to $1,499 | 21 (16.2%) | 7 (43.8%) |
| $1,500 to $1,999 | 1 (0.8%) | 0 (0.0%) |
| $2,000 to $2,499 | 2 (1.5%) | 0 (0.0%) |
| $2,500 to $2,999 | 9 (6.9%) | 0 (0.0%) |
| $3,000 or more | 0 (0.0%) | 0 (0.0%) |
| Total | 130 (100.0%) | 16 (100.0%) |
Physical Housing Characteristics in Simpson
Housing Structures in Simpson
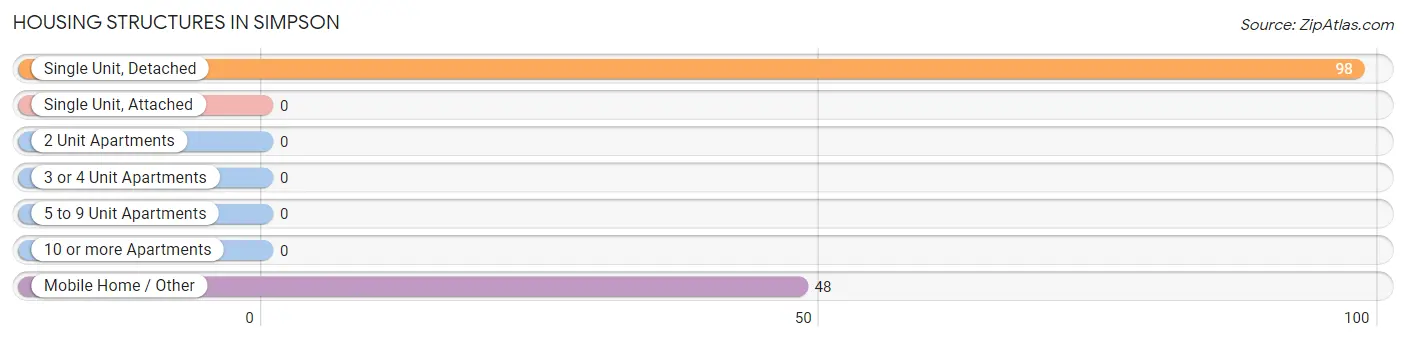
| Structure Type | # Housing Units | % Housing Units |
| Single Unit, Detached | 98 | 67.1% |
| Single Unit, Attached | 0 | 0.0% |
| 2 Unit Apartments | 0 | 0.0% |
| 3 or 4 Unit Apartments | 0 | 0.0% |
| 5 to 9 Unit Apartments | 0 | 0.0% |
| 10 or more Apartments | 0 | 0.0% |
| Mobile Home / Other | 48 | 32.9% |
| Total | 146 | 100.0% |
Housing Structures by Occupancy in Simpson
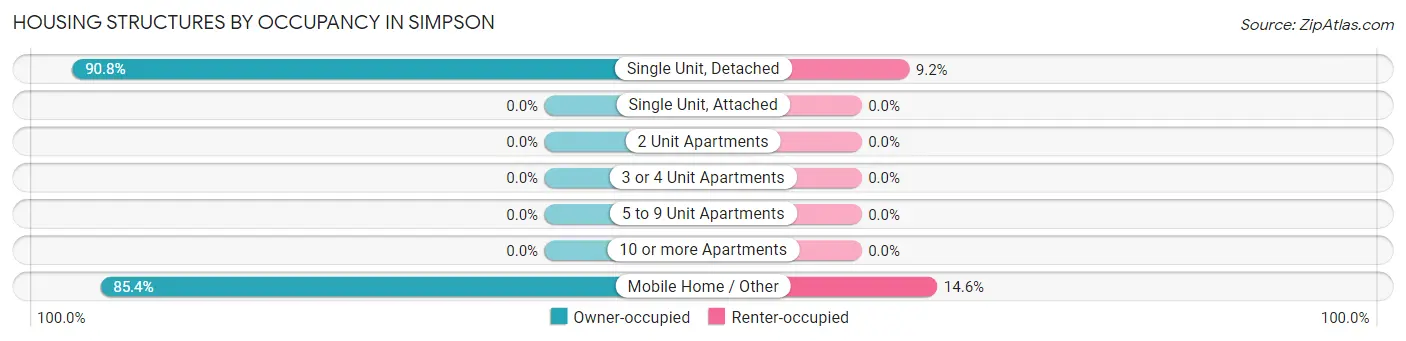
| Structure Type | Owner-occupied | Renter-occupied |
| Single Unit, Detached | 89 (90.8%) | 9 (9.2%) |
| Single Unit, Attached | 0 (0.0%) | 0 (0.0%) |
| 2 Unit Apartments | 0 (0.0%) | 0 (0.0%) |
| 3 or 4 Unit Apartments | 0 (0.0%) | 0 (0.0%) |
| 5 to 9 Unit Apartments | 0 (0.0%) | 0 (0.0%) |
| 10 or more Apartments | 0 (0.0%) | 0 (0.0%) |
| Mobile Home / Other | 41 (85.4%) | 7 (14.6%) |
| Total | 130 (89.0%) | 16 (11.0%) |
Housing Structures by Number of Rooms in Simpson
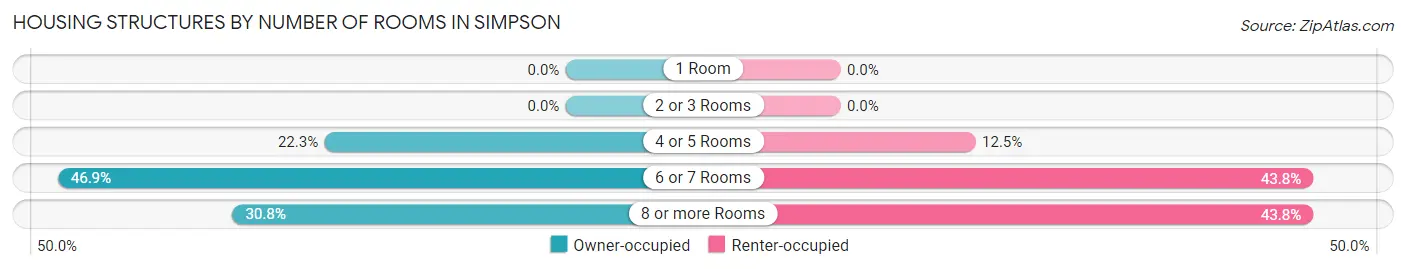
| Number of Rooms | Owner-occupied | Renter-occupied |
| 1 Room | 0 (0.0%) | 0 (0.0%) |
| 2 or 3 Rooms | 0 (0.0%) | 0 (0.0%) |
| 4 or 5 Rooms | 29 (22.3%) | 2 (12.5%) |
| 6 or 7 Rooms | 61 (46.9%) | 7 (43.8%) |
| 8 or more Rooms | 40 (30.8%) | 7 (43.8%) |
| Total | 130 (100.0%) | 16 (100.0%) |
Housing Structure by Heating Type in Simpson
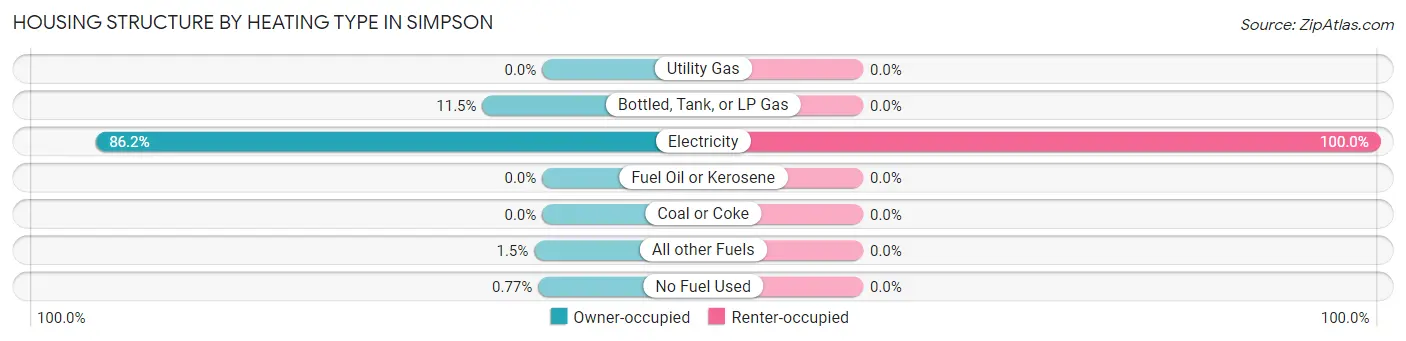
| Heating Type | Owner-occupied | Renter-occupied |
| Utility Gas | 0 (0.0%) | 0 (0.0%) |
| Bottled, Tank, or LP Gas | 15 (11.5%) | 0 (0.0%) |
| Electricity | 112 (86.2%) | 16 (100.0%) |
| Fuel Oil or Kerosene | 0 (0.0%) | 0 (0.0%) |
| Coal or Coke | 0 (0.0%) | 0 (0.0%) |
| All other Fuels | 2 (1.5%) | 0 (0.0%) |
| No Fuel Used | 1 (0.8%) | 0 (0.0%) |
| Total | 130 (100.0%) | 16 (100.0%) |
Household Vehicle Usage in Simpson
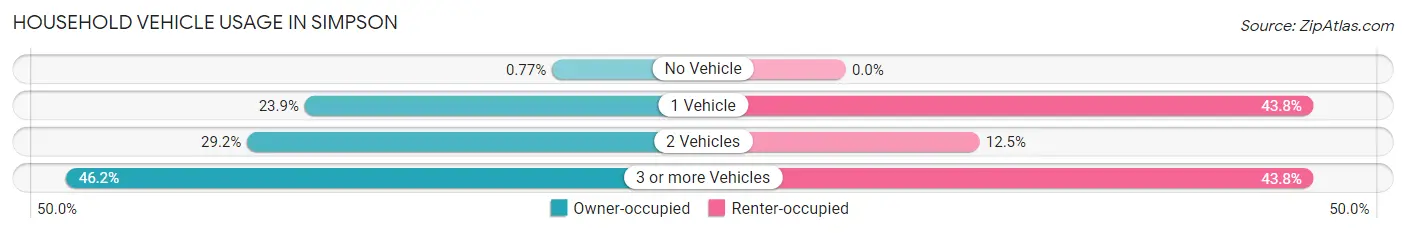
| Vehicles per Household | Owner-occupied | Renter-occupied |
| No Vehicle | 1 (0.8%) | 0 (0.0%) |
| 1 Vehicle | 31 (23.8%) | 7 (43.8%) |
| 2 Vehicles | 38 (29.2%) | 2 (12.5%) |
| 3 or more Vehicles | 60 (46.2%) | 7 (43.8%) |
| Total | 130 (100.0%) | 16 (100.0%) |
Real Estate & Mortgages in Simpson
Real Estate and Mortgage Overview in Simpson
| Characteristic | Without Mortgage | With Mortgage |
| Housing Units | 60 | 70 |
| Median Property Value | $159,100 | $0 |
| Median Household Income | $58,125 | $19 |
| Monthly Housing Costs | $405 | $0 |
| Real Estate Taxes | $199 | $52 |
Property Value by Mortgage Status in Simpson
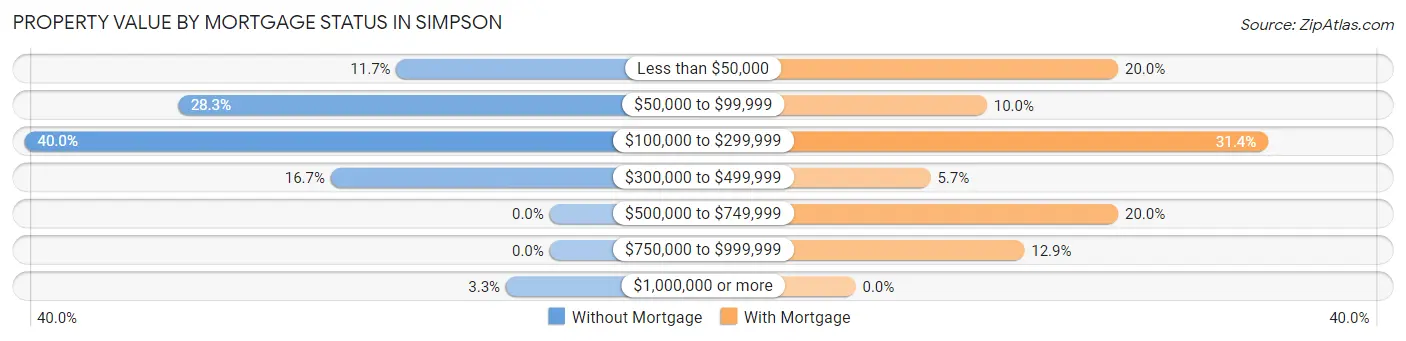
| Property Value | Without Mortgage | With Mortgage |
| Less than $50,000 | 7 (11.7%) | 14 (20.0%) |
| $50,000 to $99,999 | 17 (28.3%) | 7 (10.0%) |
| $100,000 to $299,999 | 24 (40.0%) | 22 (31.4%) |
| $300,000 to $499,999 | 10 (16.7%) | 4 (5.7%) |
| $500,000 to $749,999 | 0 (0.0%) | 14 (20.0%) |
| $750,000 to $999,999 | 0 (0.0%) | 9 (12.9%) |
| $1,000,000 or more | 2 (3.3%) | 0 (0.0%) |
| Total | 60 (100.0%) | 70 (100.0%) |
Household Income by Mortgage Status in Simpson
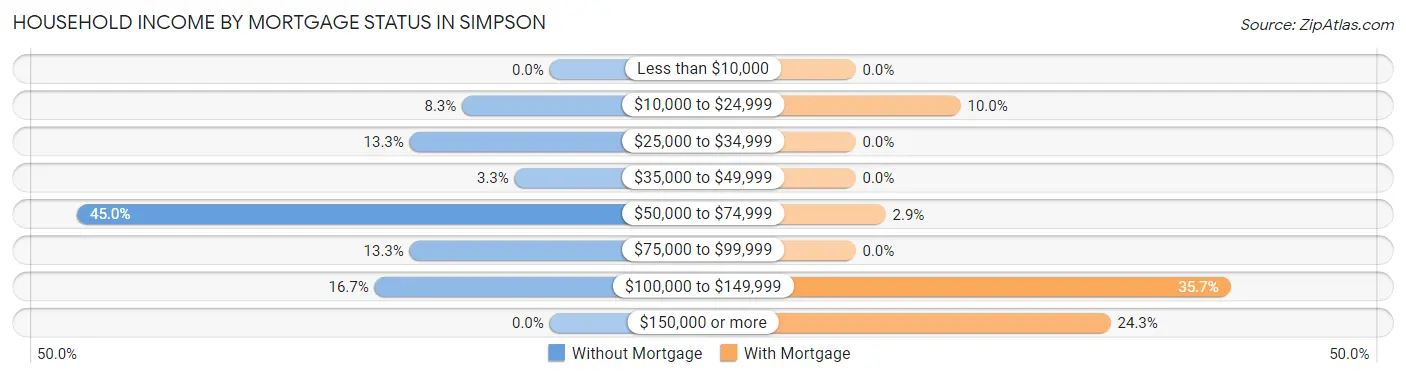
| Household Income | Without Mortgage | With Mortgage |
| Less than $10,000 | 0 (0.0%) | 0 (0.0%) |
| $10,000 to $24,999 | 5 (8.3%) | 7 (10.0%) |
| $25,000 to $34,999 | 8 (13.3%) | 0 (0.0%) |
| $35,000 to $49,999 | 2 (3.3%) | 0 (0.0%) |
| $50,000 to $74,999 | 27 (45.0%) | 2 (2.9%) |
| $75,000 to $99,999 | 8 (13.3%) | 0 (0.0%) |
| $100,000 to $149,999 | 10 (16.7%) | 25 (35.7%) |
| $150,000 or more | 0 (0.0%) | 17 (24.3%) |
| Total | 60 (100.0%) | 70 (100.0%) |
Property Value to Household Income Ratio in Simpson
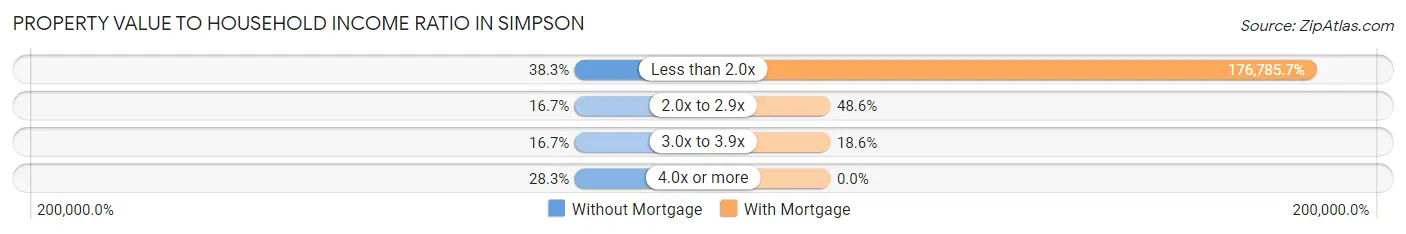
| Value-to-Income Ratio | Without Mortgage | With Mortgage |
| Less than 2.0x | 23 (38.3%) | 123,750 (176,785.7%) |
| 2.0x to 2.9x | 10 (16.7%) | 34 (48.6%) |
| 3.0x to 3.9x | 10 (16.7%) | 13 (18.6%) |
| 4.0x or more | 17 (28.3%) | 0 (0.0%) |
| Total | 60 (100.0%) | 70 (100.0%) |
Real Estate Taxes by Mortgage Status in Simpson
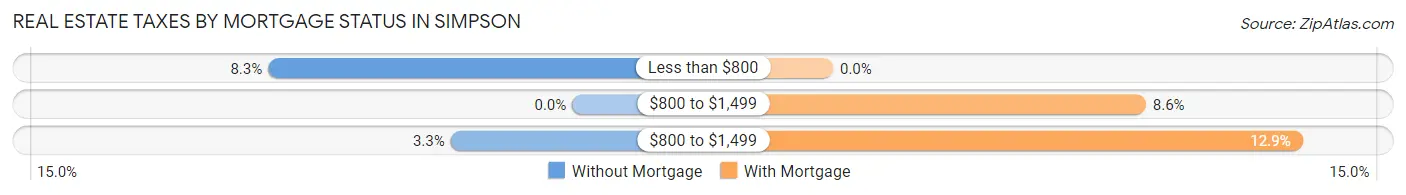
| Property Taxes | Without Mortgage | With Mortgage |
| Less than $800 | 5 (8.3%) | 0 (0.0%) |
| $800 to $1,499 | 0 (0.0%) | 6 (8.6%) |
| $800 to $1,499 | 2 (3.3%) | 9 (12.9%) |
| Total | 60 (100.0%) | 70 (100.0%) |
Health & Disability in Simpson
Health Insurance Coverage by Age in Simpson
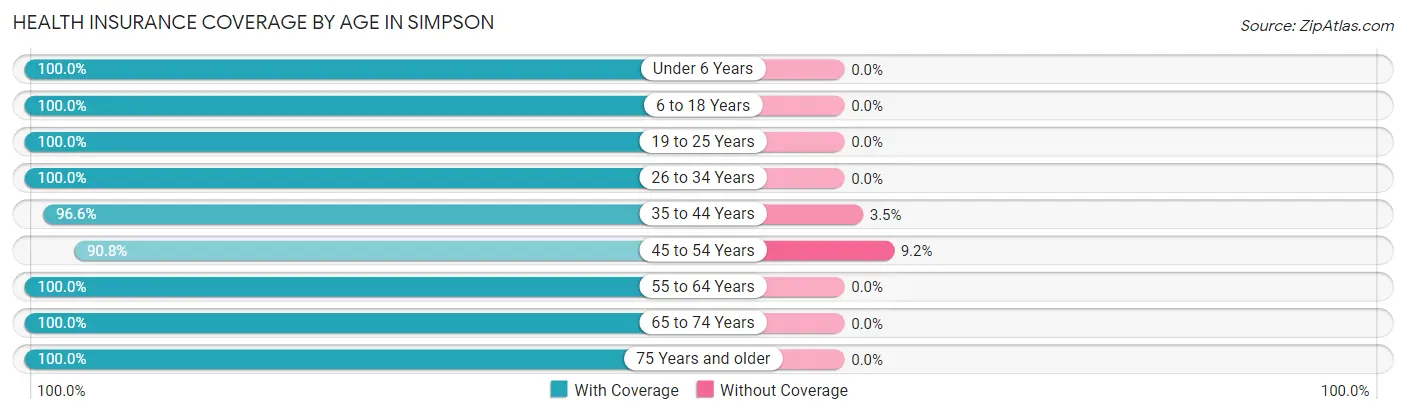
| Age Bracket | With Coverage | Without Coverage |
| Under 6 Years | 25 (100.0%) | 0 (0.0%) |
| 6 to 18 Years | 64 (100.0%) | 0 (0.0%) |
| 19 to 25 Years | 34 (100.0%) | 0 (0.0%) |
| 26 to 34 Years | 26 (100.0%) | 0 (0.0%) |
| 35 to 44 Years | 56 (96.6%) | 2 (3.5%) |
| 45 to 54 Years | 69 (90.8%) | 7 (9.2%) |
| 55 to 64 Years | 58 (100.0%) | 0 (0.0%) |
| 65 to 74 Years | 32 (100.0%) | 0 (0.0%) |
| 75 Years and older | 16 (100.0%) | 0 (0.0%) |
| Total | 380 (97.7%) | 9 (2.3%) |
Health Insurance Coverage by Citizenship Status in Simpson
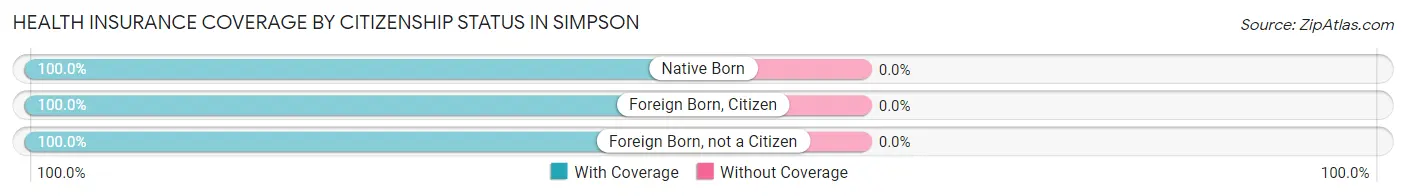
| Citizenship Status | With Coverage | Without Coverage |
| Native Born | 25 (100.0%) | 0 (0.0%) |
| Foreign Born, Citizen | 64 (100.0%) | 0 (0.0%) |
| Foreign Born, not a Citizen | 34 (100.0%) | 0 (0.0%) |
Health Insurance Coverage by Household Income in Simpson
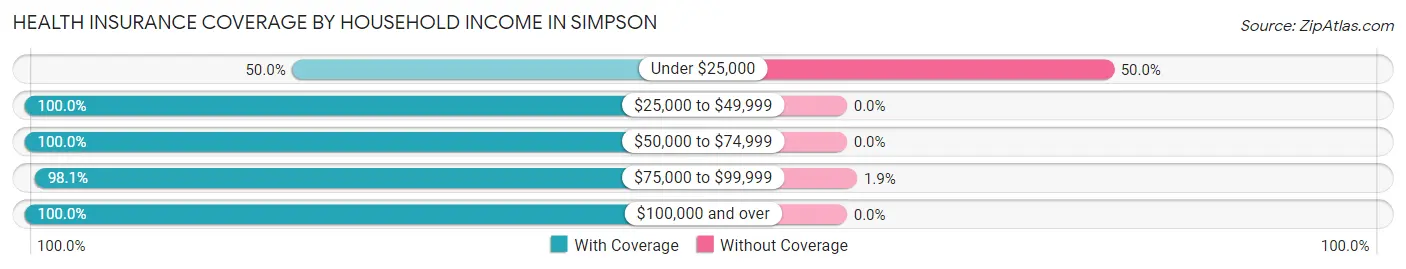
| Household Income | With Coverage | Without Coverage |
| Under $25,000 | 7 (50.0%) | 7 (50.0%) |
| $25,000 to $49,999 | 32 (100.0%) | 0 (0.0%) |
| $50,000 to $74,999 | 56 (100.0%) | 0 (0.0%) |
| $75,000 to $99,999 | 103 (98.1%) | 2 (1.9%) |
| $100,000 and over | 182 (100.0%) | 0 (0.0%) |
Public vs Private Health Insurance Coverage by Age in Simpson
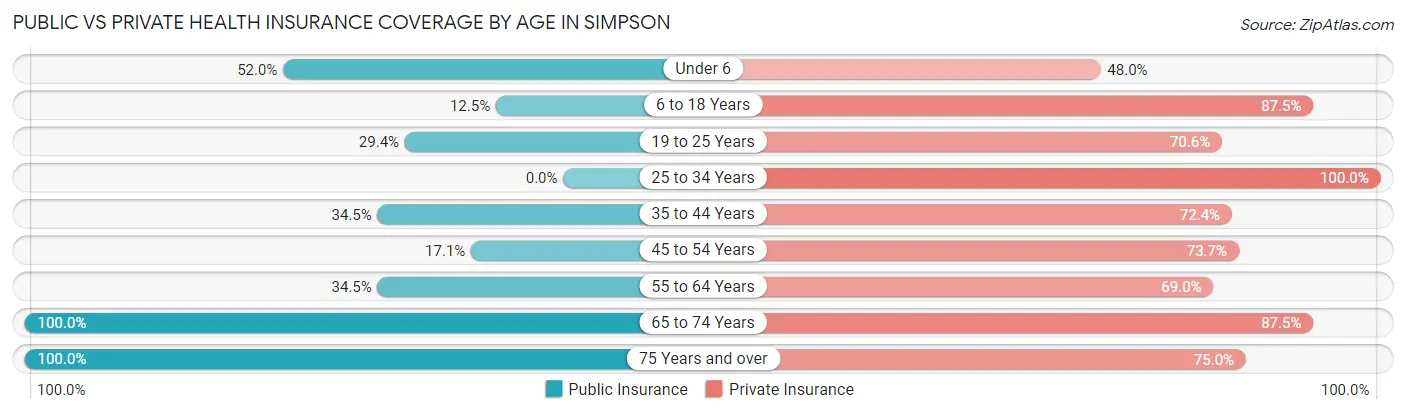
| Age Bracket | Public Insurance | Private Insurance |
| Under 6 | 13 (52.0%) | 12 (48.0%) |
| 6 to 18 Years | 8 (12.5%) | 56 (87.5%) |
| 19 to 25 Years | 10 (29.4%) | 24 (70.6%) |
| 25 to 34 Years | 0 (0.0%) | 26 (100.0%) |
| 35 to 44 Years | 20 (34.5%) | 42 (72.4%) |
| 45 to 54 Years | 13 (17.1%) | 56 (73.7%) |
| 55 to 64 Years | 20 (34.5%) | 40 (69.0%) |
| 65 to 74 Years | 32 (100.0%) | 28 (87.5%) |
| 75 Years and over | 16 (100.0%) | 12 (75.0%) |
| Total | 132 (33.9%) | 296 (76.1%) |
Disability Status by Sex by Age in Simpson
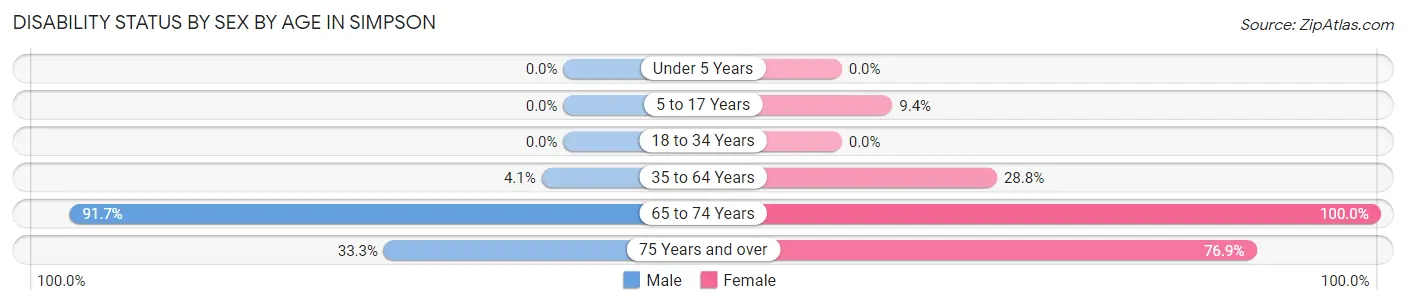
| Age Bracket | Male | Female |
| Under 5 Years | 0 (0.0%) | 0 (0.0%) |
| 5 to 17 Years | 0 (0.0%) | 3 (9.4%) |
| 18 to 34 Years | 0 (0.0%) | 0 (0.0%) |
| 35 to 64 Years | 3 (4.1%) | 34 (28.8%) |
| 65 to 74 Years | 22 (91.7%) | 8 (100.0%) |
| 75 Years and over | 1 (33.3%) | 10 (76.9%) |
Disability Class by Sex by Age in Simpson
Disability Class: Hearing Difficulty
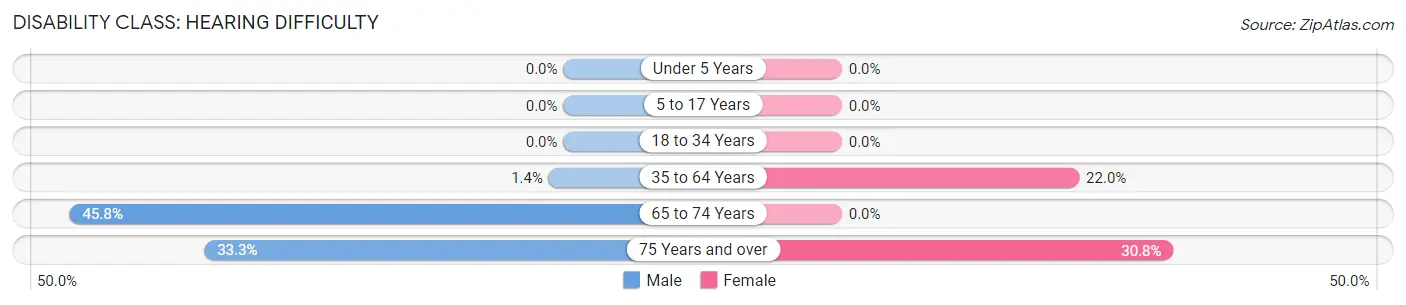
| Age Bracket | Male | Female |
| Under 5 Years | 0 (0.0%) | 0 (0.0%) |
| 5 to 17 Years | 0 (0.0%) | 0 (0.0%) |
| 18 to 34 Years | 0 (0.0%) | 0 (0.0%) |
| 35 to 64 Years | 1 (1.3%) | 26 (22.0%) |
| 65 to 74 Years | 11 (45.8%) | 0 (0.0%) |
| 75 Years and over | 1 (33.3%) | 4 (30.8%) |
Disability Class: Vision Difficulty
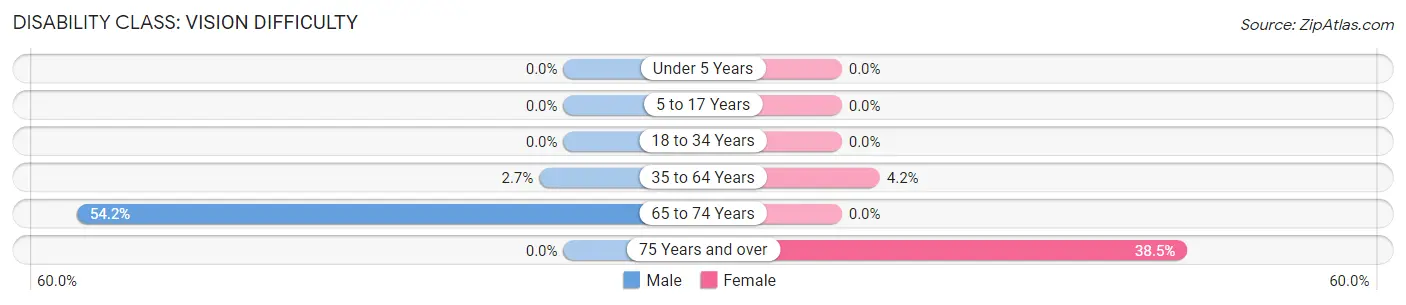
| Age Bracket | Male | Female |
| Under 5 Years | 0 (0.0%) | 0 (0.0%) |
| 5 to 17 Years | 0 (0.0%) | 0 (0.0%) |
| 18 to 34 Years | 0 (0.0%) | 0 (0.0%) |
| 35 to 64 Years | 2 (2.7%) | 5 (4.2%) |
| 65 to 74 Years | 13 (54.2%) | 0 (0.0%) |
| 75 Years and over | 0 (0.0%) | 5 (38.5%) |
Disability Class: Cognitive Difficulty
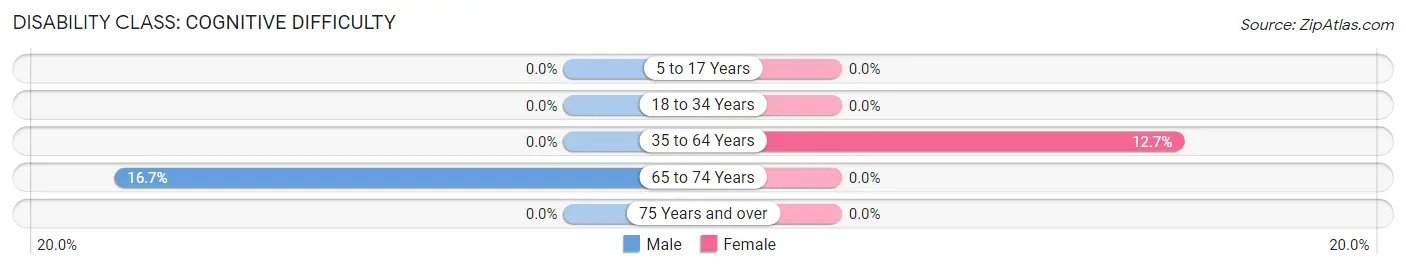
| Age Bracket | Male | Female |
| 5 to 17 Years | 0 (0.0%) | 0 (0.0%) |
| 18 to 34 Years | 0 (0.0%) | 0 (0.0%) |
| 35 to 64 Years | 0 (0.0%) | 15 (12.7%) |
| 65 to 74 Years | 4 (16.7%) | 0 (0.0%) |
| 75 Years and over | 0 (0.0%) | 0 (0.0%) |
Disability Class: Ambulatory Difficulty
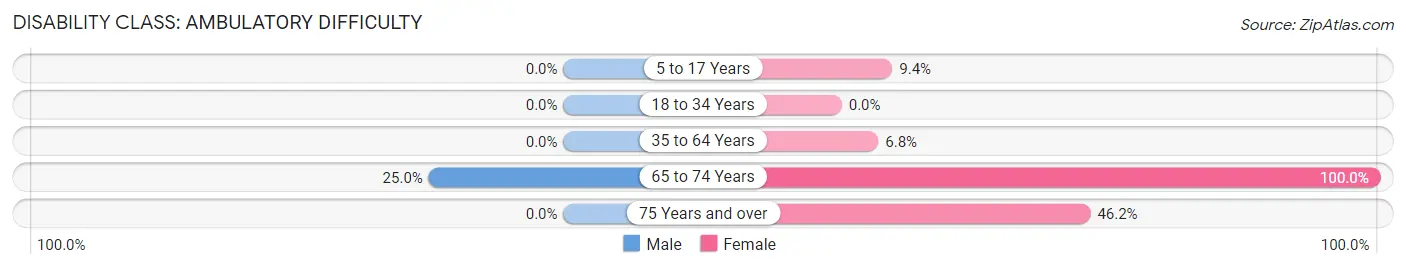
| Age Bracket | Male | Female |
| 5 to 17 Years | 0 (0.0%) | 3 (9.4%) |
| 18 to 34 Years | 0 (0.0%) | 0 (0.0%) |
| 35 to 64 Years | 0 (0.0%) | 8 (6.8%) |
| 65 to 74 Years | 6 (25.0%) | 8 (100.0%) |
| 75 Years and over | 0 (0.0%) | 6 (46.2%) |
Disability Class: Self-Care Difficulty
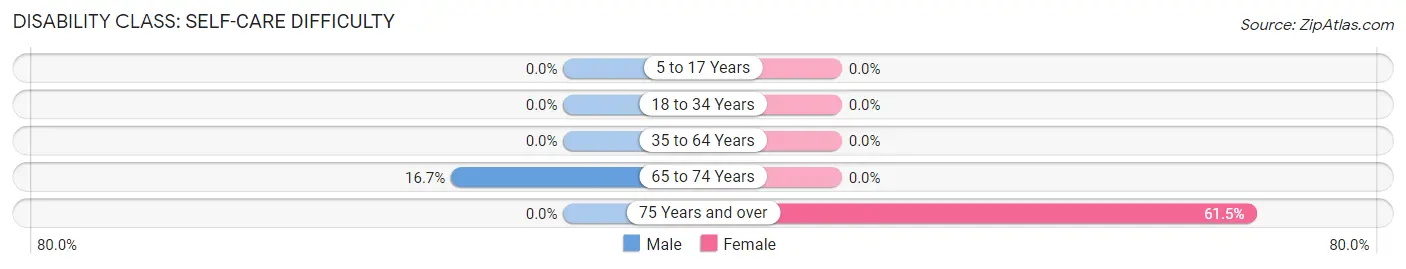
| Age Bracket | Male | Female |
| 5 to 17 Years | 0 (0.0%) | 0 (0.0%) |
| 18 to 34 Years | 0 (0.0%) | 0 (0.0%) |
| 35 to 64 Years | 0 (0.0%) | 0 (0.0%) |
| 65 to 74 Years | 4 (16.7%) | 0 (0.0%) |
| 75 Years and over | 0 (0.0%) | 8 (61.5%) |
Technology Access in Simpson
Computing Device Access in Simpson
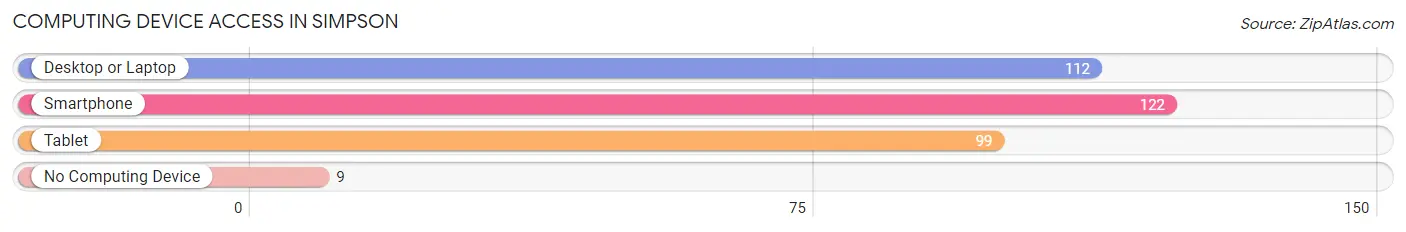
| Device Type | # Households | % Households |
| Desktop or Laptop | 112 | 76.7% |
| Smartphone | 122 | 83.6% |
| Tablet | 99 | 67.8% |
| No Computing Device | 9 | 6.2% |
| Total | 146 | 100.0% |
Internet Access in Simpson
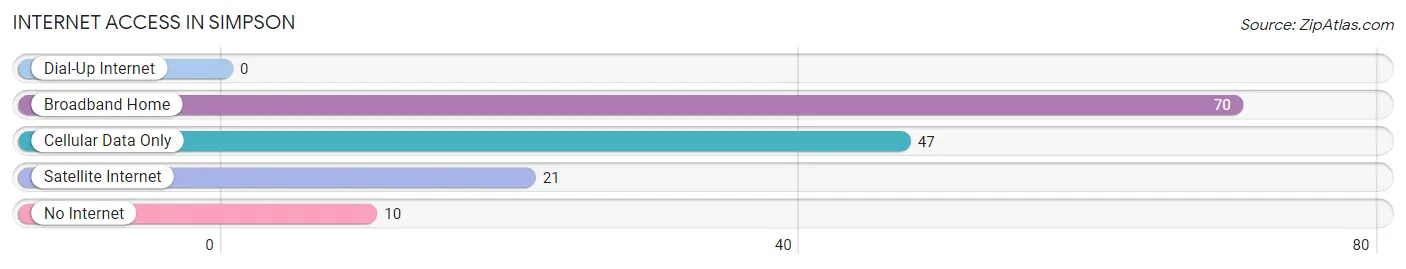
| Internet Type | # Households | % Households |
| Dial-Up Internet | 0 | 0.0% |
| Broadband Home | 70 | 47.9% |
| Cellular Data Only | 47 | 32.2% |
| Satellite Internet | 21 | 14.4% |
| No Internet | 10 | 6.9% |
| Total | 146 | 100.0% |
Simpson Summary
History
Simpson, Louisiana is a small town located in the northern part of the state, in the parish of Jackson. It was founded in 1845 by a group of settlers from the nearby town of Jonesboro. The town was named after the first settler, William Simpson, who was a prominent landowner in the area.
The town was originally a farming community, with cotton and corn being the main crops. In the late 19th century, the town began to grow as a result of the timber industry. The town was also home to a number of sawmills and lumber companies.
In the early 20th century, the town began to experience a period of growth and prosperity. This was due to the discovery of oil in the area, which led to the development of several oil refineries. This period of growth was short-lived, however, as the Great Depression hit the town hard.
The town experienced a resurgence in the 1950s, when the timber industry began to boom again. This led to the construction of several new sawmills and lumber companies in the area. The town also experienced a period of growth in the 1970s, when the oil industry began to boom again.
Geography
Simpson is located in the northern part of Louisiana, in the parish of Jackson. It is situated on the banks of the Pearl River, which is a tributary of the Mississippi River. The town is surrounded by a number of small towns and villages, including Jonesboro, Chatham, and Olla.
The town is located in a rural area, with the nearest major city being Shreveport, which is located about 50 miles away. The town is also located close to the Louisiana-Mississippi border.
The town has a total area of 1.2 square miles, all of which is land. The town is located at an elevation of about 200 feet above sea level.
Economy
The economy of Simpson is largely based on the timber industry. The town is home to several sawmills and lumber companies, which provide employment for many of the town’s residents.
The town is also home to a number of oil refineries, which provide employment for many of the town’s residents. The town is also home to a number of small businesses, such as restaurants, stores, and other services.
Demographics
As of the 2010 census, the population of Simpson was 1,845. The town has a population density of 1,521 people per square mile. The racial makeup of the town is 79.3% White, 17.2% African American, 0.3% Native American, 0.2% Asian, 0.1% Pacific Islander, and 2.9% from other races.
The median household income in Simpson is $31,250, and the median family income is $37,500. The per capita income in the town is $15,845. About 17.2% of the population is below the poverty line.
Common Questions
What is Per Capita Income in Simpson?
Per Capita income in Simpson is $36,254.
What is the Median Family Income in Simpson?
Median Family Income in Simpson is $84,583.
What is the Median Household income in Simpson?
Median Household Income in Simpson is $85,769.
What is Income or Wage Gap in Simpson?
Income or Wage Gap in Simpson is 32.3%.
Women in Simpson earn 67.7 cents for every dollar earned by a man.
What is Inequality or Gini Index in Simpson?
Inequality or Gini Index in Simpson is 0.36.
What is the Total Population of Simpson?
Total Population of Simpson is 389.
What is the Total Male Population of Simpson?
Total Male Population of Simpson is 178.
What is the Total Female Population of Simpson?
Total Female Population of Simpson is 211.
What is the Ratio of Males per 100 Females in Simpson?
There are 84.36 Males per 100 Females in Simpson.
What is the Ratio of Females per 100 Males in Simpson?
There are 118.54 Females per 100 Males in Simpson.
What is the Median Population Age in Simpson?
Median Population Age in Simpson is 44.1 Years.
What is the Average Family Size in Simpson
Average Family Size in Simpson is 3.0 People.
What is the Average Household Size in Simpson
Average Household Size in Simpson is 2.7 People.
How Large is the Labor Force in Simpson?
There are 185 People in the Labor Forcein in Simpson.
What is the Percentage of People in the Labor Force in Simpson?
56.1% of People are in the Labor Force in Simpson.
What is the Unemployment Rate in Simpson?
Unemployment Rate in Simpson is 7.0%.