Rosepine, LA Map & Demographics
Rosepine Map
Rosepine Overview
$26,523
PER CAPITA INCOME
$61,536
AVG FAMILY INCOME
$57,333
AVG HOUSEHOLD INCOME
52.9%
WAGE / INCOME GAP [ % ]
47.1¢/ $1
WAGE / INCOME GAP [ $ ]
$4,949
FAMILY INCOME DEFICIT
0.43
INEQUALITY / GINI INDEX
1,740
TOTAL POPULATION
808
MALE POPULATION
932
FEMALE POPULATION
86.70
MALES / 100 FEMALES
115.35
FEMALES / 100 MALES
32.9
MEDIAN AGE
3.2
AVG FAMILY SIZE
2.7
AVG HOUSEHOLD SIZE
788
LABOR FORCE [ PEOPLE ]
56.8%
PERCENT IN LABOR FORCE
6.6%
UNEMPLOYMENT RATE
Rosepine Zip Codes
Income in Rosepine
Income Overview in Rosepine
Per Capita Income in Rosepine is $26,523, while median incomes of families and households are $61,536 and $57,333 respectively.
| Characteristic | Number | Measure |
| Per Capita Income | 1,740 | $26,523 |
| Median Family Income | 420 | $61,536 |
| Mean Family Income | 420 | $79,865 |
| Median Household Income | 618 | $57,333 |
| Mean Household Income | 618 | $69,176 |
| Income Deficit | 420 | $4,949 |
| Wage / Income Gap (%) | 1,740 | 52.87% |
| Wage / Income Gap ($) | 1,740 | 47.13¢ per $1 |
| Gini / Inequality Index | 1,740 | 0.43 |
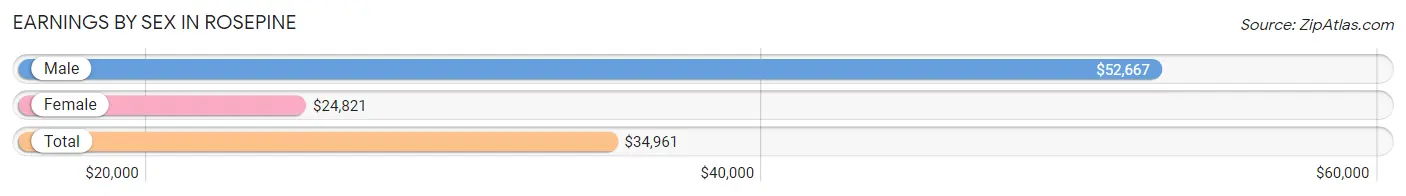
Earnings by Sex in Rosepine
Average Earnings in Rosepine are $34,961, $52,667 for men and $24,821 for women, a difference of 52.9%.
| Sex | Number | Average Earnings |
| Male | 420 (54.0%) | $52,667 |
| Female | 357 (46.0%) | $24,821 |
| Total | 777 (100.0%) | $34,961 |
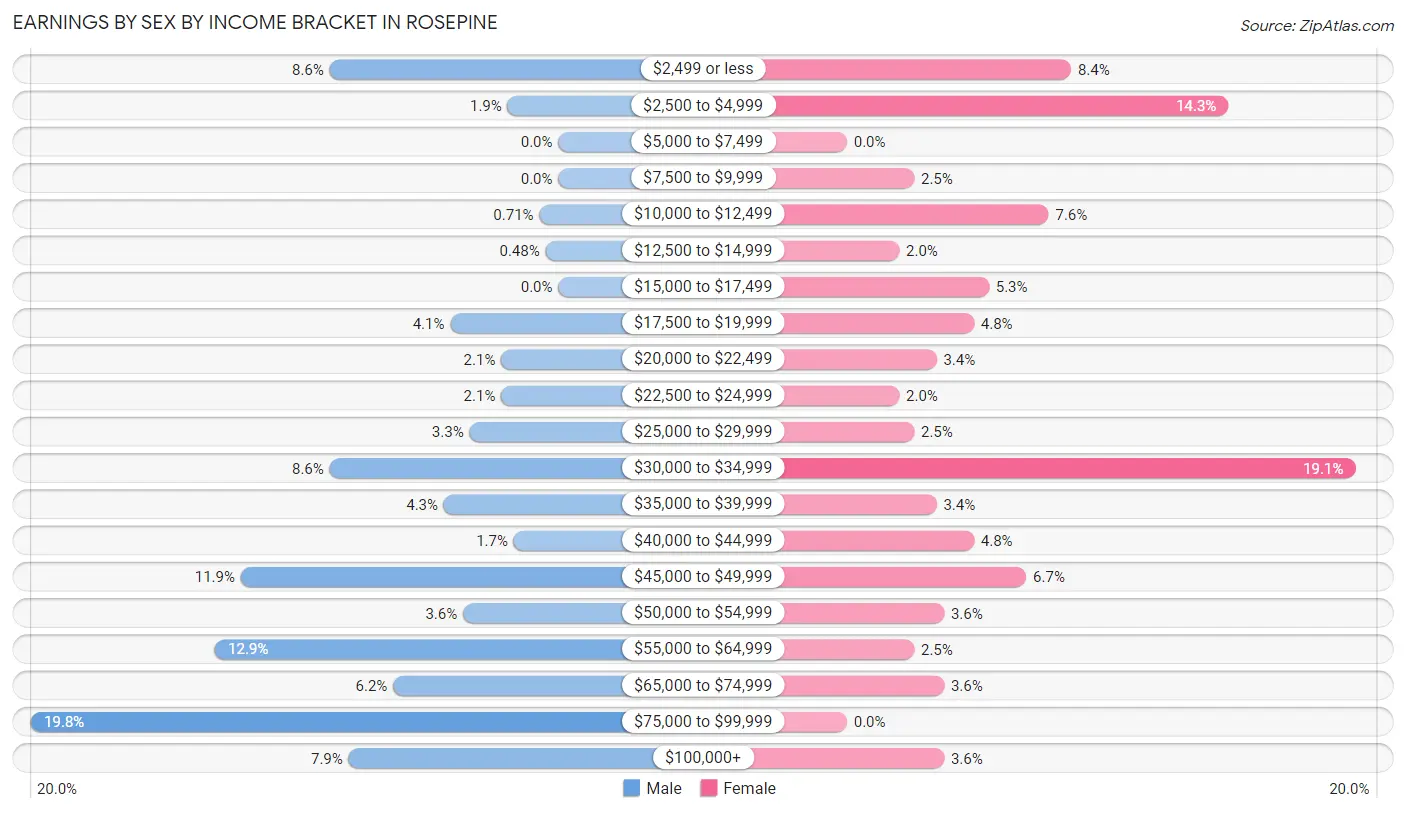
Earnings by Sex by Income Bracket in Rosepine
The most common earnings brackets in Rosepine are $75,000 to $99,999 for men (83 | 19.8%) and $30,000 to $34,999 for women (68 | 19.1%).
| Income | Male | Female |
| $2,499 or less | 36 (8.6%) | 30 (8.4%) |
| $2,500 to $4,999 | 8 (1.9%) | 51 (14.3%) |
| $5,000 to $7,499 | 0 (0.0%) | 0 (0.0%) |
| $7,500 to $9,999 | 0 (0.0%) | 9 (2.5%) |
| $10,000 to $12,499 | 3 (0.7%) | 27 (7.6%) |
| $12,500 to $14,999 | 2 (0.5%) | 7 (2.0%) |
| $15,000 to $17,499 | 0 (0.0%) | 19 (5.3%) |
| $17,500 to $19,999 | 17 (4.1%) | 17 (4.8%) |
| $20,000 to $22,499 | 9 (2.1%) | 12 (3.4%) |
| $22,500 to $24,999 | 9 (2.1%) | 7 (2.0%) |
| $25,000 to $29,999 | 14 (3.3%) | 9 (2.5%) |
| $30,000 to $34,999 | 36 (8.6%) | 68 (19.1%) |
| $35,000 to $39,999 | 18 (4.3%) | 12 (3.4%) |
| $40,000 to $44,999 | 7 (1.7%) | 17 (4.8%) |
| $45,000 to $49,999 | 50 (11.9%) | 24 (6.7%) |
| $50,000 to $54,999 | 15 (3.6%) | 13 (3.6%) |
| $55,000 to $64,999 | 54 (12.9%) | 9 (2.5%) |
| $65,000 to $74,999 | 26 (6.2%) | 13 (3.6%) |
| $75,000 to $99,999 | 83 (19.8%) | 0 (0.0%) |
| $100,000+ | 33 (7.9%) | 13 (3.6%) |
| Total | 420 (100.0%) | 357 (100.0%) |
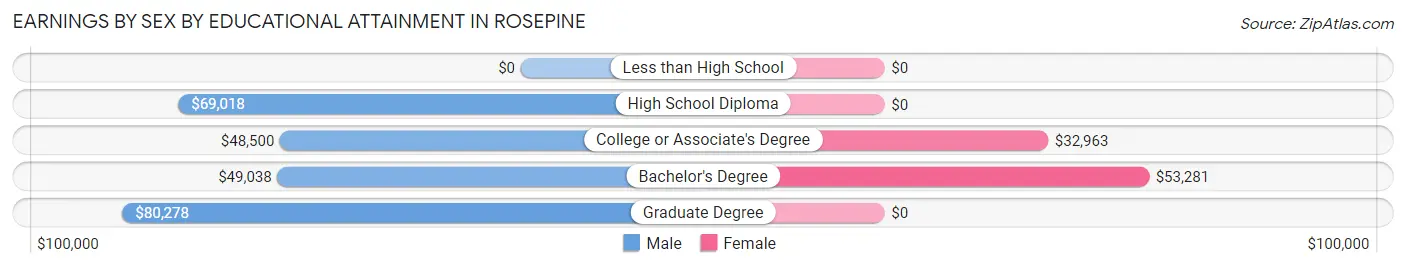
Earnings by Sex by Educational Attainment in Rosepine
Average earnings in Rosepine are $56,192 for men and $32,938 for women, a difference of 41.4%. Men with an educational attainment of graduate degree enjoy the highest average annual earnings of $80,278, while those with college or associate's degree education earn the least with $48,500. Women with an educational attainment of bachelor's degree earn the most with the average annual earnings of $53,281, while those with college or associate's degree education have the smallest earnings of $32,963.
| Educational Attainment | Male Income | Female Income |
| Less than High School | - | - |
| High School Diploma | $69,018 | $0 |
| College or Associate's Degree | $48,500 | $32,963 |
| Bachelor's Degree | $49,038 | $53,281 |
| Graduate Degree | $80,278 | $0 |
| Total | $56,192 | $32,938 |
Family Income in Rosepine
Family Income Brackets in Rosepine
According to the Rosepine family income data, there are 112 families falling into the $50,000 to $74,999 income range, which is the most common income bracket and makes up 26.7% of all families.
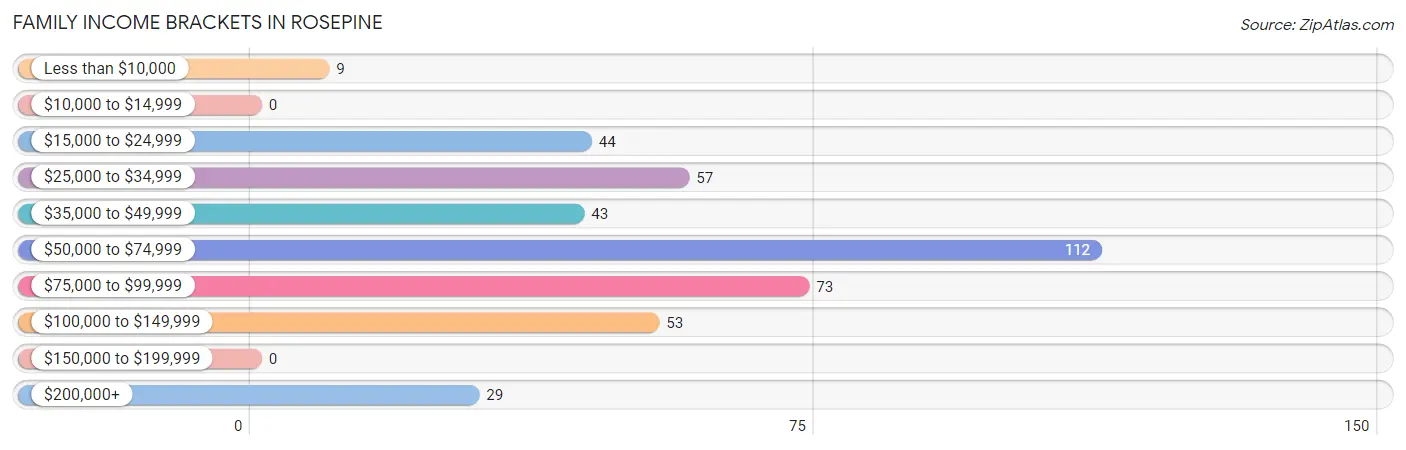
| Income Bracket | # Families | % Families |
| Less than $10,000 | 9 | 2.1% |
| $10,000 to $14,999 | 0 | 0.0% |
| $15,000 to $24,999 | 44 | 10.5% |
| $25,000 to $34,999 | 57 | 13.6% |
| $35,000 to $49,999 | 43 | 10.2% |
| $50,000 to $74,999 | 112 | 26.7% |
| $75,000 to $99,999 | 73 | 17.4% |
| $100,000 to $149,999 | 53 | 12.6% |
| $150,000 to $199,999 | 0 | 0.0% |
| $200,000+ | 29 | 6.9% |
Family Income by Famaliy Size in Rosepine
3-person families (128 | 30.5%) account for the highest median family income in Rosepine with $83,452 per family, while 3-person families (128 | 30.5%) have the highest median income of $27,817 per family member.
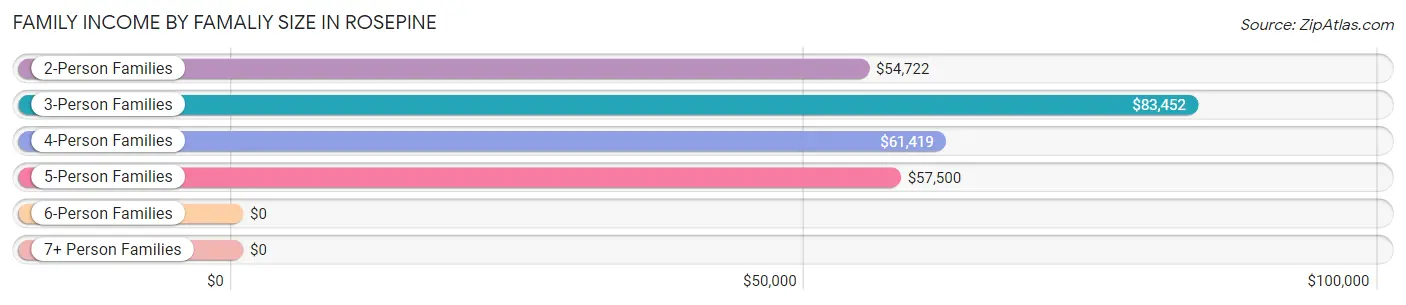
| Income Bracket | # Families | Median Income |
| 2-Person Families | 186 (44.3%) | $54,722 |
| 3-Person Families | 128 (30.5%) | $83,452 |
| 4-Person Families | 70 (16.7%) | $61,419 |
| 5-Person Families | 36 (8.6%) | $57,500 |
| 6-Person Families | 0 (0.0%) | $0 |
| 7+ Person Families | 0 (0.0%) | $0 |
| Total | 420 (100.0%) | $61,536 |
Family Income by Number of Earners in Rosepine
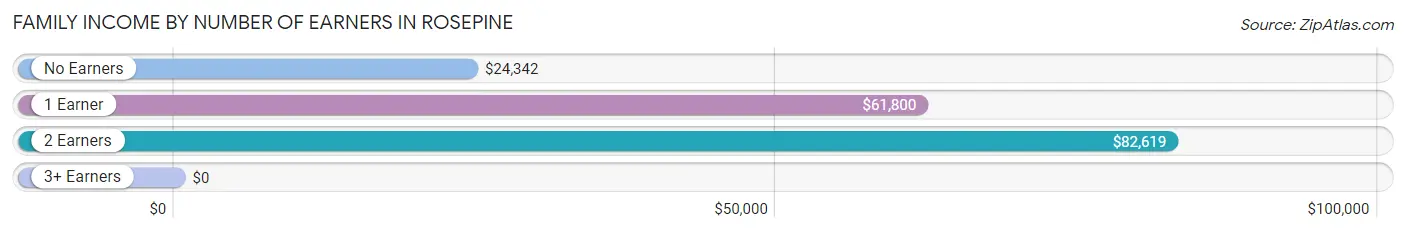
| Number of Earners | # Families | Median Income |
| No Earners | 74 (17.6%) | $24,342 |
| 1 Earner | 154 (36.7%) | $61,800 |
| 2 Earners | 170 (40.5%) | $82,619 |
| 3+ Earners | 22 (5.2%) | $0 |
| Total | 420 (100.0%) | $61,536 |
Household Income in Rosepine
Household Income Brackets in Rosepine
With 147 households falling in the category, the $50,000 to $74,999 income range is the most frequent in Rosepine, accounting for 23.8% of all households. In contrast, only 3 households (0.5%) fall into the $150,000 to $199,999 income bracket, making it the least populous group.
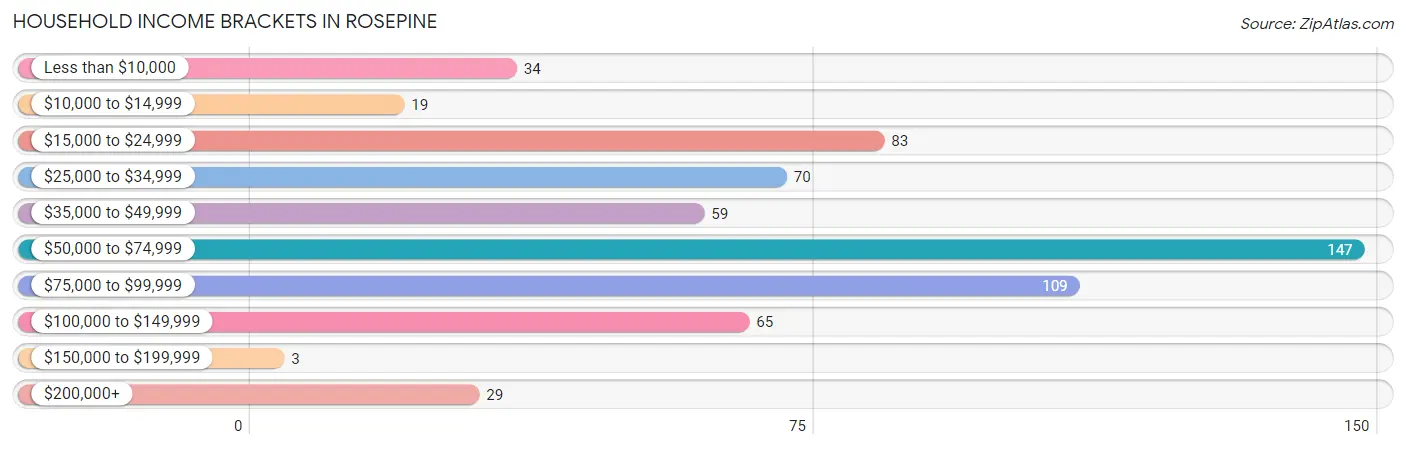
| Income Bracket | # Households | % Households |
| Less than $10,000 | 34 | 5.5% |
| $10,000 to $14,999 | 19 | 3.1% |
| $15,000 to $24,999 | 83 | 13.4% |
| $25,000 to $34,999 | 70 | 11.3% |
| $35,000 to $49,999 | 59 | 9.5% |
| $50,000 to $74,999 | 147 | 23.8% |
| $75,000 to $99,999 | 109 | 17.6% |
| $100,000 to $149,999 | 65 | 10.5% |
| $150,000 to $199,999 | 3 | 0.5% |
| $200,000+ | 29 | 4.7% |
Household Income by Householder Age in Rosepine
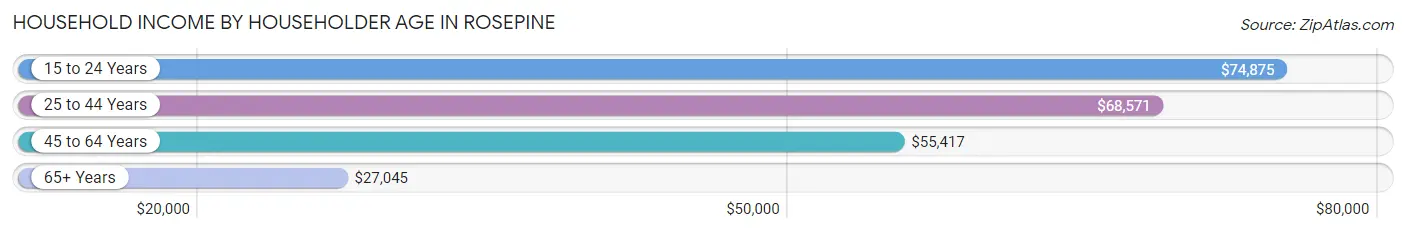
The median household income in Rosepine is $57,333, with the highest median household income of $74,875 found in the 15 to 24 years age bracket for the primary householder. A total of 43 households (7.0%) fall into this category. Meanwhile, the 65+ years age bracket for the primary householder has the lowest median household income of $27,045, with 106 households (17.2%) in this group.
| Income Bracket | # Households | Median Income |
| 15 to 24 Years | 43 (7.0%) | $74,875 |
| 25 to 44 Years | 266 (43.0%) | $68,571 |
| 45 to 64 Years | 203 (32.9%) | $55,417 |
| 65+ Years | 106 (17.2%) | $27,045 |
| Total | 618 (100.0%) | $57,333 |
Poverty in Rosepine
Income Below Poverty by Sex and Age in Rosepine
With 13.6% poverty level for males and 13.1% for females among the residents of Rosepine, 16 and 17 year old males and 15 year old females are the most vulnerable to poverty, with 9 males (100.0%) and 10 females (100.0%) in their respective age groups living below the poverty level.
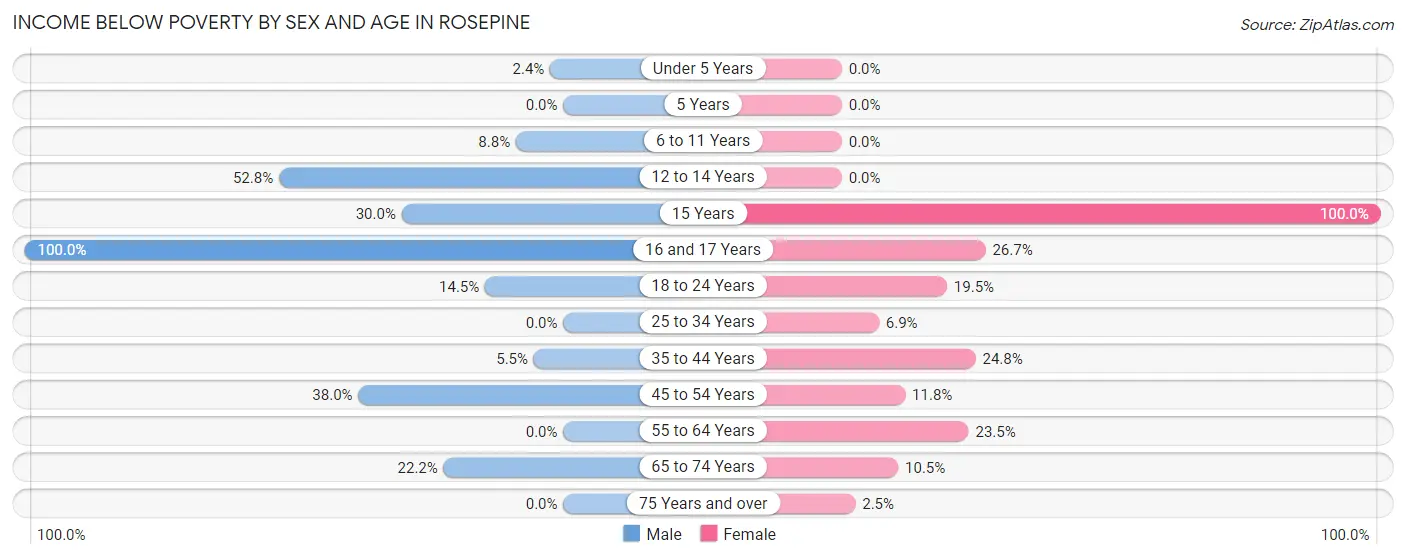
| Age Bracket | Male | Female |
| Under 5 Years | 1 (2.4%) | 0 (0.0%) |
| 5 Years | 0 (0.0%) | 0 (0.0%) |
| 6 to 11 Years | 8 (8.8%) | 0 (0.0%) |
| 12 to 14 Years | 19 (52.8%) | 0 (0.0%) |
| 15 Years | 3 (30.0%) | 10 (100.0%) |
| 16 and 17 Years | 9 (100.0%) | 8 (26.7%) |
| 18 to 24 Years | 18 (14.5%) | 16 (19.5%) |
| 25 to 34 Years | 0 (0.0%) | 9 (6.9%) |
| 35 to 44 Years | 7 (5.5%) | 34 (24.8%) |
| 45 to 54 Years | 35 (38.0%) | 8 (11.8%) |
| 55 to 64 Years | 0 (0.0%) | 20 (23.5%) |
| 65 to 74 Years | 4 (22.2%) | 7 (10.4%) |
| 75 Years and over | 0 (0.0%) | 3 (2.5%) |
| Total | 104 (13.6%) | 115 (13.1%) |
Income Above Poverty by Sex and Age in Rosepine
According to the poverty statistics in Rosepine, males aged 5 years and females aged under 5 years are the age groups that are most secure financially, with 100.0% of males and 100.0% of females in these age groups living above the poverty line.
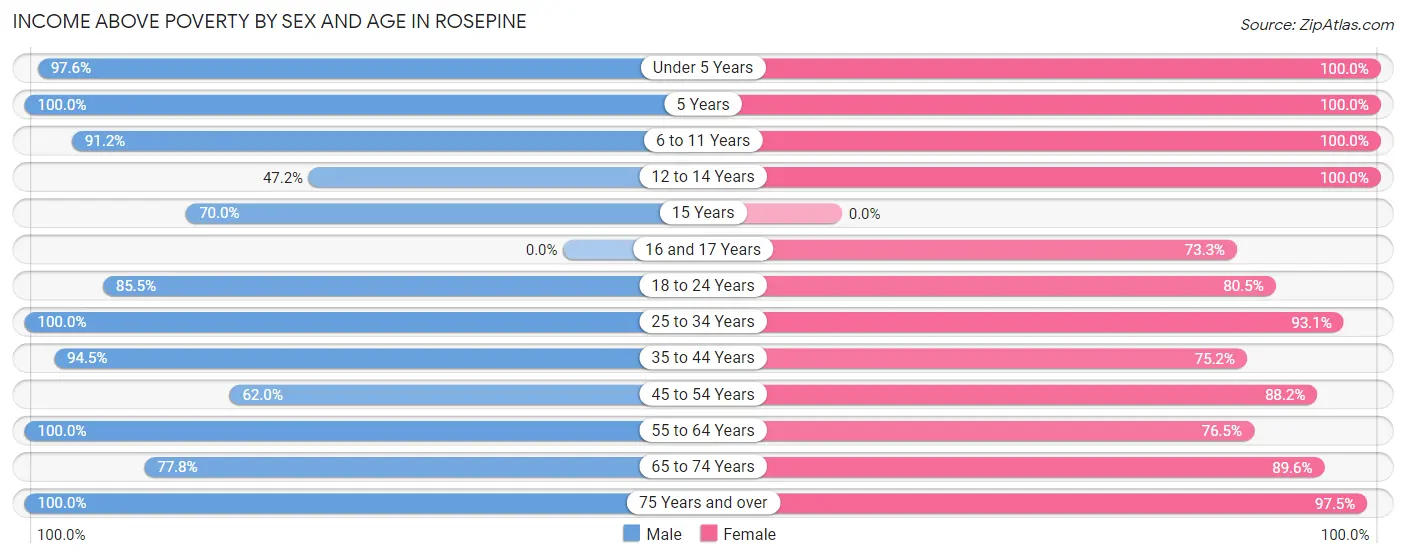
| Age Bracket | Male | Female |
| Under 5 Years | 40 (97.6%) | 28 (100.0%) |
| 5 Years | 2 (100.0%) | 28 (100.0%) |
| 6 to 11 Years | 83 (91.2%) | 12 (100.0%) |
| 12 to 14 Years | 17 (47.2%) | 82 (100.0%) |
| 15 Years | 7 (70.0%) | 0 (0.0%) |
| 16 and 17 Years | 0 (0.0%) | 22 (73.3%) |
| 18 to 24 Years | 106 (85.5%) | 66 (80.5%) |
| 25 to 34 Years | 159 (100.0%) | 122 (93.1%) |
| 35 to 44 Years | 121 (94.5%) | 103 (75.2%) |
| 45 to 54 Years | 57 (62.0%) | 60 (88.2%) |
| 55 to 64 Years | 47 (100.0%) | 65 (76.5%) |
| 65 to 74 Years | 14 (77.8%) | 60 (89.5%) |
| 75 Years and over | 8 (100.0%) | 117 (97.5%) |
| Total | 661 (86.4%) | 765 (86.9%) |
Income Below Poverty Among Married-Couple Families in Rosepine
The poverty statistics for married-couple families in Rosepine show that 8.4% or 23 of the total 273 families live below the poverty line. Families with 1 or 2 children have the highest poverty rate of 13.2%, comprising of 22 families. On the other hand, families with 3 or 4 children have the lowest poverty rate of 0.0%, which includes 0 families.
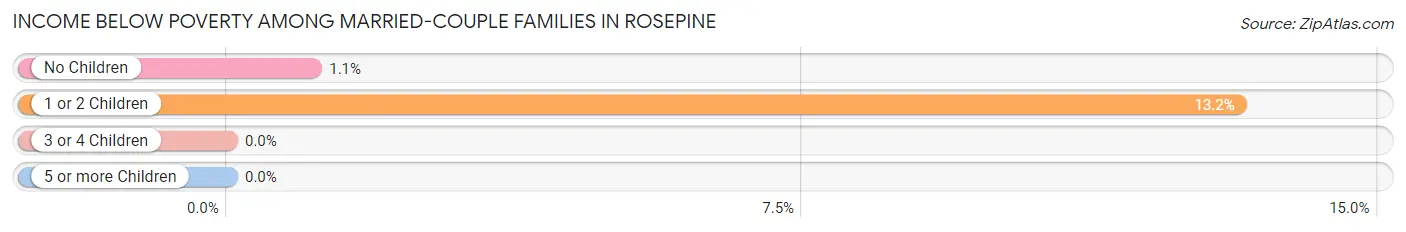
| Children | Above Poverty | Below Poverty |
| No Children | 90 (98.9%) | 1 (1.1%) |
| 1 or 2 Children | 145 (86.8%) | 22 (13.2%) |
| 3 or 4 Children | 15 (100.0%) | 0 (0.0%) |
| 5 or more Children | 0 (0.0%) | 0 (0.0%) |
| Total | 250 (91.6%) | 23 (8.4%) |
Income Below Poverty Among Single-Parent Households in Rosepine
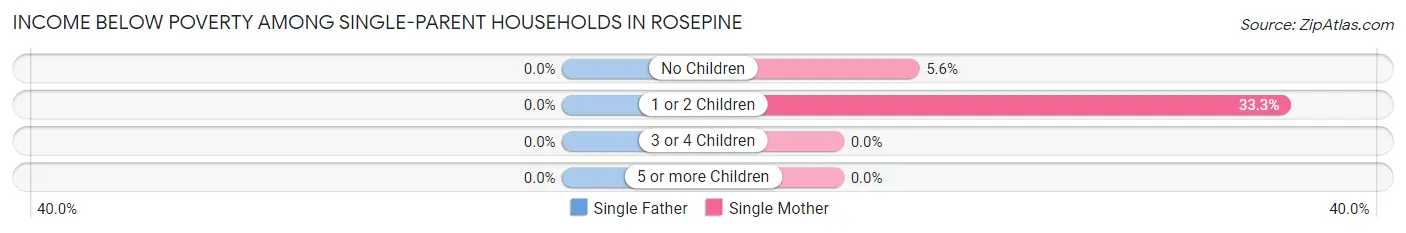
| Children | Single Father | Single Mother |
| No Children | 0 (0.0%) | 4 (5.6%) |
| 1 or 2 Children | 0 (0.0%) | 12 (33.3%) |
| 3 or 4 Children | 0 (0.0%) | 0 (0.0%) |
| 5 or more Children | 0 (0.0%) | 0 (0.0%) |
| Total | 0 (0.0%) | 16 (14.9%) |
Income Below Poverty Among Married-Couple vs Single-Parent Households in Rosepine
The poverty data for Rosepine shows that 23 of the married-couple family households (8.4%) and 16 of the single-parent households (10.9%) are living below the poverty level. Within the married-couple family households, those with 1 or 2 children have the highest poverty rate, with 22 households (13.2%) falling below the poverty line. Among the single-parent households, those with 1 or 2 children have the highest poverty rate, with 12 household (21.0%) living below poverty.
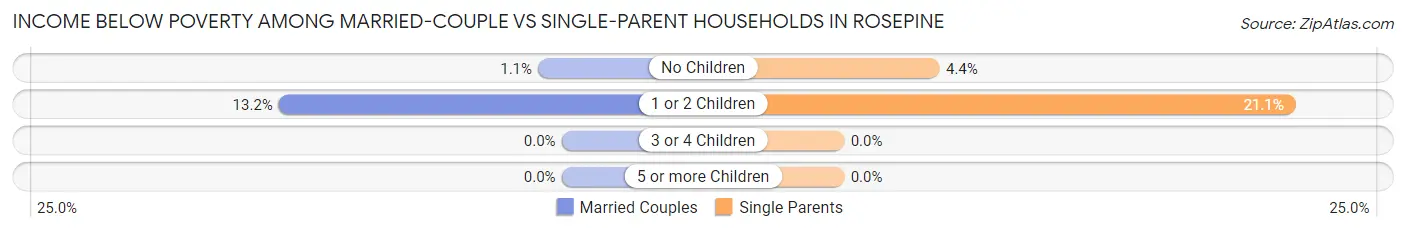
| Children | Married-Couple Families | Single-Parent Households |
| No Children | 1 (1.1%) | 4 (4.4%) |
| 1 or 2 Children | 22 (13.2%) | 12 (21.0%) |
| 3 or 4 Children | 0 (0.0%) | 0 (0.0%) |
| 5 or more Children | 0 (0.0%) | 0 (0.0%) |
| Total | 23 (8.4%) | 16 (10.9%) |
Race in Rosepine
The most populous races in Rosepine are White / Caucasian (1,489 | 85.6%), Hispanic or Latino (185 | 10.6%), and Black / African American (178 | 10.2%).
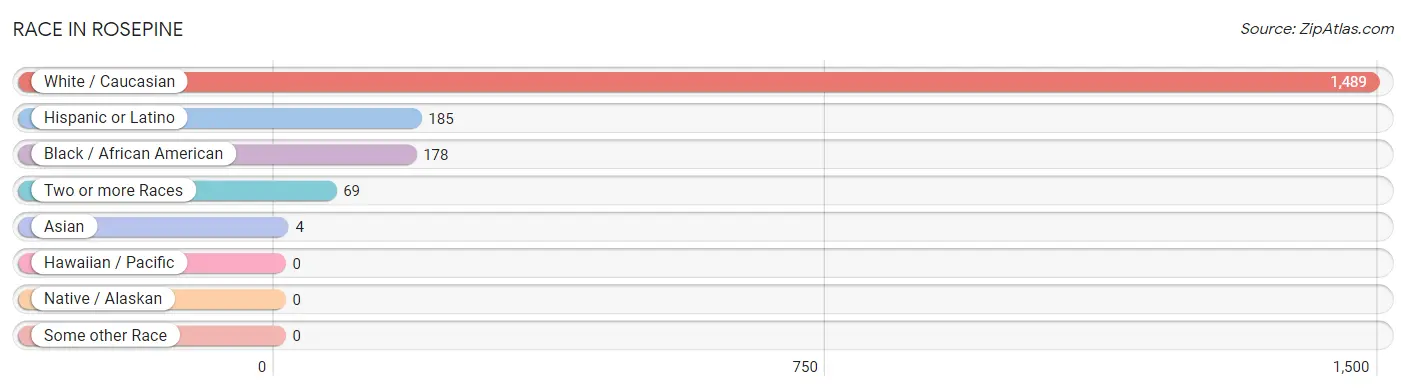
| Race | # Population | % Population |
| Asian | 4 | 0.2% |
| Black / African American | 178 | 10.2% |
| Hawaiian / Pacific | 0 | 0.0% |
| Hispanic or Latino | 185 | 10.6% |
| Native / Alaskan | 0 | 0.0% |
| White / Caucasian | 1,489 | 85.6% |
| Two or more Races | 69 | 4.0% |
| Some other Race | 0 | 0.0% |
| Total | 1,740 | 100.0% |
Ancestry in Rosepine
The most populous ancestries reported in Rosepine are American (488 | 28.1%), English (89 | 5.1%), Mexican (75 | 4.3%), Irish (54 | 3.1%), and German (52 | 3.0%), together accounting for 43.6% of all Rosepine residents.
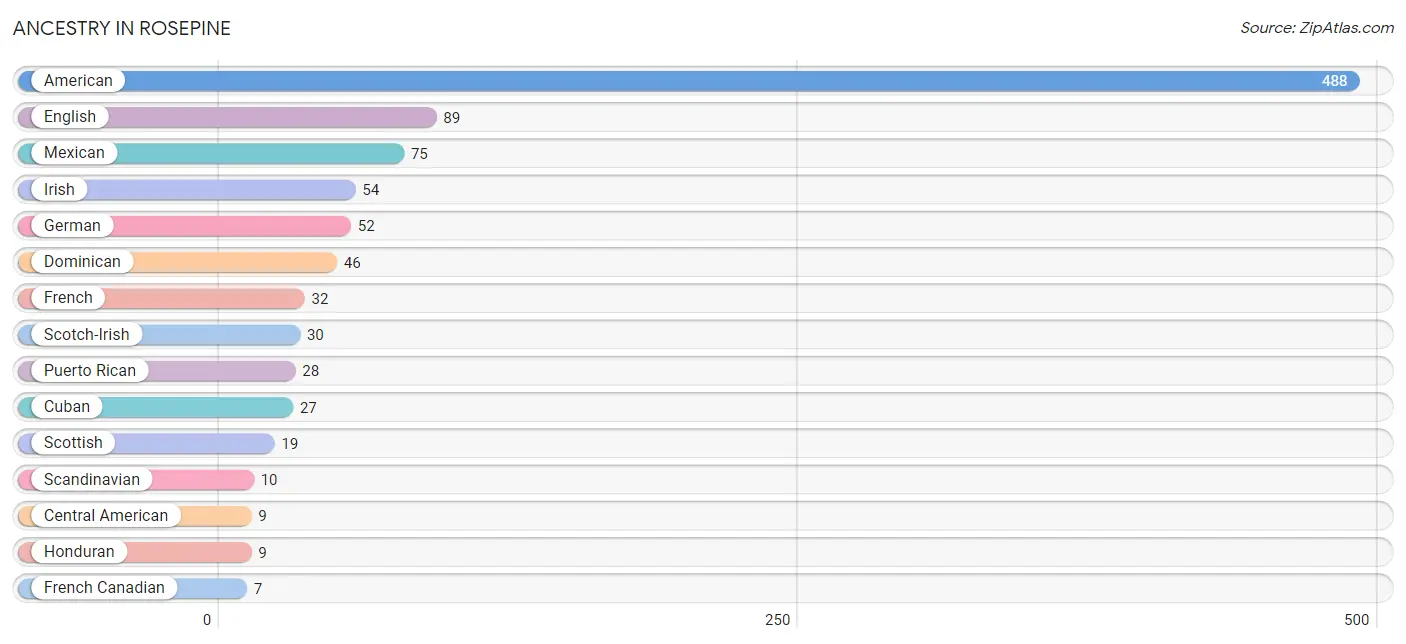
| Ancestry | # Population | % Population |
| American | 488 | 28.1% |
| Burmese | 2 | 0.1% |
| Central American | 9 | 0.5% |
| Cuban | 27 | 1.5% |
| Dominican | 46 | 2.6% |
| Dutch | 6 | 0.3% |
| English | 89 | 5.1% |
| French | 32 | 1.8% |
| French Canadian | 7 | 0.4% |
| German | 52 | 3.0% |
| Honduran | 9 | 0.5% |
| Irish | 54 | 3.1% |
| Italian | 7 | 0.4% |
| Jamaican | 5 | 0.3% |
| Korean | 2 | 0.1% |
| Mexican | 75 | 4.3% |
| Puerto Rican | 28 | 1.6% |
| Scandinavian | 10 | 0.6% |
| Scotch-Irish | 30 | 1.7% |
| Scottish | 19 | 1.1% |
| Welsh | 6 | 0.3% | View All 21 Rows |
Immigrants in Rosepine
The most numerous immigrant groups reported in Rosepine came from Latin America (38 | 2.2%), Caribbean (30 | 1.7%), Jamaica (20 | 1.1%), Dominican Republic (10 | 0.6%), and Central America (8 | 0.5%), together accounting for 6.1% of all Rosepine residents.
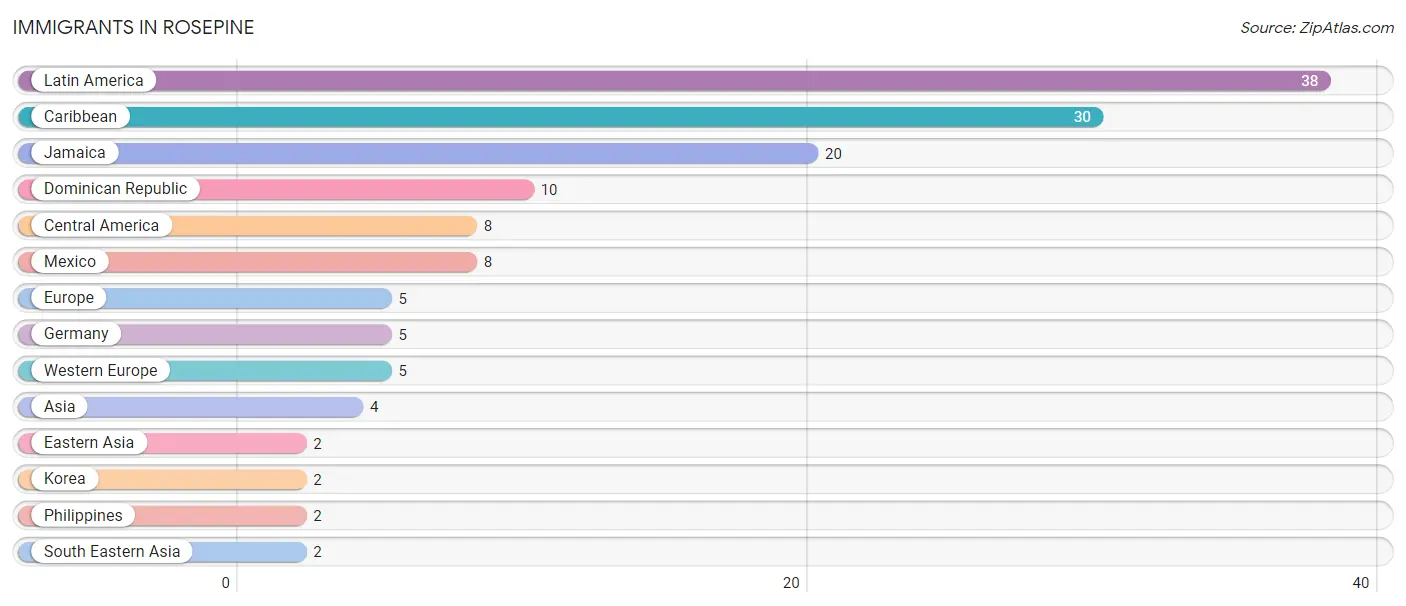
| Immigration Origin | # Population | % Population |
| Asia | 4 | 0.2% |
| Caribbean | 30 | 1.7% |
| Central America | 8 | 0.5% |
| Dominican Republic | 10 | 0.6% |
| Eastern Asia | 2 | 0.1% |
| Europe | 5 | 0.3% |
| Germany | 5 | 0.3% |
| Jamaica | 20 | 1.1% |
| Korea | 2 | 0.1% |
| Latin America | 38 | 2.2% |
| Mexico | 8 | 0.5% |
| Philippines | 2 | 0.1% |
| South Eastern Asia | 2 | 0.1% |
| Western Europe | 5 | 0.3% | View All 14 Rows |
Sex and Age in Rosepine
Sex and Age in Rosepine
The most populous age groups in Rosepine are 30 to 34 Years (93 | 11.5%) for men and 85 Years and over (130 | 14.0%) for women.
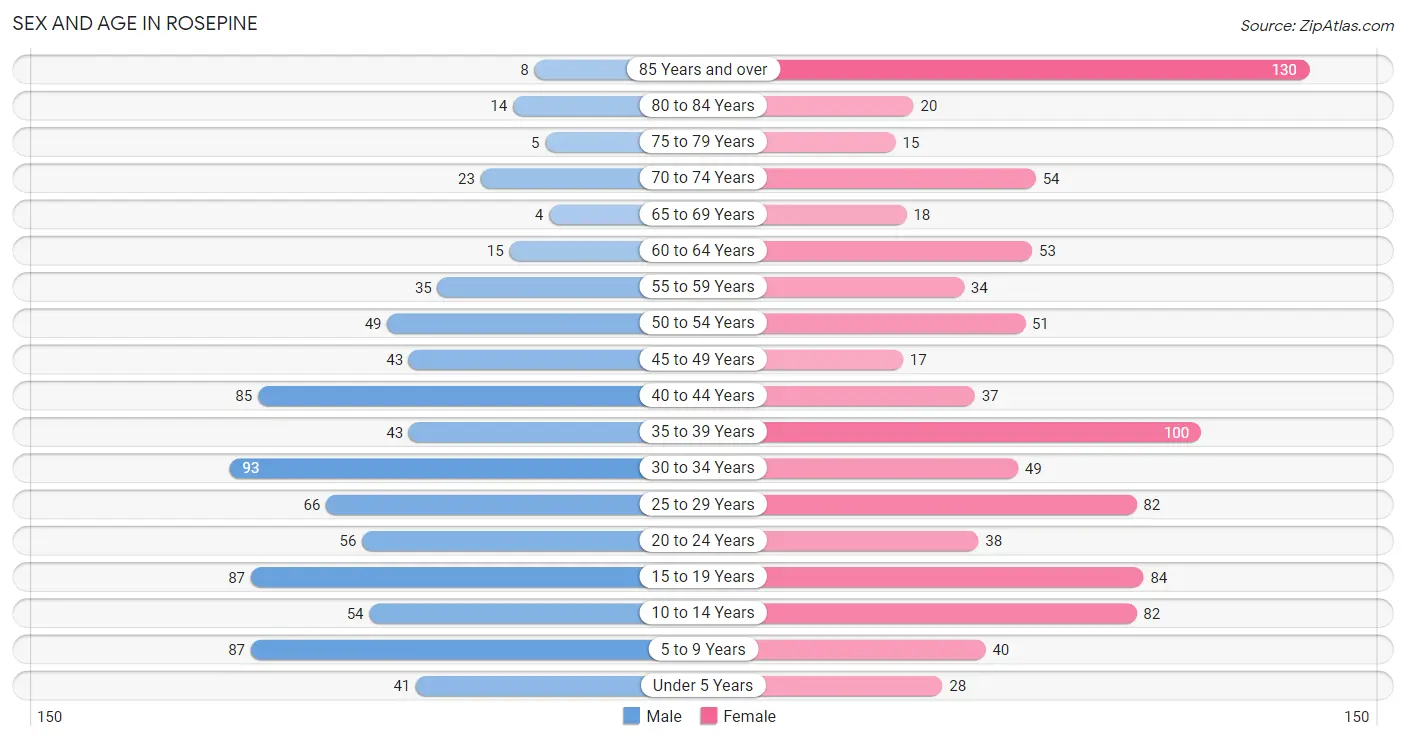
| Age Bracket | Male | Female |
| Under 5 Years | 41 (5.1%) | 28 (3.0%) |
| 5 to 9 Years | 87 (10.8%) | 40 (4.3%) |
| 10 to 14 Years | 54 (6.7%) | 82 (8.8%) |
| 15 to 19 Years | 87 (10.8%) | 84 (9.0%) |
| 20 to 24 Years | 56 (6.9%) | 38 (4.1%) |
| 25 to 29 Years | 66 (8.2%) | 82 (8.8%) |
| 30 to 34 Years | 93 (11.5%) | 49 (5.3%) |
| 35 to 39 Years | 43 (5.3%) | 100 (10.7%) |
| 40 to 44 Years | 85 (10.5%) | 37 (4.0%) |
| 45 to 49 Years | 43 (5.3%) | 17 (1.8%) |
| 50 to 54 Years | 49 (6.1%) | 51 (5.5%) |
| 55 to 59 Years | 35 (4.3%) | 34 (3.6%) |
| 60 to 64 Years | 15 (1.9%) | 53 (5.7%) |
| 65 to 69 Years | 4 (0.5%) | 18 (1.9%) |
| 70 to 74 Years | 23 (2.9%) | 54 (5.8%) |
| 75 to 79 Years | 5 (0.6%) | 15 (1.6%) |
| 80 to 84 Years | 14 (1.7%) | 20 (2.1%) |
| 85 Years and over | 8 (1.0%) | 130 (14.0%) |
| Total | 808 (100.0%) | 932 (100.0%) |
Families and Households in Rosepine
Median Family Size in Rosepine
The median family size in Rosepine is 3.22 persons per family, with single female/mother families (107 | 25.5%) accounting for the largest median family size of 3.46 persons per family. On the other hand, single male/father families (40 | 9.5%) represent the smallest median family size with 1.95 persons per family.
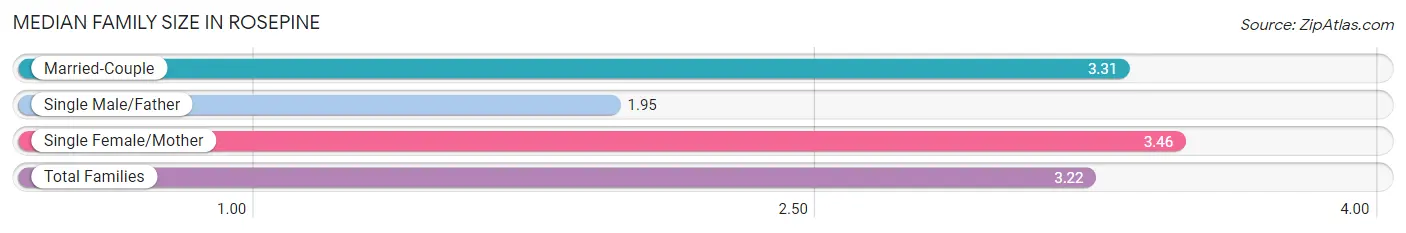
| Family Type | # Families | Family Size |
| Married-Couple | 273 (65.0%) | 3.31 |
| Single Male/Father | 40 (9.5%) | 1.95 |
| Single Female/Mother | 107 (25.5%) | 3.46 |
| Total Families | 420 (100.0%) | 3.22 |
Median Household Size in Rosepine
The median household size in Rosepine is 2.68 persons per household, with single female/mother households (107 | 17.3%) accounting for the largest median household size of 3.48 persons per household. non-family households (198 | 32.0%) represent the smallest median household size with 1.35 persons per household.
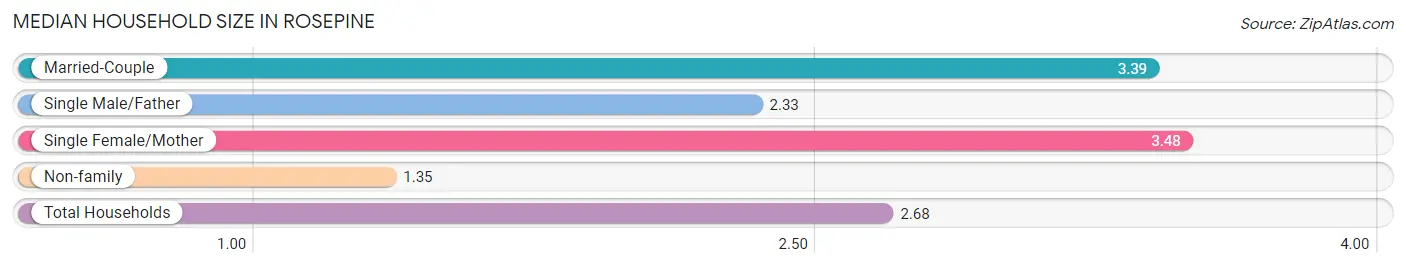
| Household Type | # Households | Household Size |
| Married-Couple | 273 (44.2%) | 3.39 |
| Single Male/Father | 40 (6.5%) | 2.33 |
| Single Female/Mother | 107 (17.3%) | 3.48 |
| Non-family | 198 (32.0%) | 1.35 |
| Total Households | 618 (100.0%) | 2.68 |
Household Size by Marriage Status in Rosepine
Out of a total of 618 households in Rosepine, 420 (68.0%) are family households, while 198 (32.0%) are nonfamily households. The most numerous type of family households are 2-person households, comprising 167, and the most common type of nonfamily households are 1-person households, comprising 152.
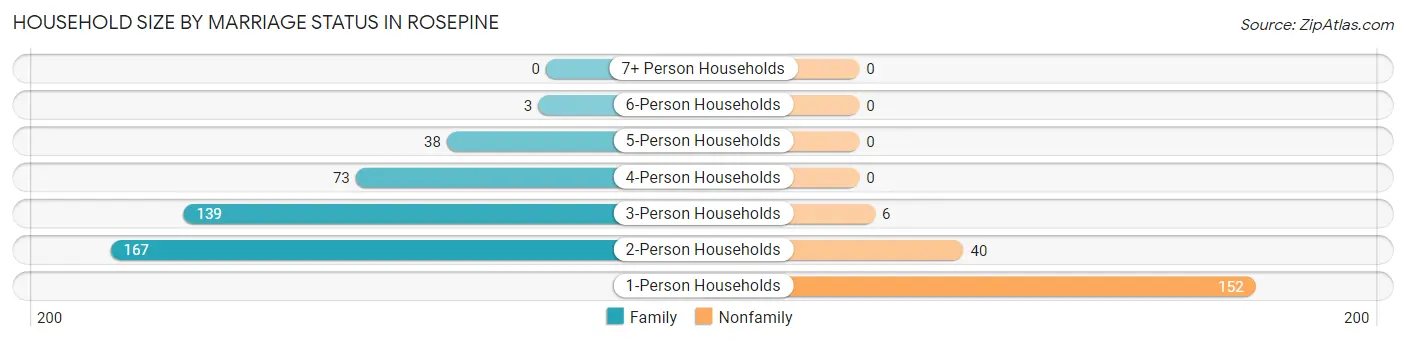
| Household Size | Family Households | Nonfamily Households |
| 1-Person Households | - | 152 (24.6%) |
| 2-Person Households | 167 (27.0%) | 40 (6.5%) |
| 3-Person Households | 139 (22.5%) | 6 (1.0%) |
| 4-Person Households | 73 (11.8%) | 0 (0.0%) |
| 5-Person Households | 38 (6.1%) | 0 (0.0%) |
| 6-Person Households | 3 (0.5%) | 0 (0.0%) |
| 7+ Person Households | 0 (0.0%) | 0 (0.0%) |
| Total | 420 (68.0%) | 198 (32.0%) |
Female Fertility in Rosepine
Fertility by Age in Rosepine
Average fertility rate in Rosepine is 24.0 births per 1,000 women. Women in the age bracket of 20 to 34 years have the highest fertility rate with 59.0 births per 1,000 women. Women in the age bracket of 20 to 34 years acount for 100.0% of all women with births.
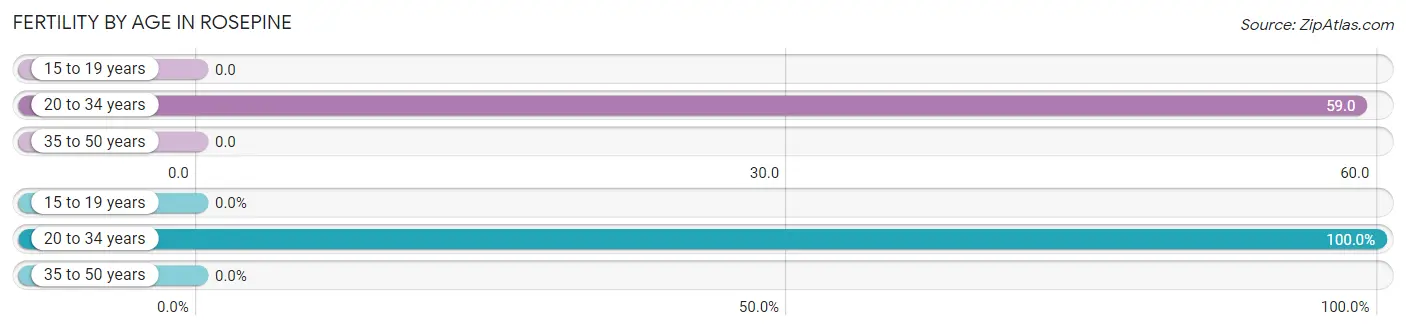
| Age Bracket | Women with Births | Births / 1,000 Women |
| 15 to 19 years | 0 (0.0%) | 0.0 |
| 20 to 34 years | 10 (100.0%) | 59.0 |
| 35 to 50 years | 0 (0.0%) | 0.0 |
| Total | 10 (100.0%) | 24.0 |
Fertility by Age by Marriage Status in Rosepine
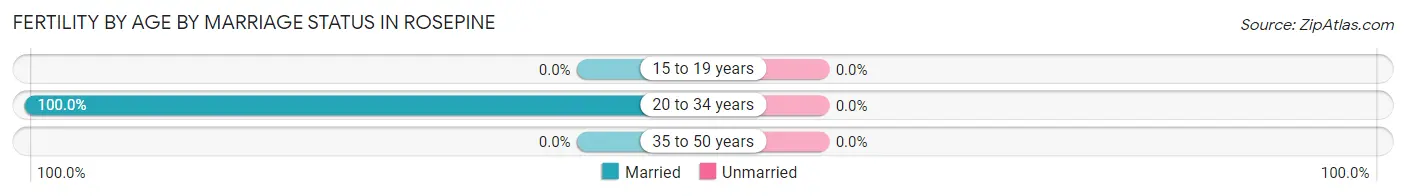
| Age Bracket | Married | Unmarried |
| 15 to 19 years | 0 (0.0%) | 0 (0.0%) |
| 20 to 34 years | 10 (100.0%) | 0 (0.0%) |
| 35 to 50 years | 0 (0.0%) | 0 (0.0%) |
| Total | 10 (100.0%) | 0 (0.0%) |
Fertility by Education in Rosepine
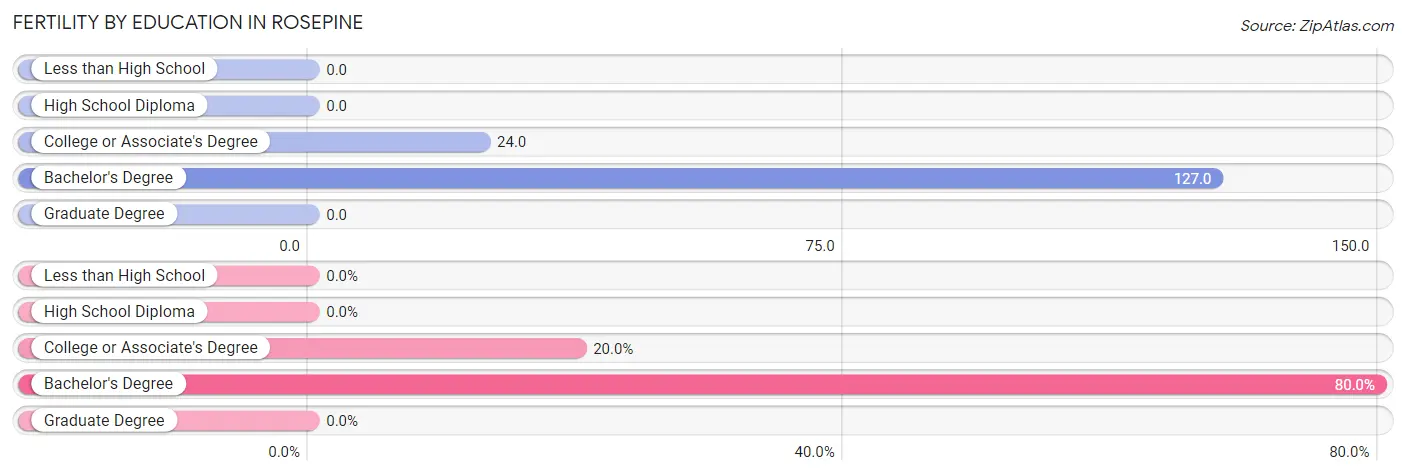
| Educational Attainment | Women with Births | Births / 1,000 Women |
| Less than High School | 0 (0.0%) | 0.0 |
| High School Diploma | 0 (0.0%) | 0.0 |
| College or Associate's Degree | 2 (20.0%) | 24.0 |
| Bachelor's Degree | 8 (80.0%) | 127.0 |
| Graduate Degree | 0 (0.0%) | 0.0 |
| Total | 10 (100.0%) | 24.0 |
Fertility by Education by Marriage Status in Rosepine
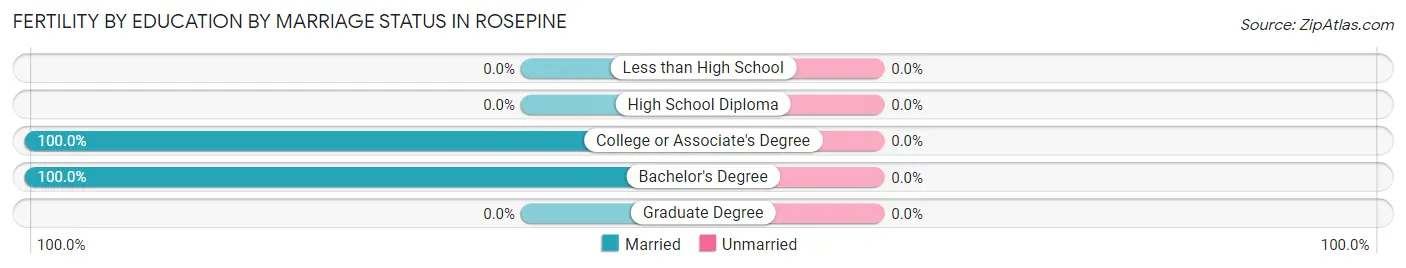
| Educational Attainment | Married | Unmarried |
| Less than High School | 0 (0.0%) | 0 (0.0%) |
| High School Diploma | 0 (0.0%) | 0 (0.0%) |
| College or Associate's Degree | 2 (100.0%) | 0 (0.0%) |
| Bachelor's Degree | 8 (100.0%) | 0 (0.0%) |
| Graduate Degree | 0 (0.0%) | 0 (0.0%) |
| Total | 10 (100.0%) | 0 (0.0%) |
Employment Characteristics in Rosepine
Employment by Class of Employer in Rosepine
Among the 738 employed individuals in Rosepine, private company employees (449 | 60.8%), federal government employees (178 | 24.1%), and not-for-profit organizations (37 | 5.0%) make up the most common classes of employment.
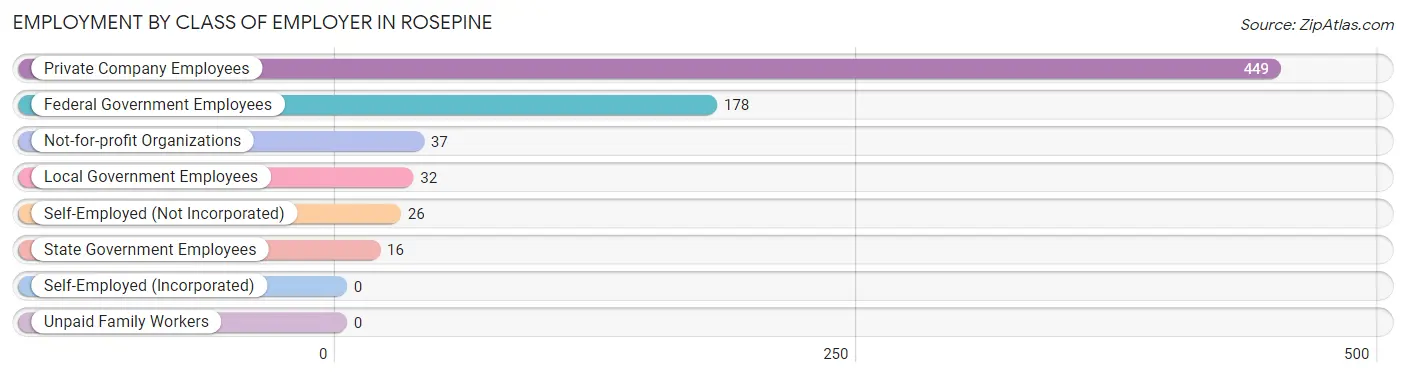
| Employer Class | # Employees | % Employees |
| Private Company Employees | 449 | 60.8% |
| Self-Employed (Incorporated) | 0 | 0.0% |
| Self-Employed (Not Incorporated) | 26 | 3.5% |
| Not-for-profit Organizations | 37 | 5.0% |
| Local Government Employees | 32 | 4.3% |
| State Government Employees | 16 | 2.2% |
| Federal Government Employees | 178 | 24.1% |
| Unpaid Family Workers | 0 | 0.0% |
| Total | 738 | 100.0% |
Employment Status by Age in Rosepine
According to the labor force statistics for Rosepine, out of the total population over 16 years of age (1,388), 56.8% or 788 individuals are in the labor force, with 6.6% or 52 of them unemployed. The age group with the highest labor force participation rate is 20 to 24 years, with 90.4% or 85 individuals in the labor force. Within the labor force, the 45 to 54 years age range has the highest percentage of unemployed individuals, with 31.5% or 30 of them being unemployed.
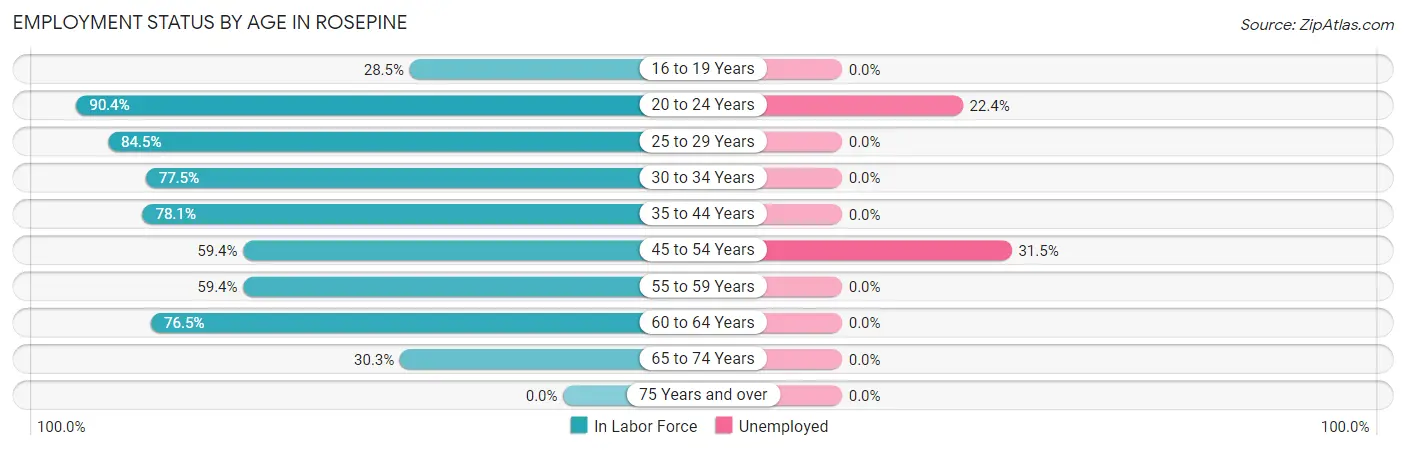
| Age Bracket | In Labor Force | Unemployed |
| 16 to 19 Years | 43 (28.5%) | 0 (0.0%) |
| 20 to 24 Years | 85 (90.4%) | 19 (22.4%) |
| 25 to 29 Years | 125 (84.5%) | 0 (0.0%) |
| 30 to 34 Years | 110 (77.5%) | 0 (0.0%) |
| 35 to 44 Years | 207 (78.1%) | 0 (0.0%) |
| 45 to 54 Years | 95 (59.4%) | 30 (31.5%) |
| 55 to 59 Years | 41 (59.4%) | 0 (0.0%) |
| 60 to 64 Years | 52 (76.5%) | 0 (0.0%) |
| 65 to 74 Years | 30 (30.3%) | 0 (0.0%) |
| 75 Years and over | 0 (0.0%) | 0 (0.0%) |
| Total | 788 (56.8%) | 52 (6.6%) |
Employment Status by Educational Attainment in Rosepine
According to labor force statistics for Rosepine, 73.9% of individuals (630) out of the total population between 25 and 64 years of age (852) are in the labor force, with 5.1% or 32 of them being unemployed. The group with the highest labor force participation rate are those with the educational attainment of bachelor's degree or higher, with 82.9% or 150 individuals in the labor force. Within the labor force, individuals with high school diploma education have the highest percentage of unemployment, with 7.2% or 20 of them being unemployed.
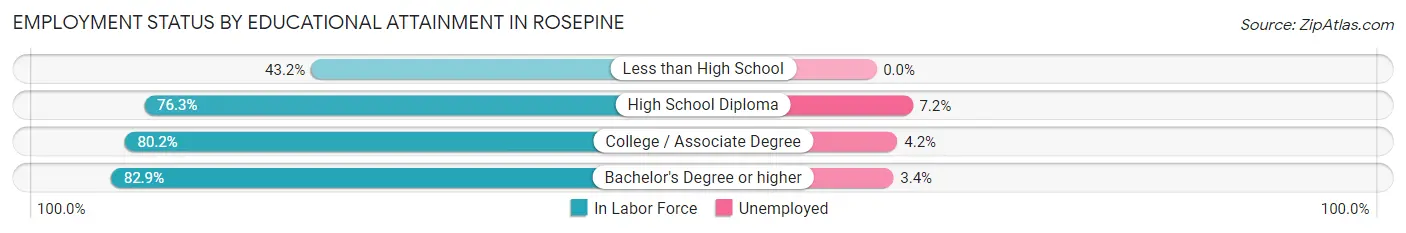
| Educational Attainment | In Labor Force | Unemployed |
| Less than High School | 51 (43.2%) | 0 (0.0%) |
| High School Diploma | 283 (76.3%) | 27 (7.2%) |
| College / Associate Degree | 146 (80.2%) | 8 (4.2%) |
| Bachelor's Degree or higher | 150 (82.9%) | 6 (3.4%) |
| Total | 630 (73.9%) | 43 (5.1%) |
Employment Occupations by Sex in Rosepine
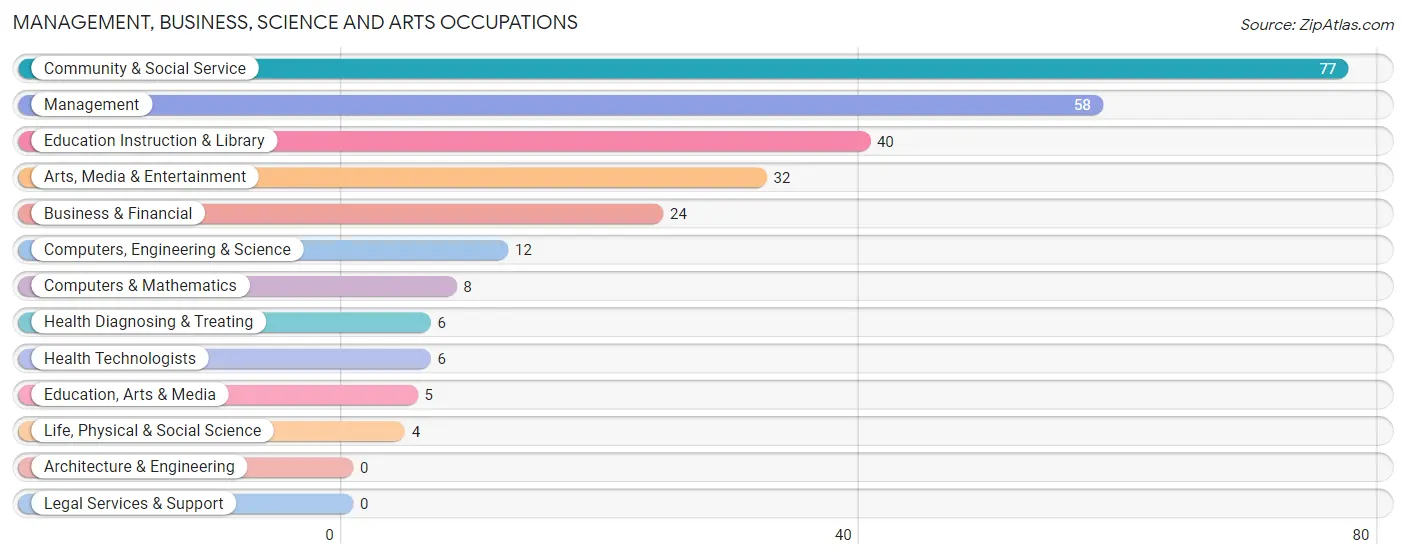
Management, Business, Science and Arts Occupations
The most common Management, Business, Science and Arts occupations in Rosepine are Community & Social Service (77 | 11.4%), Management (58 | 8.6%), Education Instruction & Library (40 | 5.9%), Arts, Media & Entertainment (32 | 4.7%), and Business & Financial (24 | 3.5%).
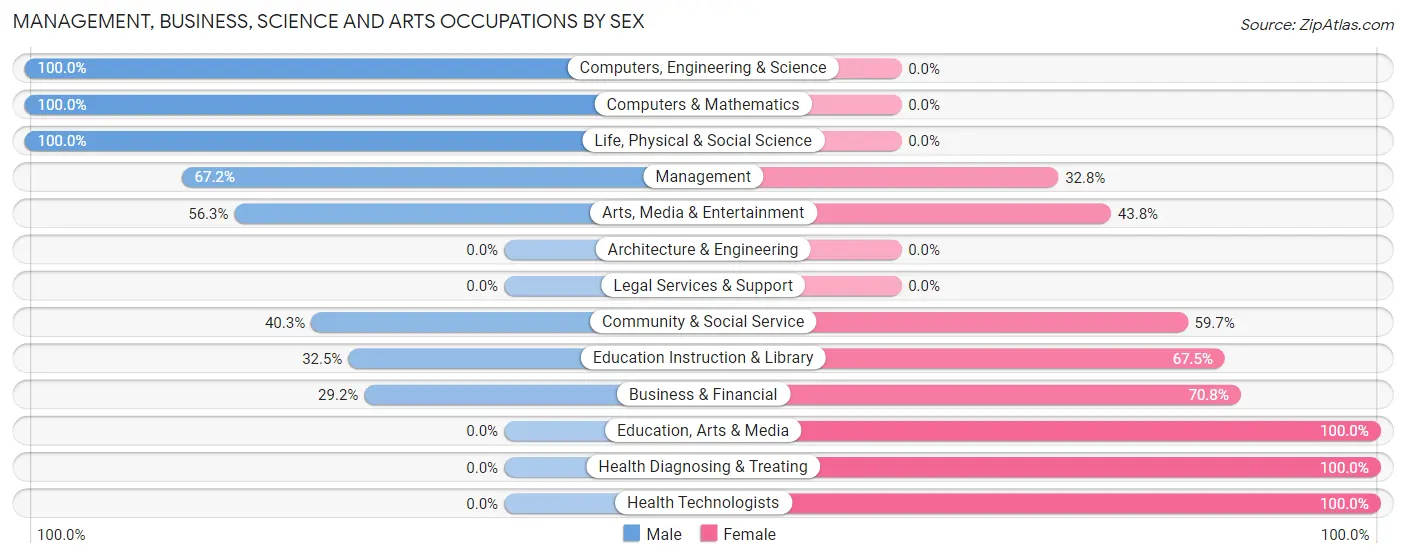
Management, Business, Science and Arts Occupations by Sex
Within the Management, Business, Science and Arts occupations in Rosepine, the most male-oriented occupations are Computers, Engineering & Science (100.0%), Computers & Mathematics (100.0%), and Life, Physical & Social Science (100.0%), while the most female-oriented occupations are Education, Arts & Media (100.0%), Health Diagnosing & Treating (100.0%), and Health Technologists (100.0%).
| Occupation | Male | Female |
| Management | 39 (67.2%) | 19 (32.8%) |
| Business & Financial | 7 (29.2%) | 17 (70.8%) |
| Computers, Engineering & Science | 12 (100.0%) | 0 (0.0%) |
| Computers & Mathematics | 8 (100.0%) | 0 (0.0%) |
| Architecture & Engineering | 0 (0.0%) | 0 (0.0%) |
| Life, Physical & Social Science | 4 (100.0%) | 0 (0.0%) |
| Community & Social Service | 31 (40.3%) | 46 (59.7%) |
| Education, Arts & Media | 0 (0.0%) | 5 (100.0%) |
| Legal Services & Support | 0 (0.0%) | 0 (0.0%) |
| Education Instruction & Library | 13 (32.5%) | 27 (67.5%) |
| Arts, Media & Entertainment | 18 (56.2%) | 14 (43.8%) |
| Health Diagnosing & Treating | 0 (0.0%) | 6 (100.0%) |
| Health Technologists | 0 (0.0%) | 6 (100.0%) |
| Total (Category) | 89 (50.3%) | 88 (49.7%) |
| Total (Overall) | 359 (53.0%) | 318 (47.0%) |
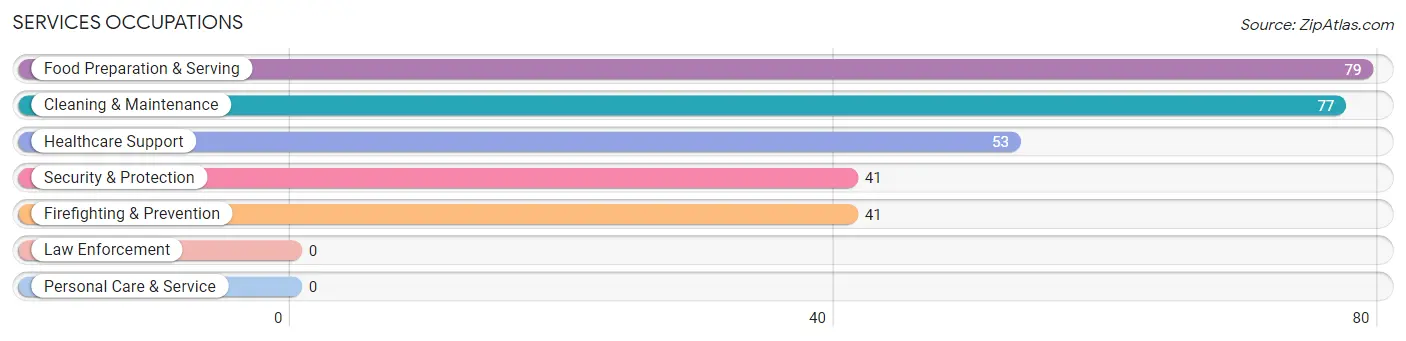
Services Occupations
The most common Services occupations in Rosepine are Food Preparation & Serving (79 | 11.7%), Cleaning & Maintenance (77 | 11.4%), Healthcare Support (53 | 7.8%), Security & Protection (41 | 6.1%), and Firefighting & Prevention (41 | 6.1%).
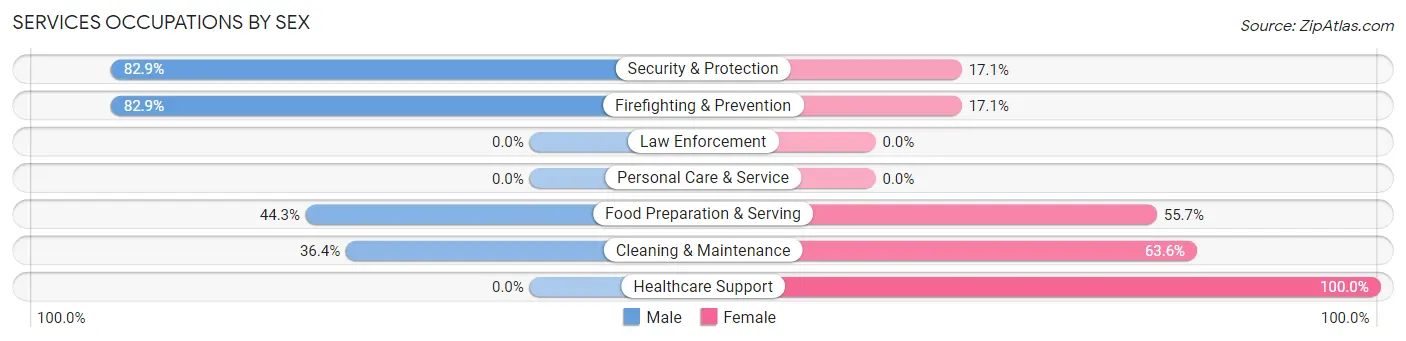
Services Occupations by Sex
Within the Services occupations in Rosepine, the most male-oriented occupations are Security & Protection (82.9%), Firefighting & Prevention (82.9%), and Food Preparation & Serving (44.3%), while the most female-oriented occupations are Healthcare Support (100.0%), Cleaning & Maintenance (63.6%), and Food Preparation & Serving (55.7%).
| Occupation | Male | Female |
| Healthcare Support | 0 (0.0%) | 53 (100.0%) |
| Security & Protection | 34 (82.9%) | 7 (17.1%) |
| Firefighting & Prevention | 34 (82.9%) | 7 (17.1%) |
| Law Enforcement | 0 (0.0%) | 0 (0.0%) |
| Food Preparation & Serving | 35 (44.3%) | 44 (55.7%) |
| Cleaning & Maintenance | 28 (36.4%) | 49 (63.6%) |
| Personal Care & Service | 0 (0.0%) | 0 (0.0%) |
| Total (Category) | 97 (38.8%) | 153 (61.2%) |
| Total (Overall) | 359 (53.0%) | 318 (47.0%) |
Sales and Office Occupations
The most common Sales and Office occupations in Rosepine are Office & Administration (28 | 4.1%), and Sales & Related (20 | 2.9%).

Sales and Office Occupations by Sex
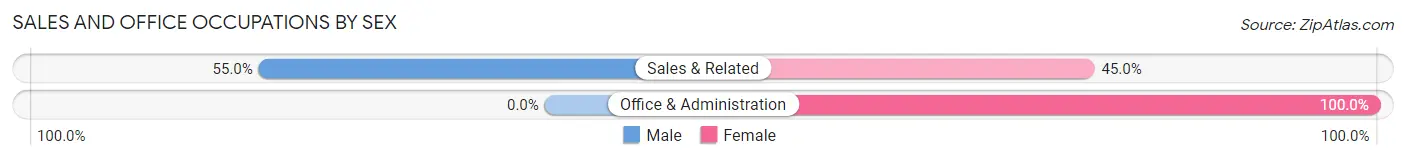
| Occupation | Male | Female |
| Sales & Related | 11 (55.0%) | 9 (45.0%) |
| Office & Administration | 0 (0.0%) | 28 (100.0%) |
| Total (Category) | 11 (22.9%) | 37 (77.1%) |
| Total (Overall) | 359 (53.0%) | 318 (47.0%) |
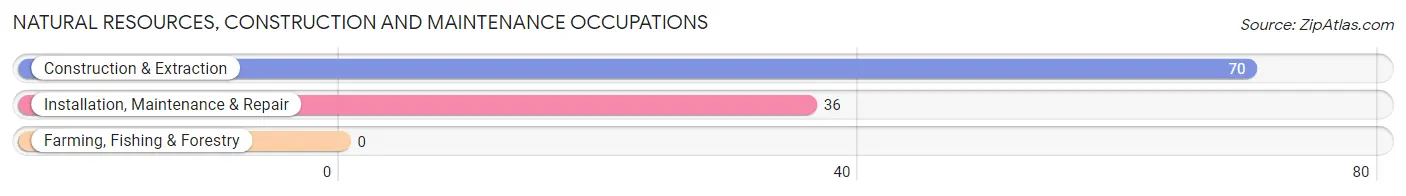
Natural Resources, Construction and Maintenance Occupations
The most common Natural Resources, Construction and Maintenance occupations in Rosepine are Construction & Extraction (70 | 10.3%), and Installation, Maintenance & Repair (36 | 5.3%).
Natural Resources, Construction and Maintenance Occupations by Sex
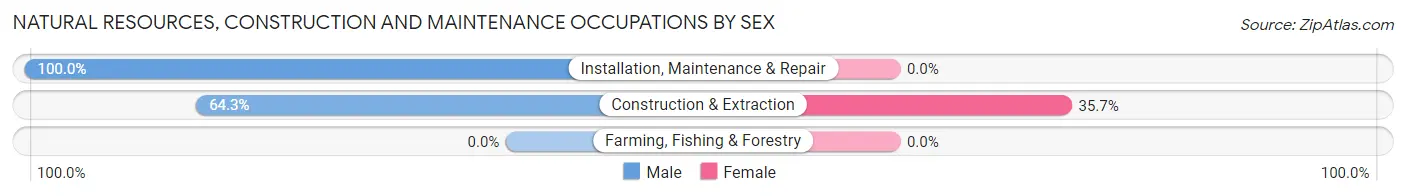
| Occupation | Male | Female |
| Farming, Fishing & Forestry | 0 (0.0%) | 0 (0.0%) |
| Construction & Extraction | 45 (64.3%) | 25 (35.7%) |
| Installation, Maintenance & Repair | 36 (100.0%) | 0 (0.0%) |
| Total (Category) | 81 (76.4%) | 25 (23.6%) |
| Total (Overall) | 359 (53.0%) | 318 (47.0%) |
Production, Transportation and Moving Occupations
The most common Production, Transportation and Moving occupations in Rosepine are Material Moving (43 | 6.4%), Transportation (30 | 4.4%), and Production (23 | 3.4%).
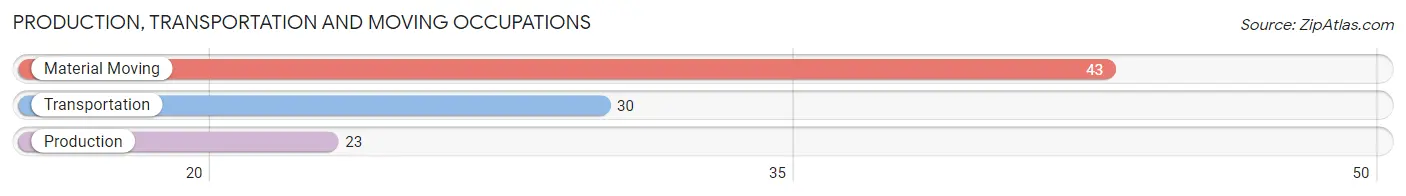
Production, Transportation and Moving Occupations by Sex
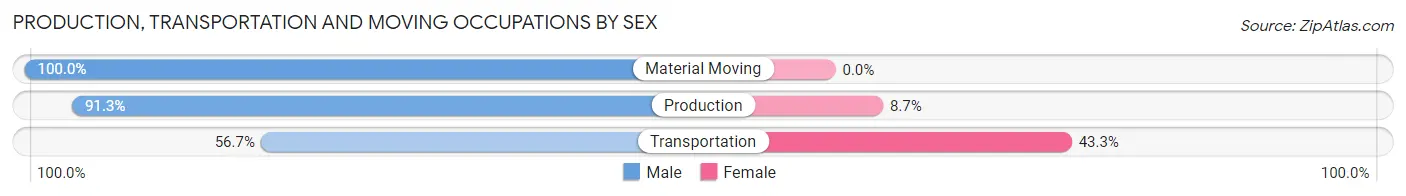
| Occupation | Male | Female |
| Production | 21 (91.3%) | 2 (8.7%) |
| Transportation | 17 (56.7%) | 13 (43.3%) |
| Material Moving | 43 (100.0%) | 0 (0.0%) |
| Total (Category) | 81 (84.4%) | 15 (15.6%) |
| Total (Overall) | 359 (53.0%) | 318 (47.0%) |
Employment Industries by Sex in Rosepine
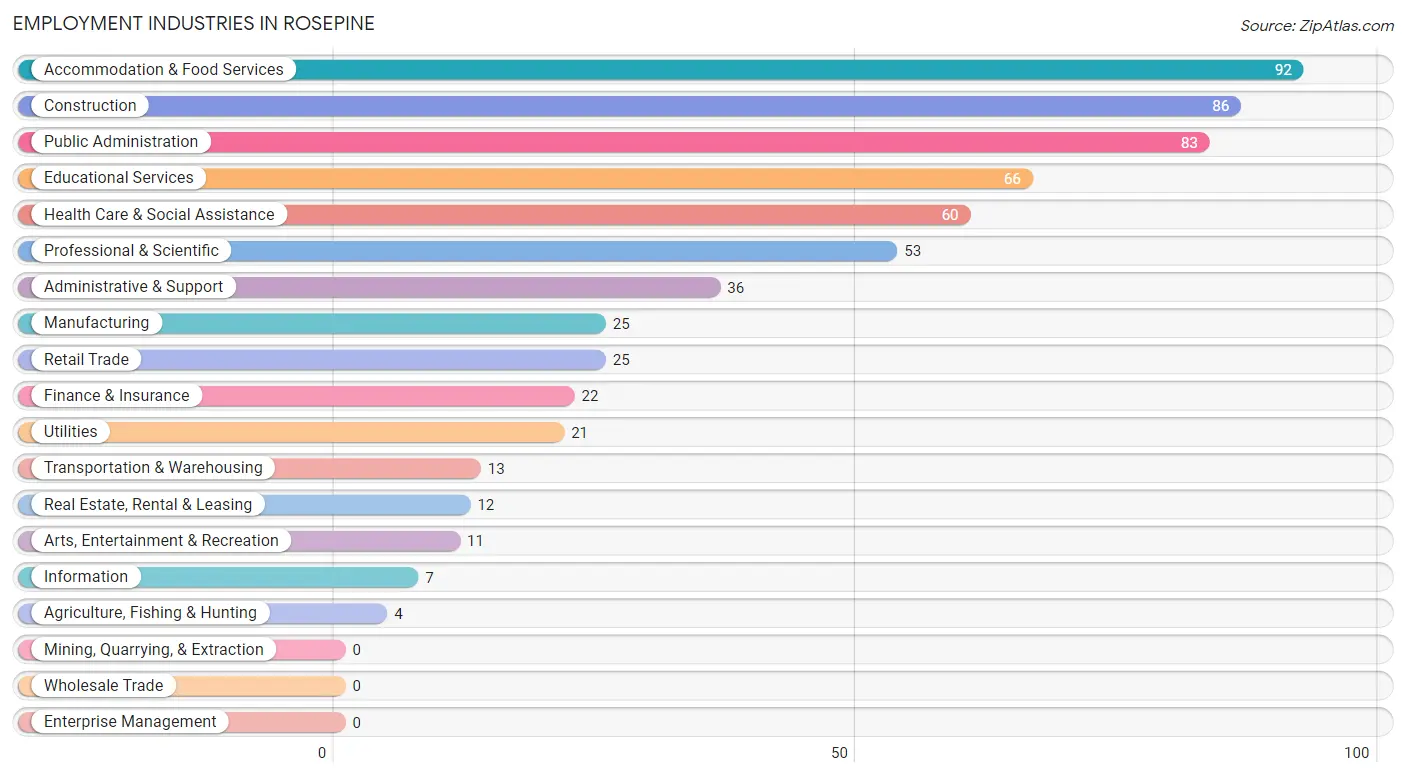
Employment Industries in Rosepine
The major employment industries in Rosepine include Accommodation & Food Services (92 | 13.6%), Construction (86 | 12.7%), Public Administration (83 | 12.3%), Educational Services (66 | 9.8%), and Health Care & Social Assistance (60 | 8.9%).
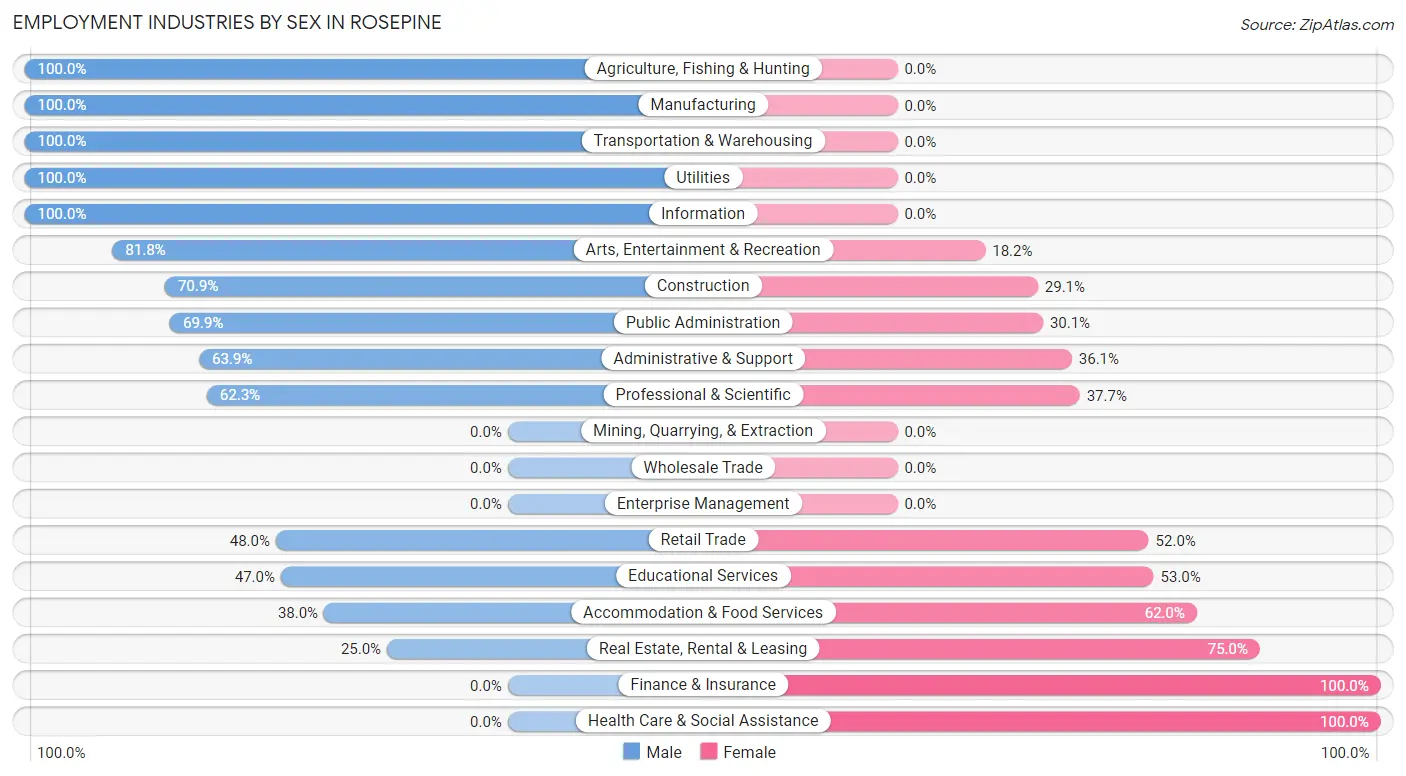
Employment Industries by Sex in Rosepine
The Rosepine industries that see more men than women are Agriculture, Fishing & Hunting (100.0%), Manufacturing (100.0%), and Transportation & Warehousing (100.0%), whereas the industries that tend to have a higher number of women are Finance & Insurance (100.0%), Health Care & Social Assistance (100.0%), and Real Estate, Rental & Leasing (75.0%).
| Industry | Male | Female |
| Agriculture, Fishing & Hunting | 4 (100.0%) | 0 (0.0%) |
| Mining, Quarrying, & Extraction | 0 (0.0%) | 0 (0.0%) |
| Construction | 61 (70.9%) | 25 (29.1%) |
| Manufacturing | 25 (100.0%) | 0 (0.0%) |
| Wholesale Trade | 0 (0.0%) | 0 (0.0%) |
| Retail Trade | 12 (48.0%) | 13 (52.0%) |
| Transportation & Warehousing | 13 (100.0%) | 0 (0.0%) |
| Utilities | 21 (100.0%) | 0 (0.0%) |
| Information | 7 (100.0%) | 0 (0.0%) |
| Finance & Insurance | 0 (0.0%) | 22 (100.0%) |
| Real Estate, Rental & Leasing | 3 (25.0%) | 9 (75.0%) |
| Professional & Scientific | 33 (62.3%) | 20 (37.7%) |
| Enterprise Management | 0 (0.0%) | 0 (0.0%) |
| Administrative & Support | 23 (63.9%) | 13 (36.1%) |
| Educational Services | 31 (47.0%) | 35 (53.0%) |
| Health Care & Social Assistance | 0 (0.0%) | 60 (100.0%) |
| Arts, Entertainment & Recreation | 9 (81.8%) | 2 (18.2%) |
| Accommodation & Food Services | 35 (38.0%) | 57 (62.0%) |
| Public Administration | 58 (69.9%) | 25 (30.1%) |
| Total | 359 (53.0%) | 318 (47.0%) |
Education in Rosepine
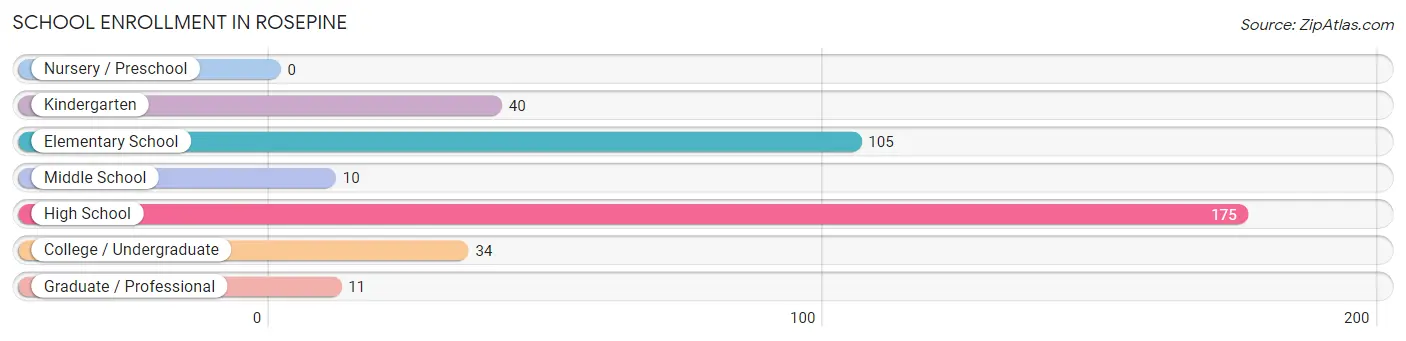
School Enrollment in Rosepine
The most common levels of schooling among the 375 students in Rosepine are high school (175 | 46.7%), elementary school (105 | 28.0%), and kindergarten (40 | 10.7%).
| School Level | # Students | % Students |
| Nursery / Preschool | 0 | 0.0% |
| Kindergarten | 40 | 10.7% |
| Elementary School | 105 | 28.0% |
| Middle School | 10 | 2.7% |
| High School | 175 | 46.7% |
| College / Undergraduate | 34 | 9.1% |
| Graduate / Professional | 11 | 2.9% |
| Total | 375 | 100.0% |
School Enrollment by Age by Funding Source in Rosepine
Out of a total of 375 students who are enrolled in schools in Rosepine, 41 (10.9%) attend a private institution, while the remaining 334 (89.1%) are enrolled in public schools. The age group of 3 to 4 year olds has the highest likelihood of being enrolled in private schools, with 10 (100.0% in the age bracket) enrolled. Conversely, the age group of 15 to 17 year olds has the lowest likelihood of being enrolled in a private school, with 59 (100.0% in the age bracket) attending a public institution.
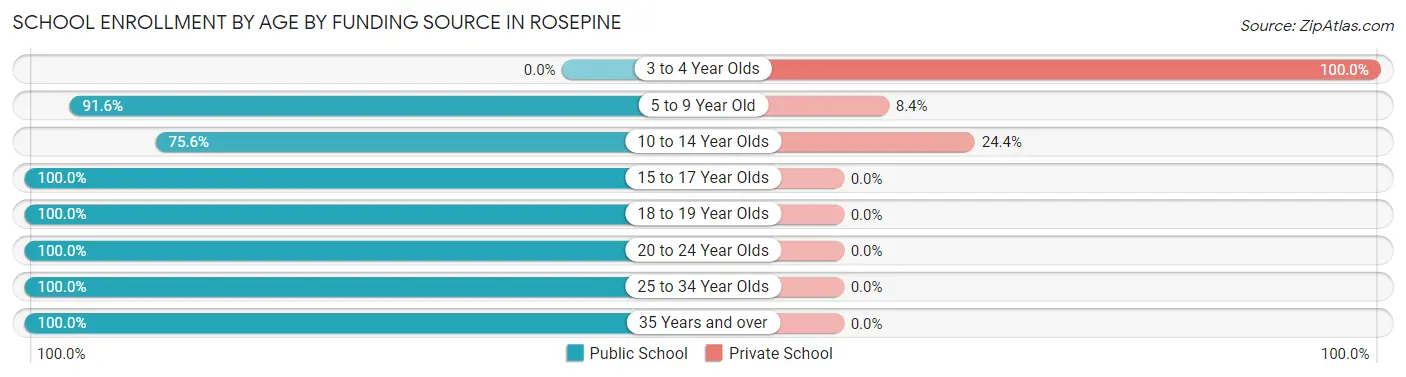
| Age Bracket | Public School | Private School |
| 3 to 4 Year Olds | 0 (0.0%) | 10 (100.0%) |
| 5 to 9 Year Old | 109 (91.6%) | 10 (8.4%) |
| 10 to 14 Year Olds | 65 (75.6%) | 21 (24.4%) |
| 15 to 17 Year Olds | 59 (100.0%) | 0 (0.0%) |
| 18 to 19 Year Olds | 66 (100.0%) | 0 (0.0%) |
| 20 to 24 Year Olds | 20 (100.0%) | 0 (0.0%) |
| 25 to 34 Year Olds | 7 (100.0%) | 0 (0.0%) |
| 35 Years and over | 8 (100.0%) | 0 (0.0%) |
| Total | 334 (89.1%) | 41 (10.9%) |
Educational Attainment by Field of Study in Rosepine
Arts & humanities (47 | 24.2%), business (29 | 14.9%), science & technology (28 | 14.4%), liberal arts & history (21 | 10.8%), and education (17 | 8.8%) are the most common fields of study among 194 individuals in Rosepine who have obtained a bachelor's degree or higher.
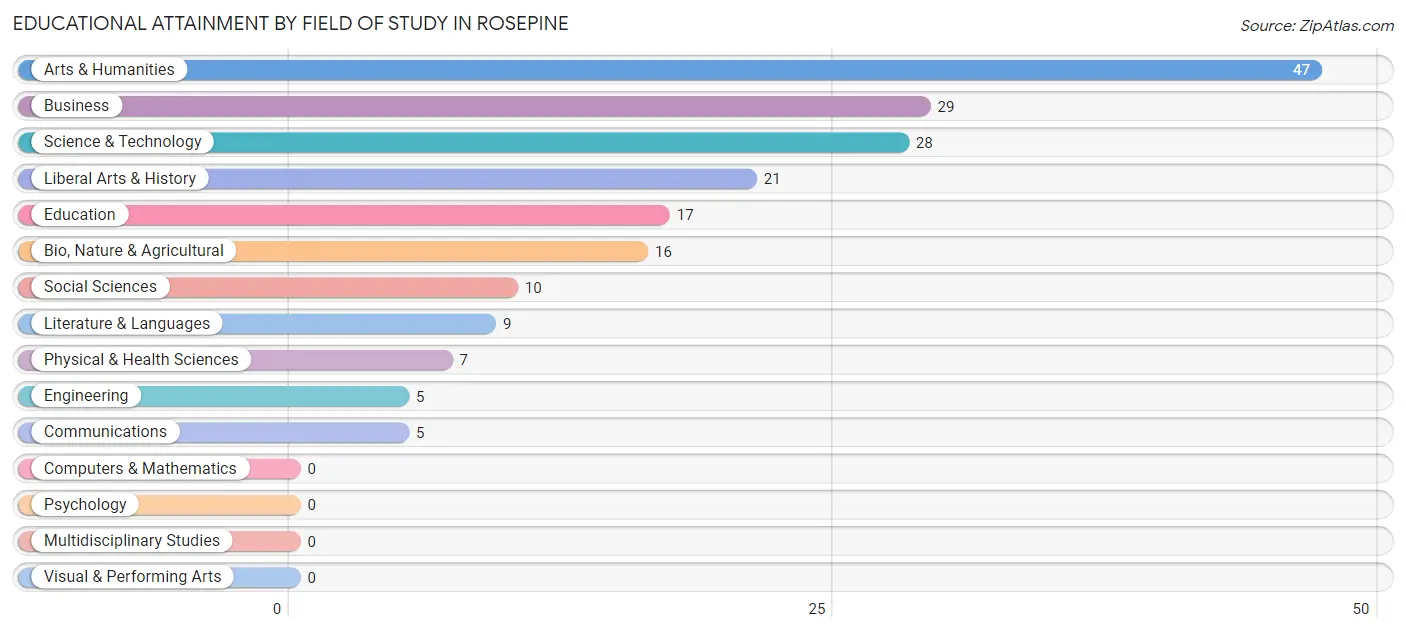
| Field of Study | # Graduates | % Graduates |
| Computers & Mathematics | 0 | 0.0% |
| Bio, Nature & Agricultural | 16 | 8.3% |
| Physical & Health Sciences | 7 | 3.6% |
| Psychology | 0 | 0.0% |
| Social Sciences | 10 | 5.1% |
| Engineering | 5 | 2.6% |
| Multidisciplinary Studies | 0 | 0.0% |
| Science & Technology | 28 | 14.4% |
| Business | 29 | 14.9% |
| Education | 17 | 8.8% |
| Literature & Languages | 9 | 4.6% |
| Liberal Arts & History | 21 | 10.8% |
| Visual & Performing Arts | 0 | 0.0% |
| Communications | 5 | 2.6% |
| Arts & Humanities | 47 | 24.2% |
| Total | 194 | 100.0% |
Transportation & Commute in Rosepine
Vehicle Availability by Sex in Rosepine
The most prevalent vehicle ownership categories in Rosepine are males with 2 vehicles (192, accounting for 45.9%) and females with 2 vehicles (87, making up 60.0%).
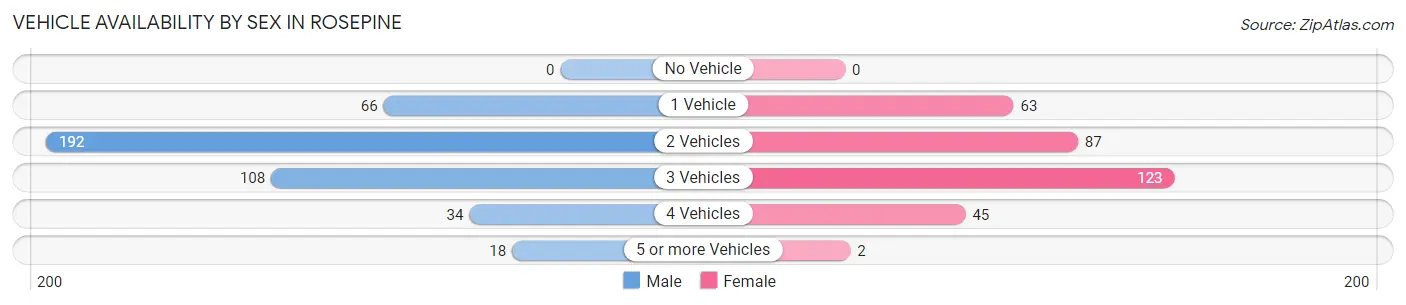
| Vehicles Available | Male | Female |
| No Vehicle | 0 (0.0%) | 0 (0.0%) |
| 1 Vehicle | 66 (15.8%) | 63 (19.7%) |
| 2 Vehicles | 192 (45.9%) | 87 (27.2%) |
| 3 Vehicles | 108 (25.8%) | 123 (38.4%) |
| 4 Vehicles | 34 (8.1%) | 45 (14.1%) |
| 5 or more Vehicles | 18 (4.3%) | 2 (0.6%) |
| Total | 418 (100.0%) | 320 (100.0%) |
Commute Time in Rosepine
The most frequently occuring commute durations in Rosepine are 20 to 24 minutes (141 commuters, 19.3%), 15 to 19 minutes (133 commuters, 18.2%), and 30 to 34 minutes (133 commuters, 18.2%).
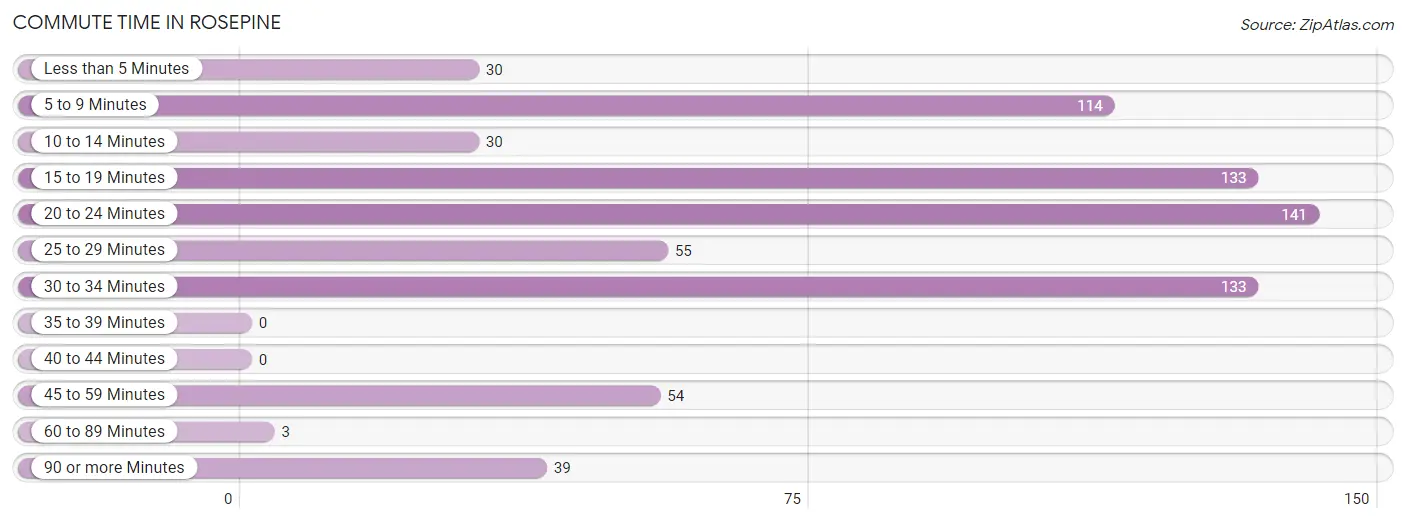
| Commute Time | # Commuters | % Commuters |
| Less than 5 Minutes | 30 | 4.1% |
| 5 to 9 Minutes | 114 | 15.6% |
| 10 to 14 Minutes | 30 | 4.1% |
| 15 to 19 Minutes | 133 | 18.2% |
| 20 to 24 Minutes | 141 | 19.3% |
| 25 to 29 Minutes | 55 | 7.5% |
| 30 to 34 Minutes | 133 | 18.2% |
| 35 to 39 Minutes | 0 | 0.0% |
| 40 to 44 Minutes | 0 | 0.0% |
| 45 to 59 Minutes | 54 | 7.4% |
| 60 to 89 Minutes | 3 | 0.4% |
| 90 or more Minutes | 39 | 5.3% |
Commute Time by Sex in Rosepine
The most common commute times in Rosepine are 30 to 34 minutes (94 commuters, 22.5%) for males and 20 to 24 minutes (58 commuters, 18.5%) for females.
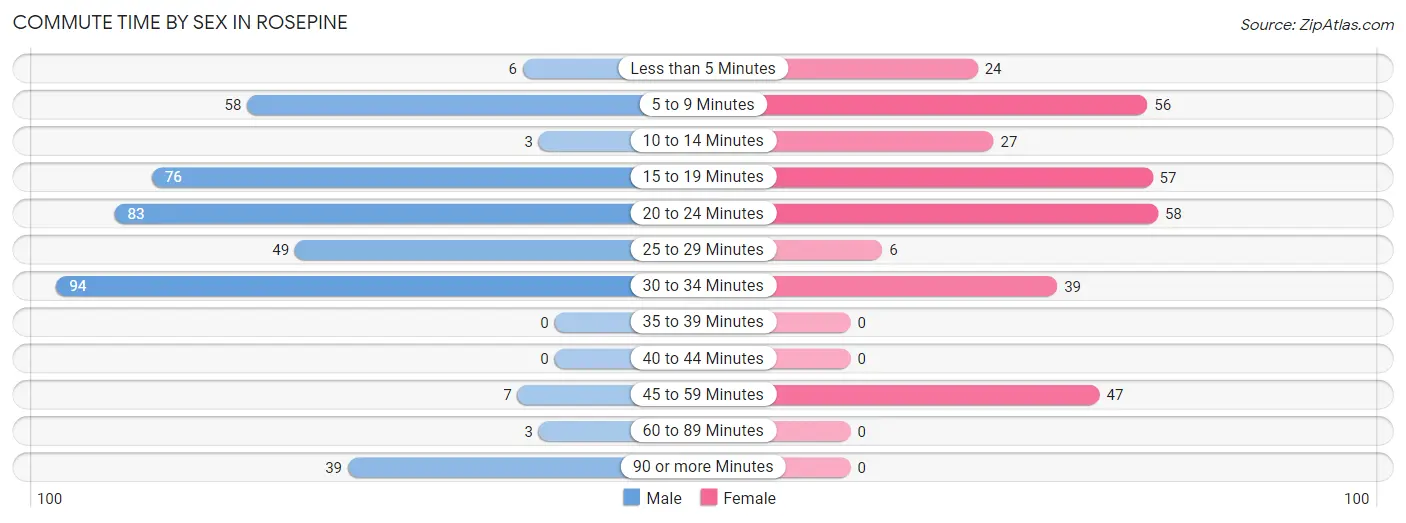
| Commute Time | Male | Female |
| Less than 5 Minutes | 6 (1.4%) | 24 (7.6%) |
| 5 to 9 Minutes | 58 (13.9%) | 56 (17.8%) |
| 10 to 14 Minutes | 3 (0.7%) | 27 (8.6%) |
| 15 to 19 Minutes | 76 (18.2%) | 57 (18.1%) |
| 20 to 24 Minutes | 83 (19.9%) | 58 (18.5%) |
| 25 to 29 Minutes | 49 (11.7%) | 6 (1.9%) |
| 30 to 34 Minutes | 94 (22.5%) | 39 (12.4%) |
| 35 to 39 Minutes | 0 (0.0%) | 0 (0.0%) |
| 40 to 44 Minutes | 0 (0.0%) | 0 (0.0%) |
| 45 to 59 Minutes | 7 (1.7%) | 47 (15.0%) |
| 60 to 89 Minutes | 3 (0.7%) | 0 (0.0%) |
| 90 or more Minutes | 39 (9.3%) | 0 (0.0%) |
Time of Departure to Work by Sex in Rosepine
The most frequent times of departure to work in Rosepine are 6:30 AM to 6:59 AM (96, 23.0%) for males and 6:30 AM to 6:59 AM (86, 27.4%) for females.
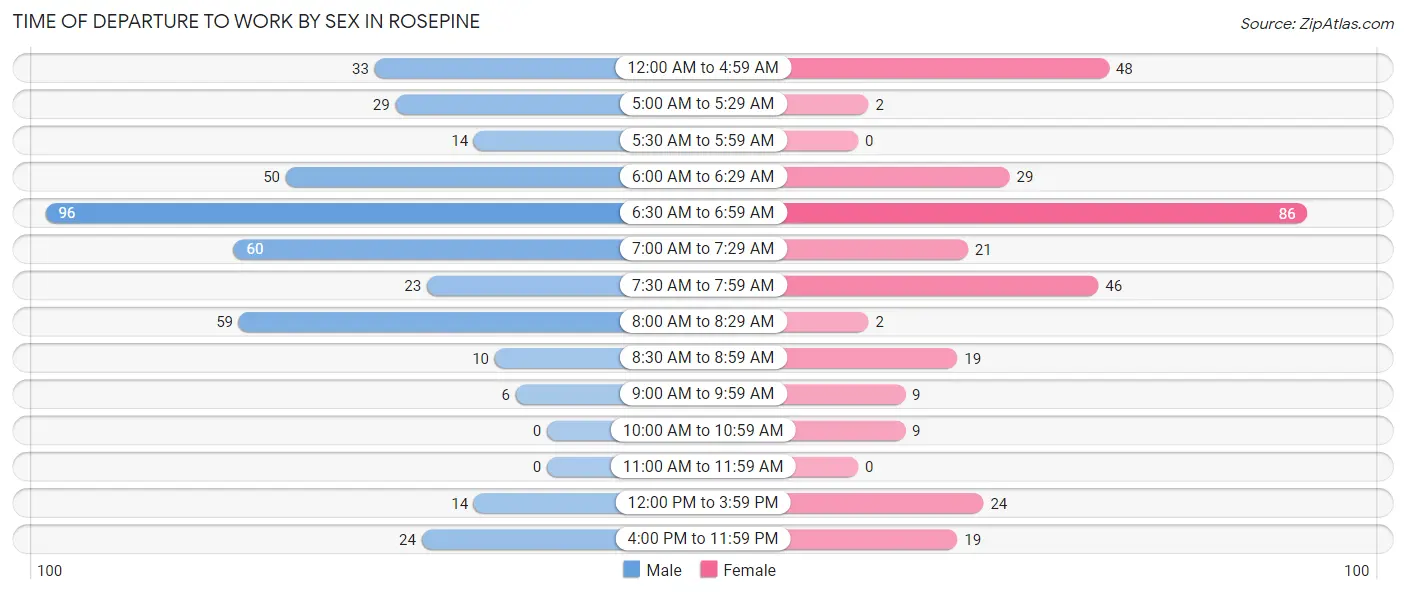
| Time of Departure | Male | Female |
| 12:00 AM to 4:59 AM | 33 (7.9%) | 48 (15.3%) |
| 5:00 AM to 5:29 AM | 29 (6.9%) | 2 (0.6%) |
| 5:30 AM to 5:59 AM | 14 (3.4%) | 0 (0.0%) |
| 6:00 AM to 6:29 AM | 50 (12.0%) | 29 (9.2%) |
| 6:30 AM to 6:59 AM | 96 (23.0%) | 86 (27.4%) |
| 7:00 AM to 7:29 AM | 60 (14.3%) | 21 (6.7%) |
| 7:30 AM to 7:59 AM | 23 (5.5%) | 46 (14.6%) |
| 8:00 AM to 8:29 AM | 59 (14.1%) | 2 (0.6%) |
| 8:30 AM to 8:59 AM | 10 (2.4%) | 19 (6.0%) |
| 9:00 AM to 9:59 AM | 6 (1.4%) | 9 (2.9%) |
| 10:00 AM to 10:59 AM | 0 (0.0%) | 9 (2.9%) |
| 11:00 AM to 11:59 AM | 0 (0.0%) | 0 (0.0%) |
| 12:00 PM to 3:59 PM | 14 (3.4%) | 24 (7.6%) |
| 4:00 PM to 11:59 PM | 24 (5.7%) | 19 (6.0%) |
| Total | 418 (100.0%) | 314 (100.0%) |
Housing Occupancy in Rosepine
Occupancy by Ownership in Rosepine
Of the total 618 dwellings in Rosepine, owner-occupied units account for 342 (55.3%), while renter-occupied units make up 276 (44.7%).
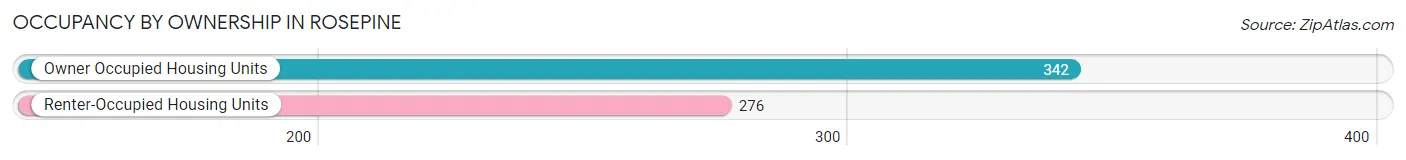
| Occupancy | # Housing Units | % Housing Units |
| Owner Occupied Housing Units | 342 | 55.3% |
| Renter-Occupied Housing Units | 276 | 44.7% |
| Total Occupied Housing Units | 618 | 100.0% |
Occupancy by Household Size in Rosepine
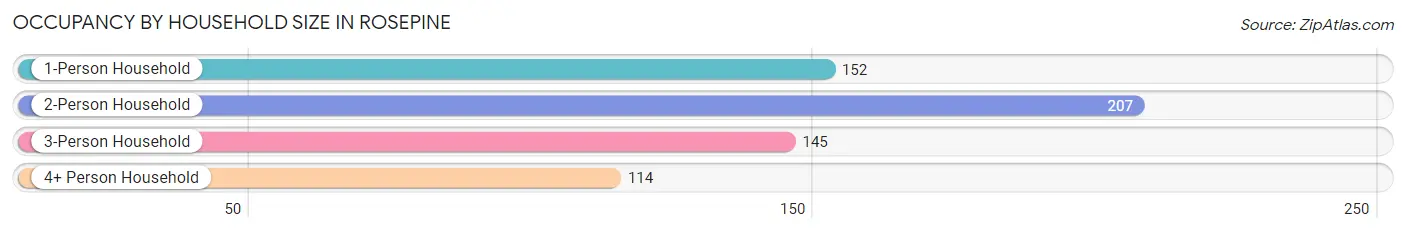
| Household Size | # Housing Units | % Housing Units |
| 1-Person Household | 152 | 24.6% |
| 2-Person Household | 207 | 33.5% |
| 3-Person Household | 145 | 23.5% |
| 4+ Person Household | 114 | 18.4% |
| Total Housing Units | 618 | 100.0% |
Occupancy by Ownership by Household Size in Rosepine
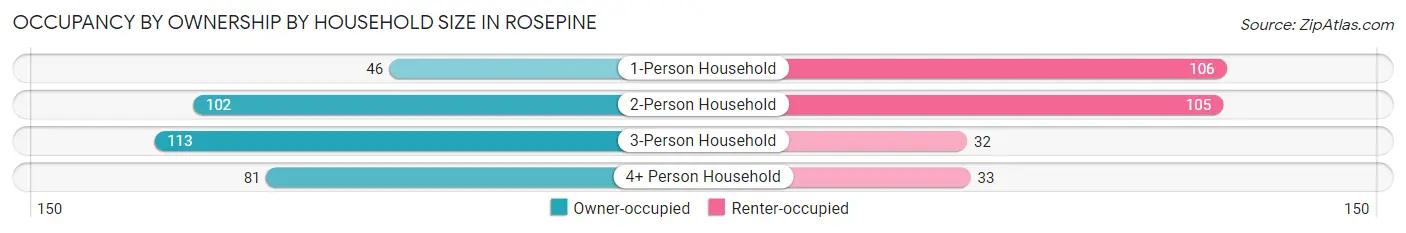
| Household Size | Owner-occupied | Renter-occupied |
| 1-Person Household | 46 (30.3%) | 106 (69.7%) |
| 2-Person Household | 102 (49.3%) | 105 (50.7%) |
| 3-Person Household | 113 (77.9%) | 32 (22.1%) |
| 4+ Person Household | 81 (71.1%) | 33 (28.9%) |
| Total Housing Units | 342 (55.3%) | 276 (44.7%) |
Occupancy by Educational Attainment in Rosepine
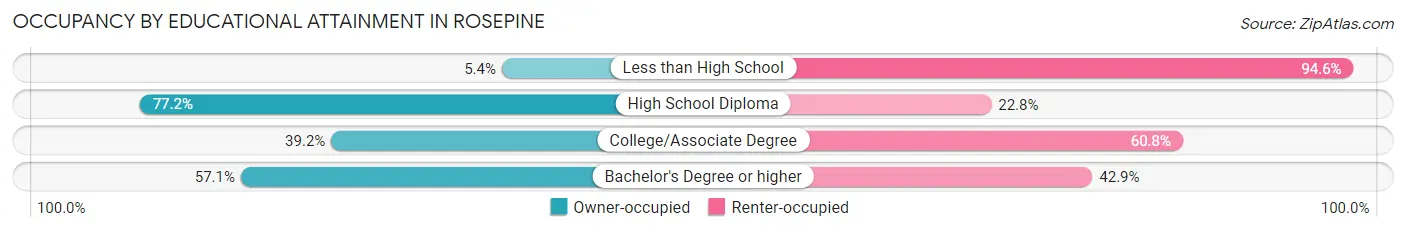
| Household Size | Owner-occupied | Renter-occupied |
| Less than High School | 5 (5.4%) | 88 (94.6%) |
| High School Diploma | 213 (77.2%) | 63 (22.8%) |
| College/Associate Degree | 40 (39.2%) | 62 (60.8%) |
| Bachelor's Degree or higher | 84 (57.1%) | 63 (42.9%) |
Occupancy by Age of Householder in Rosepine
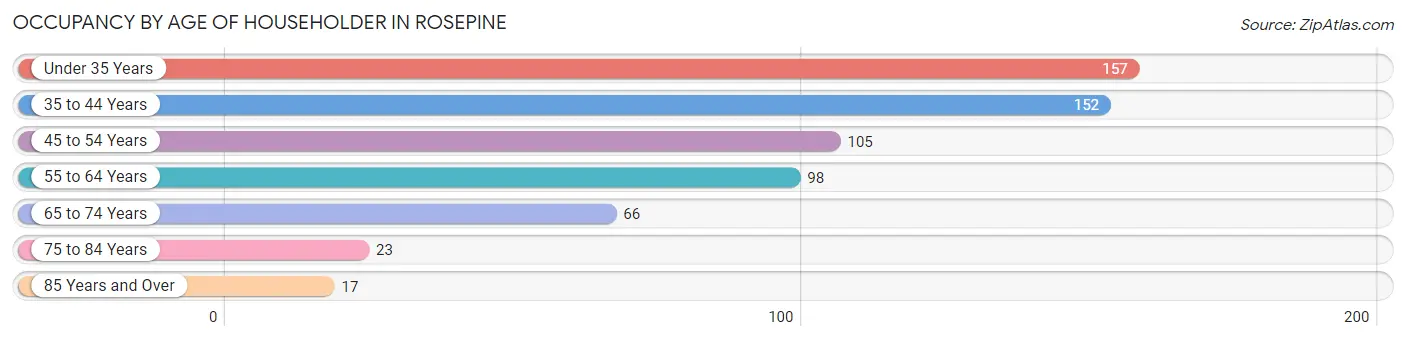
| Age Bracket | # Households | % Households |
| Under 35 Years | 157 | 25.4% |
| 35 to 44 Years | 152 | 24.6% |
| 45 to 54 Years | 105 | 17.0% |
| 55 to 64 Years | 98 | 15.9% |
| 65 to 74 Years | 66 | 10.7% |
| 75 to 84 Years | 23 | 3.7% |
| 85 Years and Over | 17 | 2.8% |
| Total | 618 | 100.0% |
Housing Finances in Rosepine
Median Income by Occupancy in Rosepine
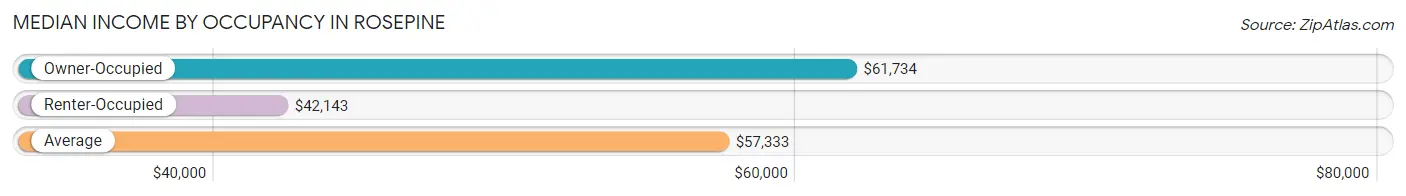
| Occupancy Type | # Households | Median Income |
| Owner-Occupied | 342 (55.3%) | $61,734 |
| Renter-Occupied | 276 (44.7%) | $42,143 |
| Average | 618 (100.0%) | $57,333 |
Occupancy by Householder Income Bracket in Rosepine
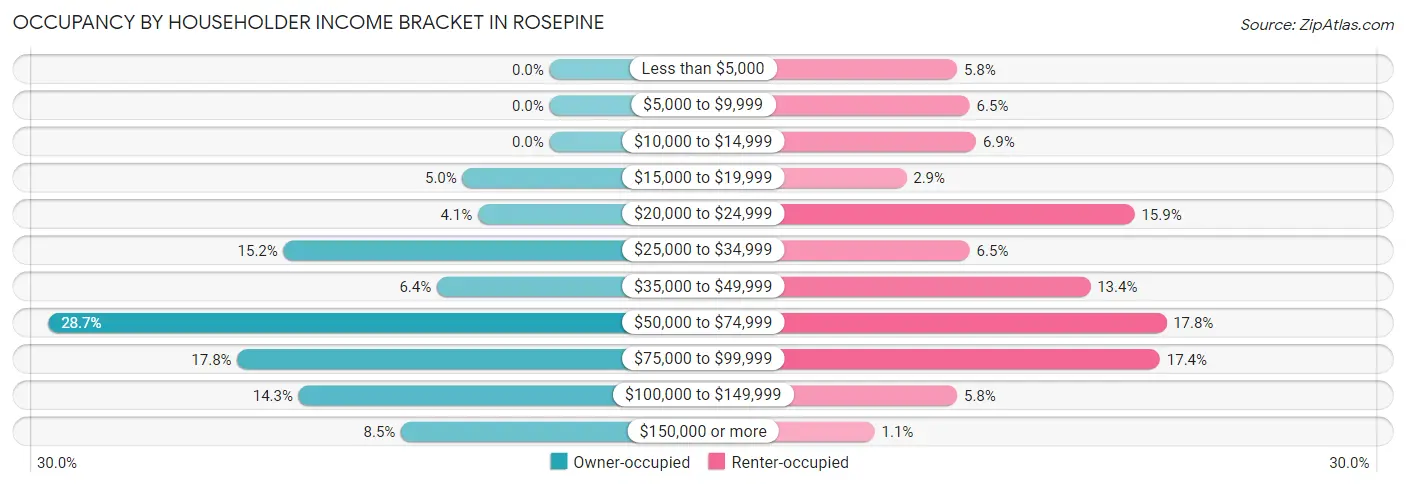
| Income Bracket | Owner-occupied | Renter-occupied |
| Less than $5,000 | 0 (0.0%) | 16 (5.8%) |
| $5,000 to $9,999 | 0 (0.0%) | 18 (6.5%) |
| $10,000 to $14,999 | 0 (0.0%) | 19 (6.9%) |
| $15,000 to $19,999 | 17 (5.0%) | 8 (2.9%) |
| $20,000 to $24,999 | 14 (4.1%) | 44 (15.9%) |
| $25,000 to $34,999 | 52 (15.2%) | 18 (6.5%) |
| $35,000 to $49,999 | 22 (6.4%) | 37 (13.4%) |
| $50,000 to $74,999 | 98 (28.6%) | 49 (17.7%) |
| $75,000 to $99,999 | 61 (17.8%) | 48 (17.4%) |
| $100,000 to $149,999 | 49 (14.3%) | 16 (5.8%) |
| $150,000 or more | 29 (8.5%) | 3 (1.1%) |
| Total | 342 (100.0%) | 276 (100.0%) |
Monthly Housing Cost Tiers in Rosepine
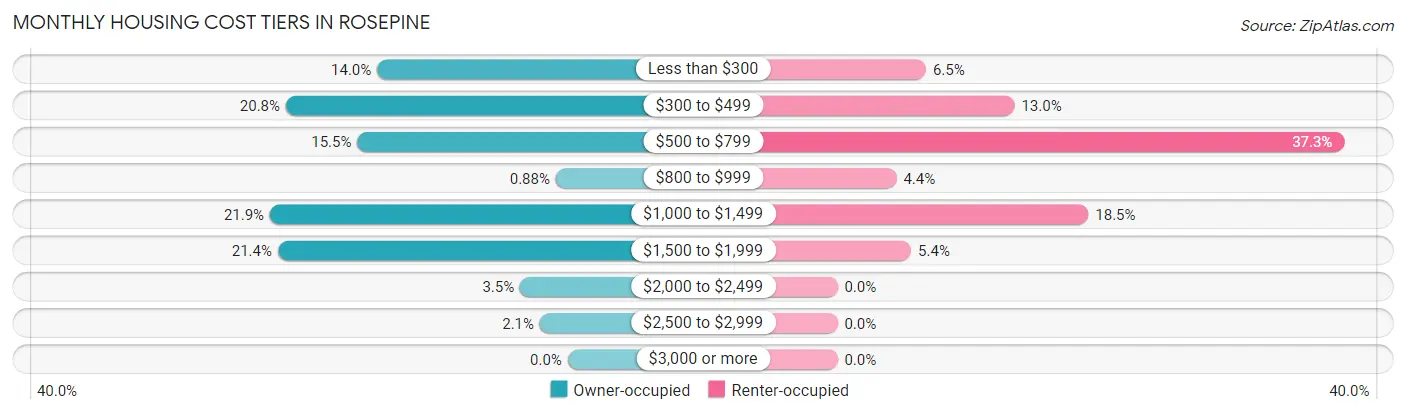
| Monthly Cost | Owner-occupied | Renter-occupied |
| Less than $300 | 48 (14.0%) | 18 (6.5%) |
| $300 to $499 | 71 (20.8%) | 36 (13.0%) |
| $500 to $799 | 53 (15.5%) | 103 (37.3%) |
| $800 to $999 | 3 (0.9%) | 12 (4.3%) |
| $1,000 to $1,499 | 75 (21.9%) | 51 (18.5%) |
| $1,500 to $1,999 | 73 (21.3%) | 15 (5.4%) |
| $2,000 to $2,499 | 12 (3.5%) | 0 (0.0%) |
| $2,500 to $2,999 | 7 (2.1%) | 0 (0.0%) |
| $3,000 or more | 0 (0.0%) | 0 (0.0%) |
| Total | 342 (100.0%) | 276 (100.0%) |
Physical Housing Characteristics in Rosepine
Housing Structures in Rosepine
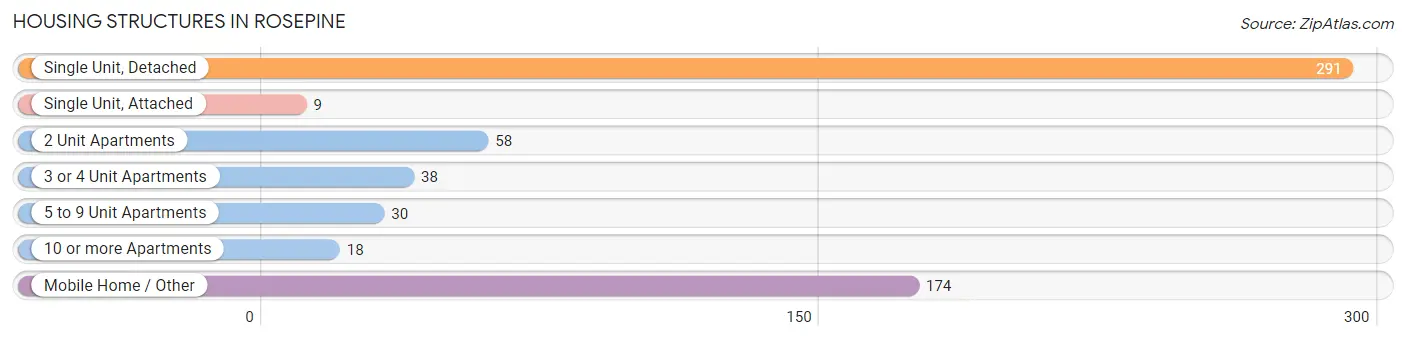
| Structure Type | # Housing Units | % Housing Units |
| Single Unit, Detached | 291 | 47.1% |
| Single Unit, Attached | 9 | 1.5% |
| 2 Unit Apartments | 58 | 9.4% |
| 3 or 4 Unit Apartments | 38 | 6.1% |
| 5 to 9 Unit Apartments | 30 | 4.9% |
| 10 or more Apartments | 18 | 2.9% |
| Mobile Home / Other | 174 | 28.2% |
| Total | 618 | 100.0% |
Housing Structures by Occupancy in Rosepine
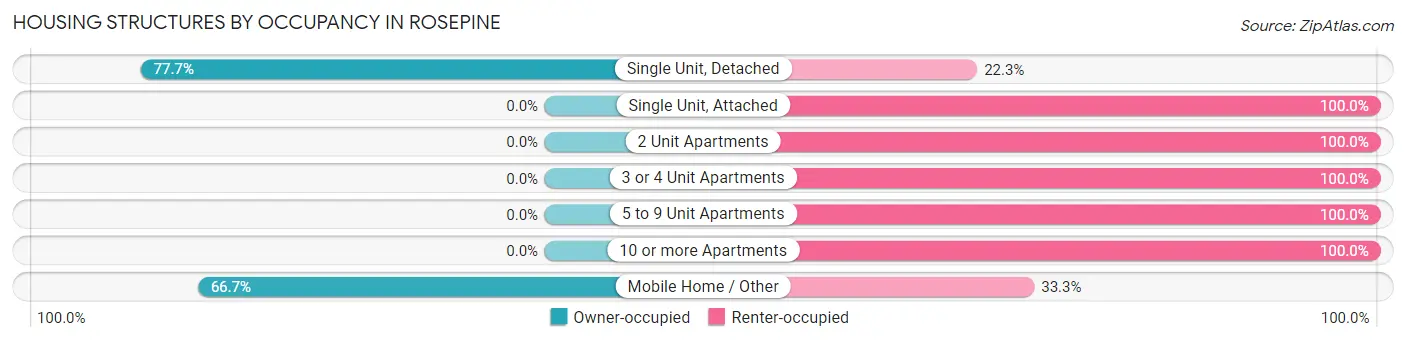
| Structure Type | Owner-occupied | Renter-occupied |
| Single Unit, Detached | 226 (77.7%) | 65 (22.3%) |
| Single Unit, Attached | 0 (0.0%) | 9 (100.0%) |
| 2 Unit Apartments | 0 (0.0%) | 58 (100.0%) |
| 3 or 4 Unit Apartments | 0 (0.0%) | 38 (100.0%) |
| 5 to 9 Unit Apartments | 0 (0.0%) | 30 (100.0%) |
| 10 or more Apartments | 0 (0.0%) | 18 (100.0%) |
| Mobile Home / Other | 116 (66.7%) | 58 (33.3%) |
| Total | 342 (55.3%) | 276 (44.7%) |
Housing Structures by Number of Rooms in Rosepine
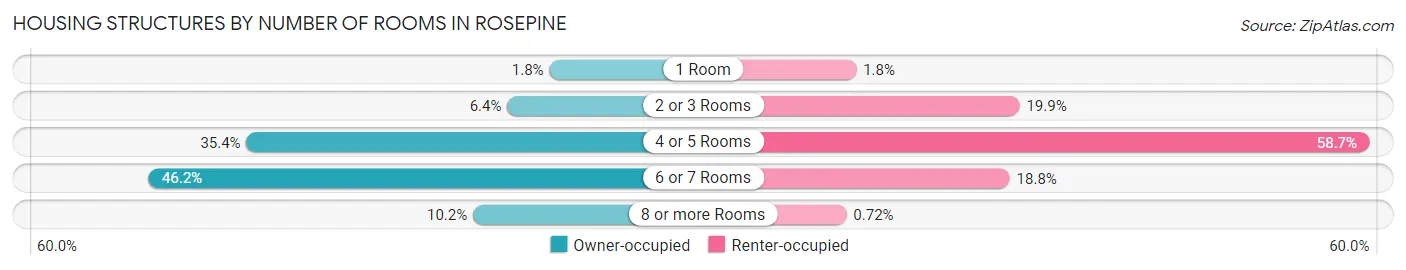
| Number of Rooms | Owner-occupied | Renter-occupied |
| 1 Room | 6 (1.8%) | 5 (1.8%) |
| 2 or 3 Rooms | 22 (6.4%) | 55 (19.9%) |
| 4 or 5 Rooms | 121 (35.4%) | 162 (58.7%) |
| 6 or 7 Rooms | 158 (46.2%) | 52 (18.8%) |
| 8 or more Rooms | 35 (10.2%) | 2 (0.7%) |
| Total | 342 (100.0%) | 276 (100.0%) |
Housing Structure by Heating Type in Rosepine
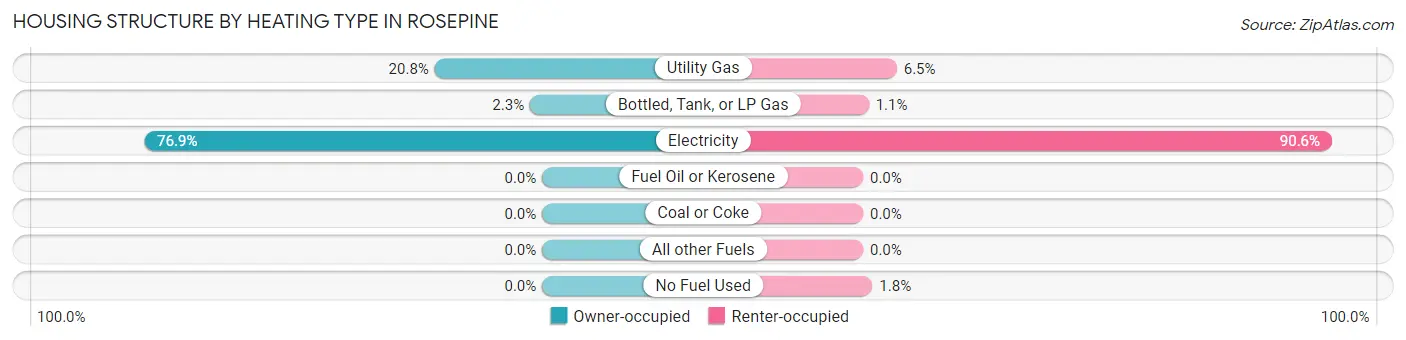
| Heating Type | Owner-occupied | Renter-occupied |
| Utility Gas | 71 (20.8%) | 18 (6.5%) |
| Bottled, Tank, or LP Gas | 8 (2.3%) | 3 (1.1%) |
| Electricity | 263 (76.9%) | 250 (90.6%) |
| Fuel Oil or Kerosene | 0 (0.0%) | 0 (0.0%) |
| Coal or Coke | 0 (0.0%) | 0 (0.0%) |
| All other Fuels | 0 (0.0%) | 0 (0.0%) |
| No Fuel Used | 0 (0.0%) | 5 (1.8%) |
| Total | 342 (100.0%) | 276 (100.0%) |
Household Vehicle Usage in Rosepine
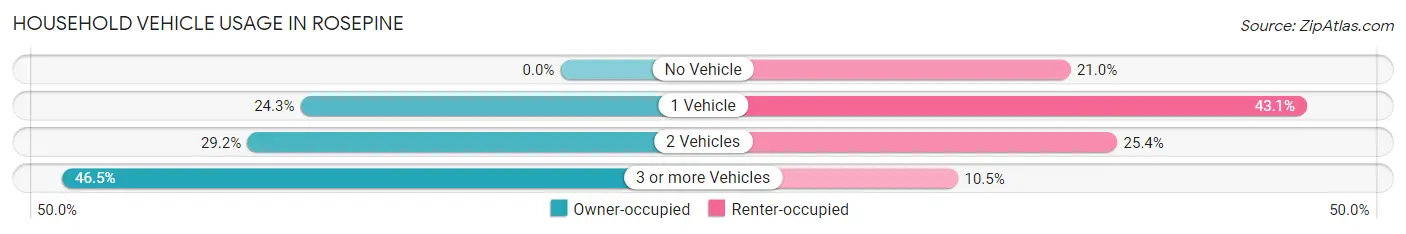
| Vehicles per Household | Owner-occupied | Renter-occupied |
| No Vehicle | 0 (0.0%) | 58 (21.0%) |
| 1 Vehicle | 83 (24.3%) | 119 (43.1%) |
| 2 Vehicles | 100 (29.2%) | 70 (25.4%) |
| 3 or more Vehicles | 159 (46.5%) | 29 (10.5%) |
| Total | 342 (100.0%) | 276 (100.0%) |
Real Estate & Mortgages in Rosepine
Real Estate and Mortgage Overview in Rosepine
| Characteristic | Without Mortgage | With Mortgage |
| Housing Units | 112 | 230 |
| Median Property Value | $57,100 | $207,000 |
| Median Household Income | $34,231 | $27 |
| Monthly Housing Costs | $359 | $0 |
| Real Estate Taxes | $1,477 | $111 |
Property Value by Mortgage Status in Rosepine
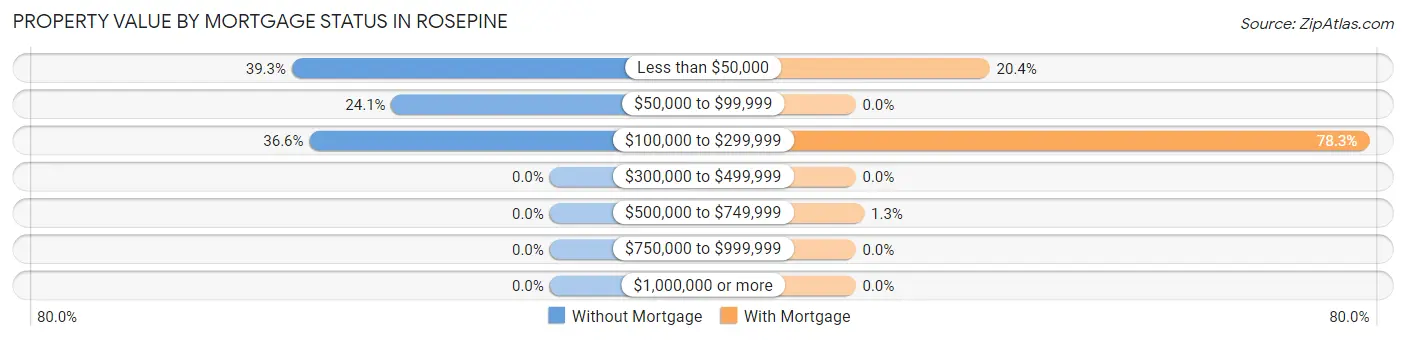
| Property Value | Without Mortgage | With Mortgage |
| Less than $50,000 | 44 (39.3%) | 47 (20.4%) |
| $50,000 to $99,999 | 27 (24.1%) | 0 (0.0%) |
| $100,000 to $299,999 | 41 (36.6%) | 180 (78.3%) |
| $300,000 to $499,999 | 0 (0.0%) | 0 (0.0%) |
| $500,000 to $749,999 | 0 (0.0%) | 3 (1.3%) |
| $750,000 to $999,999 | 0 (0.0%) | 0 (0.0%) |
| $1,000,000 or more | 0 (0.0%) | 0 (0.0%) |
| Total | 112 (100.0%) | 230 (100.0%) |
Household Income by Mortgage Status in Rosepine
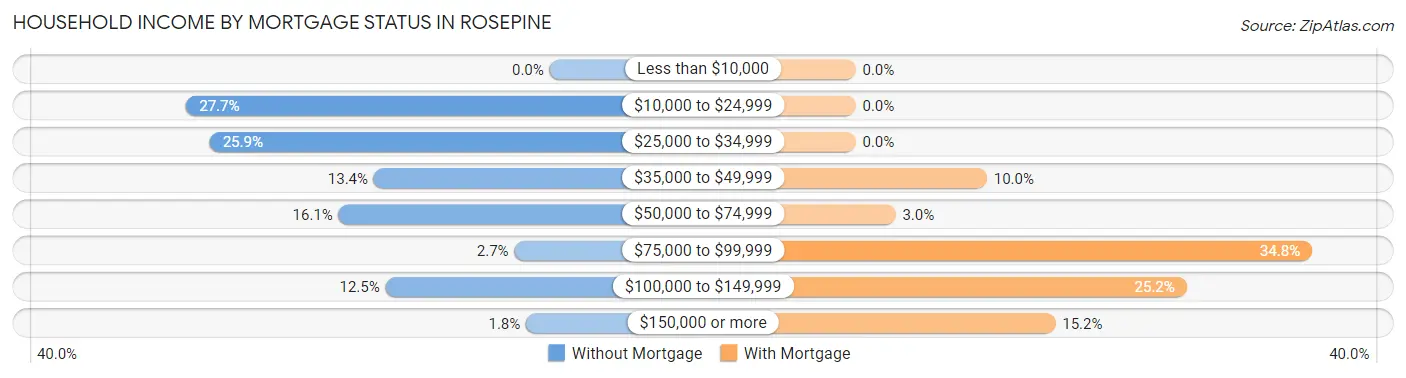
| Household Income | Without Mortgage | With Mortgage |
| Less than $10,000 | 0 (0.0%) | 0 (0.0%) |
| $10,000 to $24,999 | 31 (27.7%) | 0 (0.0%) |
| $25,000 to $34,999 | 29 (25.9%) | 0 (0.0%) |
| $35,000 to $49,999 | 15 (13.4%) | 23 (10.0%) |
| $50,000 to $74,999 | 18 (16.1%) | 7 (3.0%) |
| $75,000 to $99,999 | 3 (2.7%) | 80 (34.8%) |
| $100,000 to $149,999 | 14 (12.5%) | 58 (25.2%) |
| $150,000 or more | 2 (1.8%) | 35 (15.2%) |
| Total | 112 (100.0%) | 230 (100.0%) |
Property Value to Household Income Ratio in Rosepine
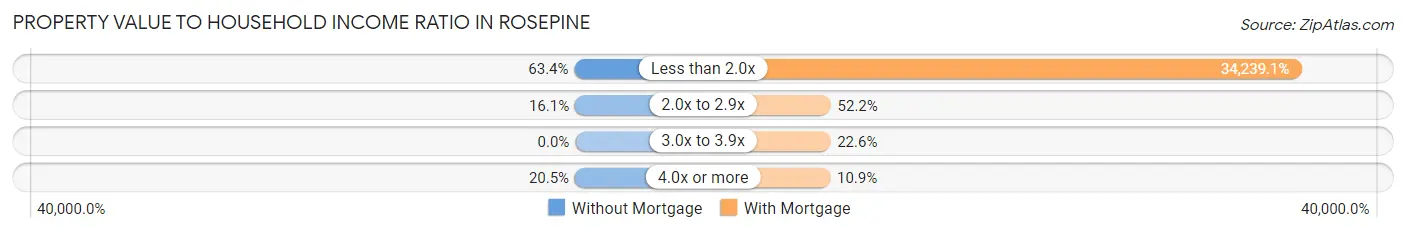
| Value-to-Income Ratio | Without Mortgage | With Mortgage |
| Less than 2.0x | 71 (63.4%) | 78,750 (34,239.1%) |
| 2.0x to 2.9x | 18 (16.1%) | 120 (52.2%) |
| 3.0x to 3.9x | 0 (0.0%) | 52 (22.6%) |
| 4.0x or more | 23 (20.5%) | 25 (10.9%) |
| Total | 112 (100.0%) | 230 (100.0%) |
Real Estate Taxes by Mortgage Status in Rosepine
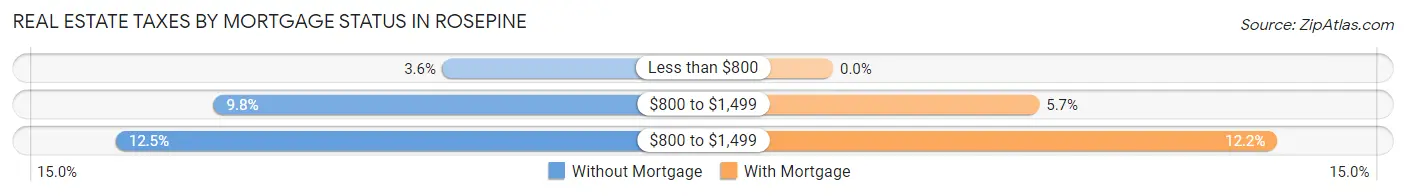
| Property Taxes | Without Mortgage | With Mortgage |
| Less than $800 | 4 (3.6%) | 0 (0.0%) |
| $800 to $1,499 | 11 (9.8%) | 13 (5.7%) |
| $800 to $1,499 | 14 (12.5%) | 28 (12.2%) |
| Total | 112 (100.0%) | 230 (100.0%) |
Health & Disability in Rosepine
Health Insurance Coverage by Age in Rosepine
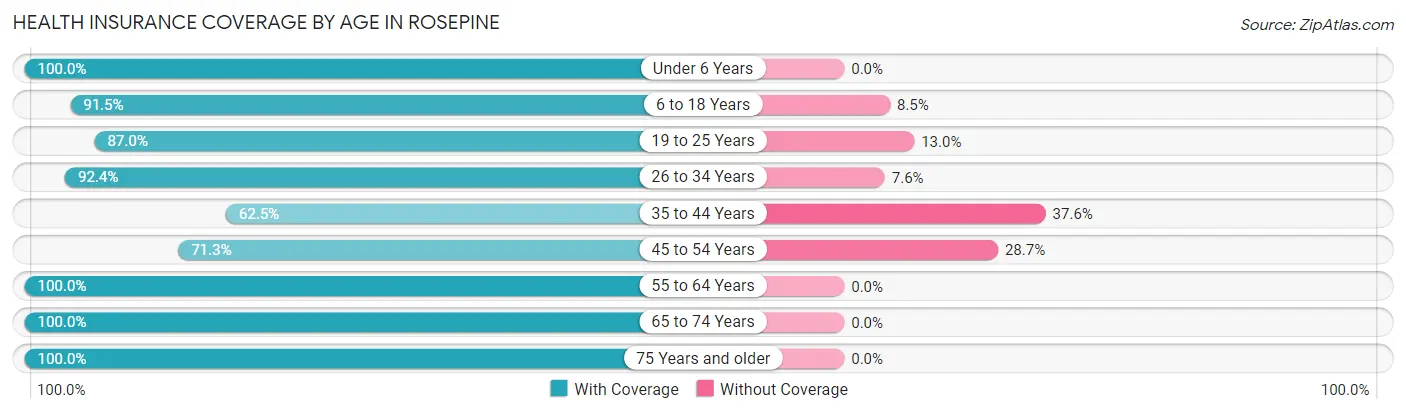
| Age Bracket | With Coverage | Without Coverage |
| Under 6 Years | 99 (100.0%) | 0 (0.0%) |
| 6 to 18 Years | 354 (91.5%) | 33 (8.5%) |
| 19 to 25 Years | 100 (87.0%) | 15 (13.0%) |
| 26 to 34 Years | 220 (92.4%) | 18 (7.6%) |
| 35 to 44 Years | 158 (62.5%) | 95 (37.6%) |
| 45 to 54 Years | 112 (71.3%) | 45 (28.7%) |
| 55 to 64 Years | 132 (100.0%) | 0 (0.0%) |
| 65 to 74 Years | 85 (100.0%) | 0 (0.0%) |
| 75 Years and older | 128 (100.0%) | 0 (0.0%) |
| Total | 1,388 (87.1%) | 206 (12.9%) |
Health Insurance Coverage by Citizenship Status in Rosepine
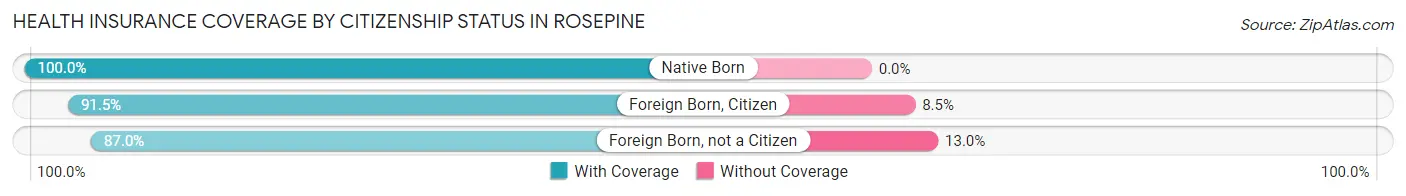
| Citizenship Status | With Coverage | Without Coverage |
| Native Born | 99 (100.0%) | 0 (0.0%) |
| Foreign Born, Citizen | 354 (91.5%) | 33 (8.5%) |
| Foreign Born, not a Citizen | 100 (87.0%) | 15 (13.0%) |
Health Insurance Coverage by Household Income in Rosepine
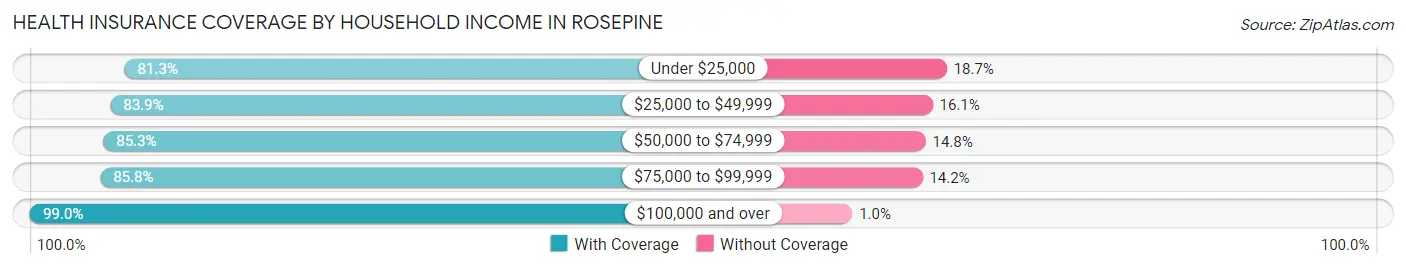
| Household Income | With Coverage | Without Coverage |
| Under $25,000 | 178 (81.3%) | 41 (18.7%) |
| $25,000 to $49,999 | 277 (83.9%) | 53 (16.1%) |
| $50,000 to $74,999 | 422 (85.3%) | 73 (14.7%) |
| $75,000 to $99,999 | 218 (85.8%) | 36 (14.2%) |
| $100,000 and over | 293 (99.0%) | 3 (1.0%) |
Public vs Private Health Insurance Coverage by Age in Rosepine
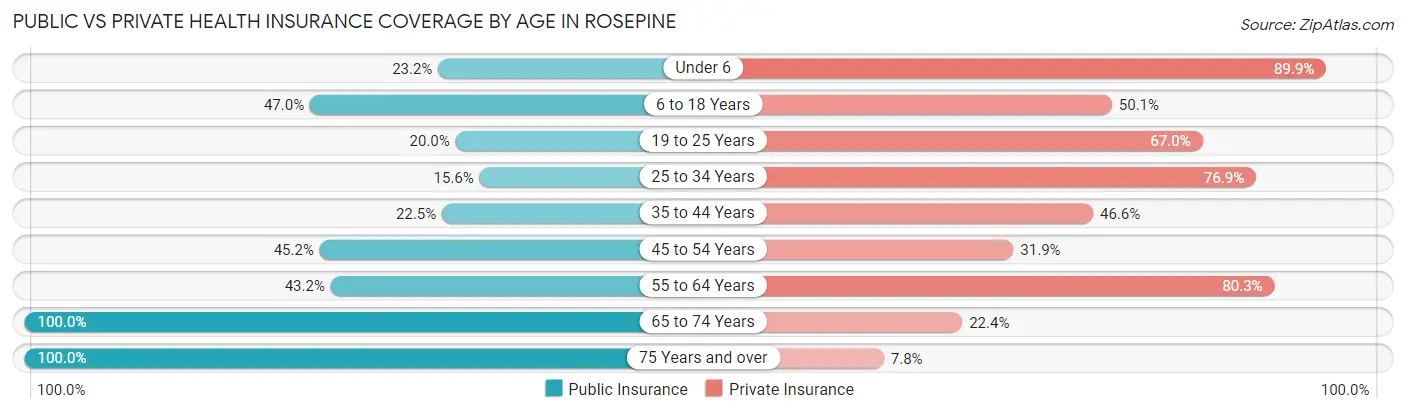
| Age Bracket | Public Insurance | Private Insurance |
| Under 6 | 23 (23.2%) | 89 (89.9%) |
| 6 to 18 Years | 182 (47.0%) | 194 (50.1%) |
| 19 to 25 Years | 23 (20.0%) | 77 (67.0%) |
| 25 to 34 Years | 37 (15.5%) | 183 (76.9%) |
| 35 to 44 Years | 57 (22.5%) | 118 (46.6%) |
| 45 to 54 Years | 71 (45.2%) | 50 (31.9%) |
| 55 to 64 Years | 57 (43.2%) | 106 (80.3%) |
| 65 to 74 Years | 85 (100.0%) | 19 (22.4%) |
| 75 Years and over | 128 (100.0%) | 10 (7.8%) |
| Total | 663 (41.6%) | 846 (53.1%) |
Disability Status by Sex by Age in Rosepine
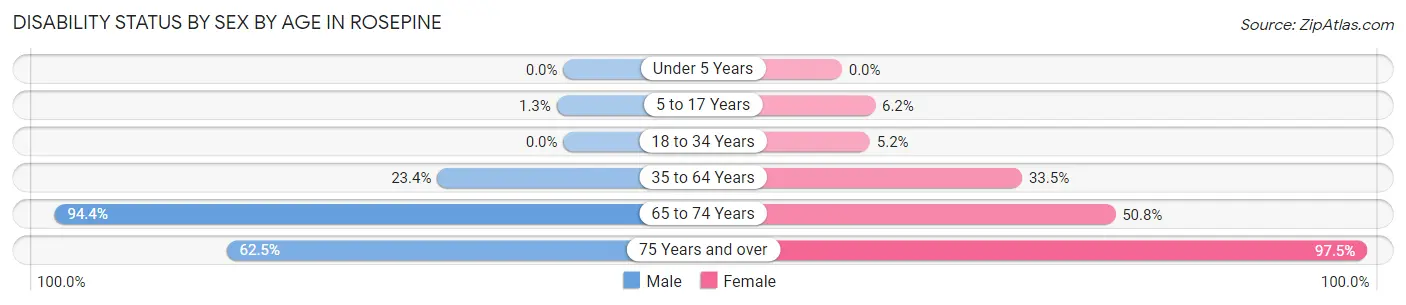
| Age Bracket | Male | Female |
| Under 5 Years | 0 (0.0%) | 0 (0.0%) |
| 5 to 17 Years | 2 (1.3%) | 10 (6.2%) |
| 18 to 34 Years | 0 (0.0%) | 11 (5.2%) |
| 35 to 64 Years | 59 (23.4%) | 97 (33.5%) |
| 65 to 74 Years | 17 (94.4%) | 34 (50.7%) |
| 75 Years and over | 5 (62.5%) | 117 (97.5%) |
Disability Class by Sex by Age in Rosepine
Disability Class: Hearing Difficulty
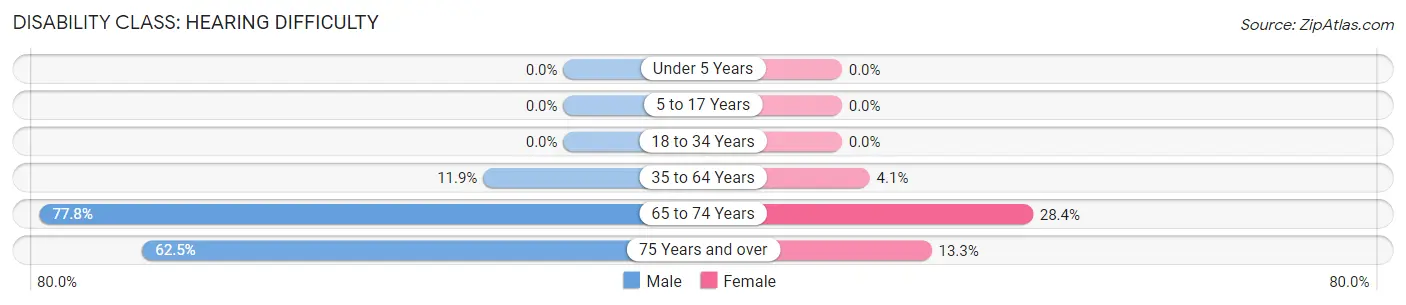
| Age Bracket | Male | Female |
| Under 5 Years | 0 (0.0%) | 0 (0.0%) |
| 5 to 17 Years | 0 (0.0%) | 0 (0.0%) |
| 18 to 34 Years | 0 (0.0%) | 0 (0.0%) |
| 35 to 64 Years | 30 (11.9%) | 12 (4.1%) |
| 65 to 74 Years | 14 (77.8%) | 19 (28.4%) |
| 75 Years and over | 5 (62.5%) | 16 (13.3%) |
Disability Class: Vision Difficulty
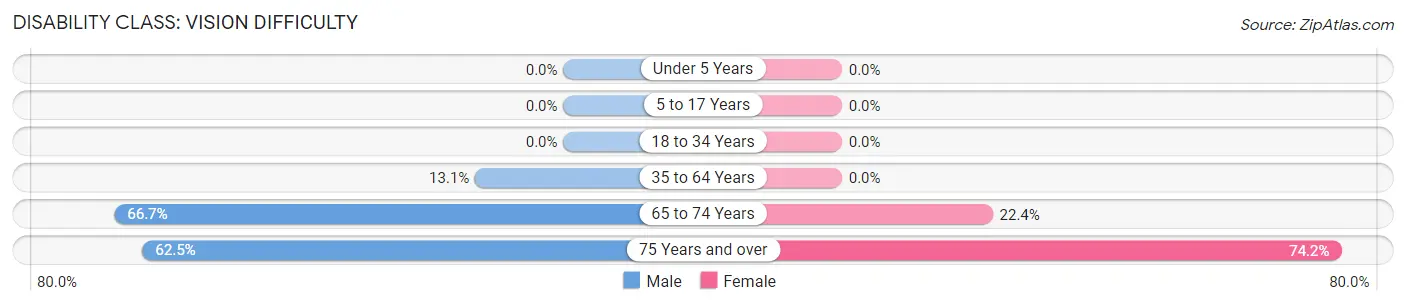
| Age Bracket | Male | Female |
| Under 5 Years | 0 (0.0%) | 0 (0.0%) |
| 5 to 17 Years | 0 (0.0%) | 0 (0.0%) |
| 18 to 34 Years | 0 (0.0%) | 0 (0.0%) |
| 35 to 64 Years | 33 (13.1%) | 0 (0.0%) |
| 65 to 74 Years | 12 (66.7%) | 15 (22.4%) |
| 75 Years and over | 5 (62.5%) | 89 (74.2%) |
Disability Class: Cognitive Difficulty
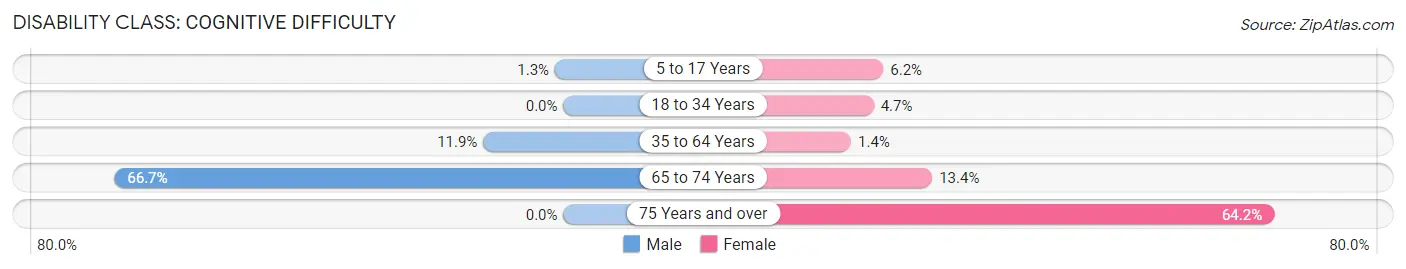
| Age Bracket | Male | Female |
| 5 to 17 Years | 2 (1.3%) | 10 (6.2%) |
| 18 to 34 Years | 0 (0.0%) | 10 (4.7%) |
| 35 to 64 Years | 30 (11.9%) | 4 (1.4%) |
| 65 to 74 Years | 12 (66.7%) | 9 (13.4%) |
| 75 Years and over | 0 (0.0%) | 77 (64.2%) |
Disability Class: Ambulatory Difficulty
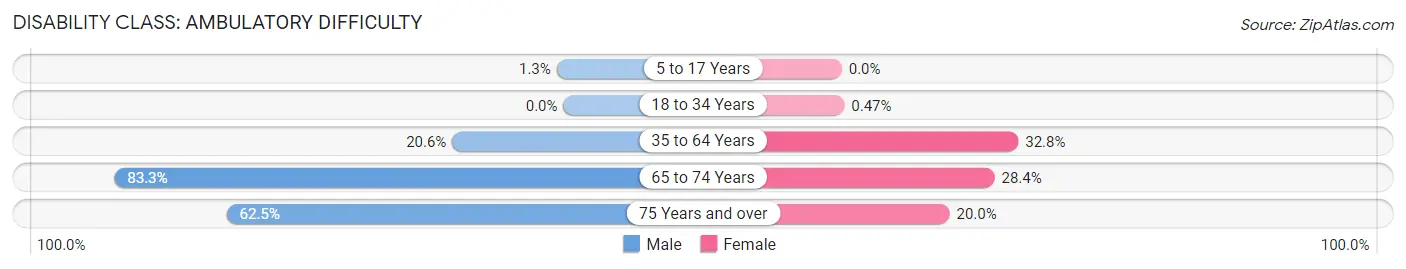
| Age Bracket | Male | Female |
| 5 to 17 Years | 2 (1.3%) | 0 (0.0%) |
| 18 to 34 Years | 0 (0.0%) | 1 (0.5%) |
| 35 to 64 Years | 52 (20.6%) | 95 (32.8%) |
| 65 to 74 Years | 15 (83.3%) | 19 (28.4%) |
| 75 Years and over | 5 (62.5%) | 24 (20.0%) |
Disability Class: Self-Care Difficulty
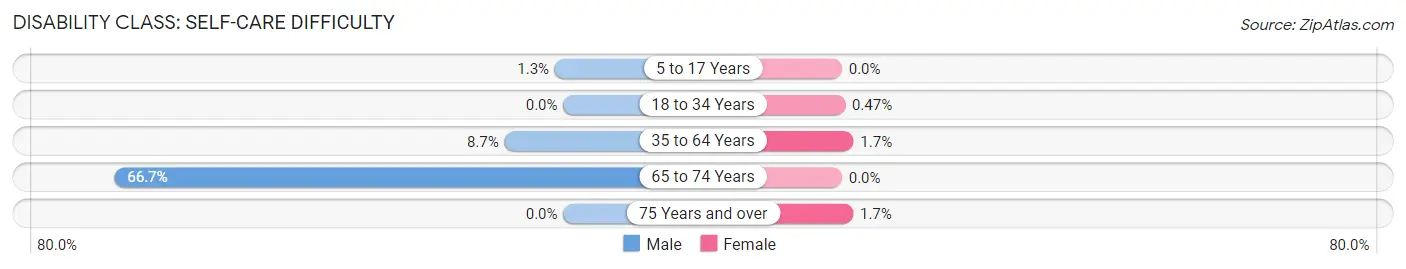
| Age Bracket | Male | Female |
| 5 to 17 Years | 2 (1.3%) | 0 (0.0%) |
| 18 to 34 Years | 0 (0.0%) | 1 (0.5%) |
| 35 to 64 Years | 22 (8.7%) | 5 (1.7%) |
| 65 to 74 Years | 12 (66.7%) | 0 (0.0%) |
| 75 Years and over | 0 (0.0%) | 2 (1.7%) |
Technology Access in Rosepine
Computing Device Access in Rosepine
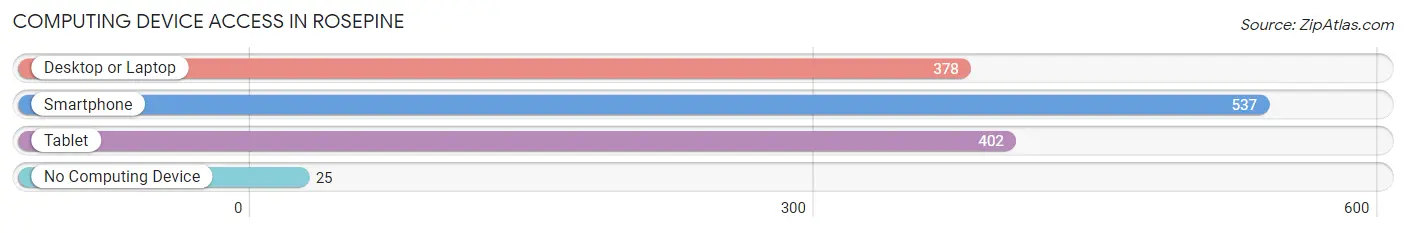
| Device Type | # Households | % Households |
| Desktop or Laptop | 378 | 61.2% |
| Smartphone | 537 | 86.9% |
| Tablet | 402 | 65.0% |
| No Computing Device | 25 | 4.1% |
| Total | 618 | 100.0% |
Internet Access in Rosepine
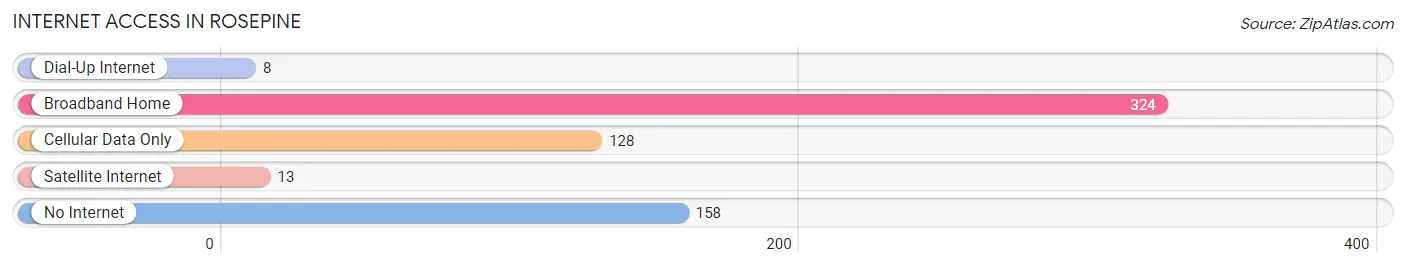
| Internet Type | # Households | % Households |
| Dial-Up Internet | 8 | 1.3% |
| Broadband Home | 324 | 52.4% |
| Cellular Data Only | 128 | 20.7% |
| Satellite Internet | 13 | 2.1% |
| No Internet | 158 | 25.6% |
| Total | 618 | 100.0% |
Rosepine Summary
Rosepine is a small town located in Vernon Parish, Louisiana. It is situated in the northwest corner of the state, near the Texas border. The town was founded in 1883 and has a population of 1,845 as of the 2010 census.
History
Rosepine was founded in 1883 by a group of settlers from the nearby town of Leesville. The town was named after the wild roses that grew in the area. The first post office was established in 1884 and the town was incorporated in 1887.
The town grew slowly but steadily over the years, and by the early 1900s, it had become a thriving agricultural center. Cotton, corn, and other crops were grown in the area, and the town was home to several sawmills and other businesses.
In the 1920s, the town began to experience a decline in population as many of its residents moved away in search of better economic opportunities. This trend continued until the 1950s, when the town began to experience a resurgence. The construction of a new highway in the area helped to bring new businesses and residents to the town.
Geography
Rosepine is located in the northwest corner of Louisiana, near the Texas border. It is situated in Vernon Parish, which is part of the Central Louisiana region. The town is located at the intersection of U.S. Highway 171 and Louisiana Highway 10.
The town is situated on a flat plain, with an elevation of about 200 feet above sea level. The climate is humid subtropical, with hot summers and mild winters. The average annual temperature is around 70 degrees Fahrenheit.
Economy
The economy of Rosepine is largely based on agriculture. Cotton, corn, and other crops are grown in the area, and the town is home to several sawmills and other businesses.
The town is also home to several small businesses, including restaurants, retail stores, and service providers. The town is also home to a branch of the Vernon Parish Library.
Demographics
As of the 2010 census, the population of Rosepine was 1,845. The racial makeup of the town was 79.3% White, 17.2% African American, 0.7% Native American, 0.3% Asian, 0.1% Pacific Islander, and 2.4% from other races. Hispanic or Latino of any race were 2.7% of the population.
The median household income in Rosepine was $31,250, and the median family income was $37,500. The per capita income was $15,945. About 17.2% of the population was below the poverty line.
Conclusion
Rosepine is a small town located in Vernon Parish, Louisiana. It was founded in 1883 and has a population of 1,845 as of the 2010 census. The town is situated on a flat plain, with an elevation of about 200 feet above sea level. The economy of Rosepine is largely based on agriculture, and the town is also home to several small businesses. The racial makeup of the town was 79.3% White, 17.2% African American, 0.7% Native American, 0.3% Asian, 0.1% Pacific Islander, and 2.4% from other races. The median household income in Rosepine was $31,250, and the median family income was $37,500.
Common Questions
What is Per Capita Income in Rosepine?
Per Capita income in Rosepine is $26,523.
What is the Median Family Income in Rosepine?
Median Family Income in Rosepine is $61,536.
What is the Median Household income in Rosepine?
Median Household Income in Rosepine is $57,333.
What is Income or Wage Gap in Rosepine?
Income or Wage Gap in Rosepine is 52.9%.
Women in Rosepine earn 47.1 cents for every dollar earned by a man.
What is Family Income Deficit in Rosepine?
Family Income Deficit in Rosepine is $4,949.
Families that are below poverty line in Rosepine earn $4,949 less on average than the poverty threshold level.
What is Inequality or Gini Index in Rosepine?
Inequality or Gini Index in Rosepine is 0.43.
What is the Total Population of Rosepine?
Total Population of Rosepine is 1,740.
What is the Total Male Population of Rosepine?
Total Male Population of Rosepine is 808.
What is the Total Female Population of Rosepine?
Total Female Population of Rosepine is 932.
What is the Ratio of Males per 100 Females in Rosepine?
There are 86.70 Males per 100 Females in Rosepine.
What is the Ratio of Females per 100 Males in Rosepine?
There are 115.35 Females per 100 Males in Rosepine.
What is the Median Population Age in Rosepine?
Median Population Age in Rosepine is 32.9 Years.
What is the Average Family Size in Rosepine
Average Family Size in Rosepine is 3.2 People.
What is the Average Household Size in Rosepine
Average Household Size in Rosepine is 2.7 People.
How Large is the Labor Force in Rosepine?
There are 788 People in the Labor Forcein in Rosepine.
What is the Percentage of People in the Labor Force in Rosepine?
56.8% of People are in the Labor Force in Rosepine.
What is the Unemployment Rate in Rosepine?
Unemployment Rate in Rosepine is 6.6%.