Red Chute, LA Map & Demographics
Red Chute Map
Red Chute Overview
$30,289
PER CAPITA INCOME
$94,848
AVG FAMILY INCOME
$76,520
AVG HOUSEHOLD INCOME
58.8%
WAGE / INCOME GAP [ % ]
41.2¢/ $1
WAGE / INCOME GAP [ $ ]
0.37
INEQUALITY / GINI INDEX
7,577
TOTAL POPULATION
3,638
MALE POPULATION
3,939
FEMALE POPULATION
92.36
MALES / 100 FEMALES
108.27
FEMALES / 100 MALES
34.6
MEDIAN AGE
3.4
AVG FAMILY SIZE
2.8
AVG HOUSEHOLD SIZE
3,566
LABOR FORCE [ PEOPLE ]
63.7%
PERCENT IN LABOR FORCE
6.2%
UNEMPLOYMENT RATE
Income in Red Chute
Income Overview in Red Chute
Per Capita Income in Red Chute is $30,289, while median incomes of families and households are $94,848 and $76,520 respectively.
| Characteristic | Number | Measure |
| Per Capita Income | 7,577 | $30,289 |
| Median Family Income | 1,933 | $94,848 |
| Mean Family Income | 1,933 | $97,418 |
| Median Household Income | 2,755 | $76,520 |
| Mean Household Income | 2,755 | $83,420 |
| Income Deficit | 1,933 | $0 |
| Wage / Income Gap (%) | 7,577 | 58.81% |
| Wage / Income Gap ($) | 7,577 | 41.19¢ per $1 |
| Gini / Inequality Index | 7,577 | 0.37 |
Earnings by Sex in Red Chute
Average Earnings in Red Chute are $34,850, $53,421 for men and $22,002 for women, a difference of 58.8%.
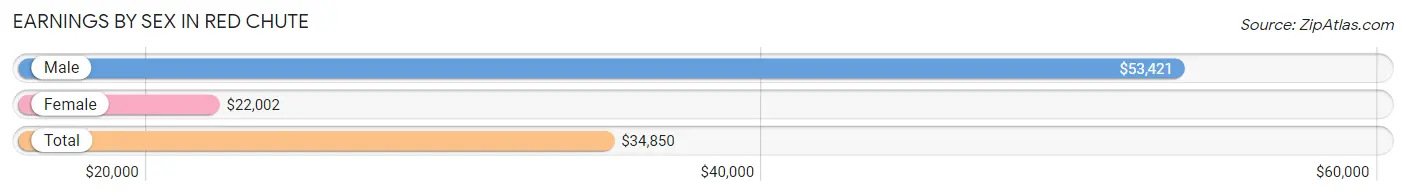
| Sex | Number | Average Earnings |
| Male | 1,934 (52.9%) | $53,421 |
| Female | 1,723 (47.1%) | $22,002 |
| Total | 3,657 (100.0%) | $34,850 |
Earnings by Sex by Income Bracket in Red Chute
The most common earnings brackets in Red Chute are $100,000+ for men (431 | 22.3%) and $5,000 to $7,499 for women (176 | 10.2%).
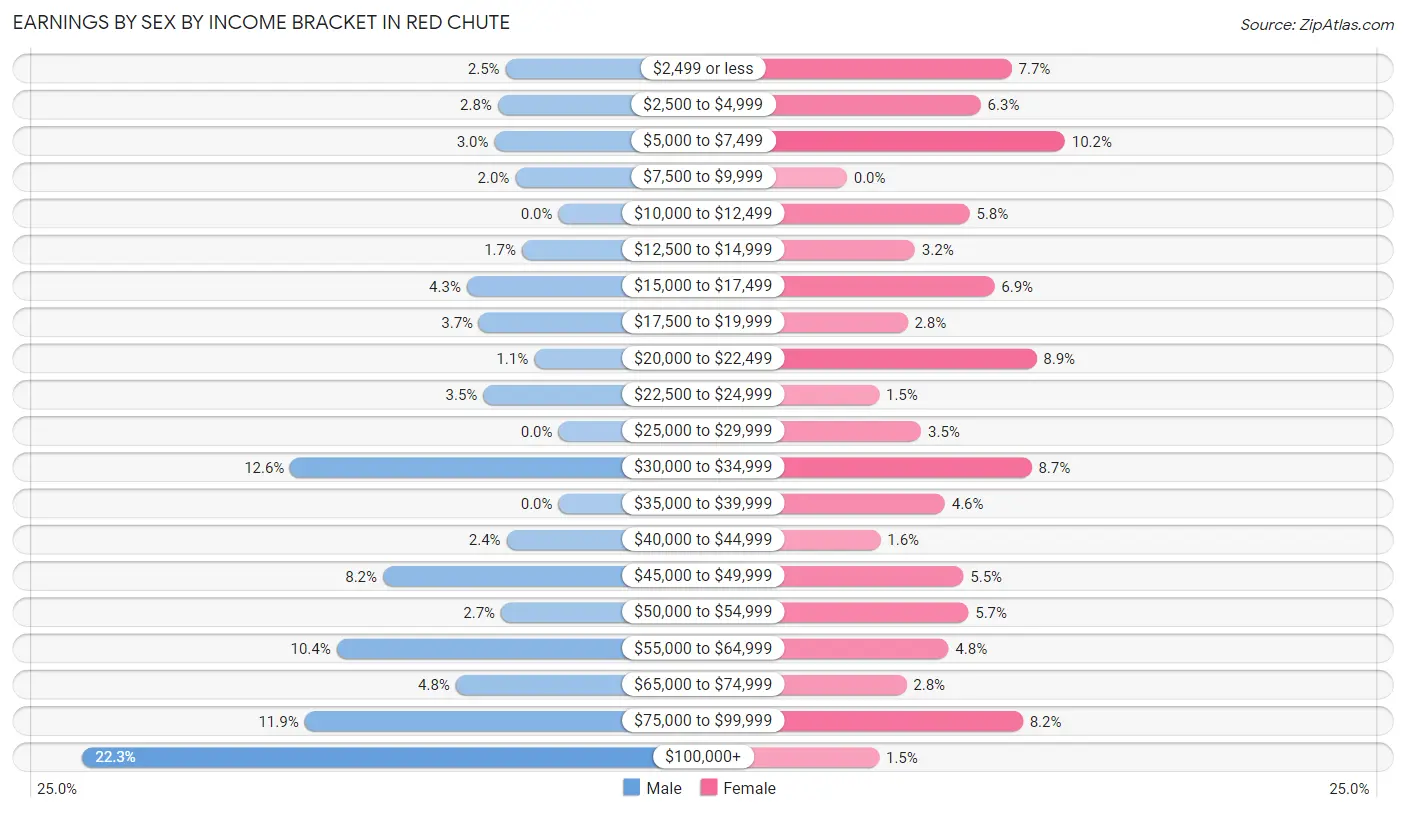
| Income | Male | Female |
| $2,499 or less | 48 (2.5%) | 133 (7.7%) |
| $2,500 to $4,999 | 55 (2.8%) | 108 (6.3%) |
| $5,000 to $7,499 | 58 (3.0%) | 176 (10.2%) |
| $7,500 to $9,999 | 39 (2.0%) | 0 (0.0%) |
| $10,000 to $12,499 | 0 (0.0%) | 99 (5.8%) |
| $12,500 to $14,999 | 33 (1.7%) | 55 (3.2%) |
| $15,000 to $17,499 | 83 (4.3%) | 119 (6.9%) |
| $17,500 to $19,999 | 72 (3.7%) | 49 (2.8%) |
| $20,000 to $22,499 | 22 (1.1%) | 153 (8.9%) |
| $22,500 to $24,999 | 68 (3.5%) | 26 (1.5%) |
| $25,000 to $29,999 | 0 (0.0%) | 60 (3.5%) |
| $30,000 to $34,999 | 243 (12.6%) | 149 (8.6%) |
| $35,000 to $39,999 | 0 (0.0%) | 79 (4.6%) |
| $40,000 to $44,999 | 47 (2.4%) | 27 (1.6%) |
| $45,000 to $49,999 | 159 (8.2%) | 94 (5.5%) |
| $50,000 to $54,999 | 52 (2.7%) | 98 (5.7%) |
| $55,000 to $64,999 | 201 (10.4%) | 82 (4.8%) |
| $65,000 to $74,999 | 93 (4.8%) | 48 (2.8%) |
| $75,000 to $99,999 | 230 (11.9%) | 142 (8.2%) |
| $100,000+ | 431 (22.3%) | 26 (1.5%) |
| Total | 1,934 (100.0%) | 1,723 (100.0%) |
Earnings by Sex by Educational Attainment in Red Chute
Average earnings in Red Chute are $56,182 for men and $23,990 for women, a difference of 57.3%. Men with an educational attainment of graduate degree enjoy the highest average annual earnings of $102,721, while those with high school diploma education earn the least with $47,977. Women with an educational attainment of graduate degree earn the most with the average annual earnings of $55,125, while those with high school diploma education have the smallest earnings of $15,918.
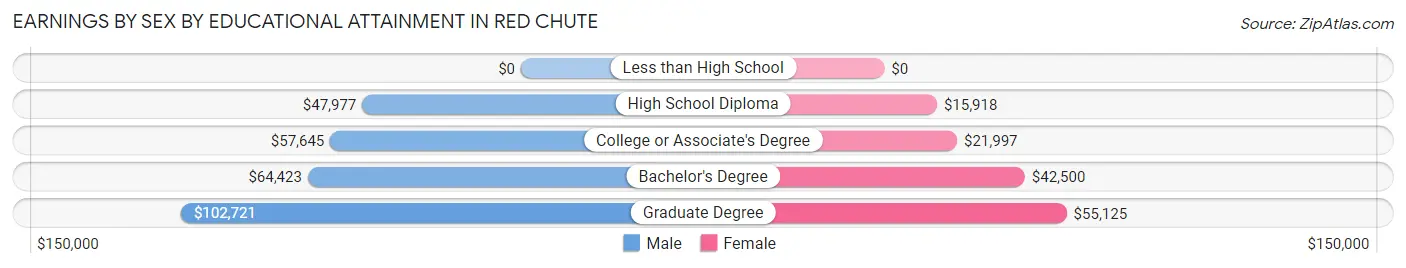
| Educational Attainment | Male Income | Female Income |
| Less than High School | - | - |
| High School Diploma | $47,977 | $15,918 |
| College or Associate's Degree | $57,645 | $21,997 |
| Bachelor's Degree | $64,423 | $42,500 |
| Graduate Degree | $102,721 | $55,125 |
| Total | $56,182 | $23,990 |
Family Income in Red Chute
Family Income Brackets in Red Chute
According to the Red Chute family income data, there are 483 families falling into the $100,000 to $149,999 income range, which is the most common income bracket and makes up 25.0% of all families. Conversely, the $10,000 to $14,999 income bracket is the least frequent group with only 29 families (1.5%) belonging to this category.
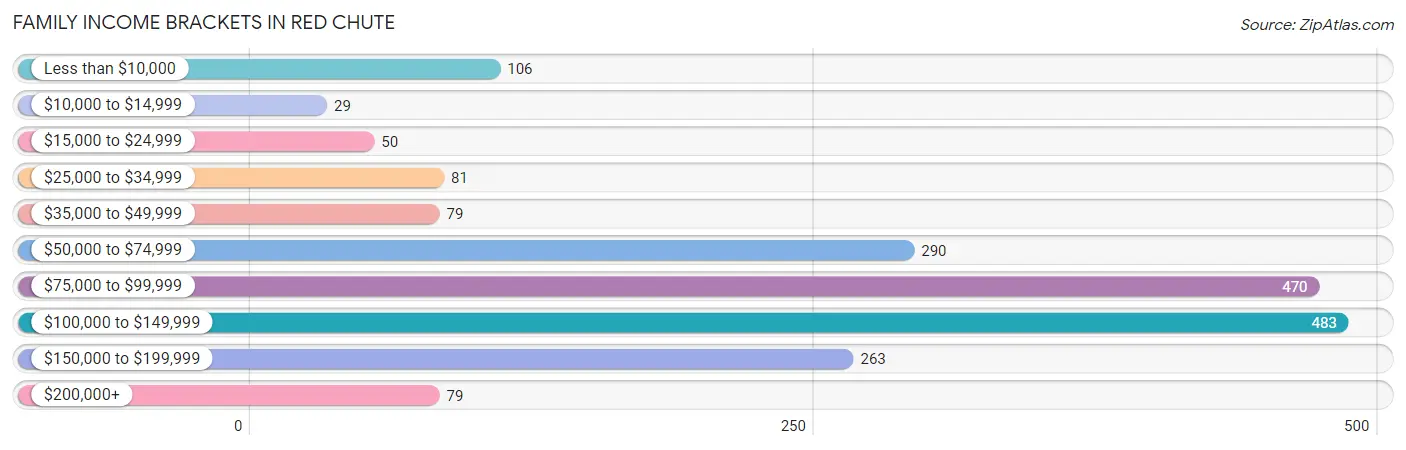
| Income Bracket | # Families | % Families |
| Less than $10,000 | 106 | 5.5% |
| $10,000 to $14,999 | 29 | 1.5% |
| $15,000 to $24,999 | 50 | 2.6% |
| $25,000 to $34,999 | 81 | 4.2% |
| $35,000 to $49,999 | 79 | 4.1% |
| $50,000 to $74,999 | 290 | 15.0% |
| $75,000 to $99,999 | 470 | 24.3% |
| $100,000 to $149,999 | 483 | 25.0% |
| $150,000 to $199,999 | 263 | 13.6% |
| $200,000+ | 79 | 4.1% |
Family Income by Famaliy Size in Red Chute
3-person families (460 | 23.8%) account for the highest median family income in Red Chute with $110,517 per family, while 2-person families (646 | 33.4%) have the highest median income of $46,316 per family member.
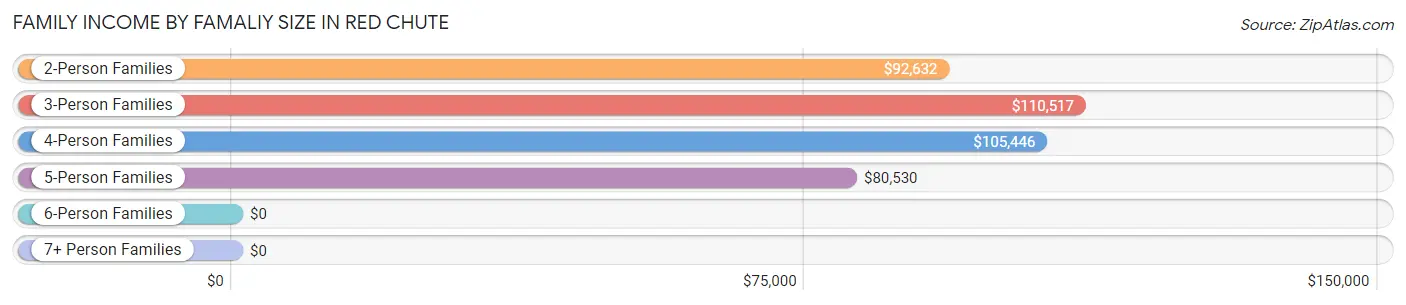
| Income Bracket | # Families | Median Income |
| 2-Person Families | 646 (33.4%) | $92,632 |
| 3-Person Families | 460 (23.8%) | $110,517 |
| 4-Person Families | 480 (24.8%) | $105,446 |
| 5-Person Families | 341 (17.6%) | $80,530 |
| 6-Person Families | 6 (0.3%) | $0 |
| 7+ Person Families | 0 (0.0%) | $0 |
| Total | 1,933 (100.0%) | $94,848 |
Family Income by Number of Earners in Red Chute
The median family income in Red Chute is $94,848, with families comprising 2 earners (1,119) having the highest median family income of $102,930, while families with no earners (285) have the lowest median family income of $58,627, accounting for 57.9% and 14.7% of families, respectively.
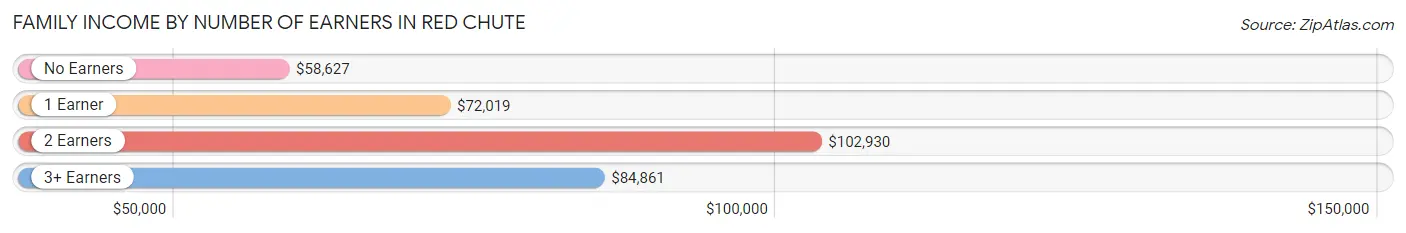
| Number of Earners | # Families | Median Income |
| No Earners | 285 (14.7%) | $58,627 |
| 1 Earner | 399 (20.6%) | $72,019 |
| 2 Earners | 1,119 (57.9%) | $102,930 |
| 3+ Earners | 130 (6.7%) | $84,861 |
| Total | 1,933 (100.0%) | $94,848 |
Household Income in Red Chute
Household Income Brackets in Red Chute
With 598 households falling in the category, the $75,000 to $99,999 income range is the most frequent in Red Chute, accounting for 21.7% of all households. In contrast, only 77 households (2.8%) fall into the $10,000 to $14,999 income bracket, making it the least populous group.
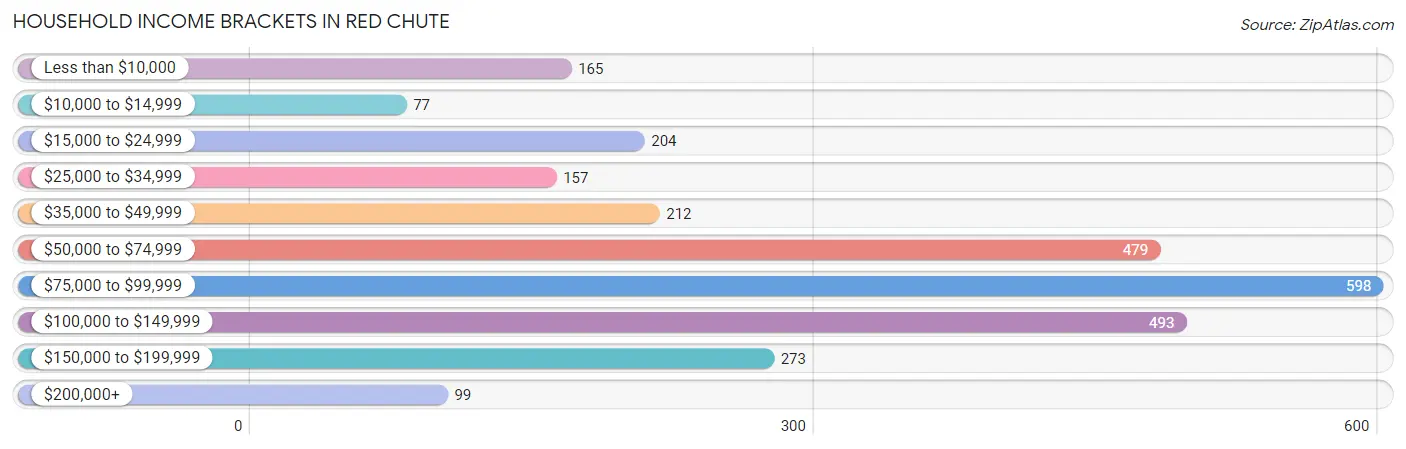
| Income Bracket | # Households | % Households |
| Less than $10,000 | 165 | 6.0% |
| $10,000 to $14,999 | 77 | 2.8% |
| $15,000 to $24,999 | 204 | 7.4% |
| $25,000 to $34,999 | 157 | 5.7% |
| $35,000 to $49,999 | 212 | 7.7% |
| $50,000 to $74,999 | 479 | 17.4% |
| $75,000 to $99,999 | 598 | 21.7% |
| $100,000 to $149,999 | 493 | 17.9% |
| $150,000 to $199,999 | 273 | 9.9% |
| $200,000+ | 99 | 3.6% |
Household Income by Householder Age in Red Chute
The median household income in Red Chute is $76,520, with the highest median household income of $81,236 found in the 25 to 44 years age bracket for the primary householder. A total of 961 households (34.9%) fall into this category. Meanwhile, the 15 to 24 years age bracket for the primary householder has the lowest median household income of $0, with 87 households (3.2%) in this group.
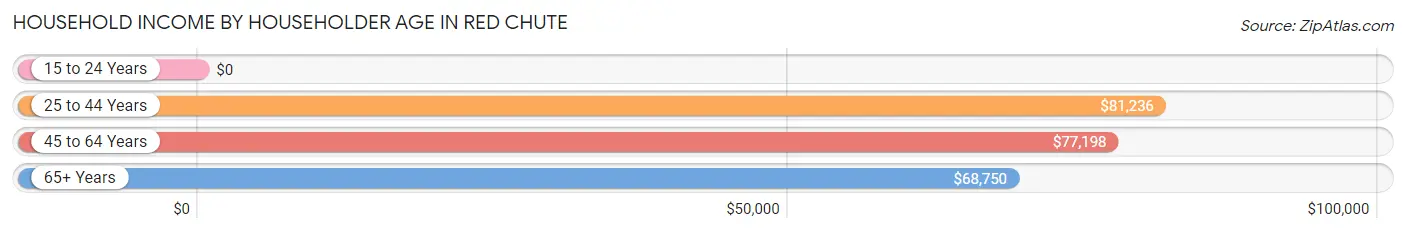
| Income Bracket | # Households | Median Income |
| 15 to 24 Years | 87 (3.2%) | $0 |
| 25 to 44 Years | 961 (34.9%) | $81,236 |
| 45 to 64 Years | 1,136 (41.2%) | $77,198 |
| 65+ Years | 571 (20.7%) | $68,750 |
| Total | 2,755 (100.0%) | $76,520 |
Poverty in Red Chute
Income Below Poverty by Sex and Age in Red Chute
With 11.8% poverty level for males and 16.3% for females among the residents of Red Chute, under 5 year old males and 18 to 24 year old females are the most vulnerable to poverty, with 86 males (27.3%) and 172 females (37.6%) in their respective age groups living below the poverty level.
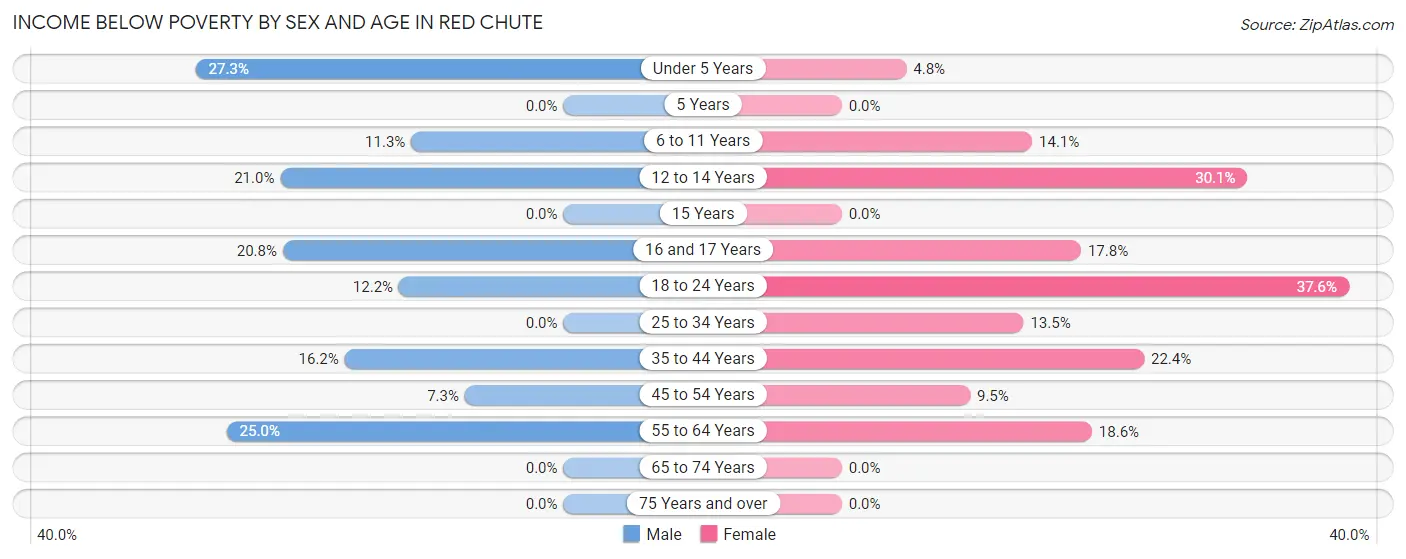
| Age Bracket | Male | Female |
| Under 5 Years | 86 (27.3%) | 15 (4.8%) |
| 5 Years | 0 (0.0%) | 0 (0.0%) |
| 6 to 11 Years | 46 (11.3%) | 53 (14.1%) |
| 12 to 14 Years | 62 (21.0%) | 53 (30.1%) |
| 15 Years | 0 (0.0%) | 0 (0.0%) |
| 16 and 17 Years | 20 (20.8%) | 27 (17.8%) |
| 18 to 24 Years | 26 (12.2%) | 172 (37.6%) |
| 25 to 34 Years | 0 (0.0%) | 68 (13.5%) |
| 35 to 44 Years | 83 (16.2%) | 101 (22.4%) |
| 45 to 54 Years | 36 (7.3%) | 50 (9.5%) |
| 55 to 64 Years | 70 (25.0%) | 104 (18.6%) |
| 65 to 74 Years | 0 (0.0%) | 0 (0.0%) |
| 75 Years and over | 0 (0.0%) | 0 (0.0%) |
| Total | 429 (11.8%) | 643 (16.3%) |
Income Above Poverty by Sex and Age in Red Chute
According to the poverty statistics in Red Chute, males aged 5 years and females aged 5 years are the age groups that are most secure financially, with 100.0% of males and 100.0% of females in these age groups living above the poverty line.
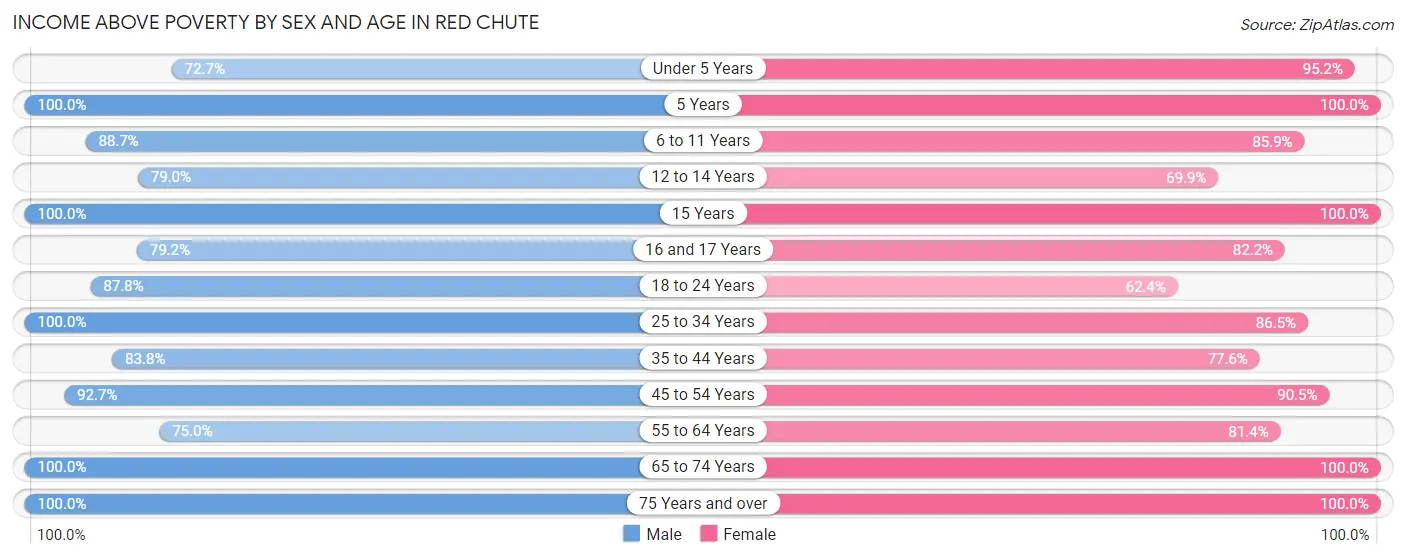
| Age Bracket | Male | Female |
| Under 5 Years | 229 (72.7%) | 298 (95.2%) |
| 5 Years | 18 (100.0%) | 22 (100.0%) |
| 6 to 11 Years | 361 (88.7%) | 322 (85.9%) |
| 12 to 14 Years | 233 (79.0%) | 123 (69.9%) |
| 15 Years | 52 (100.0%) | 6 (100.0%) |
| 16 and 17 Years | 76 (79.2%) | 125 (82.2%) |
| 18 to 24 Years | 187 (87.8%) | 285 (62.4%) |
| 25 to 34 Years | 495 (100.0%) | 436 (86.5%) |
| 35 to 44 Years | 428 (83.8%) | 349 (77.6%) |
| 45 to 54 Years | 456 (92.7%) | 475 (90.5%) |
| 55 to 64 Years | 210 (75.0%) | 456 (81.4%) |
| 65 to 74 Years | 261 (100.0%) | 210 (100.0%) |
| 75 Years and over | 203 (100.0%) | 189 (100.0%) |
| Total | 3,209 (88.2%) | 3,296 (83.7%) |
Income Below Poverty Among Married-Couple Families in Red Chute
The poverty statistics for married-couple families in Red Chute show that 11.3% or 185 of the total 1,641 families live below the poverty line. Families with 3 or 4 children have the highest poverty rate of 26.9%, comprising of 81 families. On the other hand, families with 1 or 2 children have the lowest poverty rate of 0.0%, which includes 0 families.
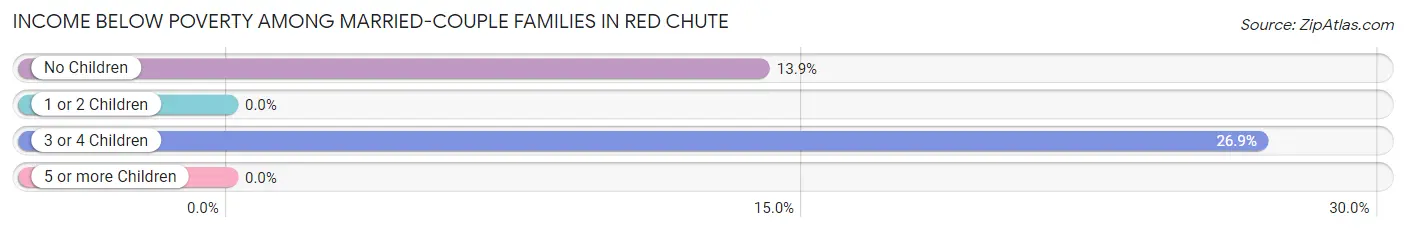
| Children | Above Poverty | Below Poverty |
| No Children | 645 (86.1%) | 104 (13.9%) |
| 1 or 2 Children | 591 (100.0%) | 0 (0.0%) |
| 3 or 4 Children | 220 (73.1%) | 81 (26.9%) |
| 5 or more Children | 0 (0.0%) | 0 (0.0%) |
| Total | 1,456 (88.7%) | 185 (11.3%) |
Income Below Poverty Among Single-Parent Households in Red Chute
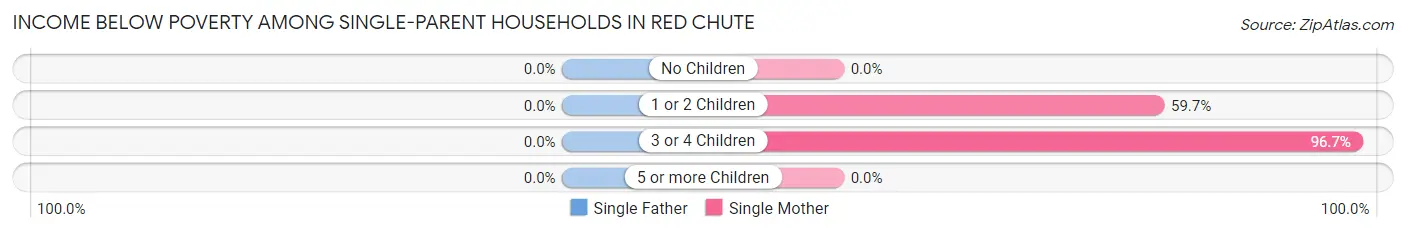
| Children | Single Father | Single Mother |
| No Children | 0 (0.0%) | 0 (0.0%) |
| 1 or 2 Children | 0 (0.0%) | 37 (59.7%) |
| 3 or 4 Children | 0 (0.0%) | 29 (96.7%) |
| 5 or more Children | 0 (0.0%) | 0 (0.0%) |
| Total | 0 (0.0%) | 66 (36.3%) |
Income Below Poverty Among Married-Couple vs Single-Parent Households in Red Chute
The poverty data for Red Chute shows that 185 of the married-couple family households (11.3%) and 66 of the single-parent households (22.6%) are living below the poverty level. Within the married-couple family households, those with 3 or 4 children have the highest poverty rate, with 81 households (26.9%) falling below the poverty line. Among the single-parent households, those with 3 or 4 children have the highest poverty rate, with 29 household (74.4%) living below poverty.
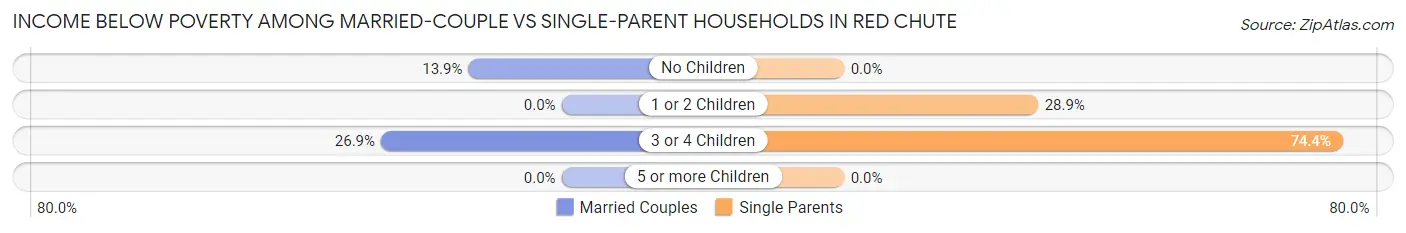
| Children | Married-Couple Families | Single-Parent Households |
| No Children | 104 (13.9%) | 0 (0.0%) |
| 1 or 2 Children | 0 (0.0%) | 37 (28.9%) |
| 3 or 4 Children | 81 (26.9%) | 29 (74.4%) |
| 5 or more Children | 0 (0.0%) | 0 (0.0%) |
| Total | 185 (11.3%) | 66 (22.6%) |
Race in Red Chute
The most populous races in Red Chute are White / Caucasian (6,287 | 83.0%), Hispanic or Latino (819 | 10.8%), and Black / African American (770 | 10.2%).
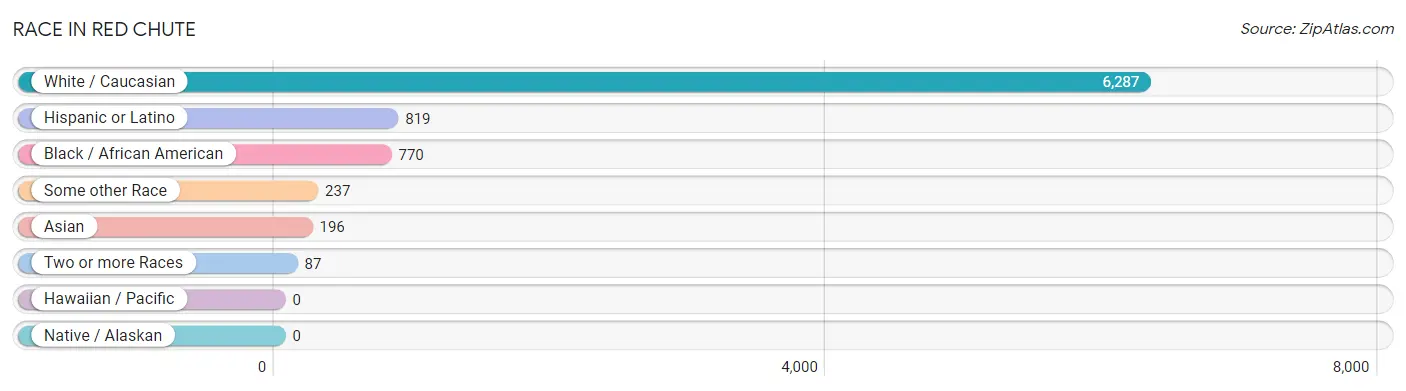
| Race | # Population | % Population |
| Asian | 196 | 2.6% |
| Black / African American | 770 | 10.2% |
| Hawaiian / Pacific | 0 | 0.0% |
| Hispanic or Latino | 819 | 10.8% |
| Native / Alaskan | 0 | 0.0% |
| White / Caucasian | 6,287 | 83.0% |
| Two or more Races | 87 | 1.1% |
| Some other Race | 237 | 3.1% |
| Total | 7,577 | 100.0% |
Ancestry in Red Chute
The most populous ancestries reported in Red Chute are American (1,370 | 18.1%), English (870 | 11.5%), Irish (494 | 6.5%), Mexican (448 | 5.9%), and German (346 | 4.6%), together accounting for 46.6% of all Red Chute residents.
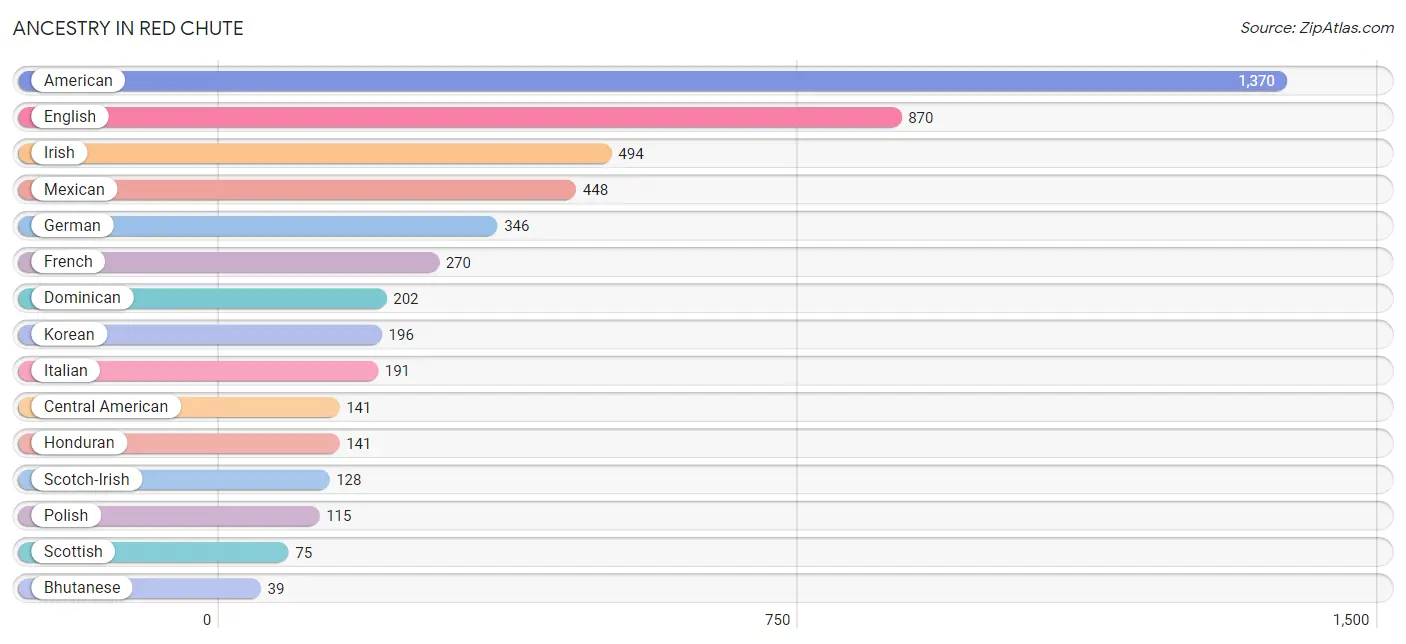
| Ancestry | # Population | % Population |
| American | 1,370 | 18.1% |
| Bhutanese | 39 | 0.5% |
| British | 15 | 0.2% |
| Cajun | 2 | 0.0% |
| Central American | 141 | 1.9% |
| Choctaw | 11 | 0.2% |
| Colombian | 18 | 0.2% |
| Czechoslovakian | 17 | 0.2% |
| Dominican | 202 | 2.7% |
| Dutch | 37 | 0.5% |
| English | 870 | 11.5% |
| French | 270 | 3.6% |
| French Canadian | 13 | 0.2% |
| German | 346 | 4.6% |
| Honduran | 141 | 1.9% |
| Irish | 494 | 6.5% |
| Italian | 191 | 2.5% |
| Jamaican | 21 | 0.3% |
| Korean | 196 | 2.6% |
| Lithuanian | 17 | 0.2% |
| Mexican | 448 | 5.9% |
| Norwegian | 27 | 0.4% |
| Polish | 115 | 1.5% |
| Scandinavian | 32 | 0.4% |
| Scotch-Irish | 128 | 1.7% |
| Scottish | 75 | 1.0% |
| South American | 28 | 0.4% |
| Swedish | 30 | 0.4% |
| Swiss | 11 | 0.2% |
| Venezuelan | 10 | 0.1% |
| Welsh | 10 | 0.1% | View All 31 Rows |
Immigrants in Red Chute
The most numerous immigrant groups reported in Red Chute came from Latin America (433 | 5.7%), Central America (203 | 2.7%), Caribbean (168 | 2.2%), Dominican Republic (168 | 2.2%), and Asia (142 | 1.9%), together accounting for 14.7% of all Red Chute residents.
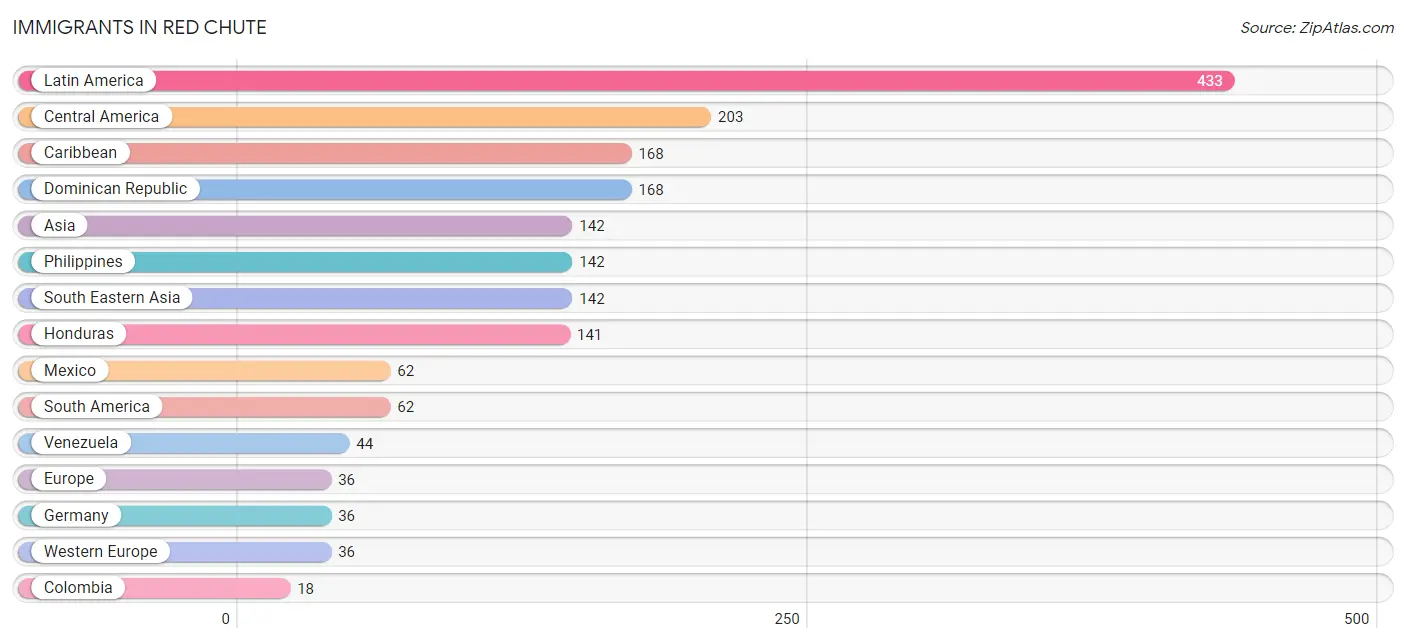
| Immigration Origin | # Population | % Population |
| Asia | 142 | 1.9% |
| Canada | 15 | 0.2% |
| Caribbean | 168 | 2.2% |
| Central America | 203 | 2.7% |
| Colombia | 18 | 0.2% |
| Dominican Republic | 168 | 2.2% |
| Europe | 36 | 0.5% |
| Germany | 36 | 0.5% |
| Honduras | 141 | 1.9% |
| Latin America | 433 | 5.7% |
| Mexico | 62 | 0.8% |
| Philippines | 142 | 1.9% |
| South America | 62 | 0.8% |
| South Eastern Asia | 142 | 1.9% |
| Venezuela | 44 | 0.6% |
| Western Europe | 36 | 0.5% | View All 16 Rows |
Sex and Age in Red Chute
Sex and Age in Red Chute
The most populous age groups in Red Chute are 10 to 14 Years (559 | 15.4%) for men and 20 to 24 Years (365 | 9.3%) for women.
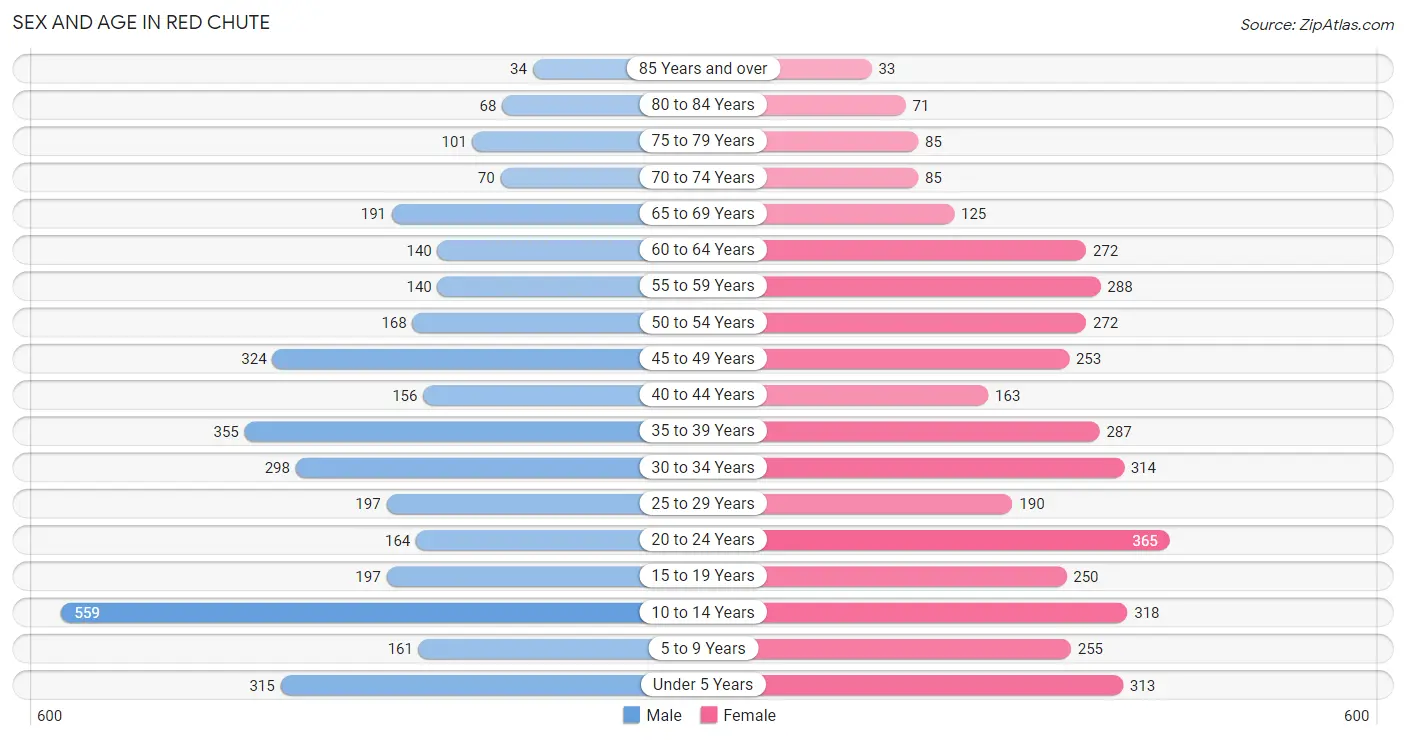
| Age Bracket | Male | Female |
| Under 5 Years | 315 (8.7%) | 313 (8.0%) |
| 5 to 9 Years | 161 (4.4%) | 255 (6.5%) |
| 10 to 14 Years | 559 (15.4%) | 318 (8.1%) |
| 15 to 19 Years | 197 (5.4%) | 250 (6.4%) |
| 20 to 24 Years | 164 (4.5%) | 365 (9.3%) |
| 25 to 29 Years | 197 (5.4%) | 190 (4.8%) |
| 30 to 34 Years | 298 (8.2%) | 314 (8.0%) |
| 35 to 39 Years | 355 (9.8%) | 287 (7.3%) |
| 40 to 44 Years | 156 (4.3%) | 163 (4.1%) |
| 45 to 49 Years | 324 (8.9%) | 253 (6.4%) |
| 50 to 54 Years | 168 (4.6%) | 272 (6.9%) |
| 55 to 59 Years | 140 (3.8%) | 288 (7.3%) |
| 60 to 64 Years | 140 (3.8%) | 272 (6.9%) |
| 65 to 69 Years | 191 (5.2%) | 125 (3.2%) |
| 70 to 74 Years | 70 (1.9%) | 85 (2.2%) |
| 75 to 79 Years | 101 (2.8%) | 85 (2.2%) |
| 80 to 84 Years | 68 (1.9%) | 71 (1.8%) |
| 85 Years and over | 34 (0.9%) | 33 (0.8%) |
| Total | 3,638 (100.0%) | 3,939 (100.0%) |
Families and Households in Red Chute
Median Family Size in Red Chute
The median family size in Red Chute is 3.43 persons per family, with single female/mother families (182 | 9.4%) accounting for the largest median family size of 3.58 persons per family. On the other hand, single male/father families (110 | 5.7%) represent the smallest median family size with 2.95 persons per family.
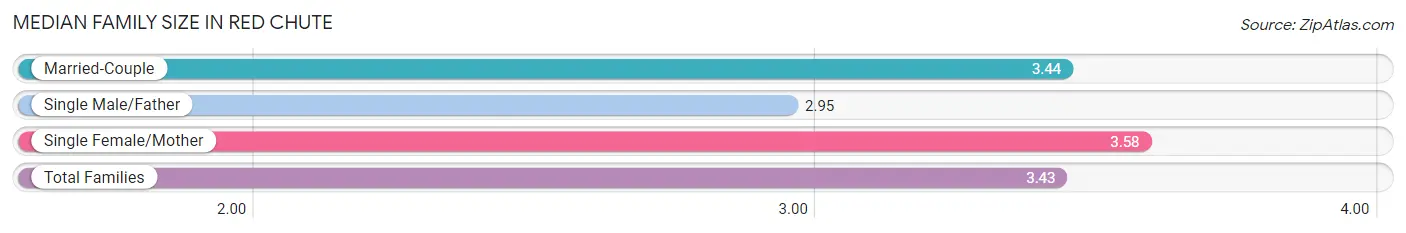
| Family Type | # Families | Family Size |
| Married-Couple | 1,641 (84.9%) | 3.44 |
| Single Male/Father | 110 (5.7%) | 2.95 |
| Single Female/Mother | 182 (9.4%) | 3.58 |
| Total Families | 1,933 (100.0%) | 3.43 |
Median Household Size in Red Chute
The median household size in Red Chute is 2.75 persons per household, with single female/mother households (182 | 6.6%) accounting for the largest median household size of 3.58 persons per household. non-family households (822 | 29.8%) represent the smallest median household size with 1.08 persons per household.
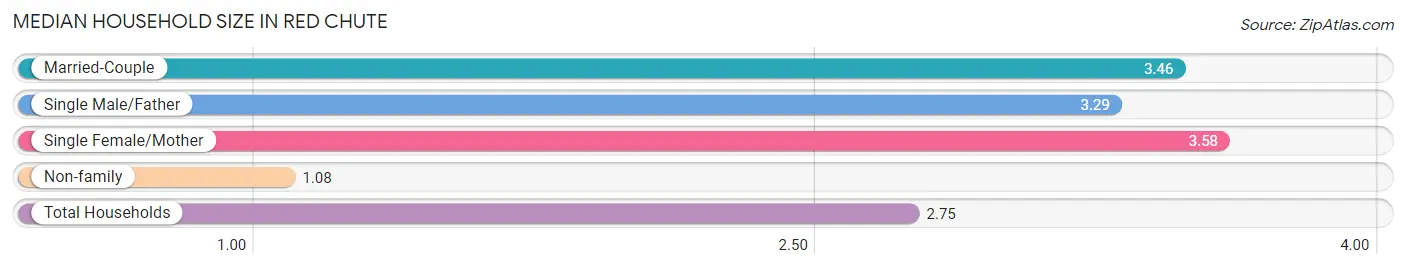
| Household Type | # Households | Household Size |
| Married-Couple | 1,641 (59.6%) | 3.46 |
| Single Male/Father | 110 (4.0%) | 3.29 |
| Single Female/Mother | 182 (6.6%) | 3.58 |
| Non-family | 822 (29.8%) | 1.08 |
| Total Households | 2,755 (100.0%) | 2.75 |
Household Size by Marriage Status in Red Chute
Out of a total of 2,755 households in Red Chute, 1,933 (70.2%) are family households, while 822 (29.8%) are nonfamily households. The most numerous type of family households are 2-person households, comprising 646, and the most common type of nonfamily households are 1-person households, comprising 740.
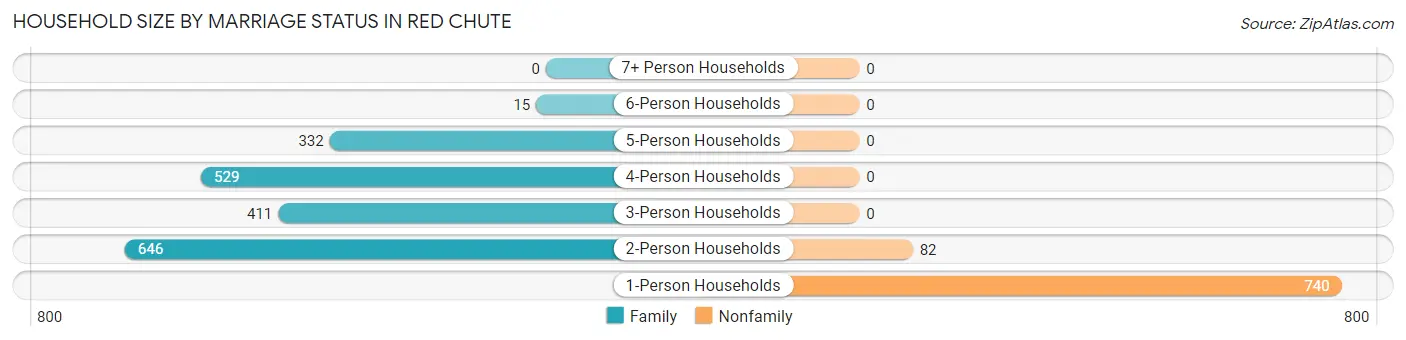
| Household Size | Family Households | Nonfamily Households |
| 1-Person Households | - | 740 (26.9%) |
| 2-Person Households | 646 (23.4%) | 82 (3.0%) |
| 3-Person Households | 411 (14.9%) | 0 (0.0%) |
| 4-Person Households | 529 (19.2%) | 0 (0.0%) |
| 5-Person Households | 332 (12.0%) | 0 (0.0%) |
| 6-Person Households | 15 (0.5%) | 0 (0.0%) |
| 7+ Person Households | 0 (0.0%) | 0 (0.0%) |
| Total | 1,933 (70.2%) | 822 (29.8%) |
Female Fertility in Red Chute
Fertility by Age in Red Chute
Average fertility rate in Red Chute is 49.0 births per 1,000 women. Women in the age bracket of 35 to 50 years have the highest fertility rate with 95.0 births per 1,000 women. Women in the age bracket of 35 to 50 years acount for 77.4% of all women with births.
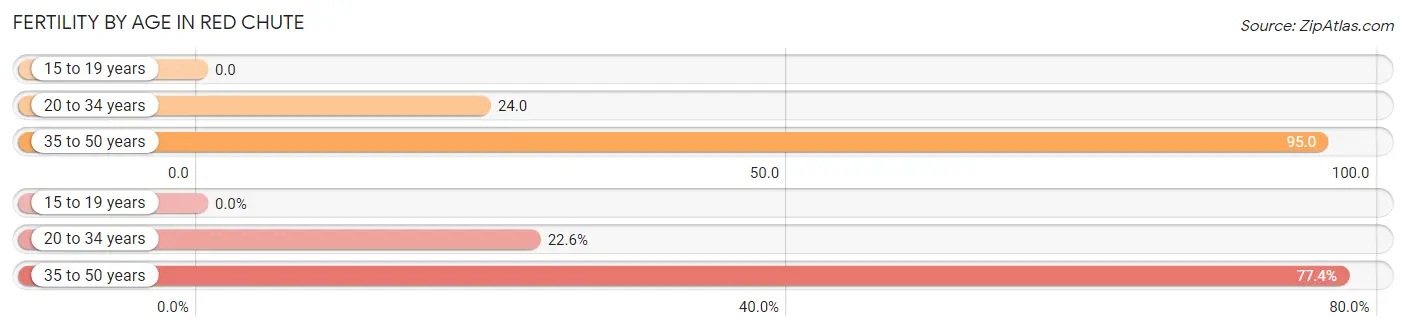
| Age Bracket | Women with Births | Births / 1,000 Women |
| 15 to 19 years | 0 (0.0%) | 0.0 |
| 20 to 34 years | 21 (22.6%) | 24.0 |
| 35 to 50 years | 72 (77.4%) | 95.0 |
| Total | 93 (100.0%) | 49.0 |
Fertility by Age by Marriage Status in Red Chute
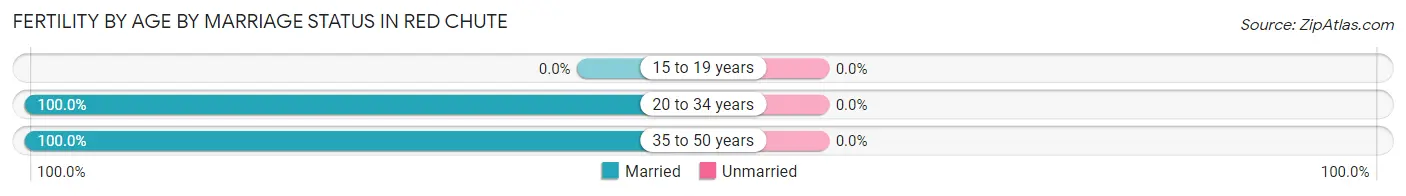
| Age Bracket | Married | Unmarried |
| 15 to 19 years | 0 (0.0%) | 0 (0.0%) |
| 20 to 34 years | 21 (100.0%) | 0 (0.0%) |
| 35 to 50 years | 72 (100.0%) | 0 (0.0%) |
| Total | 93 (100.0%) | 0 (0.0%) |
Fertility by Education in Red Chute
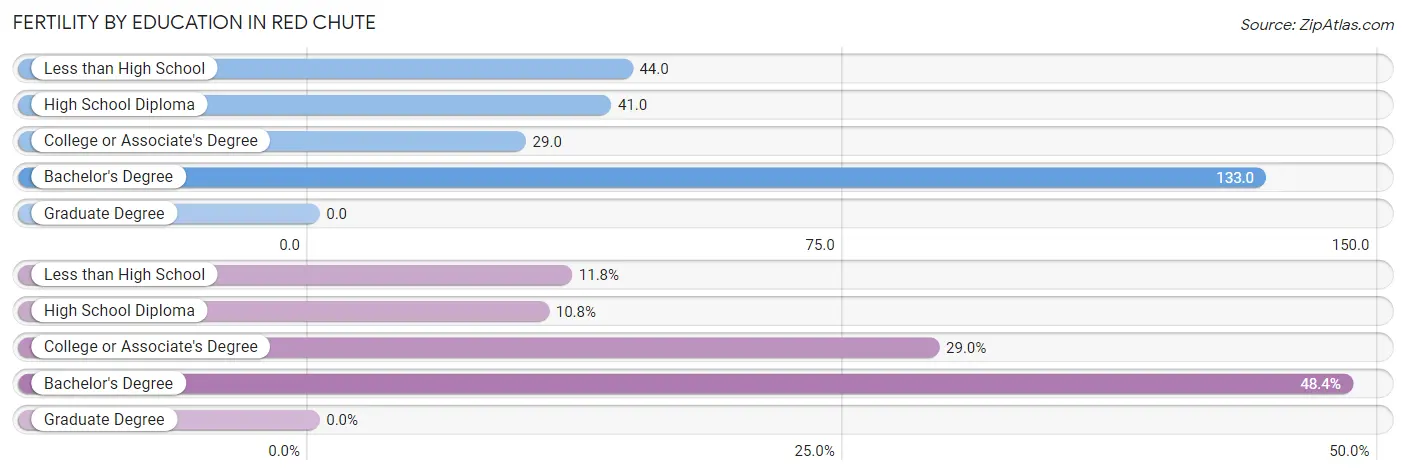
| Educational Attainment | Women with Births | Births / 1,000 Women |
| Less than High School | 11 (11.8%) | 44.0 |
| High School Diploma | 10 (10.7%) | 41.0 |
| College or Associate's Degree | 27 (29.0%) | 29.0 |
| Bachelor's Degree | 45 (48.4%) | 133.0 |
| Graduate Degree | 0 (0.0%) | 0.0 |
| Total | 93 (100.0%) | 49.0 |
Fertility by Education by Marriage Status in Red Chute
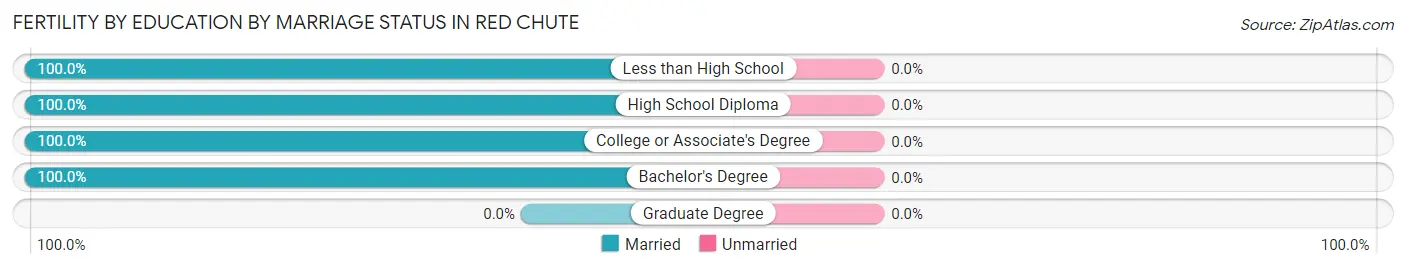
| Educational Attainment | Married | Unmarried |
| Less than High School | 11 (100.0%) | 0 (0.0%) |
| High School Diploma | 10 (100.0%) | 0 (0.0%) |
| College or Associate's Degree | 27 (100.0%) | 0 (0.0%) |
| Bachelor's Degree | 45 (100.0%) | 0 (0.0%) |
| Graduate Degree | 0 (0.0%) | 0 (0.0%) |
| Total | 93 (100.0%) | 0 (0.0%) |
Employment Characteristics in Red Chute
Employment by Class of Employer in Red Chute
Among the 3,290 employed individuals in Red Chute, private company employees (2,249 | 68.4%), federal government employees (251 | 7.6%), and not-for-profit organizations (215 | 6.5%) make up the most common classes of employment.
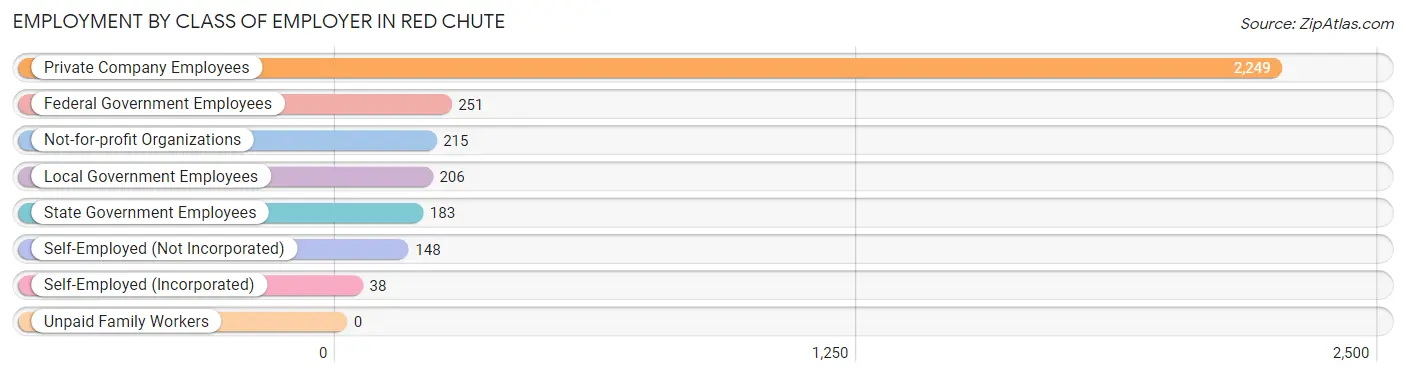
| Employer Class | # Employees | % Employees |
| Private Company Employees | 2,249 | 68.4% |
| Self-Employed (Incorporated) | 38 | 1.2% |
| Self-Employed (Not Incorporated) | 148 | 4.5% |
| Not-for-profit Organizations | 215 | 6.5% |
| Local Government Employees | 206 | 6.3% |
| State Government Employees | 183 | 5.6% |
| Federal Government Employees | 251 | 7.6% |
| Unpaid Family Workers | 0 | 0.0% |
| Total | 3,290 | 100.0% |
Employment Status by Age in Red Chute
According to the labor force statistics for Red Chute, out of the total population over 16 years of age (5,598), 63.7% or 3,566 individuals are in the labor force, with 6.2% or 221 of them unemployed. The age group with the highest labor force participation rate is 30 to 34 years, with 95.9% or 587 individuals in the labor force. Within the labor force, the 16 to 19 years age range has the highest percentage of unemployed individuals, with 45.3% or 39 of them being unemployed.
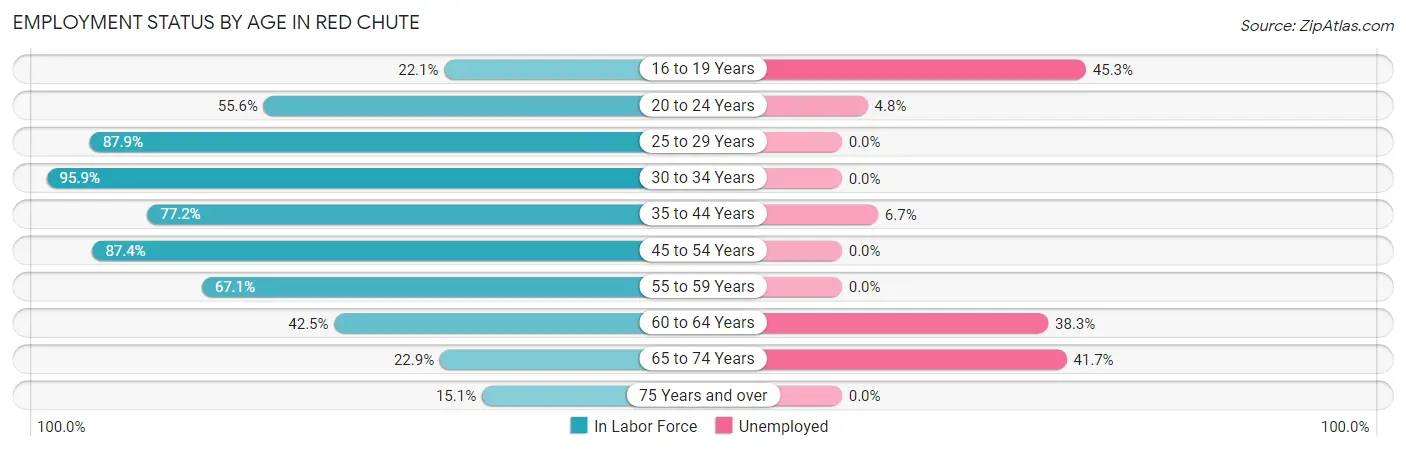
| Age Bracket | In Labor Force | Unemployed |
| 16 to 19 Years | 86 (22.1%) | 39 (45.3%) |
| 20 to 24 Years | 294 (55.6%) | 14 (4.8%) |
| 25 to 29 Years | 340 (87.9%) | 0 (0.0%) |
| 30 to 34 Years | 587 (95.9%) | 0 (0.0%) |
| 35 to 44 Years | 742 (77.2%) | 50 (6.7%) |
| 45 to 54 Years | 889 (87.4%) | 0 (0.0%) |
| 55 to 59 Years | 287 (67.1%) | 0 (0.0%) |
| 60 to 64 Years | 175 (42.5%) | 67 (38.3%) |
| 65 to 74 Years | 108 (22.9%) | 45 (41.7%) |
| 75 Years and over | 59 (15.1%) | 0 (0.0%) |
| Total | 3,566 (63.7%) | 221 (6.2%) |
Employment Status by Educational Attainment in Red Chute
According to labor force statistics for Red Chute, 79.1% of individuals (3,019) out of the total population between 25 and 64 years of age (3,817) are in the labor force, with 4.0% or 121 of them being unemployed. The group with the highest labor force participation rate are those with the educational attainment of bachelor's degree or higher, with 88.3% or 962 individuals in the labor force. Within the labor force, individuals with college / associate degree education have the highest percentage of unemployment, with 7.4% or 92 of them being unemployed.
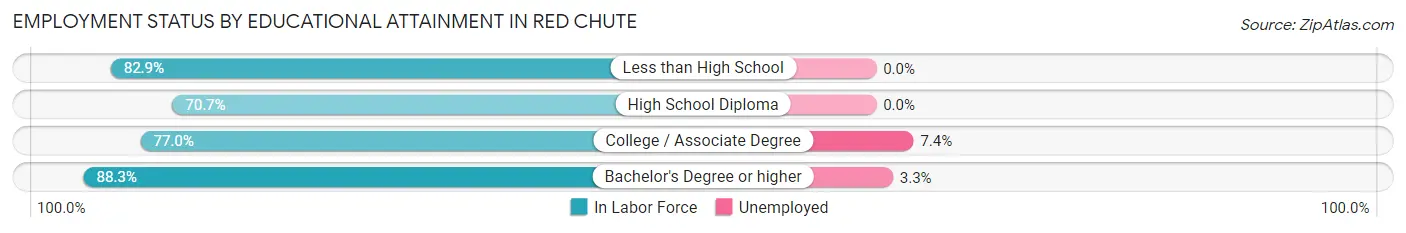
| Educational Attainment | In Labor Force | Unemployed |
| Less than High School | 194 (82.9%) | 0 (0.0%) |
| High School Diploma | 621 (70.7%) | 0 (0.0%) |
| College / Associate Degree | 1,244 (77.0%) | 120 (7.4%) |
| Bachelor's Degree or higher | 962 (88.3%) | 36 (3.3%) |
| Total | 3,019 (79.1%) | 153 (4.0%) |
Employment Occupations by Sex in Red Chute
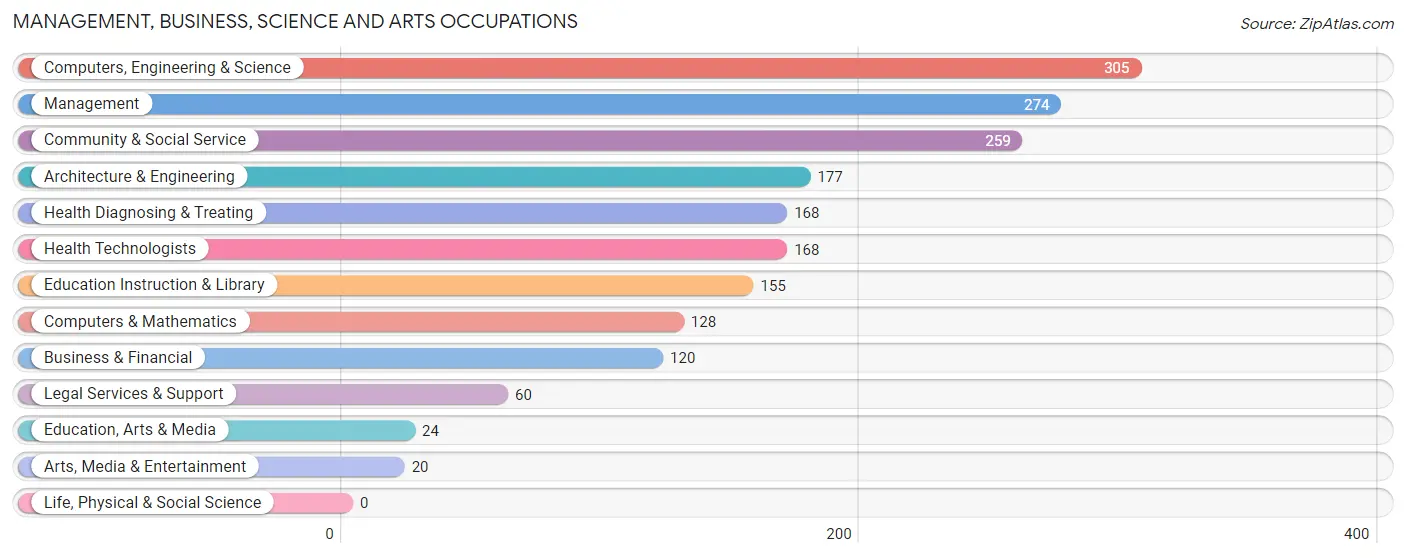
Management, Business, Science and Arts Occupations
The most common Management, Business, Science and Arts occupations in Red Chute are Computers, Engineering & Science (305 | 9.5%), Management (274 | 8.5%), Community & Social Service (259 | 8.0%), Architecture & Engineering (177 | 5.5%), and Health Diagnosing & Treating (168 | 5.2%).
Management, Business, Science and Arts Occupations by Sex
Within the Management, Business, Science and Arts occupations in Red Chute, the most male-oriented occupations are Arts, Media & Entertainment (100.0%), Architecture & Engineering (85.3%), and Computers, Engineering & Science (85.3%), while the most female-oriented occupations are Legal Services & Support (90.0%), Health Diagnosing & Treating (88.1%), and Health Technologists (88.1%).
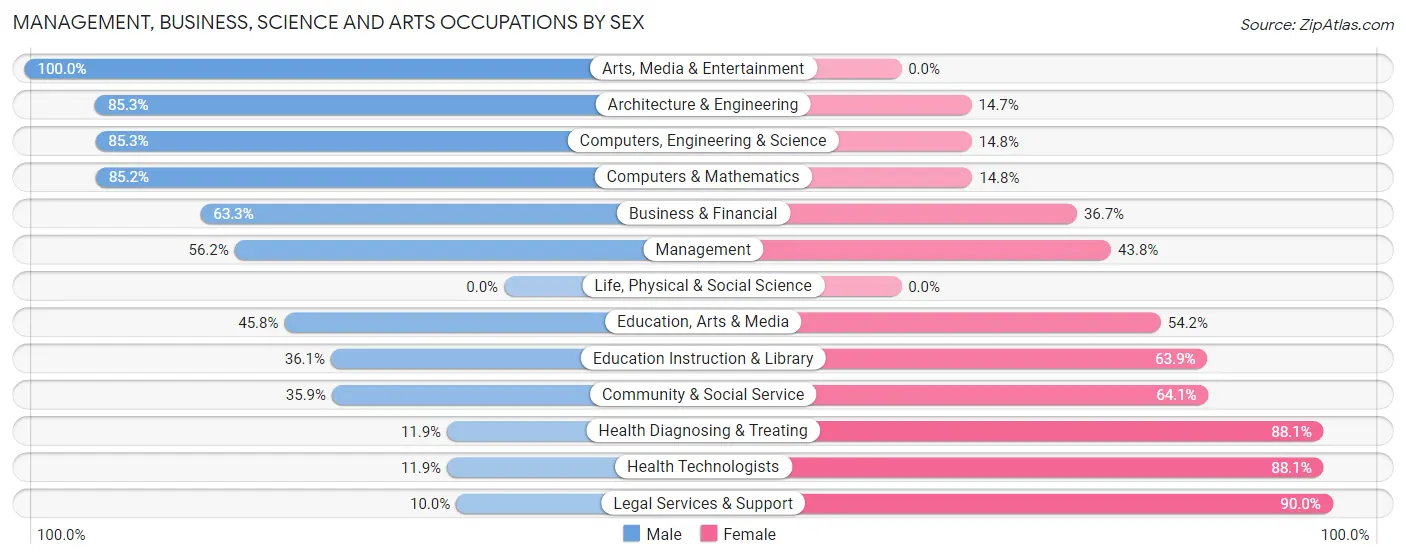
| Occupation | Male | Female |
| Management | 154 (56.2%) | 120 (43.8%) |
| Business & Financial | 76 (63.3%) | 44 (36.7%) |
| Computers, Engineering & Science | 260 (85.3%) | 45 (14.7%) |
| Computers & Mathematics | 109 (85.2%) | 19 (14.8%) |
| Architecture & Engineering | 151 (85.3%) | 26 (14.7%) |
| Life, Physical & Social Science | 0 (0.0%) | 0 (0.0%) |
| Community & Social Service | 93 (35.9%) | 166 (64.1%) |
| Education, Arts & Media | 11 (45.8%) | 13 (54.2%) |
| Legal Services & Support | 6 (10.0%) | 54 (90.0%) |
| Education Instruction & Library | 56 (36.1%) | 99 (63.9%) |
| Arts, Media & Entertainment | 20 (100.0%) | 0 (0.0%) |
| Health Diagnosing & Treating | 20 (11.9%) | 148 (88.1%) |
| Health Technologists | 20 (11.9%) | 148 (88.1%) |
| Total (Category) | 603 (53.5%) | 523 (46.5%) |
| Total (Overall) | 1,739 (54.0%) | 1,482 (46.0%) |
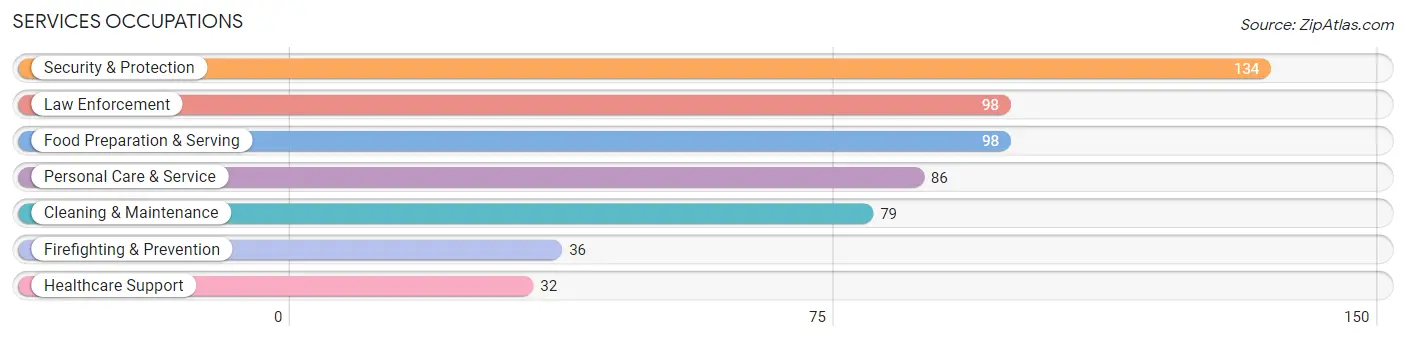
Services Occupations
The most common Services occupations in Red Chute are Security & Protection (134 | 4.2%), Law Enforcement (98 | 3.0%), Food Preparation & Serving (98 | 3.0%), Personal Care & Service (86 | 2.7%), and Cleaning & Maintenance (79 | 2.5%).
Services Occupations by Sex
Within the Services occupations in Red Chute, the most male-oriented occupations are Firefighting & Prevention (100.0%), Security & Protection (82.1%), and Law Enforcement (75.5%), while the most female-oriented occupations are Healthcare Support (100.0%), Food Preparation & Serving (84.7%), and Personal Care & Service (82.6%).
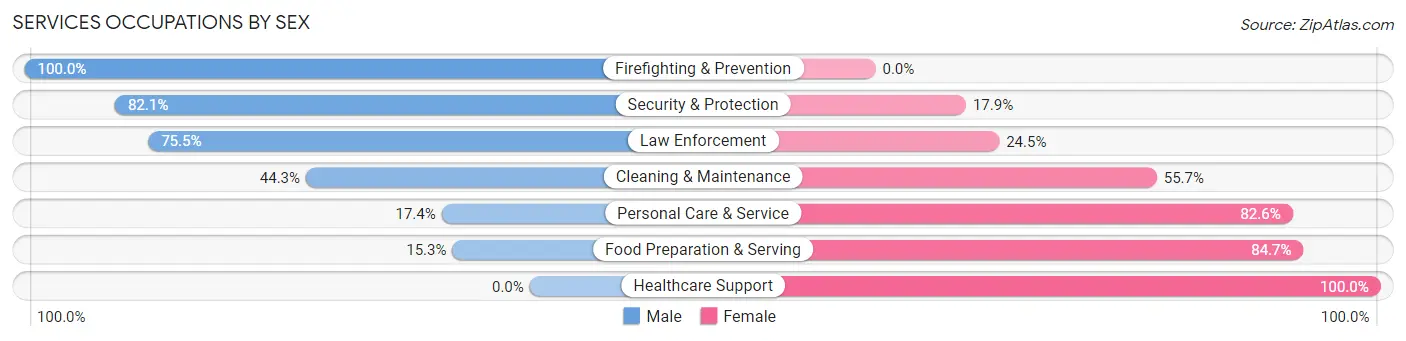
| Occupation | Male | Female |
| Healthcare Support | 0 (0.0%) | 32 (100.0%) |
| Security & Protection | 110 (82.1%) | 24 (17.9%) |
| Firefighting & Prevention | 36 (100.0%) | 0 (0.0%) |
| Law Enforcement | 74 (75.5%) | 24 (24.5%) |
| Food Preparation & Serving | 15 (15.3%) | 83 (84.7%) |
| Cleaning & Maintenance | 35 (44.3%) | 44 (55.7%) |
| Personal Care & Service | 15 (17.4%) | 71 (82.6%) |
| Total (Category) | 175 (40.8%) | 254 (59.2%) |
| Total (Overall) | 1,739 (54.0%) | 1,482 (46.0%) |
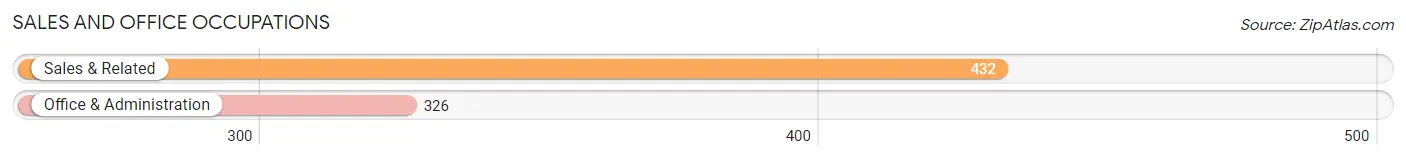
Sales and Office Occupations
The most common Sales and Office occupations in Red Chute are Sales & Related (432 | 13.4%), and Office & Administration (326 | 10.1%).
Sales and Office Occupations by Sex
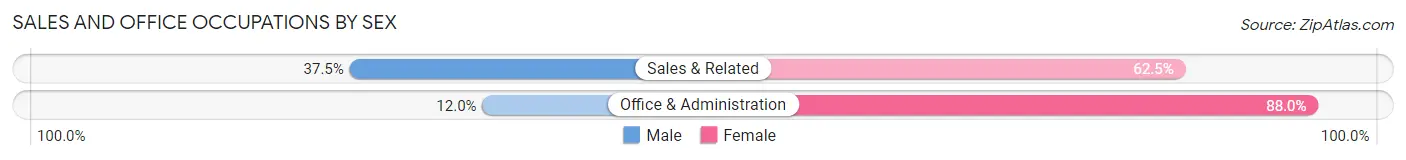
| Occupation | Male | Female |
| Sales & Related | 162 (37.5%) | 270 (62.5%) |
| Office & Administration | 39 (12.0%) | 287 (88.0%) |
| Total (Category) | 201 (26.5%) | 557 (73.5%) |
| Total (Overall) | 1,739 (54.0%) | 1,482 (46.0%) |
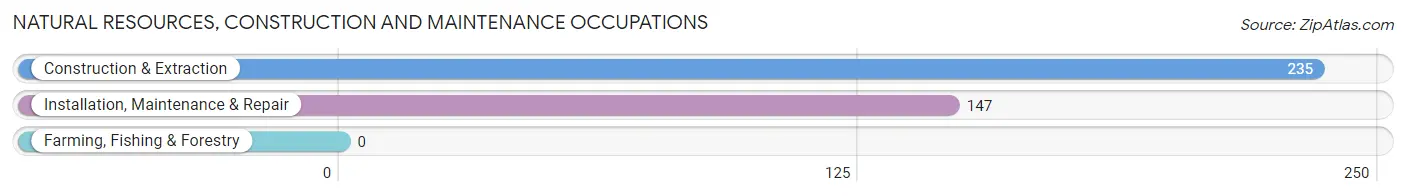
Natural Resources, Construction and Maintenance Occupations
The most common Natural Resources, Construction and Maintenance occupations in Red Chute are Construction & Extraction (235 | 7.3%), and Installation, Maintenance & Repair (147 | 4.6%).
Natural Resources, Construction and Maintenance Occupations by Sex
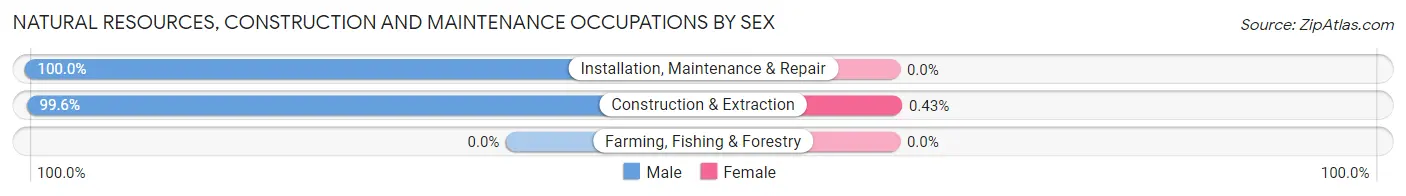
| Occupation | Male | Female |
| Farming, Fishing & Forestry | 0 (0.0%) | 0 (0.0%) |
| Construction & Extraction | 234 (99.6%) | 1 (0.4%) |
| Installation, Maintenance & Repair | 147 (100.0%) | 0 (0.0%) |
| Total (Category) | 381 (99.7%) | 1 (0.3%) |
| Total (Overall) | 1,739 (54.0%) | 1,482 (46.0%) |
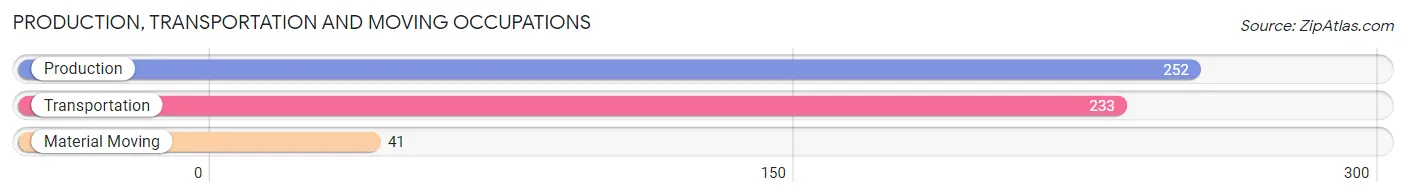
Production, Transportation and Moving Occupations
The most common Production, Transportation and Moving occupations in Red Chute are Production (252 | 7.8%), Transportation (233 | 7.2%), and Material Moving (41 | 1.3%).
Production, Transportation and Moving Occupations by Sex
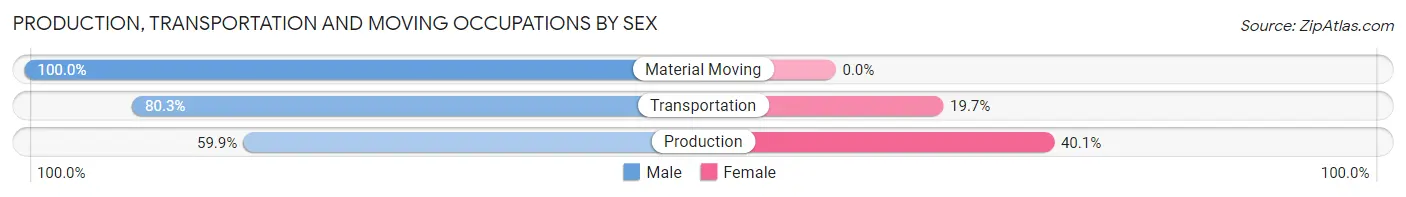
| Occupation | Male | Female |
| Production | 151 (59.9%) | 101 (40.1%) |
| Transportation | 187 (80.3%) | 46 (19.7%) |
| Material Moving | 41 (100.0%) | 0 (0.0%) |
| Total (Category) | 379 (72.1%) | 147 (28.0%) |
| Total (Overall) | 1,739 (54.0%) | 1,482 (46.0%) |
Employment Industries by Sex in Red Chute
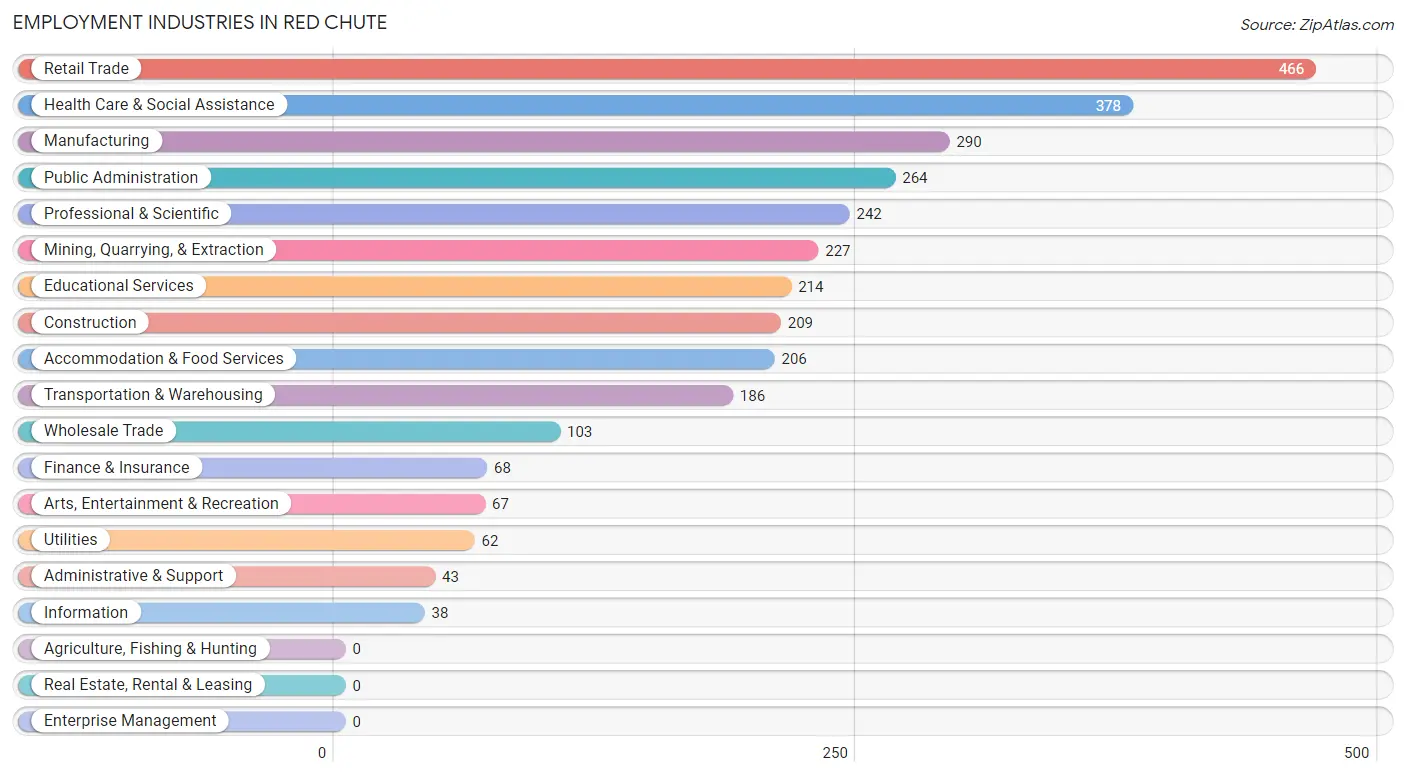
Employment Industries in Red Chute
The major employment industries in Red Chute include Retail Trade (466 | 14.5%), Health Care & Social Assistance (378 | 11.7%), Manufacturing (290 | 9.0%), Public Administration (264 | 8.2%), and Professional & Scientific (242 | 7.5%).
Employment Industries by Sex in Red Chute
The Red Chute industries that see more men than women are Mining, Quarrying, & Extraction (100.0%), Transportation & Warehousing (100.0%), and Utilities (100.0%), whereas the industries that tend to have a higher number of women are Health Care & Social Assistance (87.6%), Educational Services (73.8%), and Arts, Entertainment & Recreation (73.1%).
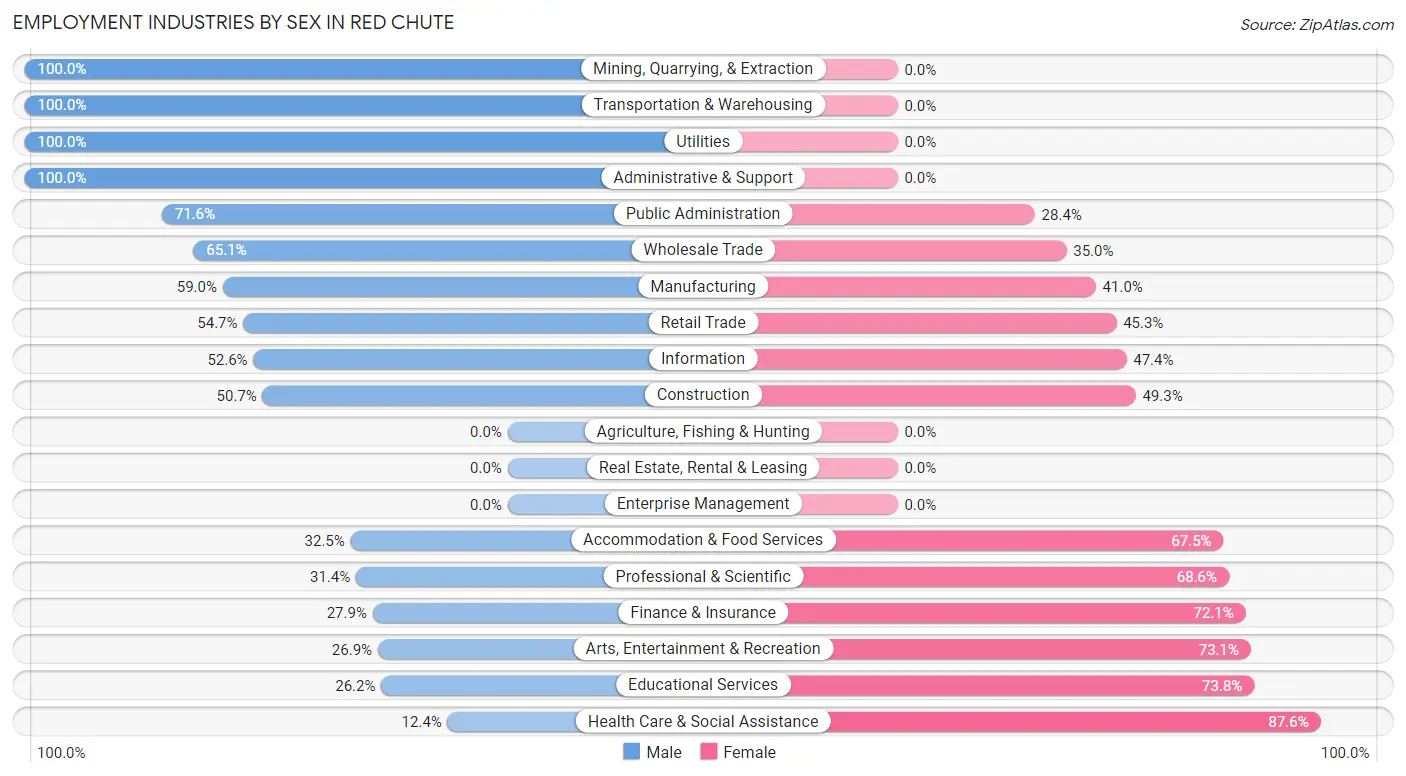
| Industry | Male | Female |
| Agriculture, Fishing & Hunting | 0 (0.0%) | 0 (0.0%) |
| Mining, Quarrying, & Extraction | 227 (100.0%) | 0 (0.0%) |
| Construction | 106 (50.7%) | 103 (49.3%) |
| Manufacturing | 171 (59.0%) | 119 (41.0%) |
| Wholesale Trade | 67 (65.0%) | 36 (34.9%) |
| Retail Trade | 255 (54.7%) | 211 (45.3%) |
| Transportation & Warehousing | 186 (100.0%) | 0 (0.0%) |
| Utilities | 62 (100.0%) | 0 (0.0%) |
| Information | 20 (52.6%) | 18 (47.4%) |
| Finance & Insurance | 19 (27.9%) | 49 (72.1%) |
| Real Estate, Rental & Leasing | 0 (0.0%) | 0 (0.0%) |
| Professional & Scientific | 76 (31.4%) | 166 (68.6%) |
| Enterprise Management | 0 (0.0%) | 0 (0.0%) |
| Administrative & Support | 43 (100.0%) | 0 (0.0%) |
| Educational Services | 56 (26.2%) | 158 (73.8%) |
| Health Care & Social Assistance | 47 (12.4%) | 331 (87.6%) |
| Arts, Entertainment & Recreation | 18 (26.9%) | 49 (73.1%) |
| Accommodation & Food Services | 67 (32.5%) | 139 (67.5%) |
| Public Administration | 189 (71.6%) | 75 (28.4%) |
| Total | 1,739 (54.0%) | 1,482 (46.0%) |
Education in Red Chute
School Enrollment in Red Chute
The most common levels of schooling among the 2,518 students in Red Chute are middle school (769 | 30.5%), college / undergraduate (590 | 23.4%), and elementary school (442 | 17.5%).
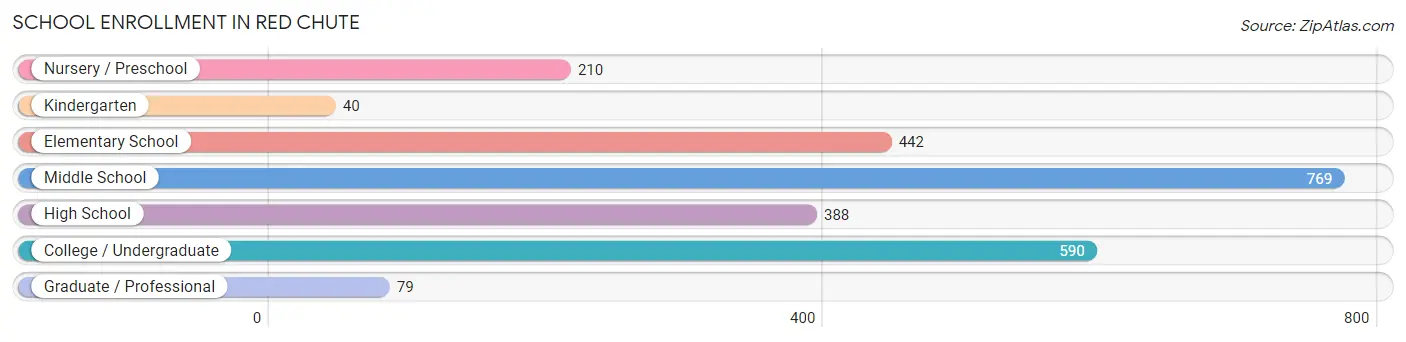
| School Level | # Students | % Students |
| Nursery / Preschool | 210 | 8.3% |
| Kindergarten | 40 | 1.6% |
| Elementary School | 442 | 17.5% |
| Middle School | 769 | 30.5% |
| High School | 388 | 15.4% |
| College / Undergraduate | 590 | 23.4% |
| Graduate / Professional | 79 | 3.1% |
| Total | 2,518 | 100.0% |
School Enrollment by Age by Funding Source in Red Chute
Out of a total of 2,518 students who are enrolled in schools in Red Chute, 347 (13.8%) attend a private institution, while the remaining 2,171 (86.2%) are enrolled in public schools. The age group of 20 to 24 year olds has the highest likelihood of being enrolled in private schools, with 64 (21.8% in the age bracket) enrolled. Conversely, the age group of 18 to 19 year olds has the lowest likelihood of being enrolled in a private school, with 105 (100.0% in the age bracket) attending a public institution.
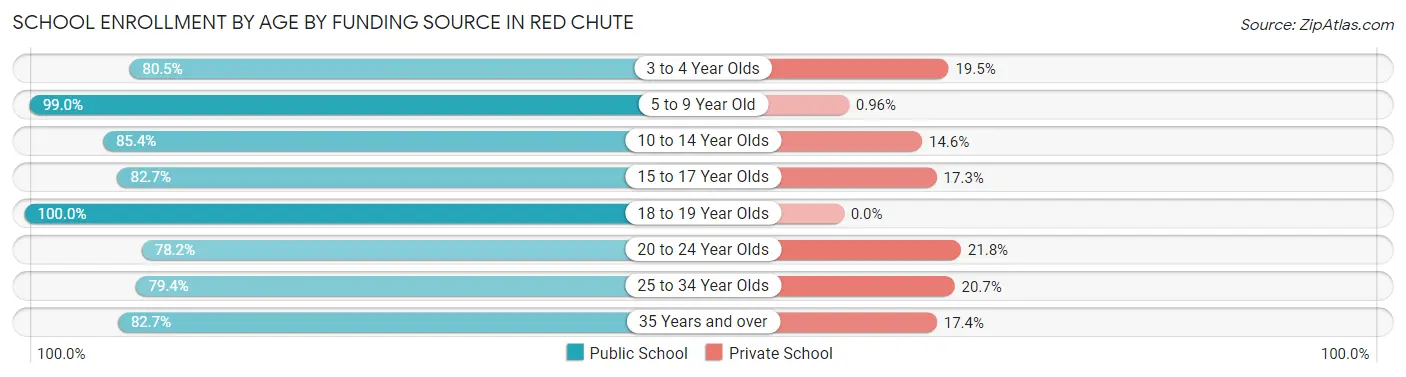
| Age Bracket | Public School | Private School |
| 3 to 4 Year Olds | 169 (80.5%) | 41 (19.5%) |
| 5 to 9 Year Old | 412 (99.0%) | 4 (1.0%) |
| 10 to 14 Year Olds | 749 (85.4%) | 128 (14.6%) |
| 15 to 17 Year Olds | 253 (82.7%) | 53 (17.3%) |
| 18 to 19 Year Olds | 105 (100.0%) | 0 (0.0%) |
| 20 to 24 Year Olds | 229 (78.2%) | 64 (21.8%) |
| 25 to 34 Year Olds | 73 (79.3%) | 19 (20.6%) |
| 35 Years and over | 181 (82.7%) | 38 (17.3%) |
| Total | 2,171 (86.2%) | 347 (13.8%) |
Educational Attainment by Field of Study in Red Chute
Education (383 | 25.0%), science & technology (265 | 17.3%), business (264 | 17.2%), liberal arts & history (139 | 9.1%), and engineering (87 | 5.7%) are the most common fields of study among 1,531 individuals in Red Chute who have obtained a bachelor's degree or higher.
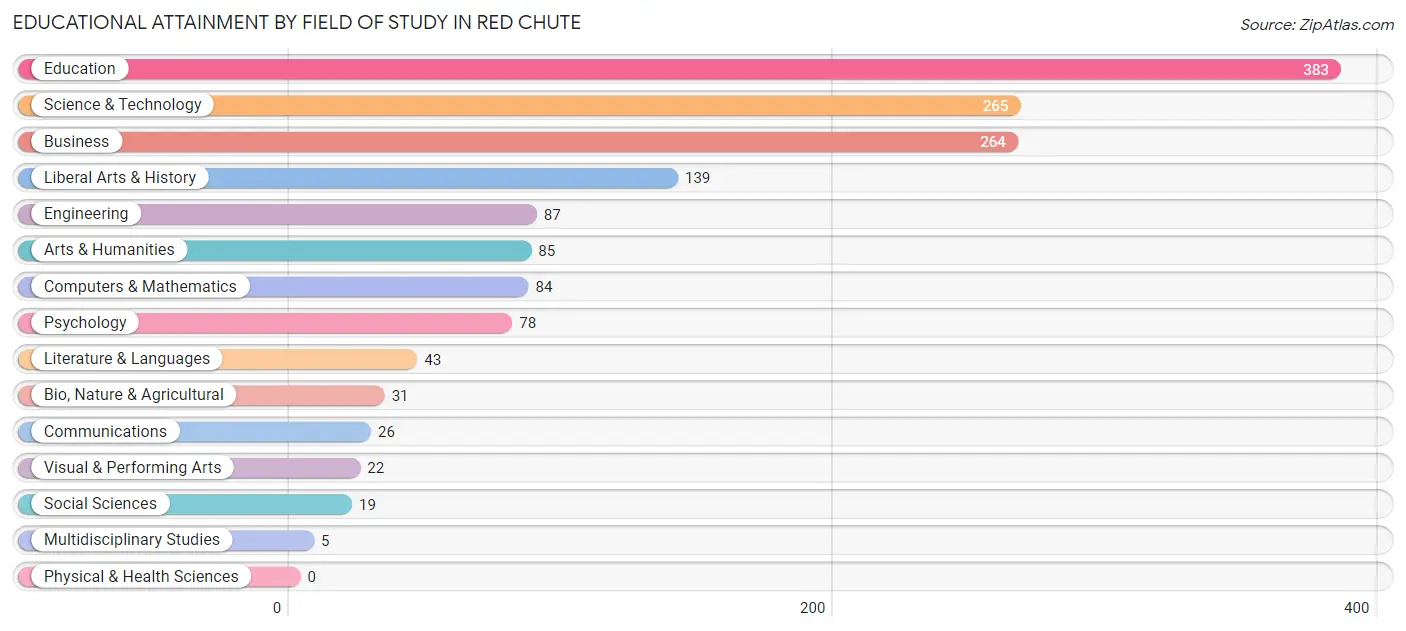
| Field of Study | # Graduates | % Graduates |
| Computers & Mathematics | 84 | 5.5% |
| Bio, Nature & Agricultural | 31 | 2.0% |
| Physical & Health Sciences | 0 | 0.0% |
| Psychology | 78 | 5.1% |
| Social Sciences | 19 | 1.2% |
| Engineering | 87 | 5.7% |
| Multidisciplinary Studies | 5 | 0.3% |
| Science & Technology | 265 | 17.3% |
| Business | 264 | 17.2% |
| Education | 383 | 25.0% |
| Literature & Languages | 43 | 2.8% |
| Liberal Arts & History | 139 | 9.1% |
| Visual & Performing Arts | 22 | 1.4% |
| Communications | 26 | 1.7% |
| Arts & Humanities | 85 | 5.6% |
| Total | 1,531 | 100.0% |
Transportation & Commute in Red Chute
Vehicle Availability by Sex in Red Chute
The most prevalent vehicle ownership categories in Red Chute are males with 2 vehicles (1,124, accounting for 60.8%) and females with 2 vehicles (822, making up 78.0%).
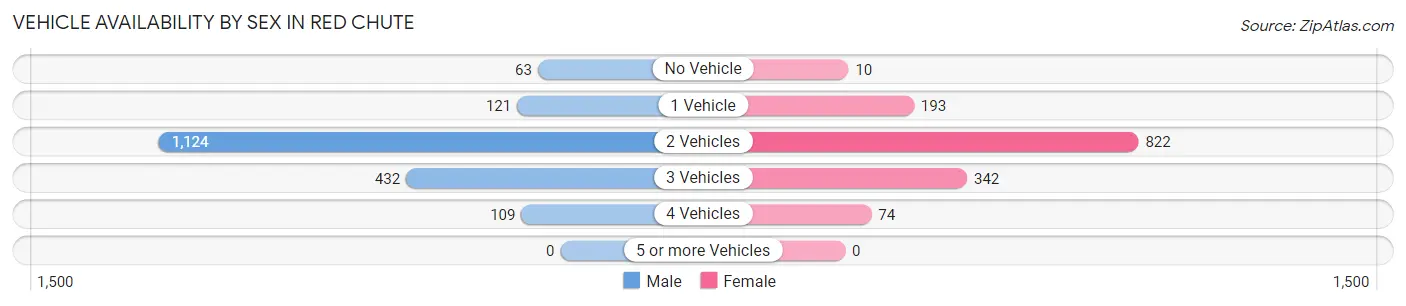
| Vehicles Available | Male | Female |
| No Vehicle | 63 (3.4%) | 10 (0.7%) |
| 1 Vehicle | 121 (6.5%) | 193 (13.4%) |
| 2 Vehicles | 1,124 (60.8%) | 822 (57.0%) |
| 3 Vehicles | 432 (23.4%) | 342 (23.7%) |
| 4 Vehicles | 109 (5.9%) | 74 (5.1%) |
| 5 or more Vehicles | 0 (0.0%) | 0 (0.0%) |
| Total | 1,849 (100.0%) | 1,441 (100.0%) |
Commute Time in Red Chute
The most frequently occuring commute durations in Red Chute are 20 to 24 minutes (829 commuters, 27.4%), 15 to 19 minutes (643 commuters, 21.2%), and 30 to 34 minutes (307 commuters, 10.1%).
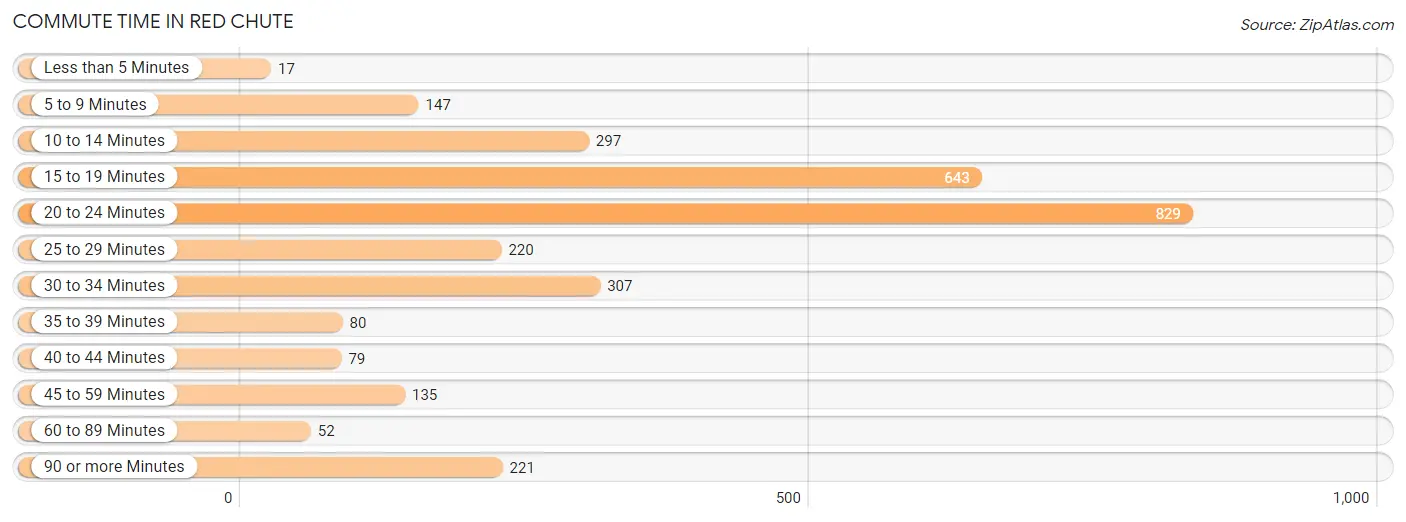
| Commute Time | # Commuters | % Commuters |
| Less than 5 Minutes | 17 | 0.6% |
| 5 to 9 Minutes | 147 | 4.9% |
| 10 to 14 Minutes | 297 | 9.8% |
| 15 to 19 Minutes | 643 | 21.2% |
| 20 to 24 Minutes | 829 | 27.4% |
| 25 to 29 Minutes | 220 | 7.3% |
| 30 to 34 Minutes | 307 | 10.1% |
| 35 to 39 Minutes | 80 | 2.6% |
| 40 to 44 Minutes | 79 | 2.6% |
| 45 to 59 Minutes | 135 | 4.5% |
| 60 to 89 Minutes | 52 | 1.7% |
| 90 or more Minutes | 221 | 7.3% |
Commute Time by Sex in Red Chute
The most common commute times in Red Chute are 20 to 24 minutes (469 commuters, 27.1%) for males and 15 to 19 minutes (382 commuters, 29.4%) for females.
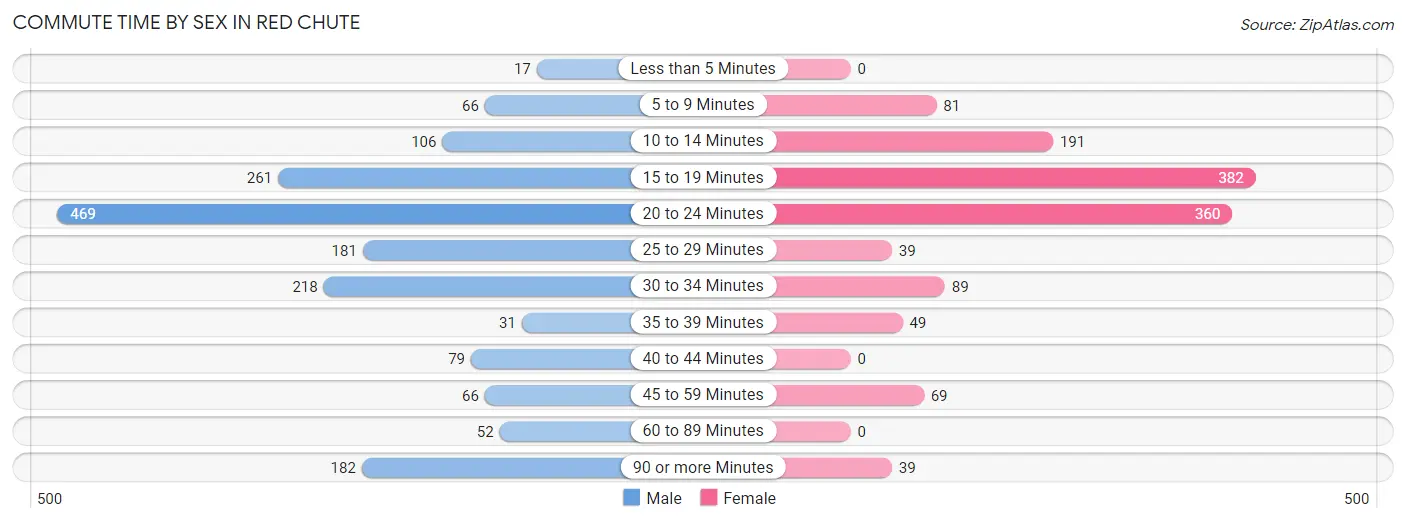
| Commute Time | Male | Female |
| Less than 5 Minutes | 17 (1.0%) | 0 (0.0%) |
| 5 to 9 Minutes | 66 (3.8%) | 81 (6.2%) |
| 10 to 14 Minutes | 106 (6.1%) | 191 (14.7%) |
| 15 to 19 Minutes | 261 (15.1%) | 382 (29.4%) |
| 20 to 24 Minutes | 469 (27.1%) | 360 (27.7%) |
| 25 to 29 Minutes | 181 (10.5%) | 39 (3.0%) |
| 30 to 34 Minutes | 218 (12.6%) | 89 (6.9%) |
| 35 to 39 Minutes | 31 (1.8%) | 49 (3.8%) |
| 40 to 44 Minutes | 79 (4.6%) | 0 (0.0%) |
| 45 to 59 Minutes | 66 (3.8%) | 69 (5.3%) |
| 60 to 89 Minutes | 52 (3.0%) | 0 (0.0%) |
| 90 or more Minutes | 182 (10.5%) | 39 (3.0%) |
Time of Departure to Work by Sex in Red Chute
The most frequent times of departure to work in Red Chute are 7:00 AM to 7:29 AM (330, 19.1%) for males and 7:00 AM to 7:29 AM (356, 27.4%) for females.
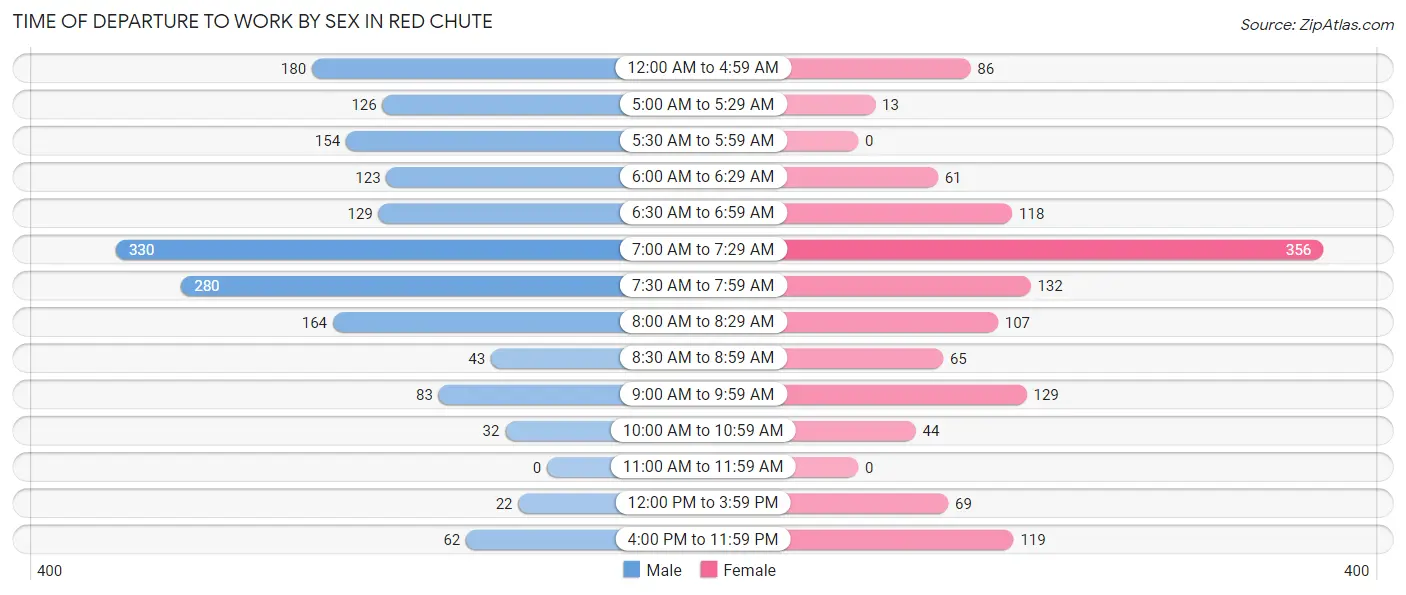
| Time of Departure | Male | Female |
| 12:00 AM to 4:59 AM | 180 (10.4%) | 86 (6.6%) |
| 5:00 AM to 5:29 AM | 126 (7.3%) | 13 (1.0%) |
| 5:30 AM to 5:59 AM | 154 (8.9%) | 0 (0.0%) |
| 6:00 AM to 6:29 AM | 123 (7.1%) | 61 (4.7%) |
| 6:30 AM to 6:59 AM | 129 (7.5%) | 118 (9.1%) |
| 7:00 AM to 7:29 AM | 330 (19.1%) | 356 (27.4%) |
| 7:30 AM to 7:59 AM | 280 (16.2%) | 132 (10.2%) |
| 8:00 AM to 8:29 AM | 164 (9.5%) | 107 (8.2%) |
| 8:30 AM to 8:59 AM | 43 (2.5%) | 65 (5.0%) |
| 9:00 AM to 9:59 AM | 83 (4.8%) | 129 (9.9%) |
| 10:00 AM to 10:59 AM | 32 (1.8%) | 44 (3.4%) |
| 11:00 AM to 11:59 AM | 0 (0.0%) | 0 (0.0%) |
| 12:00 PM to 3:59 PM | 22 (1.3%) | 69 (5.3%) |
| 4:00 PM to 11:59 PM | 62 (3.6%) | 119 (9.2%) |
| Total | 1,728 (100.0%) | 1,299 (100.0%) |
Housing Occupancy in Red Chute
Occupancy by Ownership in Red Chute
Of the total 2,755 dwellings in Red Chute, owner-occupied units account for 2,410 (87.5%), while renter-occupied units make up 345 (12.5%).
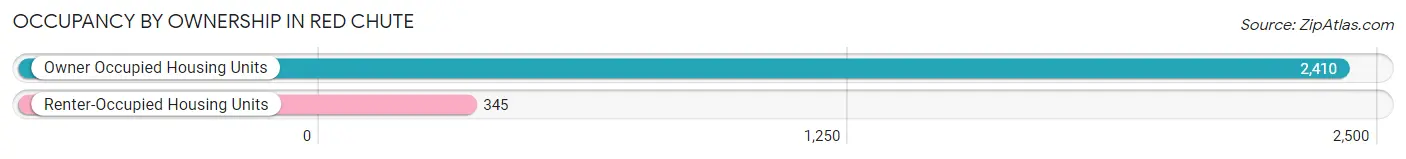
| Occupancy | # Housing Units | % Housing Units |
| Owner Occupied Housing Units | 2,410 | 87.5% |
| Renter-Occupied Housing Units | 345 | 12.5% |
| Total Occupied Housing Units | 2,755 | 100.0% |
Occupancy by Household Size in Red Chute
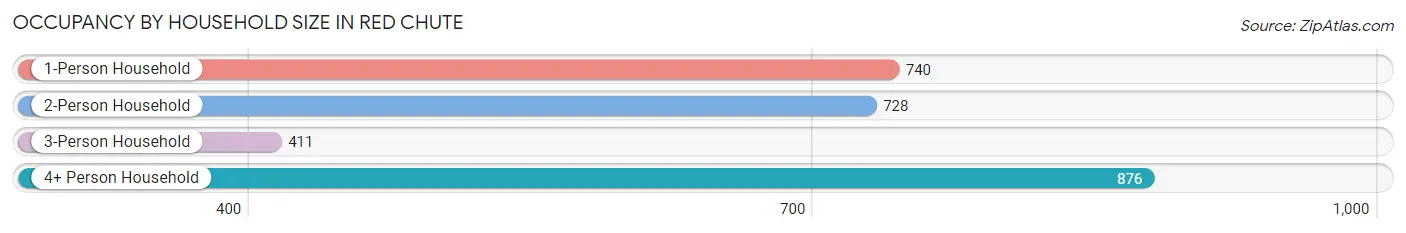
| Household Size | # Housing Units | % Housing Units |
| 1-Person Household | 740 | 26.9% |
| 2-Person Household | 728 | 26.4% |
| 3-Person Household | 411 | 14.9% |
| 4+ Person Household | 876 | 31.8% |
| Total Housing Units | 2,755 | 100.0% |
Occupancy by Ownership by Household Size in Red Chute
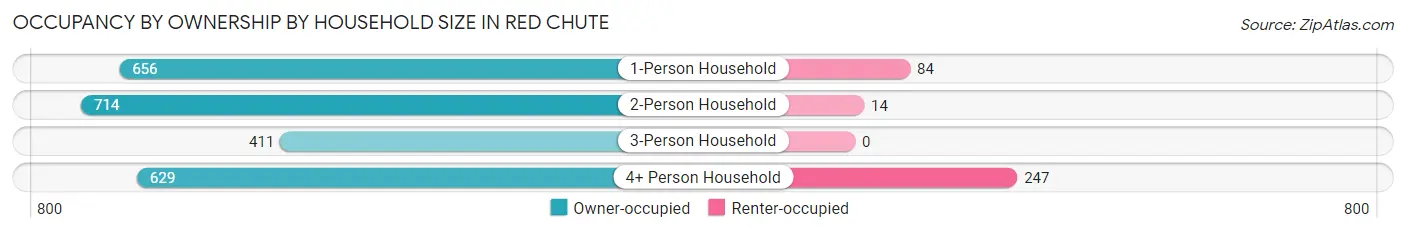
| Household Size | Owner-occupied | Renter-occupied |
| 1-Person Household | 656 (88.6%) | 84 (11.4%) |
| 2-Person Household | 714 (98.1%) | 14 (1.9%) |
| 3-Person Household | 411 (100.0%) | 0 (0.0%) |
| 4+ Person Household | 629 (71.8%) | 247 (28.2%) |
| Total Housing Units | 2,410 (87.5%) | 345 (12.5%) |
Occupancy by Educational Attainment in Red Chute
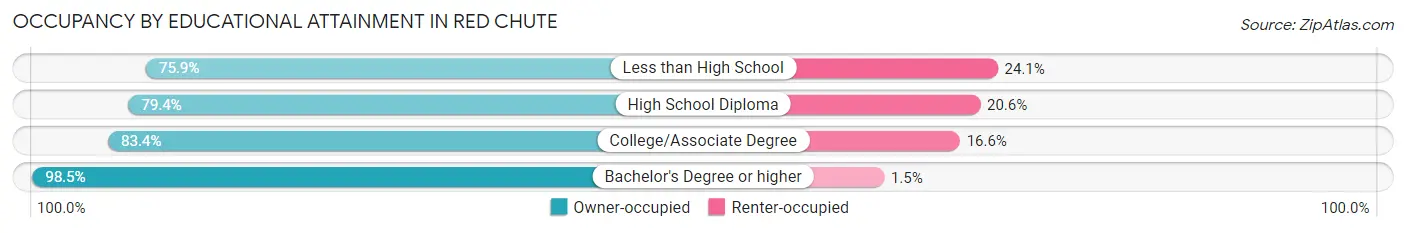
| Household Size | Owner-occupied | Renter-occupied |
| Less than High School | 145 (75.9%) | 46 (24.1%) |
| High School Diploma | 401 (79.4%) | 104 (20.6%) |
| College/Associate Degree | 907 (83.4%) | 180 (16.6%) |
| Bachelor's Degree or higher | 957 (98.5%) | 15 (1.5%) |
Occupancy by Age of Householder in Red Chute
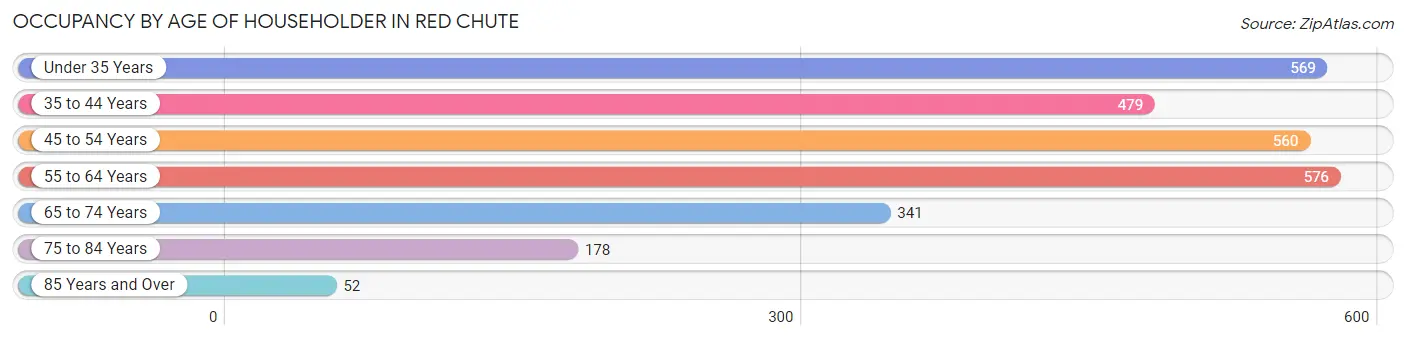
| Age Bracket | # Households | % Households |
| Under 35 Years | 569 | 20.6% |
| 35 to 44 Years | 479 | 17.4% |
| 45 to 54 Years | 560 | 20.3% |
| 55 to 64 Years | 576 | 20.9% |
| 65 to 74 Years | 341 | 12.4% |
| 75 to 84 Years | 178 | 6.5% |
| 85 Years and Over | 52 | 1.9% |
| Total | 2,755 | 100.0% |
Housing Finances in Red Chute
Median Income by Occupancy in Red Chute
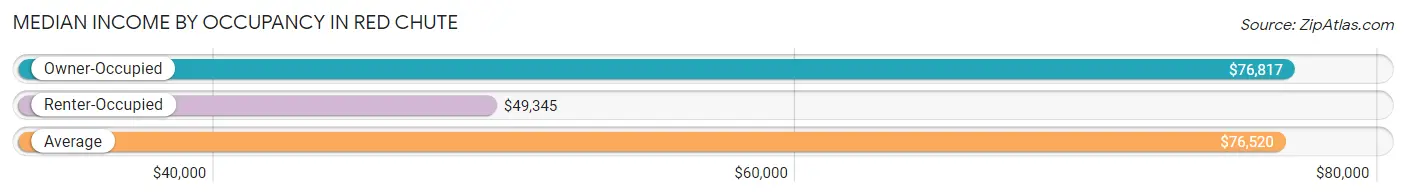
| Occupancy Type | # Households | Median Income |
| Owner-Occupied | 2,410 (87.5%) | $76,817 |
| Renter-Occupied | 345 (12.5%) | $49,345 |
| Average | 2,755 (100.0%) | $76,520 |
Occupancy by Householder Income Bracket in Red Chute
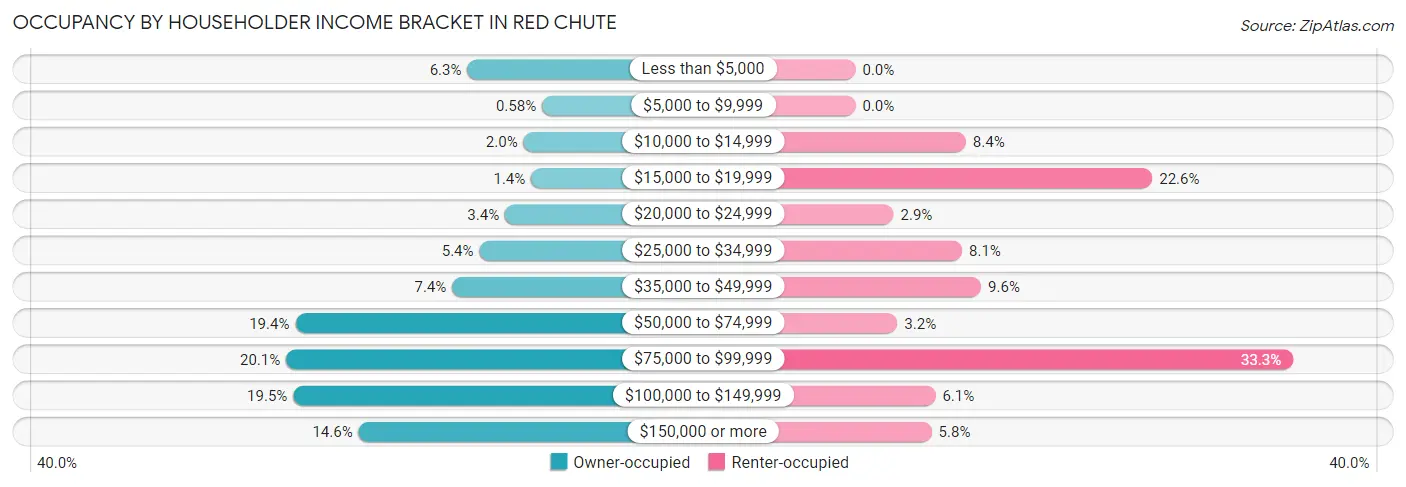
| Income Bracket | Owner-occupied | Renter-occupied |
| Less than $5,000 | 151 (6.3%) | 0 (0.0%) |
| $5,000 to $9,999 | 14 (0.6%) | 0 (0.0%) |
| $10,000 to $14,999 | 48 (2.0%) | 29 (8.4%) |
| $15,000 to $19,999 | 34 (1.4%) | 78 (22.6%) |
| $20,000 to $24,999 | 82 (3.4%) | 10 (2.9%) |
| $25,000 to $34,999 | 129 (5.3%) | 28 (8.1%) |
| $35,000 to $49,999 | 179 (7.4%) | 33 (9.6%) |
| $50,000 to $74,999 | 467 (19.4%) | 11 (3.2%) |
| $75,000 to $99,999 | 484 (20.1%) | 115 (33.3%) |
| $100,000 to $149,999 | 471 (19.5%) | 21 (6.1%) |
| $150,000 or more | 351 (14.6%) | 20 (5.8%) |
| Total | 2,410 (100.0%) | 345 (100.0%) |
Monthly Housing Cost Tiers in Red Chute
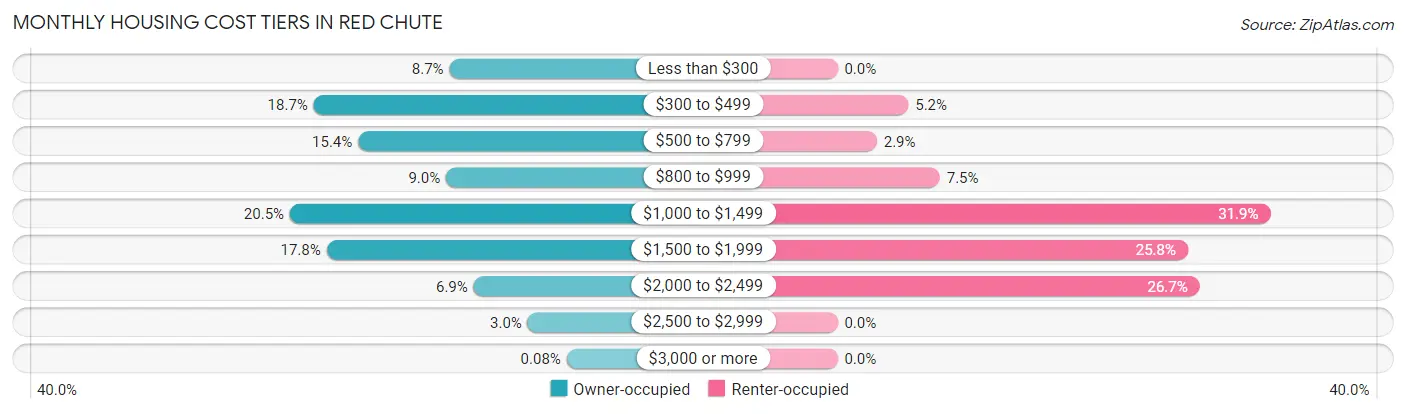
| Monthly Cost | Owner-occupied | Renter-occupied |
| Less than $300 | 210 (8.7%) | 0 (0.0%) |
| $300 to $499 | 451 (18.7%) | 18 (5.2%) |
| $500 to $799 | 372 (15.4%) | 10 (2.9%) |
| $800 to $999 | 216 (9.0%) | 26 (7.5%) |
| $1,000 to $1,499 | 493 (20.5%) | 110 (31.9%) |
| $1,500 to $1,999 | 428 (17.8%) | 89 (25.8%) |
| $2,000 to $2,499 | 167 (6.9%) | 92 (26.7%) |
| $2,500 to $2,999 | 71 (2.9%) | 0 (0.0%) |
| $3,000 or more | 2 (0.1%) | 0 (0.0%) |
| Total | 2,410 (100.0%) | 345 (100.0%) |
Physical Housing Characteristics in Red Chute
Housing Structures in Red Chute
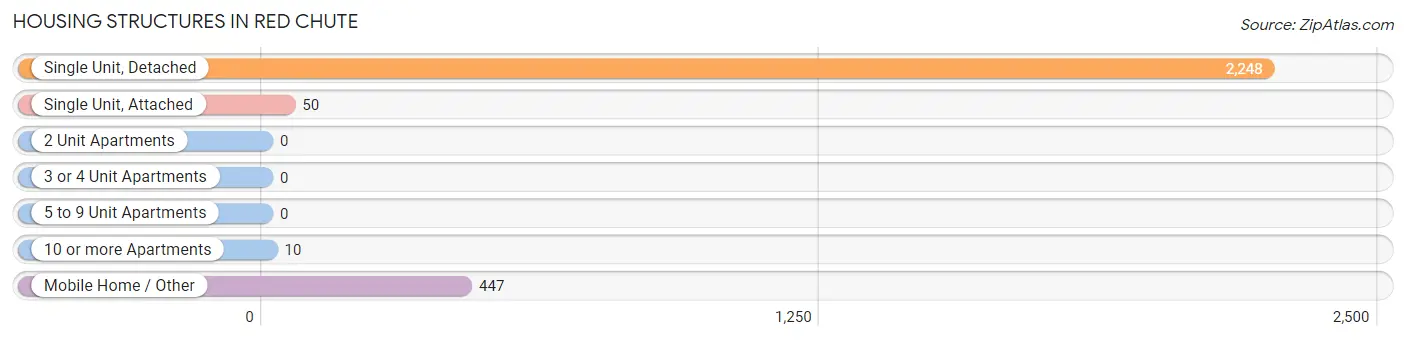
| Structure Type | # Housing Units | % Housing Units |
| Single Unit, Detached | 2,248 | 81.6% |
| Single Unit, Attached | 50 | 1.8% |
| 2 Unit Apartments | 0 | 0.0% |
| 3 or 4 Unit Apartments | 0 | 0.0% |
| 5 to 9 Unit Apartments | 0 | 0.0% |
| 10 or more Apartments | 10 | 0.4% |
| Mobile Home / Other | 447 | 16.2% |
| Total | 2,755 | 100.0% |
Housing Structures by Occupancy in Red Chute
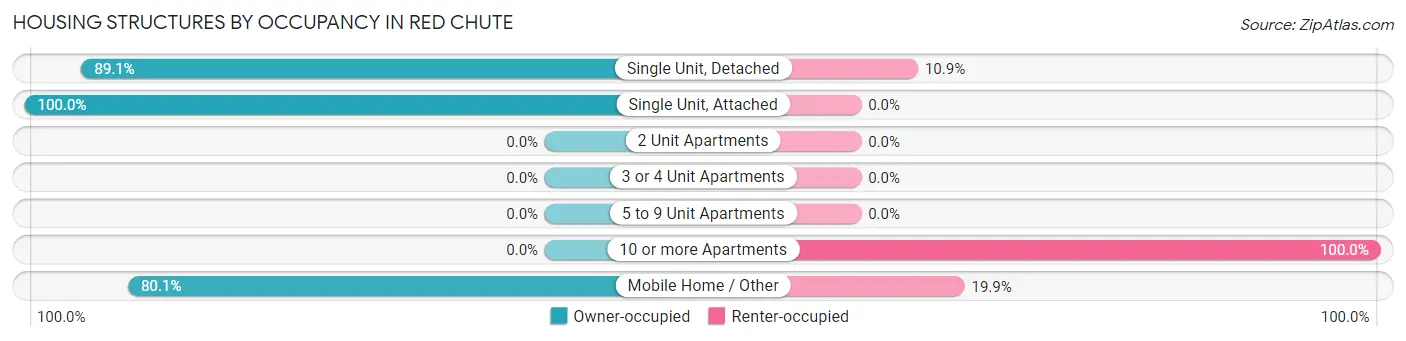
| Structure Type | Owner-occupied | Renter-occupied |
| Single Unit, Detached | 2,002 (89.1%) | 246 (10.9%) |
| Single Unit, Attached | 50 (100.0%) | 0 (0.0%) |
| 2 Unit Apartments | 0 (0.0%) | 0 (0.0%) |
| 3 or 4 Unit Apartments | 0 (0.0%) | 0 (0.0%) |
| 5 to 9 Unit Apartments | 0 (0.0%) | 0 (0.0%) |
| 10 or more Apartments | 0 (0.0%) | 10 (100.0%) |
| Mobile Home / Other | 358 (80.1%) | 89 (19.9%) |
| Total | 2,410 (87.5%) | 345 (12.5%) |
Housing Structures by Number of Rooms in Red Chute
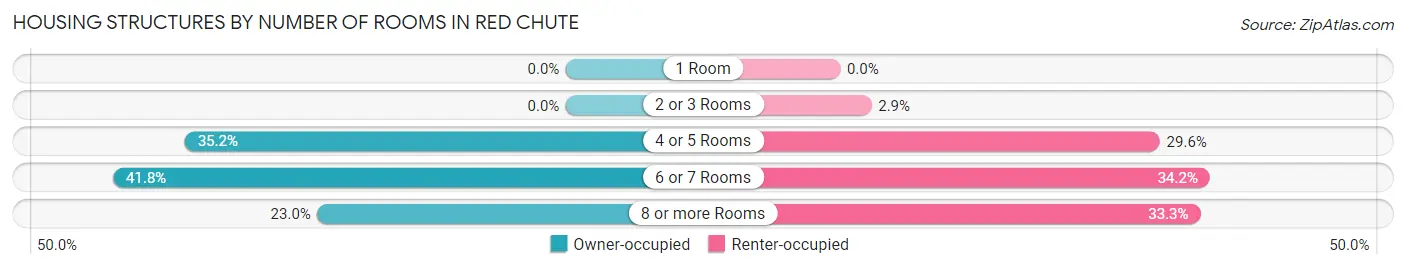
| Number of Rooms | Owner-occupied | Renter-occupied |
| 1 Room | 0 (0.0%) | 0 (0.0%) |
| 2 or 3 Rooms | 0 (0.0%) | 10 (2.9%) |
| 4 or 5 Rooms | 848 (35.2%) | 102 (29.6%) |
| 6 or 7 Rooms | 1,008 (41.8%) | 118 (34.2%) |
| 8 or more Rooms | 554 (23.0%) | 115 (33.3%) |
| Total | 2,410 (100.0%) | 345 (100.0%) |
Housing Structure by Heating Type in Red Chute
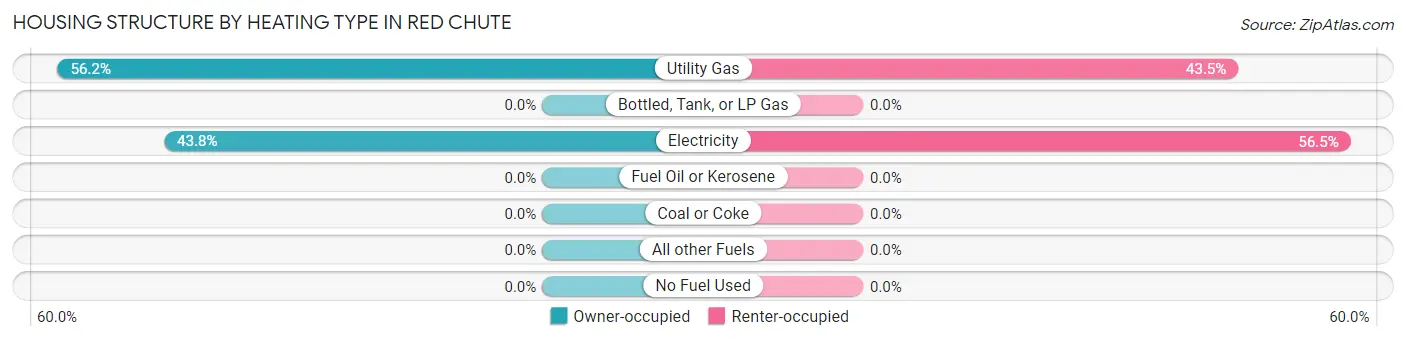
| Heating Type | Owner-occupied | Renter-occupied |
| Utility Gas | 1,354 (56.2%) | 150 (43.5%) |
| Bottled, Tank, or LP Gas | 0 (0.0%) | 0 (0.0%) |
| Electricity | 1,056 (43.8%) | 195 (56.5%) |
| Fuel Oil or Kerosene | 0 (0.0%) | 0 (0.0%) |
| Coal or Coke | 0 (0.0%) | 0 (0.0%) |
| All other Fuels | 0 (0.0%) | 0 (0.0%) |
| No Fuel Used | 0 (0.0%) | 0 (0.0%) |
| Total | 2,410 (100.0%) | 345 (100.0%) |
Household Vehicle Usage in Red Chute
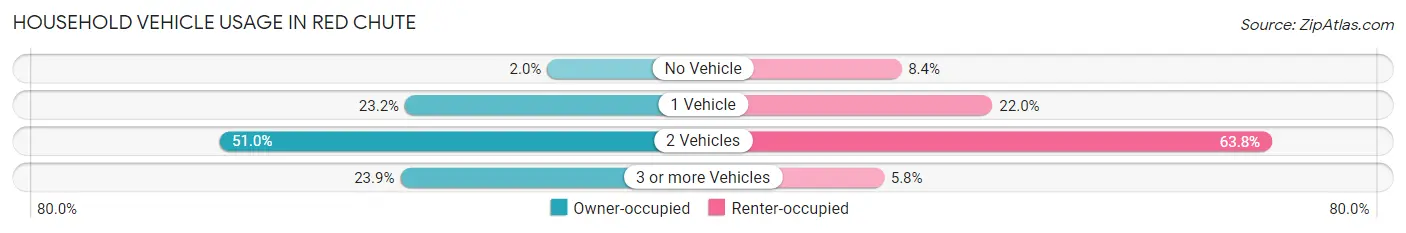
| Vehicles per Household | Owner-occupied | Renter-occupied |
| No Vehicle | 47 (1.9%) | 29 (8.4%) |
| 1 Vehicle | 559 (23.2%) | 76 (22.0%) |
| 2 Vehicles | 1,228 (50.9%) | 220 (63.8%) |
| 3 or more Vehicles | 576 (23.9%) | 20 (5.8%) |
| Total | 2,410 (100.0%) | 345 (100.0%) |
Real Estate & Mortgages in Red Chute
Real Estate and Mortgage Overview in Red Chute
| Characteristic | Without Mortgage | With Mortgage |
| Housing Units | 986 | 1,424 |
| Median Property Value | $160,600 | $222,000 |
| Median Household Income | $69,031 | $333 |
| Monthly Housing Costs | $444 | $2 |
| Real Estate Taxes | $690 | $145 |
Property Value by Mortgage Status in Red Chute
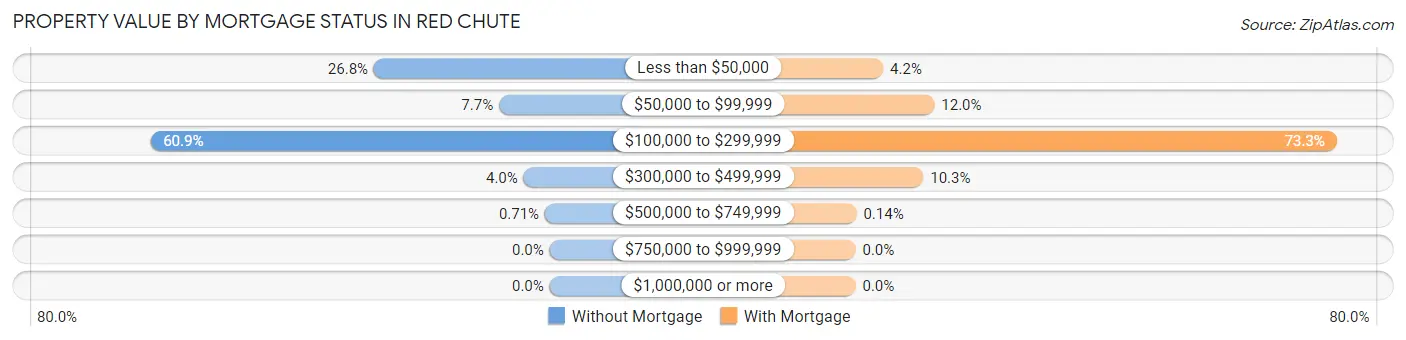
| Property Value | Without Mortgage | With Mortgage |
| Less than $50,000 | 264 (26.8%) | 60 (4.2%) |
| $50,000 to $99,999 | 76 (7.7%) | 171 (12.0%) |
| $100,000 to $299,999 | 600 (60.9%) | 1,044 (73.3%) |
| $300,000 to $499,999 | 39 (4.0%) | 147 (10.3%) |
| $500,000 to $749,999 | 7 (0.7%) | 2 (0.1%) |
| $750,000 to $999,999 | 0 (0.0%) | 0 (0.0%) |
| $1,000,000 or more | 0 (0.0%) | 0 (0.0%) |
| Total | 986 (100.0%) | 1,424 (100.0%) |
Household Income by Mortgage Status in Red Chute
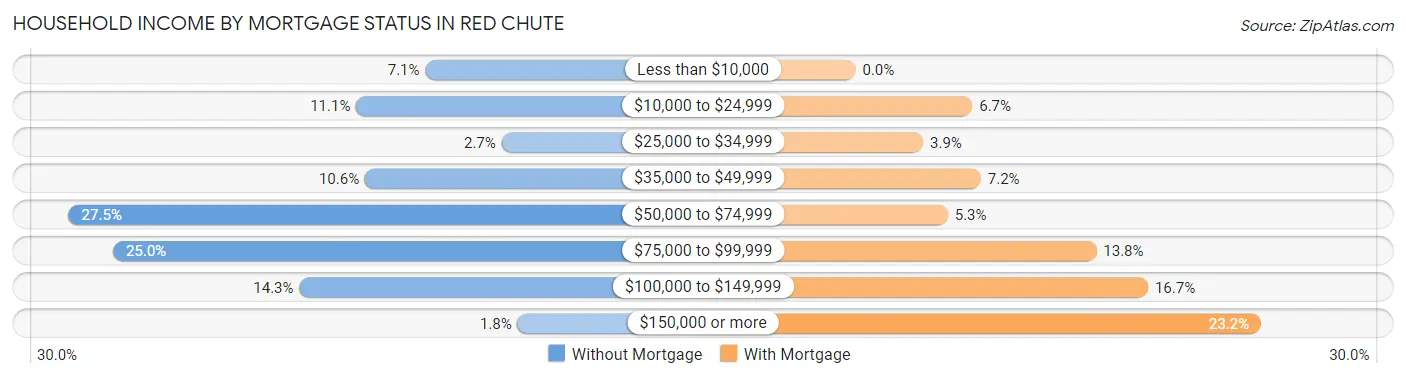
| Household Income | Without Mortgage | With Mortgage |
| Less than $10,000 | 70 (7.1%) | 0 (0.0%) |
| $10,000 to $24,999 | 109 (11.1%) | 95 (6.7%) |
| $25,000 to $34,999 | 27 (2.7%) | 55 (3.9%) |
| $35,000 to $49,999 | 104 (10.5%) | 102 (7.2%) |
| $50,000 to $74,999 | 271 (27.5%) | 75 (5.3%) |
| $75,000 to $99,999 | 246 (24.9%) | 196 (13.8%) |
| $100,000 to $149,999 | 141 (14.3%) | 238 (16.7%) |
| $150,000 or more | 18 (1.8%) | 330 (23.2%) |
| Total | 986 (100.0%) | 1,424 (100.0%) |
Property Value to Household Income Ratio in Red Chute
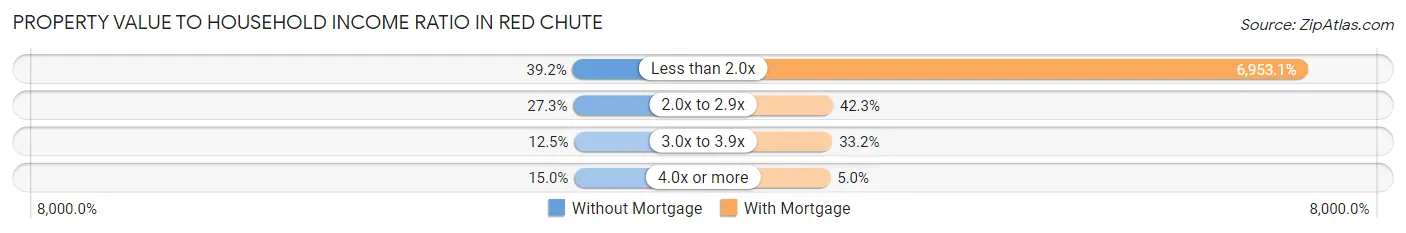
| Value-to-Income Ratio | Without Mortgage | With Mortgage |
| Less than 2.0x | 386 (39.2%) | 99,012 (6,953.1%) |
| 2.0x to 2.9x | 269 (27.3%) | 602 (42.3%) |
| 3.0x to 3.9x | 123 (12.5%) | 473 (33.2%) |
| 4.0x or more | 148 (15.0%) | 71 (5.0%) |
| Total | 986 (100.0%) | 1,424 (100.0%) |
Real Estate Taxes by Mortgage Status in Red Chute
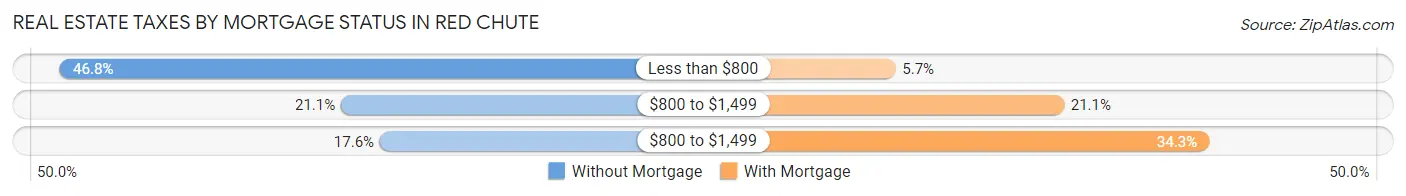
| Property Taxes | Without Mortgage | With Mortgage |
| Less than $800 | 461 (46.8%) | 81 (5.7%) |
| $800 to $1,499 | 208 (21.1%) | 300 (21.1%) |
| $800 to $1,499 | 173 (17.5%) | 489 (34.3%) |
| Total | 986 (100.0%) | 1,424 (100.0%) |
Health & Disability in Red Chute
Health Insurance Coverage by Age in Red Chute
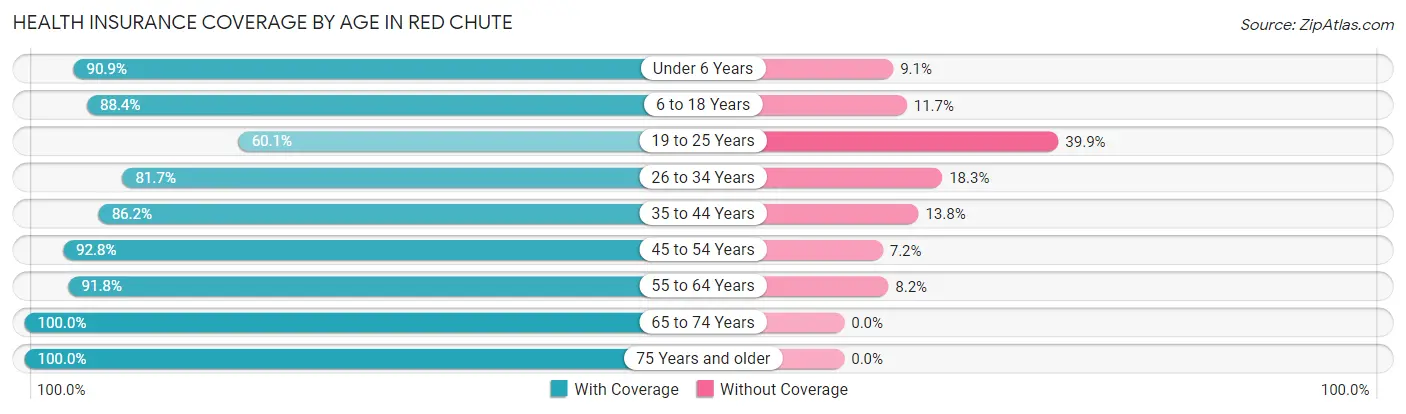
| Age Bracket | With Coverage | Without Coverage |
| Under 6 Years | 607 (90.9%) | 61 (9.1%) |
| 6 to 18 Years | 1,479 (88.3%) | 195 (11.7%) |
| 19 to 25 Years | 367 (60.1%) | 244 (39.9%) |
| 26 to 34 Years | 685 (81.7%) | 153 (18.3%) |
| 35 to 44 Years | 804 (86.2%) | 129 (13.8%) |
| 45 to 54 Years | 944 (92.8%) | 73 (7.2%) |
| 55 to 64 Years | 771 (91.8%) | 69 (8.2%) |
| 65 to 74 Years | 471 (100.0%) | 0 (0.0%) |
| 75 Years and older | 392 (100.0%) | 0 (0.0%) |
| Total | 6,520 (87.6%) | 924 (12.4%) |
Health Insurance Coverage by Citizenship Status in Red Chute
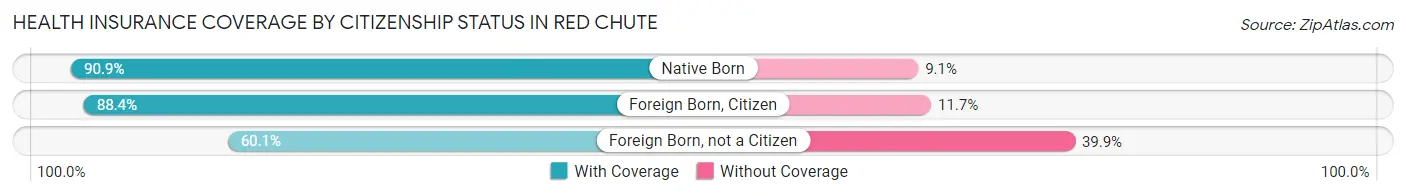
| Citizenship Status | With Coverage | Without Coverage |
| Native Born | 607 (90.9%) | 61 (9.1%) |
| Foreign Born, Citizen | 1,479 (88.3%) | 195 (11.7%) |
| Foreign Born, not a Citizen | 367 (60.1%) | 244 (39.9%) |
Health Insurance Coverage by Household Income in Red Chute
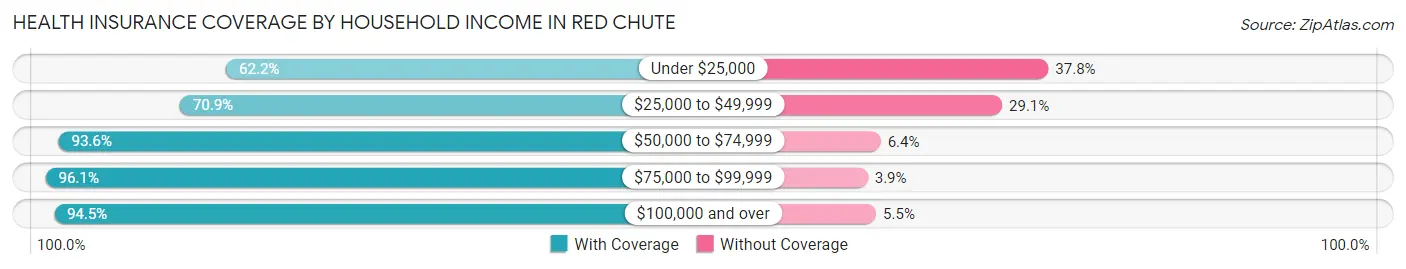
| Household Income | With Coverage | Without Coverage |
| Under $25,000 | 524 (62.2%) | 318 (37.8%) |
| $25,000 to $49,999 | 782 (70.9%) | 321 (29.1%) |
| $50,000 to $74,999 | 1,163 (93.6%) | 79 (6.4%) |
| $75,000 to $99,999 | 1,713 (96.1%) | 70 (3.9%) |
| $100,000 and over | 2,335 (94.5%) | 136 (5.5%) |
Public vs Private Health Insurance Coverage by Age in Red Chute
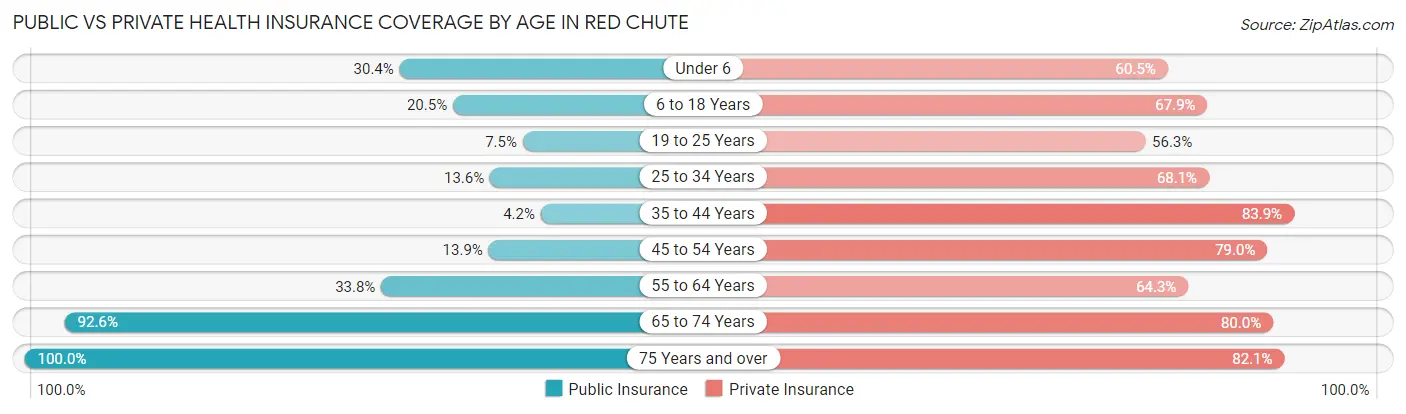
| Age Bracket | Public Insurance | Private Insurance |
| Under 6 | 203 (30.4%) | 404 (60.5%) |
| 6 to 18 Years | 343 (20.5%) | 1,136 (67.9%) |
| 19 to 25 Years | 46 (7.5%) | 344 (56.3%) |
| 25 to 34 Years | 114 (13.6%) | 571 (68.1%) |
| 35 to 44 Years | 39 (4.2%) | 783 (83.9%) |
| 45 to 54 Years | 141 (13.9%) | 803 (79.0%) |
| 55 to 64 Years | 284 (33.8%) | 540 (64.3%) |
| 65 to 74 Years | 436 (92.6%) | 377 (80.0%) |
| 75 Years and over | 392 (100.0%) | 322 (82.1%) |
| Total | 1,998 (26.8%) | 5,280 (70.9%) |
Disability Status by Sex by Age in Red Chute
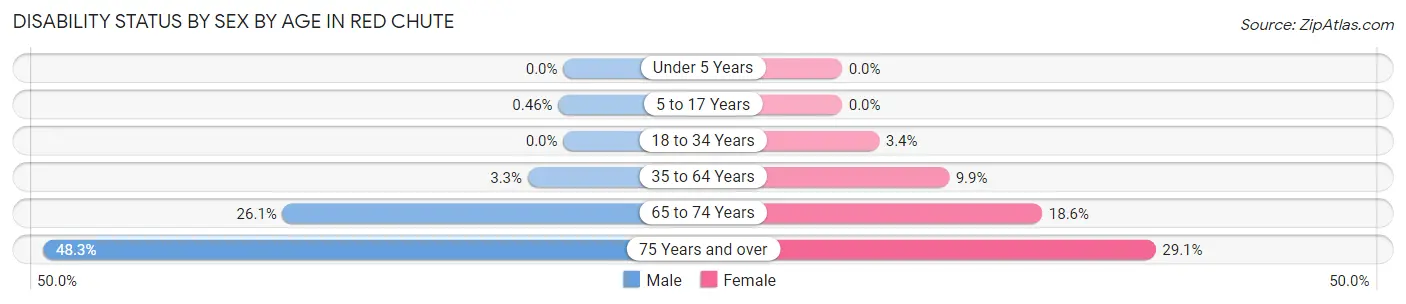
| Age Bracket | Male | Female |
| Under 5 Years | 0 (0.0%) | 0 (0.0%) |
| 5 to 17 Years | 4 (0.5%) | 0 (0.0%) |
| 18 to 34 Years | 0 (0.0%) | 33 (3.4%) |
| 35 to 64 Years | 42 (3.3%) | 150 (9.9%) |
| 65 to 74 Years | 68 (26.1%) | 39 (18.6%) |
| 75 Years and over | 98 (48.3%) | 55 (29.1%) |
Disability Class by Sex by Age in Red Chute
Disability Class: Hearing Difficulty
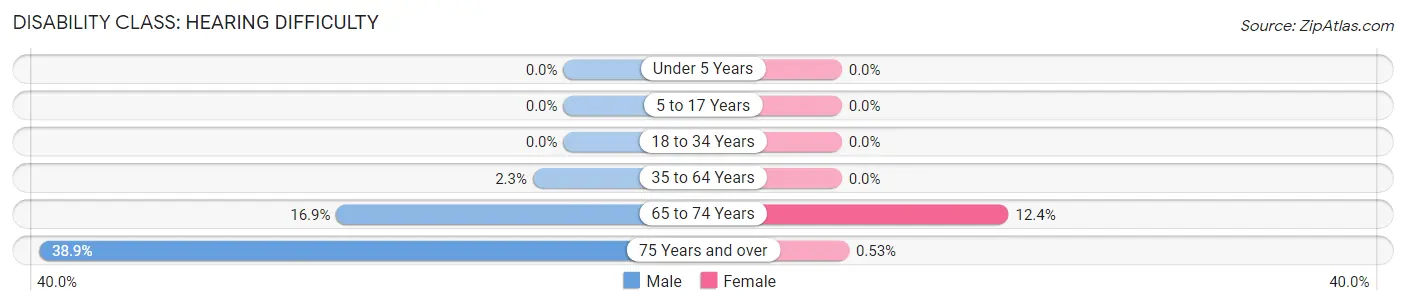
| Age Bracket | Male | Female |
| Under 5 Years | 0 (0.0%) | 0 (0.0%) |
| 5 to 17 Years | 0 (0.0%) | 0 (0.0%) |
| 18 to 34 Years | 0 (0.0%) | 0 (0.0%) |
| 35 to 64 Years | 29 (2.3%) | 0 (0.0%) |
| 65 to 74 Years | 44 (16.9%) | 26 (12.4%) |
| 75 Years and over | 79 (38.9%) | 1 (0.5%) |
Disability Class: Vision Difficulty
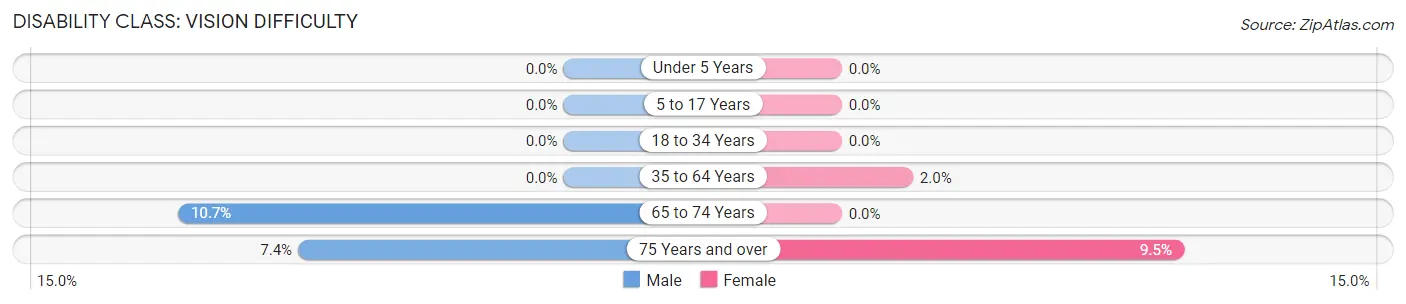
| Age Bracket | Male | Female |
| Under 5 Years | 0 (0.0%) | 0 (0.0%) |
| 5 to 17 Years | 0 (0.0%) | 0 (0.0%) |
| 18 to 34 Years | 0 (0.0%) | 0 (0.0%) |
| 35 to 64 Years | 0 (0.0%) | 30 (2.0%) |
| 65 to 74 Years | 28 (10.7%) | 0 (0.0%) |
| 75 Years and over | 15 (7.4%) | 18 (9.5%) |
Disability Class: Cognitive Difficulty
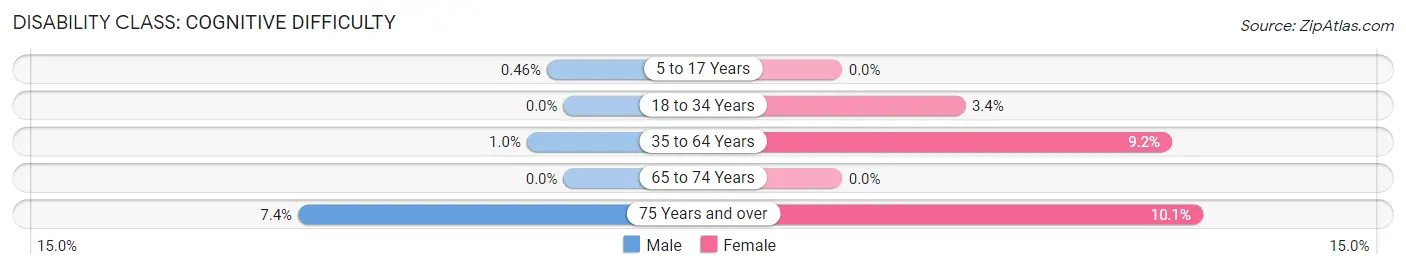
| Age Bracket | Male | Female |
| 5 to 17 Years | 4 (0.5%) | 0 (0.0%) |
| 18 to 34 Years | 0 (0.0%) | 33 (3.4%) |
| 35 to 64 Years | 13 (1.0%) | 139 (9.2%) |
| 65 to 74 Years | 0 (0.0%) | 0 (0.0%) |
| 75 Years and over | 15 (7.4%) | 19 (10.1%) |
Disability Class: Ambulatory Difficulty
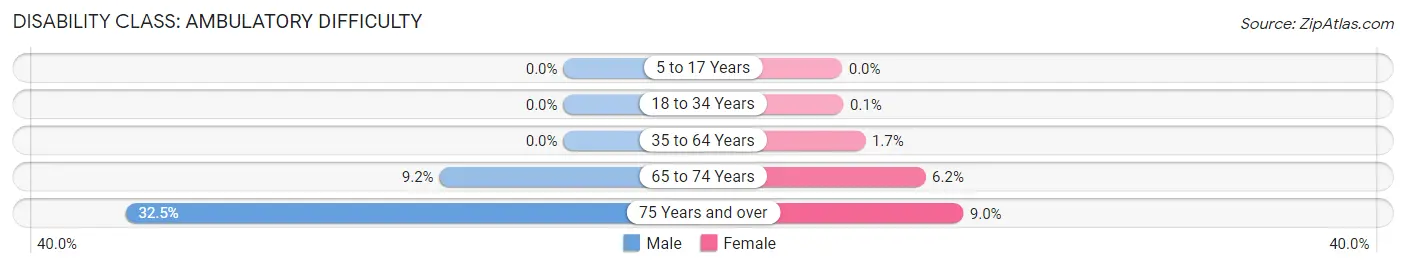
| Age Bracket | Male | Female |
| 5 to 17 Years | 0 (0.0%) | 0 (0.0%) |
| 18 to 34 Years | 0 (0.0%) | 1 (0.1%) |
| 35 to 64 Years | 0 (0.0%) | 26 (1.7%) |
| 65 to 74 Years | 24 (9.2%) | 13 (6.2%) |
| 75 Years and over | 66 (32.5%) | 17 (9.0%) |
Disability Class: Self-Care Difficulty
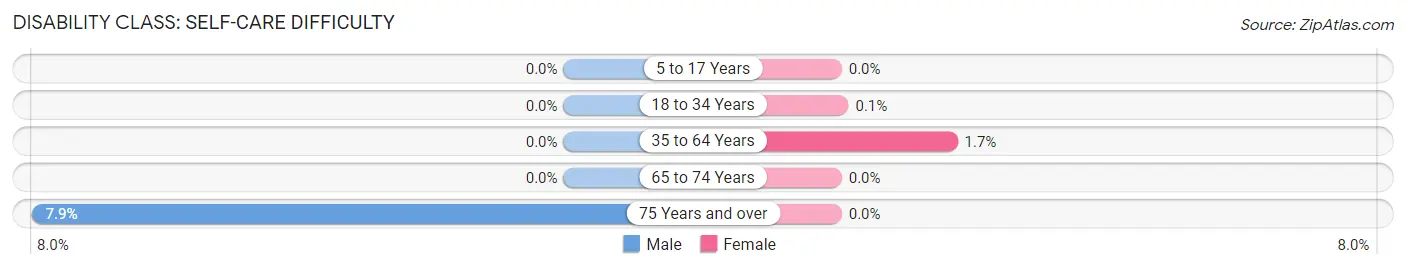
| Age Bracket | Male | Female |
| 5 to 17 Years | 0 (0.0%) | 0 (0.0%) |
| 18 to 34 Years | 0 (0.0%) | 1 (0.1%) |
| 35 to 64 Years | 0 (0.0%) | 26 (1.7%) |
| 65 to 74 Years | 0 (0.0%) | 0 (0.0%) |
| 75 Years and over | 16 (7.9%) | 0 (0.0%) |
Technology Access in Red Chute
Computing Device Access in Red Chute
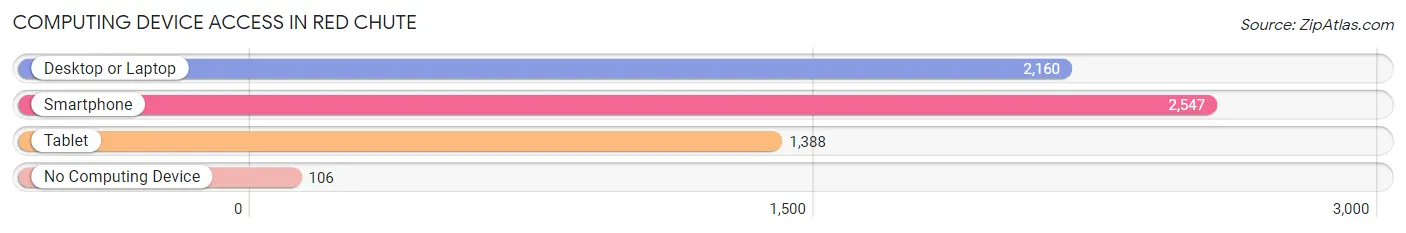
| Device Type | # Households | % Households |
| Desktop or Laptop | 2,160 | 78.4% |
| Smartphone | 2,547 | 92.4% |
| Tablet | 1,388 | 50.4% |
| No Computing Device | 106 | 3.8% |
| Total | 2,755 | 100.0% |
Internet Access in Red Chute
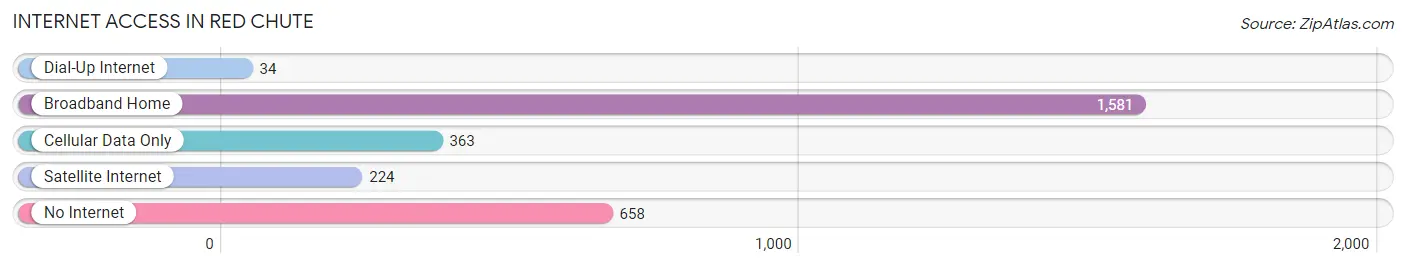
| Internet Type | # Households | % Households |
| Dial-Up Internet | 34 | 1.2% |
| Broadband Home | 1,581 | 57.4% |
| Cellular Data Only | 363 | 13.2% |
| Satellite Internet | 224 | 8.1% |
| No Internet | 658 | 23.9% |
| Total | 2,755 | 100.0% |
Red Chute Summary
Red Chute is a small unincorporated community located in Bossier Parish, Louisiana. It is situated on the banks of the Red Chute Bayou, a tributary of the Red River. The community is located approximately 10 miles south of the city of Shreveport and is part of the Shreveport-Bossier City Metropolitan Statistical Area.
History
The area that is now Red Chute was first settled in the early 1800s by a group of French-Canadian immigrants. The area was originally known as “La Chute Rouge”, which translates to “The Red Chute”. The name was derived from the red-colored clay that was found in the area. The community was officially established in 1845 and was incorporated in 1848.
In the late 1800s, the area was home to a large lumber industry. The lumber industry was responsible for the construction of many of the homes and businesses in the area. The lumber industry also provided employment for many of the residents of Red Chute.
In the early 1900s, the area was home to a large cotton industry. The cotton industry provided employment for many of the residents of Red Chute and was responsible for the construction of many of the homes and businesses in the area.
In the late 1900s, the area was home to a large oil and gas industry. The oil and gas industry provided employment for many of the residents of Red Chute and was responsible for the construction of many of the homes and businesses in the area.
Geography
Red Chute is located in Bossier Parish, Louisiana. It is situated on the banks of the Red Chute Bayou, a tributary of the Red River. The community is located approximately 10 miles south of the city of Shreveport and is part of the Shreveport-Bossier City Metropolitan Statistical Area.
The area is characterized by flat terrain with some rolling hills. The climate is humid subtropical with hot summers and mild winters. The average annual temperature is around 70 degrees Fahrenheit.
Economy
The economy of Red Chute is largely based on the oil and gas industry. The area is home to several oil and gas companies, including Chevron, ExxonMobil, and Shell. The oil and gas industry provides employment for many of the residents of Red Chute.
In addition to the oil and gas industry, the area is also home to a large agricultural industry. The agricultural industry is responsible for the production of cotton, soybeans, corn, and other crops. The agricultural industry provides employment for many of the residents of Red Chute.
Demographics
As of the 2010 census, the population of Red Chute was 1,845. The racial makeup of the community was 79.3% White, 17.2% African American, 0.7% Native American, 0.3% Asian, 0.1% Pacific Islander, and 2.4% from other races. The median household income was $37,917.
Red Chute is home to a large number of churches, including Baptist, Methodist, and Catholic. The community is also home to a number of schools, including Red Chute Elementary School, Red Chute Middle School, and Red Chute High School.
Conclusion
Red Chute is a small unincorporated community located in Bossier Parish, Louisiana. It is situated on the banks of the Red Chute Bayou, a tributary of the Red River. The community is located approximately 10 miles south of the city of Shreveport and is part of the Shreveport-Bossier City Metropolitan Statistical Area. The economy of Red Chute is largely based on the oil and gas industry and the agricultural industry. As of the 2010 census, the population of Red Chute was 1,845. The racial makeup of the community was 79.3% White, 17.2% African American, 0.7% Native American, 0.3% Asian, 0.1% Pacific Islander, and 2.4% from other races. The median household income was $37,917. Red Chute is home to a large number of churches and schools.
Common Questions
What is Per Capita Income in Red Chute?
Per Capita income in Red Chute is $30,289.
What is the Median Family Income in Red Chute?
Median Family Income in Red Chute is $94,848.
What is the Median Household income in Red Chute?
Median Household Income in Red Chute is $76,520.
What is Income or Wage Gap in Red Chute?
Income or Wage Gap in Red Chute is 58.8%.
Women in Red Chute earn 41.2 cents for every dollar earned by a man.
What is Inequality or Gini Index in Red Chute?
Inequality or Gini Index in Red Chute is 0.37.
What is the Total Population of Red Chute?
Total Population of Red Chute is 7,577.
What is the Total Male Population of Red Chute?
Total Male Population of Red Chute is 3,638.
What is the Total Female Population of Red Chute?
Total Female Population of Red Chute is 3,939.
What is the Ratio of Males per 100 Females in Red Chute?
There are 92.36 Males per 100 Females in Red Chute.
What is the Ratio of Females per 100 Males in Red Chute?
There are 108.27 Females per 100 Males in Red Chute.
What is the Median Population Age in Red Chute?
Median Population Age in Red Chute is 34.6 Years.
What is the Average Family Size in Red Chute
Average Family Size in Red Chute is 3.4 People.
What is the Average Household Size in Red Chute
Average Household Size in Red Chute is 2.8 People.
How Large is the Labor Force in Red Chute?
There are 3,566 People in the Labor Forcein in Red Chute.
What is the Percentage of People in the Labor Force in Red Chute?
63.7% of People are in the Labor Force in Red Chute.
What is the Unemployment Rate in Red Chute?
Unemployment Rate in Red Chute is 6.2%.