Raceland, LA Map & Demographics
Raceland Map
Raceland Overview
$27,487
PER CAPITA INCOME
$67,500
AVG FAMILY INCOME
$47,371
AVG HOUSEHOLD INCOME
52.9%
WAGE / INCOME GAP [ % ]
47.1¢/ $1
WAGE / INCOME GAP [ $ ]
0.45
INEQUALITY / GINI INDEX
11,094
TOTAL POPULATION
5,455
MALE POPULATION
5,639
FEMALE POPULATION
96.74
MALES / 100 FEMALES
103.37
FEMALES / 100 MALES
44.5
MEDIAN AGE
3.1
AVG FAMILY SIZE
2.6
AVG HOUSEHOLD SIZE
4,843
LABOR FORCE [ PEOPLE ]
53.8%
PERCENT IN LABOR FORCE
10.6%
UNEMPLOYMENT RATE
Raceland Zip Codes
Raceland Area Codes
Income in Raceland
Income Overview in Raceland
Per Capita Income in Raceland is $27,487, while median incomes of families and households are $67,500 and $47,371 respectively.
| Characteristic | Number | Measure |
| Per Capita Income | 11,094 | $27,487 |
| Median Family Income | 2,906 | $67,500 |
| Mean Family Income | 2,906 | $80,006 |
| Median Household Income | 4,280 | $47,371 |
| Mean Household Income | 4,280 | $67,681 |
| Income Deficit | 2,906 | $0 |
| Wage / Income Gap (%) | 11,094 | 52.88% |
| Wage / Income Gap ($) | 11,094 | 47.12¢ per $1 |
| Gini / Inequality Index | 11,094 | 0.45 |
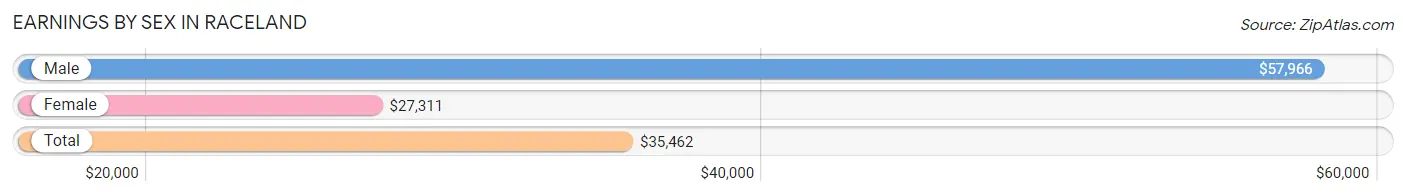
Earnings by Sex in Raceland
Average Earnings in Raceland are $35,462, $57,966 for men and $27,311 for women, a difference of 52.9%.
| Sex | Number | Average Earnings |
| Male | 2,245 (46.7%) | $57,966 |
| Female | 2,563 (53.3%) | $27,311 |
| Total | 4,808 (100.0%) | $35,462 |
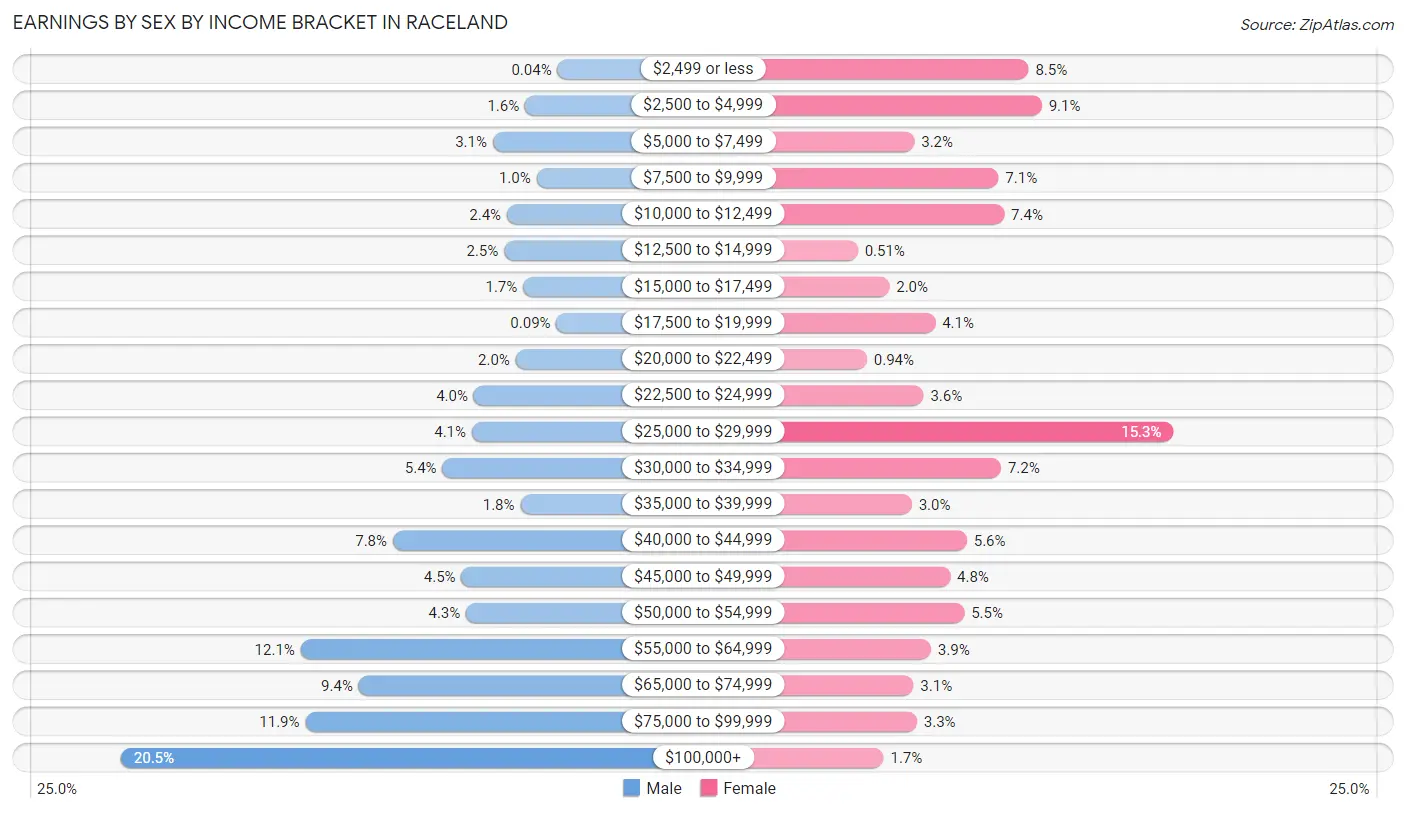
Earnings by Sex by Income Bracket in Raceland
The most common earnings brackets in Raceland are $100,000+ for men (460 | 20.5%) and $25,000 to $29,999 for women (392 | 15.3%).
| Income | Male | Female |
| $2,499 or less | 1 (0.0%) | 218 (8.5%) |
| $2,500 to $4,999 | 35 (1.6%) | 234 (9.1%) |
| $5,000 to $7,499 | 69 (3.1%) | 81 (3.2%) |
| $7,500 to $9,999 | 23 (1.0%) | 182 (7.1%) |
| $10,000 to $12,499 | 54 (2.4%) | 189 (7.4%) |
| $12,500 to $14,999 | 57 (2.5%) | 13 (0.5%) |
| $15,000 to $17,499 | 37 (1.7%) | 51 (2.0%) |
| $17,500 to $19,999 | 2 (0.1%) | 106 (4.1%) |
| $20,000 to $22,499 | 45 (2.0%) | 24 (0.9%) |
| $22,500 to $24,999 | 89 (4.0%) | 92 (3.6%) |
| $25,000 to $29,999 | 91 (4.1%) | 392 (15.3%) |
| $30,000 to $34,999 | 122 (5.4%) | 185 (7.2%) |
| $35,000 to $39,999 | 40 (1.8%) | 78 (3.0%) |
| $40,000 to $44,999 | 174 (7.7%) | 144 (5.6%) |
| $45,000 to $49,999 | 102 (4.5%) | 124 (4.8%) |
| $50,000 to $54,999 | 97 (4.3%) | 141 (5.5%) |
| $55,000 to $64,999 | 271 (12.1%) | 101 (3.9%) |
| $65,000 to $74,999 | 210 (9.3%) | 80 (3.1%) |
| $75,000 to $99,999 | 266 (11.8%) | 84 (3.3%) |
| $100,000+ | 460 (20.5%) | 44 (1.7%) |
| Total | 2,245 (100.0%) | 2,563 (100.0%) |
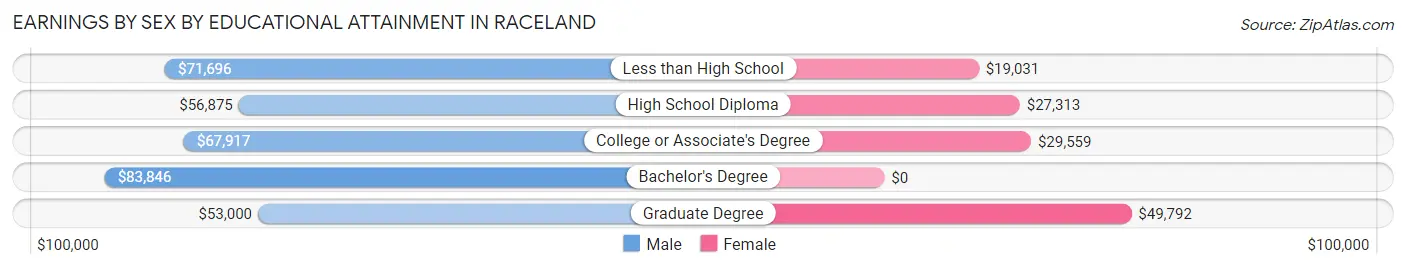
Earnings by Sex by Educational Attainment in Raceland
Average earnings in Raceland are $60,804 for men and $28,281 for women, a difference of 53.5%. Men with an educational attainment of bachelor's degree enjoy the highest average annual earnings of $83,846, while those with graduate degree education earn the least with $53,000. Women with an educational attainment of graduate degree earn the most with the average annual earnings of $49,792, while those with less than high school education have the smallest earnings of $19,031.
| Educational Attainment | Male Income | Female Income |
| Less than High School | $71,696 | $19,031 |
| High School Diploma | $56,875 | $27,313 |
| College or Associate's Degree | $67,917 | $29,559 |
| Bachelor's Degree | $83,846 | $0 |
| Graduate Degree | $53,000 | $49,792 |
| Total | $60,804 | $28,281 |
Family Income in Raceland
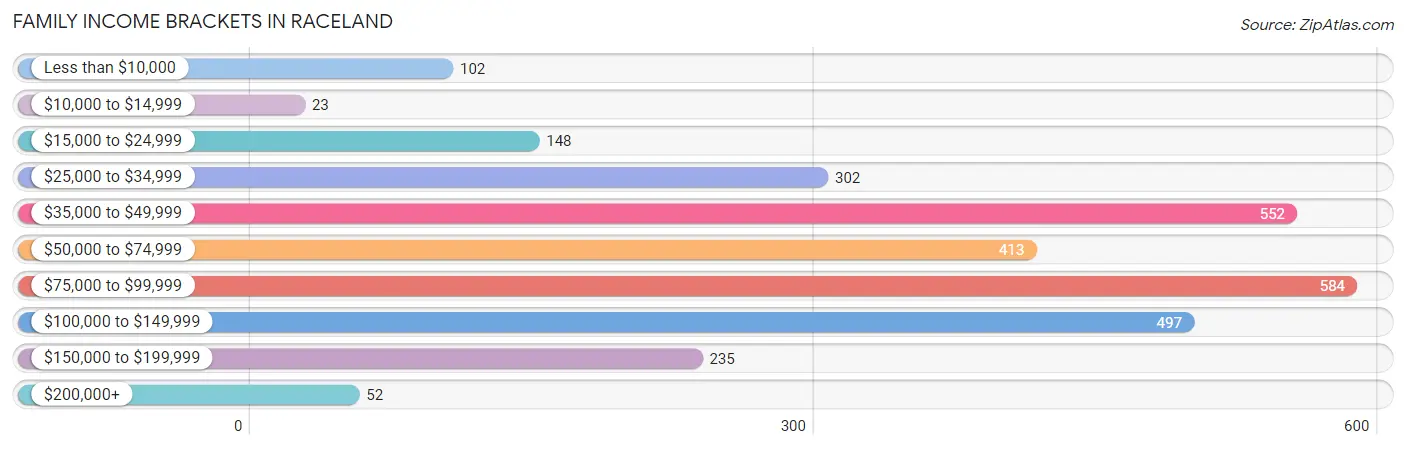
Family Income Brackets in Raceland
According to the Raceland family income data, there are 584 families falling into the $75,000 to $99,999 income range, which is the most common income bracket and makes up 20.1% of all families. Conversely, the $10,000 to $14,999 income bracket is the least frequent group with only 23 families (0.8%) belonging to this category.
| Income Bracket | # Families | % Families |
| Less than $10,000 | 102 | 3.5% |
| $10,000 to $14,999 | 23 | 0.8% |
| $15,000 to $24,999 | 148 | 5.1% |
| $25,000 to $34,999 | 302 | 10.4% |
| $35,000 to $49,999 | 552 | 19.0% |
| $50,000 to $74,999 | 413 | 14.2% |
| $75,000 to $99,999 | 584 | 20.1% |
| $100,000 to $149,999 | 497 | 17.1% |
| $150,000 to $199,999 | 235 | 8.1% |
| $200,000+ | 52 | 1.8% |
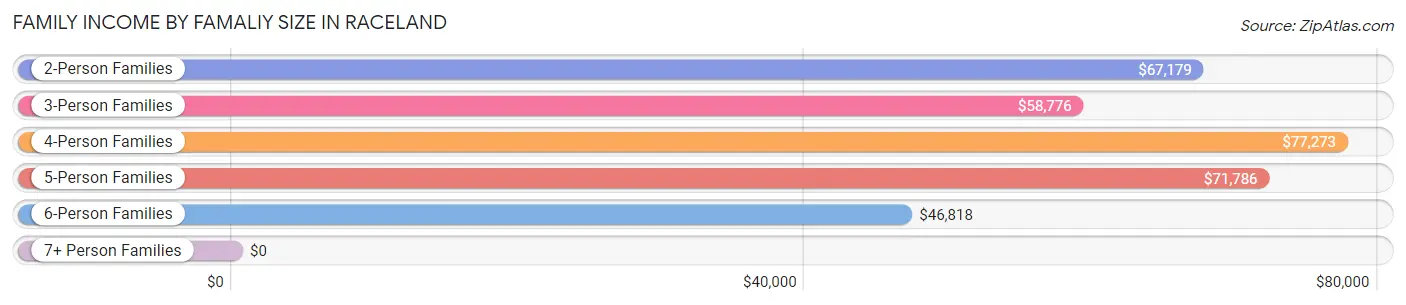
Family Income by Famaliy Size in Raceland
4-person families (682 | 23.5%) account for the highest median family income in Raceland with $77,273 per family, while 2-person families (1,454 | 50.0%) have the highest median income of $33,590 per family member.
| Income Bracket | # Families | Median Income |
| 2-Person Families | 1,454 (50.0%) | $67,179 |
| 3-Person Families | 550 (18.9%) | $58,776 |
| 4-Person Families | 682 (23.5%) | $77,273 |
| 5-Person Families | 190 (6.5%) | $71,786 |
| 6-Person Families | 16 (0.5%) | $46,818 |
| 7+ Person Families | 14 (0.5%) | $0 |
| Total | 2,906 (100.0%) | $67,500 |
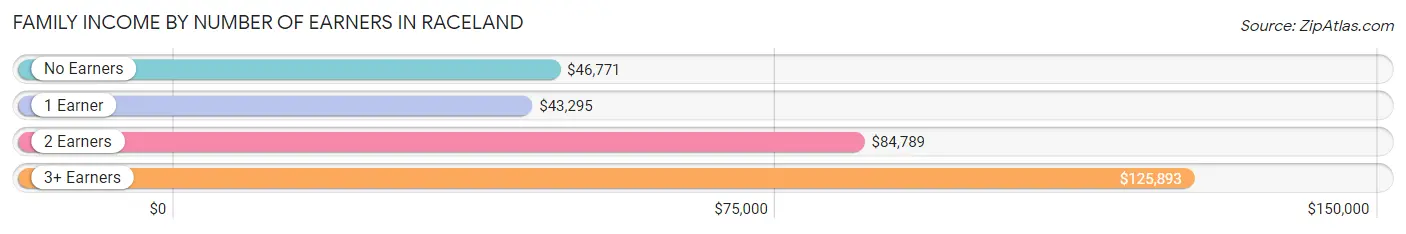
Family Income by Number of Earners in Raceland
The median family income in Raceland is $67,500, with families comprising 3+ earners (100) having the highest median family income of $125,893, while families with 1 earner (1,319) have the lowest median family income of $43,295, accounting for 3.4% and 45.4% of families, respectively.
| Number of Earners | # Families | Median Income |
| No Earners | 377 (13.0%) | $46,771 |
| 1 Earner | 1,319 (45.4%) | $43,295 |
| 2 Earners | 1,110 (38.2%) | $84,789 |
| 3+ Earners | 100 (3.4%) | $125,893 |
| Total | 2,906 (100.0%) | $67,500 |
Household Income in Raceland
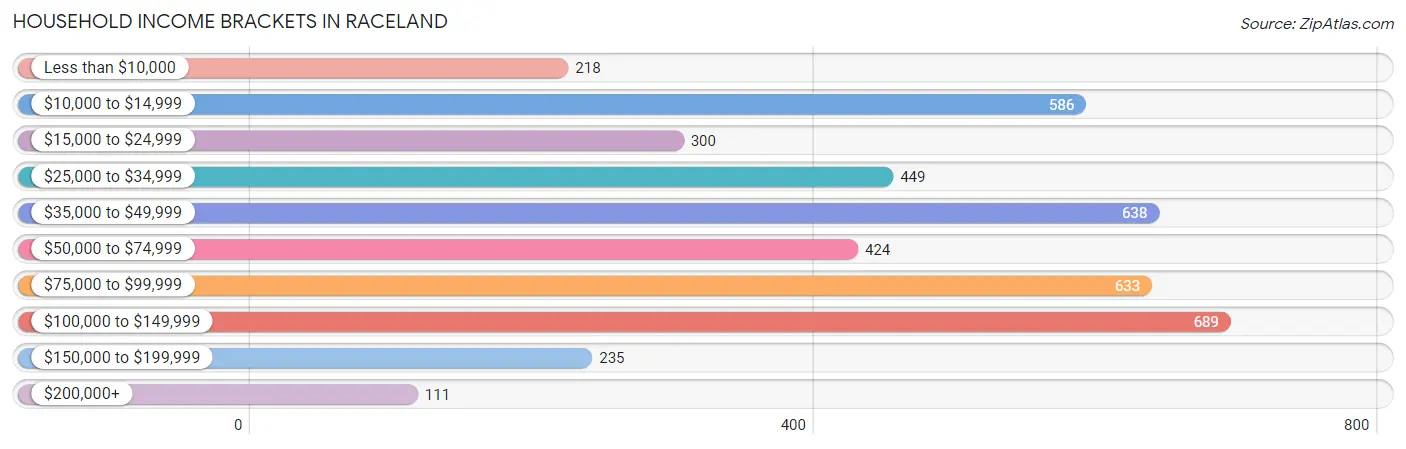
Household Income Brackets in Raceland
With 689 households falling in the category, the $100,000 to $149,999 income range is the most frequent in Raceland, accounting for 16.1% of all households. In contrast, only 111 households (2.6%) fall into the $200,000+ income bracket, making it the least populous group.
| Income Bracket | # Households | % Households |
| Less than $10,000 | 218 | 5.1% |
| $10,000 to $14,999 | 586 | 13.7% |
| $15,000 to $24,999 | 300 | 7.0% |
| $25,000 to $34,999 | 449 | 10.5% |
| $35,000 to $49,999 | 638 | 14.9% |
| $50,000 to $74,999 | 424 | 9.9% |
| $75,000 to $99,999 | 633 | 14.8% |
| $100,000 to $149,999 | 689 | 16.1% |
| $150,000 to $199,999 | 235 | 5.5% |
| $200,000+ | 111 | 2.6% |
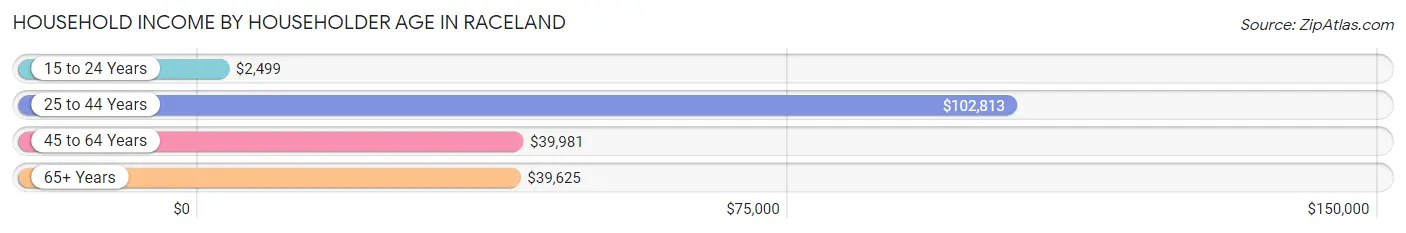
Household Income by Householder Age in Raceland
The median household income in Raceland is $47,371, with the highest median household income of $102,813 found in the 25 to 44 years age bracket for the primary householder. A total of 1,157 households (27.0%) fall into this category. Meanwhile, the 15 to 24 years age bracket for the primary householder has the lowest median household income of $2,499, with 78 households (1.8%) in this group.
| Income Bracket | # Households | Median Income |
| 15 to 24 Years | 78 (1.8%) | $2,499 |
| 25 to 44 Years | 1,157 (27.0%) | $102,813 |
| 45 to 64 Years | 1,972 (46.1%) | $39,981 |
| 65+ Years | 1,073 (25.1%) | $39,625 |
| Total | 4,280 (100.0%) | $47,371 |
Poverty in Raceland
Income Below Poverty by Sex and Age in Raceland
With 14.6% poverty level for males and 19.9% for females among the residents of Raceland, 18 to 24 year old males and under 5 year old females are the most vulnerable to poverty, with 86 males (40.6%) and 202 females (74.5%) in their respective age groups living below the poverty level.
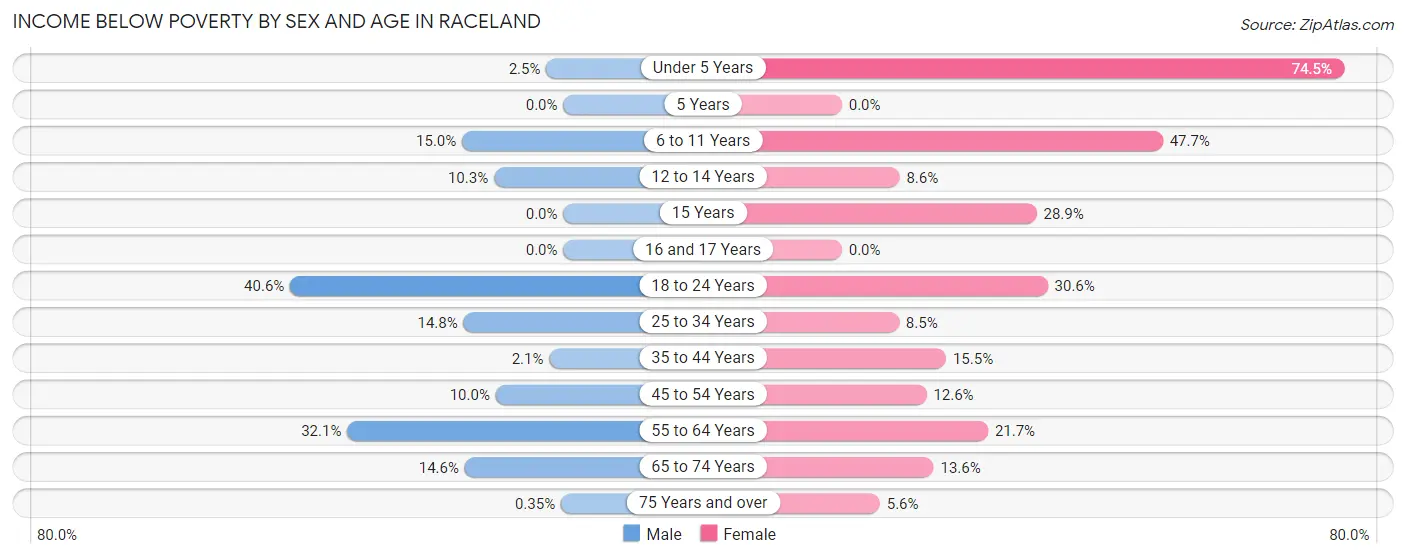
| Age Bracket | Male | Female |
| Under 5 Years | 8 (2.5%) | 202 (74.5%) |
| 5 Years | 0 (0.0%) | 0 (0.0%) |
| 6 to 11 Years | 46 (15.0%) | 162 (47.6%) |
| 12 to 14 Years | 31 (10.3%) | 15 (8.6%) |
| 15 Years | 0 (0.0%) | 24 (28.9%) |
| 16 and 17 Years | 0 (0.0%) | 0 (0.0%) |
| 18 to 24 Years | 86 (40.6%) | 136 (30.6%) |
| 25 to 34 Years | 75 (14.8%) | 44 (8.5%) |
| 35 to 44 Years | 14 (2.1%) | 134 (15.5%) |
| 45 to 54 Years | 82 (10.0%) | 105 (12.6%) |
| 55 to 64 Years | 386 (32.1%) | 199 (21.7%) |
| 65 to 74 Years | 65 (14.6%) | 65 (13.6%) |
| 75 Years and over | 1 (0.4%) | 25 (5.6%) |
| Total | 794 (14.6%) | 1,111 (19.9%) |
Income Above Poverty by Sex and Age in Raceland
According to the poverty statistics in Raceland, males aged 5 years and females aged 5 years are the age groups that are most secure financially, with 100.0% of males and 100.0% of females in these age groups living above the poverty line.
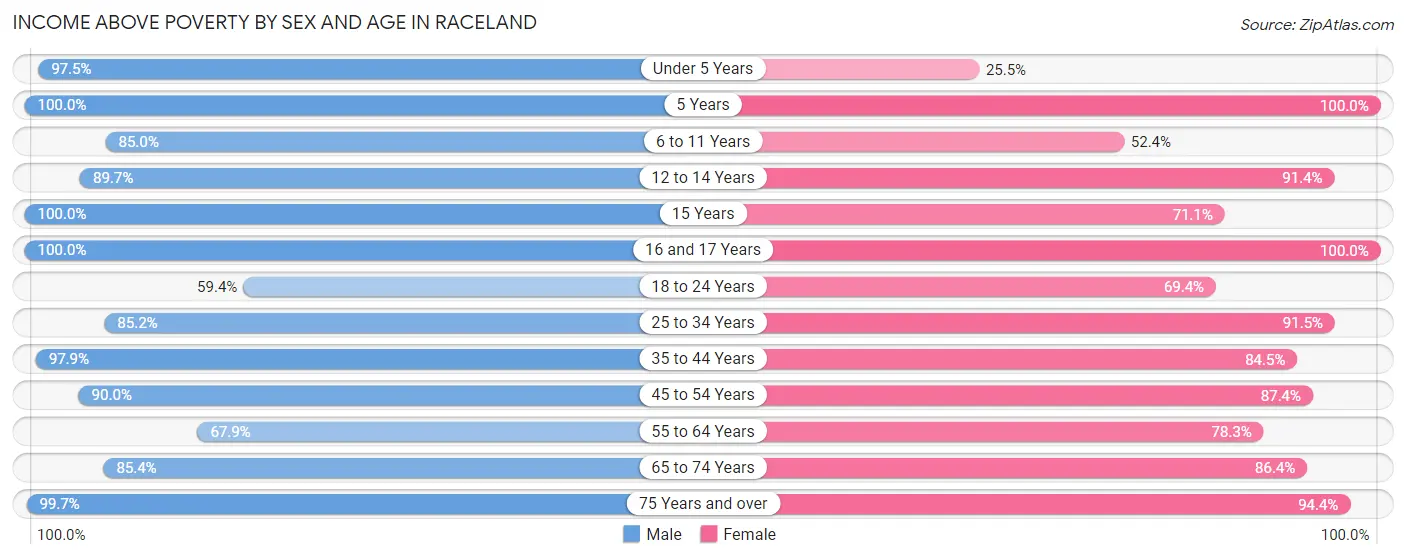
| Age Bracket | Male | Female |
| Under 5 Years | 308 (97.5%) | 69 (25.5%) |
| 5 Years | 55 (100.0%) | 77 (100.0%) |
| 6 to 11 Years | 260 (85.0%) | 178 (52.3%) |
| 12 to 14 Years | 270 (89.7%) | 160 (91.4%) |
| 15 Years | 168 (100.0%) | 59 (71.1%) |
| 16 and 17 Years | 154 (100.0%) | 147 (100.0%) |
| 18 to 24 Years | 126 (59.4%) | 309 (69.4%) |
| 25 to 34 Years | 431 (85.2%) | 475 (91.5%) |
| 35 to 44 Years | 657 (97.9%) | 732 (84.5%) |
| 45 to 54 Years | 735 (90.0%) | 730 (87.4%) |
| 55 to 64 Years | 817 (67.9%) | 718 (78.3%) |
| 65 to 74 Years | 379 (85.4%) | 412 (86.4%) |
| 75 Years and over | 283 (99.7%) | 418 (94.4%) |
| Total | 4,643 (85.4%) | 4,484 (80.1%) |
Income Below Poverty Among Married-Couple Families in Raceland
The poverty statistics for married-couple families in Raceland show that 4.2% or 87 of the total 2,073 families live below the poverty line. Families with 1 or 2 children have the highest poverty rate of 8.7%, comprising of 56 families. On the other hand, families with 3 or 4 children have the lowest poverty rate of 0.0%, which includes 0 families.
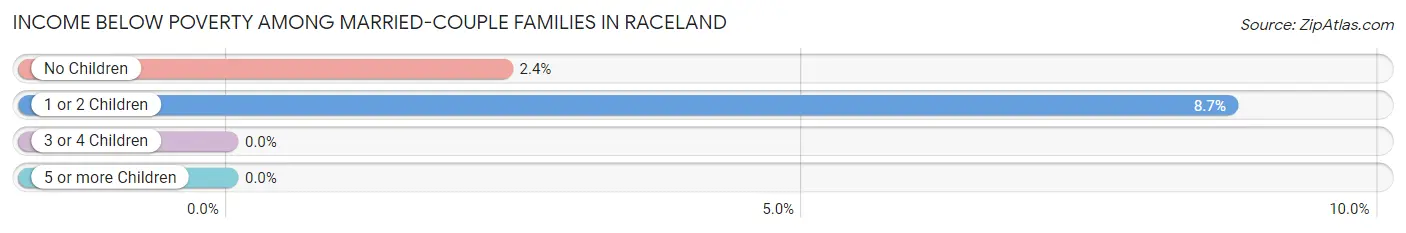
| Children | Above Poverty | Below Poverty |
| No Children | 1,265 (97.6%) | 31 (2.4%) |
| 1 or 2 Children | 588 (91.3%) | 56 (8.7%) |
| 3 or 4 Children | 133 (100.0%) | 0 (0.0%) |
| 5 or more Children | 0 (0.0%) | 0 (0.0%) |
| Total | 1,986 (95.8%) | 87 (4.2%) |
Income Below Poverty Among Single-Parent Households in Raceland
According to the poverty data in Raceland, 4.4% or 10 single-father households and 24.5% or 149 single-mother households are living below the poverty line. Among single-father households, those with 1 or 2 children have the highest poverty rate, with 10 households (7.0%) experiencing poverty. Likewise, among single-mother households, those with 3 or 4 children have the highest poverty rate, with 48 households (100.0%) falling below the poverty line.
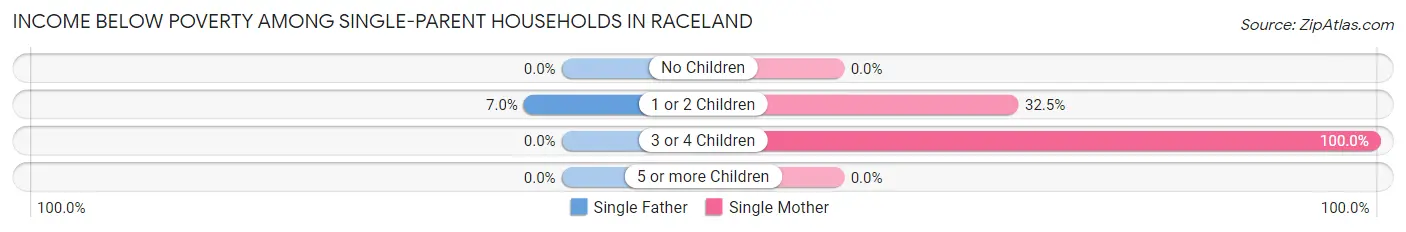
| Children | Single Father | Single Mother |
| No Children | 0 (0.0%) | 0 (0.0%) |
| 1 or 2 Children | 10 (7.0%) | 101 (32.5%) |
| 3 or 4 Children | 0 (0.0%) | 48 (100.0%) |
| 5 or more Children | 0 (0.0%) | 0 (0.0%) |
| Total | 10 (4.4%) | 149 (24.5%) |
Income Below Poverty Among Married-Couple vs Single-Parent Households in Raceland
The poverty data for Raceland shows that 87 of the married-couple family households (4.2%) and 159 of the single-parent households (19.1%) are living below the poverty level. Within the married-couple family households, those with 1 or 2 children have the highest poverty rate, with 56 households (8.7%) falling below the poverty line. Among the single-parent households, those with 3 or 4 children have the highest poverty rate, with 48 household (100.0%) living below poverty.
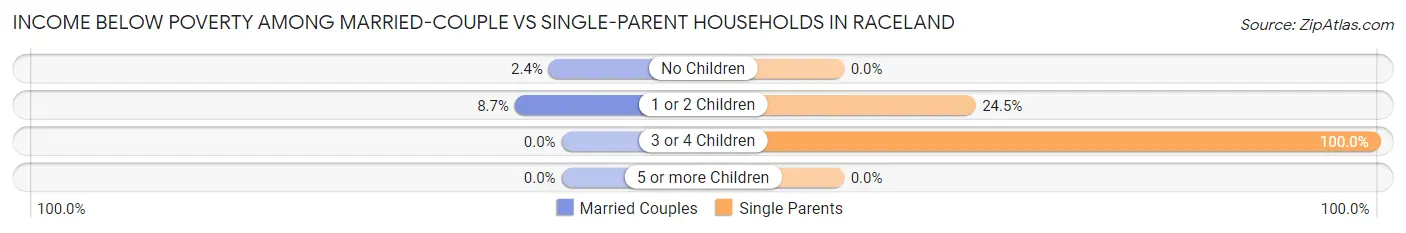
| Children | Married-Couple Families | Single-Parent Households |
| No Children | 31 (2.4%) | 0 (0.0%) |
| 1 or 2 Children | 56 (8.7%) | 111 (24.5%) |
| 3 or 4 Children | 0 (0.0%) | 48 (100.0%) |
| 5 or more Children | 0 (0.0%) | 0 (0.0%) |
| Total | 87 (4.2%) | 159 (19.1%) |
Race in Raceland
The most populous races in Raceland are White / Caucasian (7,600 | 68.5%), Black / African American (3,067 | 27.7%), and Two or more Races (207 | 1.9%).
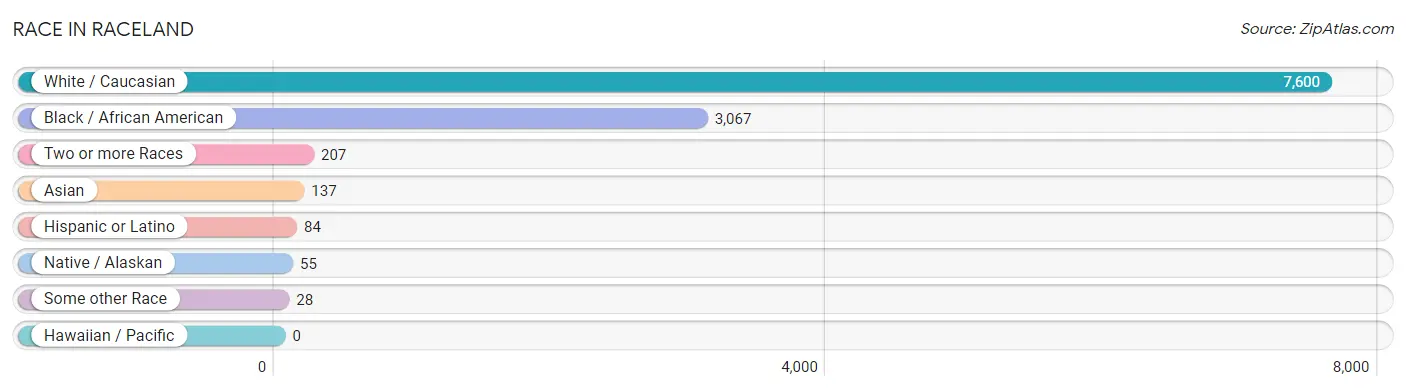
| Race | # Population | % Population |
| Asian | 137 | 1.2% |
| Black / African American | 3,067 | 27.7% |
| Hawaiian / Pacific | 0 | 0.0% |
| Hispanic or Latino | 84 | 0.8% |
| Native / Alaskan | 55 | 0.5% |
| White / Caucasian | 7,600 | 68.5% |
| Two or more Races | 207 | 1.9% |
| Some other Race | 28 | 0.3% |
| Total | 11,094 | 100.0% |
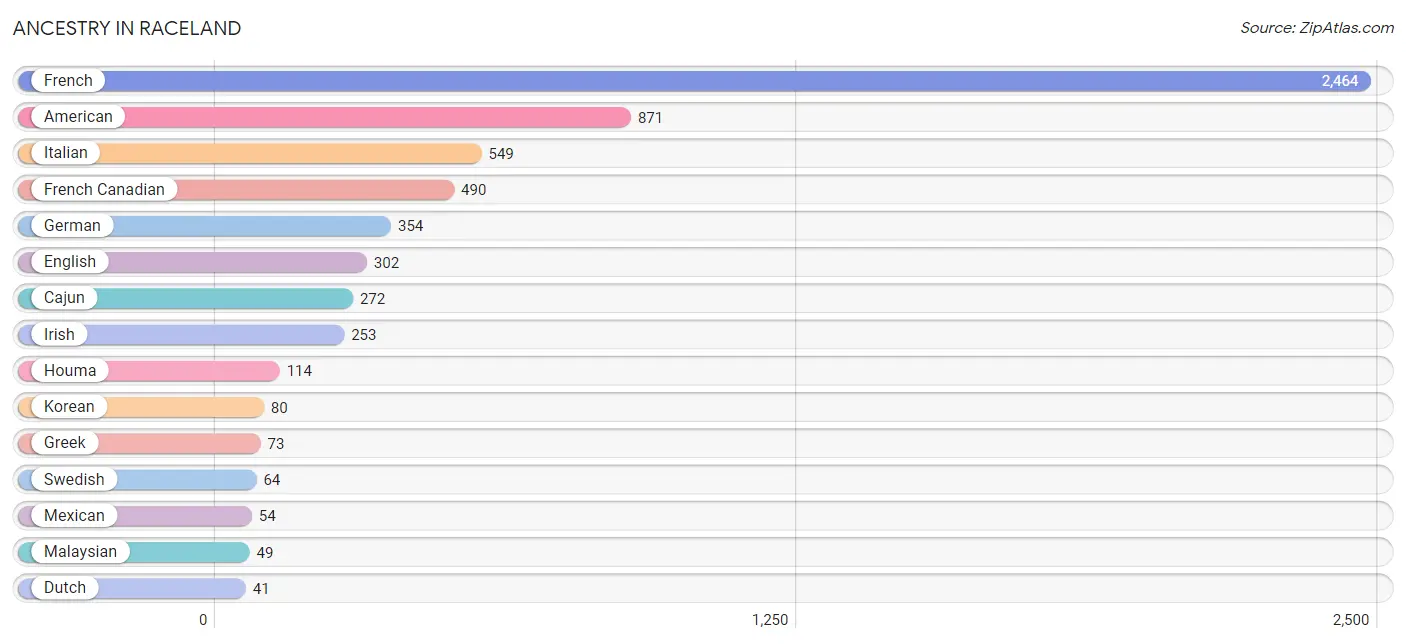
Ancestry in Raceland
The most populous ancestries reported in Raceland are French (2,464 | 22.2%), American (871 | 7.9%), Italian (549 | 5.0%), French Canadian (490 | 4.4%), and German (354 | 3.2%), together accounting for 42.6% of all Raceland residents.
| Ancestry | # Population | % Population |
| African | 37 | 0.3% |
| American | 871 | 7.9% |
| Bhutanese | 26 | 0.2% |
| Burmese | 19 | 0.2% |
| Cajun | 272 | 2.5% |
| Canadian | 12 | 0.1% |
| Dutch | 41 | 0.4% |
| Ecuadorian | 1 | 0.0% |
| English | 302 | 2.7% |
| European | 12 | 0.1% |
| French | 2,464 | 22.2% |
| French Canadian | 490 | 4.4% |
| German | 354 | 3.2% |
| Greek | 73 | 0.7% |
| Houma | 114 | 1.0% |
| Irish | 253 | 2.3% |
| Italian | 549 | 5.0% |
| Korean | 80 | 0.7% |
| Luxembourger | 4 | 0.0% |
| Malaysian | 49 | 0.4% |
| Mexican | 54 | 0.5% |
| Polish | 12 | 0.1% |
| Scottish | 39 | 0.4% |
| South American | 1 | 0.0% |
| Spaniard | 29 | 0.3% |
| Spanish American Indian | 16 | 0.1% |
| Subsaharan African | 37 | 0.3% |
| Swedish | 64 | 0.6% |
| Welsh | 14 | 0.1% | View All 29 Rows |
Immigrants in Raceland
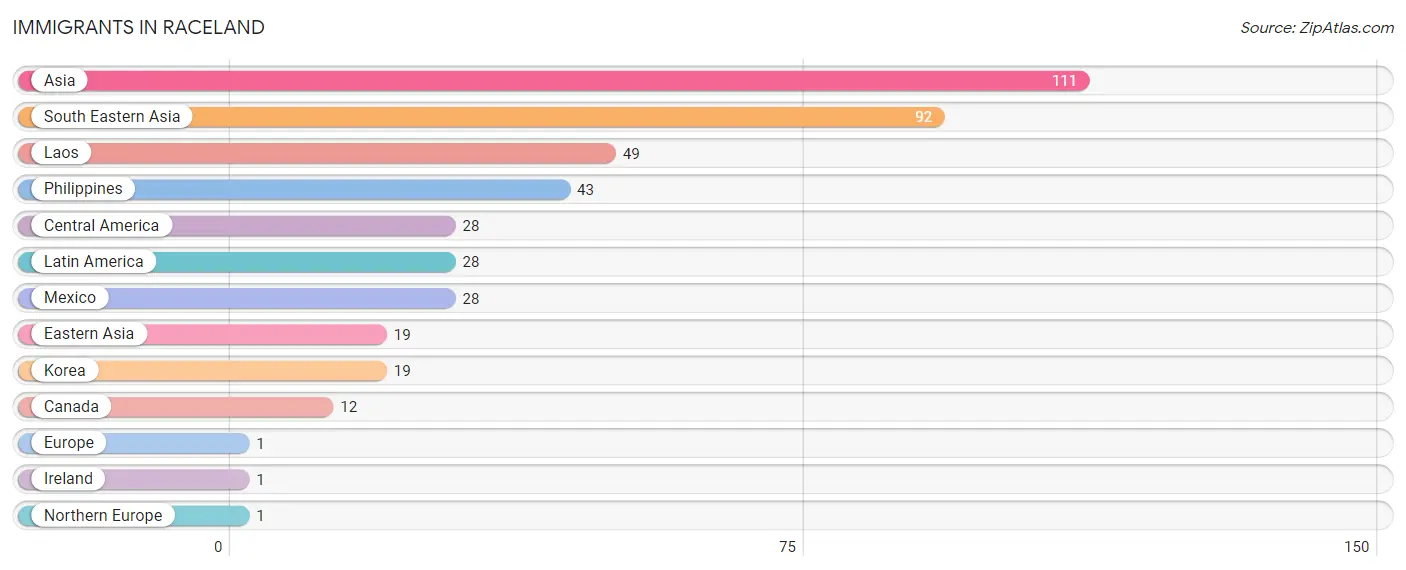
The most numerous immigrant groups reported in Raceland came from Asia (111 | 1.0%), South Eastern Asia (92 | 0.8%), Laos (49 | 0.4%), Philippines (43 | 0.4%), and Central America (28 | 0.3%), together accounting for 2.9% of all Raceland residents.
| Immigration Origin | # Population | % Population |
| Asia | 111 | 1.0% |
| Canada | 12 | 0.1% |
| Central America | 28 | 0.3% |
| Eastern Asia | 19 | 0.2% |
| Europe | 1 | 0.0% |
| Ireland | 1 | 0.0% |
| Korea | 19 | 0.2% |
| Laos | 49 | 0.4% |
| Latin America | 28 | 0.3% |
| Mexico | 28 | 0.3% |
| Northern Europe | 1 | 0.0% |
| Philippines | 43 | 0.4% |
| South Eastern Asia | 92 | 0.8% | View All 13 Rows |
Sex and Age in Raceland
Sex and Age in Raceland
The most populous age groups in Raceland are 60 to 64 Years (636 | 11.7%) for men and 50 to 54 Years (478 | 8.5%) for women.
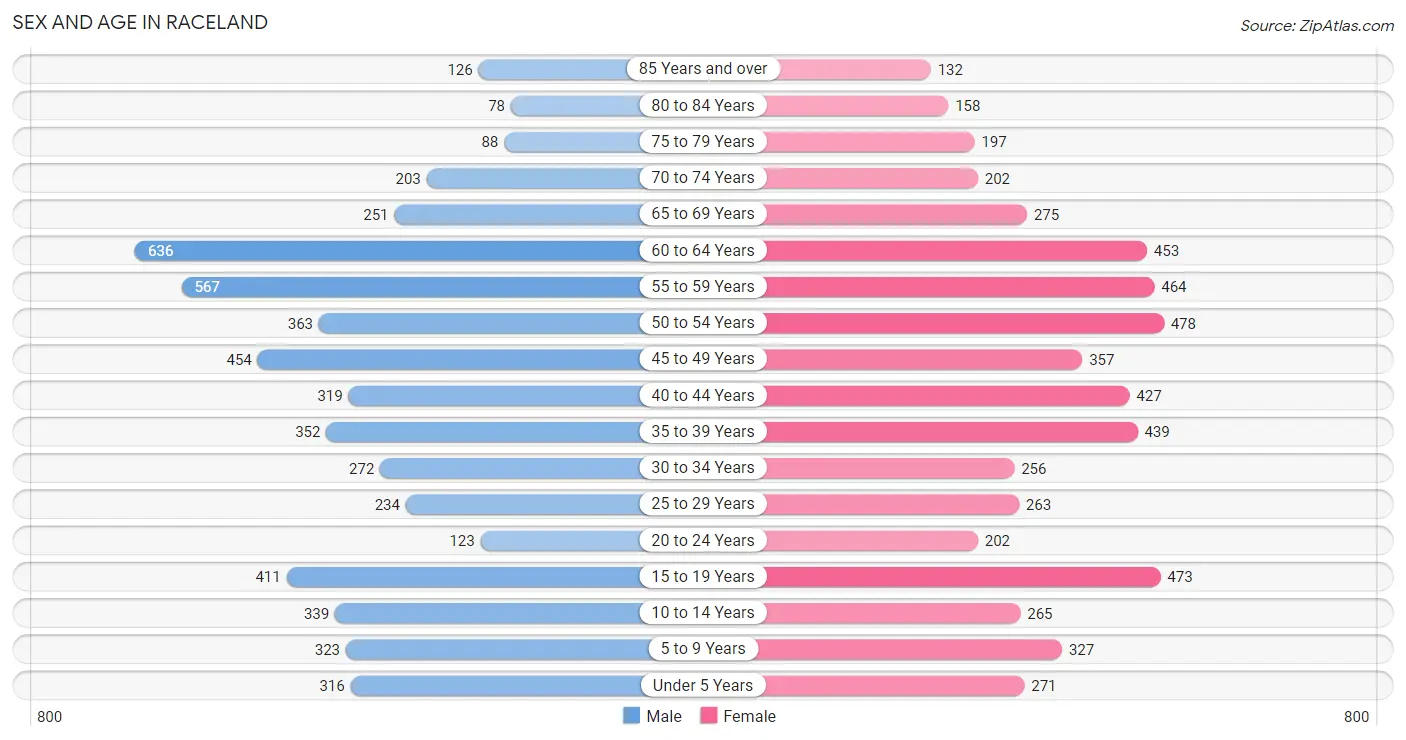
| Age Bracket | Male | Female |
| Under 5 Years | 316 (5.8%) | 271 (4.8%) |
| 5 to 9 Years | 323 (5.9%) | 327 (5.8%) |
| 10 to 14 Years | 339 (6.2%) | 265 (4.7%) |
| 15 to 19 Years | 411 (7.5%) | 473 (8.4%) |
| 20 to 24 Years | 123 (2.2%) | 202 (3.6%) |
| 25 to 29 Years | 234 (4.3%) | 263 (4.7%) |
| 30 to 34 Years | 272 (5.0%) | 256 (4.5%) |
| 35 to 39 Years | 352 (6.5%) | 439 (7.8%) |
| 40 to 44 Years | 319 (5.9%) | 427 (7.6%) |
| 45 to 49 Years | 454 (8.3%) | 357 (6.3%) |
| 50 to 54 Years | 363 (6.7%) | 478 (8.5%) |
| 55 to 59 Years | 567 (10.4%) | 464 (8.2%) |
| 60 to 64 Years | 636 (11.7%) | 453 (8.0%) |
| 65 to 69 Years | 251 (4.6%) | 275 (4.9%) |
| 70 to 74 Years | 203 (3.7%) | 202 (3.6%) |
| 75 to 79 Years | 88 (1.6%) | 197 (3.5%) |
| 80 to 84 Years | 78 (1.4%) | 158 (2.8%) |
| 85 Years and over | 126 (2.3%) | 132 (2.3%) |
| Total | 5,455 (100.0%) | 5,639 (100.0%) |
Families and Households in Raceland
Median Family Size in Raceland
The median family size in Raceland is 3.10 persons per family, with single female/mother families (607 | 20.9%) accounting for the largest median family size of 3.41 persons per family. On the other hand, single male/father families (226 | 7.8%) represent the smallest median family size with 2.85 persons per family.
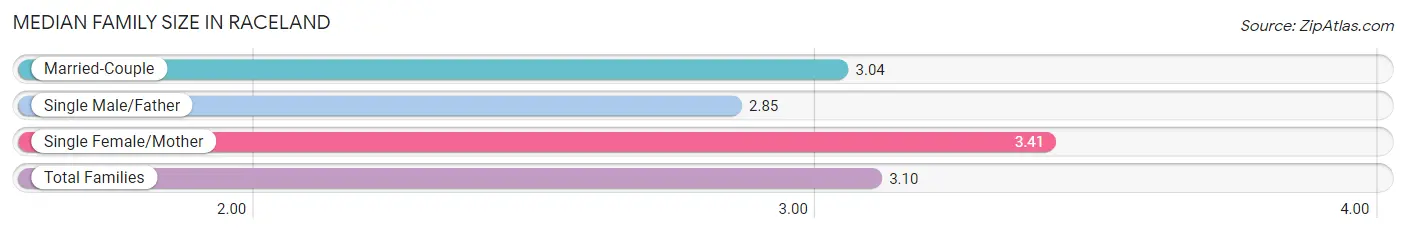
| Family Type | # Families | Family Size |
| Married-Couple | 2,073 (71.3%) | 3.04 |
| Single Male/Father | 226 (7.8%) | 2.85 |
| Single Female/Mother | 607 (20.9%) | 3.41 |
| Total Families | 2,906 (100.0%) | 3.10 |
Median Household Size in Raceland
The median household size in Raceland is 2.58 persons per household, with single female/mother households (607 | 14.2%) accounting for the largest median household size of 3.59 persons per household. non-family households (1,374 | 32.1%) represent the smallest median household size with 1.30 persons per household.
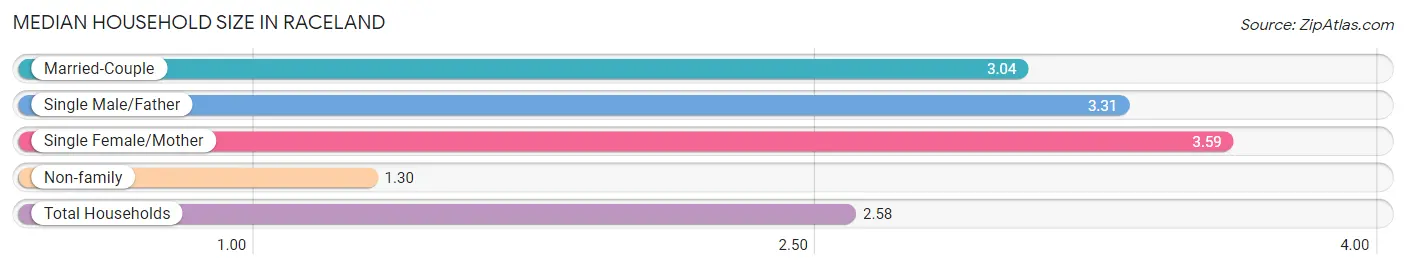
| Household Type | # Households | Household Size |
| Married-Couple | 2,073 (48.4%) | 3.04 |
| Single Male/Father | 226 (5.3%) | 3.31 |
| Single Female/Mother | 607 (14.2%) | 3.59 |
| Non-family | 1,374 (32.1%) | 1.30 |
| Total Households | 4,280 (100.0%) | 2.58 |
Household Size by Marriage Status in Raceland
Out of a total of 4,280 households in Raceland, 2,906 (67.9%) are family households, while 1,374 (32.1%) are nonfamily households. The most numerous type of family households are 2-person households, comprising 1,303, and the most common type of nonfamily households are 1-person households, comprising 1,117.
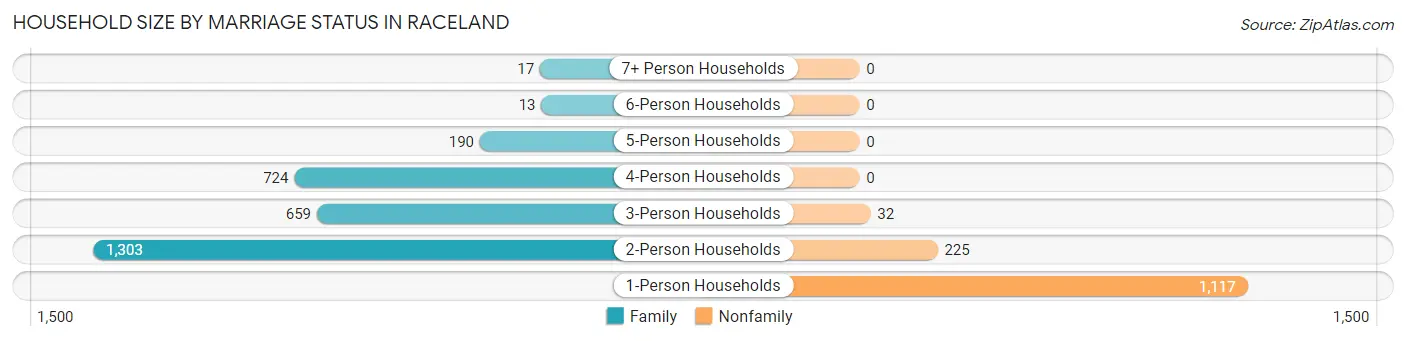
| Household Size | Family Households | Nonfamily Households |
| 1-Person Households | - | 1,117 (26.1%) |
| 2-Person Households | 1,303 (30.4%) | 225 (5.3%) |
| 3-Person Households | 659 (15.4%) | 32 (0.7%) |
| 4-Person Households | 724 (16.9%) | 0 (0.0%) |
| 5-Person Households | 190 (4.4%) | 0 (0.0%) |
| 6-Person Households | 13 (0.3%) | 0 (0.0%) |
| 7+ Person Households | 17 (0.4%) | 0 (0.0%) |
| Total | 2,906 (67.9%) | 1,374 (32.1%) |
Female Fertility in Raceland
Fertility by Age in Raceland
Average fertility rate in Raceland is 24.0 births per 1,000 women. Women in the age bracket of 20 to 34 years have the highest fertility rate with 87.0 births per 1,000 women. Women in the age bracket of 20 to 34 years acount for 100.0% of all women with births.
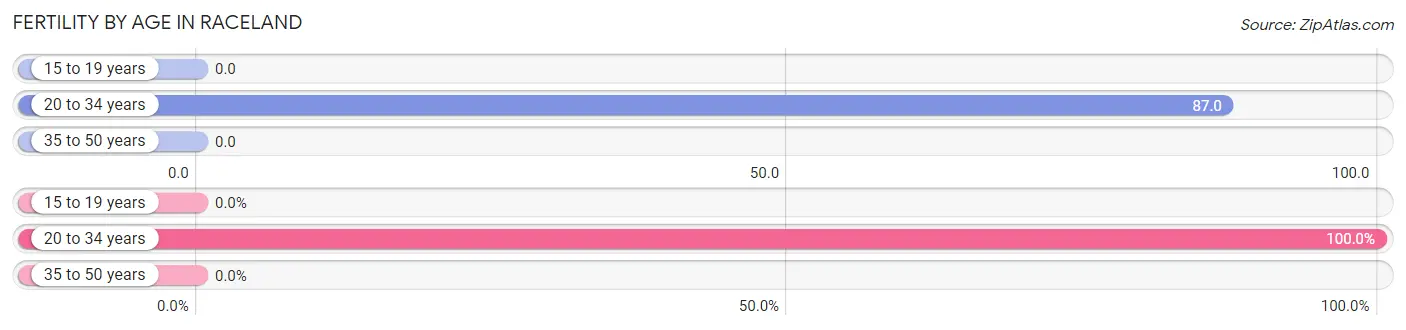
| Age Bracket | Women with Births | Births / 1,000 Women |
| 15 to 19 years | 0 (0.0%) | 0.0 |
| 20 to 34 years | 63 (100.0%) | 87.0 |
| 35 to 50 years | 0 (0.0%) | 0.0 |
| Total | 63 (100.0%) | 24.0 |
Fertility by Age by Marriage Status in Raceland
73.0% of women with births (63) in Raceland are married. The highest percentage of unmarried women with births falls into 20 to 34 years age bracket with 27.0% of them unmarried at the time of birth, while the lowest percentage of unmarried women with births belong to 20 to 34 years age bracket with 27.0% of them unmarried.
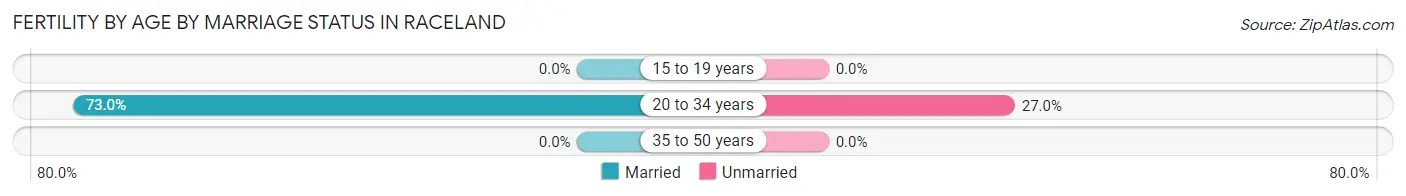
| Age Bracket | Married | Unmarried |
| 15 to 19 years | 0 (0.0%) | 0 (0.0%) |
| 20 to 34 years | 46 (73.0%) | 17 (27.0%) |
| 35 to 50 years | 0 (0.0%) | 0 (0.0%) |
| Total | 46 (73.0%) | 17 (27.0%) |
Fertility by Education in Raceland
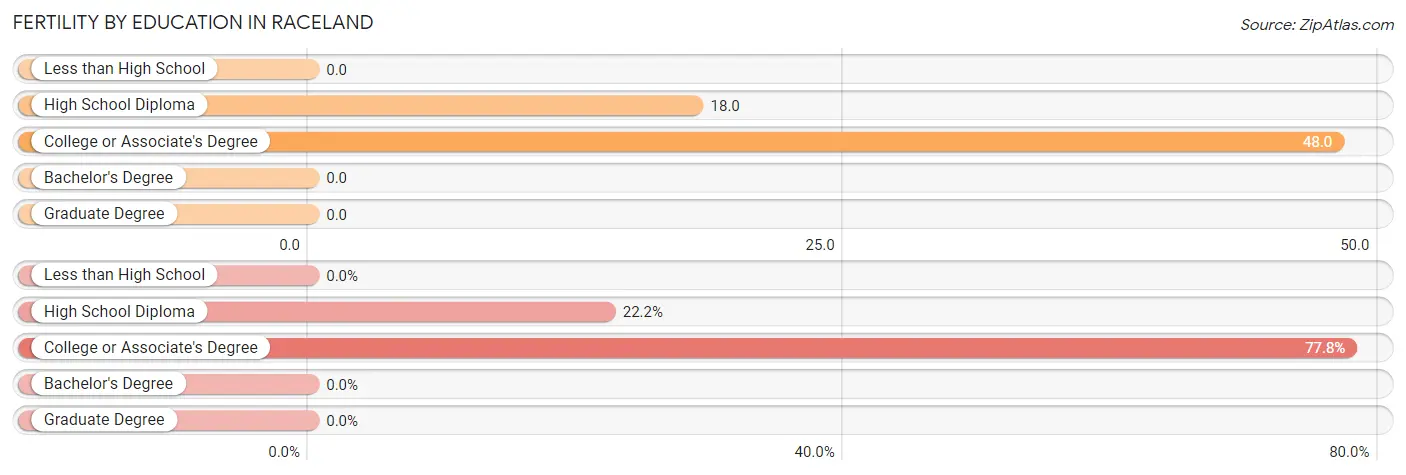
| Educational Attainment | Women with Births | Births / 1,000 Women |
| Less than High School | 0 (0.0%) | 0.0 |
| High School Diploma | 14 (22.2%) | 18.0 |
| College or Associate's Degree | 49 (77.8%) | 48.0 |
| Bachelor's Degree | 0 (0.0%) | 0.0 |
| Graduate Degree | 0 (0.0%) | 0.0 |
| Total | 63 (100.0%) | 24.0 |
Fertility by Education by Marriage Status in Raceland
27.0% of women with births in Raceland are unmarried. Women with the educational attainment of high school diploma are most likely to be married with 100.0% of them married at childbirth, while women with the educational attainment of college or associate's degree are least likely to be married with 34.7% of them unmarried at childbirth.
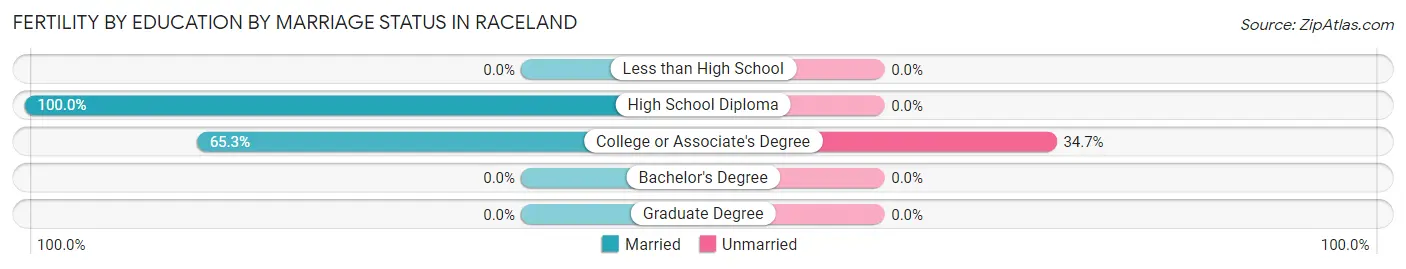
| Educational Attainment | Married | Unmarried |
| Less than High School | 0 (0.0%) | 0 (0.0%) |
| High School Diploma | 14 (100.0%) | 0 (0.0%) |
| College or Associate's Degree | 32 (65.3%) | 17 (34.7%) |
| Bachelor's Degree | 0 (0.0%) | 0 (0.0%) |
| Graduate Degree | 0 (0.0%) | 0 (0.0%) |
| Total | 46 (73.0%) | 17 (27.0%) |
Employment Characteristics in Raceland
Employment by Class of Employer in Raceland
Among the 4,228 employed individuals in Raceland, private company employees (2,973 | 70.3%), local government employees (527 | 12.5%), and not-for-profit organizations (289 | 6.8%) make up the most common classes of employment.
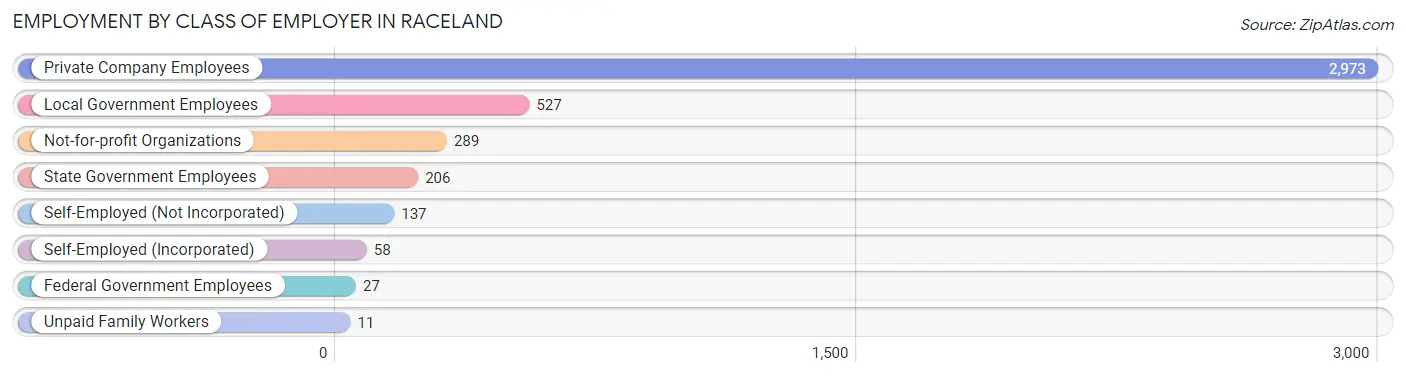
| Employer Class | # Employees | % Employees |
| Private Company Employees | 2,973 | 70.3% |
| Self-Employed (Incorporated) | 58 | 1.4% |
| Self-Employed (Not Incorporated) | 137 | 3.2% |
| Not-for-profit Organizations | 289 | 6.8% |
| Local Government Employees | 527 | 12.5% |
| State Government Employees | 206 | 4.9% |
| Federal Government Employees | 27 | 0.6% |
| Unpaid Family Workers | 11 | 0.3% |
| Total | 4,228 | 100.0% |
Employment Status by Age in Raceland
According to the labor force statistics for Raceland, out of the total population over 16 years of age (9,002), 53.8% or 4,843 individuals are in the labor force, with 10.6% or 513 of them unemployed. The age group with the highest labor force participation rate is 25 to 29 years, with 94.0% or 467 individuals in the labor force. Within the labor force, the 16 to 19 years age range has the highest percentage of unemployed individuals, with 71.2% or 158 of them being unemployed.
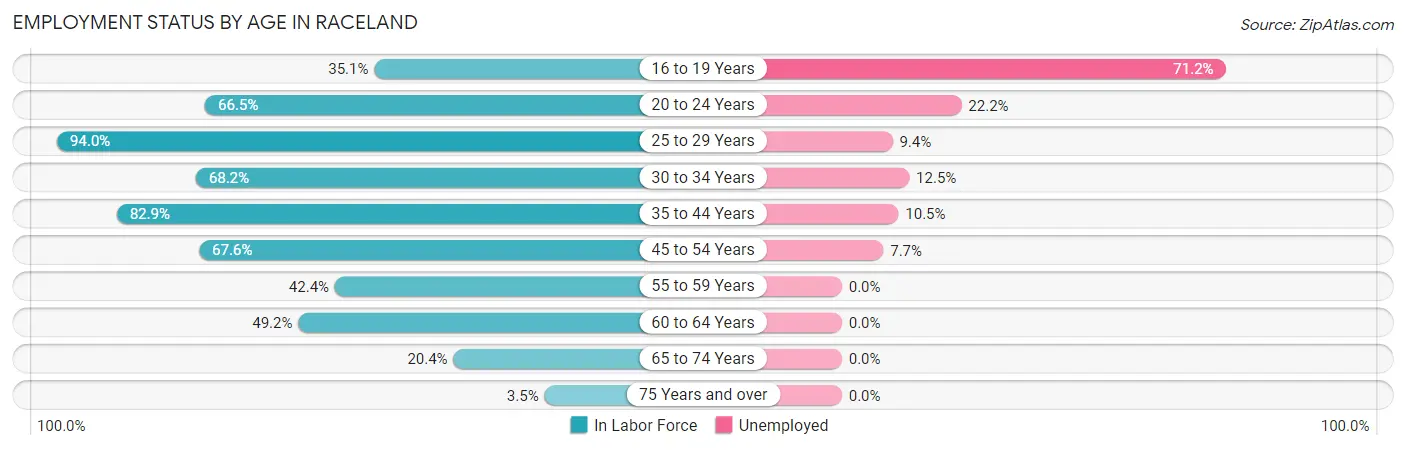
| Age Bracket | In Labor Force | Unemployed |
| 16 to 19 Years | 222 (35.1%) | 158 (71.2%) |
| 20 to 24 Years | 216 (66.5%) | 48 (22.2%) |
| 25 to 29 Years | 467 (94.0%) | 44 (9.4%) |
| 30 to 34 Years | 360 (68.2%) | 45 (12.5%) |
| 35 to 44 Years | 1,274 (82.9%) | 134 (10.5%) |
| 45 to 54 Years | 1,117 (67.6%) | 86 (7.7%) |
| 55 to 59 Years | 437 (42.4%) | 0 (0.0%) |
| 60 to 64 Years | 536 (49.2%) | 0 (0.0%) |
| 65 to 74 Years | 190 (20.4%) | 0 (0.0%) |
| 75 Years and over | 27 (3.5%) | 0 (0.0%) |
| Total | 4,843 (53.8%) | 513 (10.6%) |
Employment Status by Educational Attainment in Raceland
According to labor force statistics for Raceland, 66.2% of individuals (4,193) out of the total population between 25 and 64 years of age (6,334) are in the labor force, with 7.4% or 310 of them being unemployed. The group with the highest labor force participation rate are those with the educational attainment of bachelor's degree or higher, with 93.0% or 570 individuals in the labor force. Within the labor force, individuals with less than high school education have the highest percentage of unemployment, with 18.6% or 96 of them being unemployed.
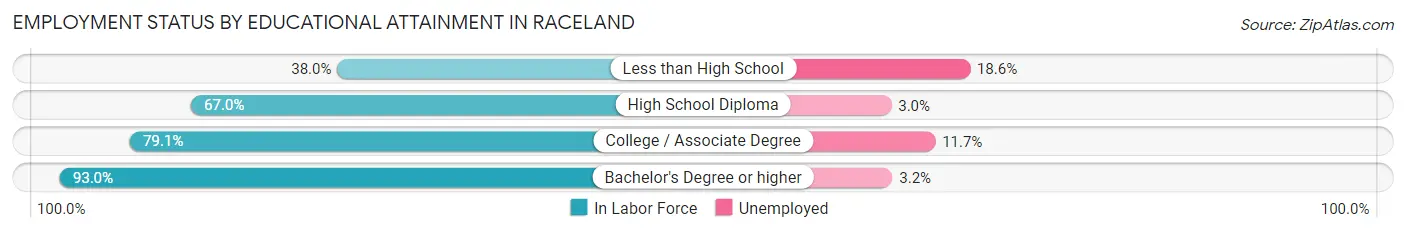
| Educational Attainment | In Labor Force | Unemployed |
| Less than High School | 515 (38.0%) | 252 (18.6%) |
| High School Diploma | 1,940 (67.0%) | 87 (3.0%) |
| College / Associate Degree | 1,164 (79.1%) | 172 (11.7%) |
| Bachelor's Degree or higher | 570 (93.0%) | 20 (3.2%) |
| Total | 4,193 (66.2%) | 469 (7.4%) |
Employment Occupations by Sex in Raceland
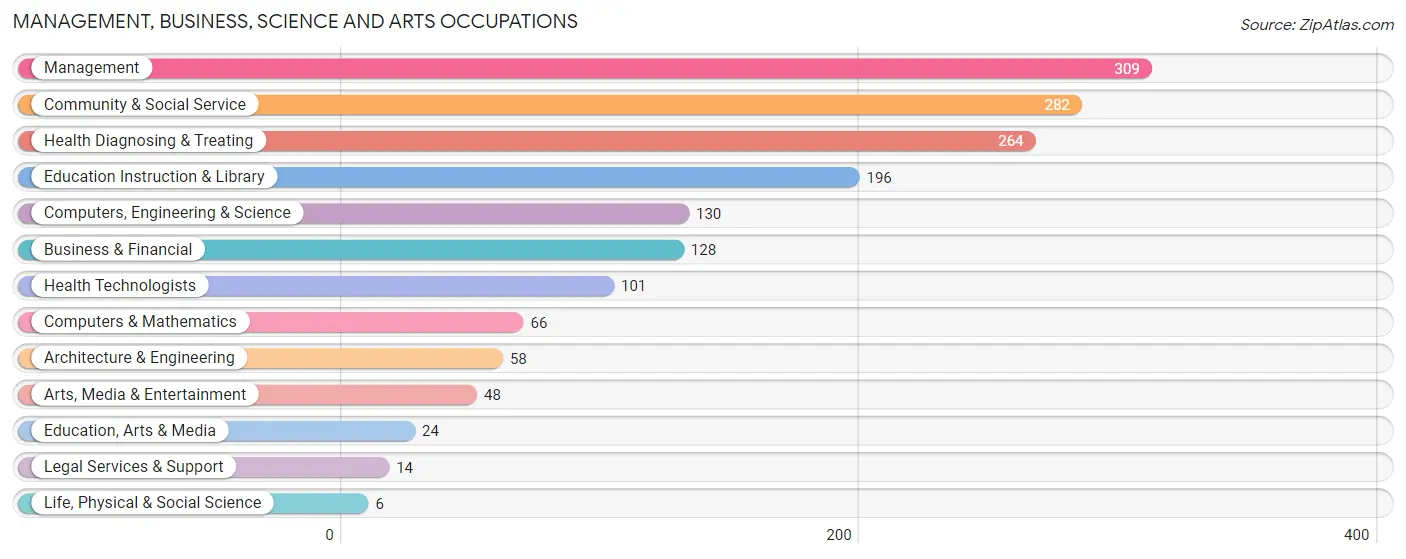
Management, Business, Science and Arts Occupations
The most common Management, Business, Science and Arts occupations in Raceland are Management (309 | 7.1%), Community & Social Service (282 | 6.5%), Health Diagnosing & Treating (264 | 6.1%), Education Instruction & Library (196 | 4.5%), and Computers, Engineering & Science (130 | 3.0%).
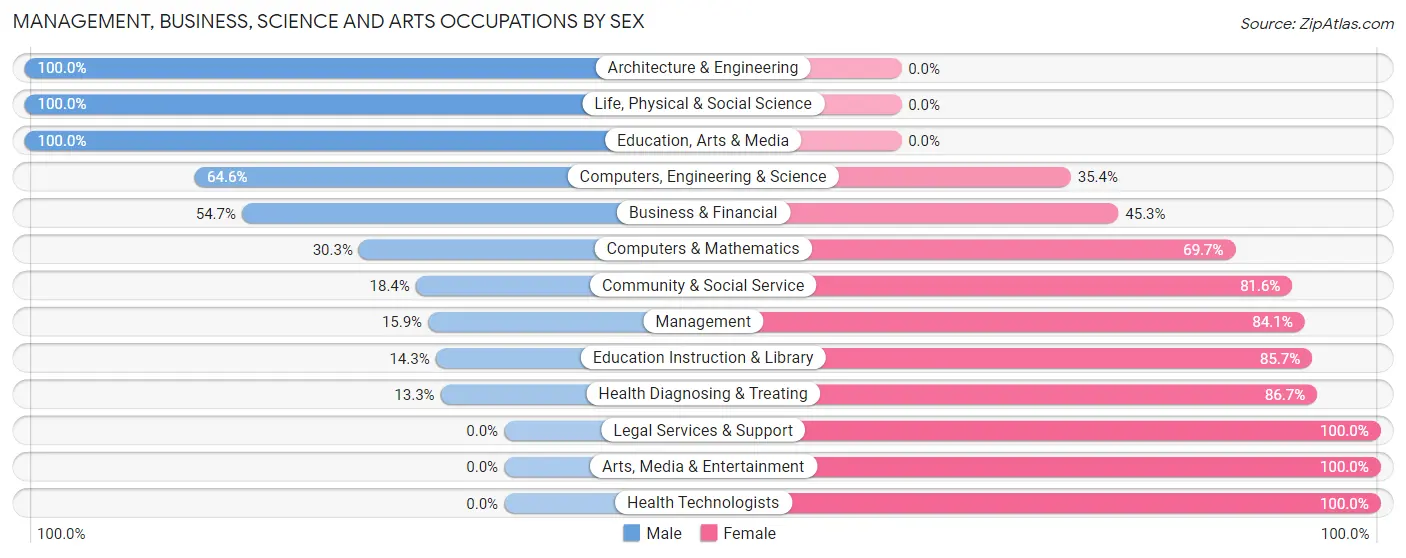
Management, Business, Science and Arts Occupations by Sex
Within the Management, Business, Science and Arts occupations in Raceland, the most male-oriented occupations are Architecture & Engineering (100.0%), Life, Physical & Social Science (100.0%), and Education, Arts & Media (100.0%), while the most female-oriented occupations are Legal Services & Support (100.0%), Arts, Media & Entertainment (100.0%), and Health Technologists (100.0%).
| Occupation | Male | Female |
| Management | 49 (15.9%) | 260 (84.1%) |
| Business & Financial | 70 (54.7%) | 58 (45.3%) |
| Computers, Engineering & Science | 84 (64.6%) | 46 (35.4%) |
| Computers & Mathematics | 20 (30.3%) | 46 (69.7%) |
| Architecture & Engineering | 58 (100.0%) | 0 (0.0%) |
| Life, Physical & Social Science | 6 (100.0%) | 0 (0.0%) |
| Community & Social Service | 52 (18.4%) | 230 (81.6%) |
| Education, Arts & Media | 24 (100.0%) | 0 (0.0%) |
| Legal Services & Support | 0 (0.0%) | 14 (100.0%) |
| Education Instruction & Library | 28 (14.3%) | 168 (85.7%) |
| Arts, Media & Entertainment | 0 (0.0%) | 48 (100.0%) |
| Health Diagnosing & Treating | 35 (13.3%) | 229 (86.7%) |
| Health Technologists | 0 (0.0%) | 101 (100.0%) |
| Total (Category) | 290 (26.1%) | 823 (73.9%) |
| Total (Overall) | 2,040 (47.1%) | 2,291 (52.9%) |
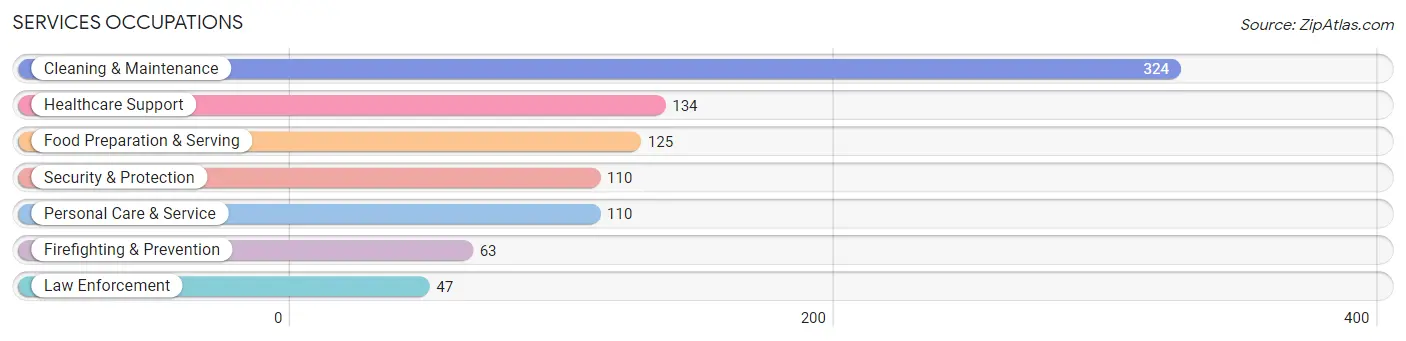
Services Occupations
The most common Services occupations in Raceland are Cleaning & Maintenance (324 | 7.5%), Healthcare Support (134 | 3.1%), Food Preparation & Serving (125 | 2.9%), Security & Protection (110 | 2.5%), and Personal Care & Service (110 | 2.5%).
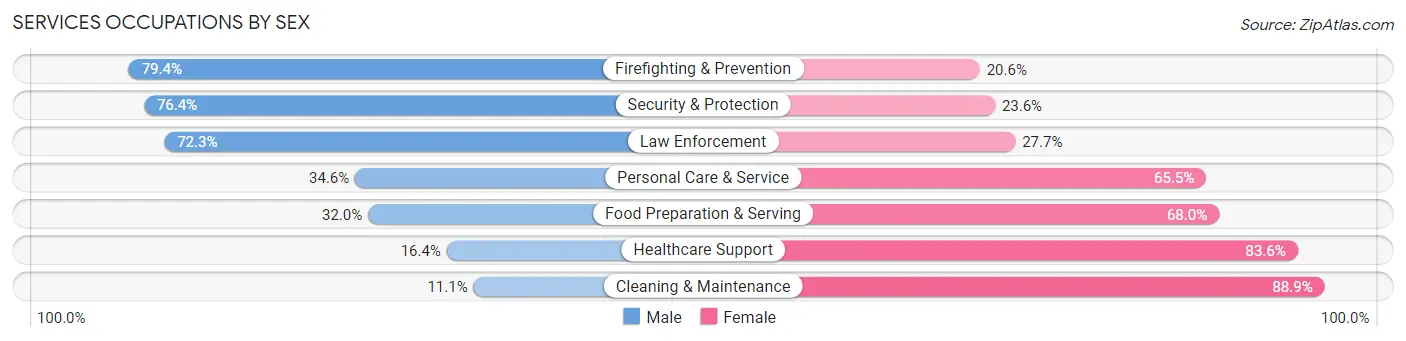
Services Occupations by Sex
Within the Services occupations in Raceland, the most male-oriented occupations are Firefighting & Prevention (79.4%), Security & Protection (76.4%), and Law Enforcement (72.3%), while the most female-oriented occupations are Cleaning & Maintenance (88.9%), Healthcare Support (83.6%), and Food Preparation & Serving (68.0%).
| Occupation | Male | Female |
| Healthcare Support | 22 (16.4%) | 112 (83.6%) |
| Security & Protection | 84 (76.4%) | 26 (23.6%) |
| Firefighting & Prevention | 50 (79.4%) | 13 (20.6%) |
| Law Enforcement | 34 (72.3%) | 13 (27.7%) |
| Food Preparation & Serving | 40 (32.0%) | 85 (68.0%) |
| Cleaning & Maintenance | 36 (11.1%) | 288 (88.9%) |
| Personal Care & Service | 38 (34.5%) | 72 (65.4%) |
| Total (Category) | 220 (27.4%) | 583 (72.6%) |
| Total (Overall) | 2,040 (47.1%) | 2,291 (52.9%) |
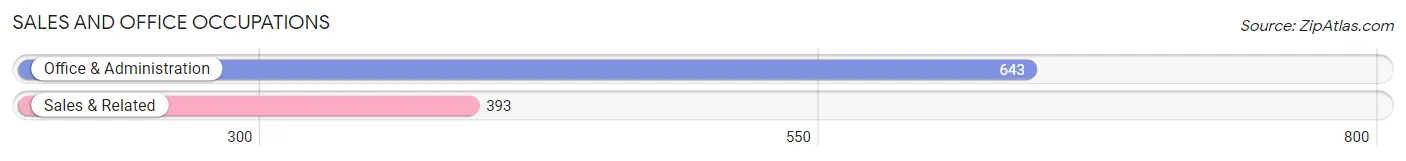
Sales and Office Occupations
The most common Sales and Office occupations in Raceland are Office & Administration (643 | 14.8%), and Sales & Related (393 | 9.1%).
Sales and Office Occupations by Sex
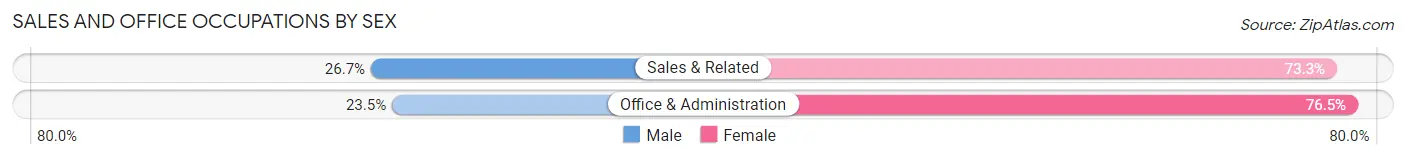
| Occupation | Male | Female |
| Sales & Related | 105 (26.7%) | 288 (73.3%) |
| Office & Administration | 151 (23.5%) | 492 (76.5%) |
| Total (Category) | 256 (24.7%) | 780 (75.3%) |
| Total (Overall) | 2,040 (47.1%) | 2,291 (52.9%) |
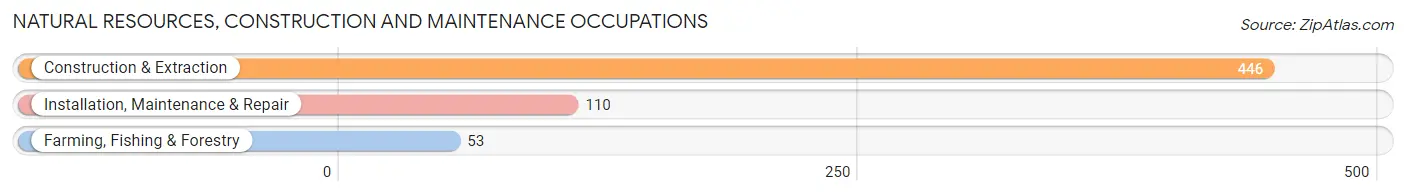
Natural Resources, Construction and Maintenance Occupations
The most common Natural Resources, Construction and Maintenance occupations in Raceland are Construction & Extraction (446 | 10.3%), Installation, Maintenance & Repair (110 | 2.5%), and Farming, Fishing & Forestry (53 | 1.2%).
Natural Resources, Construction and Maintenance Occupations by Sex
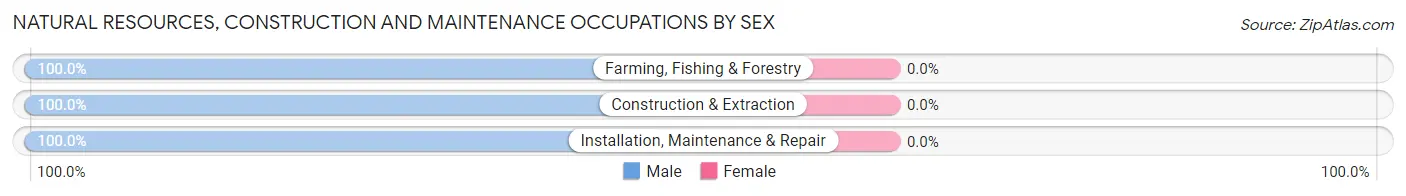
| Occupation | Male | Female |
| Farming, Fishing & Forestry | 53 (100.0%) | 0 (0.0%) |
| Construction & Extraction | 446 (100.0%) | 0 (0.0%) |
| Installation, Maintenance & Repair | 110 (100.0%) | 0 (0.0%) |
| Total (Category) | 609 (100.0%) | 0 (0.0%) |
| Total (Overall) | 2,040 (47.1%) | 2,291 (52.9%) |
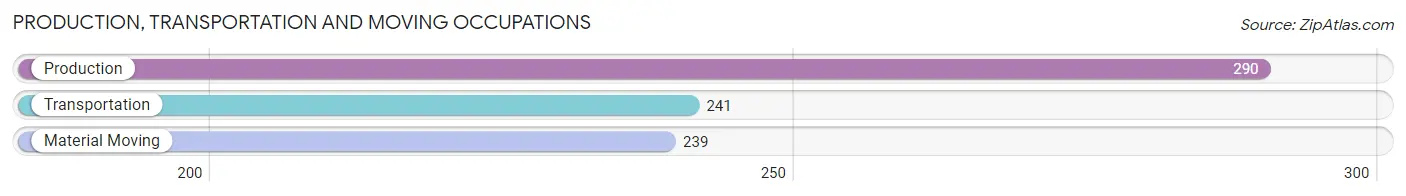
Production, Transportation and Moving Occupations
The most common Production, Transportation and Moving occupations in Raceland are Production (290 | 6.7%), Transportation (241 | 5.6%), and Material Moving (239 | 5.5%).
Production, Transportation and Moving Occupations by Sex
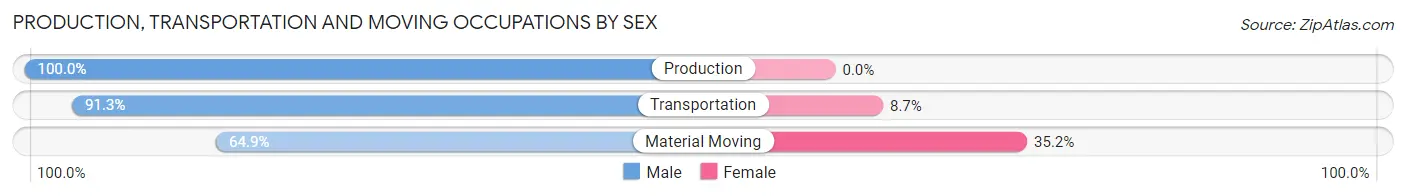
| Occupation | Male | Female |
| Production | 290 (100.0%) | 0 (0.0%) |
| Transportation | 220 (91.3%) | 21 (8.7%) |
| Material Moving | 155 (64.8%) | 84 (35.1%) |
| Total (Category) | 665 (86.4%) | 105 (13.6%) |
| Total (Overall) | 2,040 (47.1%) | 2,291 (52.9%) |
Employment Industries by Sex in Raceland
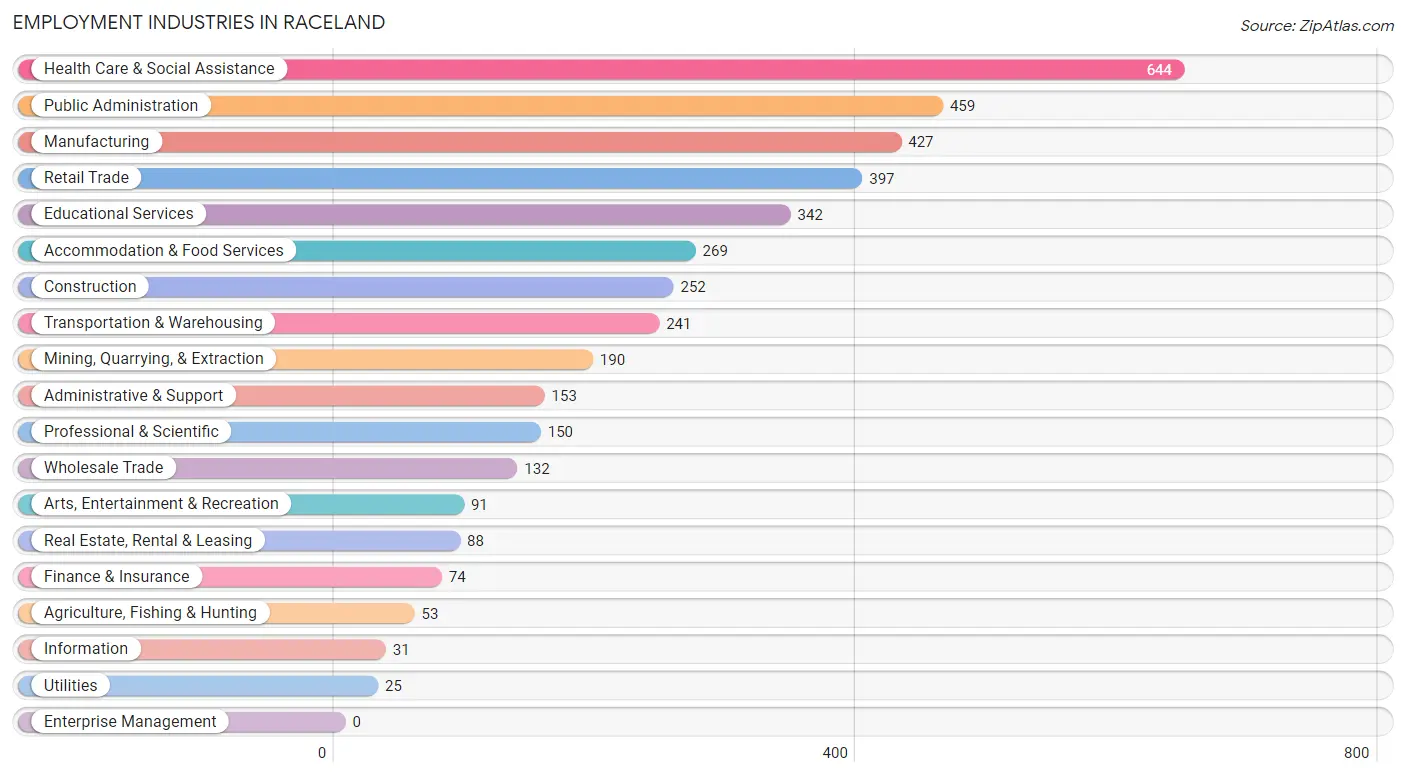
Employment Industries in Raceland
The major employment industries in Raceland include Health Care & Social Assistance (644 | 14.9%), Public Administration (459 | 10.6%), Manufacturing (427 | 9.9%), Retail Trade (397 | 9.2%), and Educational Services (342 | 7.9%).
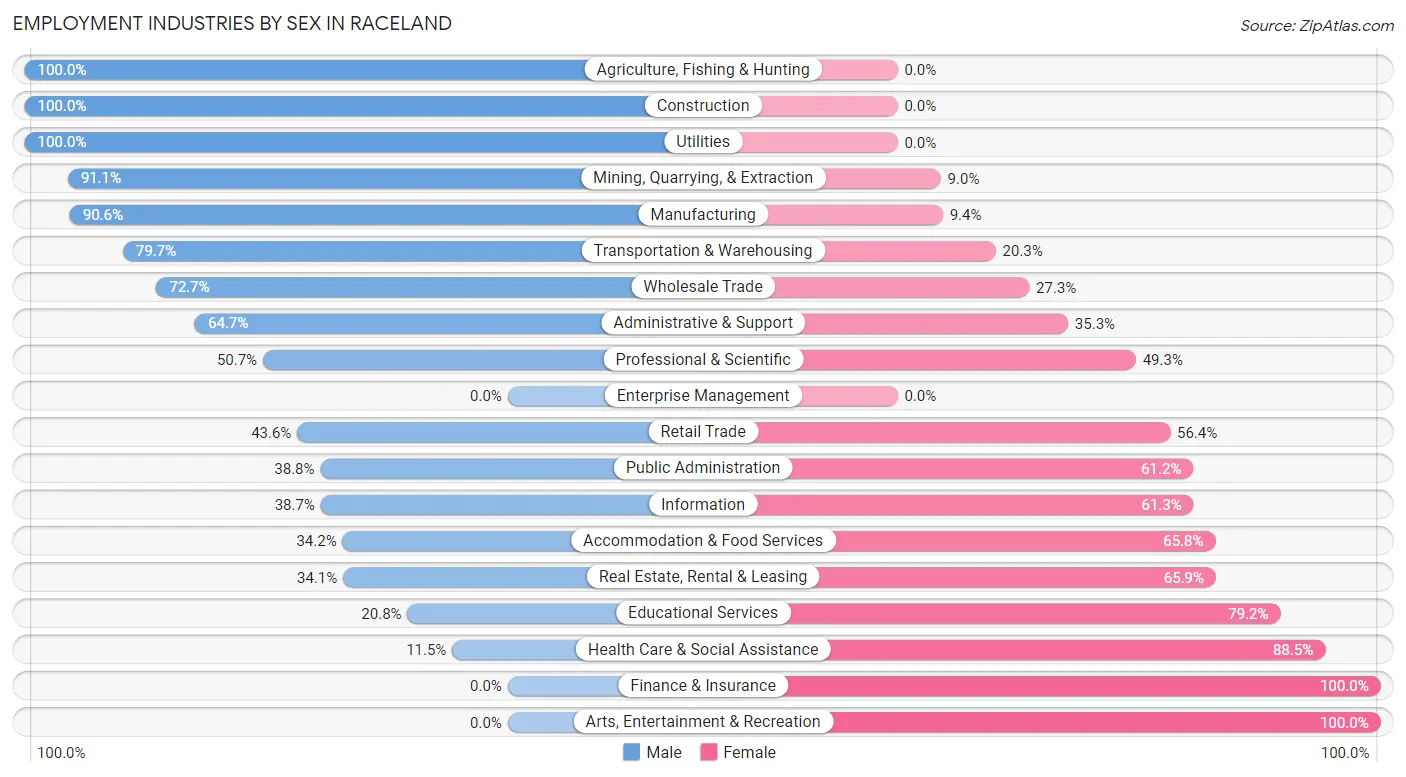
Employment Industries by Sex in Raceland
The Raceland industries that see more men than women are Agriculture, Fishing & Hunting (100.0%), Construction (100.0%), and Utilities (100.0%), whereas the industries that tend to have a higher number of women are Finance & Insurance (100.0%), Arts, Entertainment & Recreation (100.0%), and Health Care & Social Assistance (88.5%).
| Industry | Male | Female |
| Agriculture, Fishing & Hunting | 53 (100.0%) | 0 (0.0%) |
| Mining, Quarrying, & Extraction | 173 (91.0%) | 17 (8.9%) |
| Construction | 252 (100.0%) | 0 (0.0%) |
| Manufacturing | 387 (90.6%) | 40 (9.4%) |
| Wholesale Trade | 96 (72.7%) | 36 (27.3%) |
| Retail Trade | 173 (43.6%) | 224 (56.4%) |
| Transportation & Warehousing | 192 (79.7%) | 49 (20.3%) |
| Utilities | 25 (100.0%) | 0 (0.0%) |
| Information | 12 (38.7%) | 19 (61.3%) |
| Finance & Insurance | 0 (0.0%) | 74 (100.0%) |
| Real Estate, Rental & Leasing | 30 (34.1%) | 58 (65.9%) |
| Professional & Scientific | 76 (50.7%) | 74 (49.3%) |
| Enterprise Management | 0 (0.0%) | 0 (0.0%) |
| Administrative & Support | 99 (64.7%) | 54 (35.3%) |
| Educational Services | 71 (20.8%) | 271 (79.2%) |
| Health Care & Social Assistance | 74 (11.5%) | 570 (88.5%) |
| Arts, Entertainment & Recreation | 0 (0.0%) | 91 (100.0%) |
| Accommodation & Food Services | 92 (34.2%) | 177 (65.8%) |
| Public Administration | 178 (38.8%) | 281 (61.2%) |
| Total | 2,040 (47.1%) | 2,291 (52.9%) |
Education in Raceland
School Enrollment in Raceland
The most common levels of schooling among the 2,156 students in Raceland are high school (720 | 33.4%), middle school (421 | 19.5%), and elementary school (412 | 19.1%).
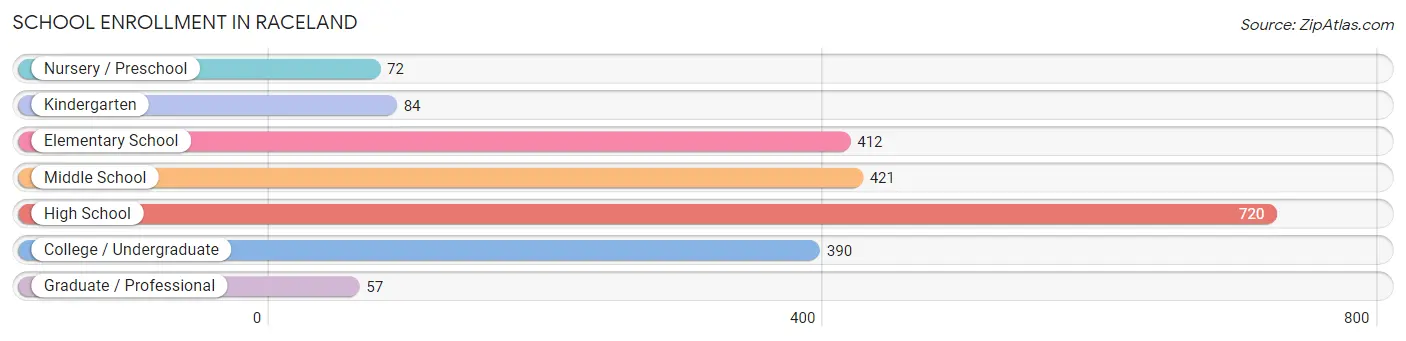
| School Level | # Students | % Students |
| Nursery / Preschool | 72 | 3.3% |
| Kindergarten | 84 | 3.9% |
| Elementary School | 412 | 19.1% |
| Middle School | 421 | 19.5% |
| High School | 720 | 33.4% |
| College / Undergraduate | 390 | 18.1% |
| Graduate / Professional | 57 | 2.6% |
| Total | 2,156 | 100.0% |
School Enrollment by Age by Funding Source in Raceland
Out of a total of 2,156 students who are enrolled in schools in Raceland, 345 (16.0%) attend a private institution, while the remaining 1,811 (84.0%) are enrolled in public schools. The age group of 3 to 4 year olds has the highest likelihood of being enrolled in private schools, with 13 (28.9% in the age bracket) enrolled. Conversely, the age group of 18 to 19 year olds has the lowest likelihood of being enrolled in a private school, with 145 (100.0% in the age bracket) attending a public institution.
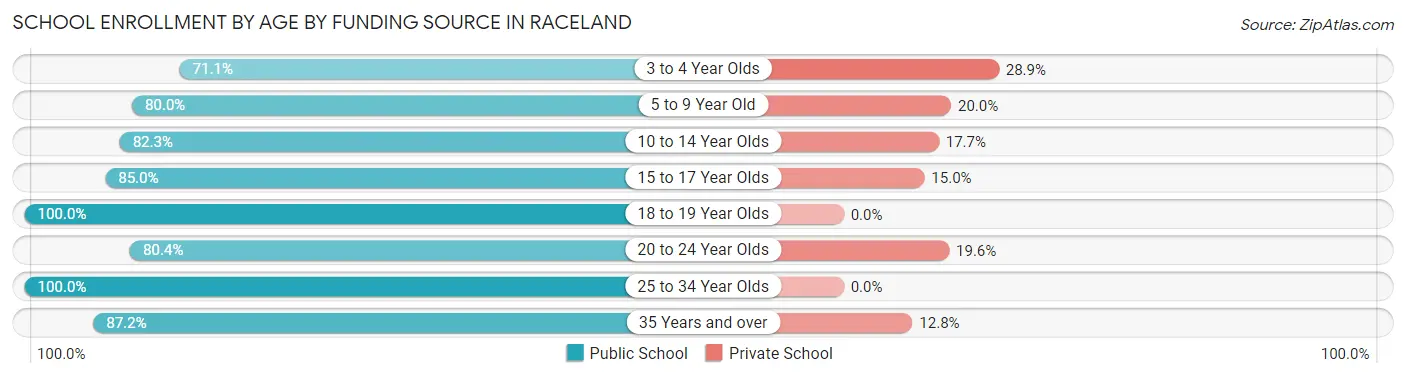
| Age Bracket | Public School | Private School |
| 3 to 4 Year Olds | 32 (71.1%) | 13 (28.9%) |
| 5 to 9 Year Old | 396 (80.0%) | 99 (20.0%) |
| 10 to 14 Year Olds | 497 (82.3%) | 107 (17.7%) |
| 15 to 17 Year Olds | 469 (85.0%) | 83 (15.0%) |
| 18 to 19 Year Olds | 145 (100.0%) | 0 (0.0%) |
| 20 to 24 Year Olds | 90 (80.4%) | 22 (19.6%) |
| 25 to 34 Year Olds | 39 (100.0%) | 0 (0.0%) |
| 35 Years and over | 143 (87.2%) | 21 (12.8%) |
| Total | 1,811 (84.0%) | 345 (16.0%) |
Educational Attainment by Field of Study in Raceland
Business (272 | 31.7%), education (182 | 21.2%), science & technology (170 | 19.8%), arts & humanities (52 | 6.1%), and psychology (47 | 5.5%) are the most common fields of study among 858 individuals in Raceland who have obtained a bachelor's degree or higher.
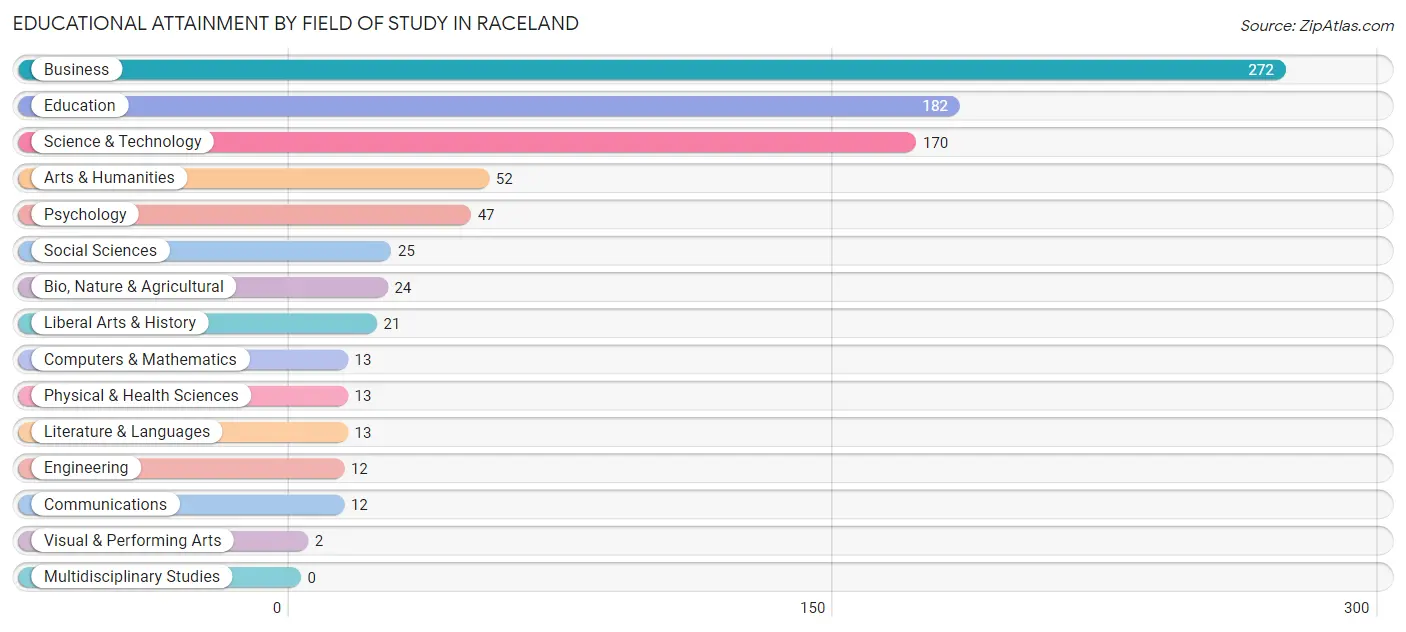
| Field of Study | # Graduates | % Graduates |
| Computers & Mathematics | 13 | 1.5% |
| Bio, Nature & Agricultural | 24 | 2.8% |
| Physical & Health Sciences | 13 | 1.5% |
| Psychology | 47 | 5.5% |
| Social Sciences | 25 | 2.9% |
| Engineering | 12 | 1.4% |
| Multidisciplinary Studies | 0 | 0.0% |
| Science & Technology | 170 | 19.8% |
| Business | 272 | 31.7% |
| Education | 182 | 21.2% |
| Literature & Languages | 13 | 1.5% |
| Liberal Arts & History | 21 | 2.5% |
| Visual & Performing Arts | 2 | 0.2% |
| Communications | 12 | 1.4% |
| Arts & Humanities | 52 | 6.1% |
| Total | 858 | 100.0% |
Transportation & Commute in Raceland
Vehicle Availability by Sex in Raceland
The most prevalent vehicle ownership categories in Raceland are males with 2 vehicles (1,124, accounting for 57.0%) and females with 2 vehicles (1,238, making up 50.0%).
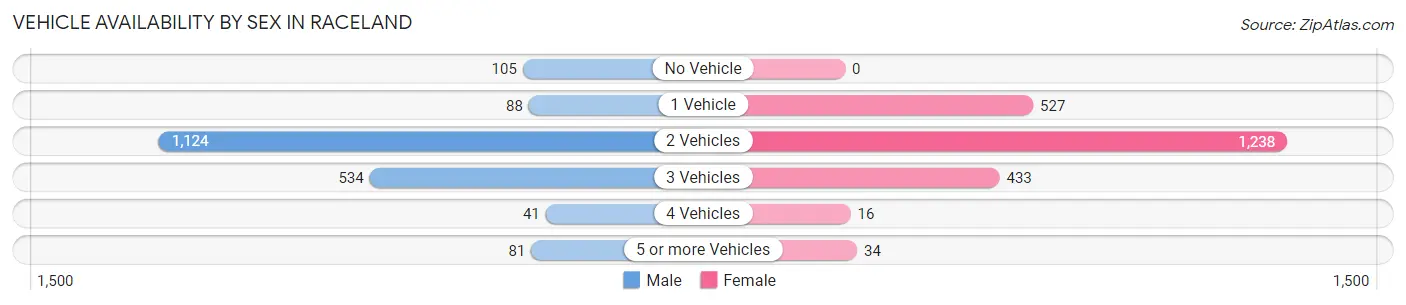
| Vehicles Available | Male | Female |
| No Vehicle | 105 (5.3%) | 0 (0.0%) |
| 1 Vehicle | 88 (4.5%) | 527 (23.4%) |
| 2 Vehicles | 1,124 (57.0%) | 1,238 (55.1%) |
| 3 Vehicles | 534 (27.1%) | 433 (19.3%) |
| 4 Vehicles | 41 (2.1%) | 16 (0.7%) |
| 5 or more Vehicles | 81 (4.1%) | 34 (1.5%) |
| Total | 1,973 (100.0%) | 2,248 (100.0%) |
Commute Time in Raceland
The most frequently occuring commute durations in Raceland are 30 to 34 minutes (665 commuters, 16.5%), 20 to 24 minutes (440 commuters, 10.9%), and 15 to 19 minutes (430 commuters, 10.7%).
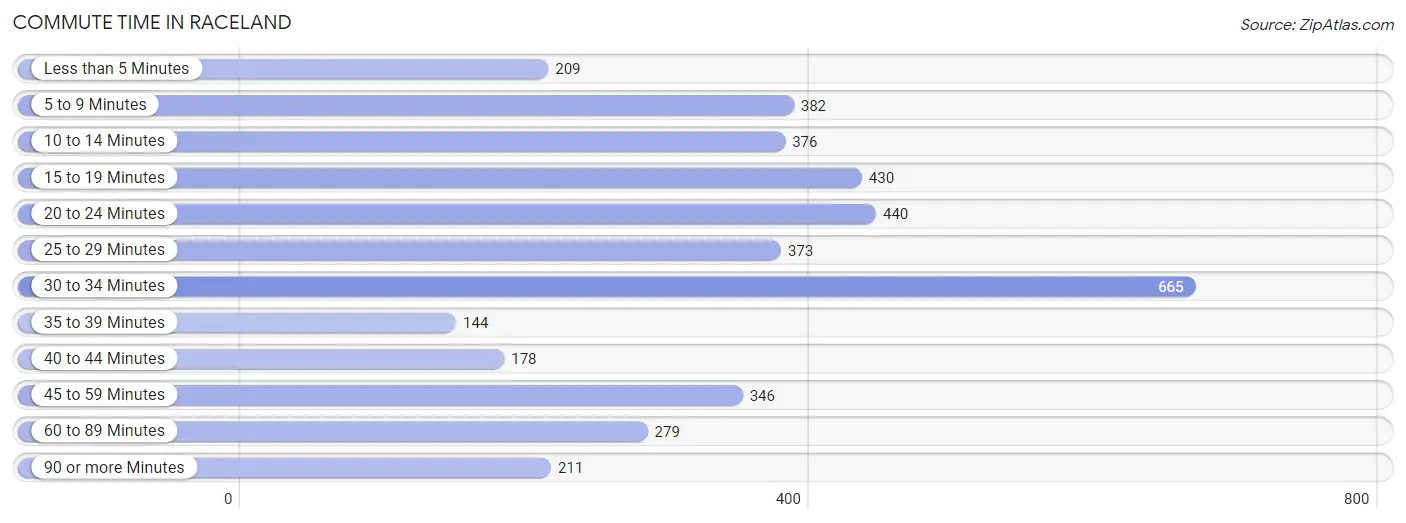
| Commute Time | # Commuters | % Commuters |
| Less than 5 Minutes | 209 | 5.2% |
| 5 to 9 Minutes | 382 | 9.5% |
| 10 to 14 Minutes | 376 | 9.3% |
| 15 to 19 Minutes | 430 | 10.7% |
| 20 to 24 Minutes | 440 | 10.9% |
| 25 to 29 Minutes | 373 | 9.2% |
| 30 to 34 Minutes | 665 | 16.5% |
| 35 to 39 Minutes | 144 | 3.6% |
| 40 to 44 Minutes | 178 | 4.4% |
| 45 to 59 Minutes | 346 | 8.6% |
| 60 to 89 Minutes | 279 | 6.9% |
| 90 or more Minutes | 211 | 5.2% |
Commute Time by Sex in Raceland
The most common commute times in Raceland are 30 to 34 minutes (465 commuters, 23.5%) for males and 5 to 9 minutes (330 commuters, 16.1%) for females.
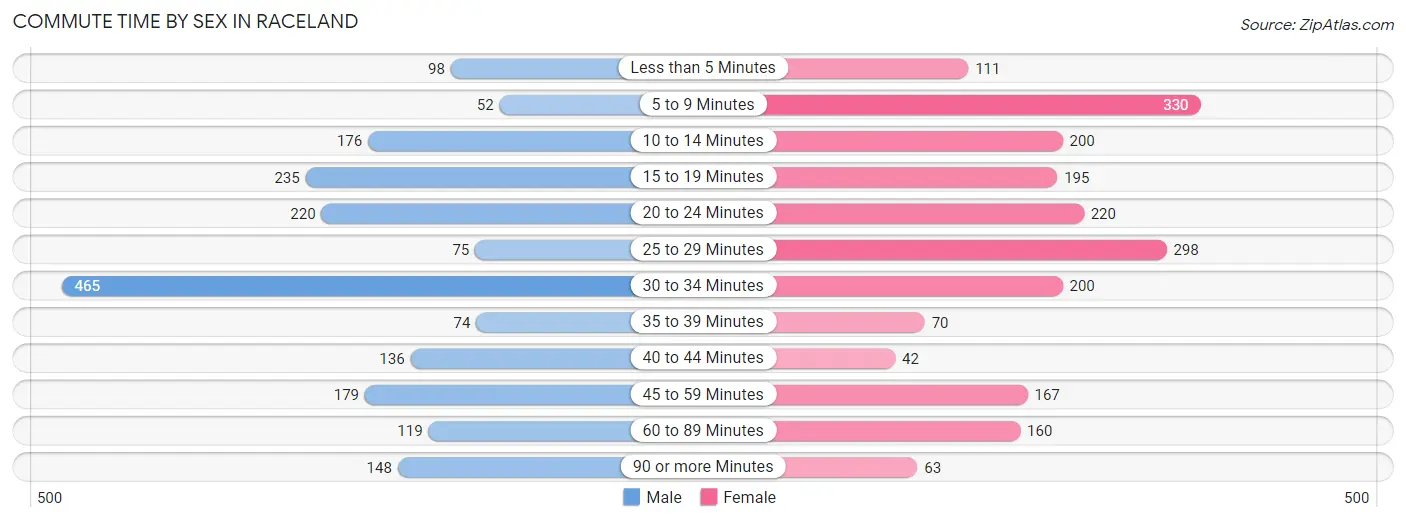
| Commute Time | Male | Female |
| Less than 5 Minutes | 98 (5.0%) | 111 (5.4%) |
| 5 to 9 Minutes | 52 (2.6%) | 330 (16.1%) |
| 10 to 14 Minutes | 176 (8.9%) | 200 (9.7%) |
| 15 to 19 Minutes | 235 (11.9%) | 195 (9.5%) |
| 20 to 24 Minutes | 220 (11.1%) | 220 (10.7%) |
| 25 to 29 Minutes | 75 (3.8%) | 298 (14.5%) |
| 30 to 34 Minutes | 465 (23.5%) | 200 (9.7%) |
| 35 to 39 Minutes | 74 (3.7%) | 70 (3.4%) |
| 40 to 44 Minutes | 136 (6.9%) | 42 (2.0%) |
| 45 to 59 Minutes | 179 (9.0%) | 167 (8.1%) |
| 60 to 89 Minutes | 119 (6.0%) | 160 (7.8%) |
| 90 or more Minutes | 148 (7.5%) | 63 (3.1%) |
Time of Departure to Work by Sex in Raceland
The most frequent times of departure to work in Raceland are 6:00 AM to 6:29 AM (318, 16.1%) for males and 7:00 AM to 7:29 AM (334, 16.3%) for females.
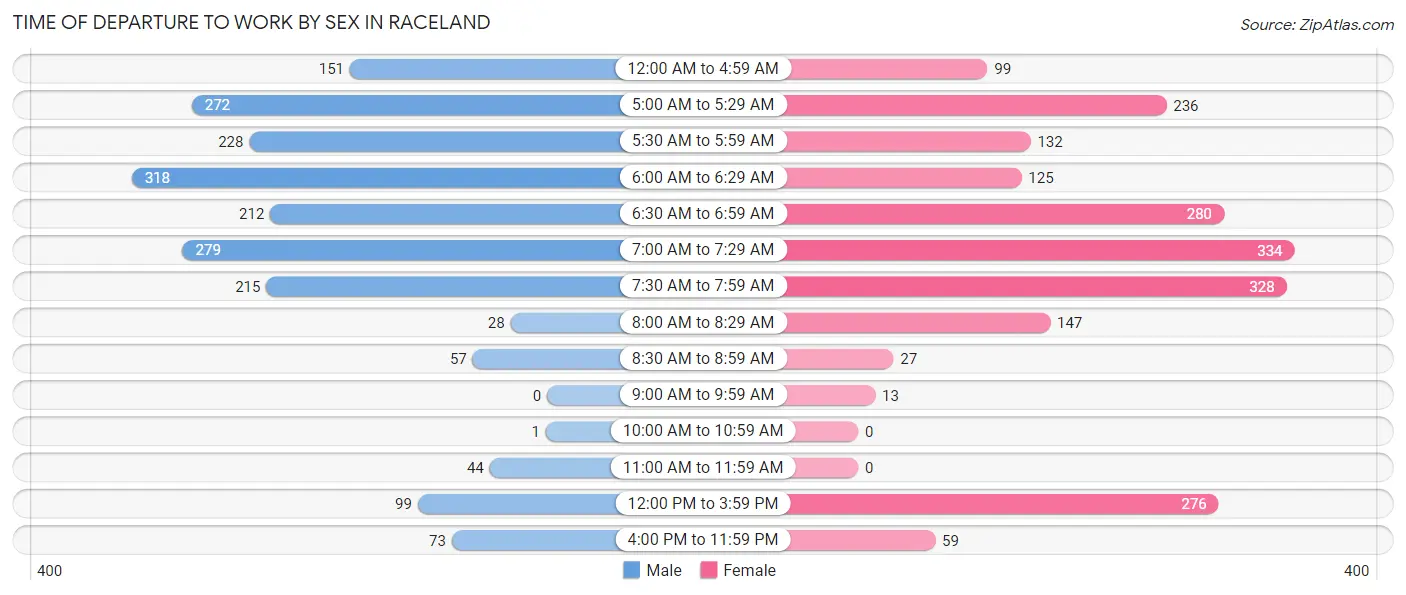
| Time of Departure | Male | Female |
| 12:00 AM to 4:59 AM | 151 (7.6%) | 99 (4.8%) |
| 5:00 AM to 5:29 AM | 272 (13.8%) | 236 (11.5%) |
| 5:30 AM to 5:59 AM | 228 (11.5%) | 132 (6.4%) |
| 6:00 AM to 6:29 AM | 318 (16.1%) | 125 (6.1%) |
| 6:30 AM to 6:59 AM | 212 (10.7%) | 280 (13.6%) |
| 7:00 AM to 7:29 AM | 279 (14.1%) | 334 (16.3%) |
| 7:30 AM to 7:59 AM | 215 (10.9%) | 328 (16.0%) |
| 8:00 AM to 8:29 AM | 28 (1.4%) | 147 (7.1%) |
| 8:30 AM to 8:59 AM | 57 (2.9%) | 27 (1.3%) |
| 9:00 AM to 9:59 AM | 0 (0.0%) | 13 (0.6%) |
| 10:00 AM to 10:59 AM | 1 (0.1%) | 0 (0.0%) |
| 11:00 AM to 11:59 AM | 44 (2.2%) | 0 (0.0%) |
| 12:00 PM to 3:59 PM | 99 (5.0%) | 276 (13.4%) |
| 4:00 PM to 11:59 PM | 73 (3.7%) | 59 (2.9%) |
| Total | 1,977 (100.0%) | 2,056 (100.0%) |
Housing Occupancy in Raceland
Occupancy by Ownership in Raceland
Of the total 4,280 dwellings in Raceland, owner-occupied units account for 3,393 (79.3%), while renter-occupied units make up 887 (20.7%).
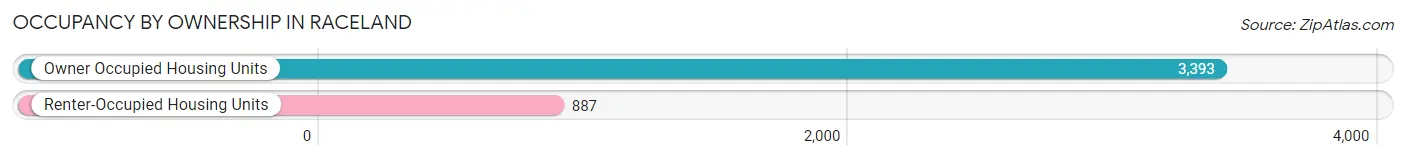
| Occupancy | # Housing Units | % Housing Units |
| Owner Occupied Housing Units | 3,393 | 79.3% |
| Renter-Occupied Housing Units | 887 | 20.7% |
| Total Occupied Housing Units | 4,280 | 100.0% |
Occupancy by Household Size in Raceland
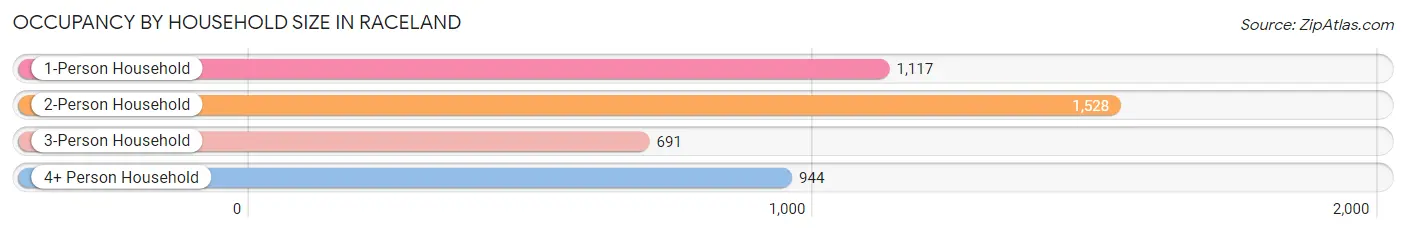
| Household Size | # Housing Units | % Housing Units |
| 1-Person Household | 1,117 | 26.1% |
| 2-Person Household | 1,528 | 35.7% |
| 3-Person Household | 691 | 16.1% |
| 4+ Person Household | 944 | 22.1% |
| Total Housing Units | 4,280 | 100.0% |
Occupancy by Ownership by Household Size in Raceland
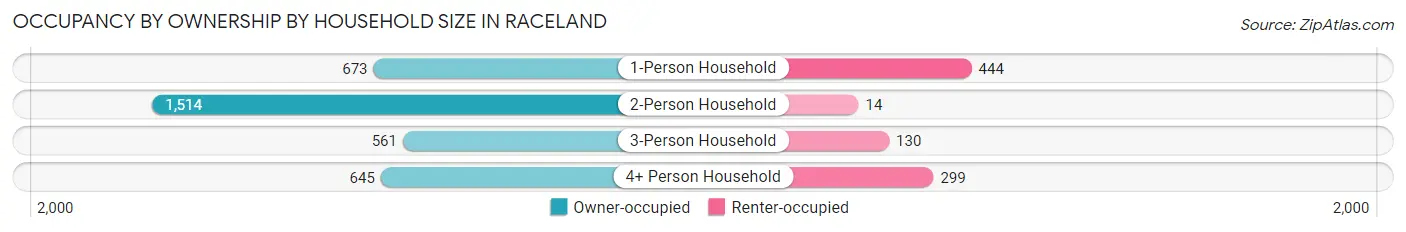
| Household Size | Owner-occupied | Renter-occupied |
| 1-Person Household | 673 (60.3%) | 444 (39.8%) |
| 2-Person Household | 1,514 (99.1%) | 14 (0.9%) |
| 3-Person Household | 561 (81.2%) | 130 (18.8%) |
| 4+ Person Household | 645 (68.3%) | 299 (31.7%) |
| Total Housing Units | 3,393 (79.3%) | 887 (20.7%) |
Occupancy by Educational Attainment in Raceland
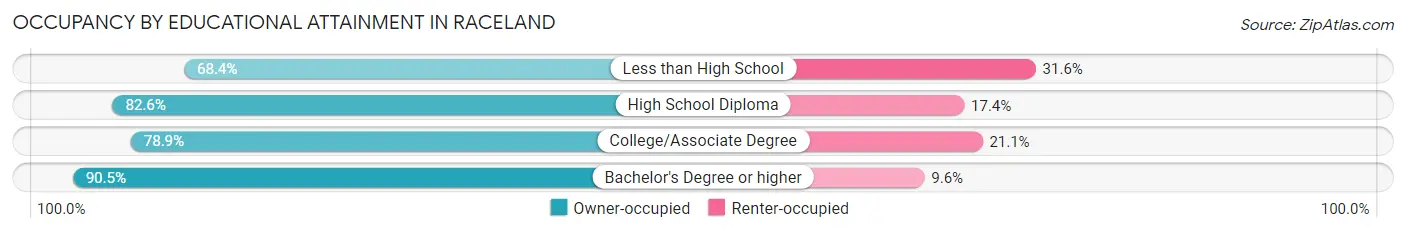
| Household Size | Owner-occupied | Renter-occupied |
| Less than High School | 744 (68.4%) | 344 (31.6%) |
| High School Diploma | 1,326 (82.6%) | 280 (17.4%) |
| College/Associate Degree | 764 (78.9%) | 204 (21.1%) |
| Bachelor's Degree or higher | 559 (90.4%) | 59 (9.6%) |
Occupancy by Age of Householder in Raceland
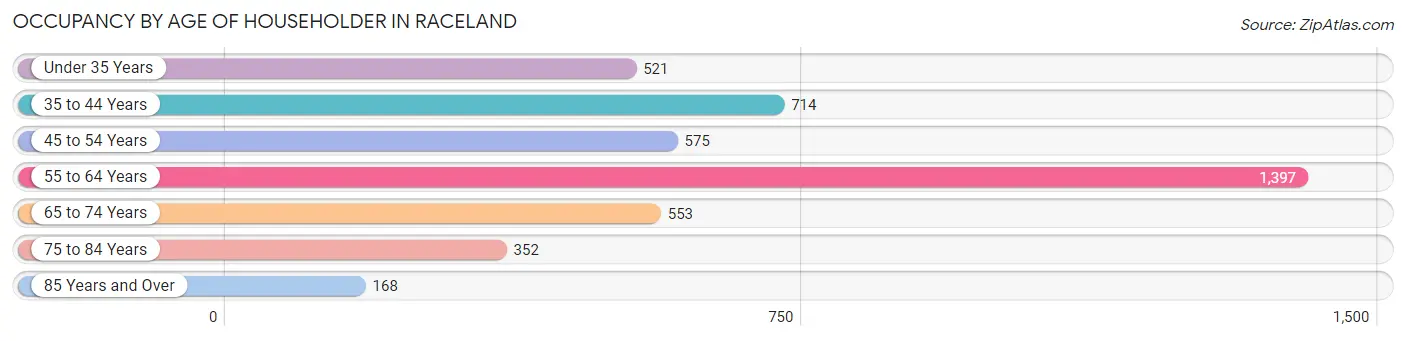
| Age Bracket | # Households | % Households |
| Under 35 Years | 521 | 12.2% |
| 35 to 44 Years | 714 | 16.7% |
| 45 to 54 Years | 575 | 13.4% |
| 55 to 64 Years | 1,397 | 32.6% |
| 65 to 74 Years | 553 | 12.9% |
| 75 to 84 Years | 352 | 8.2% |
| 85 Years and Over | 168 | 3.9% |
| Total | 4,280 | 100.0% |
Housing Finances in Raceland
Median Income by Occupancy in Raceland
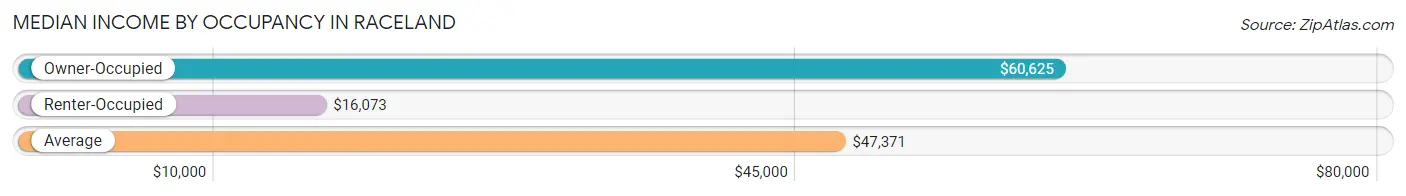
| Occupancy Type | # Households | Median Income |
| Owner-Occupied | 3,393 (79.3%) | $60,625 |
| Renter-Occupied | 887 (20.7%) | $16,073 |
| Average | 4,280 (100.0%) | $47,371 |
Occupancy by Householder Income Bracket in Raceland
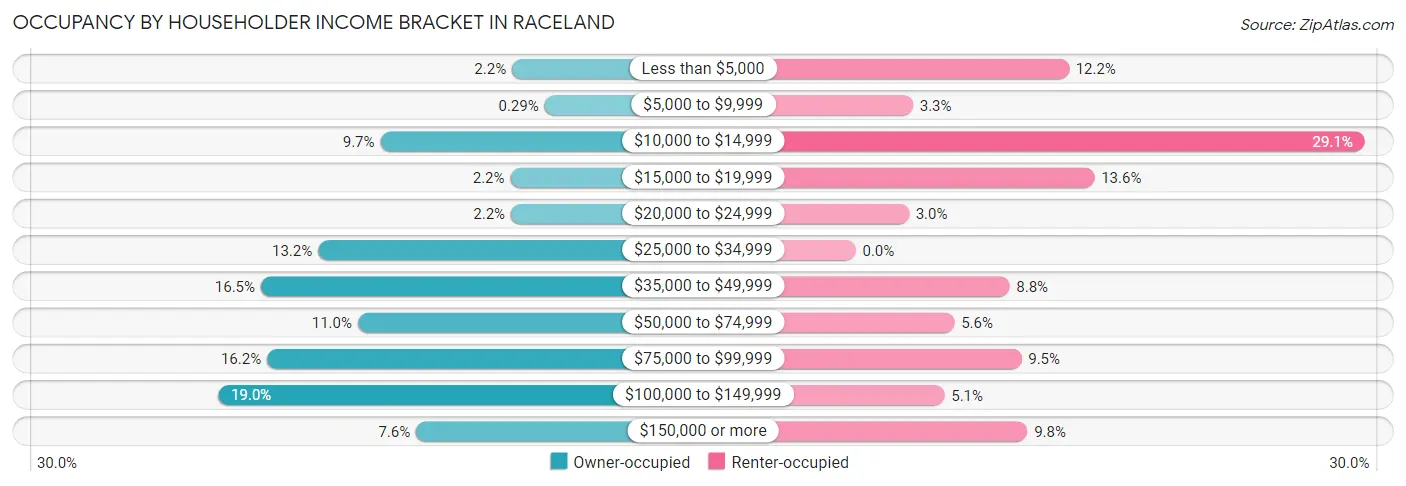
| Income Bracket | Owner-occupied | Renter-occupied |
| Less than $5,000 | 73 (2.1%) | 108 (12.2%) |
| $5,000 to $9,999 | 10 (0.3%) | 29 (3.3%) |
| $10,000 to $14,999 | 328 (9.7%) | 258 (29.1%) |
| $15,000 to $19,999 | 76 (2.2%) | 121 (13.6%) |
| $20,000 to $24,999 | 75 (2.2%) | 27 (3.0%) |
| $25,000 to $34,999 | 449 (13.2%) | 0 (0.0%) |
| $35,000 to $49,999 | 560 (16.5%) | 78 (8.8%) |
| $50,000 to $74,999 | 372 (11.0%) | 50 (5.6%) |
| $75,000 to $99,999 | 548 (16.2%) | 84 (9.5%) |
| $100,000 to $149,999 | 643 (19.0%) | 45 (5.1%) |
| $150,000 or more | 259 (7.6%) | 87 (9.8%) |
| Total | 3,393 (100.0%) | 887 (100.0%) |
Monthly Housing Cost Tiers in Raceland
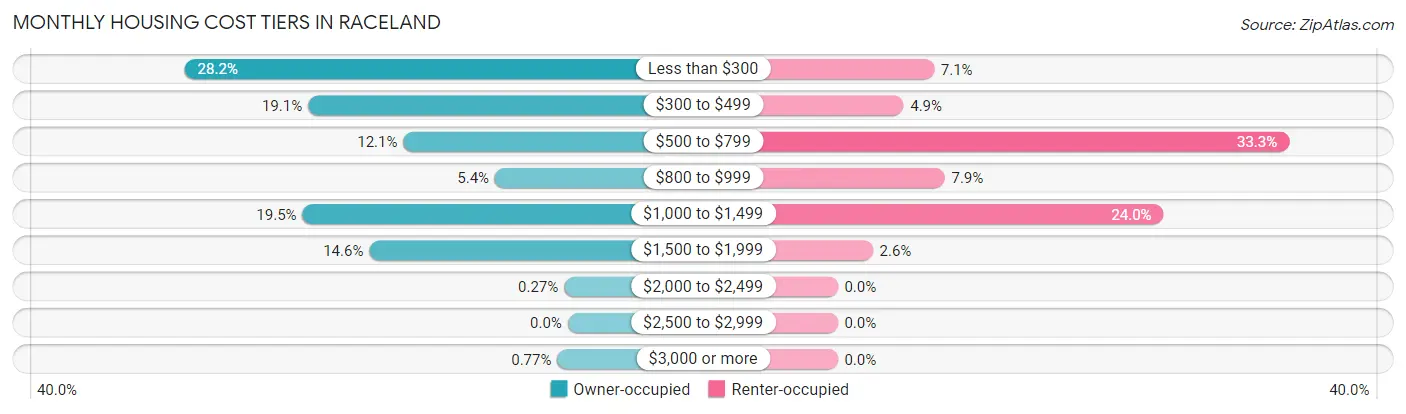
| Monthly Cost | Owner-occupied | Renter-occupied |
| Less than $300 | 957 (28.2%) | 63 (7.1%) |
| $300 to $499 | 649 (19.1%) | 43 (4.9%) |
| $500 to $799 | 411 (12.1%) | 295 (33.3%) |
| $800 to $999 | 182 (5.4%) | 70 (7.9%) |
| $1,000 to $1,499 | 663 (19.5%) | 213 (24.0%) |
| $1,500 to $1,999 | 496 (14.6%) | 23 (2.6%) |
| $2,000 to $2,499 | 9 (0.3%) | 0 (0.0%) |
| $2,500 to $2,999 | 0 (0.0%) | 0 (0.0%) |
| $3,000 or more | 26 (0.8%) | 0 (0.0%) |
| Total | 3,393 (100.0%) | 887 (100.0%) |
Physical Housing Characteristics in Raceland
Housing Structures in Raceland
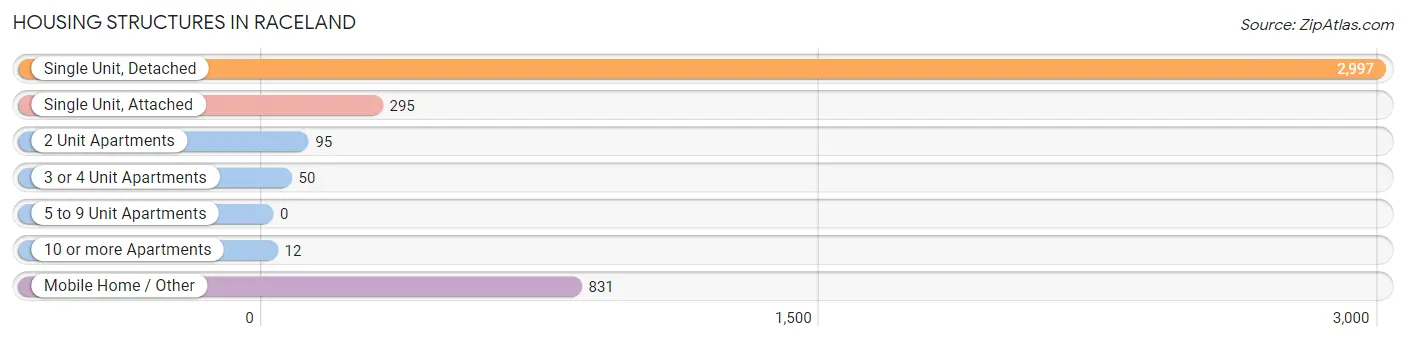
| Structure Type | # Housing Units | % Housing Units |
| Single Unit, Detached | 2,997 | 70.0% |
| Single Unit, Attached | 295 | 6.9% |
| 2 Unit Apartments | 95 | 2.2% |
| 3 or 4 Unit Apartments | 50 | 1.2% |
| 5 to 9 Unit Apartments | 0 | 0.0% |
| 10 or more Apartments | 12 | 0.3% |
| Mobile Home / Other | 831 | 19.4% |
| Total | 4,280 | 100.0% |
Housing Structures by Occupancy in Raceland
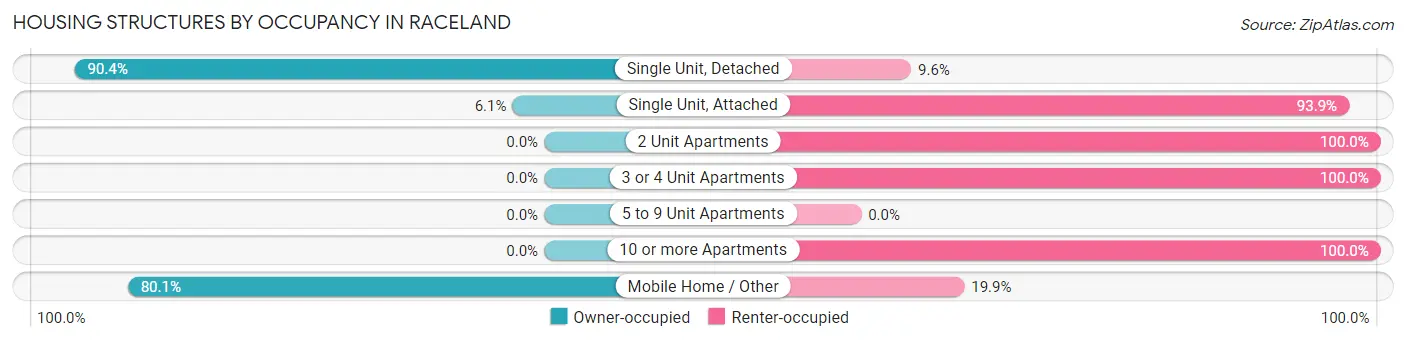
| Structure Type | Owner-occupied | Renter-occupied |
| Single Unit, Detached | 2,709 (90.4%) | 288 (9.6%) |
| Single Unit, Attached | 18 (6.1%) | 277 (93.9%) |
| 2 Unit Apartments | 0 (0.0%) | 95 (100.0%) |
| 3 or 4 Unit Apartments | 0 (0.0%) | 50 (100.0%) |
| 5 to 9 Unit Apartments | 0 (0.0%) | 0 (0.0%) |
| 10 or more Apartments | 0 (0.0%) | 12 (100.0%) |
| Mobile Home / Other | 666 (80.1%) | 165 (19.9%) |
| Total | 3,393 (79.3%) | 887 (20.7%) |
Housing Structures by Number of Rooms in Raceland
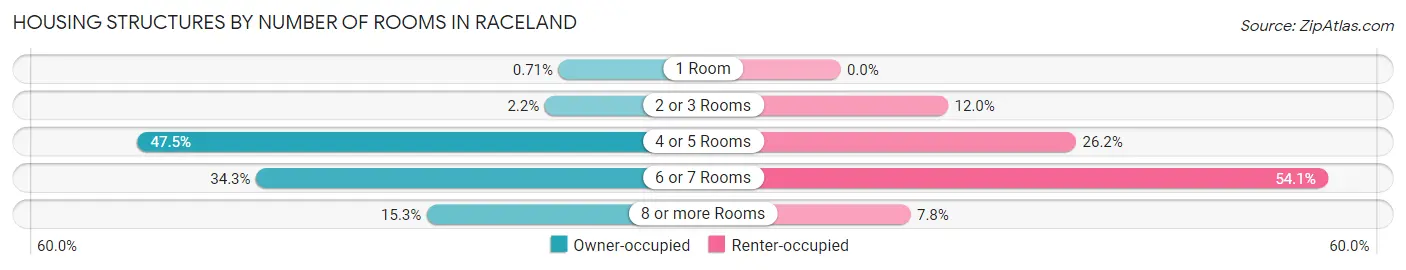
| Number of Rooms | Owner-occupied | Renter-occupied |
| 1 Room | 24 (0.7%) | 0 (0.0%) |
| 2 or 3 Rooms | 76 (2.2%) | 106 (11.9%) |
| 4 or 5 Rooms | 1,610 (47.4%) | 232 (26.2%) |
| 6 or 7 Rooms | 1,163 (34.3%) | 480 (54.1%) |
| 8 or more Rooms | 520 (15.3%) | 69 (7.8%) |
| Total | 3,393 (100.0%) | 887 (100.0%) |
Housing Structure by Heating Type in Raceland
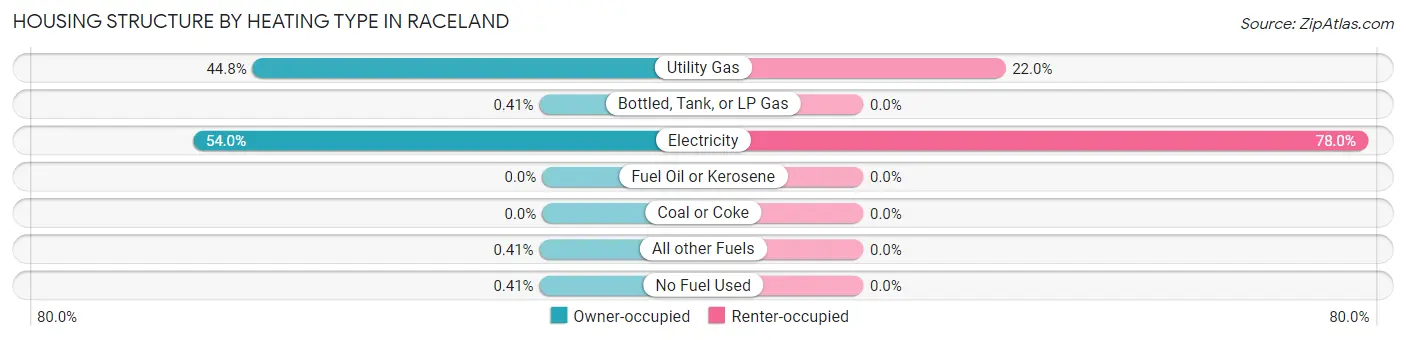
| Heating Type | Owner-occupied | Renter-occupied |
| Utility Gas | 1,519 (44.8%) | 195 (22.0%) |
| Bottled, Tank, or LP Gas | 14 (0.4%) | 0 (0.0%) |
| Electricity | 1,832 (54.0%) | 692 (78.0%) |
| Fuel Oil or Kerosene | 0 (0.0%) | 0 (0.0%) |
| Coal or Coke | 0 (0.0%) | 0 (0.0%) |
| All other Fuels | 14 (0.4%) | 0 (0.0%) |
| No Fuel Used | 14 (0.4%) | 0 (0.0%) |
| Total | 3,393 (100.0%) | 887 (100.0%) |
Household Vehicle Usage in Raceland
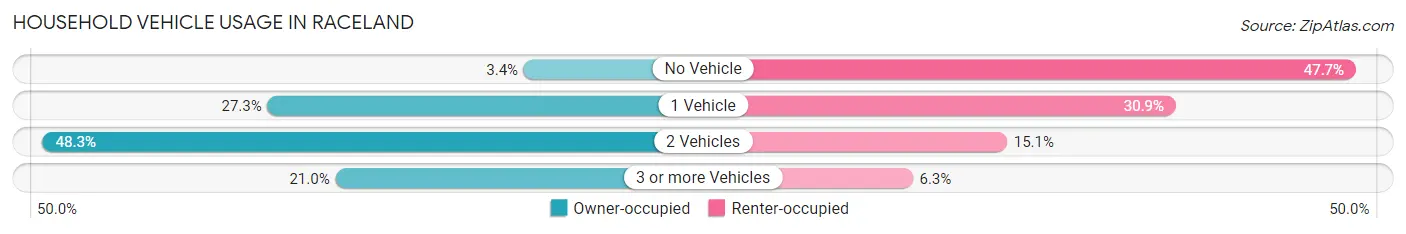
| Vehicles per Household | Owner-occupied | Renter-occupied |
| No Vehicle | 115 (3.4%) | 423 (47.7%) |
| 1 Vehicle | 927 (27.3%) | 274 (30.9%) |
| 2 Vehicles | 1,639 (48.3%) | 134 (15.1%) |
| 3 or more Vehicles | 712 (21.0%) | 56 (6.3%) |
| Total | 3,393 (100.0%) | 887 (100.0%) |
Real Estate & Mortgages in Raceland
Real Estate and Mortgage Overview in Raceland
| Characteristic | Without Mortgage | With Mortgage |
| Housing Units | 1,959 | 1,434 |
| Median Property Value | $110,400 | $172,400 |
| Median Household Income | $40,876 | $204 |
| Monthly Housing Costs | $305 | $16 |
| Real Estate Taxes | $488 | $338 |
Property Value by Mortgage Status in Raceland
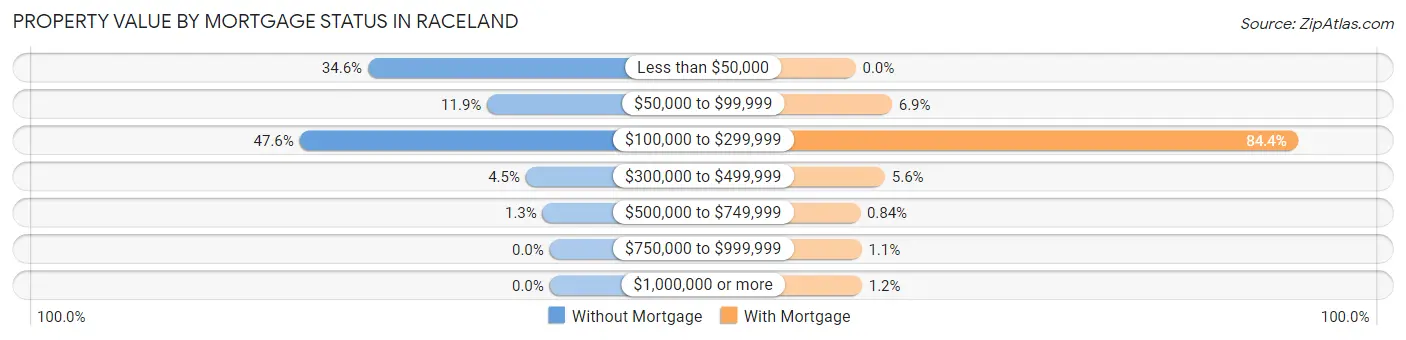
| Property Value | Without Mortgage | With Mortgage |
| Less than $50,000 | 678 (34.6%) | 0 (0.0%) |
| $50,000 to $99,999 | 233 (11.9%) | 99 (6.9%) |
| $100,000 to $299,999 | 933 (47.6%) | 1,210 (84.4%) |
| $300,000 to $499,999 | 89 (4.5%) | 80 (5.6%) |
| $500,000 to $749,999 | 26 (1.3%) | 12 (0.8%) |
| $750,000 to $999,999 | 0 (0.0%) | 16 (1.1%) |
| $1,000,000 or more | 0 (0.0%) | 17 (1.2%) |
| Total | 1,959 (100.0%) | 1,434 (100.0%) |
Household Income by Mortgage Status in Raceland
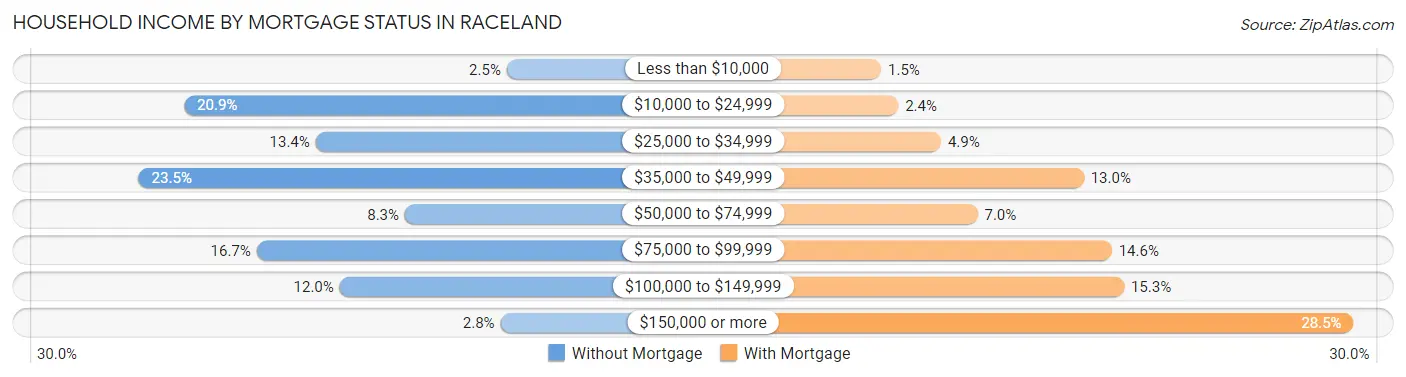
| Household Income | Without Mortgage | With Mortgage |
| Less than $10,000 | 48 (2.5%) | 21 (1.5%) |
| $10,000 to $24,999 | 409 (20.9%) | 35 (2.4%) |
| $25,000 to $34,999 | 262 (13.4%) | 70 (4.9%) |
| $35,000 to $49,999 | 460 (23.5%) | 187 (13.0%) |
| $50,000 to $74,999 | 162 (8.3%) | 100 (7.0%) |
| $75,000 to $99,999 | 328 (16.7%) | 210 (14.6%) |
| $100,000 to $149,999 | 235 (12.0%) | 220 (15.3%) |
| $150,000 or more | 55 (2.8%) | 408 (28.4%) |
| Total | 1,959 (100.0%) | 1,434 (100.0%) |
Property Value to Household Income Ratio in Raceland
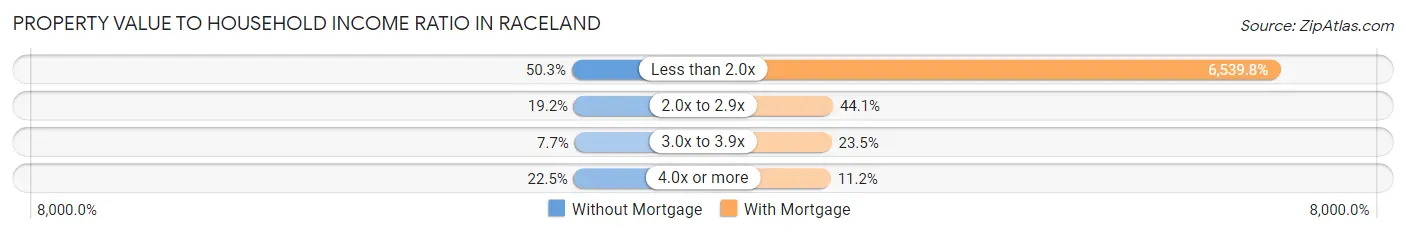
| Value-to-Income Ratio | Without Mortgage | With Mortgage |
| Less than 2.0x | 985 (50.3%) | 93,780 (6,539.7%) |
| 2.0x to 2.9x | 377 (19.2%) | 632 (44.1%) |
| 3.0x to 3.9x | 150 (7.7%) | 337 (23.5%) |
| 4.0x or more | 441 (22.5%) | 161 (11.2%) |
| Total | 1,959 (100.0%) | 1,434 (100.0%) |
Real Estate Taxes by Mortgage Status in Raceland
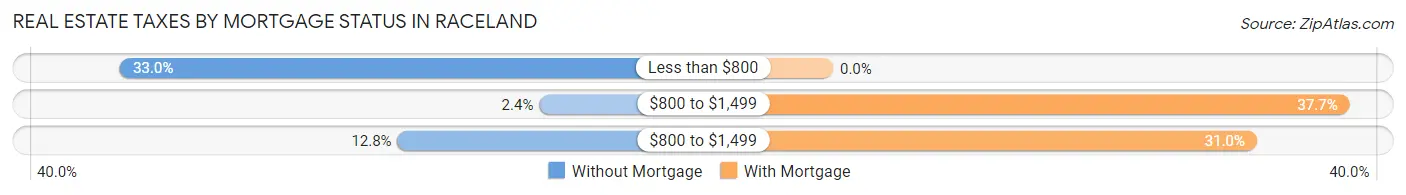
| Property Taxes | Without Mortgage | With Mortgage |
| Less than $800 | 647 (33.0%) | 0 (0.0%) |
| $800 to $1,499 | 47 (2.4%) | 541 (37.7%) |
| $800 to $1,499 | 250 (12.8%) | 444 (31.0%) |
| Total | 1,959 (100.0%) | 1,434 (100.0%) |
Health & Disability in Raceland
Health Insurance Coverage by Age in Raceland
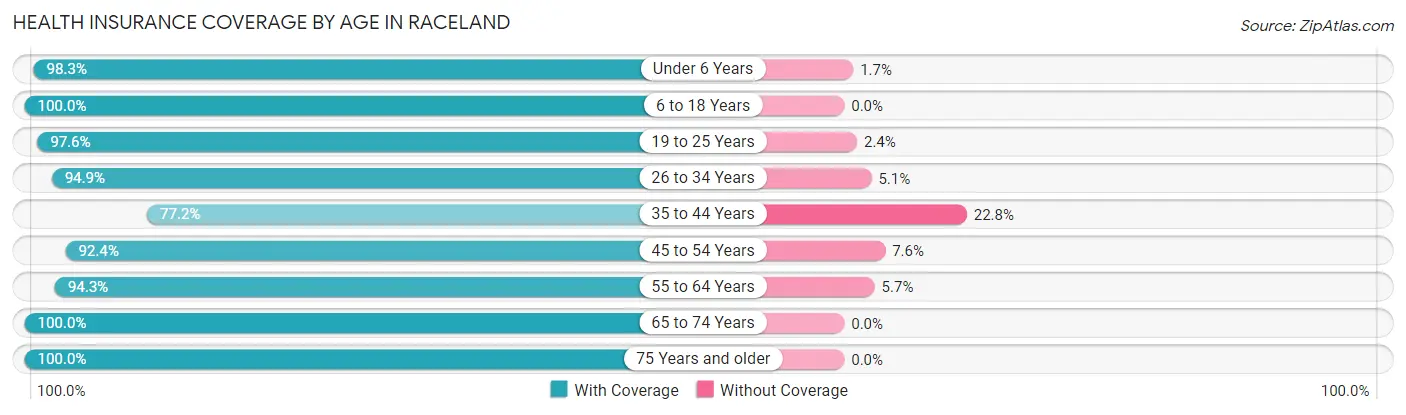
| Age Bracket | With Coverage | Without Coverage |
| Under 6 Years | 707 (98.3%) | 12 (1.7%) |
| 6 to 18 Years | 1,772 (100.0%) | 0 (0.0%) |
| 19 to 25 Years | 698 (97.6%) | 17 (2.4%) |
| 26 to 34 Years | 825 (94.9%) | 44 (5.1%) |
| 35 to 44 Years | 1,186 (77.2%) | 351 (22.8%) |
| 45 to 54 Years | 1,526 (92.4%) | 126 (7.6%) |
| 55 to 64 Years | 2,000 (94.3%) | 120 (5.7%) |
| 65 to 74 Years | 921 (100.0%) | 0 (0.0%) |
| 75 Years and older | 727 (100.0%) | 0 (0.0%) |
| Total | 10,362 (93.9%) | 670 (6.1%) |
Health Insurance Coverage by Citizenship Status in Raceland
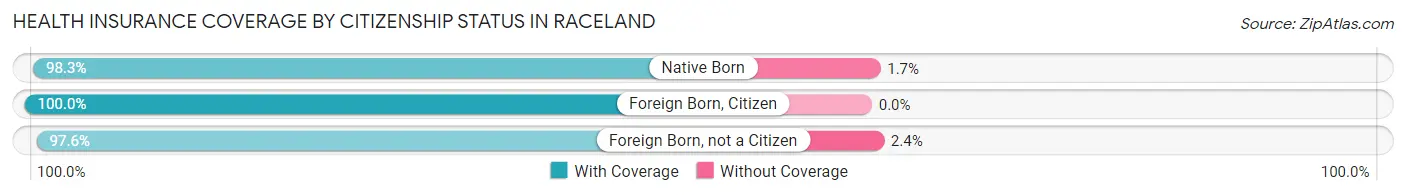
| Citizenship Status | With Coverage | Without Coverage |
| Native Born | 707 (98.3%) | 12 (1.7%) |
| Foreign Born, Citizen | 1,772 (100.0%) | 0 (0.0%) |
| Foreign Born, not a Citizen | 698 (97.6%) | 17 (2.4%) |
Health Insurance Coverage by Household Income in Raceland
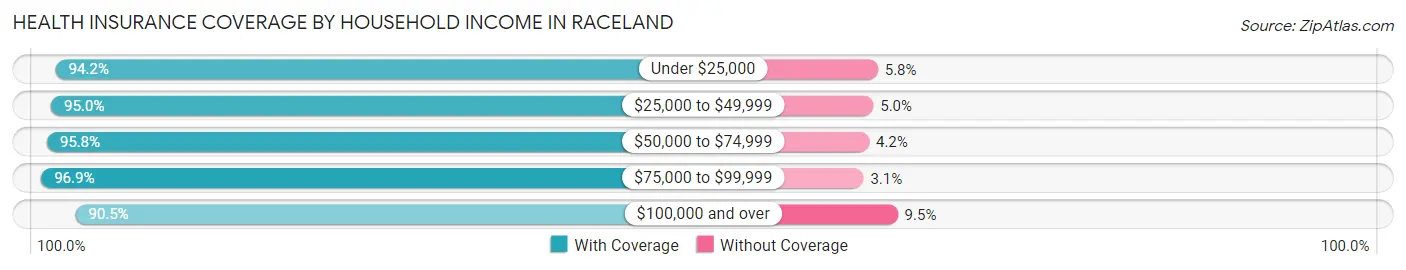
| Household Income | With Coverage | Without Coverage |
| Under $25,000 | 1,882 (94.2%) | 116 (5.8%) |
| $25,000 to $49,999 | 2,797 (95.0%) | 146 (5.0%) |
| $50,000 to $74,999 | 1,240 (95.8%) | 54 (4.2%) |
| $75,000 to $99,999 | 1,555 (96.9%) | 50 (3.1%) |
| $100,000 and over | 2,878 (90.5%) | 303 (9.5%) |
Public vs Private Health Insurance Coverage by Age in Raceland
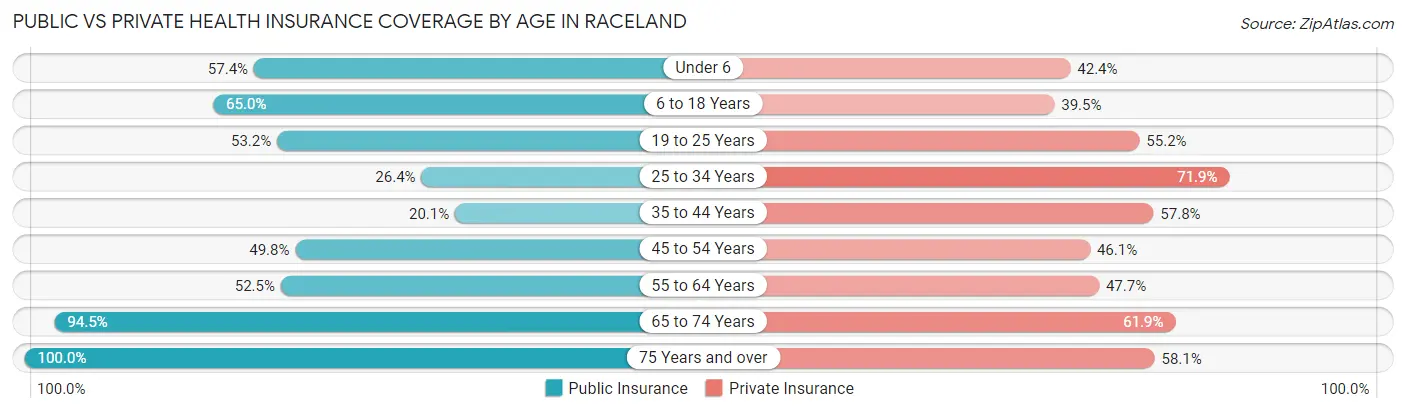
| Age Bracket | Public Insurance | Private Insurance |
| Under 6 | 413 (57.4%) | 305 (42.4%) |
| 6 to 18 Years | 1,152 (65.0%) | 699 (39.5%) |
| 19 to 25 Years | 380 (53.1%) | 395 (55.2%) |
| 25 to 34 Years | 229 (26.4%) | 625 (71.9%) |
| 35 to 44 Years | 309 (20.1%) | 889 (57.8%) |
| 45 to 54 Years | 822 (49.8%) | 761 (46.1%) |
| 55 to 64 Years | 1,112 (52.4%) | 1,012 (47.7%) |
| 65 to 74 Years | 870 (94.5%) | 570 (61.9%) |
| 75 Years and over | 727 (100.0%) | 422 (58.1%) |
| Total | 6,014 (54.5%) | 5,678 (51.5%) |
Disability Status by Sex by Age in Raceland
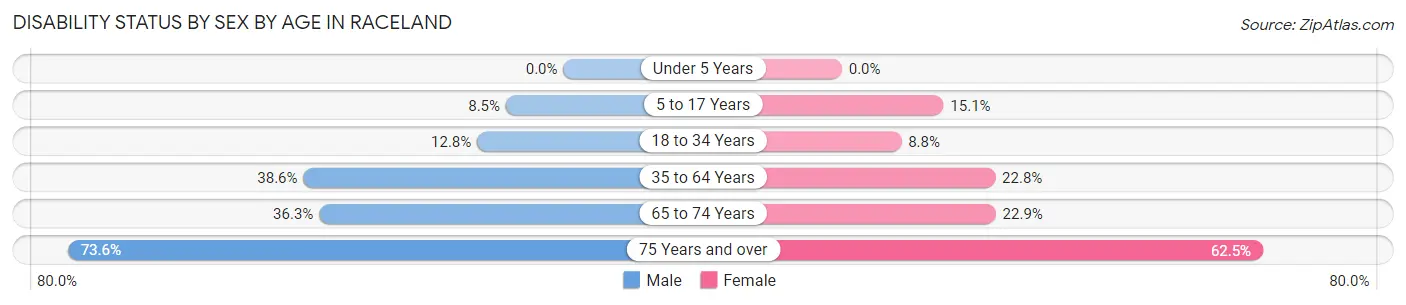
| Age Bracket | Male | Female |
| Under 5 Years | 0 (0.0%) | 0 (0.0%) |
| 5 to 17 Years | 84 (8.5%) | 124 (15.1%) |
| 18 to 34 Years | 92 (12.8%) | 85 (8.8%) |
| 35 to 64 Years | 1,039 (38.6%) | 596 (22.8%) |
| 65 to 74 Years | 161 (36.3%) | 109 (22.9%) |
| 75 Years and over | 209 (73.6%) | 277 (62.5%) |
Disability Class by Sex by Age in Raceland
Disability Class: Hearing Difficulty
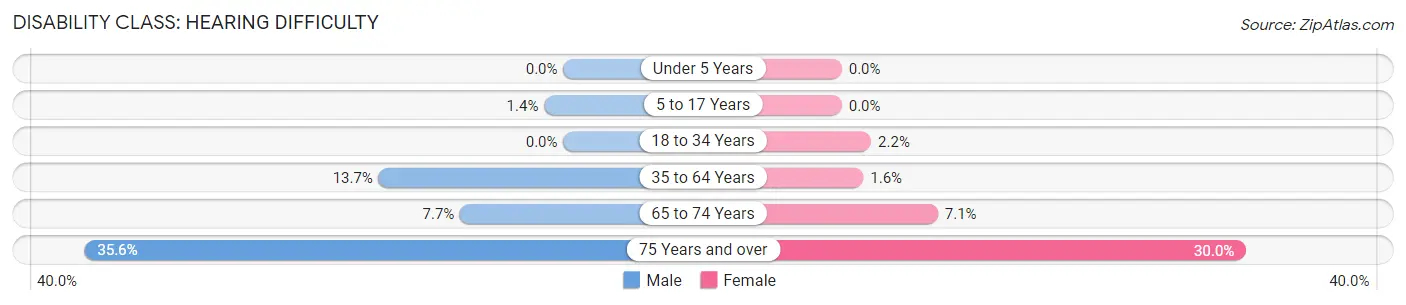
| Age Bracket | Male | Female |
| Under 5 Years | 0 (0.0%) | 0 (0.0%) |
| 5 to 17 Years | 14 (1.4%) | 0 (0.0%) |
| 18 to 34 Years | 0 (0.0%) | 21 (2.2%) |
| 35 to 64 Years | 369 (13.7%) | 42 (1.6%) |
| 65 to 74 Years | 34 (7.7%) | 34 (7.1%) |
| 75 Years and over | 101 (35.6%) | 133 (30.0%) |
Disability Class: Vision Difficulty
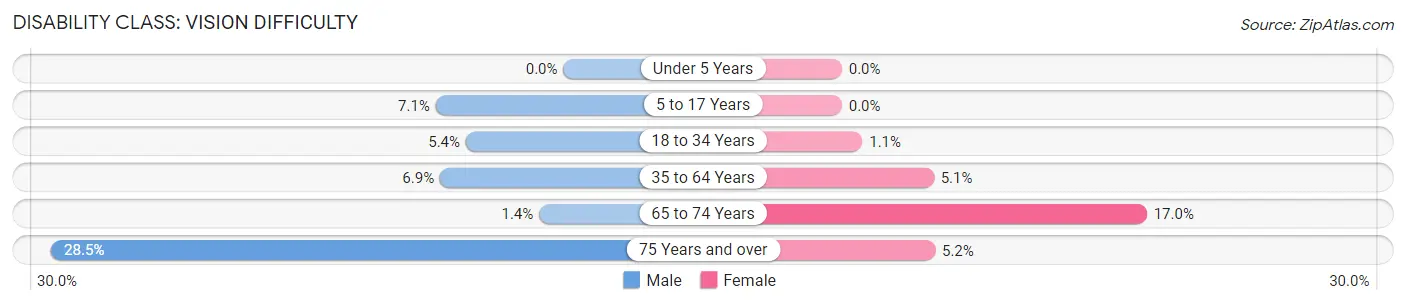
| Age Bracket | Male | Female |
| Under 5 Years | 0 (0.0%) | 0 (0.0%) |
| 5 to 17 Years | 70 (7.1%) | 0 (0.0%) |
| 18 to 34 Years | 39 (5.4%) | 11 (1.1%) |
| 35 to 64 Years | 185 (6.9%) | 134 (5.1%) |
| 65 to 74 Years | 6 (1.3%) | 81 (17.0%) |
| 75 Years and over | 81 (28.5%) | 23 (5.2%) |
Disability Class: Cognitive Difficulty
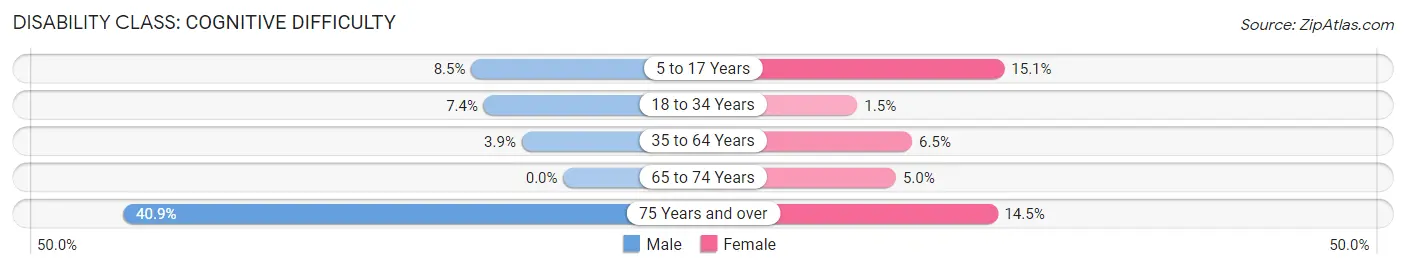
| Age Bracket | Male | Female |
| 5 to 17 Years | 84 (8.5%) | 124 (15.1%) |
| 18 to 34 Years | 53 (7.4%) | 14 (1.5%) |
| 35 to 64 Years | 104 (3.9%) | 171 (6.5%) |
| 65 to 74 Years | 0 (0.0%) | 24 (5.0%) |
| 75 Years and over | 116 (40.8%) | 64 (14.4%) |
Disability Class: Ambulatory Difficulty
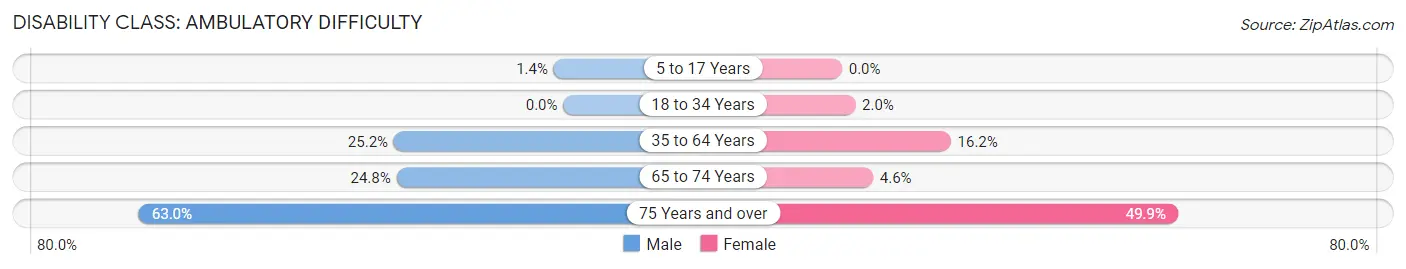
| Age Bracket | Male | Female |
| 5 to 17 Years | 14 (1.4%) | 0 (0.0%) |
| 18 to 34 Years | 0 (0.0%) | 19 (2.0%) |
| 35 to 64 Years | 677 (25.2%) | 423 (16.2%) |
| 65 to 74 Years | 110 (24.8%) | 22 (4.6%) |
| 75 Years and over | 179 (63.0%) | 221 (49.9%) |
Disability Class: Self-Care Difficulty
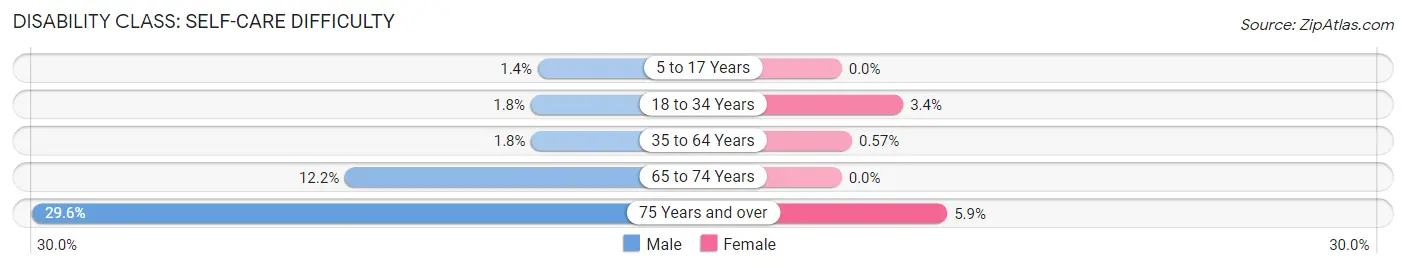
| Age Bracket | Male | Female |
| 5 to 17 Years | 14 (1.4%) | 0 (0.0%) |
| 18 to 34 Years | 13 (1.8%) | 33 (3.4%) |
| 35 to 64 Years | 48 (1.8%) | 15 (0.6%) |
| 65 to 74 Years | 54 (12.2%) | 0 (0.0%) |
| 75 Years and over | 84 (29.6%) | 26 (5.9%) |
Technology Access in Raceland
Computing Device Access in Raceland
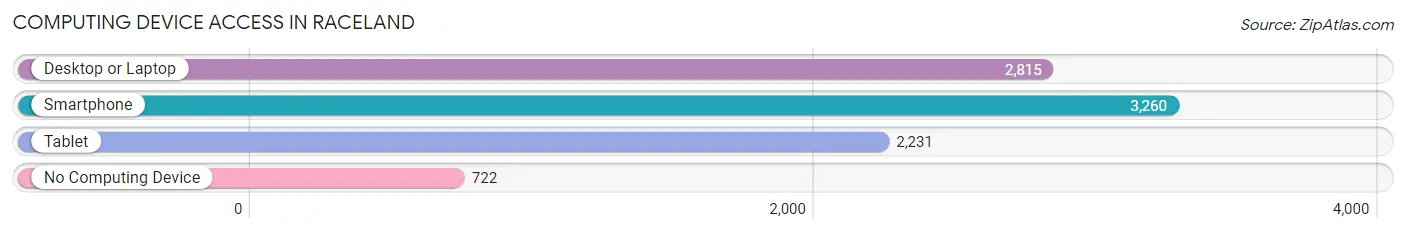
| Device Type | # Households | % Households |
| Desktop or Laptop | 2,815 | 65.8% |
| Smartphone | 3,260 | 76.2% |
| Tablet | 2,231 | 52.1% |
| No Computing Device | 722 | 16.9% |
| Total | 4,280 | 100.0% |
Internet Access in Raceland
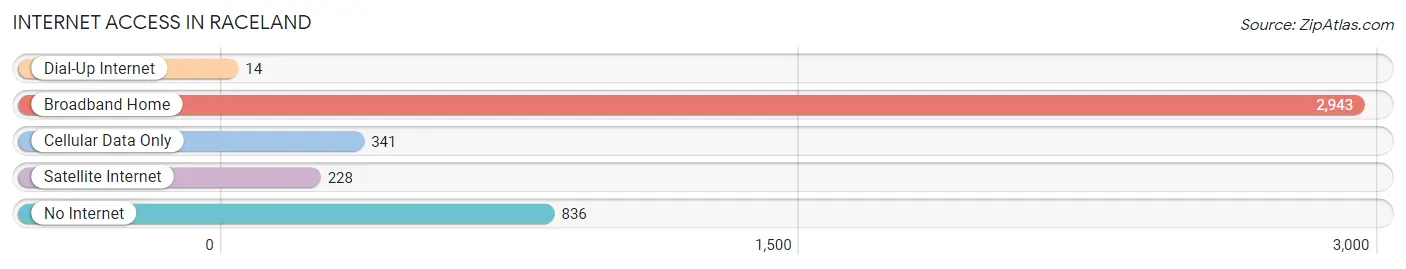
| Internet Type | # Households | % Households |
| Dial-Up Internet | 14 | 0.3% |
| Broadband Home | 2,943 | 68.8% |
| Cellular Data Only | 341 | 8.0% |
| Satellite Internet | 228 | 5.3% |
| No Internet | 836 | 19.5% |
| Total | 4,280 | 100.0% |
Raceland Summary
Raceland is a small town located in Lafourche Parish, Louisiana. It is situated on the banks of Bayou Lafourche, approximately 20 miles south of Thibodaux and 25 miles northwest of Houma. The town has a population of approximately 5,000 people and is part of the Houma-Thibodaux Metropolitan Statistical Area.
History
Raceland was founded in 1883 by the Raceland Land and Improvement Company. The company was formed by a group of investors from New Orleans who purchased the land from the local Native American tribes. The town was named after the racetrack that was built in the area. The racetrack was used for horse racing and other events.
In the early 1900s, Raceland was a thriving community with a variety of businesses, including a sawmill, a cotton gin, a grist mill, and a brickyard. The town also had a hotel, a bank, and a post office.
In the 1950s, the town began to decline as the local economy shifted away from agriculture and towards oil and gas production. The decline continued into the 1970s, when the town was hit hard by the oil crisis.
Geography
Raceland is located in the southeastern part of Louisiana, in Lafourche Parish. It is situated on the banks of Bayou Lafourche, approximately 20 miles south of Thibodaux and 25 miles northwest of Houma. The town is located at an elevation of 8 feet above sea level.
The climate in Raceland is humid subtropical, with hot, humid summers and mild winters. The average annual temperature is 68°F, and the average annual precipitation is 62 inches.
Economy
Raceland’s economy is largely based on oil and gas production, as well as agriculture. The town is home to several oil and gas companies, including Chevron, Shell, and ExxonMobil. The town also has a number of agricultural businesses, including sugar cane and crawfish farms.
In addition, Raceland is home to a number of small businesses, including restaurants, retail stores, and service providers. The town also has a number of manufacturing companies, including a paper mill and a plastics plant.
Demographics
As of the 2010 census, Raceland had a population of 5,000 people. The racial makeup of the town was 79.2% White, 17.2% African American, 0.7% Native American, 0.7% Asian, 0.2% Pacific Islander, and 1.9% from other races. The median household income was $37,500, and the median family income was $45,000.
Raceland is served by the Lafourche Parish School District. The town has two public schools, Raceland Elementary School and Raceland Middle School. The town also has a number of private schools, including St. Mary’s Catholic School and Raceland Christian Academy.
Common Questions
What is Per Capita Income in Raceland?
Per Capita income in Raceland is $27,487.
What is the Median Family Income in Raceland?
Median Family Income in Raceland is $67,500.
What is the Median Household income in Raceland?
Median Household Income in Raceland is $47,371.
What is Income or Wage Gap in Raceland?
Income or Wage Gap in Raceland is 52.9%.
Women in Raceland earn 47.1 cents for every dollar earned by a man.
What is Inequality or Gini Index in Raceland?
Inequality or Gini Index in Raceland is 0.45.
What is the Total Population of Raceland?
Total Population of Raceland is 11,094.
What is the Total Male Population of Raceland?
Total Male Population of Raceland is 5,455.
What is the Total Female Population of Raceland?
Total Female Population of Raceland is 5,639.
What is the Ratio of Males per 100 Females in Raceland?
There are 96.74 Males per 100 Females in Raceland.
What is the Ratio of Females per 100 Males in Raceland?
There are 103.37 Females per 100 Males in Raceland.
What is the Median Population Age in Raceland?
Median Population Age in Raceland is 44.5 Years.
What is the Average Family Size in Raceland
Average Family Size in Raceland is 3.1 People.
What is the Average Household Size in Raceland
Average Household Size in Raceland is 2.6 People.
How Large is the Labor Force in Raceland?
There are 4,843 People in the Labor Forcein in Raceland.
What is the Percentage of People in the Labor Force in Raceland?
53.8% of People are in the Labor Force in Raceland.
What is the Unemployment Rate in Raceland?
Unemployment Rate in Raceland is 10.6%.