Pierre Part, LA Map & Demographics
Pierre Part Map
Pierre Part Overview
$34,437
PER CAPITA INCOME
$75,964
AVG FAMILY INCOME
$51,078
AVG HOUSEHOLD INCOME
40.6%
WAGE / INCOME GAP [ % ]
59.4¢/ $1
WAGE / INCOME GAP [ $ ]
$7,566
FAMILY INCOME DEFICIT
0.43
INEQUALITY / GINI INDEX
2,447
TOTAL POPULATION
1,073
MALE POPULATION
1,374
FEMALE POPULATION
78.09
MALES / 100 FEMALES
128.05
FEMALES / 100 MALES
42.5
MEDIAN AGE
3.2
AVG FAMILY SIZE
2.6
AVG HOUSEHOLD SIZE
1,389
LABOR FORCE [ PEOPLE ]
66.0%
PERCENT IN LABOR FORCE
7.5%
UNEMPLOYMENT RATE
Pierre Part Zip Codes
Pierre Part Area Codes
Income in Pierre Part
Income Overview in Pierre Part
Per Capita Income in Pierre Part is $34,437, while median incomes of families and households are $75,964 and $51,078 respectively.
| Characteristic | Number | Measure |
| Per Capita Income | 2,447 | $34,437 |
| Median Family Income | 677 | $75,964 |
| Mean Family Income | 677 | $90,816 |
| Median Household Income | 941 | $51,078 |
| Mean Household Income | 941 | $74,947 |
| Income Deficit | 677 | $7,566 |
| Wage / Income Gap (%) | 2,447 | 40.57% |
| Wage / Income Gap ($) | 2,447 | 59.43¢ per $1 |
| Gini / Inequality Index | 2,447 | 0.43 |
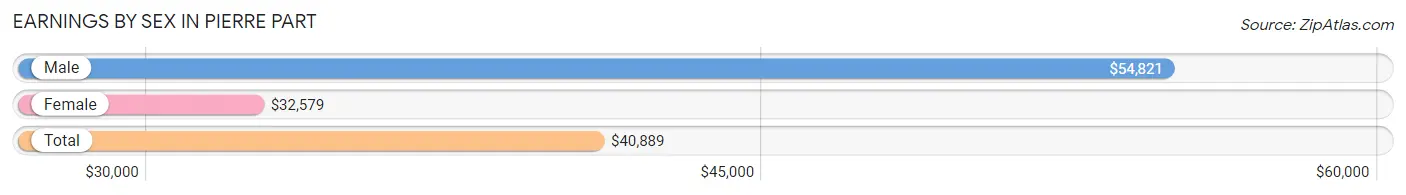
Earnings by Sex in Pierre Part
Average Earnings in Pierre Part are $40,889, $54,821 for men and $32,579 for women, a difference of 40.6%.
| Sex | Number | Average Earnings |
| Male | 702 (50.6%) | $54,821 |
| Female | 686 (49.4%) | $32,579 |
| Total | 1,388 (100.0%) | $40,889 |
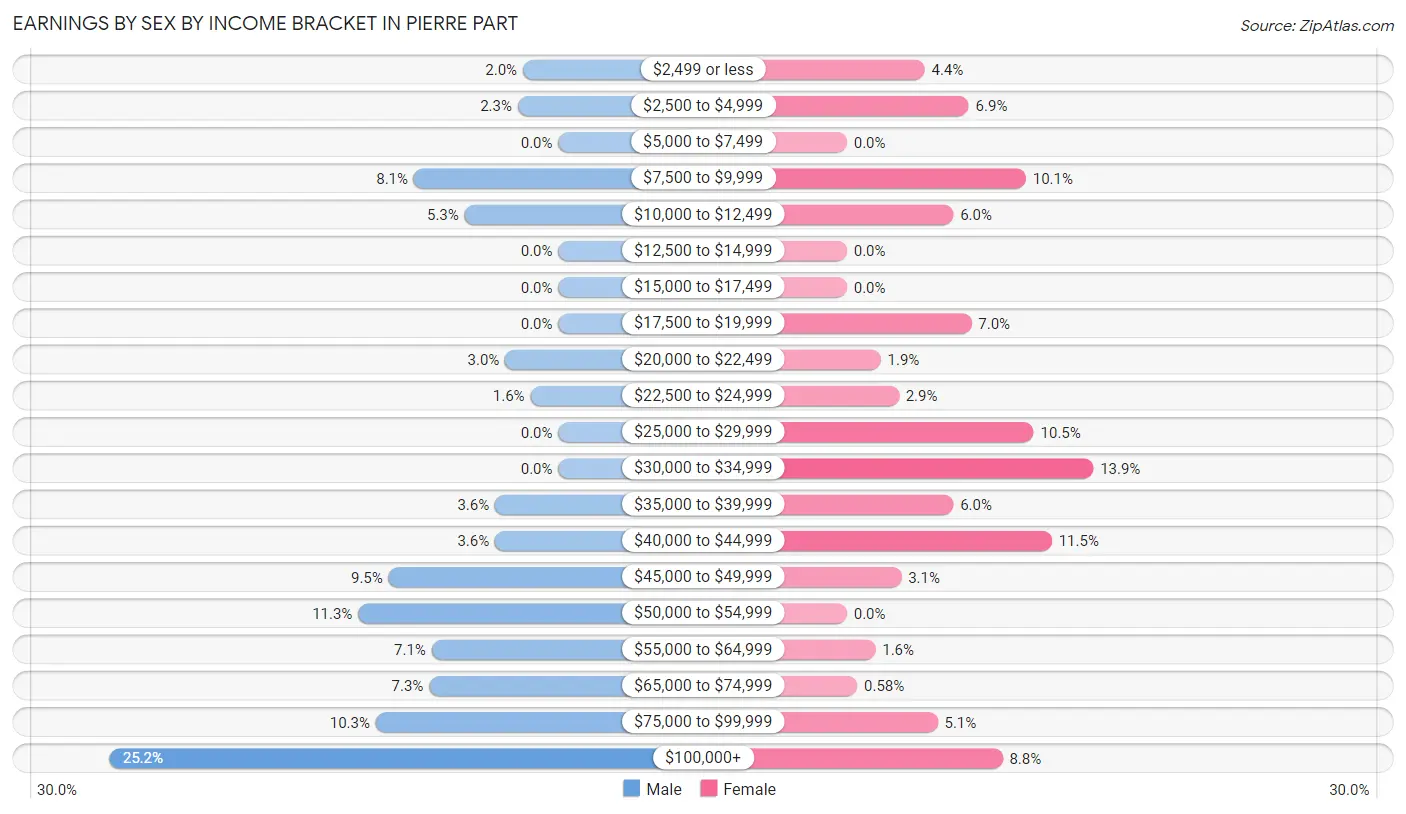
Earnings by Sex by Income Bracket in Pierre Part
The most common earnings brackets in Pierre Part are $100,000+ for men (177 | 25.2%) and $30,000 to $34,999 for women (95 | 13.9%).
| Income | Male | Female |
| $2,499 or less | 14 (2.0%) | 30 (4.4%) |
| $2,500 to $4,999 | 16 (2.3%) | 47 (6.9%) |
| $5,000 to $7,499 | 0 (0.0%) | 0 (0.0%) |
| $7,500 to $9,999 | 57 (8.1%) | 69 (10.1%) |
| $10,000 to $12,499 | 37 (5.3%) | 41 (6.0%) |
| $12,500 to $14,999 | 0 (0.0%) | 0 (0.0%) |
| $15,000 to $17,499 | 0 (0.0%) | 0 (0.0%) |
| $17,500 to $19,999 | 0 (0.0%) | 48 (7.0%) |
| $20,000 to $22,499 | 21 (3.0%) | 13 (1.9%) |
| $22,500 to $24,999 | 11 (1.6%) | 20 (2.9%) |
| $25,000 to $29,999 | 0 (0.0%) | 72 (10.5%) |
| $30,000 to $34,999 | 0 (0.0%) | 95 (13.9%) |
| $35,000 to $39,999 | 25 (3.6%) | 41 (6.0%) |
| $40,000 to $44,999 | 25 (3.6%) | 79 (11.5%) |
| $45,000 to $49,999 | 67 (9.5%) | 21 (3.1%) |
| $50,000 to $54,999 | 79 (11.3%) | 0 (0.0%) |
| $55,000 to $64,999 | 50 (7.1%) | 11 (1.6%) |
| $65,000 to $74,999 | 51 (7.3%) | 4 (0.6%) |
| $75,000 to $99,999 | 72 (10.3%) | 35 (5.1%) |
| $100,000+ | 177 (25.2%) | 60 (8.7%) |
| Total | 702 (100.0%) | 686 (100.0%) |
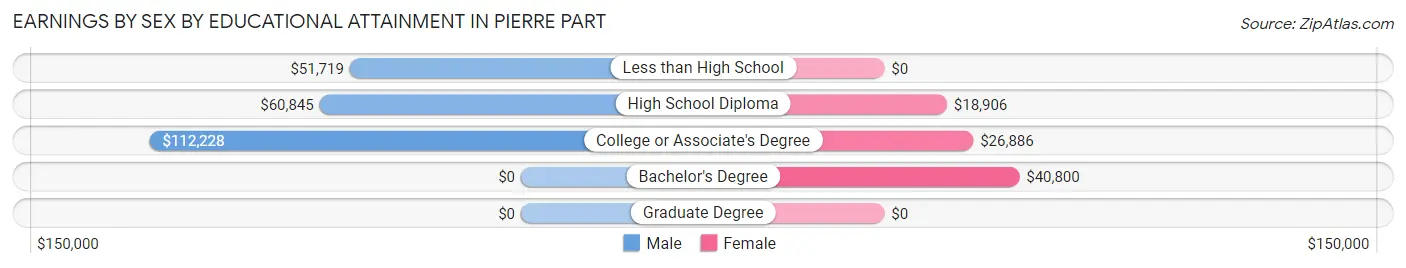
Earnings by Sex by Educational Attainment in Pierre Part
Average earnings in Pierre Part are $60,507 for men and $32,803 for women, a difference of 45.8%. Men with an educational attainment of college or associate's degree enjoy the highest average annual earnings of $112,228, while those with less than high school education earn the least with $51,719. Women with an educational attainment of bachelor's degree earn the most with the average annual earnings of $40,800, while those with high school diploma education have the smallest earnings of $18,906.
| Educational Attainment | Male Income | Female Income |
| Less than High School | $51,719 | $0 |
| High School Diploma | $60,845 | $18,906 |
| College or Associate's Degree | $112,228 | $26,886 |
| Bachelor's Degree | - | - |
| Graduate Degree | - | - |
| Total | $60,507 | $32,803 |
Family Income in Pierre Part
Family Income Brackets in Pierre Part
According to the Pierre Part family income data, there are 215 families falling into the $100,000 to $149,999 income range, which is the most common income bracket and makes up 31.8% of all families.
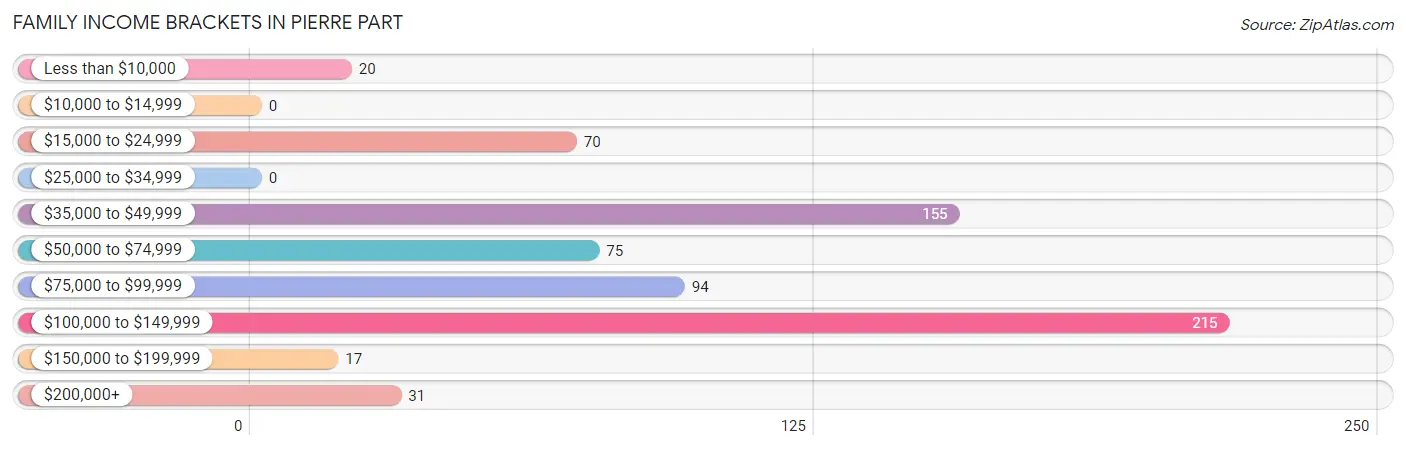
| Income Bracket | # Families | % Families |
| Less than $10,000 | 20 | 3.0% |
| $10,000 to $14,999 | 0 | 0.0% |
| $15,000 to $24,999 | 70 | 10.3% |
| $25,000 to $34,999 | 0 | 0.0% |
| $35,000 to $49,999 | 155 | 22.9% |
| $50,000 to $74,999 | 75 | 11.1% |
| $75,000 to $99,999 | 94 | 13.9% |
| $100,000 to $149,999 | 215 | 31.8% |
| $150,000 to $199,999 | 17 | 2.5% |
| $200,000+ | 31 | 4.6% |
Family Income by Famaliy Size in Pierre Part
3-person families (176 | 26.0%) account for the highest median family income in Pierre Part with $111,250 per family, while 3-person families (176 | 26.0%) have the highest median income of $37,083 per family member.
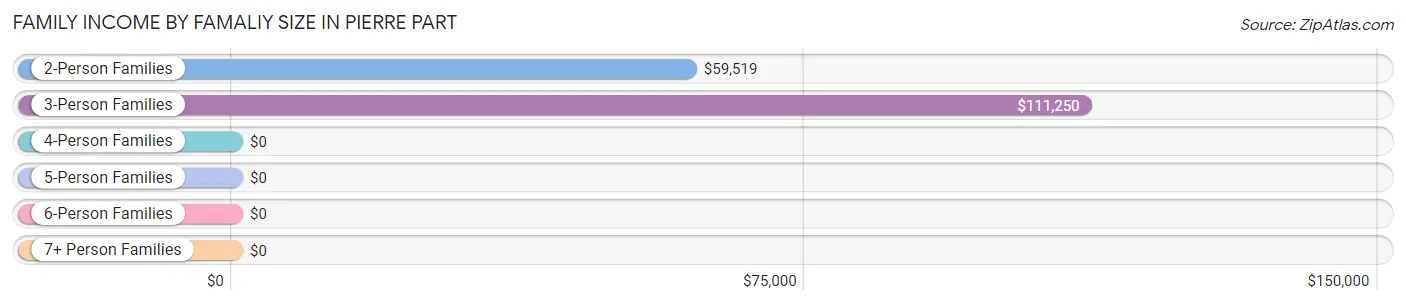
| Income Bracket | # Families | Median Income |
| 2-Person Families | 337 (49.8%) | $59,519 |
| 3-Person Families | 176 (26.0%) | $111,250 |
| 4-Person Families | 124 (18.3%) | $0 |
| 5-Person Families | 0 (0.0%) | $0 |
| 6-Person Families | 40 (5.9%) | $0 |
| 7+ Person Families | 0 (0.0%) | $0 |
| Total | 677 (100.0%) | $75,964 |
Family Income by Number of Earners in Pierre Part
The median family income in Pierre Part is $75,964, with families comprising 3+ earners (165) having the highest median family income of $110,896, while families with no earners (128) have the lowest median family income of $39,911, accounting for 24.4% and 18.9% of families, respectively.
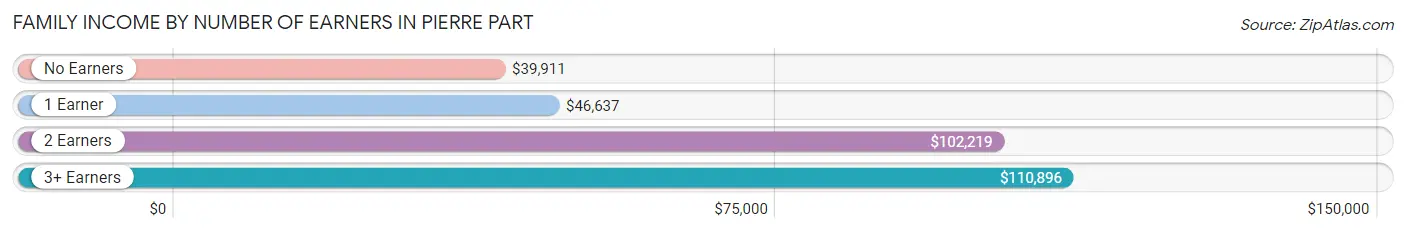
| Number of Earners | # Families | Median Income |
| No Earners | 128 (18.9%) | $39,911 |
| 1 Earner | 219 (32.4%) | $46,637 |
| 2 Earners | 165 (24.4%) | $102,219 |
| 3+ Earners | 165 (24.4%) | $110,896 |
| Total | 677 (100.0%) | $75,964 |
Household Income in Pierre Part
Household Income Brackets in Pierre Part
With 219 households falling in the category, the $100,000 to $149,999 income range is the most frequent in Pierre Part, accounting for 23.3% of all households. In contrast, only 17 households (1.8%) fall into the $150,000 to $199,999 income bracket, making it the least populous group.
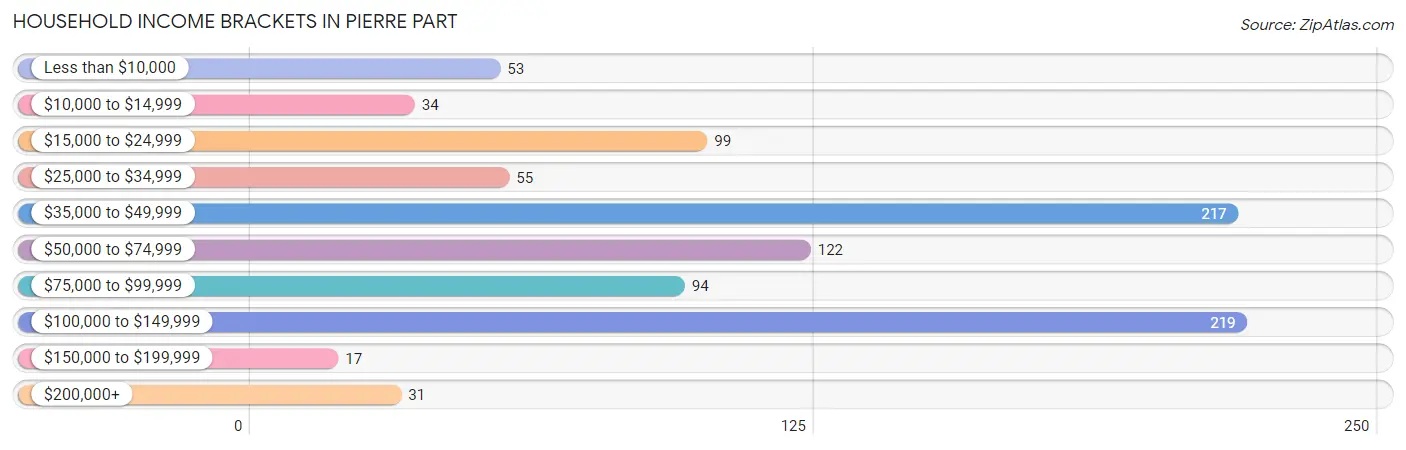
| Income Bracket | # Households | % Households |
| Less than $10,000 | 53 | 5.6% |
| $10,000 to $14,999 | 34 | 3.6% |
| $15,000 to $24,999 | 99 | 10.5% |
| $25,000 to $34,999 | 55 | 5.8% |
| $35,000 to $49,999 | 217 | 23.1% |
| $50,000 to $74,999 | 122 | 13.0% |
| $75,000 to $99,999 | 94 | 10.0% |
| $100,000 to $149,999 | 219 | 23.3% |
| $150,000 to $199,999 | 17 | 1.8% |
| $200,000+ | 31 | 3.3% |
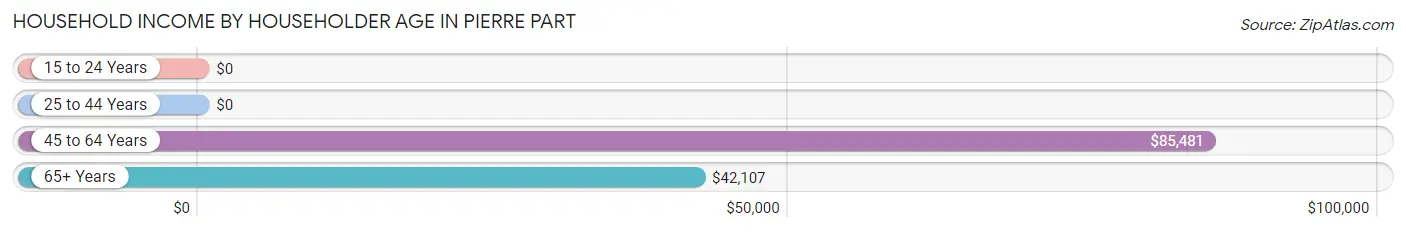
Household Income by Householder Age in Pierre Part
The median household income in Pierre Part is $51,078, with the highest median household income of $85,481 found in the 45 to 64 years age bracket for the primary householder. A total of 401 households (42.6%) fall into this category.
| Income Bracket | # Households | Median Income |
| 15 to 24 Years | 0 (0.0%) | $0 |
| 25 to 44 Years | 297 (31.6%) | $0 |
| 45 to 64 Years | 401 (42.6%) | $85,481 |
| 65+ Years | 243 (25.8%) | $42,107 |
| Total | 941 (100.0%) | $51,078 |
Poverty in Pierre Part
Income Below Poverty by Sex and Age in Pierre Part
With 10.1% poverty level for males and 15.5% for females among the residents of Pierre Part, 45 to 54 year old males and 65 to 74 year old females are the most vulnerable to poverty, with 53 males (69.7%) and 21 females (42.9%) in their respective age groups living below the poverty level.
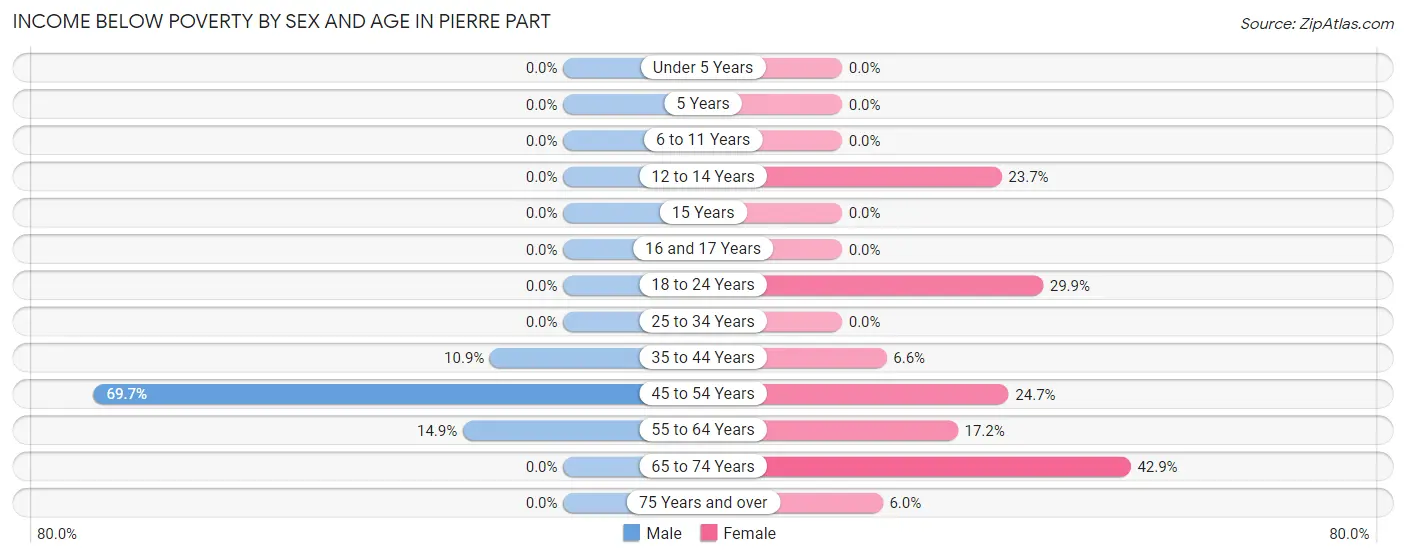
| Age Bracket | Male | Female |
| Under 5 Years | 0 (0.0%) | 0 (0.0%) |
| 5 Years | 0 (0.0%) | 0 (0.0%) |
| 6 to 11 Years | 0 (0.0%) | 0 (0.0%) |
| 12 to 14 Years | 0 (0.0%) | 32 (23.7%) |
| 15 Years | 0 (0.0%) | 0 (0.0%) |
| 16 and 17 Years | 0 (0.0%) | 0 (0.0%) |
| 18 to 24 Years | 0 (0.0%) | 40 (29.8%) |
| 25 to 34 Years | 0 (0.0%) | 0 (0.0%) |
| 35 to 44 Years | 20 (10.9%) | 15 (6.6%) |
| 45 to 54 Years | 53 (69.7%) | 47 (24.7%) |
| 55 to 64 Years | 35 (14.9%) | 49 (17.2%) |
| 65 to 74 Years | 0 (0.0%) | 21 (42.9%) |
| 75 Years and over | 0 (0.0%) | 9 (6.0%) |
| Total | 108 (10.1%) | 213 (15.5%) |
Income Above Poverty by Sex and Age in Pierre Part
According to the poverty statistics in Pierre Part, males aged under 5 years and females aged 6 to 11 years are the age groups that are most secure financially, with 100.0% of males and 100.0% of females in these age groups living above the poverty line.
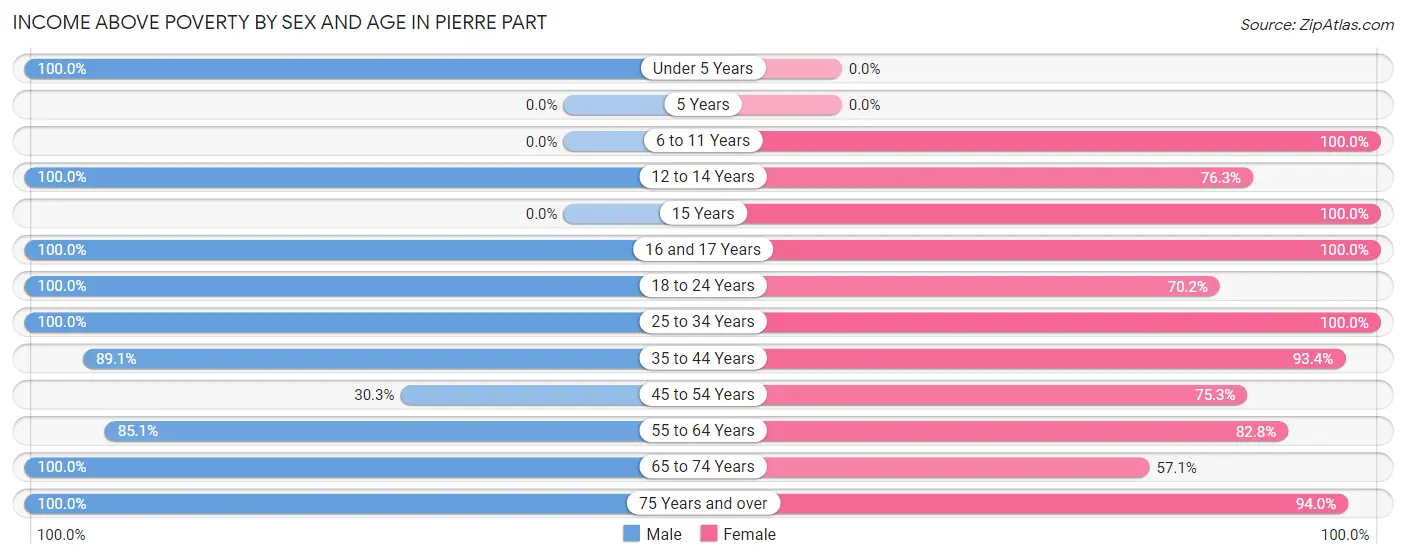
| Age Bracket | Male | Female |
| Under 5 Years | 22 (100.0%) | 0 (0.0%) |
| 5 Years | 0 (0.0%) | 0 (0.0%) |
| 6 to 11 Years | 0 (0.0%) | 55 (100.0%) |
| 12 to 14 Years | 82 (100.0%) | 103 (76.3%) |
| 15 Years | 0 (0.0%) | 49 (100.0%) |
| 16 and 17 Years | 59 (100.0%) | 51 (100.0%) |
| 18 to 24 Years | 179 (100.0%) | 94 (70.2%) |
| 25 to 34 Years | 62 (100.0%) | 50 (100.0%) |
| 35 to 44 Years | 164 (89.1%) | 212 (93.4%) |
| 45 to 54 Years | 23 (30.3%) | 143 (75.3%) |
| 55 to 64 Years | 200 (85.1%) | 236 (82.8%) |
| 65 to 74 Years | 86 (100.0%) | 28 (57.1%) |
| 75 Years and over | 88 (100.0%) | 140 (94.0%) |
| Total | 965 (89.9%) | 1,161 (84.5%) |
Income Below Poverty Among Married-Couple Families in Pierre Part
The poverty statistics for married-couple families in Pierre Part show that 13.0% or 73 of the total 561 families live below the poverty line. Families with 1 or 2 children have the highest poverty rate of 16.9%, comprising of 21 families. On the other hand, families with 3 or 4 children have the lowest poverty rate of 0.0%, which includes 0 families.
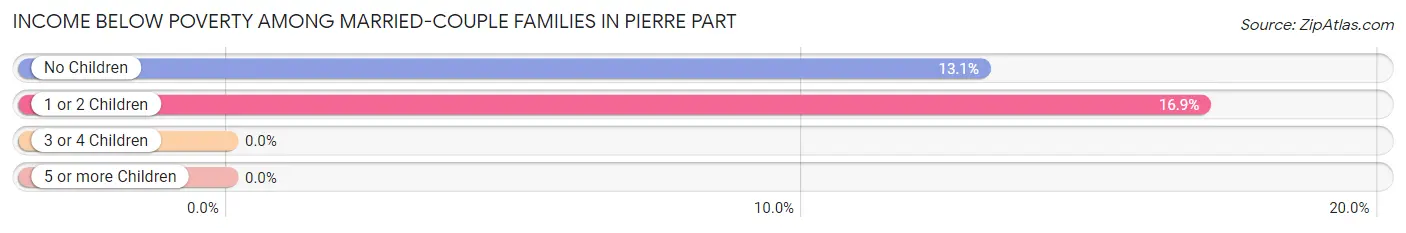
| Children | Above Poverty | Below Poverty |
| No Children | 345 (86.9%) | 52 (13.1%) |
| 1 or 2 Children | 103 (83.1%) | 21 (16.9%) |
| 3 or 4 Children | 40 (100.0%) | 0 (0.0%) |
| 5 or more Children | 0 (0.0%) | 0 (0.0%) |
| Total | 488 (87.0%) | 73 (13.0%) |
Income Below Poverty Among Single-Parent Households in Pierre Part
| Children | Single Father | Single Mother |
| No Children | 0 (0.0%) | 0 (0.0%) |
| 1 or 2 Children | 0 (0.0%) | 0 (0.0%) |
| 3 or 4 Children | 0 (0.0%) | 0 (0.0%) |
| 5 or more Children | 0 (0.0%) | 0 (0.0%) |
| Total | 0 (0.0%) | 0 (0.0%) |
Income Below Poverty Among Married-Couple vs Single-Parent Households in Pierre Part
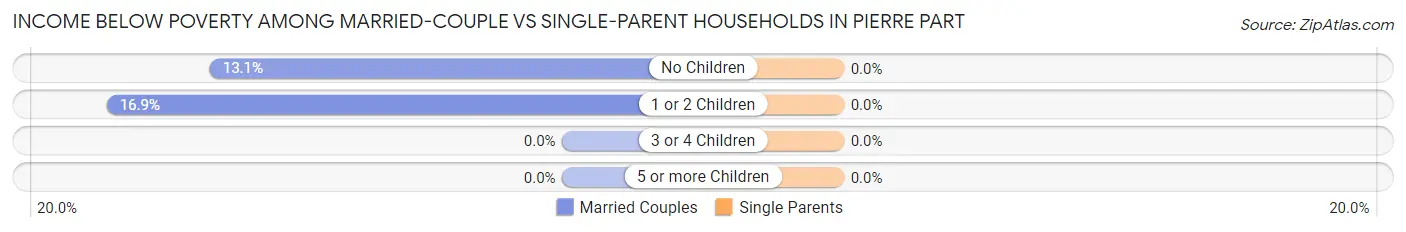
| Children | Married-Couple Families | Single-Parent Households |
| No Children | 52 (13.1%) | 0 (0.0%) |
| 1 or 2 Children | 21 (16.9%) | 0 (0.0%) |
| 3 or 4 Children | 0 (0.0%) | 0 (0.0%) |
| 5 or more Children | 0 (0.0%) | 0 (0.0%) |
| Total | 73 (13.0%) | 0 (0.0%) |
Race in Pierre Part
The most populous races in Pierre Part are White / Caucasian (2,293 | 93.7%), Two or more Races (107 | 4.4%), and Black / African American (47 | 1.9%).
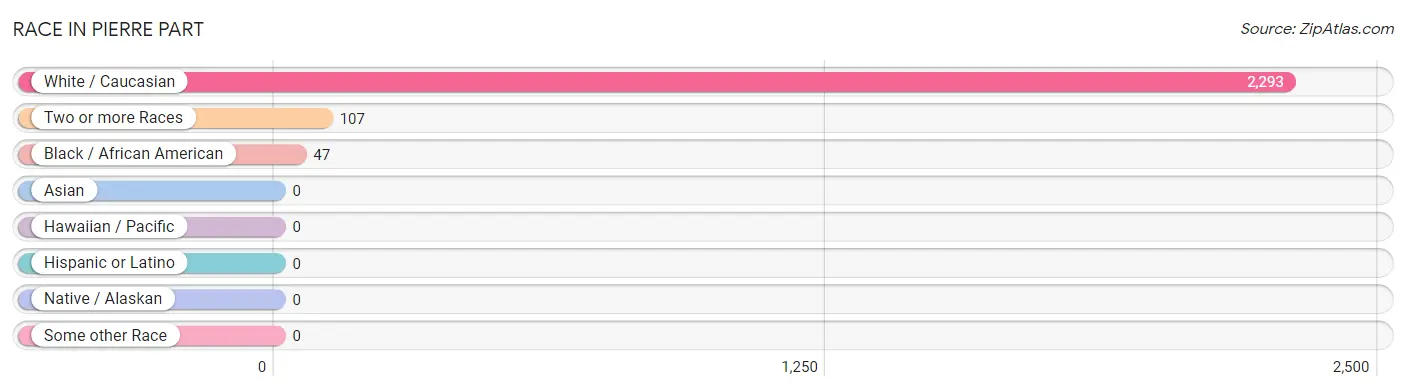
| Race | # Population | % Population |
| Asian | 0 | 0.0% |
| Black / African American | 47 | 1.9% |
| Hawaiian / Pacific | 0 | 0.0% |
| Hispanic or Latino | 0 | 0.0% |
| Native / Alaskan | 0 | 0.0% |
| White / Caucasian | 2,293 | 93.7% |
| Two or more Races | 107 | 4.4% |
| Some other Race | 0 | 0.0% |
| Total | 2,447 | 100.0% |
Ancestry in Pierre Part
The most populous ancestries reported in Pierre Part are French (712 | 29.1%), French Canadian (272 | 11.1%), American (217 | 8.9%), English (139 | 5.7%), and Cajun (113 | 4.6%), together accounting for 59.4% of all Pierre Part residents.
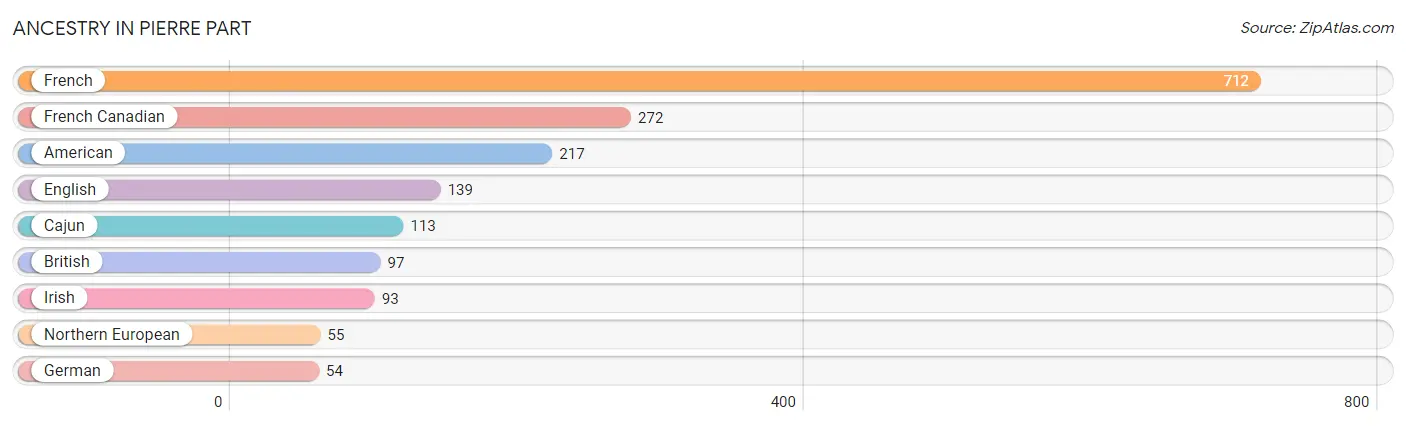
| Ancestry | # Population | % Population |
| American | 217 | 8.9% |
| British | 97 | 4.0% |
| Cajun | 113 | 4.6% |
| English | 139 | 5.7% |
| French | 712 | 29.1% |
| French Canadian | 272 | 11.1% |
| German | 54 | 2.2% |
| Irish | 93 | 3.8% |
| Northern European | 55 | 2.2% | View All 9 Rows |
Immigrants in Pierre Part

| Immigration Origin | # Population | % Population | View All 0 Rows |
Sex and Age in Pierre Part
Sex and Age in Pierre Part
The most populous age groups in Pierre Part are 20 to 24 Years (179 | 16.7%) for men and 55 to 59 Years (169 | 12.3%) for women.
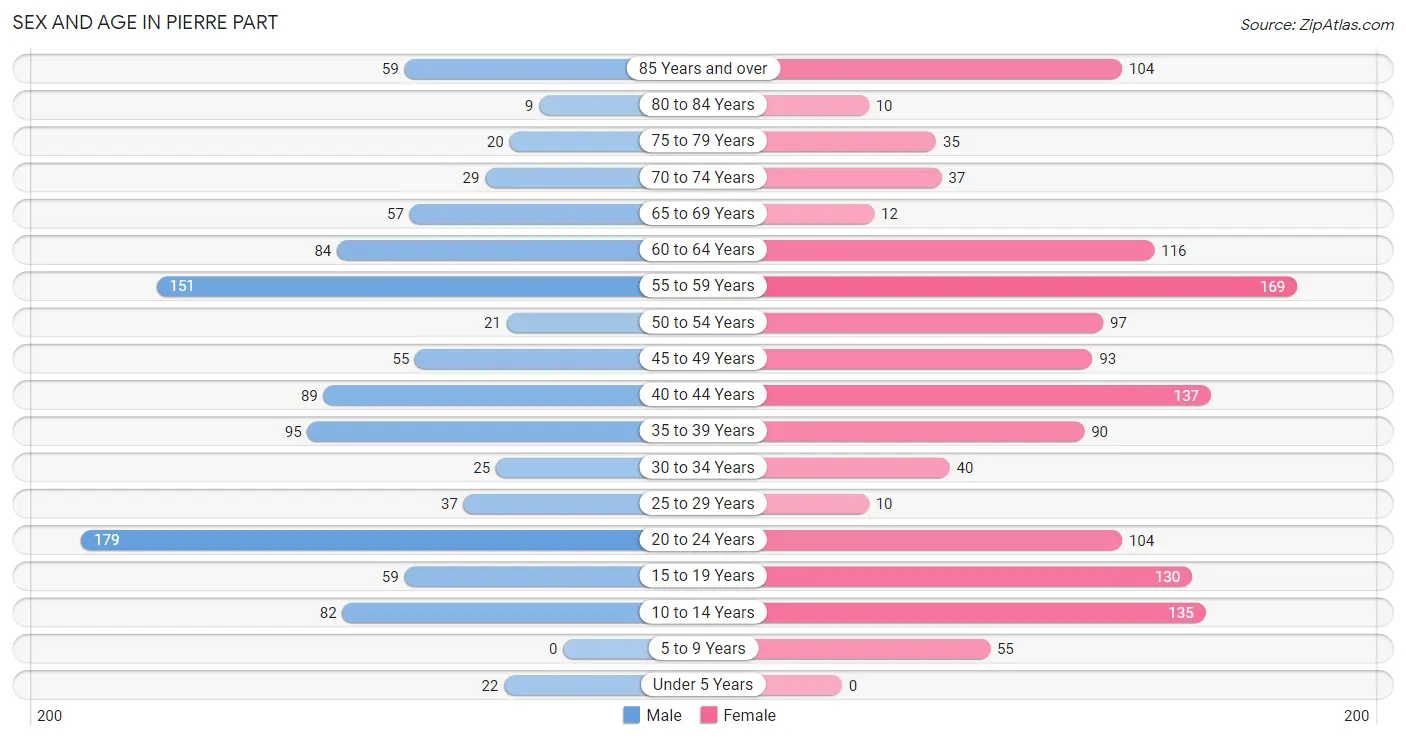
| Age Bracket | Male | Female |
| Under 5 Years | 22 (2.1%) | 0 (0.0%) |
| 5 to 9 Years | 0 (0.0%) | 55 (4.0%) |
| 10 to 14 Years | 82 (7.6%) | 135 (9.8%) |
| 15 to 19 Years | 59 (5.5%) | 130 (9.5%) |
| 20 to 24 Years | 179 (16.7%) | 104 (7.6%) |
| 25 to 29 Years | 37 (3.5%) | 10 (0.7%) |
| 30 to 34 Years | 25 (2.3%) | 40 (2.9%) |
| 35 to 39 Years | 95 (8.8%) | 90 (6.6%) |
| 40 to 44 Years | 89 (8.3%) | 137 (10.0%) |
| 45 to 49 Years | 55 (5.1%) | 93 (6.8%) |
| 50 to 54 Years | 21 (2.0%) | 97 (7.1%) |
| 55 to 59 Years | 151 (14.1%) | 169 (12.3%) |
| 60 to 64 Years | 84 (7.8%) | 116 (8.4%) |
| 65 to 69 Years | 57 (5.3%) | 12 (0.9%) |
| 70 to 74 Years | 29 (2.7%) | 37 (2.7%) |
| 75 to 79 Years | 20 (1.9%) | 35 (2.5%) |
| 80 to 84 Years | 9 (0.8%) | 10 (0.7%) |
| 85 Years and over | 59 (5.5%) | 104 (7.6%) |
| Total | 1,073 (100.0%) | 1,374 (100.0%) |
Families and Households in Pierre Part
Median Family Size in Pierre Part
The median family size in Pierre Part is 3.18 persons per family, with married-couple families (561 | 82.9%) accounting for the largest median family size of 3.28 persons per family. On the other hand, single female/mother families (93 | 13.7%) represent the smallest median family size with 2.56 persons per family.
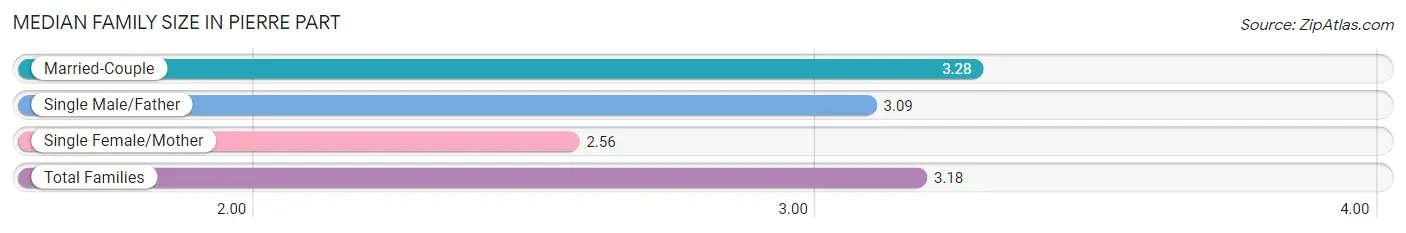
| Family Type | # Families | Family Size |
| Married-Couple | 561 (82.9%) | 3.28 |
| Single Male/Father | 23 (3.4%) | 3.09 |
| Single Female/Mother | 93 (13.7%) | 2.56 |
| Total Families | 677 (100.0%) | 3.18 |
Median Household Size in Pierre Part
The median household size in Pierre Part is 2.60 persons per household, with married-couple households (561 | 59.6%) accounting for the largest median household size of 3.28 persons per household. non-family households (264 | 28.1%) represent the smallest median household size with 1.12 persons per household.
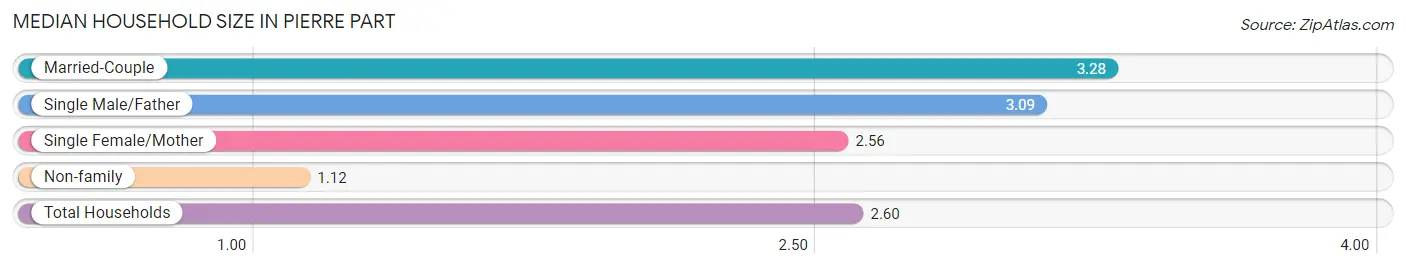
| Household Type | # Households | Household Size |
| Married-Couple | 561 (59.6%) | 3.28 |
| Single Male/Father | 23 (2.4%) | 3.09 |
| Single Female/Mother | 93 (9.9%) | 2.56 |
| Non-family | 264 (28.1%) | 1.12 |
| Total Households | 941 (100.0%) | 2.60 |
Household Size by Marriage Status in Pierre Part
Out of a total of 941 households in Pierre Part, 677 (71.9%) are family households, while 264 (28.1%) are nonfamily households. The most numerous type of family households are 2-person households, comprising 337, and the most common type of nonfamily households are 1-person households, comprising 230.
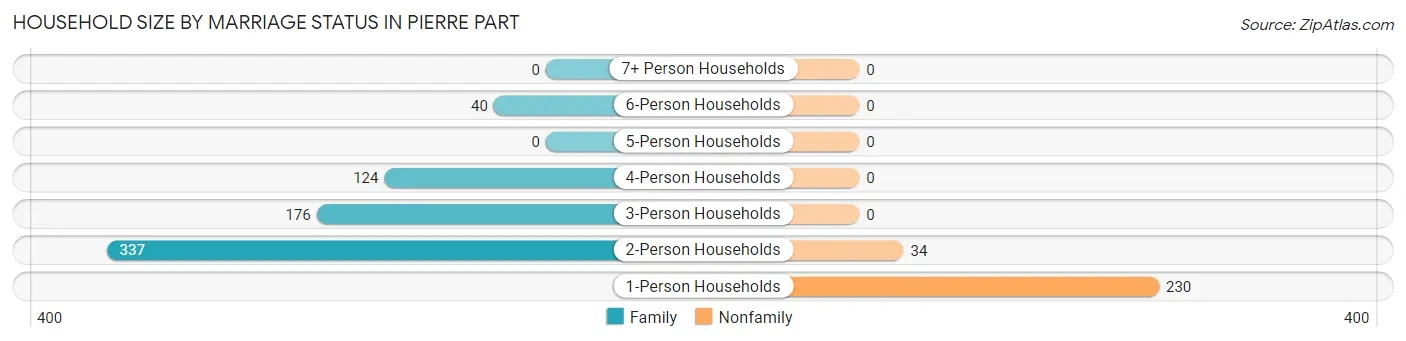
| Household Size | Family Households | Nonfamily Households |
| 1-Person Households | - | 230 (24.4%) |
| 2-Person Households | 337 (35.8%) | 34 (3.6%) |
| 3-Person Households | 176 (18.7%) | 0 (0.0%) |
| 4-Person Households | 124 (13.2%) | 0 (0.0%) |
| 5-Person Households | 0 (0.0%) | 0 (0.0%) |
| 6-Person Households | 40 (4.3%) | 0 (0.0%) |
| 7+ Person Households | 0 (0.0%) | 0 (0.0%) |
| Total | 677 (71.9%) | 264 (28.1%) |
Female Fertility in Pierre Part
Fertility by Age in Pierre Part
| Age Bracket | Women with Births | Births / 1,000 Women |
| 15 to 19 years | 0 (0.0%) | 0.0 |
| 20 to 34 years | 0 (0.0%) | 0.0 |
| 35 to 50 years | 0 (0.0%) | 0.0 |
| Total | 0 (0.0%) | 0.0 |
Fertility by Age by Marriage Status in Pierre Part
| Age Bracket | Married | Unmarried |
| 15 to 19 years | 0 (0.0%) | 0 (0.0%) |
| 20 to 34 years | 0 (0.0%) | 0 (0.0%) |
| 35 to 50 years | 0 (0.0%) | 0 (0.0%) |
| Total | 0 (0.0%) | 0 (0.0%) |
Fertility by Education in Pierre Part
| Educational Attainment | Women with Births | Births / 1,000 Women |
| Less than High School | 0 (0.0%) | 0.0 |
| High School Diploma | 0 (0.0%) | 0.0 |
| College or Associate's Degree | 0 (0.0%) | 0.0 |
| Bachelor's Degree | 0 (0.0%) | 0.0 |
| Graduate Degree | 0 (0.0%) | 0.0 |
| Total | 0 (0.0%) | 0.0 |
Fertility by Education by Marriage Status in Pierre Part
| Educational Attainment | Married | Unmarried |
| Less than High School | 0 (0.0%) | 0 (0.0%) |
| High School Diploma | 0 (0.0%) | 0 (0.0%) |
| College or Associate's Degree | 0 (0.0%) | 0 (0.0%) |
| Bachelor's Degree | 0 (0.0%) | 0 (0.0%) |
| Graduate Degree | 0 (0.0%) | 0 (0.0%) |
| Total | 0 (0.0%) | 0 (0.0%) |
Employment Characteristics in Pierre Part
Employment by Class of Employer in Pierre Part
Among the 1,284 employed individuals in Pierre Part, private company employees (824 | 64.2%), state government employees (225 | 17.5%), and self-employed (incorporated) (81 | 6.3%) make up the most common classes of employment.
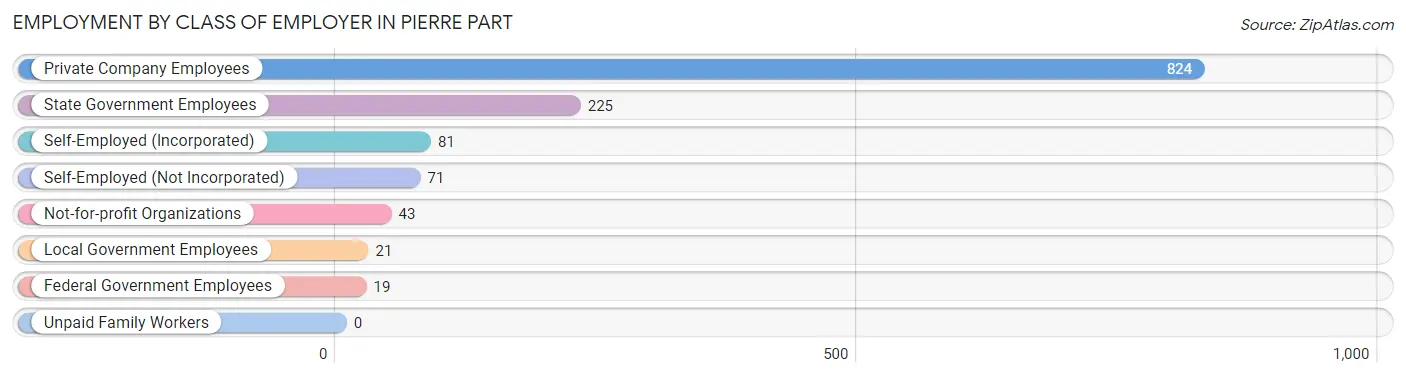
| Employer Class | # Employees | % Employees |
| Private Company Employees | 824 | 64.2% |
| Self-Employed (Incorporated) | 81 | 6.3% |
| Self-Employed (Not Incorporated) | 71 | 5.5% |
| Not-for-profit Organizations | 43 | 3.4% |
| Local Government Employees | 21 | 1.6% |
| State Government Employees | 225 | 17.5% |
| Federal Government Employees | 19 | 1.5% |
| Unpaid Family Workers | 0 | 0.0% |
| Total | 1,284 | 100.0% |
Employment Status by Age in Pierre Part
According to the labor force statistics for Pierre Part, out of the total population over 16 years of age (2,104), 66.0% or 1,389 individuals are in the labor force, with 7.5% or 104 of them unemployed. The age group with the highest labor force participation rate is 30 to 34 years, with 100.0% or 65 individuals in the labor force. Within the labor force, the 25 to 29 years age range has the highest percentage of unemployed individuals, with 48.6% or 18 of them being unemployed.
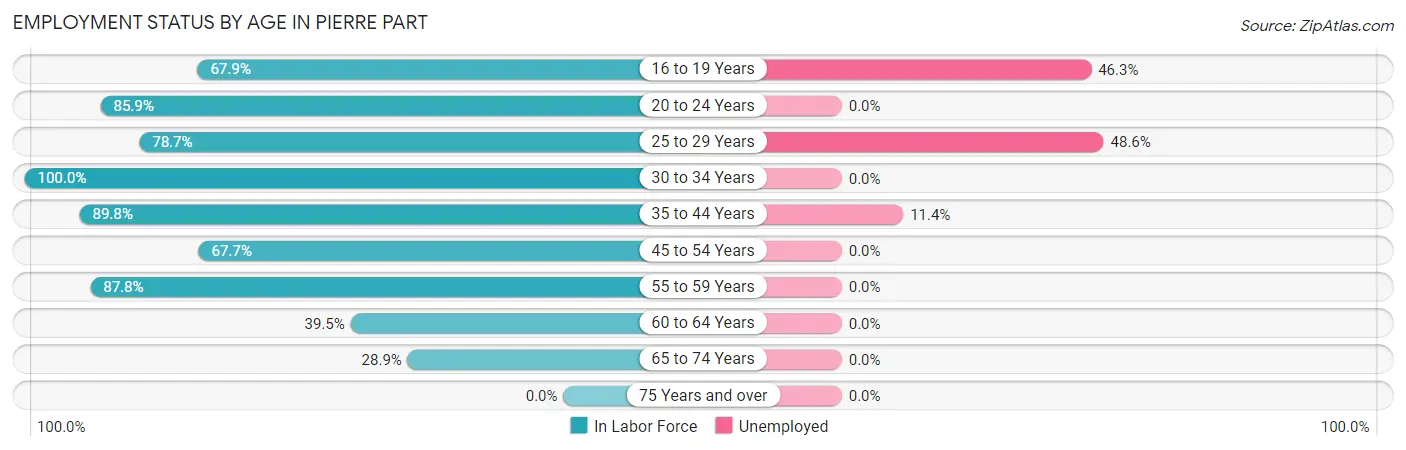
| Age Bracket | In Labor Force | Unemployed |
| 16 to 19 Years | 95 (67.9%) | 44 (46.3%) |
| 20 to 24 Years | 243 (85.9%) | 0 (0.0%) |
| 25 to 29 Years | 37 (78.7%) | 18 (48.6%) |
| 30 to 34 Years | 65 (100.0%) | 0 (0.0%) |
| 35 to 44 Years | 369 (89.8%) | 42 (11.4%) |
| 45 to 54 Years | 180 (67.7%) | 0 (0.0%) |
| 55 to 59 Years | 281 (87.8%) | 0 (0.0%) |
| 60 to 64 Years | 79 (39.5%) | 0 (0.0%) |
| 65 to 74 Years | 39 (28.9%) | 0 (0.0%) |
| 75 Years and over | 0 (0.0%) | 0 (0.0%) |
| Total | 1,389 (66.0%) | 104 (7.5%) |
Employment Status by Educational Attainment in Pierre Part
According to labor force statistics for Pierre Part, 77.2% of individuals (1,011) out of the total population between 25 and 64 years of age (1,309) are in the labor force, with 5.9% or 60 of them being unemployed. The group with the highest labor force participation rate are those with the educational attainment of college / associate degree, with 94.0% or 250 individuals in the labor force. Within the labor force, individuals with college / associate degree education have the highest percentage of unemployment, with 16.8% or 42 of them being unemployed.

| Educational Attainment | In Labor Force | Unemployed |
| Less than High School | 61 (61.0%) | 0 (0.0%) |
| High School Diploma | 515 (69.2%) | 26 (3.5%) |
| College / Associate Degree | 250 (94.0%) | 45 (16.8%) |
| Bachelor's Degree or higher | 185 (93.0%) | 0 (0.0%) |
| Total | 1,011 (77.2%) | 77 (5.9%) |
Employment Occupations by Sex in Pierre Part
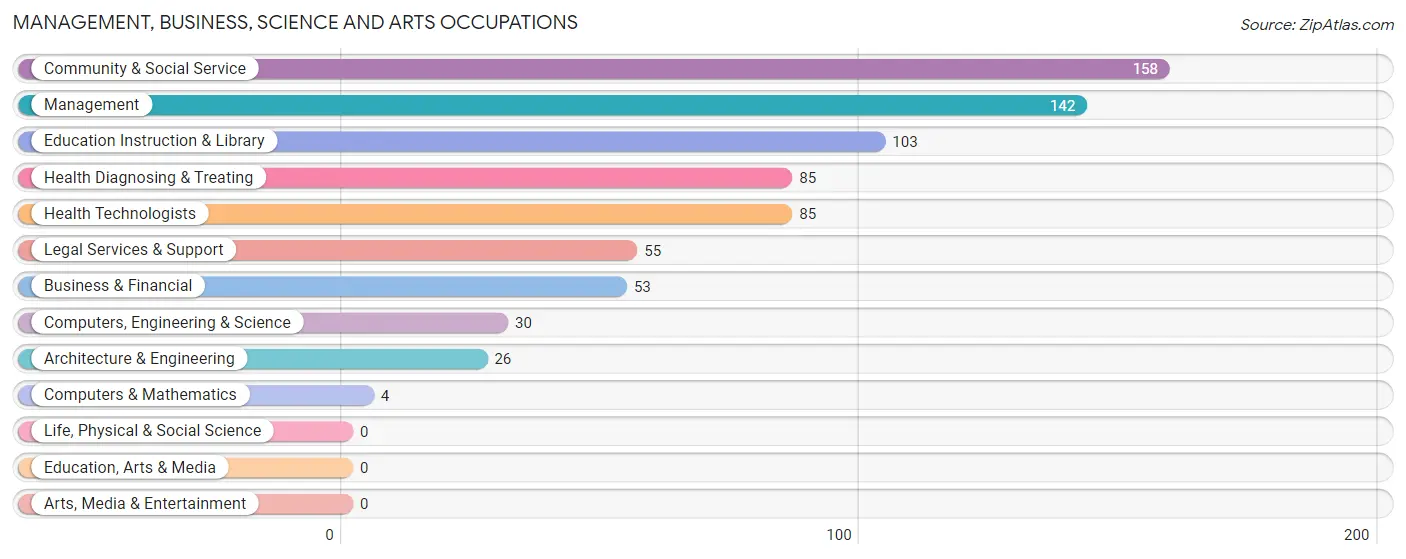
Management, Business, Science and Arts Occupations
The most common Management, Business, Science and Arts occupations in Pierre Part are Community & Social Service (158 | 12.3%), Management (142 | 11.1%), Education Instruction & Library (103 | 8.0%), Health Diagnosing & Treating (85 | 6.6%), and Health Technologists (85 | 6.6%).
Management, Business, Science and Arts Occupations by Sex
Within the Management, Business, Science and Arts occupations in Pierre Part, the most male-oriented occupations are Architecture & Engineering (100.0%), Computers, Engineering & Science (86.7%), and Education Instruction & Library (79.6%), while the most female-oriented occupations are Computers & Mathematics (100.0%), Legal Services & Support (100.0%), and Health Diagnosing & Treating (100.0%).
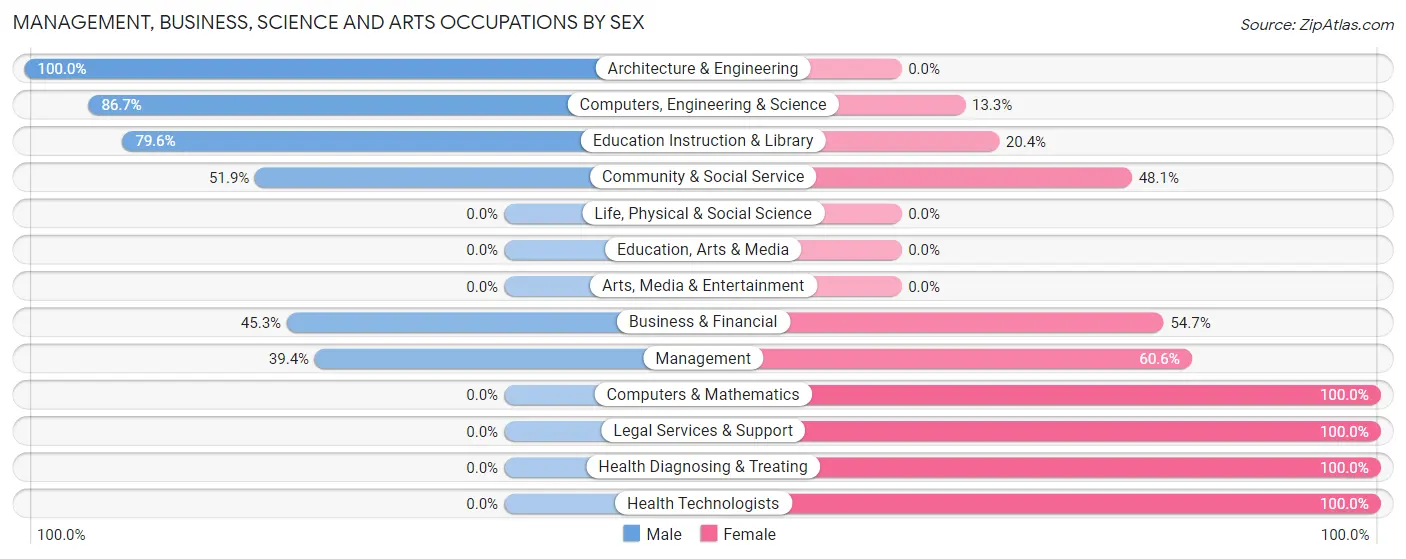
| Occupation | Male | Female |
| Management | 56 (39.4%) | 86 (60.6%) |
| Business & Financial | 24 (45.3%) | 29 (54.7%) |
| Computers, Engineering & Science | 26 (86.7%) | 4 (13.3%) |
| Computers & Mathematics | 0 (0.0%) | 4 (100.0%) |
| Architecture & Engineering | 26 (100.0%) | 0 (0.0%) |
| Life, Physical & Social Science | 0 (0.0%) | 0 (0.0%) |
| Community & Social Service | 82 (51.9%) | 76 (48.1%) |
| Education, Arts & Media | 0 (0.0%) | 0 (0.0%) |
| Legal Services & Support | 0 (0.0%) | 55 (100.0%) |
| Education Instruction & Library | 82 (79.6%) | 21 (20.4%) |
| Arts, Media & Entertainment | 0 (0.0%) | 0 (0.0%) |
| Health Diagnosing & Treating | 0 (0.0%) | 85 (100.0%) |
| Health Technologists | 0 (0.0%) | 85 (100.0%) |
| Total (Category) | 188 (40.2%) | 280 (59.8%) |
| Total (Overall) | 628 (48.9%) | 656 (51.1%) |
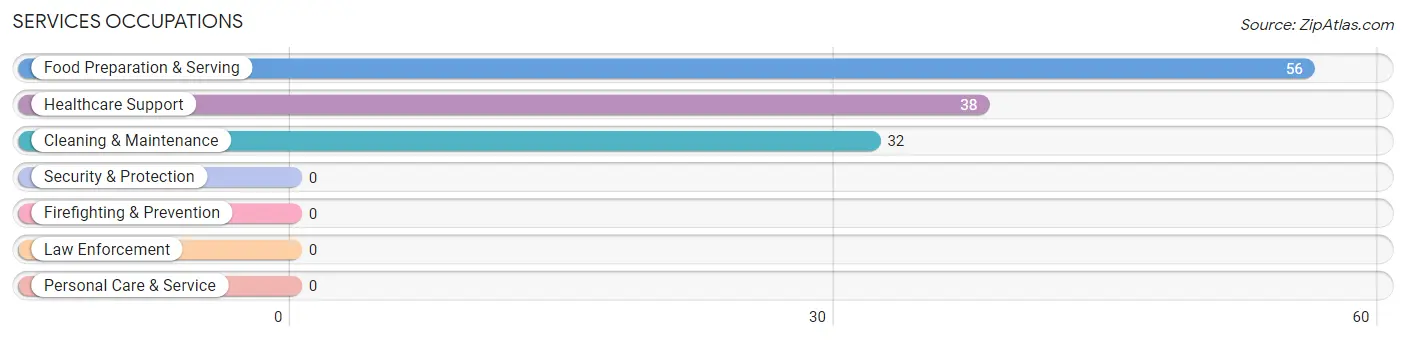
Services Occupations
The most common Services occupations in Pierre Part are Food Preparation & Serving (56 | 4.4%), Healthcare Support (38 | 3.0%), and Cleaning & Maintenance (32 | 2.5%).
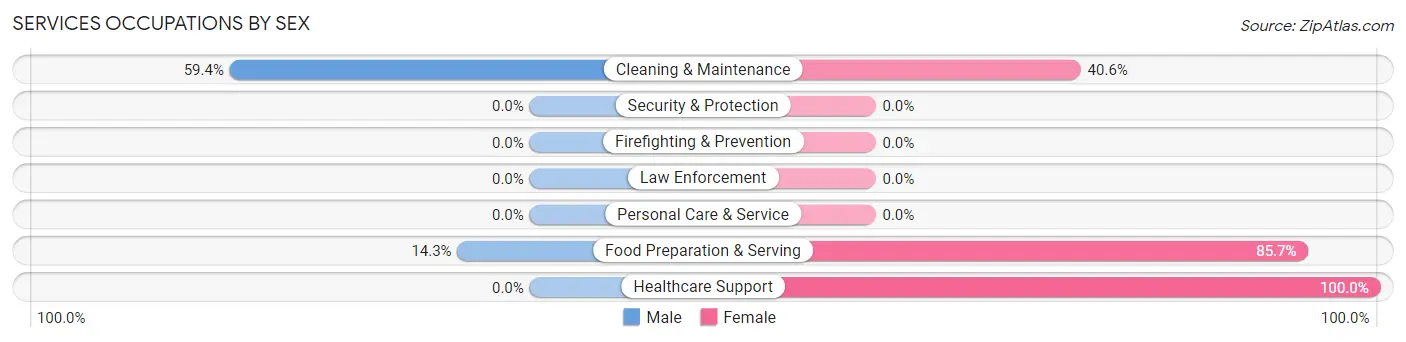
Services Occupations by Sex
Within the Services occupations in Pierre Part, the most male-oriented occupations are Cleaning & Maintenance (59.4%), and Food Preparation & Serving (14.3%), while the most female-oriented occupations are Healthcare Support (100.0%), Food Preparation & Serving (85.7%), and Cleaning & Maintenance (40.6%).
| Occupation | Male | Female |
| Healthcare Support | 0 (0.0%) | 38 (100.0%) |
| Security & Protection | 0 (0.0%) | 0 (0.0%) |
| Firefighting & Prevention | 0 (0.0%) | 0 (0.0%) |
| Law Enforcement | 0 (0.0%) | 0 (0.0%) |
| Food Preparation & Serving | 8 (14.3%) | 48 (85.7%) |
| Cleaning & Maintenance | 19 (59.4%) | 13 (40.6%) |
| Personal Care & Service | 0 (0.0%) | 0 (0.0%) |
| Total (Category) | 27 (21.4%) | 99 (78.6%) |
| Total (Overall) | 628 (48.9%) | 656 (51.1%) |
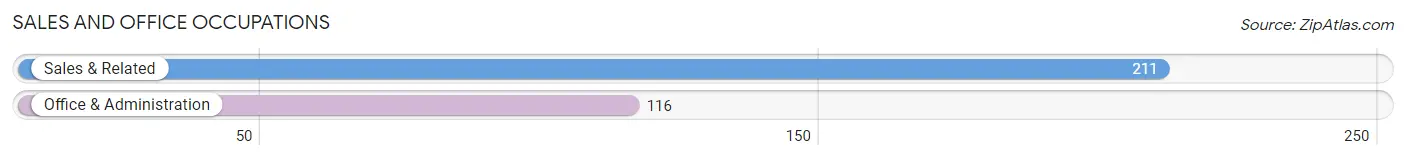
Sales and Office Occupations
The most common Sales and Office occupations in Pierre Part are Sales & Related (211 | 16.4%), and Office & Administration (116 | 9.0%).
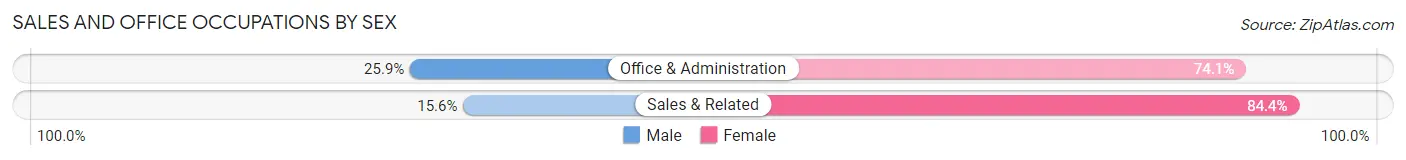
Sales and Office Occupations by Sex
| Occupation | Male | Female |
| Sales & Related | 33 (15.6%) | 178 (84.4%) |
| Office & Administration | 30 (25.9%) | 86 (74.1%) |
| Total (Category) | 63 (19.3%) | 264 (80.7%) |
| Total (Overall) | 628 (48.9%) | 656 (51.1%) |
Natural Resources, Construction and Maintenance Occupations
The most common Natural Resources, Construction and Maintenance occupations in Pierre Part are Construction & Extraction (106 | 8.3%), and Farming, Fishing & Forestry (16 | 1.3%).
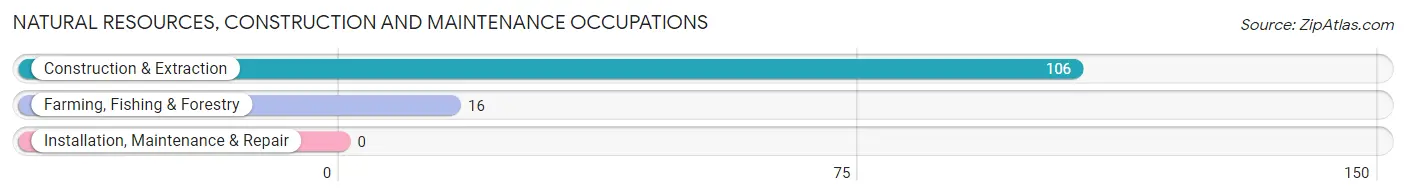
Natural Resources, Construction and Maintenance Occupations by Sex
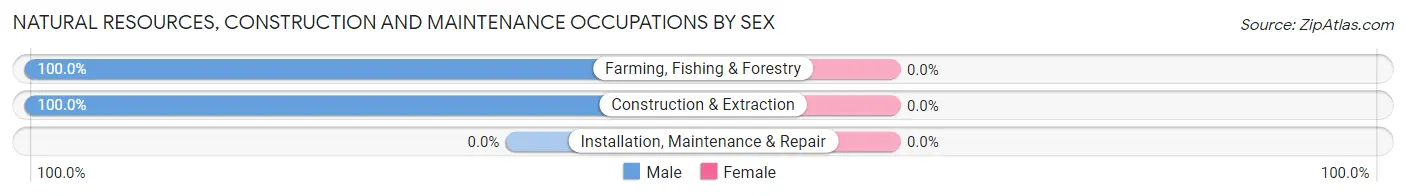
| Occupation | Male | Female |
| Farming, Fishing & Forestry | 16 (100.0%) | 0 (0.0%) |
| Construction & Extraction | 106 (100.0%) | 0 (0.0%) |
| Installation, Maintenance & Repair | 0 (0.0%) | 0 (0.0%) |
| Total (Category) | 122 (100.0%) | 0 (0.0%) |
| Total (Overall) | 628 (48.9%) | 656 (51.1%) |
Production, Transportation and Moving Occupations
The most common Production, Transportation and Moving occupations in Pierre Part are Production (85 | 6.6%), Transportation (84 | 6.5%), and Material Moving (72 | 5.6%).
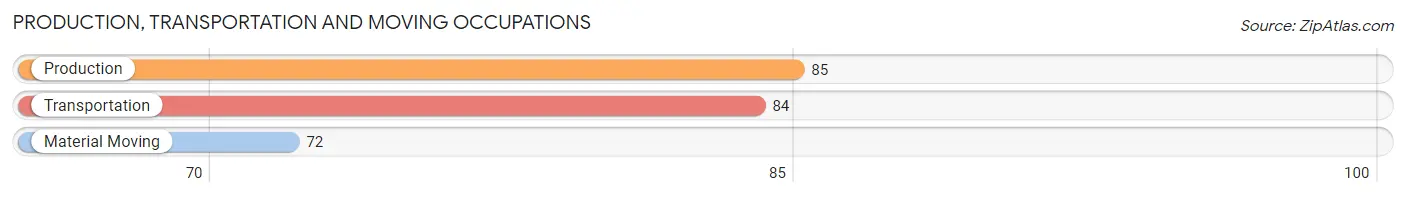
Production, Transportation and Moving Occupations by Sex
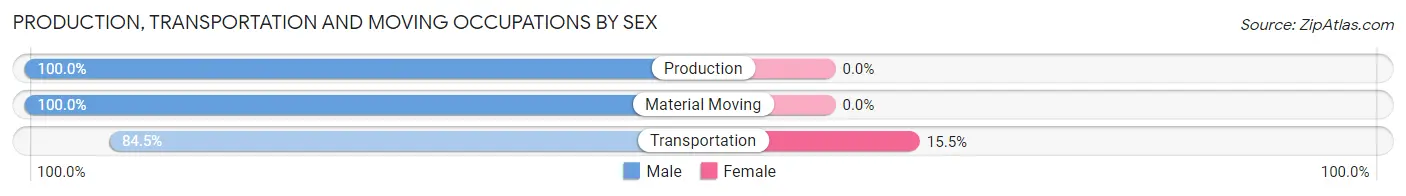
| Occupation | Male | Female |
| Production | 85 (100.0%) | 0 (0.0%) |
| Transportation | 71 (84.5%) | 13 (15.5%) |
| Material Moving | 72 (100.0%) | 0 (0.0%) |
| Total (Category) | 228 (94.6%) | 13 (5.4%) |
| Total (Overall) | 628 (48.9%) | 656 (51.1%) |
Employment Industries by Sex in Pierre Part
Employment Industries in Pierre Part
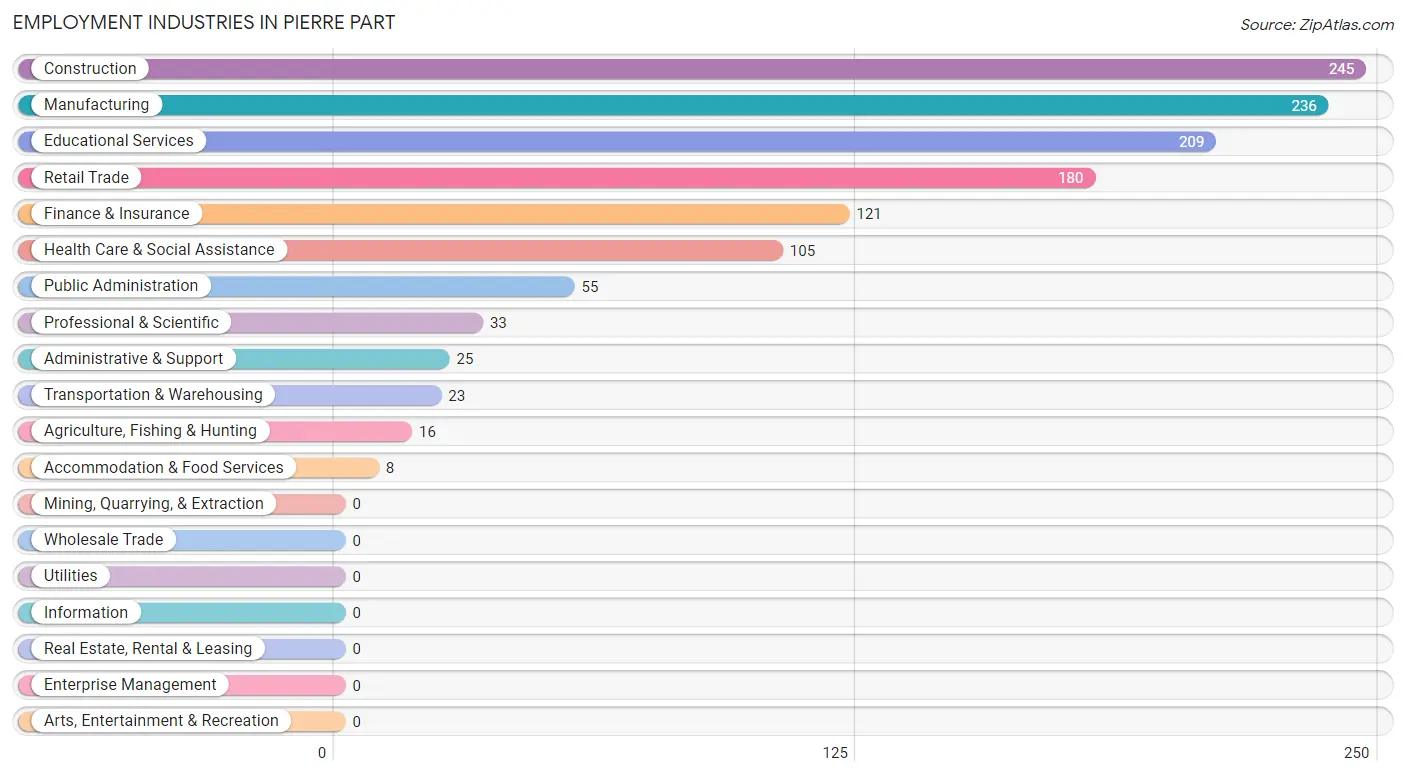
The major employment industries in Pierre Part include Construction (245 | 19.1%), Manufacturing (236 | 18.4%), Educational Services (209 | 16.3%), Retail Trade (180 | 14.0%), and Finance & Insurance (121 | 9.4%).
Employment Industries by Sex in Pierre Part
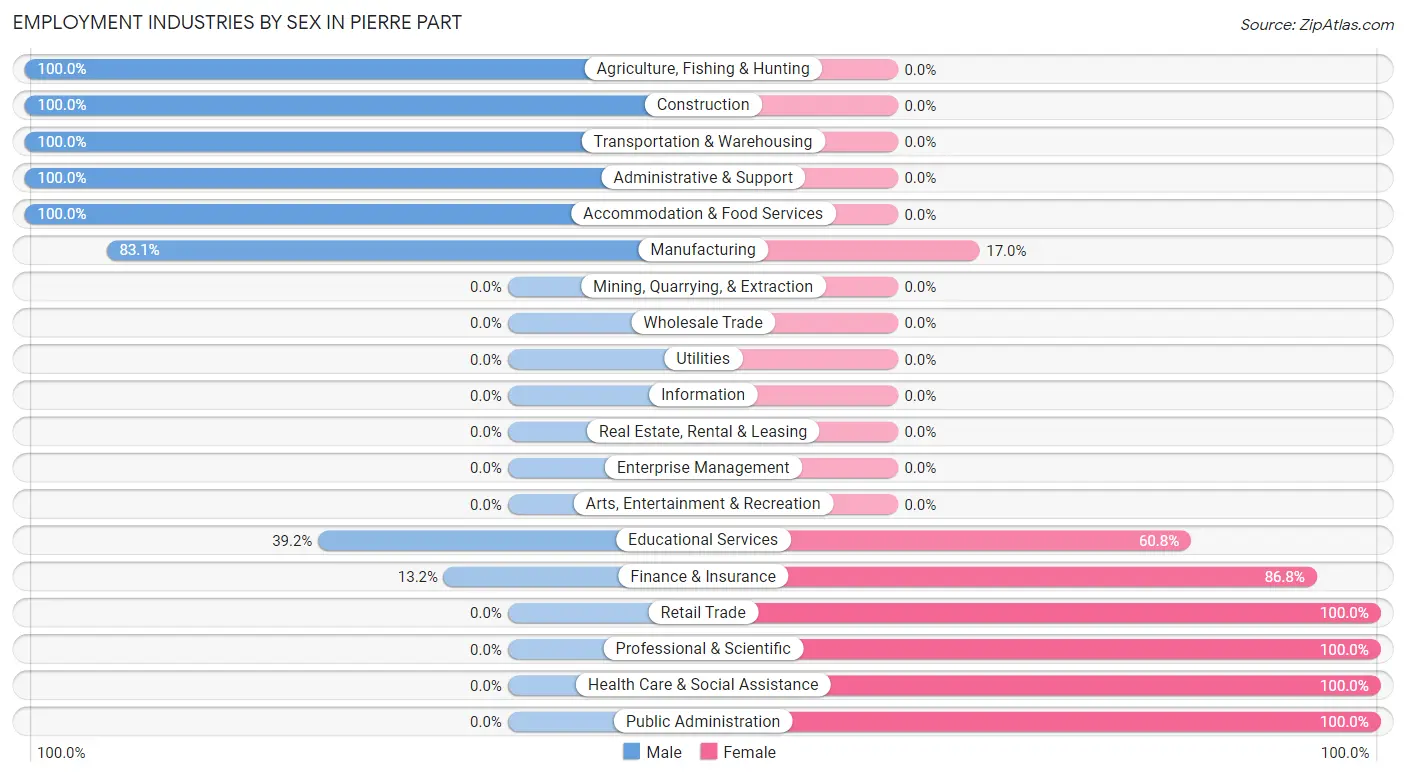
The Pierre Part industries that see more men than women are Agriculture, Fishing & Hunting (100.0%), Construction (100.0%), and Transportation & Warehousing (100.0%), whereas the industries that tend to have a higher number of women are Retail Trade (100.0%), Professional & Scientific (100.0%), and Health Care & Social Assistance (100.0%).
| Industry | Male | Female |
| Agriculture, Fishing & Hunting | 16 (100.0%) | 0 (0.0%) |
| Mining, Quarrying, & Extraction | 0 (0.0%) | 0 (0.0%) |
| Construction | 245 (100.0%) | 0 (0.0%) |
| Manufacturing | 196 (83.1%) | 40 (17.0%) |
| Wholesale Trade | 0 (0.0%) | 0 (0.0%) |
| Retail Trade | 0 (0.0%) | 180 (100.0%) |
| Transportation & Warehousing | 23 (100.0%) | 0 (0.0%) |
| Utilities | 0 (0.0%) | 0 (0.0%) |
| Information | 0 (0.0%) | 0 (0.0%) |
| Finance & Insurance | 16 (13.2%) | 105 (86.8%) |
| Real Estate, Rental & Leasing | 0 (0.0%) | 0 (0.0%) |
| Professional & Scientific | 0 (0.0%) | 33 (100.0%) |
| Enterprise Management | 0 (0.0%) | 0 (0.0%) |
| Administrative & Support | 25 (100.0%) | 0 (0.0%) |
| Educational Services | 82 (39.2%) | 127 (60.8%) |
| Health Care & Social Assistance | 0 (0.0%) | 105 (100.0%) |
| Arts, Entertainment & Recreation | 0 (0.0%) | 0 (0.0%) |
| Accommodation & Food Services | 8 (100.0%) | 0 (0.0%) |
| Public Administration | 0 (0.0%) | 55 (100.0%) |
| Total | 628 (48.9%) | 656 (51.1%) |
Education in Pierre Part
School Enrollment in Pierre Part
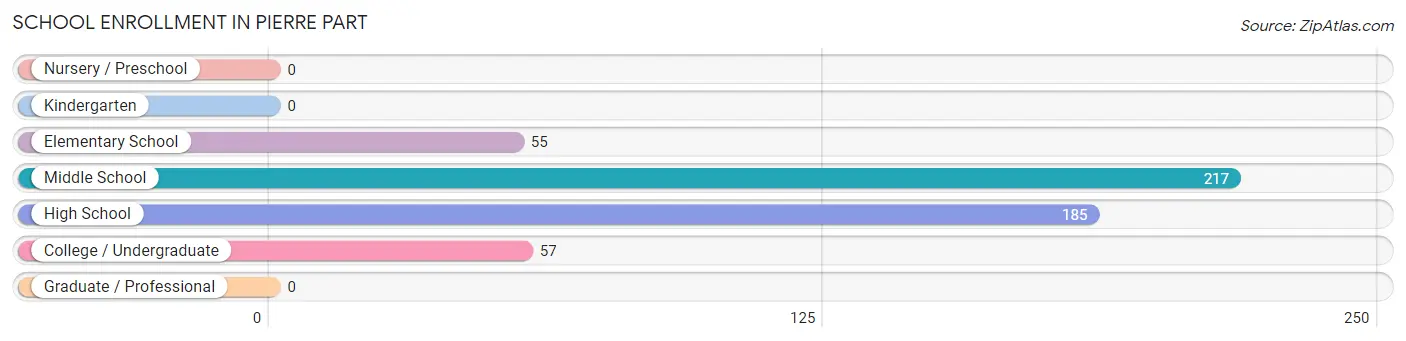
The most common levels of schooling among the 514 students in Pierre Part are middle school (217 | 42.2%), high school (185 | 36.0%), and college / undergraduate (57 | 11.1%).
| School Level | # Students | % Students |
| Nursery / Preschool | 0 | 0.0% |
| Kindergarten | 0 | 0.0% |
| Elementary School | 55 | 10.7% |
| Middle School | 217 | 42.2% |
| High School | 185 | 36.0% |
| College / Undergraduate | 57 | 11.1% |
| Graduate / Professional | 0 | 0.0% |
| Total | 514 | 100.0% |
School Enrollment by Age by Funding Source in Pierre Part
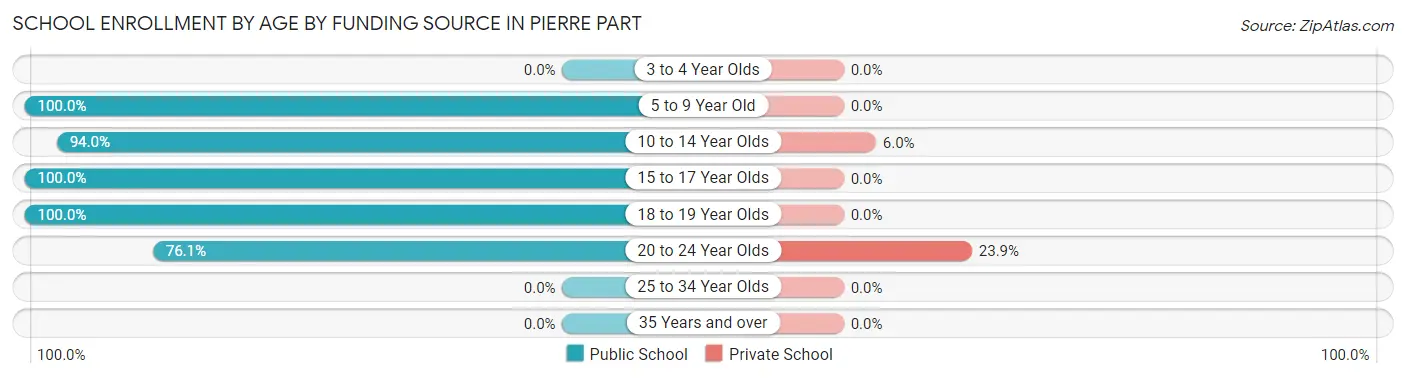
Out of a total of 514 students who are enrolled in schools in Pierre Part, 29 (5.6%) attend a private institution, while the remaining 485 (94.4%) are enrolled in public schools. The age group of 20 to 24 year olds has the highest likelihood of being enrolled in private schools, with 16 (23.9% in the age bracket) enrolled. Conversely, the age group of 5 to 9 year old has the lowest likelihood of being enrolled in a private school, with 55 (100.0% in the age bracket) attending a public institution.
| Age Bracket | Public School | Private School |
| 3 to 4 Year Olds | 0 (0.0%) | 0 (0.0%) |
| 5 to 9 Year Old | 55 (100.0%) | 0 (0.0%) |
| 10 to 14 Year Olds | 204 (94.0%) | 13 (6.0%) |
| 15 to 17 Year Olds | 145 (100.0%) | 0 (0.0%) |
| 18 to 19 Year Olds | 30 (100.0%) | 0 (0.0%) |
| 20 to 24 Year Olds | 51 (76.1%) | 16 (23.9%) |
| 25 to 34 Year Olds | 0 (0.0%) | 0 (0.0%) |
| 35 Years and over | 0 (0.0%) | 0 (0.0%) |
| Total | 485 (94.4%) | 29 (5.6%) |
Educational Attainment by Field of Study in Pierre Part
Education (143 | 40.6%), science & technology (59 | 16.8%), business (42 | 11.9%), psychology (40 | 11.4%), and social sciences (38 | 10.8%) are the most common fields of study among 352 individuals in Pierre Part who have obtained a bachelor's degree or higher.
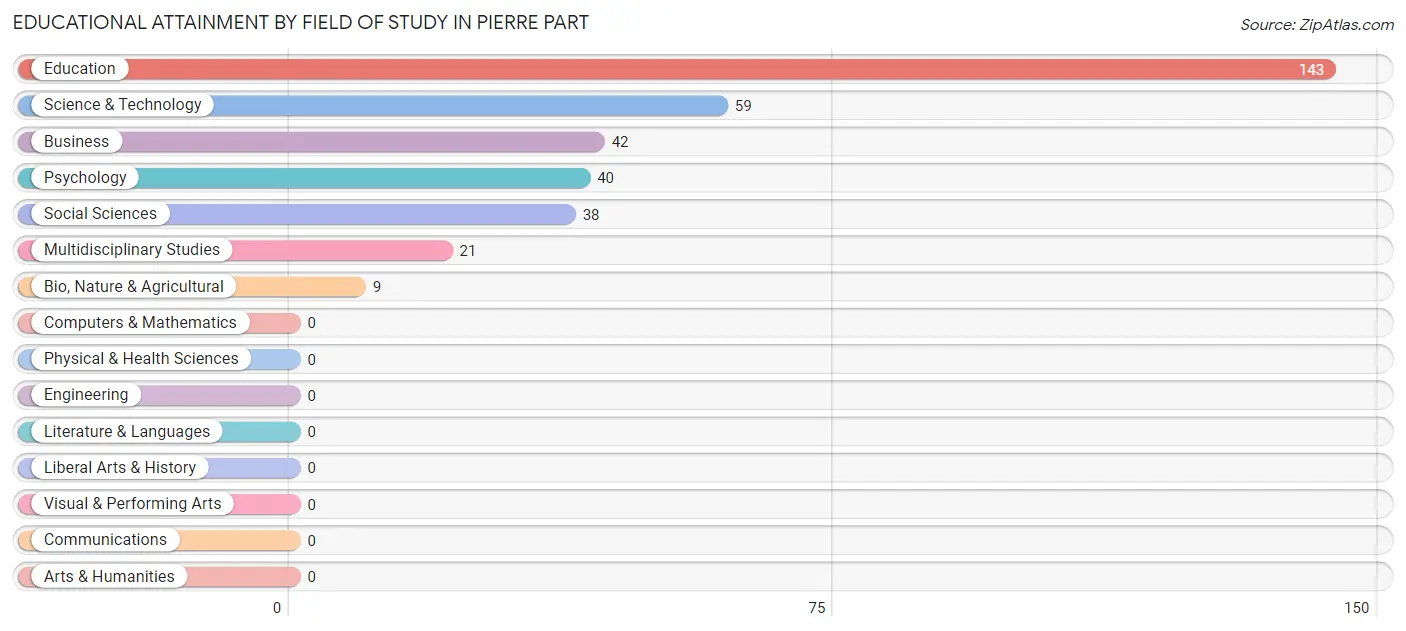
| Field of Study | # Graduates | % Graduates |
| Computers & Mathematics | 0 | 0.0% |
| Bio, Nature & Agricultural | 9 | 2.6% |
| Physical & Health Sciences | 0 | 0.0% |
| Psychology | 40 | 11.4% |
| Social Sciences | 38 | 10.8% |
| Engineering | 0 | 0.0% |
| Multidisciplinary Studies | 21 | 6.0% |
| Science & Technology | 59 | 16.8% |
| Business | 42 | 11.9% |
| Education | 143 | 40.6% |
| Literature & Languages | 0 | 0.0% |
| Liberal Arts & History | 0 | 0.0% |
| Visual & Performing Arts | 0 | 0.0% |
| Communications | 0 | 0.0% |
| Arts & Humanities | 0 | 0.0% |
| Total | 352 | 100.0% |
Transportation & Commute in Pierre Part
Vehicle Availability by Sex in Pierre Part
The most prevalent vehicle ownership categories in Pierre Part are males with 2 vehicles (201, accounting for 32.0%) and females with 2 vehicles (248, making up 30.6%).
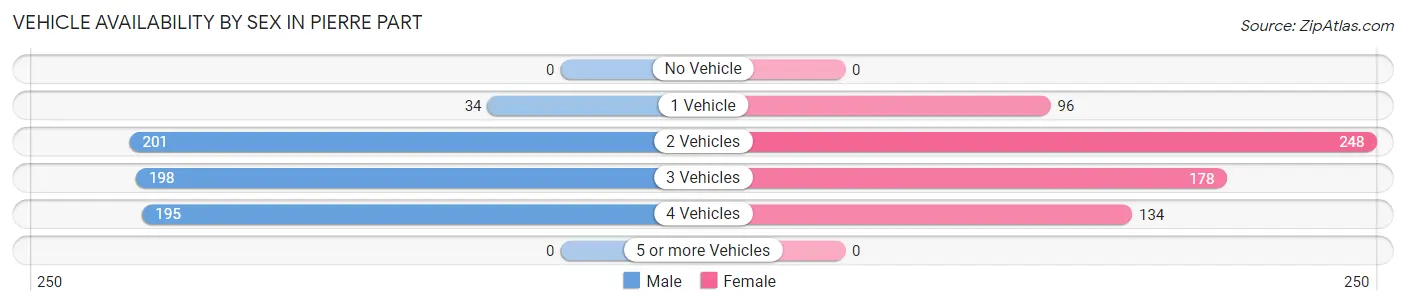
| Vehicles Available | Male | Female |
| No Vehicle | 0 (0.0%) | 0 (0.0%) |
| 1 Vehicle | 34 (5.4%) | 96 (14.6%) |
| 2 Vehicles | 201 (32.0%) | 248 (37.8%) |
| 3 Vehicles | 198 (31.5%) | 178 (27.1%) |
| 4 Vehicles | 195 (31.0%) | 134 (20.4%) |
| 5 or more Vehicles | 0 (0.0%) | 0 (0.0%) |
| Total | 628 (100.0%) | 656 (100.0%) |
Commute Time in Pierre Part
The most frequently occuring commute durations in Pierre Part are 30 to 34 minutes (415 commuters, 35.0%), 60 to 89 minutes (174 commuters, 14.7%), and less than 5 minutes (134 commuters, 11.3%).
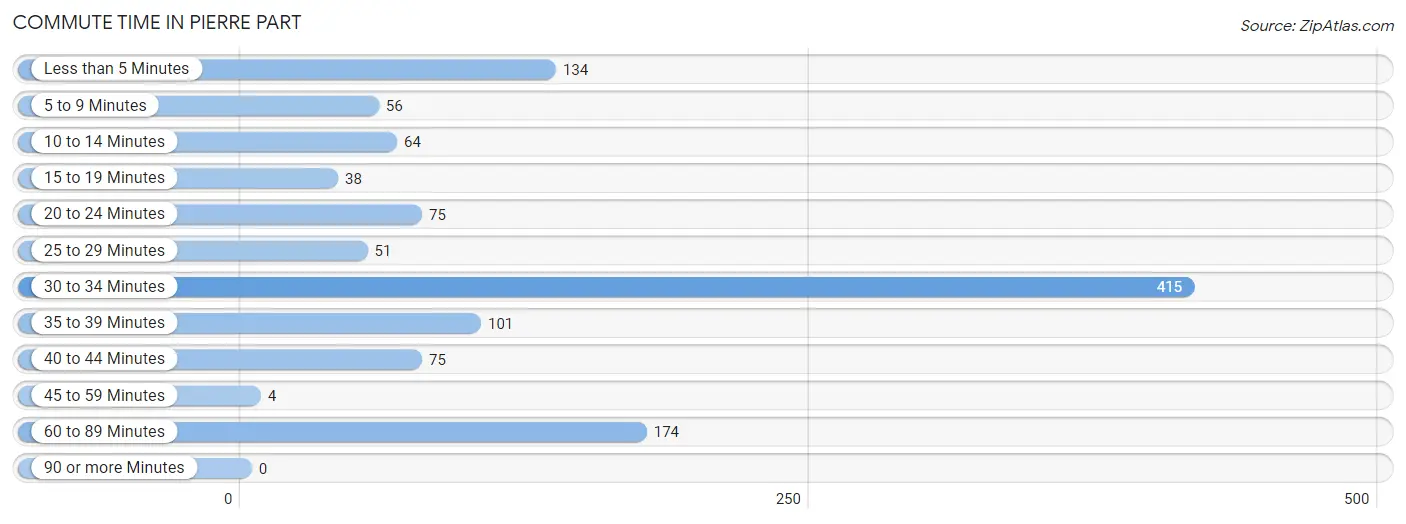
| Commute Time | # Commuters | % Commuters |
| Less than 5 Minutes | 134 | 11.3% |
| 5 to 9 Minutes | 56 | 4.7% |
| 10 to 14 Minutes | 64 | 5.4% |
| 15 to 19 Minutes | 38 | 3.2% |
| 20 to 24 Minutes | 75 | 6.3% |
| 25 to 29 Minutes | 51 | 4.3% |
| 30 to 34 Minutes | 415 | 35.0% |
| 35 to 39 Minutes | 101 | 8.5% |
| 40 to 44 Minutes | 75 | 6.3% |
| 45 to 59 Minutes | 4 | 0.3% |
| 60 to 89 Minutes | 174 | 14.7% |
| 90 or more Minutes | 0 | 0.0% |
Commute Time by Sex in Pierre Part
The most common commute times in Pierre Part are 30 to 34 minutes (251 commuters, 41.6%) for males and 30 to 34 minutes (164 commuters, 28.1%) for females.
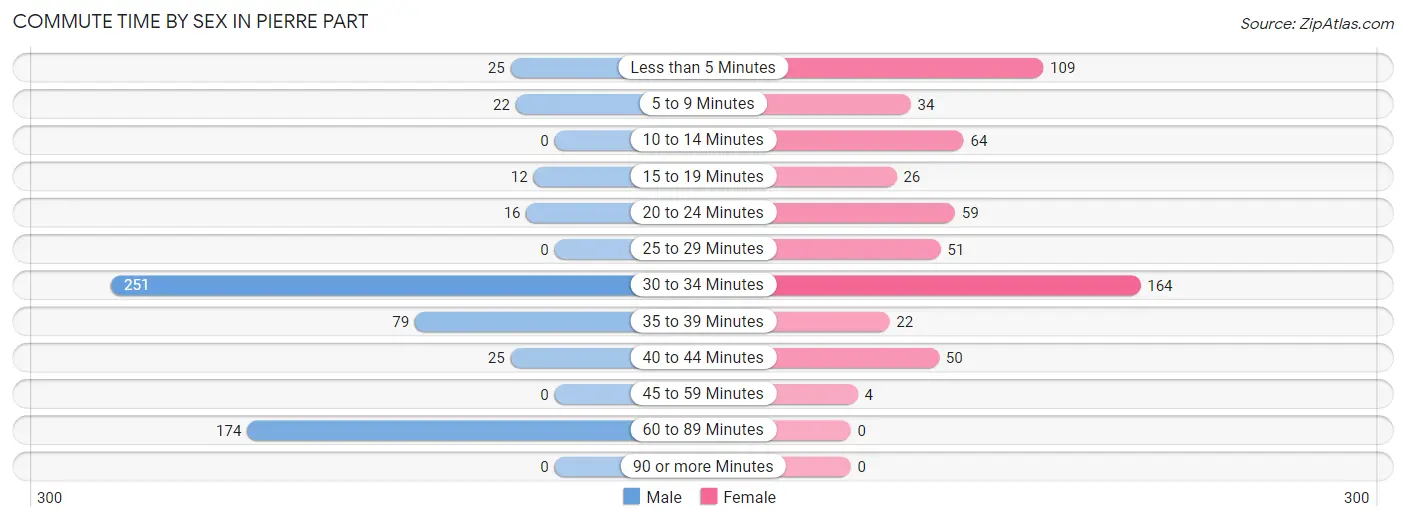
| Commute Time | Male | Female |
| Less than 5 Minutes | 25 (4.1%) | 109 (18.7%) |
| 5 to 9 Minutes | 22 (3.6%) | 34 (5.8%) |
| 10 to 14 Minutes | 0 (0.0%) | 64 (11.0%) |
| 15 to 19 Minutes | 12 (2.0%) | 26 (4.5%) |
| 20 to 24 Minutes | 16 (2.6%) | 59 (10.1%) |
| 25 to 29 Minutes | 0 (0.0%) | 51 (8.7%) |
| 30 to 34 Minutes | 251 (41.6%) | 164 (28.1%) |
| 35 to 39 Minutes | 79 (13.1%) | 22 (3.8%) |
| 40 to 44 Minutes | 25 (4.1%) | 50 (8.6%) |
| 45 to 59 Minutes | 0 (0.0%) | 4 (0.7%) |
| 60 to 89 Minutes | 174 (28.8%) | 0 (0.0%) |
| 90 or more Minutes | 0 (0.0%) | 0 (0.0%) |
Time of Departure to Work by Sex in Pierre Part
The most frequent times of departure to work in Pierre Part are 12:00 AM to 4:59 AM (296, 49.0%) for males and 7:30 AM to 7:59 AM (157, 26.9%) for females.
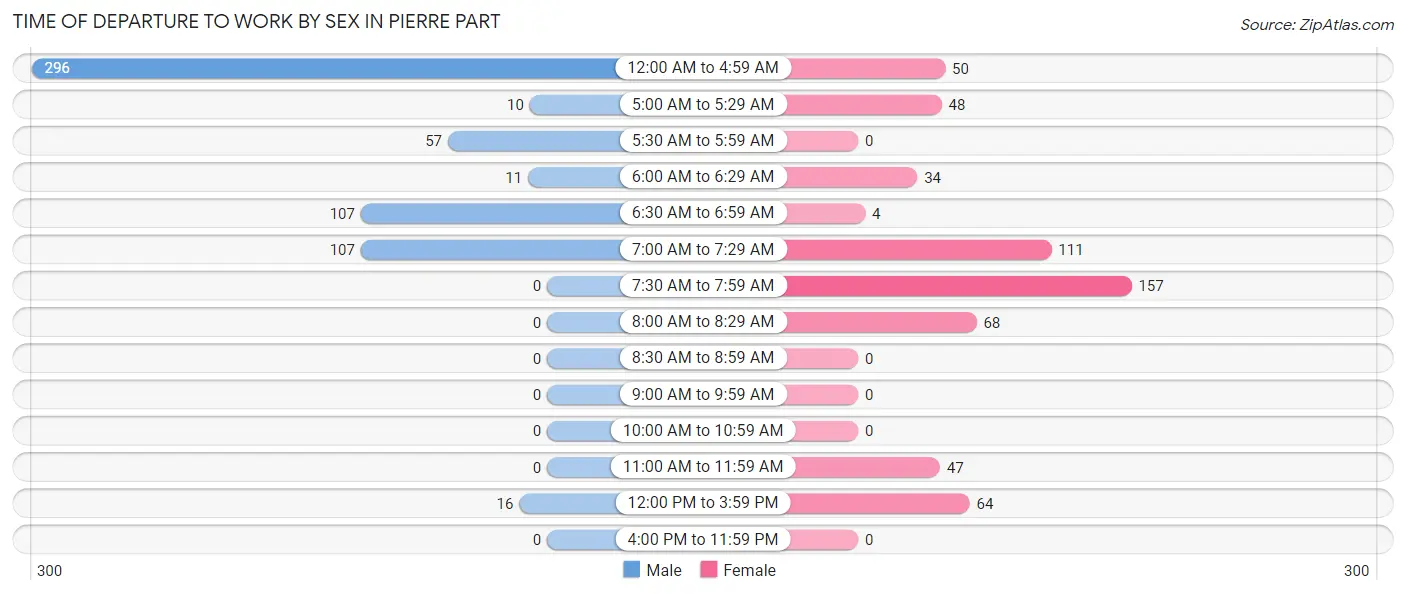
| Time of Departure | Male | Female |
| 12:00 AM to 4:59 AM | 296 (49.0%) | 50 (8.6%) |
| 5:00 AM to 5:29 AM | 10 (1.7%) | 48 (8.2%) |
| 5:30 AM to 5:59 AM | 57 (9.4%) | 0 (0.0%) |
| 6:00 AM to 6:29 AM | 11 (1.8%) | 34 (5.8%) |
| 6:30 AM to 6:59 AM | 107 (17.7%) | 4 (0.7%) |
| 7:00 AM to 7:29 AM | 107 (17.7%) | 111 (19.0%) |
| 7:30 AM to 7:59 AM | 0 (0.0%) | 157 (26.9%) |
| 8:00 AM to 8:29 AM | 0 (0.0%) | 68 (11.7%) |
| 8:30 AM to 8:59 AM | 0 (0.0%) | 0 (0.0%) |
| 9:00 AM to 9:59 AM | 0 (0.0%) | 0 (0.0%) |
| 10:00 AM to 10:59 AM | 0 (0.0%) | 0 (0.0%) |
| 11:00 AM to 11:59 AM | 0 (0.0%) | 47 (8.1%) |
| 12:00 PM to 3:59 PM | 16 (2.6%) | 64 (11.0%) |
| 4:00 PM to 11:59 PM | 0 (0.0%) | 0 (0.0%) |
| Total | 604 (100.0%) | 583 (100.0%) |
Housing Occupancy in Pierre Part
Occupancy by Ownership in Pierre Part
Of the total 941 dwellings in Pierre Part, owner-occupied units account for 821 (87.3%), while renter-occupied units make up 120 (12.8%).
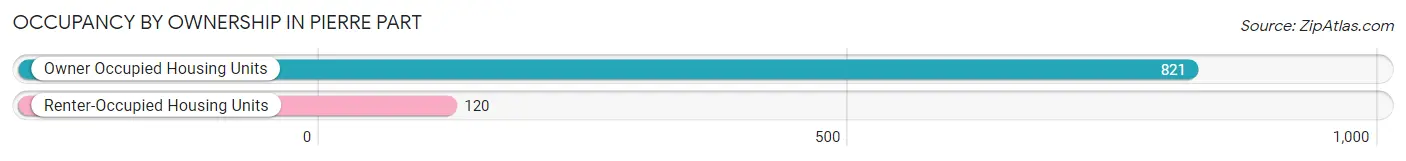
| Occupancy | # Housing Units | % Housing Units |
| Owner Occupied Housing Units | 821 | 87.3% |
| Renter-Occupied Housing Units | 120 | 12.8% |
| Total Occupied Housing Units | 941 | 100.0% |
Occupancy by Household Size in Pierre Part
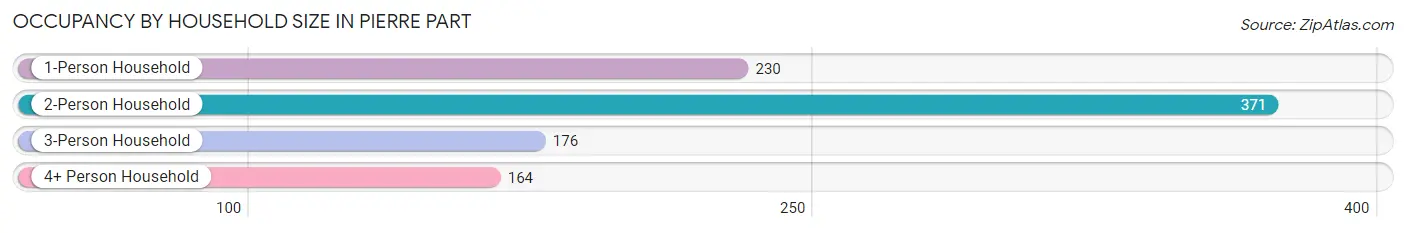
| Household Size | # Housing Units | % Housing Units |
| 1-Person Household | 230 | 24.4% |
| 2-Person Household | 371 | 39.4% |
| 3-Person Household | 176 | 18.7% |
| 4+ Person Household | 164 | 17.4% |
| Total Housing Units | 941 | 100.0% |
Occupancy by Ownership by Household Size in Pierre Part
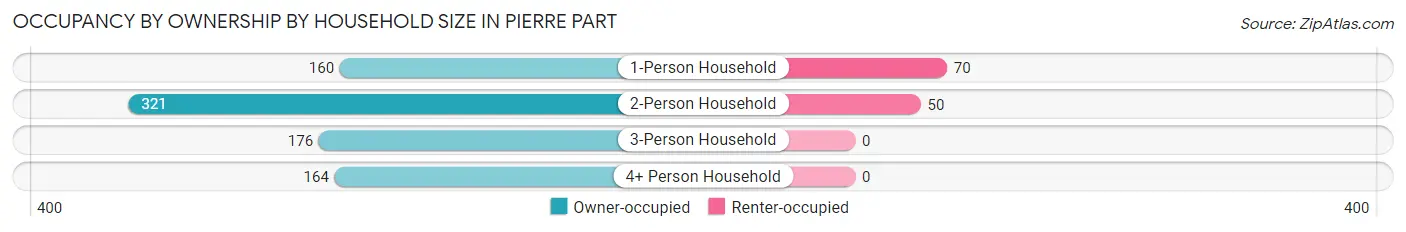
| Household Size | Owner-occupied | Renter-occupied |
| 1-Person Household | 160 (69.6%) | 70 (30.4%) |
| 2-Person Household | 321 (86.5%) | 50 (13.5%) |
| 3-Person Household | 176 (100.0%) | 0 (0.0%) |
| 4+ Person Household | 164 (100.0%) | 0 (0.0%) |
| Total Housing Units | 821 (87.3%) | 120 (12.8%) |
Occupancy by Educational Attainment in Pierre Part
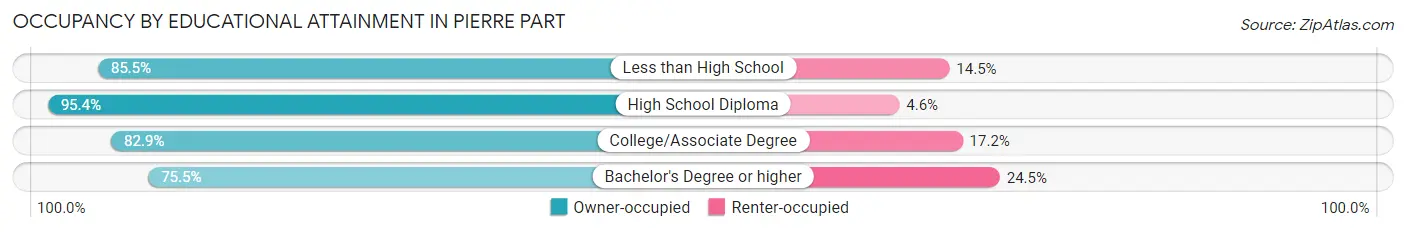
| Household Size | Owner-occupied | Renter-occupied |
| Less than High School | 53 (85.5%) | 9 (14.5%) |
| High School Diploma | 416 (95.4%) | 20 (4.6%) |
| College/Associate Degree | 198 (82.9%) | 41 (17.2%) |
| Bachelor's Degree or higher | 154 (75.5%) | 50 (24.5%) |
Occupancy by Age of Householder in Pierre Part
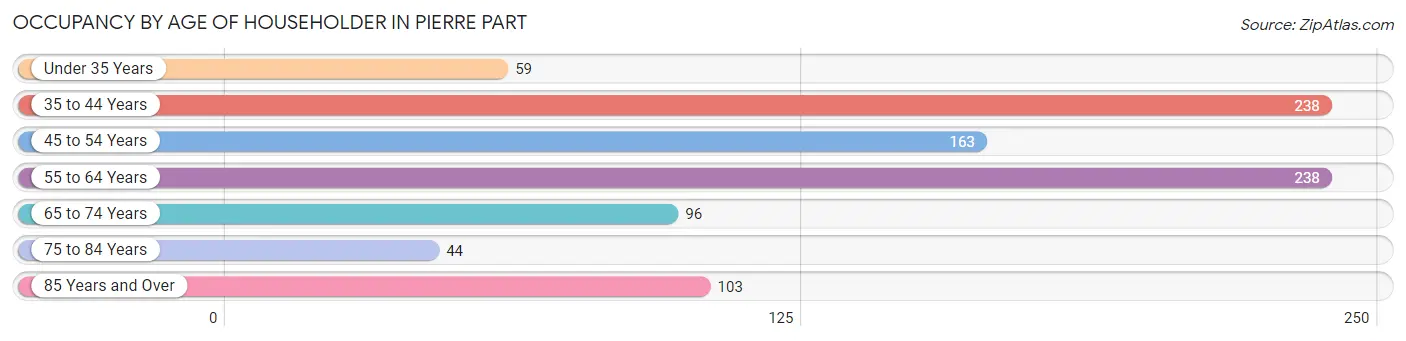
| Age Bracket | # Households | % Households |
| Under 35 Years | 59 | 6.3% |
| 35 to 44 Years | 238 | 25.3% |
| 45 to 54 Years | 163 | 17.3% |
| 55 to 64 Years | 238 | 25.3% |
| 65 to 74 Years | 96 | 10.2% |
| 75 to 84 Years | 44 | 4.7% |
| 85 Years and Over | 103 | 11.0% |
| Total | 941 | 100.0% |
Housing Finances in Pierre Part
Median Income by Occupancy in Pierre Part
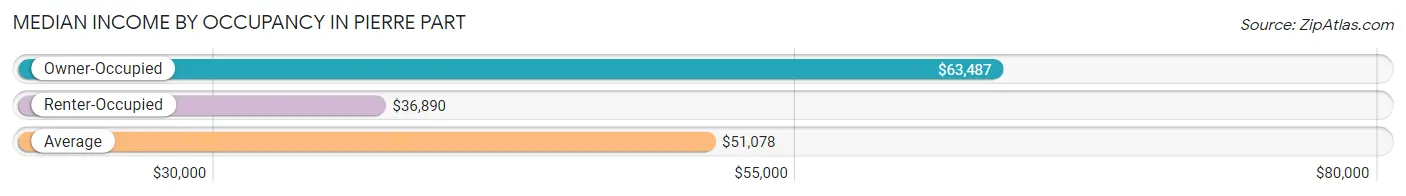
| Occupancy Type | # Households | Median Income |
| Owner-Occupied | 821 (87.3%) | $63,487 |
| Renter-Occupied | 120 (12.8%) | $36,890 |
| Average | 941 (100.0%) | $51,078 |
Occupancy by Householder Income Bracket in Pierre Part
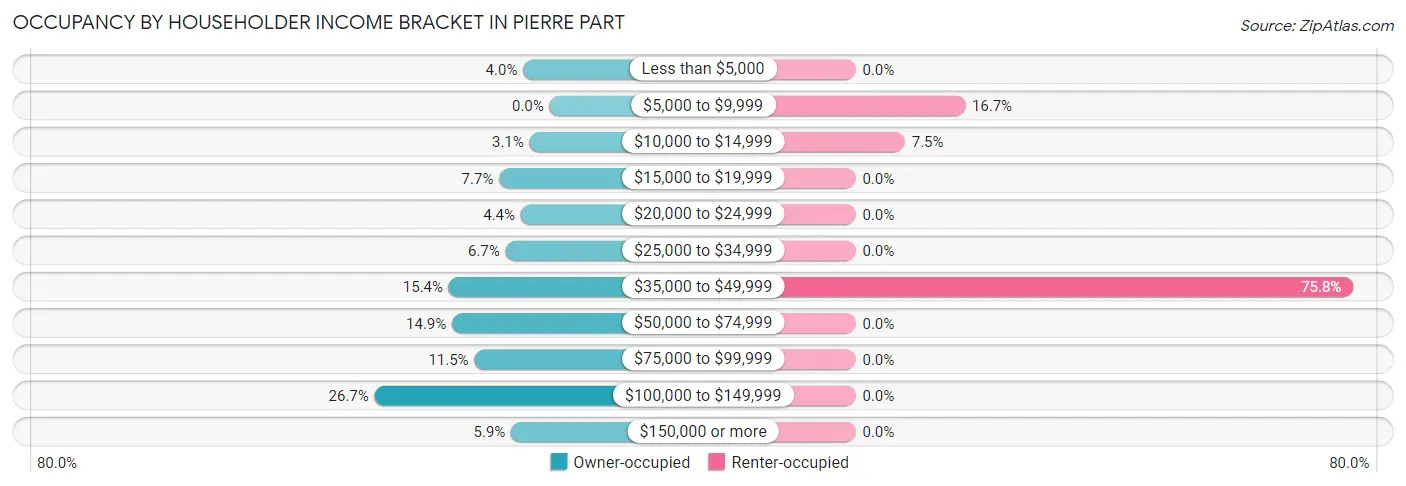
| Income Bracket | Owner-occupied | Renter-occupied |
| Less than $5,000 | 33 (4.0%) | 0 (0.0%) |
| $5,000 to $9,999 | 0 (0.0%) | 20 (16.7%) |
| $10,000 to $14,999 | 25 (3.0%) | 9 (7.5%) |
| $15,000 to $19,999 | 63 (7.7%) | 0 (0.0%) |
| $20,000 to $24,999 | 36 (4.4%) | 0 (0.0%) |
| $25,000 to $34,999 | 55 (6.7%) | 0 (0.0%) |
| $35,000 to $49,999 | 126 (15.3%) | 91 (75.8%) |
| $50,000 to $74,999 | 122 (14.9%) | 0 (0.0%) |
| $75,000 to $99,999 | 94 (11.5%) | 0 (0.0%) |
| $100,000 to $149,999 | 219 (26.7%) | 0 (0.0%) |
| $150,000 or more | 48 (5.9%) | 0 (0.0%) |
| Total | 821 (100.0%) | 120 (100.0%) |
Monthly Housing Cost Tiers in Pierre Part
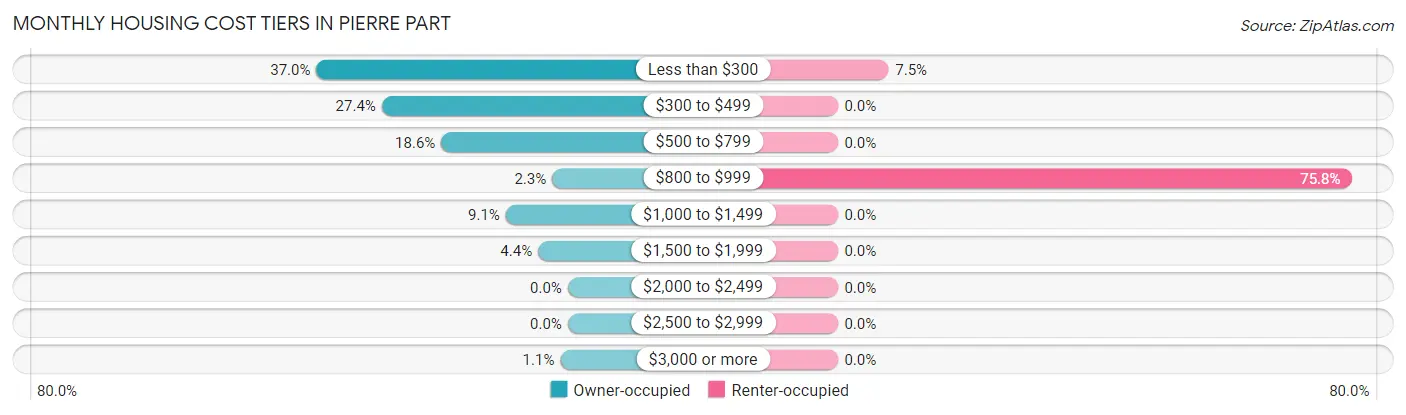
| Monthly Cost | Owner-occupied | Renter-occupied |
| Less than $300 | 304 (37.0%) | 9 (7.5%) |
| $300 to $499 | 225 (27.4%) | 0 (0.0%) |
| $500 to $799 | 153 (18.6%) | 0 (0.0%) |
| $800 to $999 | 19 (2.3%) | 91 (75.8%) |
| $1,000 to $1,499 | 75 (9.1%) | 0 (0.0%) |
| $1,500 to $1,999 | 36 (4.4%) | 0 (0.0%) |
| $2,000 to $2,499 | 0 (0.0%) | 0 (0.0%) |
| $2,500 to $2,999 | 0 (0.0%) | 0 (0.0%) |
| $3,000 or more | 9 (1.1%) | 0 (0.0%) |
| Total | 821 (100.0%) | 120 (100.0%) |
Physical Housing Characteristics in Pierre Part
Housing Structures in Pierre Part
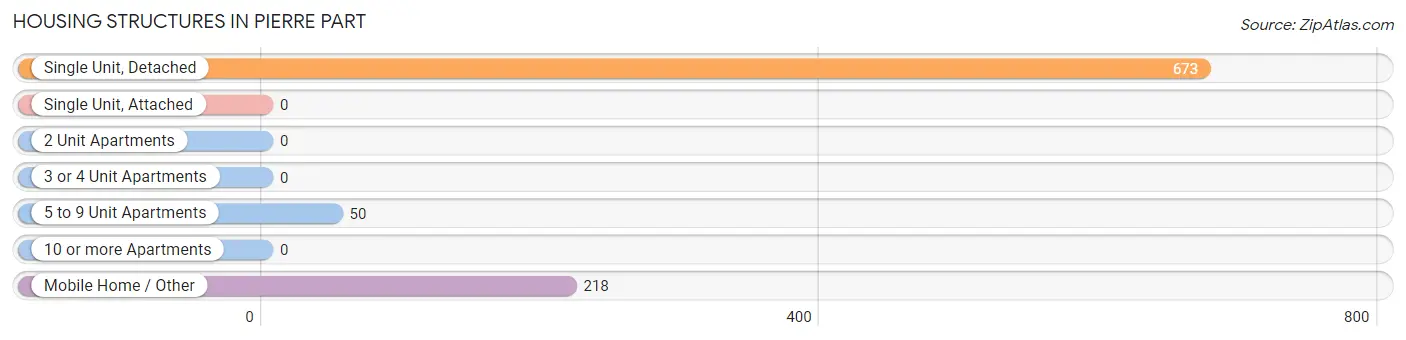
| Structure Type | # Housing Units | % Housing Units |
| Single Unit, Detached | 673 | 71.5% |
| Single Unit, Attached | 0 | 0.0% |
| 2 Unit Apartments | 0 | 0.0% |
| 3 or 4 Unit Apartments | 0 | 0.0% |
| 5 to 9 Unit Apartments | 50 | 5.3% |
| 10 or more Apartments | 0 | 0.0% |
| Mobile Home / Other | 218 | 23.2% |
| Total | 941 | 100.0% |
Housing Structures by Occupancy in Pierre Part
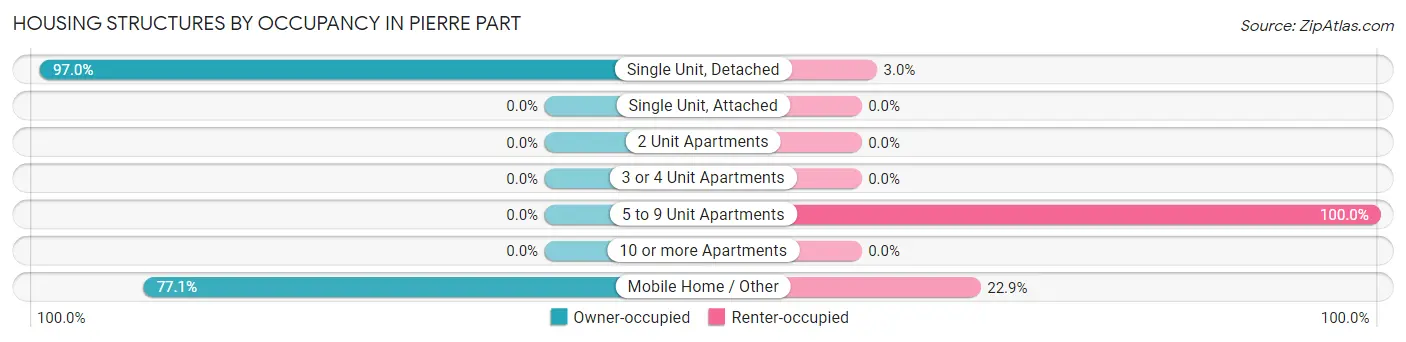
| Structure Type | Owner-occupied | Renter-occupied |
| Single Unit, Detached | 653 (97.0%) | 20 (3.0%) |
| Single Unit, Attached | 0 (0.0%) | 0 (0.0%) |
| 2 Unit Apartments | 0 (0.0%) | 0 (0.0%) |
| 3 or 4 Unit Apartments | 0 (0.0%) | 0 (0.0%) |
| 5 to 9 Unit Apartments | 0 (0.0%) | 50 (100.0%) |
| 10 or more Apartments | 0 (0.0%) | 0 (0.0%) |
| Mobile Home / Other | 168 (77.1%) | 50 (22.9%) |
| Total | 821 (87.3%) | 120 (12.8%) |
Housing Structures by Number of Rooms in Pierre Part
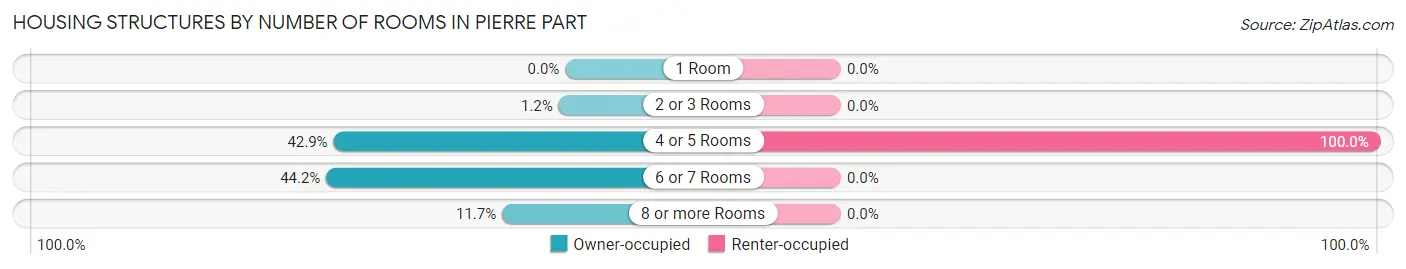
| Number of Rooms | Owner-occupied | Renter-occupied |
| 1 Room | 0 (0.0%) | 0 (0.0%) |
| 2 or 3 Rooms | 10 (1.2%) | 0 (0.0%) |
| 4 or 5 Rooms | 352 (42.9%) | 120 (100.0%) |
| 6 or 7 Rooms | 363 (44.2%) | 0 (0.0%) |
| 8 or more Rooms | 96 (11.7%) | 0 (0.0%) |
| Total | 821 (100.0%) | 120 (100.0%) |
Housing Structure by Heating Type in Pierre Part
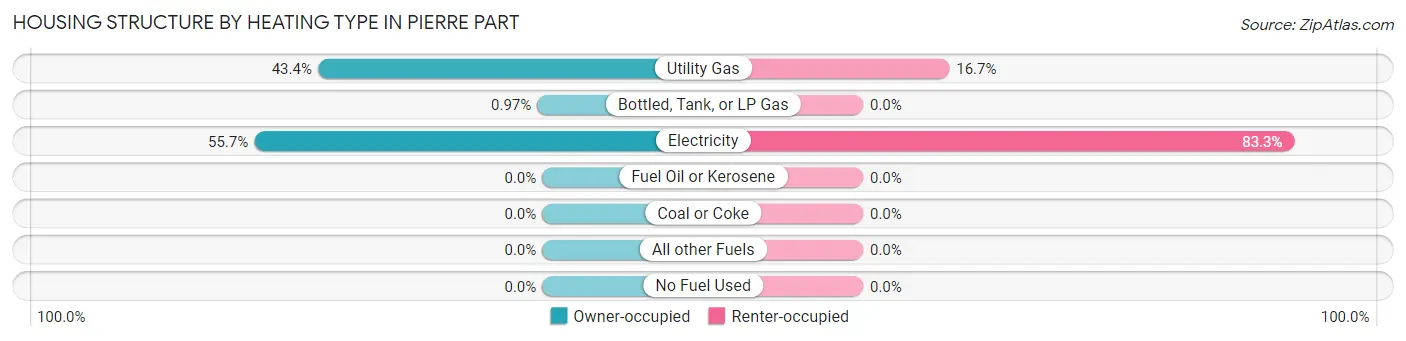
| Heating Type | Owner-occupied | Renter-occupied |
| Utility Gas | 356 (43.4%) | 20 (16.7%) |
| Bottled, Tank, or LP Gas | 8 (1.0%) | 0 (0.0%) |
| Electricity | 457 (55.7%) | 100 (83.3%) |
| Fuel Oil or Kerosene | 0 (0.0%) | 0 (0.0%) |
| Coal or Coke | 0 (0.0%) | 0 (0.0%) |
| All other Fuels | 0 (0.0%) | 0 (0.0%) |
| No Fuel Used | 0 (0.0%) | 0 (0.0%) |
| Total | 821 (100.0%) | 120 (100.0%) |
Household Vehicle Usage in Pierre Part
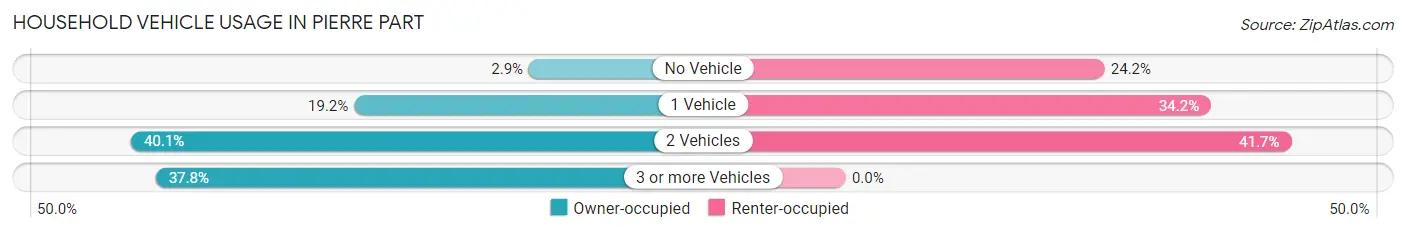
| Vehicles per Household | Owner-occupied | Renter-occupied |
| No Vehicle | 24 (2.9%) | 29 (24.2%) |
| 1 Vehicle | 158 (19.2%) | 41 (34.2%) |
| 2 Vehicles | 329 (40.1%) | 50 (41.7%) |
| 3 or more Vehicles | 310 (37.8%) | 0 (0.0%) |
| Total | 821 (100.0%) | 120 (100.0%) |
Real Estate & Mortgages in Pierre Part
Real Estate and Mortgage Overview in Pierre Part
| Characteristic | Without Mortgage | With Mortgage |
| Housing Units | 602 | 219 |
| Median Property Value | $162,800 | $154,500 |
| Median Household Income | $57,692 | $31 |
| Monthly Housing Costs | $299 | $9 |
| Real Estate Taxes | $636 | $27 |
Property Value by Mortgage Status in Pierre Part
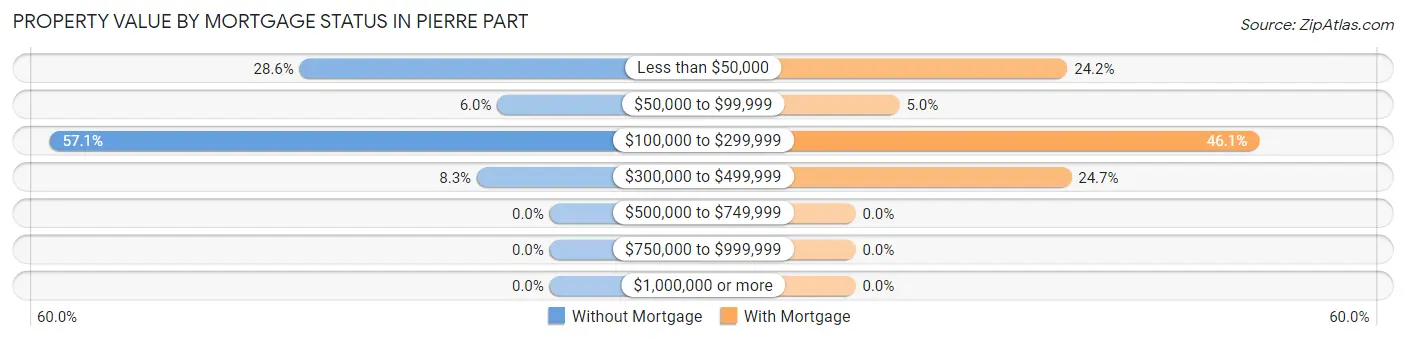
| Property Value | Without Mortgage | With Mortgage |
| Less than $50,000 | 172 (28.6%) | 53 (24.2%) |
| $50,000 to $99,999 | 36 (6.0%) | 11 (5.0%) |
| $100,000 to $299,999 | 344 (57.1%) | 101 (46.1%) |
| $300,000 to $499,999 | 50 (8.3%) | 54 (24.7%) |
| $500,000 to $749,999 | 0 (0.0%) | 0 (0.0%) |
| $750,000 to $999,999 | 0 (0.0%) | 0 (0.0%) |
| $1,000,000 or more | 0 (0.0%) | 0 (0.0%) |
| Total | 602 (100.0%) | 219 (100.0%) |
Household Income by Mortgage Status in Pierre Part
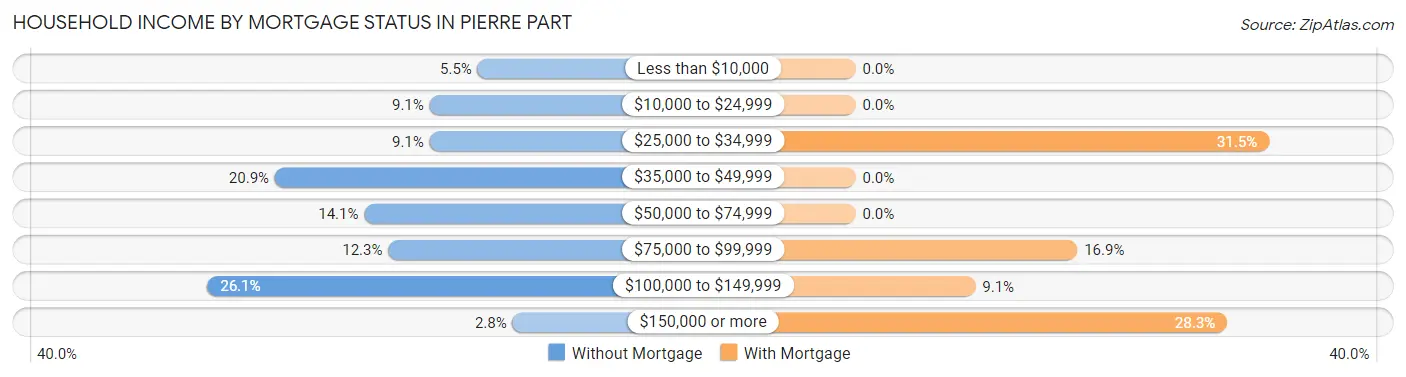
| Household Income | Without Mortgage | With Mortgage |
| Less than $10,000 | 33 (5.5%) | 0 (0.0%) |
| $10,000 to $24,999 | 55 (9.1%) | 0 (0.0%) |
| $25,000 to $34,999 | 55 (9.1%) | 69 (31.5%) |
| $35,000 to $49,999 | 126 (20.9%) | 0 (0.0%) |
| $50,000 to $74,999 | 85 (14.1%) | 0 (0.0%) |
| $75,000 to $99,999 | 74 (12.3%) | 37 (16.9%) |
| $100,000 to $149,999 | 157 (26.1%) | 20 (9.1%) |
| $150,000 or more | 17 (2.8%) | 62 (28.3%) |
| Total | 602 (100.0%) | 219 (100.0%) |
Property Value to Household Income Ratio in Pierre Part
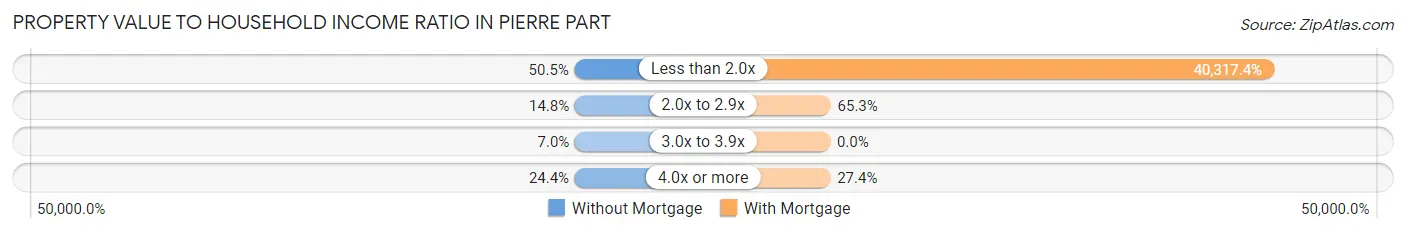
| Value-to-Income Ratio | Without Mortgage | With Mortgage |
| Less than 2.0x | 304 (50.5%) | 88,295 (40,317.3%) |
| 2.0x to 2.9x | 89 (14.8%) | 143 (65.3%) |
| 3.0x to 3.9x | 42 (7.0%) | 0 (0.0%) |
| 4.0x or more | 147 (24.4%) | 60 (27.4%) |
| Total | 602 (100.0%) | 219 (100.0%) |
Real Estate Taxes by Mortgage Status in Pierre Part
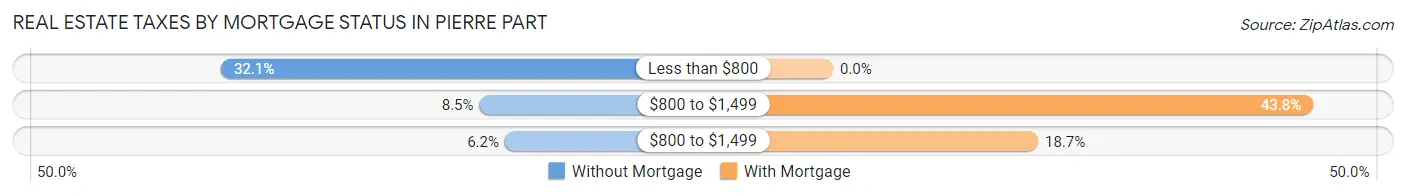
| Property Taxes | Without Mortgage | With Mortgage |
| Less than $800 | 193 (32.1%) | 0 (0.0%) |
| $800 to $1,499 | 51 (8.5%) | 96 (43.8%) |
| $800 to $1,499 | 37 (6.1%) | 41 (18.7%) |
| Total | 602 (100.0%) | 219 (100.0%) |
Health & Disability in Pierre Part
Health Insurance Coverage by Age in Pierre Part
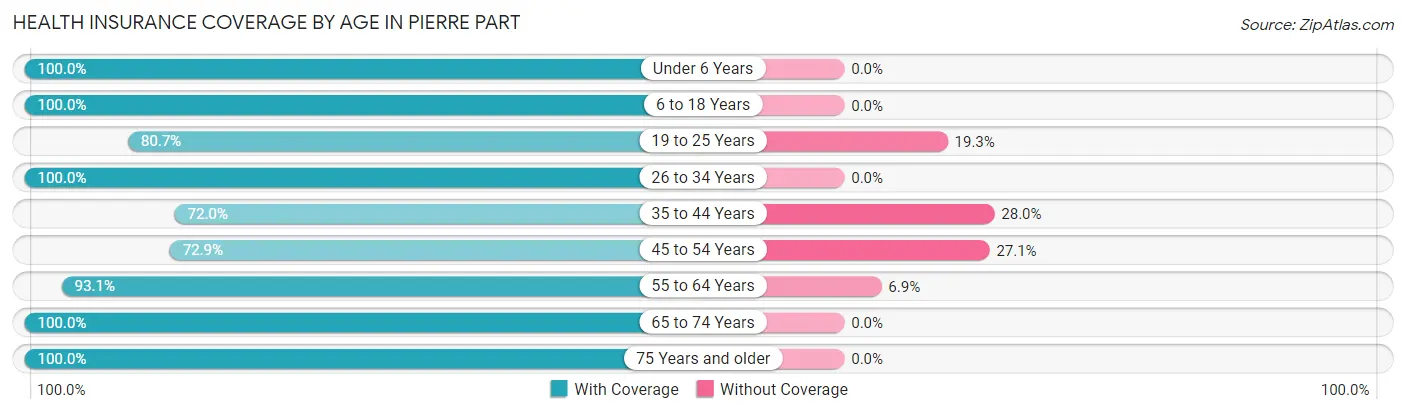
| Age Bracket | With Coverage | Without Coverage |
| Under 6 Years | 22 (100.0%) | 0 (0.0%) |
| 6 to 18 Years | 461 (100.0%) | 0 (0.0%) |
| 19 to 25 Years | 243 (80.7%) | 58 (19.3%) |
| 26 to 34 Years | 94 (100.0%) | 0 (0.0%) |
| 35 to 44 Years | 296 (72.0%) | 115 (28.0%) |
| 45 to 54 Years | 194 (72.9%) | 72 (27.1%) |
| 55 to 64 Years | 484 (93.1%) | 36 (6.9%) |
| 65 to 74 Years | 135 (100.0%) | 0 (0.0%) |
| 75 Years and older | 237 (100.0%) | 0 (0.0%) |
| Total | 2,166 (88.5%) | 281 (11.5%) |
Health Insurance Coverage by Citizenship Status in Pierre Part
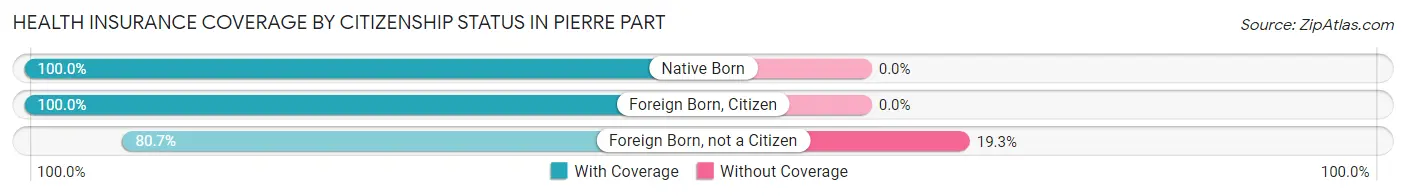
| Citizenship Status | With Coverage | Without Coverage |
| Native Born | 22 (100.0%) | 0 (0.0%) |
| Foreign Born, Citizen | 461 (100.0%) | 0 (0.0%) |
| Foreign Born, not a Citizen | 243 (80.7%) | 58 (19.3%) |
Health Insurance Coverage by Household Income in Pierre Part
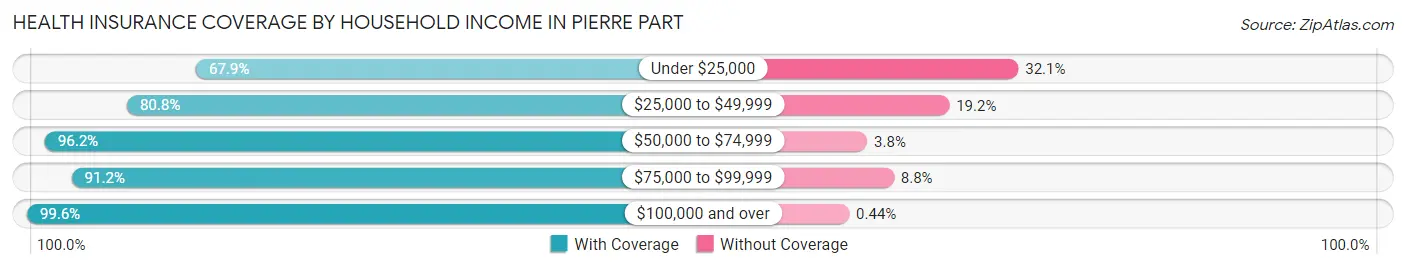
| Household Income | With Coverage | Without Coverage |
| Under $25,000 | 264 (67.9%) | 125 (32.1%) |
| $25,000 to $49,999 | 480 (80.8%) | 114 (19.2%) |
| $50,000 to $74,999 | 202 (96.2%) | 8 (3.8%) |
| $75,000 to $99,999 | 310 (91.2%) | 30 (8.8%) |
| $100,000 and over | 910 (99.6%) | 4 (0.4%) |
Public vs Private Health Insurance Coverage by Age in Pierre Part
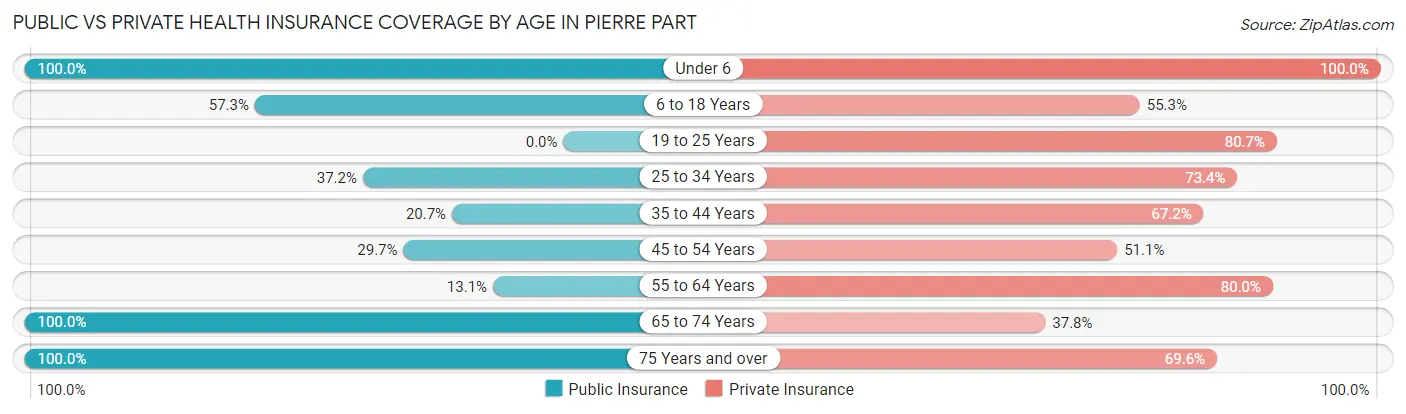
| Age Bracket | Public Insurance | Private Insurance |
| Under 6 | 22 (100.0%) | 22 (100.0%) |
| 6 to 18 Years | 264 (57.3%) | 255 (55.3%) |
| 19 to 25 Years | 0 (0.0%) | 243 (80.7%) |
| 25 to 34 Years | 35 (37.2%) | 69 (73.4%) |
| 35 to 44 Years | 85 (20.7%) | 276 (67.1%) |
| 45 to 54 Years | 79 (29.7%) | 136 (51.1%) |
| 55 to 64 Years | 68 (13.1%) | 416 (80.0%) |
| 65 to 74 Years | 135 (100.0%) | 51 (37.8%) |
| 75 Years and over | 237 (100.0%) | 165 (69.6%) |
| Total | 925 (37.8%) | 1,633 (66.7%) |
Disability Status by Sex by Age in Pierre Part
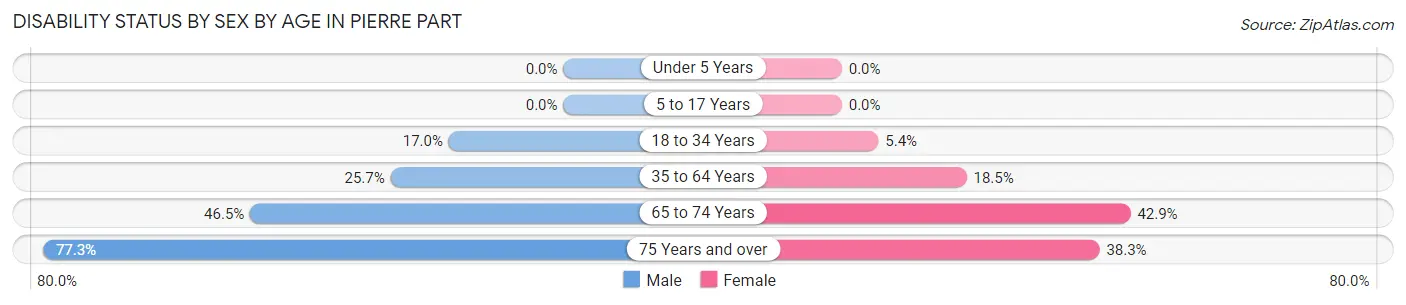
| Age Bracket | Male | Female |
| Under 5 Years | 0 (0.0%) | 0 (0.0%) |
| 5 to 17 Years | 0 (0.0%) | 0 (0.0%) |
| 18 to 34 Years | 41 (17.0%) | 10 (5.4%) |
| 35 to 64 Years | 127 (25.7%) | 130 (18.5%) |
| 65 to 74 Years | 40 (46.5%) | 21 (42.9%) |
| 75 Years and over | 68 (77.3%) | 57 (38.3%) |
Disability Class by Sex by Age in Pierre Part
Disability Class: Hearing Difficulty
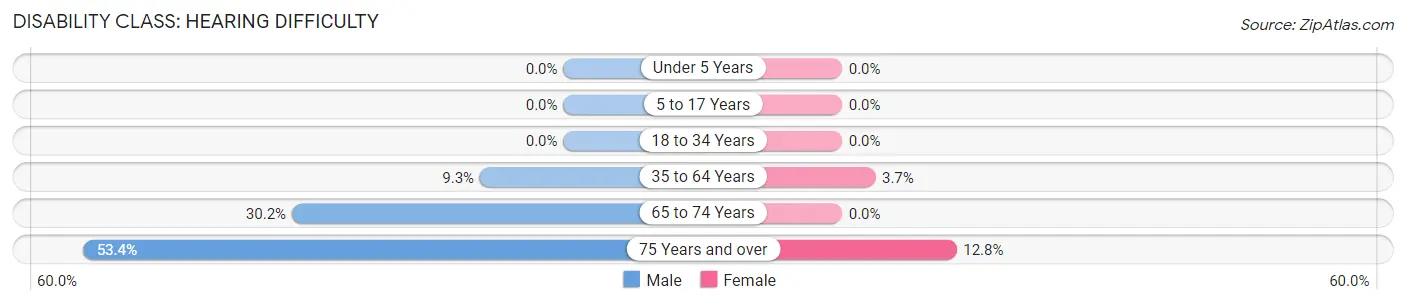
| Age Bracket | Male | Female |
| Under 5 Years | 0 (0.0%) | 0 (0.0%) |
| 5 to 17 Years | 0 (0.0%) | 0 (0.0%) |
| 18 to 34 Years | 0 (0.0%) | 0 (0.0%) |
| 35 to 64 Years | 46 (9.3%) | 26 (3.7%) |
| 65 to 74 Years | 26 (30.2%) | 0 (0.0%) |
| 75 Years and over | 47 (53.4%) | 19 (12.8%) |
Disability Class: Vision Difficulty
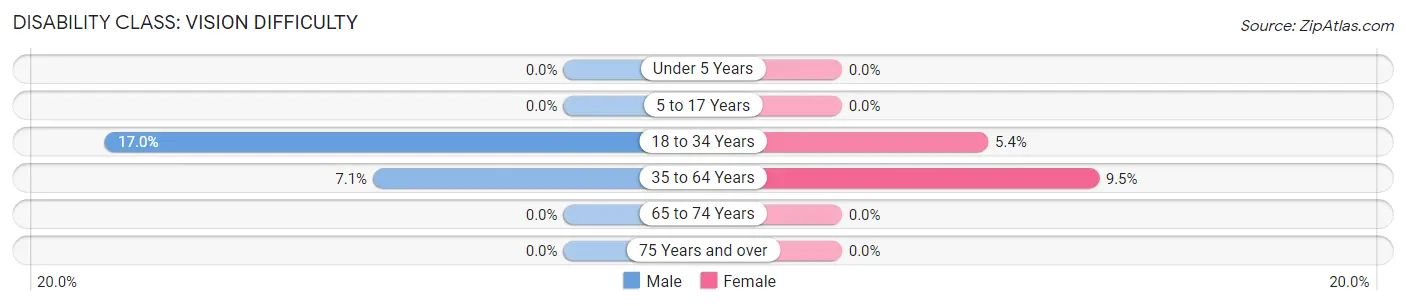
| Age Bracket | Male | Female |
| Under 5 Years | 0 (0.0%) | 0 (0.0%) |
| 5 to 17 Years | 0 (0.0%) | 0 (0.0%) |
| 18 to 34 Years | 41 (17.0%) | 10 (5.4%) |
| 35 to 64 Years | 35 (7.1%) | 67 (9.5%) |
| 65 to 74 Years | 0 (0.0%) | 0 (0.0%) |
| 75 Years and over | 0 (0.0%) | 0 (0.0%) |
Disability Class: Cognitive Difficulty
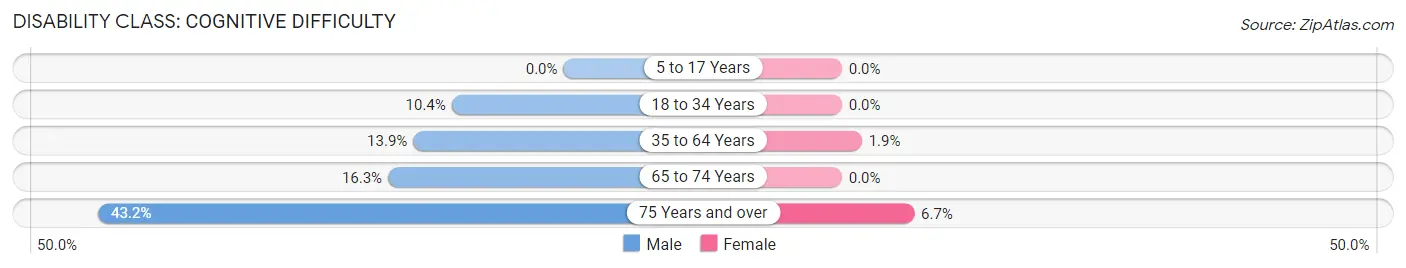
| Age Bracket | Male | Female |
| 5 to 17 Years | 0 (0.0%) | 0 (0.0%) |
| 18 to 34 Years | 25 (10.4%) | 0 (0.0%) |
| 35 to 64 Years | 69 (13.9%) | 13 (1.8%) |
| 65 to 74 Years | 14 (16.3%) | 0 (0.0%) |
| 75 Years and over | 38 (43.2%) | 10 (6.7%) |
Disability Class: Ambulatory Difficulty
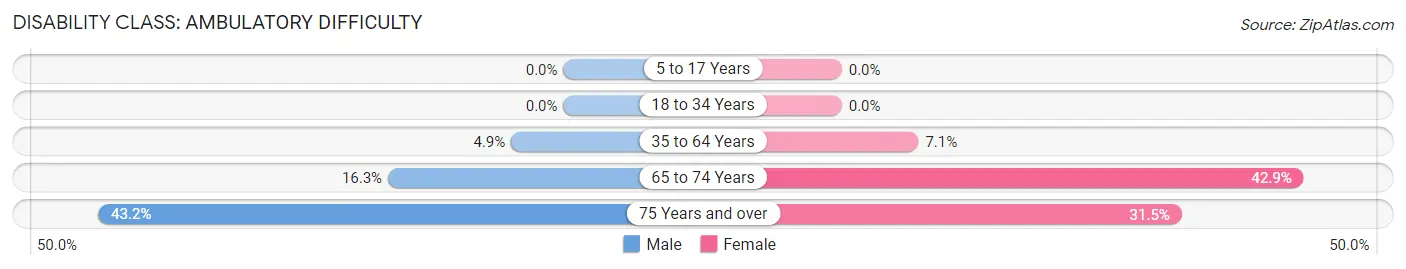
| Age Bracket | Male | Female |
| 5 to 17 Years | 0 (0.0%) | 0 (0.0%) |
| 18 to 34 Years | 0 (0.0%) | 0 (0.0%) |
| 35 to 64 Years | 24 (4.9%) | 50 (7.1%) |
| 65 to 74 Years | 14 (16.3%) | 21 (42.9%) |
| 75 Years and over | 38 (43.2%) | 47 (31.5%) |
Disability Class: Self-Care Difficulty
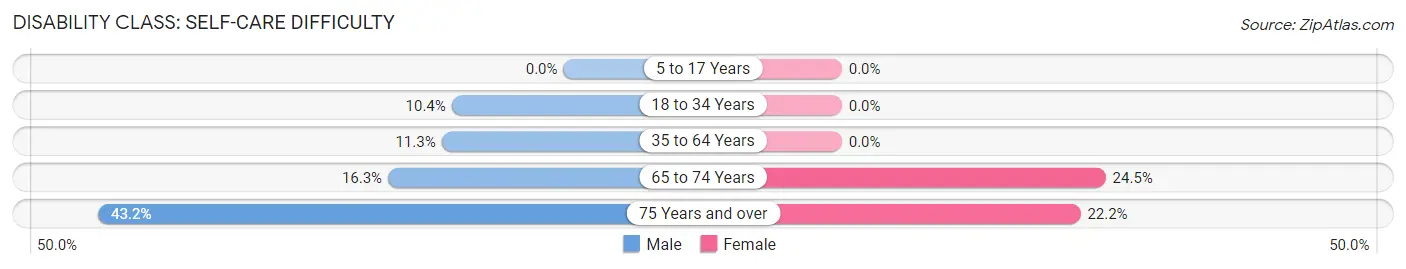
| Age Bracket | Male | Female |
| 5 to 17 Years | 0 (0.0%) | 0 (0.0%) |
| 18 to 34 Years | 25 (10.4%) | 0 (0.0%) |
| 35 to 64 Years | 56 (11.3%) | 0 (0.0%) |
| 65 to 74 Years | 14 (16.3%) | 12 (24.5%) |
| 75 Years and over | 38 (43.2%) | 33 (22.2%) |
Technology Access in Pierre Part
Computing Device Access in Pierre Part
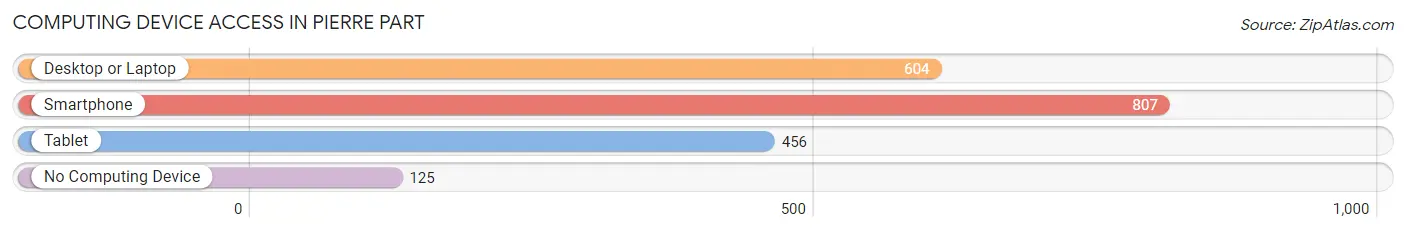
| Device Type | # Households | % Households |
| Desktop or Laptop | 604 | 64.2% |
| Smartphone | 807 | 85.8% |
| Tablet | 456 | 48.5% |
| No Computing Device | 125 | 13.3% |
| Total | 941 | 100.0% |
Internet Access in Pierre Part
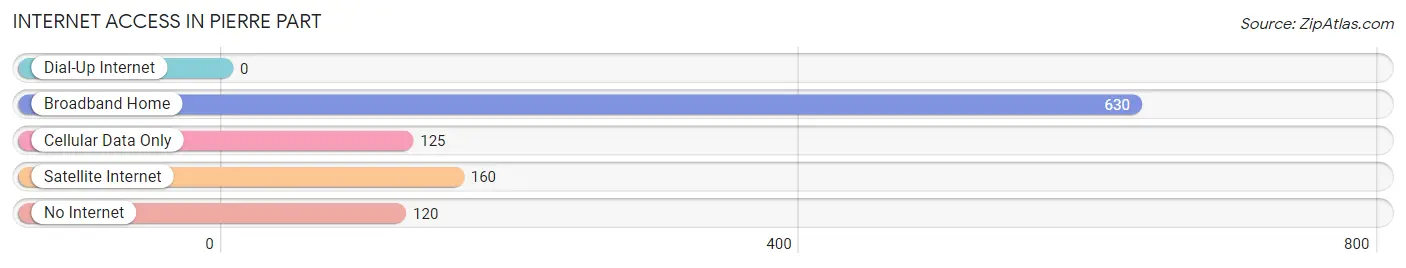
| Internet Type | # Households | % Households |
| Dial-Up Internet | 0 | 0.0% |
| Broadband Home | 630 | 66.9% |
| Cellular Data Only | 125 | 13.3% |
| Satellite Internet | 160 | 17.0% |
| No Internet | 120 | 12.8% |
| Total | 941 | 100.0% |
Pierre Part Summary
Pierre Part is a small town located in Assumption Parish, Louisiana. It is situated on the banks of the Atchafalaya River, approximately 40 miles south of Baton Rouge. The town has a population of approximately 3,000 people and is known for its Cajun culture and hospitality.
History
The area that is now Pierre Part was first settled by French-speaking Acadians in the late 1700s. The Acadians were descendants of French settlers who had been expelled from Nova Scotia in 1755. They were attracted to the area by its abundant natural resources and the opportunity to practice their Catholic faith. The town was originally known as Petit Paris, or Little Paris, and was later renamed Pierre Part in honor of Pierre Part, a prominent local landowner.
In the early 1800s, the town became a center of commerce and industry. The Atchafalaya River provided a convenient transportation route for goods and services, and the town became a hub for the lumber and fishing industries. The town also served as a port for steamboats traveling up and down the river.
In the late 1800s, the town began to experience a decline in its economic fortunes. The lumber industry had been depleted, and the steamboat traffic had decreased. The town was further impacted by the Great Depression of the 1930s.
In the 1940s, the town began to experience a resurgence in its economy. The oil and gas industry had begun to develop in the area, and the town became a center for oil and gas exploration and production. This industry continues to be a major contributor to the local economy.
Geography
Pierre Part is located in the southeastern part of Louisiana, approximately 40 miles south of Baton Rouge. The town is situated on the banks of the Atchafalaya River, which is the largest river in the state. The town is surrounded by swamps and bayous, and is home to a variety of wildlife, including alligators, turtles, and birds.
The town is located in a humid subtropical climate zone, and experiences hot, humid summers and mild winters. The average annual temperature is around 70 degrees Fahrenheit, and the average annual precipitation is around 60 inches.
Economy
The economy of Pierre Part is largely based on the oil and gas industry. The town is home to several oil and gas exploration and production companies, and the industry is a major contributor to the local economy.
In addition to the oil and gas industry, the town is also home to several other businesses, including restaurants, retail stores, and service providers. The town is also home to a number of small manufacturing companies, which produce a variety of products, including furniture, clothing, and food products.
Demographics
As of the 2010 census, the population of Pierre Part was 3,074. The town has a population density of 1,072 people per square mile. The median age of the population is 39.7 years, and the median household income is $41,945.
The racial makeup of the town is 94.3% White, 3.2% African American, 0.7% Native American, 0.3% Asian, and 1.5% from other races. The town is home to a large population of French-speaking Acadians, and the majority of the population speaks English as their primary language.
The town is served by the Assumption Parish School District, which includes two elementary schools, one middle school, and one high school. The town is also home to a branch of the Assumption Parish Library.
Conclusion
Pierre Part is a small town located in Assumption Parish, Louisiana. It is situated on the banks of the Atchafalaya River, and is known for its Cajun culture and hospitality. The town has a population of approximately 3,000 people, and the economy is largely based on the oil and gas industry. The town is home to a large population of French-speaking Acadians, and the majority of the population speaks English as their primary language. The town is served by the Assumption Parish School District, and is home to a branch of the Assumption Parish Library.
Common Questions
What is Per Capita Income in Pierre Part?
Per Capita income in Pierre Part is $34,437.
What is the Median Family Income in Pierre Part?
Median Family Income in Pierre Part is $75,964.
What is the Median Household income in Pierre Part?
Median Household Income in Pierre Part is $51,078.
What is Income or Wage Gap in Pierre Part?
Income or Wage Gap in Pierre Part is 40.6%.
Women in Pierre Part earn 59.4 cents for every dollar earned by a man.
What is Family Income Deficit in Pierre Part?
Family Income Deficit in Pierre Part is $7,566.
Families that are below poverty line in Pierre Part earn $7,566 less on average than the poverty threshold level.
What is Inequality or Gini Index in Pierre Part?
Inequality or Gini Index in Pierre Part is 0.43.
What is the Total Population of Pierre Part?
Total Population of Pierre Part is 2,447.
What is the Total Male Population of Pierre Part?
Total Male Population of Pierre Part is 1,073.
What is the Total Female Population of Pierre Part?
Total Female Population of Pierre Part is 1,374.
What is the Ratio of Males per 100 Females in Pierre Part?
There are 78.09 Males per 100 Females in Pierre Part.
What is the Ratio of Females per 100 Males in Pierre Part?
There are 128.05 Females per 100 Males in Pierre Part.
What is the Median Population Age in Pierre Part?
Median Population Age in Pierre Part is 42.5 Years.
What is the Average Family Size in Pierre Part
Average Family Size in Pierre Part is 3.2 People.
What is the Average Household Size in Pierre Part
Average Household Size in Pierre Part is 2.6 People.
How Large is the Labor Force in Pierre Part?
There are 1,389 People in the Labor Forcein in Pierre Part.
What is the Percentage of People in the Labor Force in Pierre Part?
66.0% of People are in the Labor Force in Pierre Part.
What is the Unemployment Rate in Pierre Part?
Unemployment Rate in Pierre Part is 7.5%.