Pearl River, LA Map & Demographics
Pearl River Map
Pearl River Overview
$37,198
PER CAPITA INCOME
$68,333
AVG FAMILY INCOME
$59,702
AVG HOUSEHOLD INCOME
15.8%
WAGE / INCOME GAP [ % ]
84.2¢/ $1
WAGE / INCOME GAP [ $ ]
0.51
INEQUALITY / GINI INDEX
2,584
TOTAL POPULATION
1,460
MALE POPULATION
1,124
FEMALE POPULATION
129.89
MALES / 100 FEMALES
76.99
FEMALES / 100 MALES
40.6
MEDIAN AGE
3.0
AVG FAMILY SIZE
2.7
AVG HOUSEHOLD SIZE
1,432
LABOR FORCE [ PEOPLE ]
69.7%
PERCENT IN LABOR FORCE
4.6%
UNEMPLOYMENT RATE
Pearl River Zip Codes
Pearl River Area Codes
Income in Pearl River
Income Overview in Pearl River
Per Capita Income in Pearl River is $37,198, while median incomes of families and households are $68,333 and $59,702 respectively.
| Characteristic | Number | Measure |
| Per Capita Income | 2,584 | $37,198 |
| Median Family Income | 730 | $68,333 |
| Mean Family Income | 730 | $111,308 |
| Median Household Income | 972 | $59,702 |
| Mean Household Income | 972 | $98,122 |
| Income Deficit | 730 | $0 |
| Wage / Income Gap (%) | 2,584 | 15.80% |
| Wage / Income Gap ($) | 2,584 | 84.20¢ per $1 |
| Gini / Inequality Index | 2,584 | 0.51 |
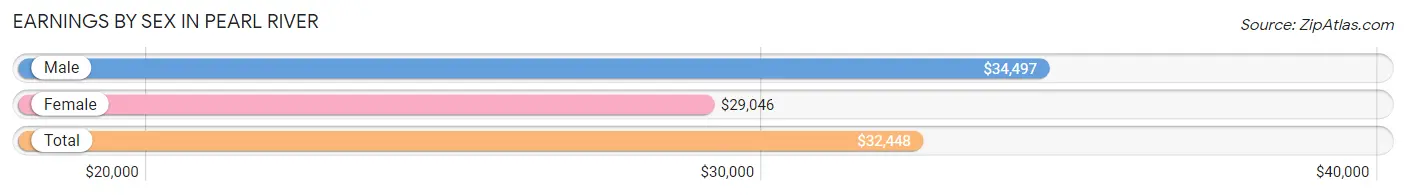
Earnings by Sex in Pearl River
Average Earnings in Pearl River are $32,448, $34,497 for men and $29,046 for women, a difference of 15.8%.
| Sex | Number | Average Earnings |
| Male | 857 (59.1%) | $34,497 |
| Female | 594 (40.9%) | $29,046 |
| Total | 1,451 (100.0%) | $32,448 |
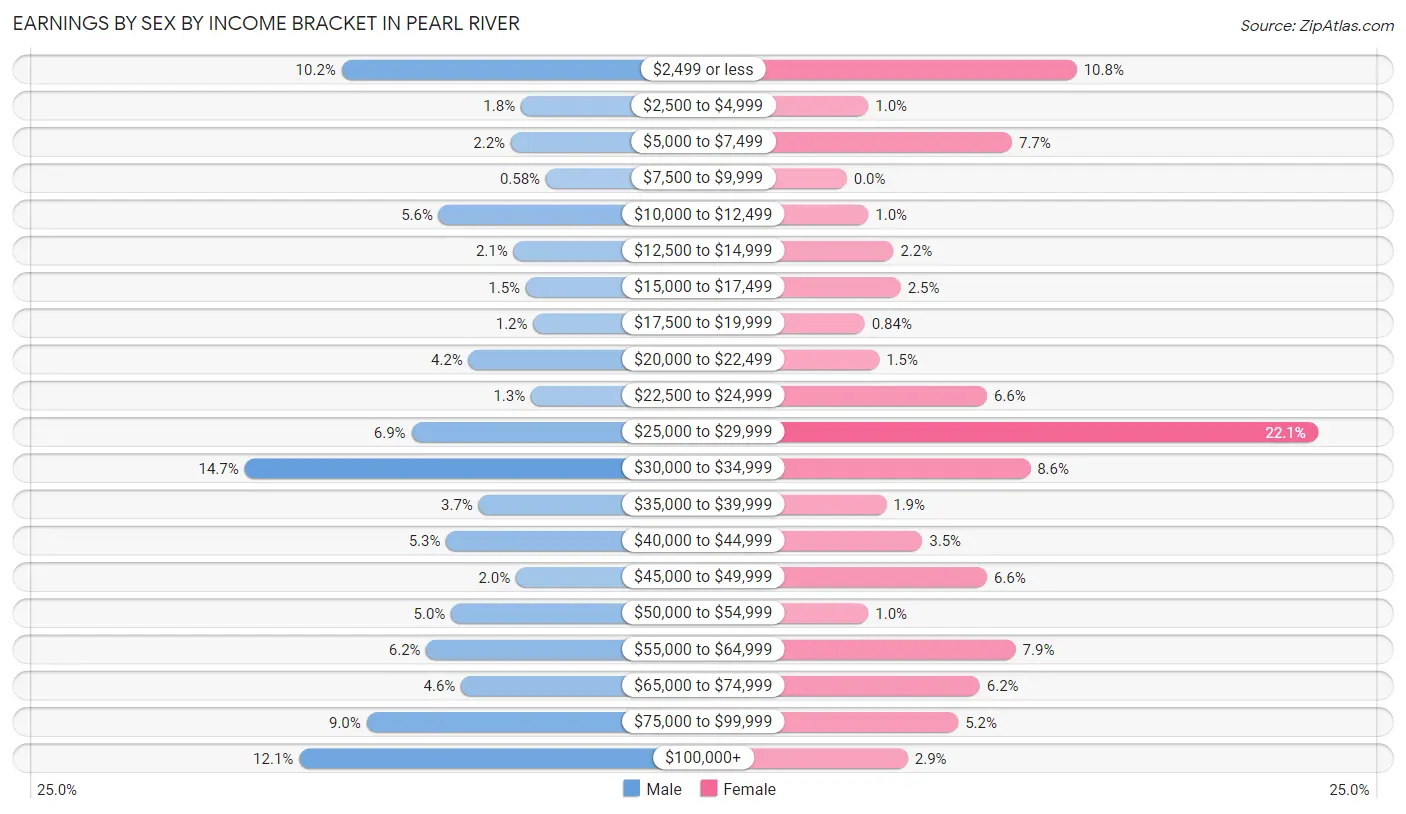
Earnings by Sex by Income Bracket in Pearl River
The most common earnings brackets in Pearl River are $30,000 to $34,999 for men (126 | 14.7%) and $25,000 to $29,999 for women (131 | 22.1%).
| Income | Male | Female |
| $2,499 or less | 87 (10.2%) | 64 (10.8%) |
| $2,500 to $4,999 | 15 (1.8%) | 6 (1.0%) |
| $5,000 to $7,499 | 19 (2.2%) | 46 (7.7%) |
| $7,500 to $9,999 | 5 (0.6%) | 0 (0.0%) |
| $10,000 to $12,499 | 48 (5.6%) | 6 (1.0%) |
| $12,500 to $14,999 | 18 (2.1%) | 13 (2.2%) |
| $15,000 to $17,499 | 13 (1.5%) | 15 (2.5%) |
| $17,500 to $19,999 | 10 (1.2%) | 5 (0.8%) |
| $20,000 to $22,499 | 36 (4.2%) | 9 (1.5%) |
| $22,500 to $24,999 | 11 (1.3%) | 39 (6.6%) |
| $25,000 to $29,999 | 59 (6.9%) | 131 (22.1%) |
| $30,000 to $34,999 | 126 (14.7%) | 51 (8.6%) |
| $35,000 to $39,999 | 32 (3.7%) | 11 (1.8%) |
| $40,000 to $44,999 | 45 (5.2%) | 21 (3.5%) |
| $45,000 to $49,999 | 17 (2.0%) | 39 (6.6%) |
| $50,000 to $54,999 | 43 (5.0%) | 6 (1.0%) |
| $55,000 to $64,999 | 53 (6.2%) | 47 (7.9%) |
| $65,000 to $74,999 | 39 (4.5%) | 37 (6.2%) |
| $75,000 to $99,999 | 77 (9.0%) | 31 (5.2%) |
| $100,000+ | 104 (12.1%) | 17 (2.9%) |
| Total | 857 (100.0%) | 594 (100.0%) |
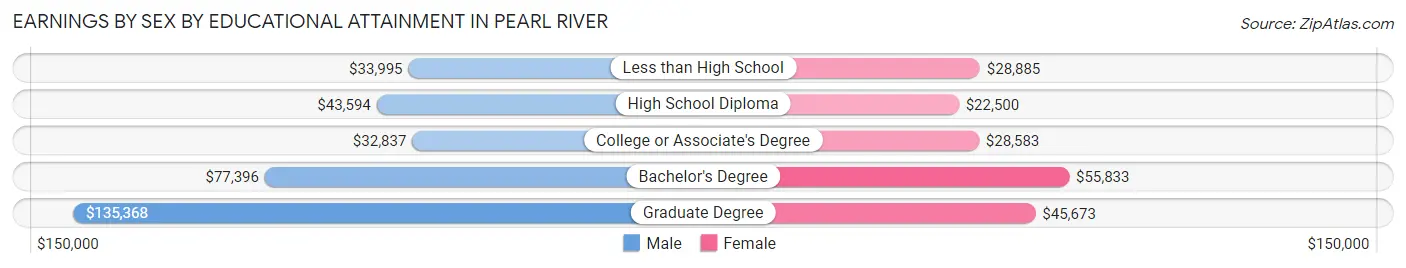
Earnings by Sex by Educational Attainment in Pearl River
Average earnings in Pearl River are $43,237 for men and $30,230 for women, a difference of 30.1%. Men with an educational attainment of graduate degree enjoy the highest average annual earnings of $135,368, while those with college or associate's degree education earn the least with $32,837. Women with an educational attainment of bachelor's degree earn the most with the average annual earnings of $55,833, while those with high school diploma education have the smallest earnings of $22,500.
| Educational Attainment | Male Income | Female Income |
| Less than High School | $33,995 | $28,885 |
| High School Diploma | $43,594 | $22,500 |
| College or Associate's Degree | $32,837 | $28,583 |
| Bachelor's Degree | $77,396 | $55,833 |
| Graduate Degree | $135,368 | $45,673 |
| Total | $43,237 | $30,230 |
Family Income in Pearl River
Family Income Brackets in Pearl River
According to the Pearl River family income data, there are 165 families falling into the $50,000 to $74,999 income range, which is the most common income bracket and makes up 22.6% of all families.
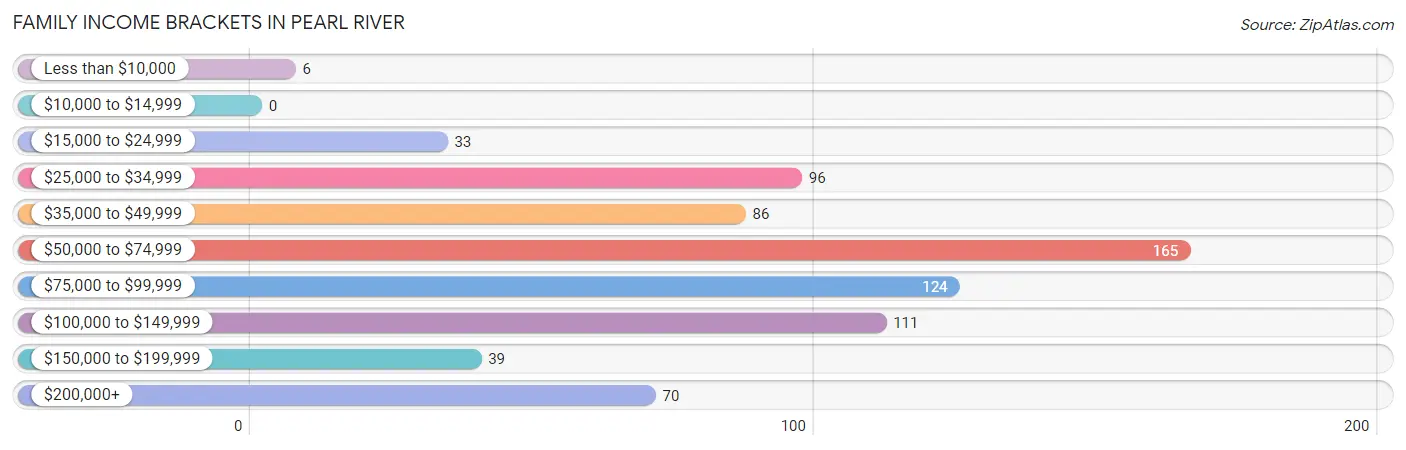
| Income Bracket | # Families | % Families |
| Less than $10,000 | 6 | 0.8% |
| $10,000 to $14,999 | 0 | 0.0% |
| $15,000 to $24,999 | 33 | 4.5% |
| $25,000 to $34,999 | 96 | 13.2% |
| $35,000 to $49,999 | 86 | 11.8% |
| $50,000 to $74,999 | 165 | 22.6% |
| $75,000 to $99,999 | 124 | 17.0% |
| $100,000 to $149,999 | 111 | 15.2% |
| $150,000 to $199,999 | 39 | 5.3% |
| $200,000+ | 70 | 9.6% |
Family Income by Famaliy Size in Pearl River
4-person families (103 | 14.1%) account for the highest median family income in Pearl River with $123,750 per family, while 4-person families (103 | 14.1%) have the highest median income of $30,938 per family member.
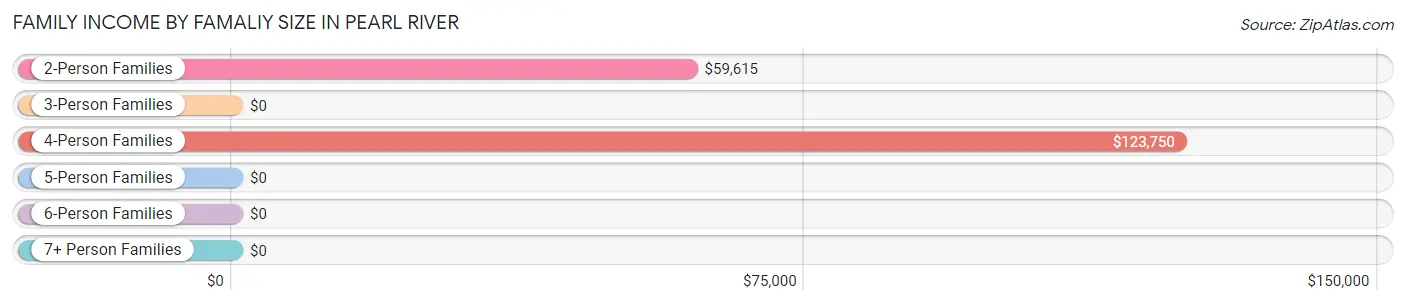
| Income Bracket | # Families | Median Income |
| 2-Person Families | 418 (57.3%) | $59,615 |
| 3-Person Families | 135 (18.5%) | $0 |
| 4-Person Families | 103 (14.1%) | $123,750 |
| 5-Person Families | 39 (5.3%) | $0 |
| 6-Person Families | 0 (0.0%) | $0 |
| 7+ Person Families | 35 (4.8%) | $0 |
| Total | 730 (100.0%) | $68,333 |
Family Income by Number of Earners in Pearl River
The median family income in Pearl River is $68,333, with families comprising 3+ earners (73) having the highest median family income of $129,926, while families with no earners (76) have the lowest median family income of $48,750, accounting for 10.0% and 10.4% of families, respectively.
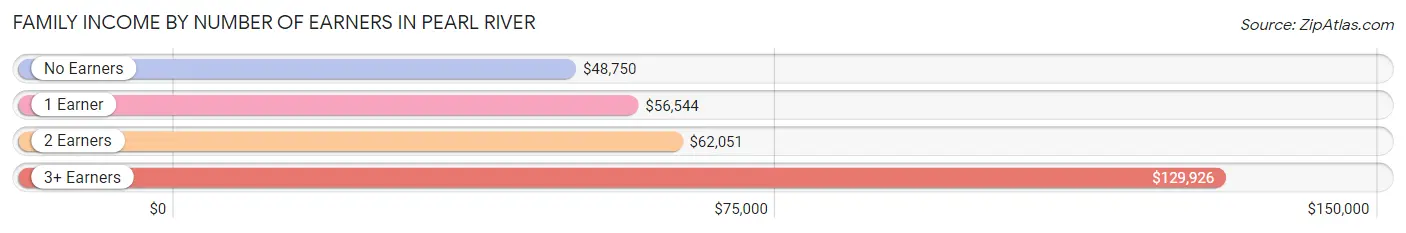
| Number of Earners | # Families | Median Income |
| No Earners | 76 (10.4%) | $48,750 |
| 1 Earner | 263 (36.0%) | $56,544 |
| 2 Earners | 318 (43.6%) | $62,051 |
| 3+ Earners | 73 (10.0%) | $129,926 |
| Total | 730 (100.0%) | $68,333 |
Household Income in Pearl River
Household Income Brackets in Pearl River
With 212 households falling in the category, the $50,000 to $74,999 income range is the most frequent in Pearl River, accounting for 21.8% of all households. In contrast, only 31 households (3.2%) fall into the less than $10,000 income bracket, making it the least populous group.
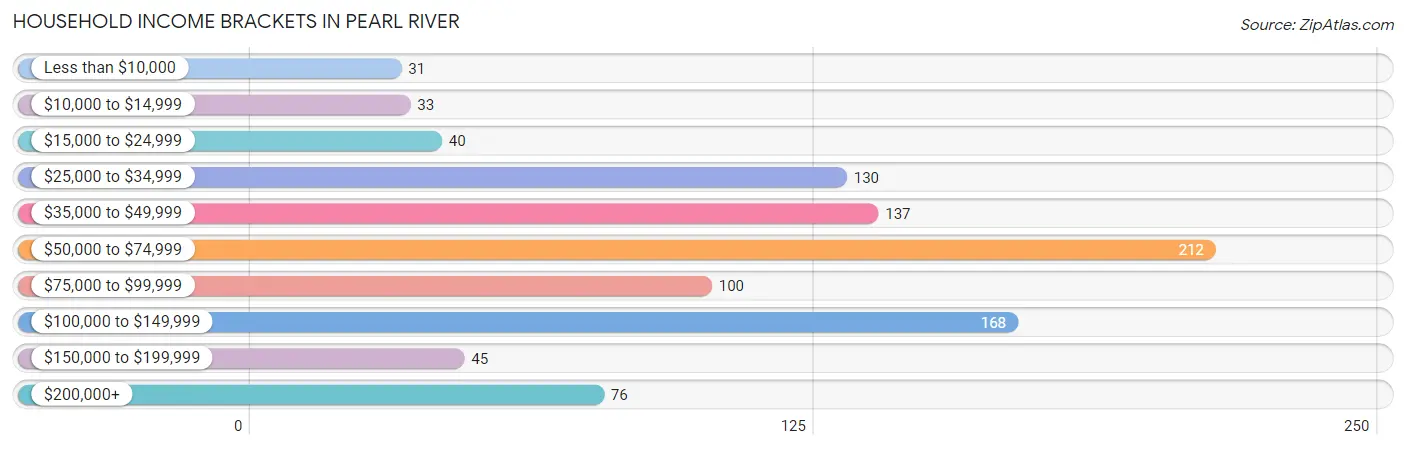
| Income Bracket | # Households | % Households |
| Less than $10,000 | 31 | 3.2% |
| $10,000 to $14,999 | 33 | 3.4% |
| $15,000 to $24,999 | 40 | 4.1% |
| $25,000 to $34,999 | 130 | 13.4% |
| $35,000 to $49,999 | 137 | 14.1% |
| $50,000 to $74,999 | 212 | 21.8% |
| $75,000 to $99,999 | 100 | 10.3% |
| $100,000 to $149,999 | 168 | 17.3% |
| $150,000 to $199,999 | 45 | 4.6% |
| $200,000+ | 76 | 7.8% |
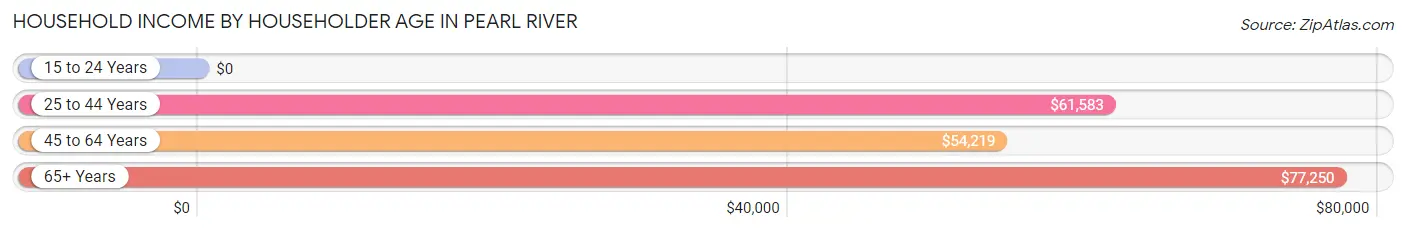
Household Income by Householder Age in Pearl River
The median household income in Pearl River is $59,702, with the highest median household income of $77,250 found in the 65+ years age bracket for the primary householder. A total of 254 households (26.1%) fall into this category. Meanwhile, the 15 to 24 years age bracket for the primary householder has the lowest median household income of $0, with 5 households (0.5%) in this group.
| Income Bracket | # Households | Median Income |
| 15 to 24 Years | 5 (0.5%) | $0 |
| 25 to 44 Years | 256 (26.3%) | $61,583 |
| 45 to 64 Years | 457 (47.0%) | $54,219 |
| 65+ Years | 254 (26.1%) | $77,250 |
| Total | 972 (100.0%) | $59,702 |
Poverty in Pearl River
Income Below Poverty by Sex and Age in Pearl River
With 7.2% poverty level for males and 10.0% for females among the residents of Pearl River, 15 year old males and 18 to 24 year old females are the most vulnerable to poverty, with 9 males (50.0%) and 37 females (45.7%) in their respective age groups living below the poverty level.
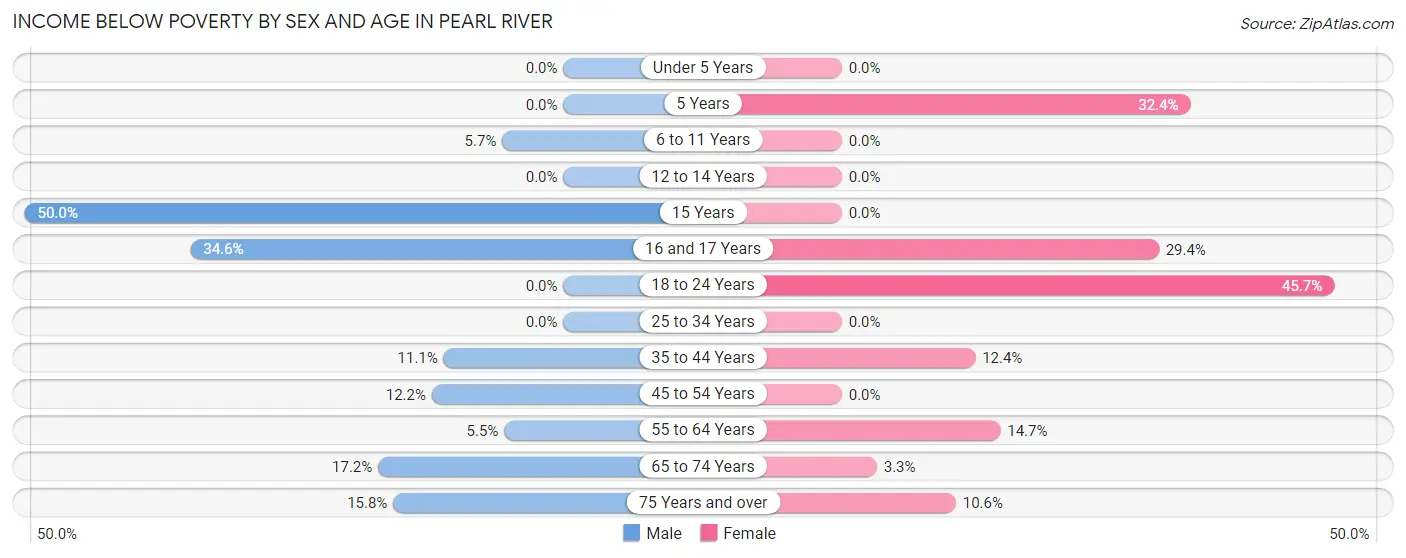
| Age Bracket | Male | Female |
| Under 5 Years | 0 (0.0%) | 0 (0.0%) |
| 5 Years | 0 (0.0%) | 11 (32.4%) |
| 6 to 11 Years | 11 (5.7%) | 0 (0.0%) |
| 12 to 14 Years | 0 (0.0%) | 0 (0.0%) |
| 15 Years | 9 (50.0%) | 0 (0.0%) |
| 16 and 17 Years | 9 (34.6%) | 10 (29.4%) |
| 18 to 24 Years | 0 (0.0%) | 37 (45.7%) |
| 25 to 34 Years | 0 (0.0%) | 0 (0.0%) |
| 35 to 44 Years | 10 (11.1%) | 13 (12.4%) |
| 45 to 54 Years | 16 (12.2%) | 0 (0.0%) |
| 55 to 64 Years | 19 (5.5%) | 25 (14.7%) |
| 65 to 74 Years | 22 (17.2%) | 4 (3.3%) |
| 75 Years and over | 9 (15.8%) | 11 (10.6%) |
| Total | 105 (7.2%) | 111 (10.0%) |
Income Above Poverty by Sex and Age in Pearl River
According to the poverty statistics in Pearl River, males aged under 5 years and females aged under 5 years are the age groups that are most secure financially, with 100.0% of males and 100.0% of females in these age groups living above the poverty line.
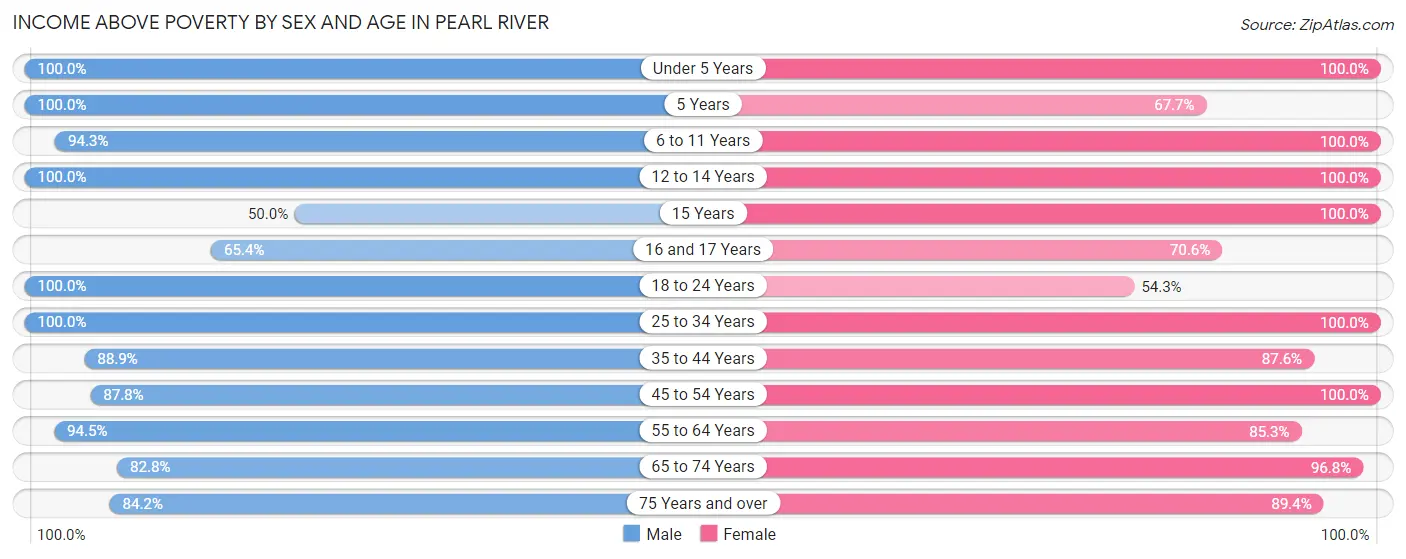
| Age Bracket | Male | Female |
| Under 5 Years | 22 (100.0%) | 47 (100.0%) |
| 5 Years | 7 (100.0%) | 23 (67.6%) |
| 6 to 11 Years | 183 (94.3%) | 42 (100.0%) |
| 12 to 14 Years | 68 (100.0%) | 71 (100.0%) |
| 15 Years | 9 (50.0%) | 13 (100.0%) |
| 16 and 17 Years | 17 (65.4%) | 24 (70.6%) |
| 18 to 24 Years | 181 (100.0%) | 44 (54.3%) |
| 25 to 34 Years | 192 (100.0%) | 141 (100.0%) |
| 35 to 44 Years | 80 (88.9%) | 92 (87.6%) |
| 45 to 54 Years | 115 (87.8%) | 145 (100.0%) |
| 55 to 64 Years | 327 (94.5%) | 145 (85.3%) |
| 65 to 74 Years | 106 (82.8%) | 119 (96.8%) |
| 75 Years and over | 48 (84.2%) | 93 (89.4%) |
| Total | 1,355 (92.8%) | 999 (90.0%) |
Income Below Poverty Among Married-Couple Families in Pearl River
The poverty statistics for married-couple families in Pearl River show that 3.3% or 18 of the total 546 families live below the poverty line. Families with no children have the highest poverty rate of 4.8%, comprising of 18 families. On the other hand, families with 1 or 2 children have the lowest poverty rate of 0.0%, which includes 0 families.
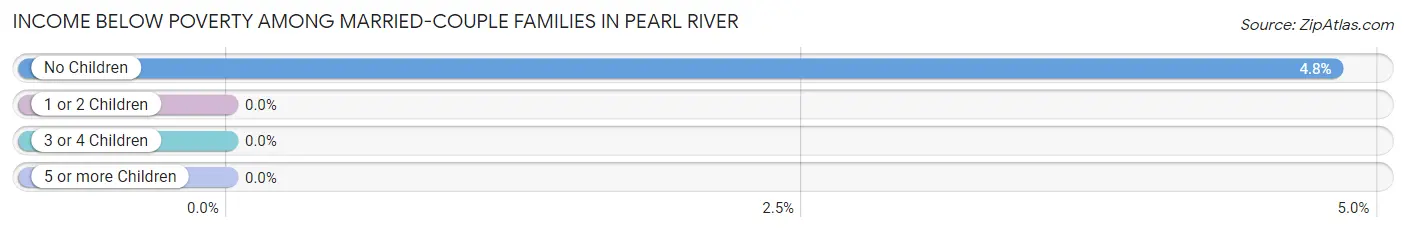
| Children | Above Poverty | Below Poverty |
| No Children | 356 (95.2%) | 18 (4.8%) |
| 1 or 2 Children | 137 (100.0%) | 0 (0.0%) |
| 3 or 4 Children | 5 (100.0%) | 0 (0.0%) |
| 5 or more Children | 30 (100.0%) | 0 (0.0%) |
| Total | 528 (96.7%) | 18 (3.3%) |
Income Below Poverty Among Single-Parent Households in Pearl River
According to the poverty data in Pearl River, 2.6% or 2 single-father households and 12.1% or 13 single-mother households are living below the poverty line. Among single-father households, those with 1 or 2 children have the highest poverty rate, with 2 households (4.9%) experiencing poverty. Likewise, among single-mother households, those with 1 or 2 children have the highest poverty rate, with 13 households (22.4%) falling below the poverty line.
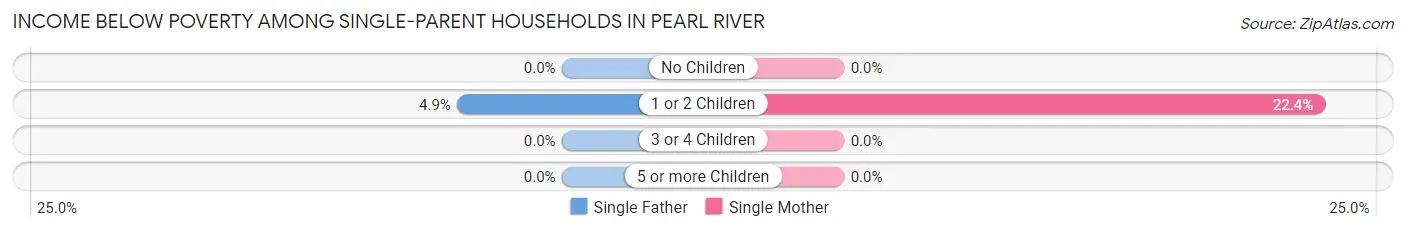
| Children | Single Father | Single Mother |
| No Children | 0 (0.0%) | 0 (0.0%) |
| 1 or 2 Children | 2 (4.9%) | 13 (22.4%) |
| 3 or 4 Children | 0 (0.0%) | 0 (0.0%) |
| 5 or more Children | 0 (0.0%) | 0 (0.0%) |
| Total | 2 (2.6%) | 13 (12.1%) |
Income Below Poverty Among Married-Couple vs Single-Parent Households in Pearl River
The poverty data for Pearl River shows that 18 of the married-couple family households (3.3%) and 15 of the single-parent households (8.2%) are living below the poverty level. Within the married-couple family households, those with no children have the highest poverty rate, with 18 households (4.8%) falling below the poverty line. Among the single-parent households, those with 1 or 2 children have the highest poverty rate, with 15 household (15.1%) living below poverty.
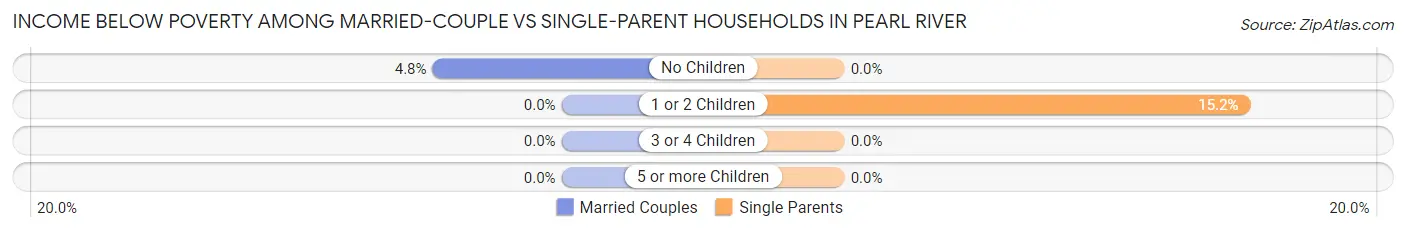
| Children | Married-Couple Families | Single-Parent Households |
| No Children | 18 (4.8%) | 0 (0.0%) |
| 1 or 2 Children | 0 (0.0%) | 15 (15.1%) |
| 3 or 4 Children | 0 (0.0%) | 0 (0.0%) |
| 5 or more Children | 0 (0.0%) | 0 (0.0%) |
| Total | 18 (3.3%) | 15 (8.2%) |
Race in Pearl River
The most populous races in Pearl River are White / Caucasian (2,378 | 92.0%), Two or more Races (115 | 4.4%), and Hispanic or Latino (111 | 4.3%).
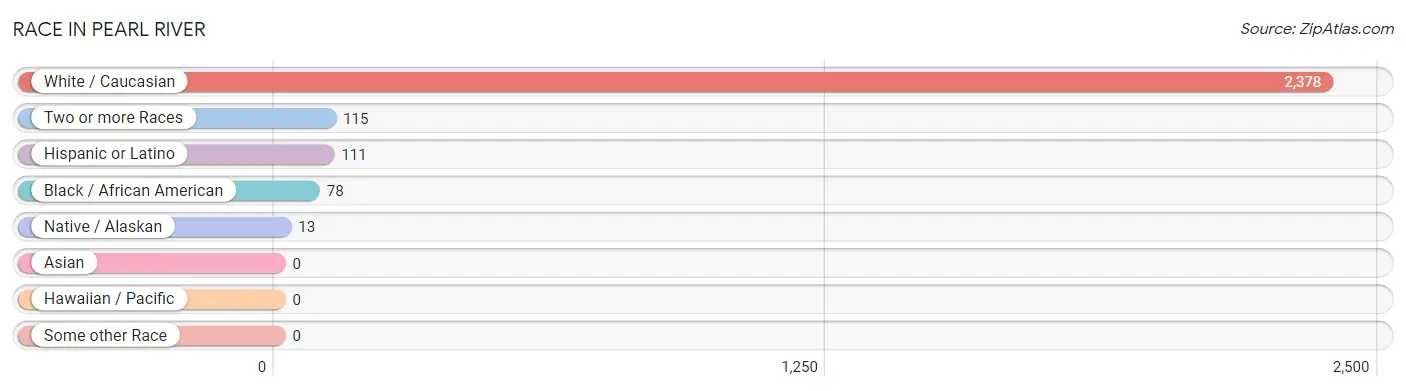
| Race | # Population | % Population |
| Asian | 0 | 0.0% |
| Black / African American | 78 | 3.0% |
| Hawaiian / Pacific | 0 | 0.0% |
| Hispanic or Latino | 111 | 4.3% |
| Native / Alaskan | 13 | 0.5% |
| White / Caucasian | 2,378 | 92.0% |
| Two or more Races | 115 | 4.4% |
| Some other Race | 0 | 0.0% |
| Total | 2,584 | 100.0% |
Ancestry in Pearl River
The most populous ancestries reported in Pearl River are German (541 | 20.9%), French (475 | 18.4%), Italian (294 | 11.4%), American (278 | 10.8%), and Irish (276 | 10.7%), together accounting for 72.1% of all Pearl River residents.
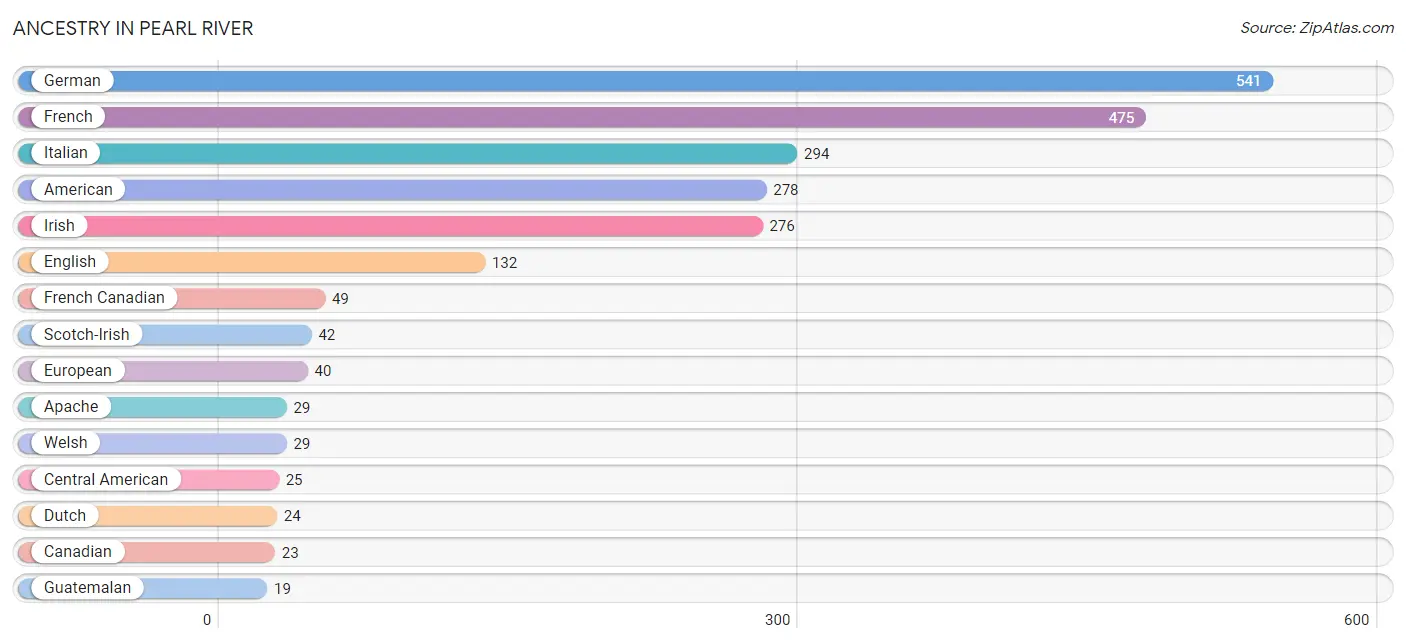
| Ancestry | # Population | % Population |
| American | 278 | 10.8% |
| Apache | 29 | 1.1% |
| Cajun | 6 | 0.2% |
| Canadian | 23 | 0.9% |
| Celtic | 7 | 0.3% |
| Central American | 25 | 1.0% |
| Cherokee | 13 | 0.5% |
| Choctaw | 13 | 0.5% |
| Croatian | 11 | 0.4% |
| Cuban | 3 | 0.1% |
| Dutch | 24 | 0.9% |
| Eastern European | 4 | 0.2% |
| English | 132 | 5.1% |
| European | 40 | 1.5% |
| French | 475 | 18.4% |
| French Canadian | 49 | 1.9% |
| German | 541 | 20.9% |
| Guatemalan | 19 | 0.7% |
| Honduran | 6 | 0.2% |
| Irish | 276 | 10.7% |
| Iroquois | 13 | 0.5% |
| Italian | 294 | 11.4% |
| Korean | 1 | 0.0% |
| Lithuanian | 4 | 0.2% |
| Mexican | 12 | 0.5% |
| Northern European | 3 | 0.1% |
| Polish | 7 | 0.3% |
| Portuguese | 4 | 0.2% |
| Puerto Rican | 13 | 0.5% |
| Scotch-Irish | 42 | 1.6% |
| Scottish | 8 | 0.3% |
| Spaniard | 16 | 0.6% |
| Spanish | 13 | 0.5% |
| Swedish | 13 | 0.5% |
| Swiss | 17 | 0.7% |
| Welsh | 29 | 1.1% | View All 36 Rows |
Immigrants in Pearl River
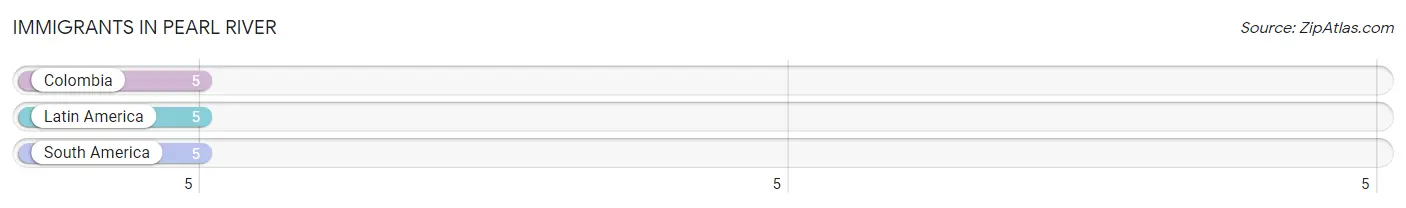
The most numerous immigrant groups reported in Pearl River came from Colombia (5 | 0.2%), Latin America (5 | 0.2%), and South America (5 | 0.2%), together accounting for 0.6% of all Pearl River residents.
| Immigration Origin | # Population | % Population |
| Colombia | 5 | 0.2% |
| Latin America | 5 | 0.2% |
| South America | 5 | 0.2% | View All 3 Rows |
Sex and Age in Pearl River
Sex and Age in Pearl River
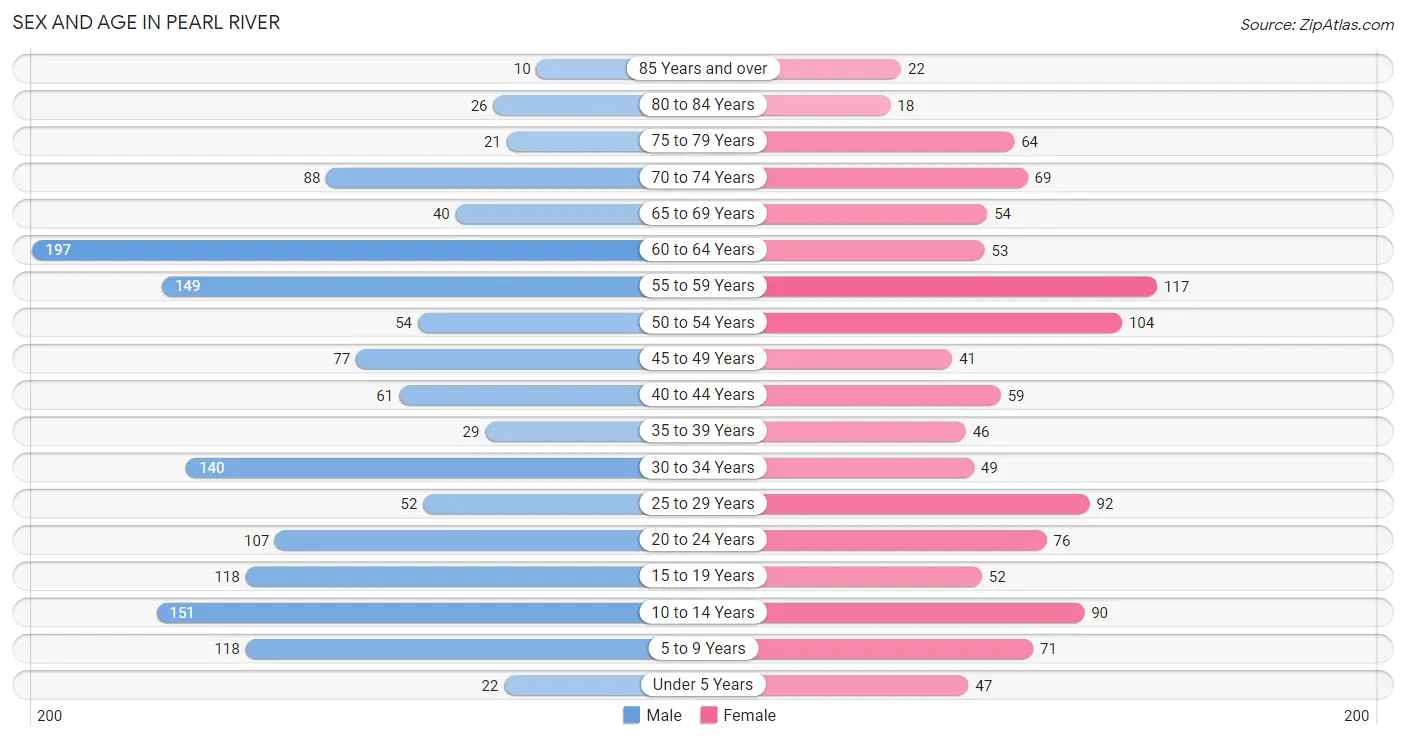
The most populous age groups in Pearl River are 60 to 64 Years (197 | 13.5%) for men and 55 to 59 Years (117 | 10.4%) for women.
| Age Bracket | Male | Female |
| Under 5 Years | 22 (1.5%) | 47 (4.2%) |
| 5 to 9 Years | 118 (8.1%) | 71 (6.3%) |
| 10 to 14 Years | 151 (10.3%) | 90 (8.0%) |
| 15 to 19 Years | 118 (8.1%) | 52 (4.6%) |
| 20 to 24 Years | 107 (7.3%) | 76 (6.8%) |
| 25 to 29 Years | 52 (3.6%) | 92 (8.2%) |
| 30 to 34 Years | 140 (9.6%) | 49 (4.4%) |
| 35 to 39 Years | 29 (2.0%) | 46 (4.1%) |
| 40 to 44 Years | 61 (4.2%) | 59 (5.2%) |
| 45 to 49 Years | 77 (5.3%) | 41 (3.6%) |
| 50 to 54 Years | 54 (3.7%) | 104 (9.2%) |
| 55 to 59 Years | 149 (10.2%) | 117 (10.4%) |
| 60 to 64 Years | 197 (13.5%) | 53 (4.7%) |
| 65 to 69 Years | 40 (2.7%) | 54 (4.8%) |
| 70 to 74 Years | 88 (6.0%) | 69 (6.1%) |
| 75 to 79 Years | 21 (1.4%) | 64 (5.7%) |
| 80 to 84 Years | 26 (1.8%) | 18 (1.6%) |
| 85 Years and over | 10 (0.7%) | 22 (2.0%) |
| Total | 1,460 (100.0%) | 1,124 (100.0%) |
Families and Households in Pearl River
Median Family Size in Pearl River
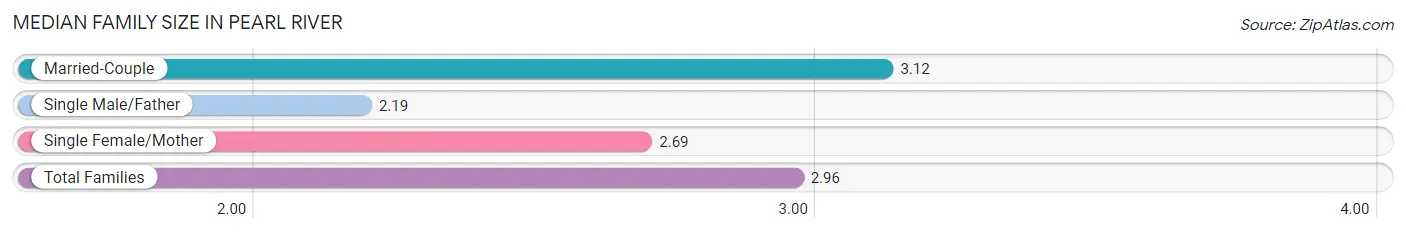
The median family size in Pearl River is 2.96 persons per family, with married-couple families (546 | 74.8%) accounting for the largest median family size of 3.12 persons per family. On the other hand, single male/father families (77 | 10.5%) represent the smallest median family size with 2.19 persons per family.
| Family Type | # Families | Family Size |
| Married-Couple | 546 (74.8%) | 3.12 |
| Single Male/Father | 77 (10.5%) | 2.19 |
| Single Female/Mother | 107 (14.7%) | 2.69 |
| Total Families | 730 (100.0%) | 2.96 |
Median Household Size in Pearl River
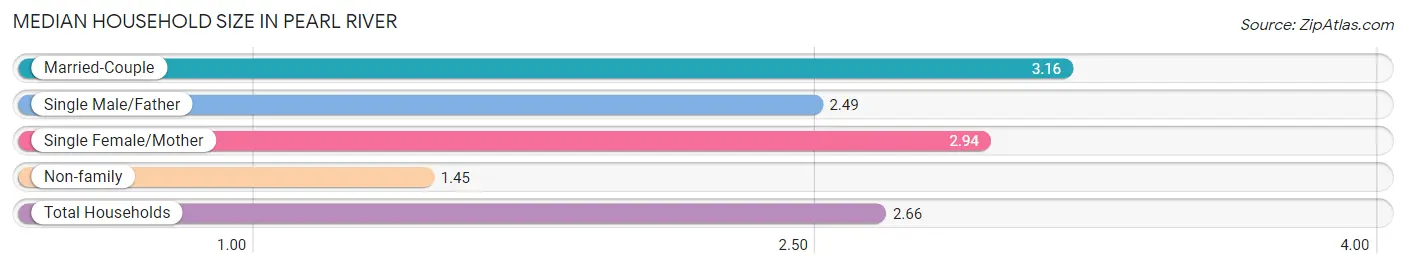
The median household size in Pearl River is 2.66 persons per household, with married-couple households (546 | 56.2%) accounting for the largest median household size of 3.16 persons per household. non-family households (242 | 24.9%) represent the smallest median household size with 1.45 persons per household.
| Household Type | # Households | Household Size |
| Married-Couple | 546 (56.2%) | 3.16 |
| Single Male/Father | 77 (7.9%) | 2.49 |
| Single Female/Mother | 107 (11.0%) | 2.94 |
| Non-family | 242 (24.9%) | 1.45 |
| Total Households | 972 (100.0%) | 2.66 |
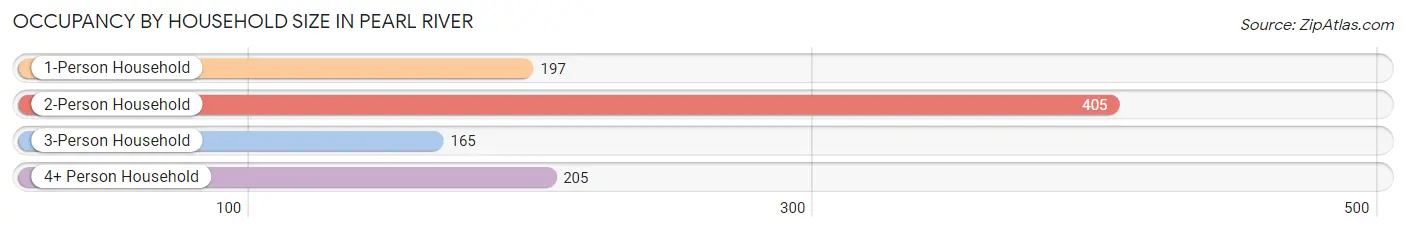
Household Size by Marriage Status in Pearl River
Out of a total of 972 households in Pearl River, 730 (75.1%) are family households, while 242 (24.9%) are nonfamily households. The most numerous type of family households are 2-person households, comprising 379, and the most common type of nonfamily households are 1-person households, comprising 197.
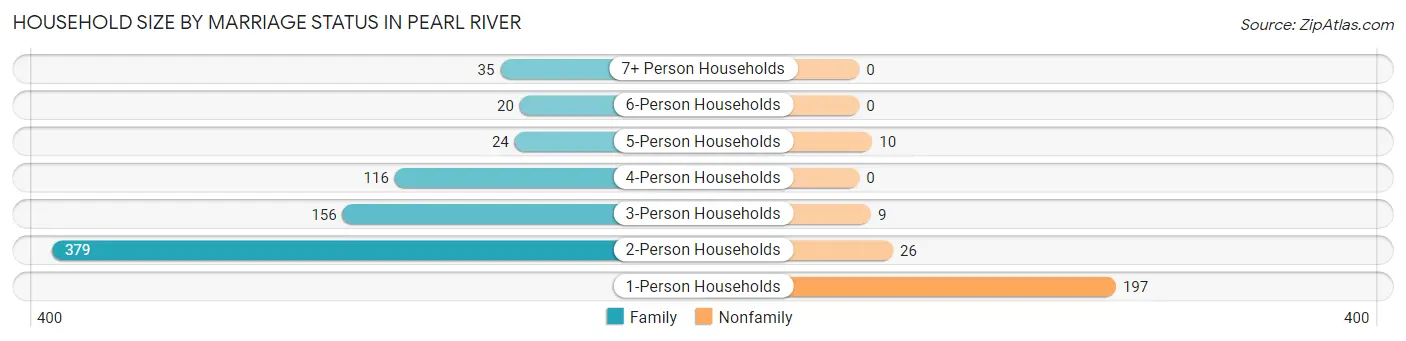
| Household Size | Family Households | Nonfamily Households |
| 1-Person Households | - | 197 (20.3%) |
| 2-Person Households | 379 (39.0%) | 26 (2.7%) |
| 3-Person Households | 156 (16.1%) | 9 (0.9%) |
| 4-Person Households | 116 (11.9%) | 0 (0.0%) |
| 5-Person Households | 24 (2.5%) | 10 (1.0%) |
| 6-Person Households | 20 (2.1%) | 0 (0.0%) |
| 7+ Person Households | 35 (3.6%) | 0 (0.0%) |
| Total | 730 (75.1%) | 242 (24.9%) |
Female Fertility in Pearl River
Fertility by Age in Pearl River
Average fertility rate in Pearl River is 39.0 births per 1,000 women. Women in the age bracket of 35 to 50 years have the highest fertility rate with 105.0 births per 1,000 women. Women in the age bracket of 35 to 50 years acount for 100.0% of all women with births.
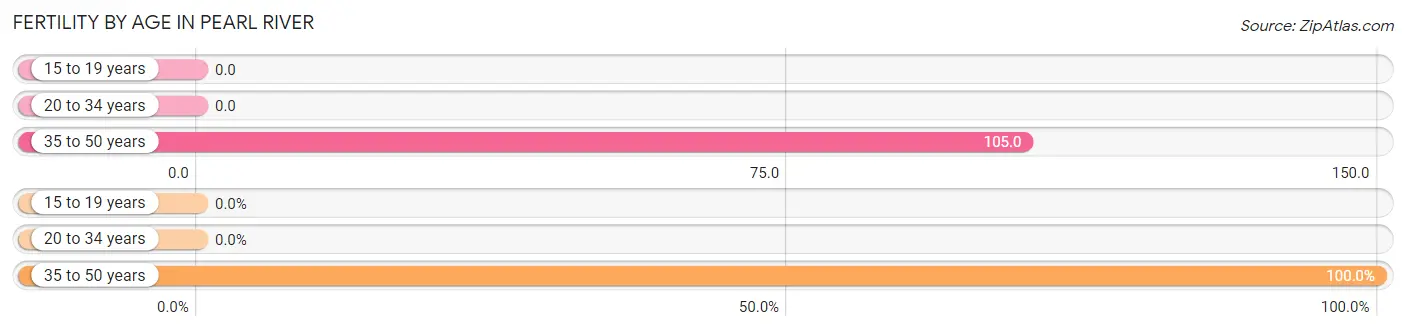
| Age Bracket | Women with Births | Births / 1,000 Women |
| 15 to 19 years | 0 (0.0%) | 0.0 |
| 20 to 34 years | 0 (0.0%) | 0.0 |
| 35 to 50 years | 17 (100.0%) | 105.0 |
| Total | 17 (100.0%) | 39.0 |
Fertility by Age by Marriage Status in Pearl River
52.9% of women with births (17) in Pearl River are married. The highest percentage of unmarried women with births falls into 35 to 50 years age bracket with 47.1% of them unmarried at the time of birth, while the lowest percentage of unmarried women with births belong to 35 to 50 years age bracket with 47.1% of them unmarried.
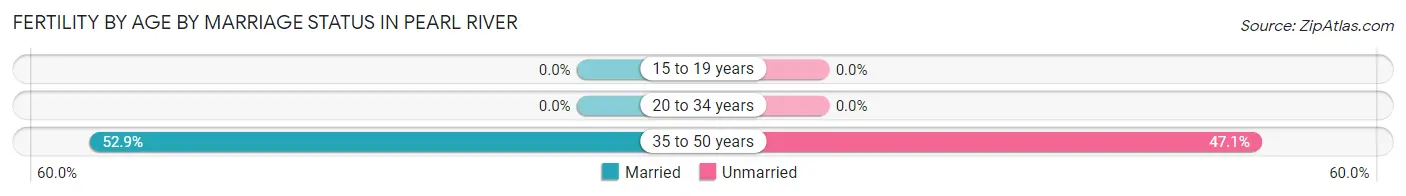
| Age Bracket | Married | Unmarried |
| 15 to 19 years | 0 (0.0%) | 0 (0.0%) |
| 20 to 34 years | 0 (0.0%) | 0 (0.0%) |
| 35 to 50 years | 9 (52.9%) | 8 (47.1%) |
| Total | 9 (52.9%) | 8 (47.1%) |
Fertility by Education in Pearl River
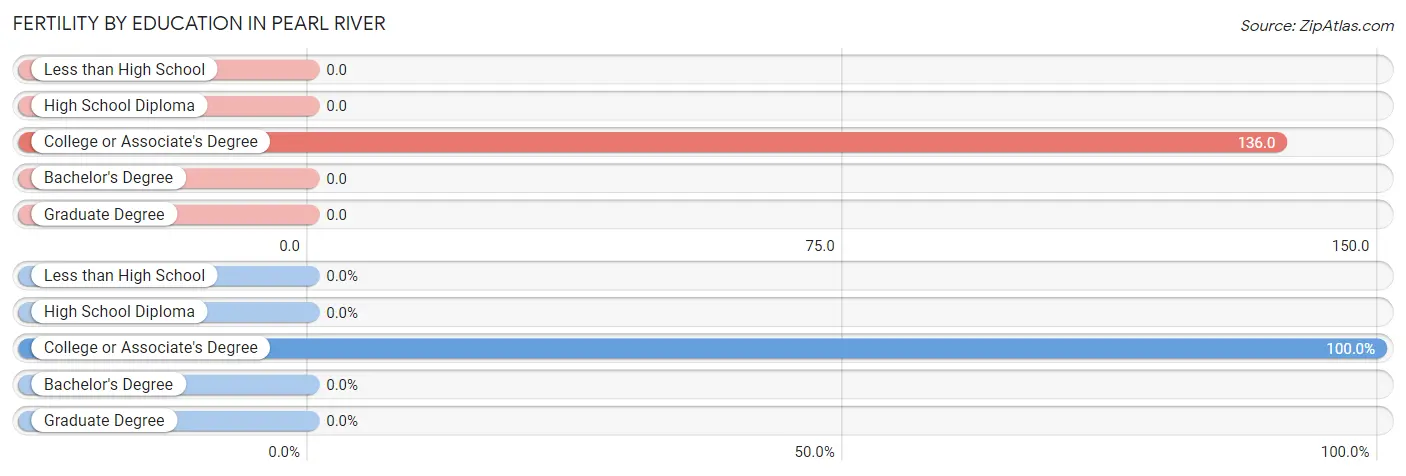
| Educational Attainment | Women with Births | Births / 1,000 Women |
| Less than High School | 0 (0.0%) | 0.0 |
| High School Diploma | 0 (0.0%) | 0.0 |
| College or Associate's Degree | 17 (100.0%) | 136.0 |
| Bachelor's Degree | 0 (0.0%) | 0.0 |
| Graduate Degree | 0 (0.0%) | 0.0 |
| Total | 17 (100.0%) | 39.0 |
Fertility by Education by Marriage Status in Pearl River
47.1% of women with births in Pearl River are unmarried. Women with the educational attainment of college or associate's degree are most likely to be married with 52.9% of them married at childbirth, while women with the educational attainment of college or associate's degree are least likely to be married with 47.1% of them unmarried at childbirth.
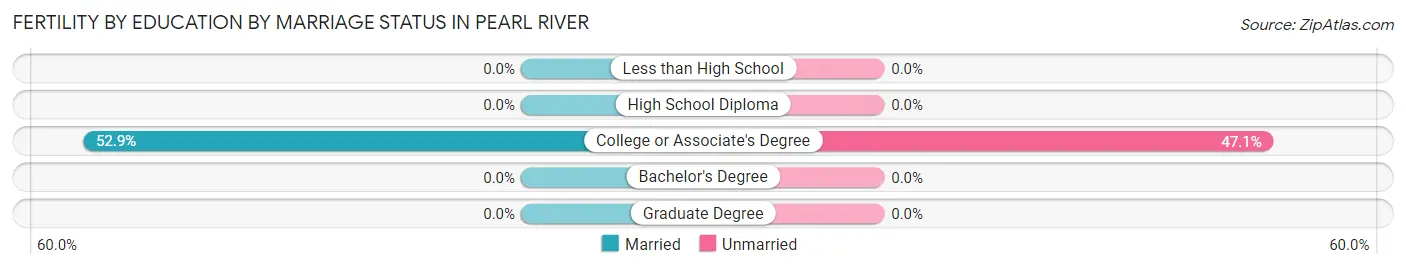
| Educational Attainment | Married | Unmarried |
| Less than High School | 0 (0.0%) | 0 (0.0%) |
| High School Diploma | 0 (0.0%) | 0 (0.0%) |
| College or Associate's Degree | 9 (52.9%) | 8 (47.1%) |
| Bachelor's Degree | 0 (0.0%) | 0 (0.0%) |
| Graduate Degree | 0 (0.0%) | 0 (0.0%) |
| Total | 9 (52.9%) | 8 (47.1%) |
Employment Characteristics in Pearl River
Employment by Class of Employer in Pearl River
Among the 1,360 employed individuals in Pearl River, private company employees (996 | 73.2%), local government employees (122 | 9.0%), and self-employed (not incorporated) (103 | 7.6%) make up the most common classes of employment.
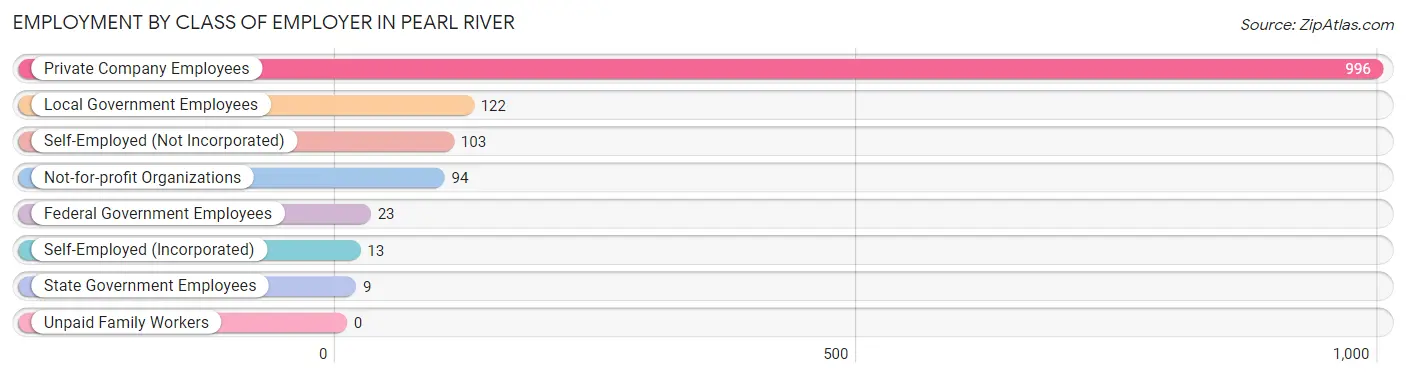
| Employer Class | # Employees | % Employees |
| Private Company Employees | 996 | 73.2% |
| Self-Employed (Incorporated) | 13 | 1.0% |
| Self-Employed (Not Incorporated) | 103 | 7.6% |
| Not-for-profit Organizations | 94 | 6.9% |
| Local Government Employees | 122 | 9.0% |
| State Government Employees | 9 | 0.7% |
| Federal Government Employees | 23 | 1.7% |
| Unpaid Family Workers | 0 | 0.0% |
| Total | 1,360 | 100.0% |
Employment Status by Age in Pearl River
According to the labor force statistics for Pearl River, out of the total population over 16 years of age (2,054), 69.7% or 1,432 individuals are in the labor force, with 4.6% or 66 of them unemployed. The age group with the highest labor force participation rate is 25 to 29 years, with 100.0% or 144 individuals in the labor force. Within the labor force, the 16 to 19 years age range has the highest percentage of unemployed individuals, with 40.7% or 24 of them being unemployed.
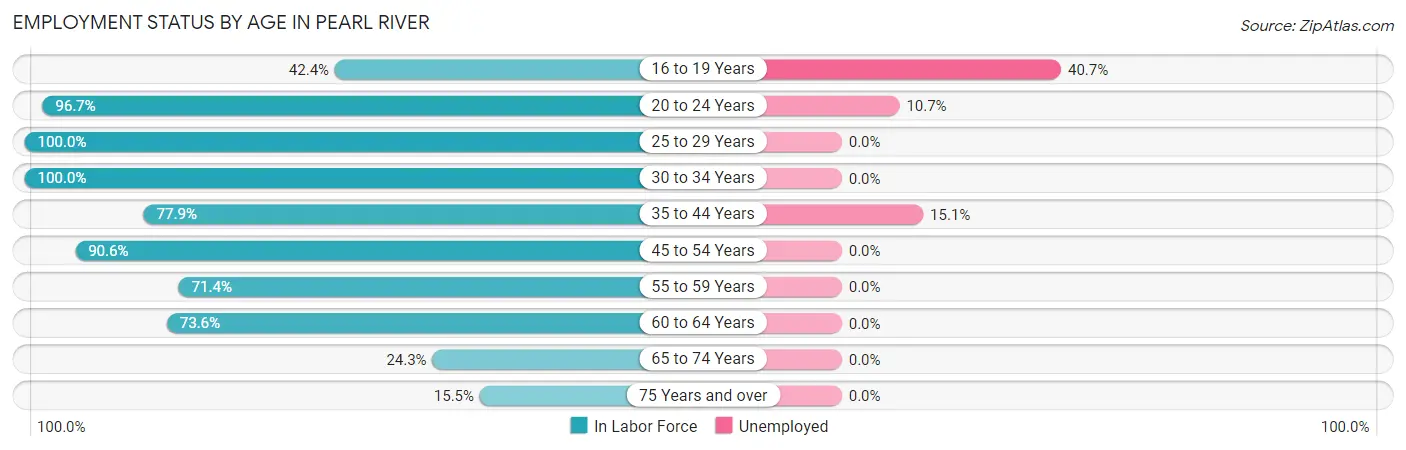
| Age Bracket | In Labor Force | Unemployed |
| 16 to 19 Years | 59 (42.4%) | 24 (40.7%) |
| 20 to 24 Years | 177 (96.7%) | 19 (10.7%) |
| 25 to 29 Years | 144 (100.0%) | 0 (0.0%) |
| 30 to 34 Years | 189 (100.0%) | 0 (0.0%) |
| 35 to 44 Years | 152 (77.9%) | 23 (15.1%) |
| 45 to 54 Years | 250 (90.6%) | 0 (0.0%) |
| 55 to 59 Years | 190 (71.4%) | 0 (0.0%) |
| 60 to 64 Years | 184 (73.6%) | 0 (0.0%) |
| 65 to 74 Years | 61 (24.3%) | 0 (0.0%) |
| 75 Years and over | 25 (15.5%) | 0 (0.0%) |
| Total | 1,432 (69.7%) | 66 (4.6%) |
Employment Status by Educational Attainment in Pearl River
According to labor force statistics for Pearl River, 84.0% of individuals (1,109) out of the total population between 25 and 64 years of age (1,320) are in the labor force, with 2.1% or 23 of them being unemployed. The group with the highest labor force participation rate are those with the educational attainment of bachelor's degree or higher, with 96.6% or 258 individuals in the labor force. Within the labor force, individuals with high school diploma education have the highest percentage of unemployment, with 8.5% or 23 of them being unemployed.
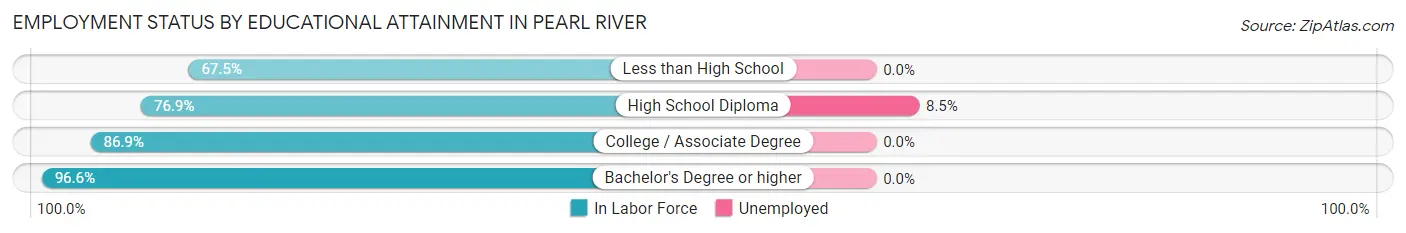
| Educational Attainment | In Labor Force | Unemployed |
| Less than High School | 102 (67.5%) | 0 (0.0%) |
| High School Diploma | 270 (76.9%) | 30 (8.5%) |
| College / Associate Degree | 479 (86.9%) | 0 (0.0%) |
| Bachelor's Degree or higher | 258 (96.6%) | 0 (0.0%) |
| Total | 1,109 (84.0%) | 28 (2.1%) |
Employment Occupations by Sex in Pearl River
Management, Business, Science and Arts Occupations
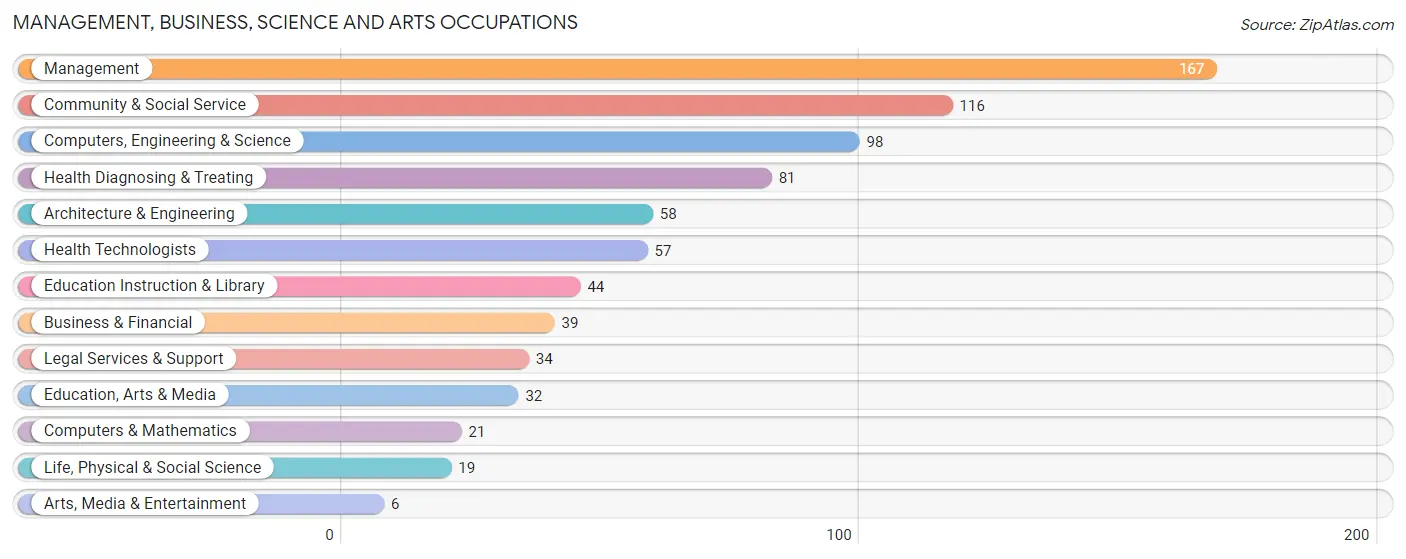
The most common Management, Business, Science and Arts occupations in Pearl River are Management (167 | 12.2%), Community & Social Service (116 | 8.5%), Computers, Engineering & Science (98 | 7.2%), Health Diagnosing & Treating (81 | 5.9%), and Architecture & Engineering (58 | 4.3%).
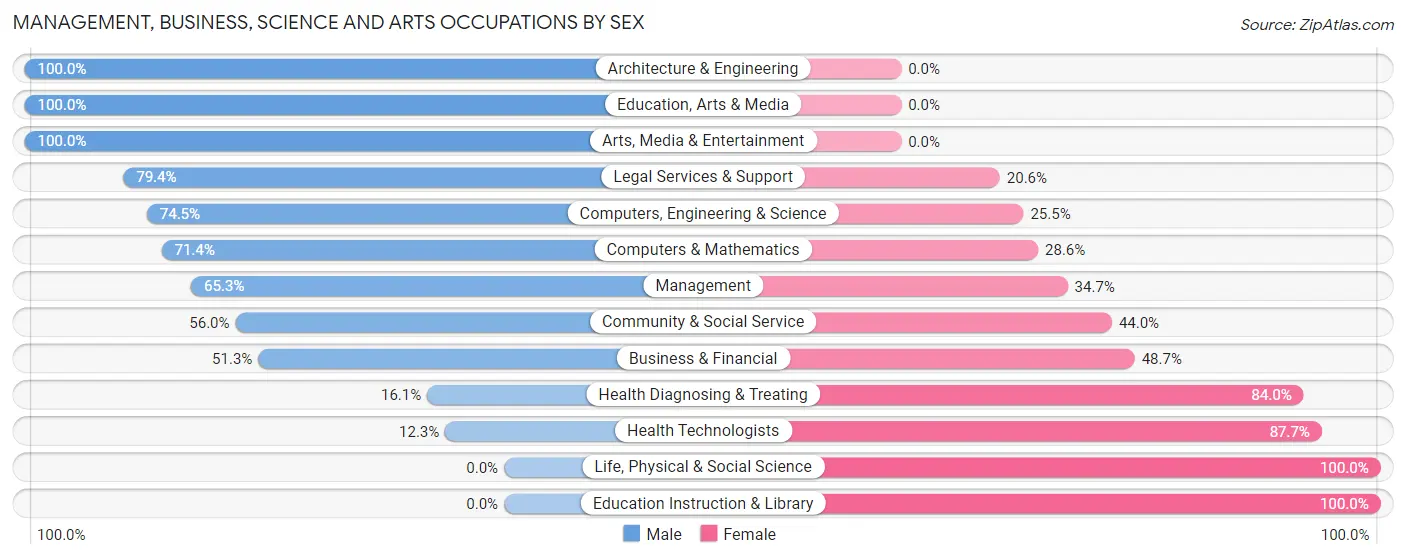
Management, Business, Science and Arts Occupations by Sex
Within the Management, Business, Science and Arts occupations in Pearl River, the most male-oriented occupations are Architecture & Engineering (100.0%), Education, Arts & Media (100.0%), and Arts, Media & Entertainment (100.0%), while the most female-oriented occupations are Life, Physical & Social Science (100.0%), Education Instruction & Library (100.0%), and Health Technologists (87.7%).
| Occupation | Male | Female |
| Management | 109 (65.3%) | 58 (34.7%) |
| Business & Financial | 20 (51.3%) | 19 (48.7%) |
| Computers, Engineering & Science | 73 (74.5%) | 25 (25.5%) |
| Computers & Mathematics | 15 (71.4%) | 6 (28.6%) |
| Architecture & Engineering | 58 (100.0%) | 0 (0.0%) |
| Life, Physical & Social Science | 0 (0.0%) | 19 (100.0%) |
| Community & Social Service | 65 (56.0%) | 51 (44.0%) |
| Education, Arts & Media | 32 (100.0%) | 0 (0.0%) |
| Legal Services & Support | 27 (79.4%) | 7 (20.6%) |
| Education Instruction & Library | 0 (0.0%) | 44 (100.0%) |
| Arts, Media & Entertainment | 6 (100.0%) | 0 (0.0%) |
| Health Diagnosing & Treating | 13 (16.1%) | 68 (84.0%) |
| Health Technologists | 7 (12.3%) | 50 (87.7%) |
| Total (Category) | 280 (55.9%) | 221 (44.1%) |
| Total (Overall) | 805 (59.0%) | 560 (41.0%) |
Services Occupations
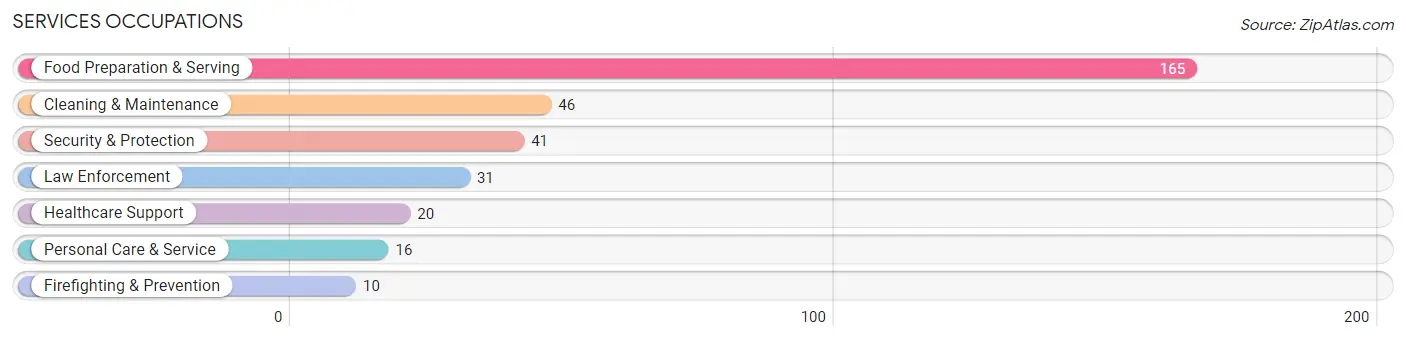
The most common Services occupations in Pearl River are Food Preparation & Serving (165 | 12.1%), Cleaning & Maintenance (46 | 3.4%), Security & Protection (41 | 3.0%), Law Enforcement (31 | 2.3%), and Healthcare Support (20 | 1.5%).
Services Occupations by Sex
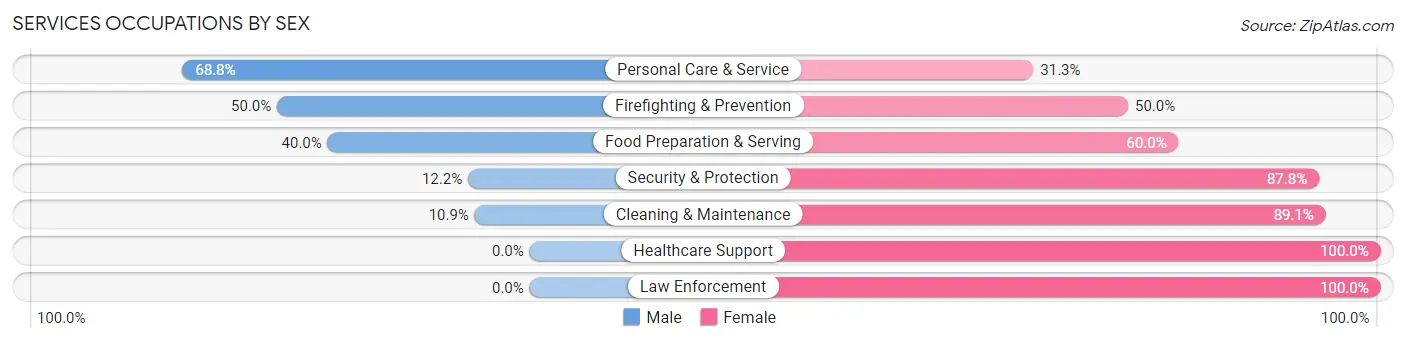
Within the Services occupations in Pearl River, the most male-oriented occupations are Personal Care & Service (68.8%), Firefighting & Prevention (50.0%), and Food Preparation & Serving (40.0%), while the most female-oriented occupations are Healthcare Support (100.0%), Law Enforcement (100.0%), and Cleaning & Maintenance (89.1%).
| Occupation | Male | Female |
| Healthcare Support | 0 (0.0%) | 20 (100.0%) |
| Security & Protection | 5 (12.2%) | 36 (87.8%) |
| Firefighting & Prevention | 5 (50.0%) | 5 (50.0%) |
| Law Enforcement | 0 (0.0%) | 31 (100.0%) |
| Food Preparation & Serving | 66 (40.0%) | 99 (60.0%) |
| Cleaning & Maintenance | 5 (10.9%) | 41 (89.1%) |
| Personal Care & Service | 11 (68.8%) | 5 (31.2%) |
| Total (Category) | 87 (30.2%) | 201 (69.8%) |
| Total (Overall) | 805 (59.0%) | 560 (41.0%) |
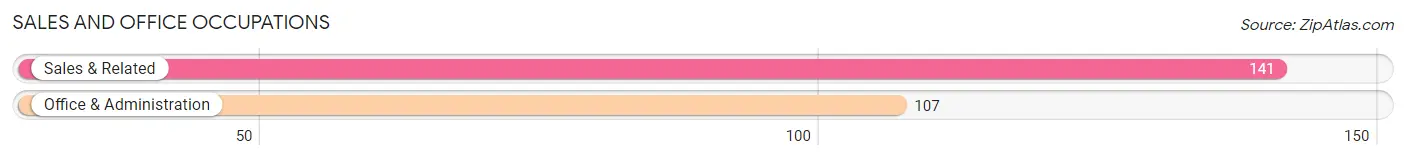
Sales and Office Occupations
The most common Sales and Office occupations in Pearl River are Sales & Related (141 | 10.3%), and Office & Administration (107 | 7.8%).
Sales and Office Occupations by Sex
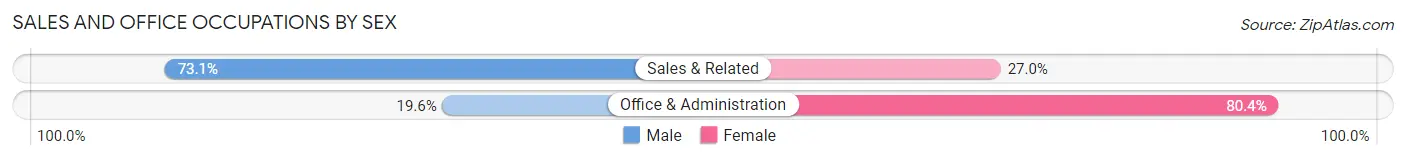
| Occupation | Male | Female |
| Sales & Related | 103 (73.1%) | 38 (27.0%) |
| Office & Administration | 21 (19.6%) | 86 (80.4%) |
| Total (Category) | 124 (50.0%) | 124 (50.0%) |
| Total (Overall) | 805 (59.0%) | 560 (41.0%) |
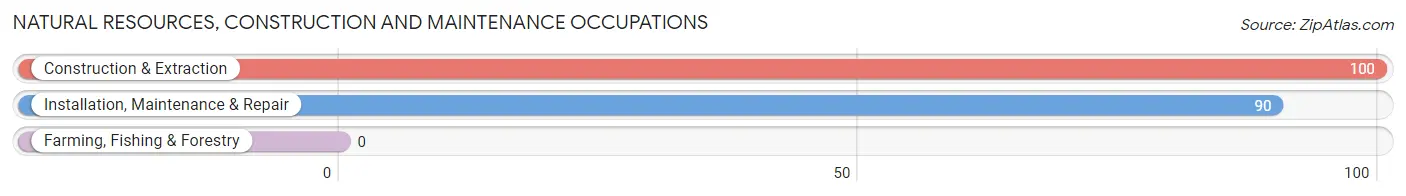
Natural Resources, Construction and Maintenance Occupations
The most common Natural Resources, Construction and Maintenance occupations in Pearl River are Construction & Extraction (100 | 7.3%), and Installation, Maintenance & Repair (90 | 6.6%).
Natural Resources, Construction and Maintenance Occupations by Sex
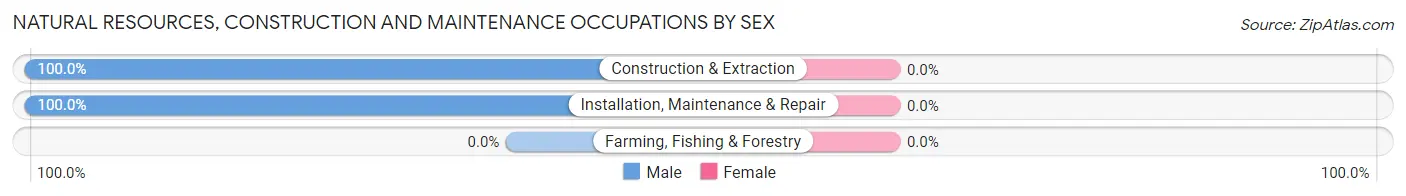
| Occupation | Male | Female |
| Farming, Fishing & Forestry | 0 (0.0%) | 0 (0.0%) |
| Construction & Extraction | 100 (100.0%) | 0 (0.0%) |
| Installation, Maintenance & Repair | 90 (100.0%) | 0 (0.0%) |
| Total (Category) | 190 (100.0%) | 0 (0.0%) |
| Total (Overall) | 805 (59.0%) | 560 (41.0%) |
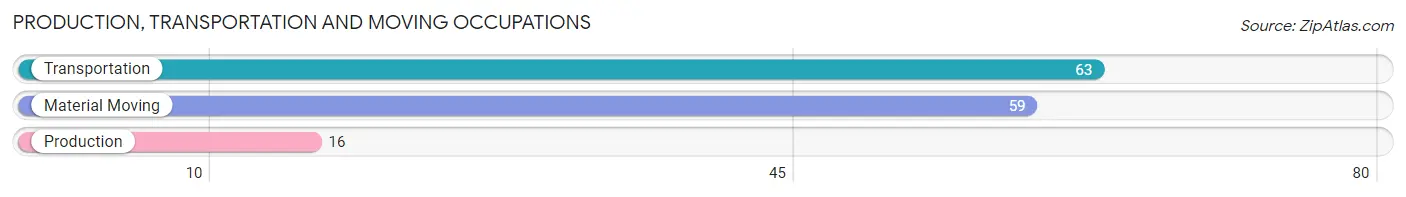
Production, Transportation and Moving Occupations
The most common Production, Transportation and Moving occupations in Pearl River are Transportation (63 | 4.6%), Material Moving (59 | 4.3%), and Production (16 | 1.2%).
Production, Transportation and Moving Occupations by Sex
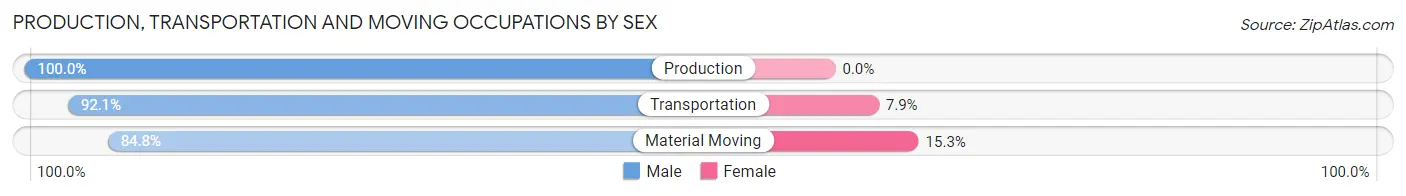
| Occupation | Male | Female |
| Production | 16 (100.0%) | 0 (0.0%) |
| Transportation | 58 (92.1%) | 5 (7.9%) |
| Material Moving | 50 (84.8%) | 9 (15.2%) |
| Total (Category) | 124 (89.9%) | 14 (10.1%) |
| Total (Overall) | 805 (59.0%) | 560 (41.0%) |
Employment Industries by Sex in Pearl River
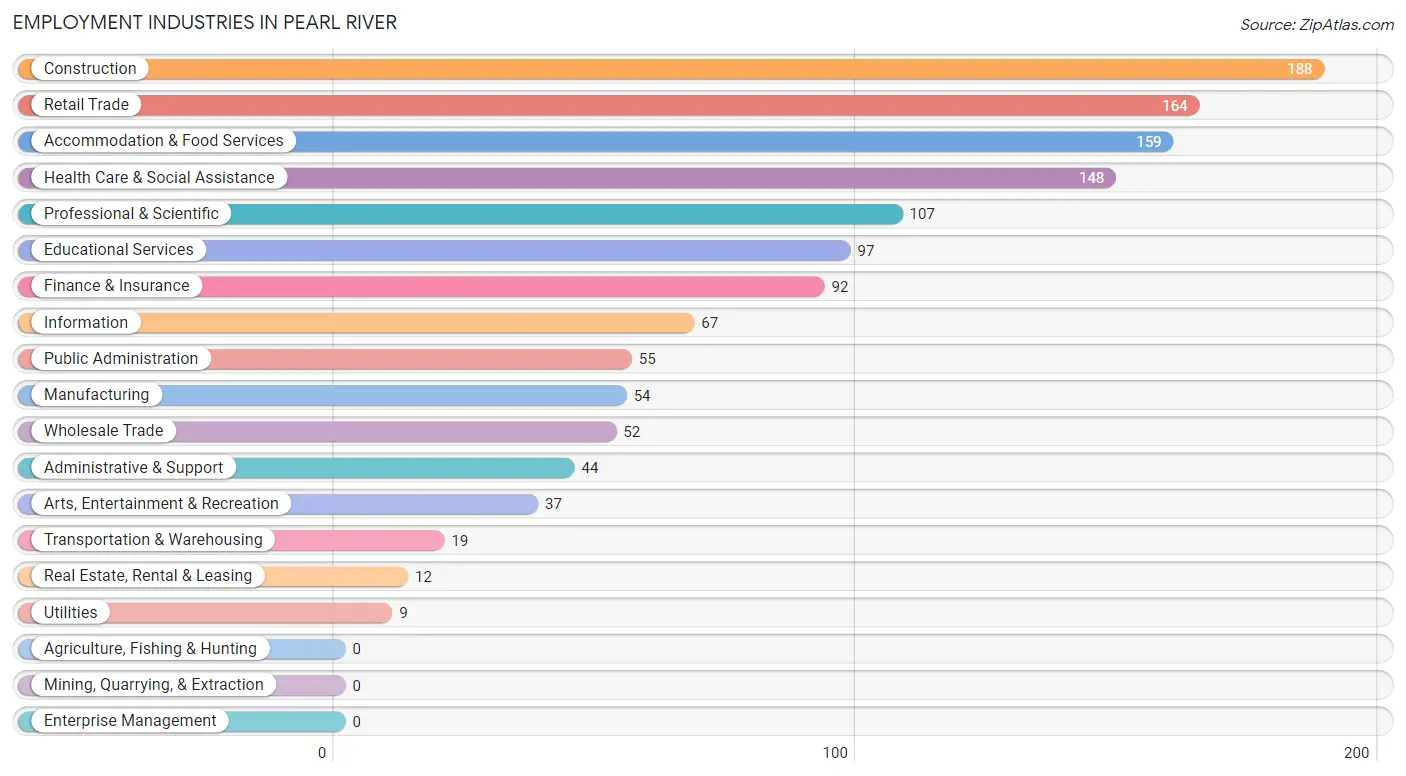
Employment Industries in Pearl River
The major employment industries in Pearl River include Construction (188 | 13.8%), Retail Trade (164 | 12.0%), Accommodation & Food Services (159 | 11.7%), Health Care & Social Assistance (148 | 10.8%), and Professional & Scientific (107 | 7.8%).
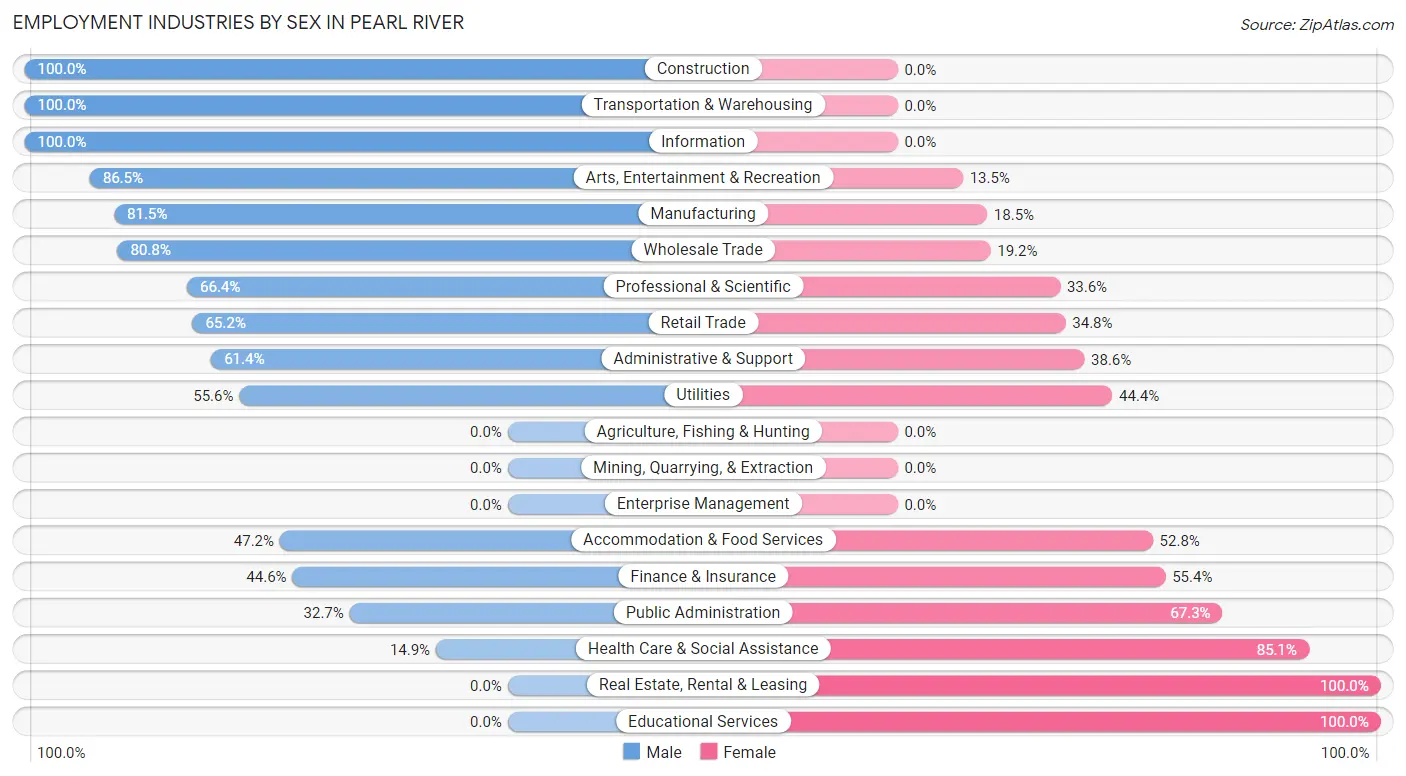
Employment Industries by Sex in Pearl River
The Pearl River industries that see more men than women are Construction (100.0%), Transportation & Warehousing (100.0%), and Information (100.0%), whereas the industries that tend to have a higher number of women are Real Estate, Rental & Leasing (100.0%), Educational Services (100.0%), and Health Care & Social Assistance (85.1%).
| Industry | Male | Female |
| Agriculture, Fishing & Hunting | 0 (0.0%) | 0 (0.0%) |
| Mining, Quarrying, & Extraction | 0 (0.0%) | 0 (0.0%) |
| Construction | 188 (100.0%) | 0 (0.0%) |
| Manufacturing | 44 (81.5%) | 10 (18.5%) |
| Wholesale Trade | 42 (80.8%) | 10 (19.2%) |
| Retail Trade | 107 (65.2%) | 57 (34.8%) |
| Transportation & Warehousing | 19 (100.0%) | 0 (0.0%) |
| Utilities | 5 (55.6%) | 4 (44.4%) |
| Information | 67 (100.0%) | 0 (0.0%) |
| Finance & Insurance | 41 (44.6%) | 51 (55.4%) |
| Real Estate, Rental & Leasing | 0 (0.0%) | 12 (100.0%) |
| Professional & Scientific | 71 (66.4%) | 36 (33.6%) |
| Enterprise Management | 0 (0.0%) | 0 (0.0%) |
| Administrative & Support | 27 (61.4%) | 17 (38.6%) |
| Educational Services | 0 (0.0%) | 97 (100.0%) |
| Health Care & Social Assistance | 22 (14.9%) | 126 (85.1%) |
| Arts, Entertainment & Recreation | 32 (86.5%) | 5 (13.5%) |
| Accommodation & Food Services | 75 (47.2%) | 84 (52.8%) |
| Public Administration | 18 (32.7%) | 37 (67.3%) |
| Total | 805 (59.0%) | 560 (41.0%) |
Education in Pearl River
School Enrollment in Pearl River
The most common levels of schooling among the 747 students in Pearl River are middle school (250 | 33.5%), college / undergraduate (166 | 22.2%), and elementary school (143 | 19.1%).
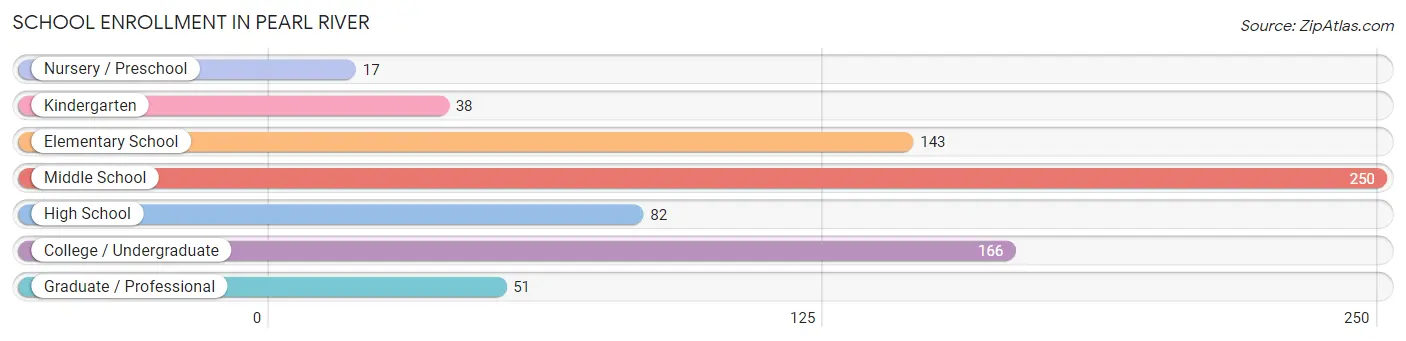
| School Level | # Students | % Students |
| Nursery / Preschool | 17 | 2.3% |
| Kindergarten | 38 | 5.1% |
| Elementary School | 143 | 19.1% |
| Middle School | 250 | 33.5% |
| High School | 82 | 11.0% |
| College / Undergraduate | 166 | 22.2% |
| Graduate / Professional | 51 | 6.8% |
| Total | 747 | 100.0% |
School Enrollment by Age by Funding Source in Pearl River
Out of a total of 747 students who are enrolled in schools in Pearl River, 93 (12.4%) attend a private institution, while the remaining 654 (87.6%) are enrolled in public schools. The age group of 3 to 4 year olds has the highest likelihood of being enrolled in private schools, with 9 (100.0% in the age bracket) enrolled. Conversely, the age group of 20 to 24 year olds has the lowest likelihood of being enrolled in a private school, with 116 (100.0% in the age bracket) attending a public institution.
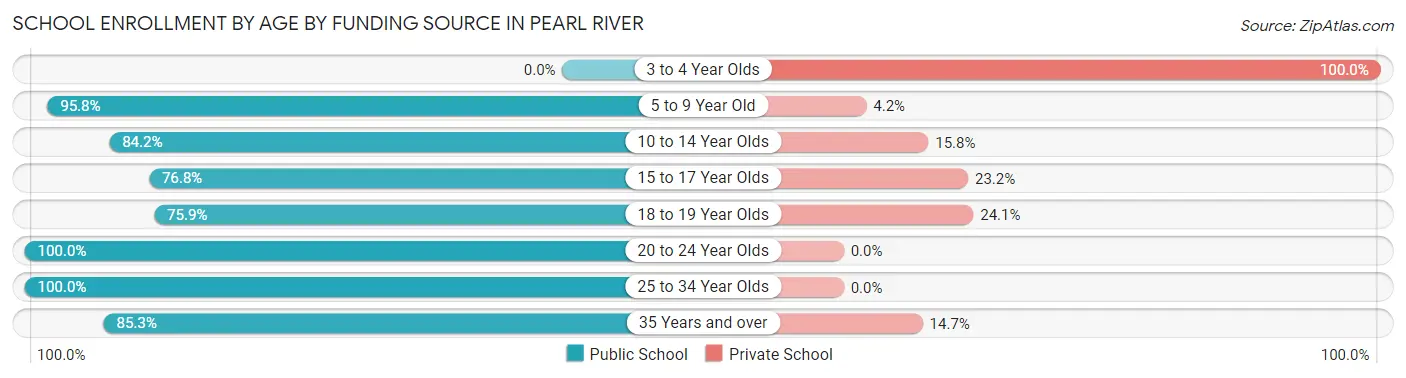
| Age Bracket | Public School | Private School |
| 3 to 4 Year Olds | 0 (0.0%) | 9 (100.0%) |
| 5 to 9 Year Old | 181 (95.8%) | 8 (4.2%) |
| 10 to 14 Year Olds | 203 (84.2%) | 38 (15.8%) |
| 15 to 17 Year Olds | 63 (76.8%) | 19 (23.2%) |
| 18 to 19 Year Olds | 44 (75.9%) | 14 (24.1%) |
| 20 to 24 Year Olds | 116 (100.0%) | 0 (0.0%) |
| 25 to 34 Year Olds | 18 (100.0%) | 0 (0.0%) |
| 35 Years and over | 29 (85.3%) | 5 (14.7%) |
| Total | 654 (87.6%) | 93 (12.4%) |
Educational Attainment by Field of Study in Pearl River
Business (132 | 38.9%), science & technology (41 | 12.1%), bio, nature & agricultural (27 | 8.0%), social sciences (23 | 6.8%), and education (23 | 6.8%) are the most common fields of study among 339 individuals in Pearl River who have obtained a bachelor's degree or higher.
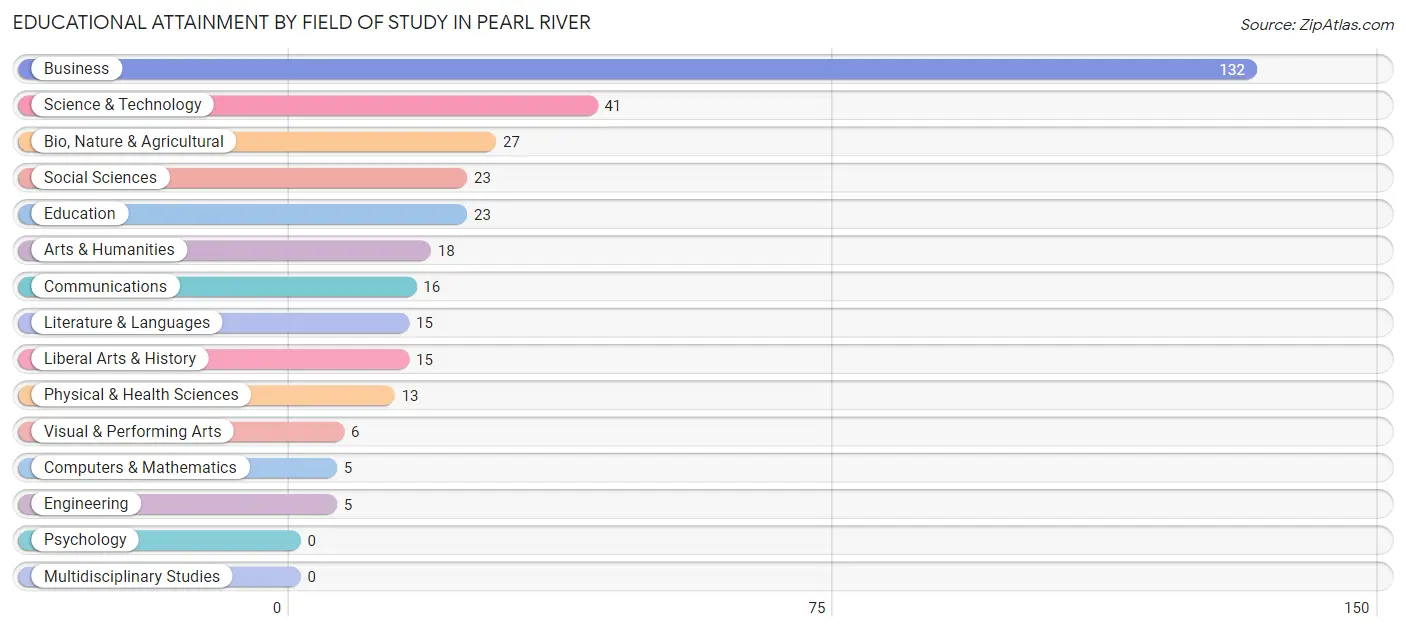
| Field of Study | # Graduates | % Graduates |
| Computers & Mathematics | 5 | 1.5% |
| Bio, Nature & Agricultural | 27 | 8.0% |
| Physical & Health Sciences | 13 | 3.8% |
| Psychology | 0 | 0.0% |
| Social Sciences | 23 | 6.8% |
| Engineering | 5 | 1.5% |
| Multidisciplinary Studies | 0 | 0.0% |
| Science & Technology | 41 | 12.1% |
| Business | 132 | 38.9% |
| Education | 23 | 6.8% |
| Literature & Languages | 15 | 4.4% |
| Liberal Arts & History | 15 | 4.4% |
| Visual & Performing Arts | 6 | 1.8% |
| Communications | 16 | 4.7% |
| Arts & Humanities | 18 | 5.3% |
| Total | 339 | 100.0% |
Transportation & Commute in Pearl River
Vehicle Availability by Sex in Pearl River
The most prevalent vehicle ownership categories in Pearl River are males with 2 vehicles (390, accounting for 48.7%) and females with 2 vehicles (218, making up 69.6%).
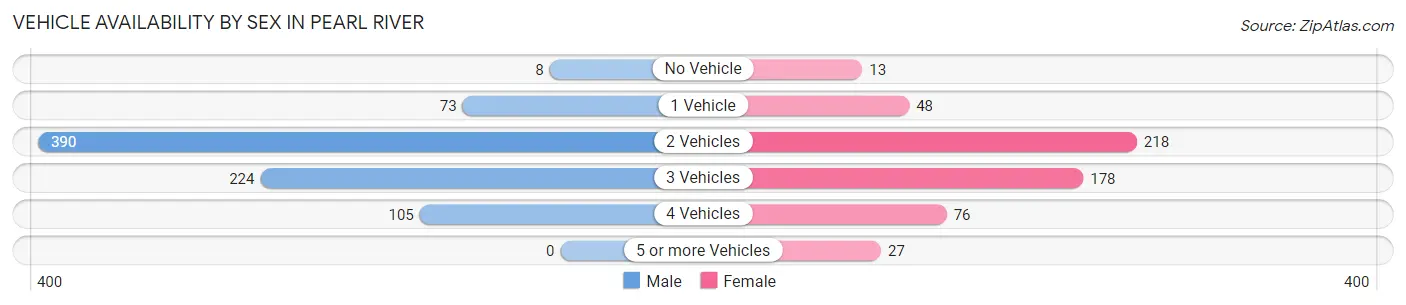
| Vehicles Available | Male | Female |
| No Vehicle | 8 (1.0%) | 13 (2.3%) |
| 1 Vehicle | 73 (9.1%) | 48 (8.6%) |
| 2 Vehicles | 390 (48.7%) | 218 (38.9%) |
| 3 Vehicles | 224 (28.0%) | 178 (31.8%) |
| 4 Vehicles | 105 (13.1%) | 76 (13.6%) |
| 5 or more Vehicles | 0 (0.0%) | 27 (4.8%) |
| Total | 800 (100.0%) | 560 (100.0%) |
Commute Time in Pearl River
The most frequently occuring commute durations in Pearl River are 15 to 19 minutes (251 commuters, 19.3%), 60 to 89 minutes (238 commuters, 18.3%), and 10 to 14 minutes (142 commuters, 10.9%).
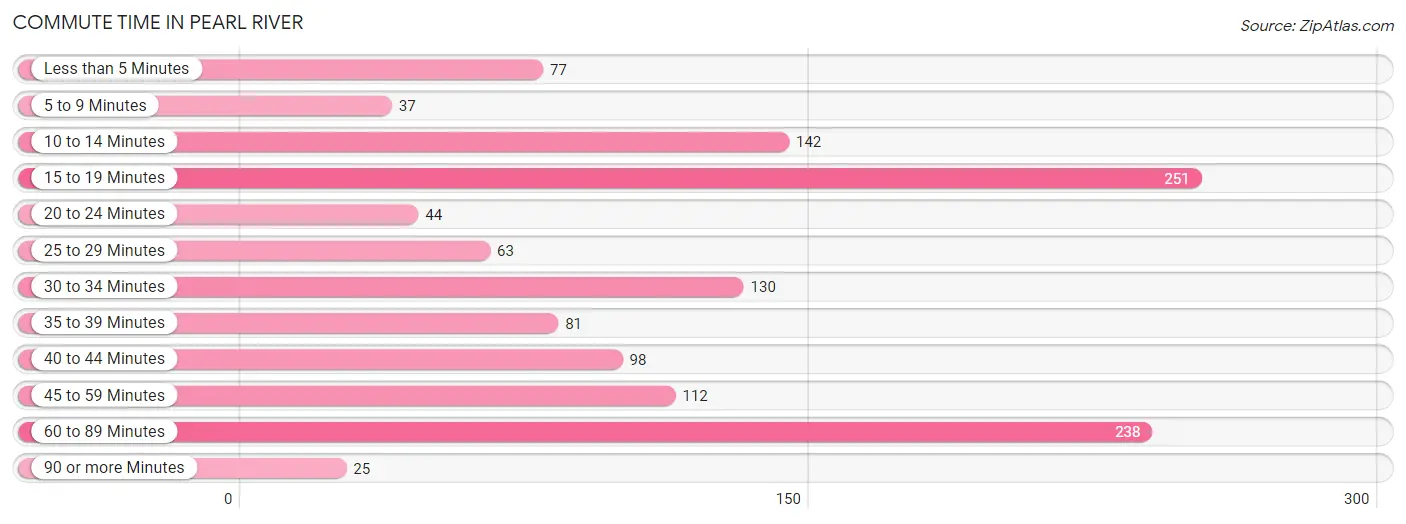
| Commute Time | # Commuters | % Commuters |
| Less than 5 Minutes | 77 | 5.9% |
| 5 to 9 Minutes | 37 | 2.9% |
| 10 to 14 Minutes | 142 | 10.9% |
| 15 to 19 Minutes | 251 | 19.3% |
| 20 to 24 Minutes | 44 | 3.4% |
| 25 to 29 Minutes | 63 | 4.9% |
| 30 to 34 Minutes | 130 | 10.0% |
| 35 to 39 Minutes | 81 | 6.2% |
| 40 to 44 Minutes | 98 | 7.5% |
| 45 to 59 Minutes | 112 | 8.6% |
| 60 to 89 Minutes | 238 | 18.3% |
| 90 or more Minutes | 25 | 1.9% |
Commute Time by Sex in Pearl River
The most common commute times in Pearl River are 15 to 19 minutes (189 commuters, 24.5%) for males and 10 to 14 minutes (111 commuters, 21.1%) for females.
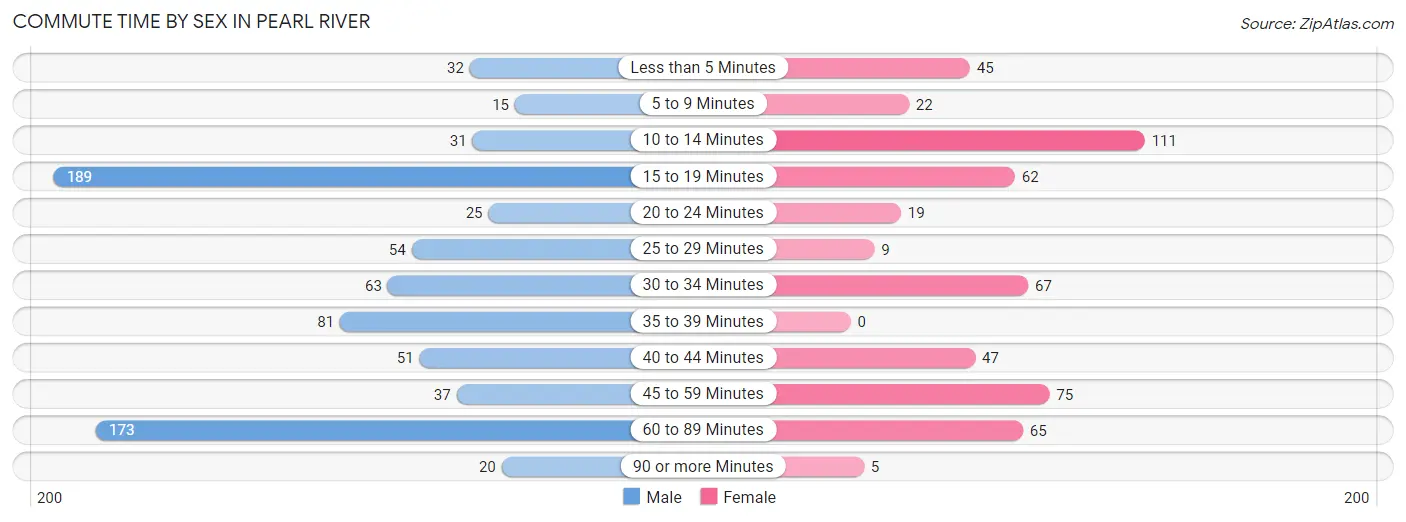
| Commute Time | Male | Female |
| Less than 5 Minutes | 32 (4.2%) | 45 (8.5%) |
| 5 to 9 Minutes | 15 (1.9%) | 22 (4.2%) |
| 10 to 14 Minutes | 31 (4.0%) | 111 (21.1%) |
| 15 to 19 Minutes | 189 (24.5%) | 62 (11.8%) |
| 20 to 24 Minutes | 25 (3.2%) | 19 (3.6%) |
| 25 to 29 Minutes | 54 (7.0%) | 9 (1.7%) |
| 30 to 34 Minutes | 63 (8.2%) | 67 (12.7%) |
| 35 to 39 Minutes | 81 (10.5%) | 0 (0.0%) |
| 40 to 44 Minutes | 51 (6.6%) | 47 (8.9%) |
| 45 to 59 Minutes | 37 (4.8%) | 75 (14.2%) |
| 60 to 89 Minutes | 173 (22.4%) | 65 (12.3%) |
| 90 or more Minutes | 20 (2.6%) | 5 (0.9%) |
Time of Departure to Work by Sex in Pearl River
The most frequent times of departure to work in Pearl River are 6:00 AM to 6:29 AM (166, 21.5%) for males and 6:30 AM to 6:59 AM (147, 27.9%) for females.
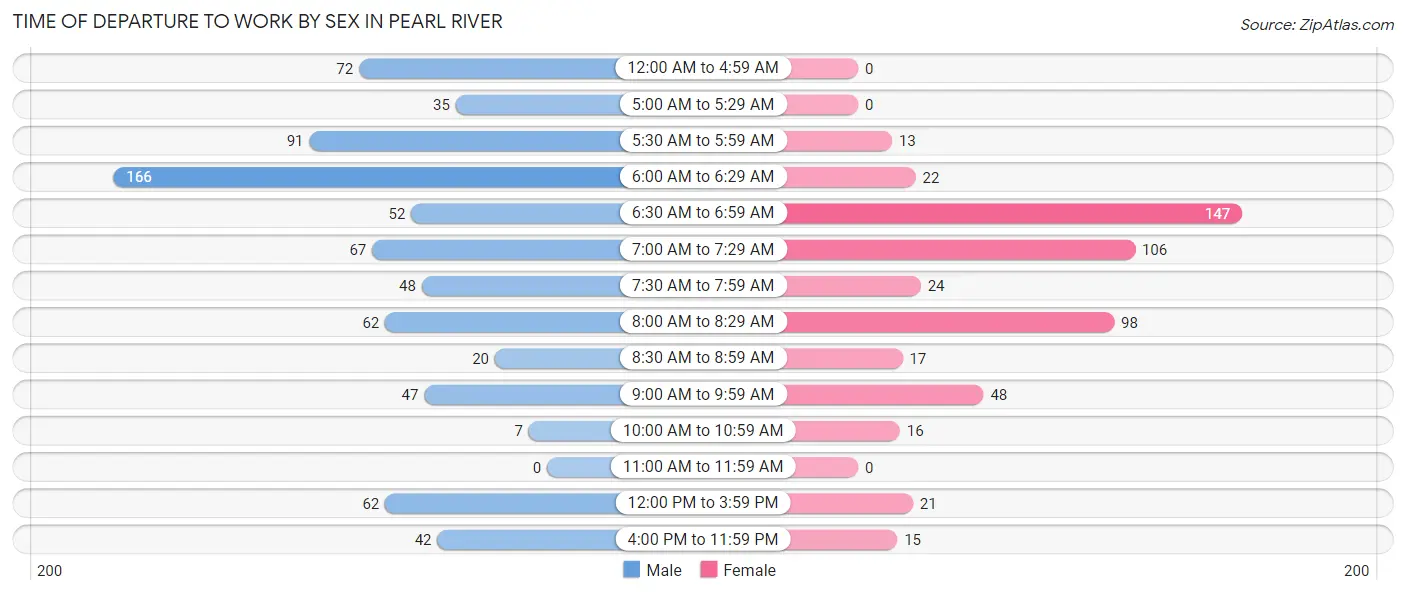
| Time of Departure | Male | Female |
| 12:00 AM to 4:59 AM | 72 (9.3%) | 0 (0.0%) |
| 5:00 AM to 5:29 AM | 35 (4.5%) | 0 (0.0%) |
| 5:30 AM to 5:59 AM | 91 (11.8%) | 13 (2.5%) |
| 6:00 AM to 6:29 AM | 166 (21.5%) | 22 (4.2%) |
| 6:30 AM to 6:59 AM | 52 (6.7%) | 147 (27.9%) |
| 7:00 AM to 7:29 AM | 67 (8.7%) | 106 (20.1%) |
| 7:30 AM to 7:59 AM | 48 (6.2%) | 24 (4.5%) |
| 8:00 AM to 8:29 AM | 62 (8.0%) | 98 (18.6%) |
| 8:30 AM to 8:59 AM | 20 (2.6%) | 17 (3.2%) |
| 9:00 AM to 9:59 AM | 47 (6.1%) | 48 (9.1%) |
| 10:00 AM to 10:59 AM | 7 (0.9%) | 16 (3.0%) |
| 11:00 AM to 11:59 AM | 0 (0.0%) | 0 (0.0%) |
| 12:00 PM to 3:59 PM | 62 (8.0%) | 21 (4.0%) |
| 4:00 PM to 11:59 PM | 42 (5.4%) | 15 (2.9%) |
| Total | 771 (100.0%) | 527 (100.0%) |
Housing Occupancy in Pearl River
Occupancy by Ownership in Pearl River
Of the total 972 dwellings in Pearl River, owner-occupied units account for 792 (81.5%), while renter-occupied units make up 180 (18.5%).
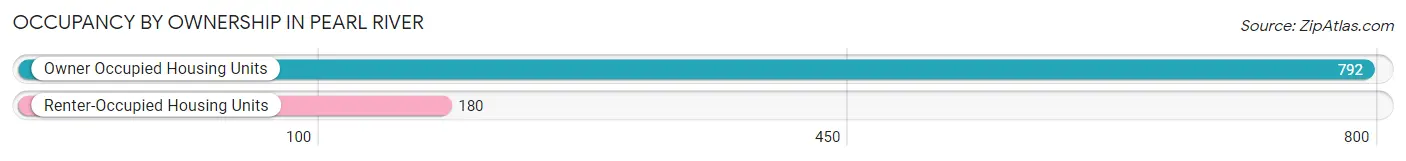
| Occupancy | # Housing Units | % Housing Units |
| Owner Occupied Housing Units | 792 | 81.5% |
| Renter-Occupied Housing Units | 180 | 18.5% |
| Total Occupied Housing Units | 972 | 100.0% |
Occupancy by Household Size in Pearl River
| Household Size | # Housing Units | % Housing Units |
| 1-Person Household | 197 | 20.3% |
| 2-Person Household | 405 | 41.7% |
| 3-Person Household | 165 | 17.0% |
| 4+ Person Household | 205 | 21.1% |
| Total Housing Units | 972 | 100.0% |
Occupancy by Ownership by Household Size in Pearl River
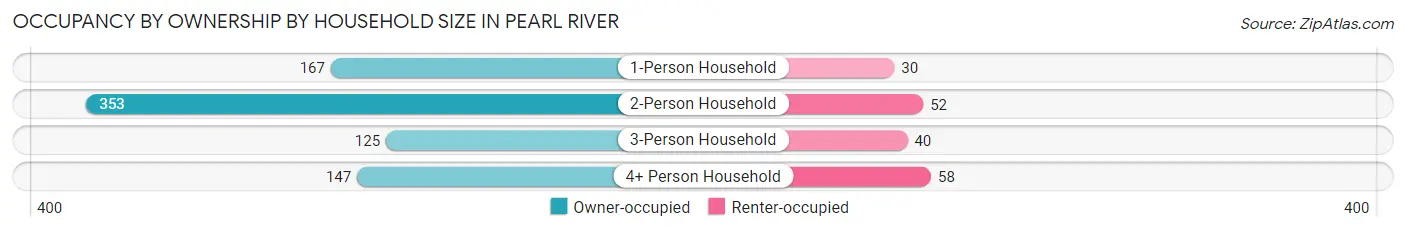
| Household Size | Owner-occupied | Renter-occupied |
| 1-Person Household | 167 (84.8%) | 30 (15.2%) |
| 2-Person Household | 353 (87.2%) | 52 (12.8%) |
| 3-Person Household | 125 (75.8%) | 40 (24.2%) |
| 4+ Person Household | 147 (71.7%) | 58 (28.3%) |
| Total Housing Units | 792 (81.5%) | 180 (18.5%) |
Occupancy by Educational Attainment in Pearl River
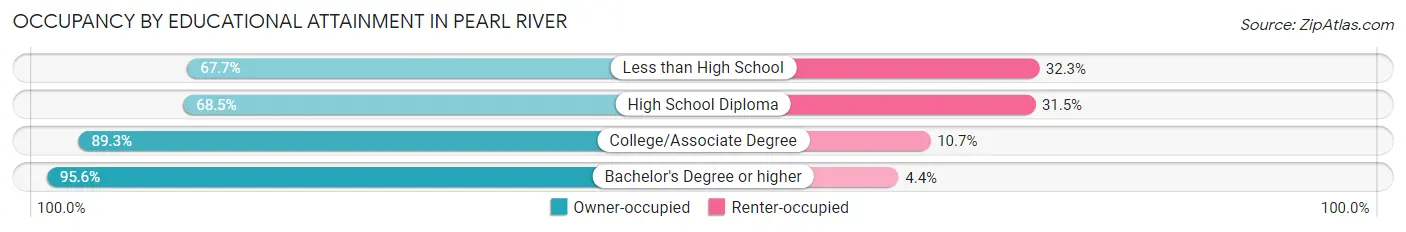
| Household Size | Owner-occupied | Renter-occupied |
| Less than High School | 63 (67.7%) | 30 (32.3%) |
| High School Diploma | 222 (68.5%) | 102 (31.5%) |
| College/Associate Degree | 333 (89.3%) | 40 (10.7%) |
| Bachelor's Degree or higher | 174 (95.6%) | 8 (4.4%) |
Occupancy by Age of Householder in Pearl River
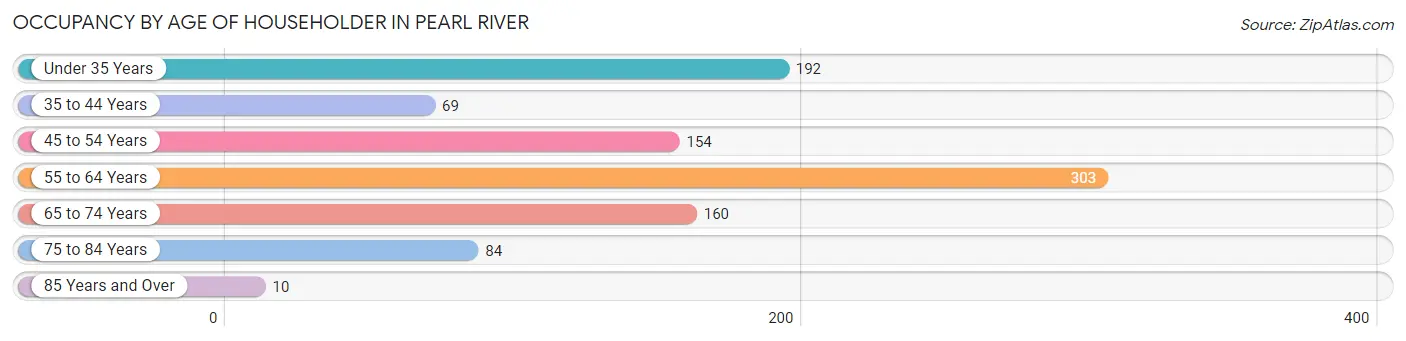
| Age Bracket | # Households | % Households |
| Under 35 Years | 192 | 19.8% |
| 35 to 44 Years | 69 | 7.1% |
| 45 to 54 Years | 154 | 15.8% |
| 55 to 64 Years | 303 | 31.2% |
| 65 to 74 Years | 160 | 16.5% |
| 75 to 84 Years | 84 | 8.6% |
| 85 Years and Over | 10 | 1.0% |
| Total | 972 | 100.0% |
Housing Finances in Pearl River
Median Income by Occupancy in Pearl River
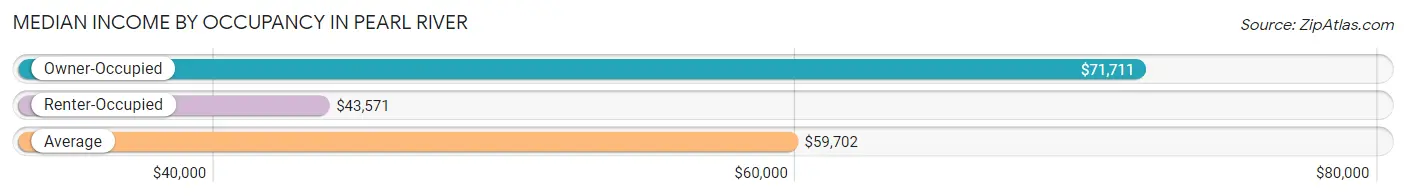
| Occupancy Type | # Households | Median Income |
| Owner-Occupied | 792 (81.5%) | $71,711 |
| Renter-Occupied | 180 (18.5%) | $43,571 |
| Average | 972 (100.0%) | $59,702 |
Occupancy by Householder Income Bracket in Pearl River
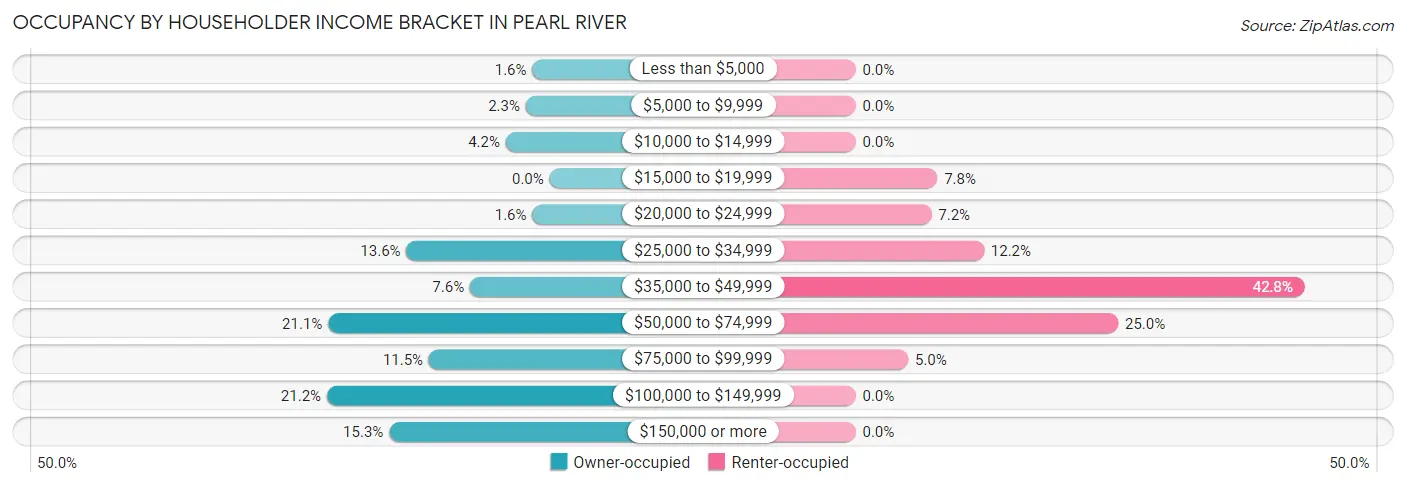
| Income Bracket | Owner-occupied | Renter-occupied |
| Less than $5,000 | 13 (1.6%) | 0 (0.0%) |
| $5,000 to $9,999 | 18 (2.3%) | 0 (0.0%) |
| $10,000 to $14,999 | 33 (4.2%) | 0 (0.0%) |
| $15,000 to $19,999 | 0 (0.0%) | 14 (7.8%) |
| $20,000 to $24,999 | 13 (1.6%) | 13 (7.2%) |
| $25,000 to $34,999 | 108 (13.6%) | 22 (12.2%) |
| $35,000 to $49,999 | 60 (7.6%) | 77 (42.8%) |
| $50,000 to $74,999 | 167 (21.1%) | 45 (25.0%) |
| $75,000 to $99,999 | 91 (11.5%) | 9 (5.0%) |
| $100,000 to $149,999 | 168 (21.2%) | 0 (0.0%) |
| $150,000 or more | 121 (15.3%) | 0 (0.0%) |
| Total | 792 (100.0%) | 180 (100.0%) |
Monthly Housing Cost Tiers in Pearl River
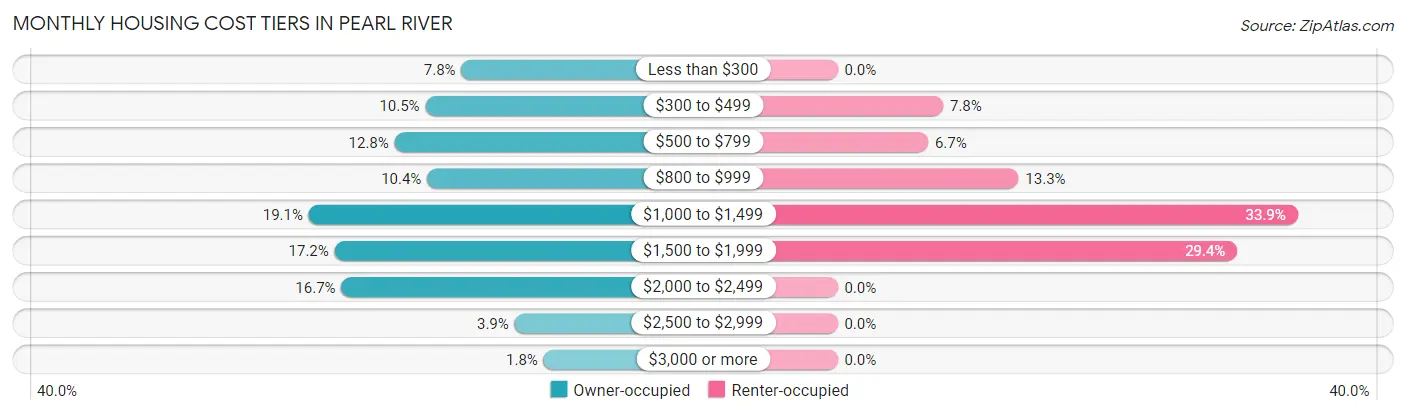
| Monthly Cost | Owner-occupied | Renter-occupied |
| Less than $300 | 62 (7.8%) | 0 (0.0%) |
| $300 to $499 | 83 (10.5%) | 14 (7.8%) |
| $500 to $799 | 101 (12.8%) | 12 (6.7%) |
| $800 to $999 | 82 (10.3%) | 24 (13.3%) |
| $1,000 to $1,499 | 151 (19.1%) | 61 (33.9%) |
| $1,500 to $1,999 | 136 (17.2%) | 53 (29.4%) |
| $2,000 to $2,499 | 132 (16.7%) | 0 (0.0%) |
| $2,500 to $2,999 | 31 (3.9%) | 0 (0.0%) |
| $3,000 or more | 14 (1.8%) | 0 (0.0%) |
| Total | 792 (100.0%) | 180 (100.0%) |
Physical Housing Characteristics in Pearl River
Housing Structures in Pearl River
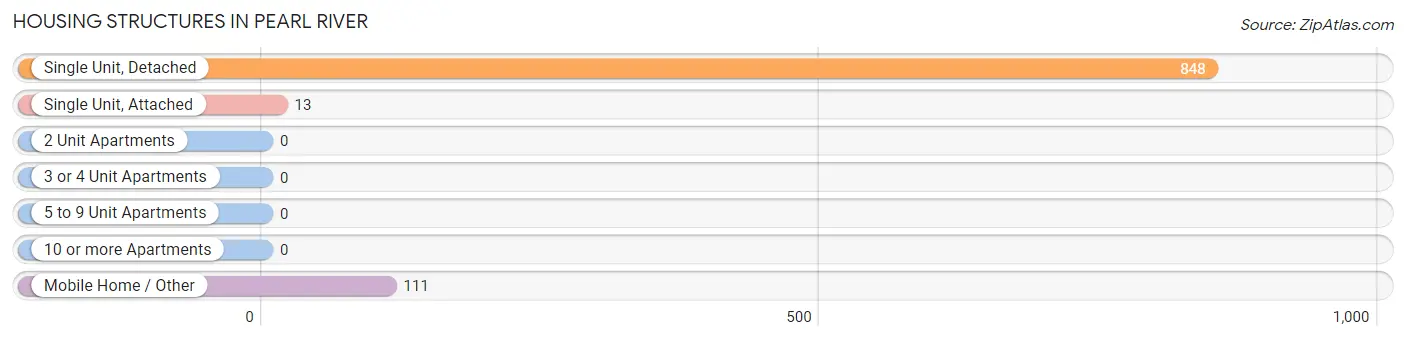
| Structure Type | # Housing Units | % Housing Units |
| Single Unit, Detached | 848 | 87.2% |
| Single Unit, Attached | 13 | 1.3% |
| 2 Unit Apartments | 0 | 0.0% |
| 3 or 4 Unit Apartments | 0 | 0.0% |
| 5 to 9 Unit Apartments | 0 | 0.0% |
| 10 or more Apartments | 0 | 0.0% |
| Mobile Home / Other | 111 | 11.4% |
| Total | 972 | 100.0% |
Housing Structures by Occupancy in Pearl River
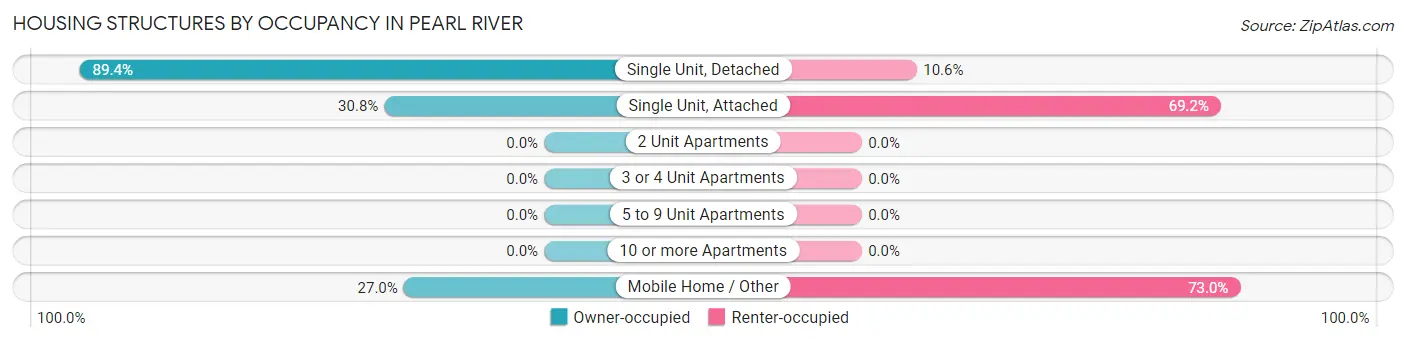
| Structure Type | Owner-occupied | Renter-occupied |
| Single Unit, Detached | 758 (89.4%) | 90 (10.6%) |
| Single Unit, Attached | 4 (30.8%) | 9 (69.2%) |
| 2 Unit Apartments | 0 (0.0%) | 0 (0.0%) |
| 3 or 4 Unit Apartments | 0 (0.0%) | 0 (0.0%) |
| 5 to 9 Unit Apartments | 0 (0.0%) | 0 (0.0%) |
| 10 or more Apartments | 0 (0.0%) | 0 (0.0%) |
| Mobile Home / Other | 30 (27.0%) | 81 (73.0%) |
| Total | 792 (81.5%) | 180 (18.5%) |
Housing Structures by Number of Rooms in Pearl River
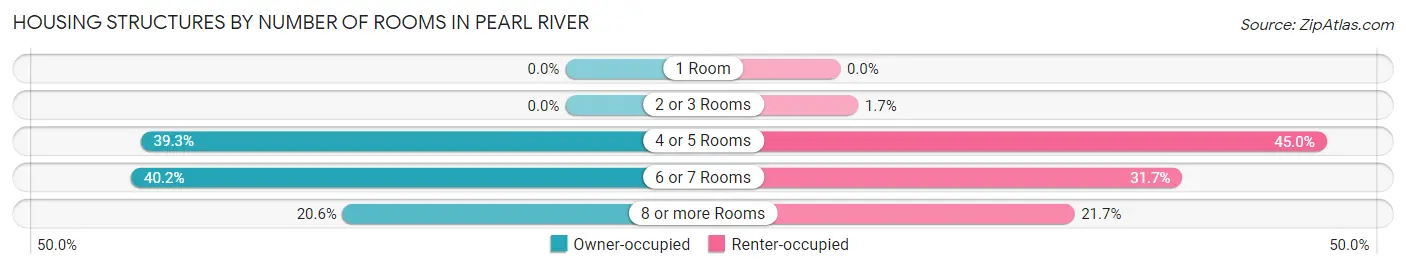
| Number of Rooms | Owner-occupied | Renter-occupied |
| 1 Room | 0 (0.0%) | 0 (0.0%) |
| 2 or 3 Rooms | 0 (0.0%) | 3 (1.7%) |
| 4 or 5 Rooms | 311 (39.3%) | 81 (45.0%) |
| 6 or 7 Rooms | 318 (40.2%) | 57 (31.7%) |
| 8 or more Rooms | 163 (20.6%) | 39 (21.7%) |
| Total | 792 (100.0%) | 180 (100.0%) |
Housing Structure by Heating Type in Pearl River
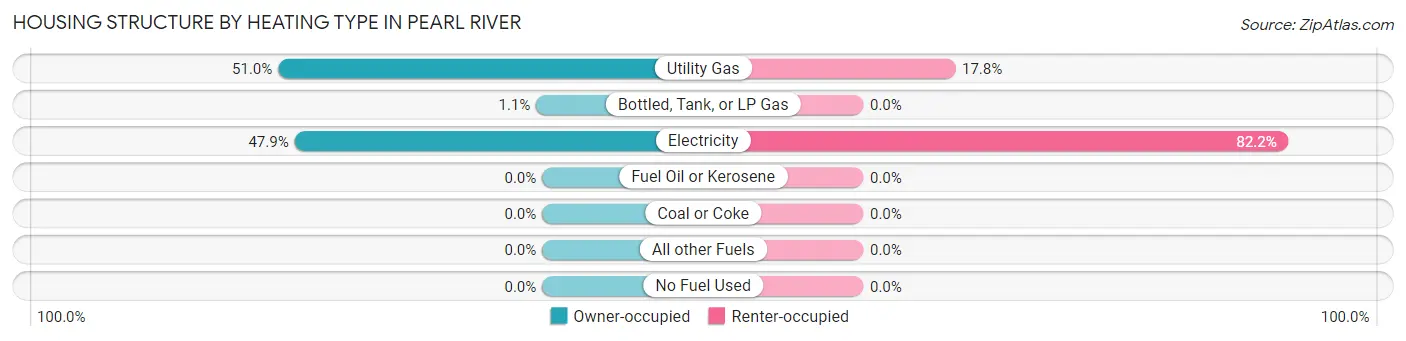
| Heating Type | Owner-occupied | Renter-occupied |
| Utility Gas | 404 (51.0%) | 32 (17.8%) |
| Bottled, Tank, or LP Gas | 9 (1.1%) | 0 (0.0%) |
| Electricity | 379 (47.8%) | 148 (82.2%) |
| Fuel Oil or Kerosene | 0 (0.0%) | 0 (0.0%) |
| Coal or Coke | 0 (0.0%) | 0 (0.0%) |
| All other Fuels | 0 (0.0%) | 0 (0.0%) |
| No Fuel Used | 0 (0.0%) | 0 (0.0%) |
| Total | 792 (100.0%) | 180 (100.0%) |
Household Vehicle Usage in Pearl River
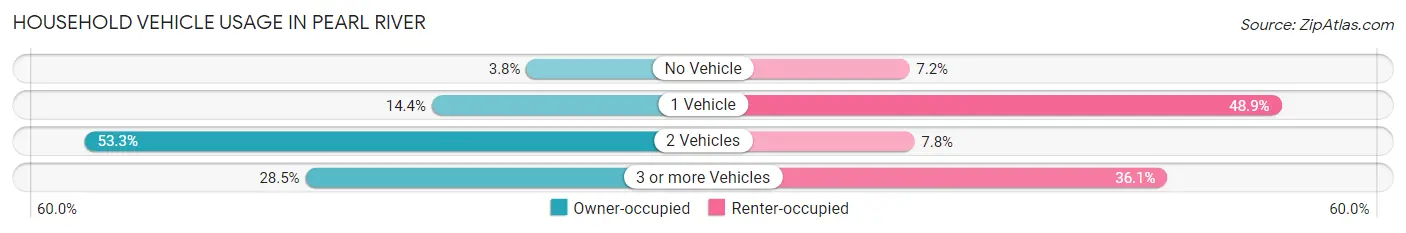
| Vehicles per Household | Owner-occupied | Renter-occupied |
| No Vehicle | 30 (3.8%) | 13 (7.2%) |
| 1 Vehicle | 114 (14.4%) | 88 (48.9%) |
| 2 Vehicles | 422 (53.3%) | 14 (7.8%) |
| 3 or more Vehicles | 226 (28.5%) | 65 (36.1%) |
| Total | 792 (100.0%) | 180 (100.0%) |
Real Estate & Mortgages in Pearl River
Real Estate and Mortgage Overview in Pearl River
| Characteristic | Without Mortgage | With Mortgage |
| Housing Units | 263 | 529 |
| Median Property Value | $170,000 | $233,800 |
| Median Household Income | $51,827 | $85 |
| Monthly Housing Costs | $472 | $6 |
| Real Estate Taxes | $806 | $7 |
Property Value by Mortgage Status in Pearl River
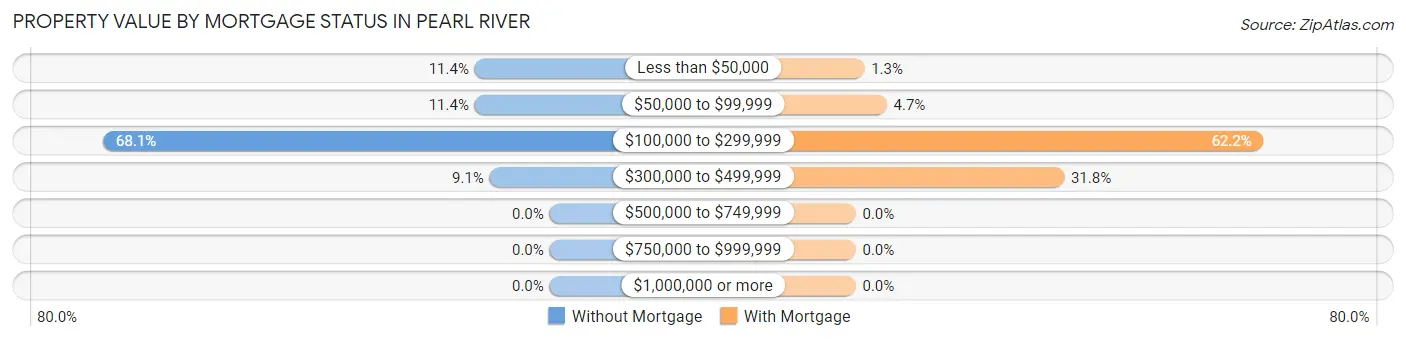
| Property Value | Without Mortgage | With Mortgage |
| Less than $50,000 | 30 (11.4%) | 7 (1.3%) |
| $50,000 to $99,999 | 30 (11.4%) | 25 (4.7%) |
| $100,000 to $299,999 | 179 (68.1%) | 329 (62.2%) |
| $300,000 to $499,999 | 24 (9.1%) | 168 (31.8%) |
| $500,000 to $749,999 | 0 (0.0%) | 0 (0.0%) |
| $750,000 to $999,999 | 0 (0.0%) | 0 (0.0%) |
| $1,000,000 or more | 0 (0.0%) | 0 (0.0%) |
| Total | 263 (100.0%) | 529 (100.0%) |
Household Income by Mortgage Status in Pearl River
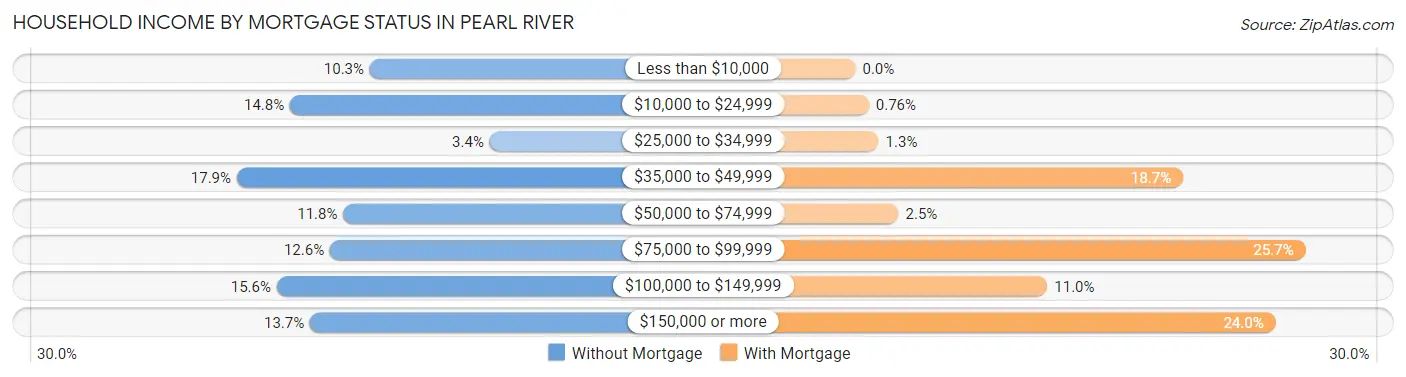
| Household Income | Without Mortgage | With Mortgage |
| Less than $10,000 | 27 (10.3%) | 0 (0.0%) |
| $10,000 to $24,999 | 39 (14.8%) | 4 (0.8%) |
| $25,000 to $34,999 | 9 (3.4%) | 7 (1.3%) |
| $35,000 to $49,999 | 47 (17.9%) | 99 (18.7%) |
| $50,000 to $74,999 | 31 (11.8%) | 13 (2.5%) |
| $75,000 to $99,999 | 33 (12.6%) | 136 (25.7%) |
| $100,000 to $149,999 | 41 (15.6%) | 58 (11.0%) |
| $150,000 or more | 36 (13.7%) | 127 (24.0%) |
| Total | 263 (100.0%) | 529 (100.0%) |
Property Value to Household Income Ratio in Pearl River
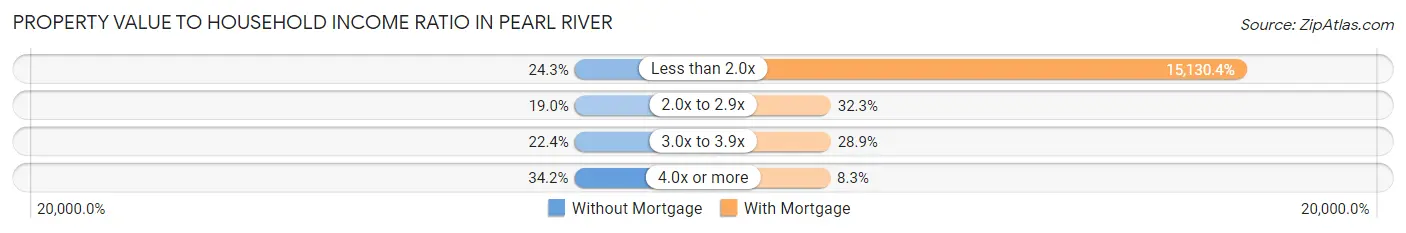
| Value-to-Income Ratio | Without Mortgage | With Mortgage |
| Less than 2.0x | 64 (24.3%) | 80,040 (15,130.4%) |
| 2.0x to 2.9x | 50 (19.0%) | 171 (32.3%) |
| 3.0x to 3.9x | 59 (22.4%) | 153 (28.9%) |
| 4.0x or more | 90 (34.2%) | 44 (8.3%) |
| Total | 263 (100.0%) | 529 (100.0%) |
Real Estate Taxes by Mortgage Status in Pearl River
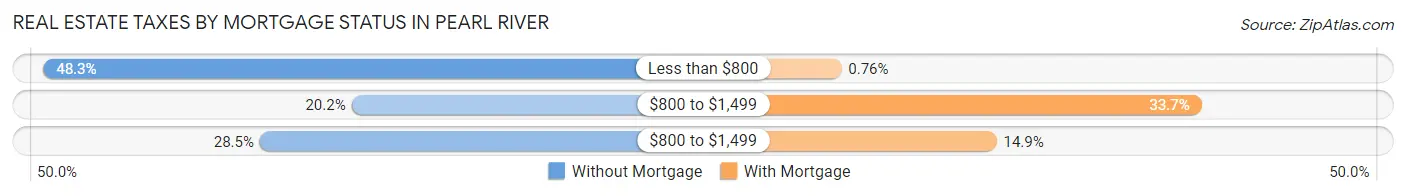
| Property Taxes | Without Mortgage | With Mortgage |
| Less than $800 | 127 (48.3%) | 4 (0.8%) |
| $800 to $1,499 | 53 (20.2%) | 178 (33.7%) |
| $800 to $1,499 | 75 (28.5%) | 79 (14.9%) |
| Total | 263 (100.0%) | 529 (100.0%) |
Health & Disability in Pearl River
Health Insurance Coverage by Age in Pearl River
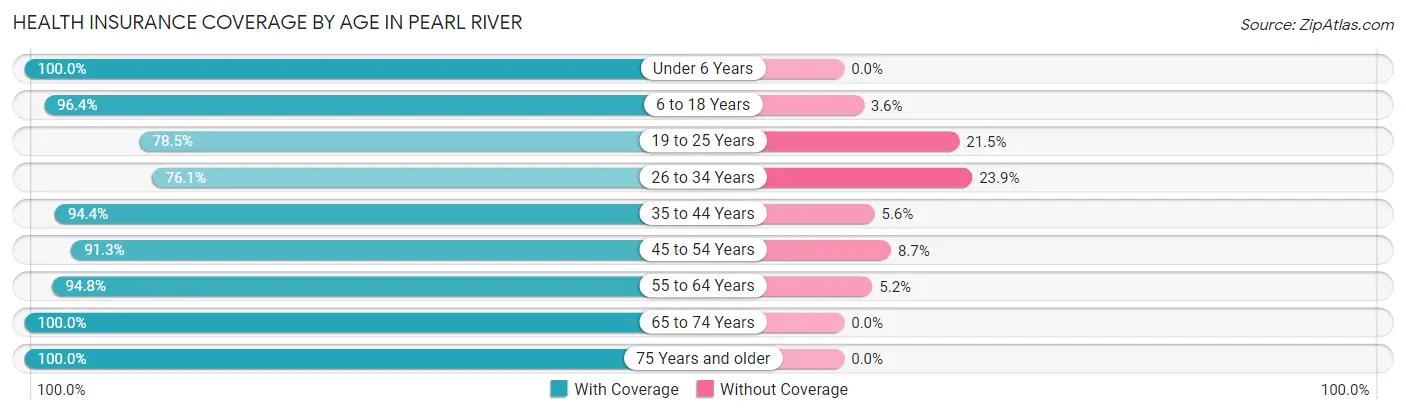
| Age Bracket | With Coverage | Without Coverage |
| Under 6 Years | 115 (100.0%) | 0 (0.0%) |
| 6 to 18 Years | 505 (96.4%) | 19 (3.6%) |
| 19 to 25 Years | 205 (78.5%) | 56 (21.5%) |
| 26 to 34 Years | 217 (76.1%) | 68 (23.9%) |
| 35 to 44 Years | 184 (94.4%) | 11 (5.6%) |
| 45 to 54 Years | 252 (91.3%) | 24 (8.7%) |
| 55 to 64 Years | 489 (94.8%) | 27 (5.2%) |
| 65 to 74 Years | 251 (100.0%) | 0 (0.0%) |
| 75 Years and older | 161 (100.0%) | 0 (0.0%) |
| Total | 2,379 (92.1%) | 205 (7.9%) |
Health Insurance Coverage by Citizenship Status in Pearl River
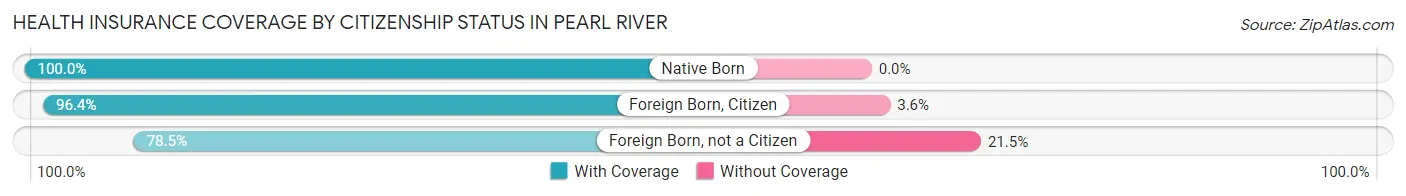
| Citizenship Status | With Coverage | Without Coverage |
| Native Born | 115 (100.0%) | 0 (0.0%) |
| Foreign Born, Citizen | 505 (96.4%) | 19 (3.6%) |
| Foreign Born, not a Citizen | 205 (78.5%) | 56 (21.5%) |
Health Insurance Coverage by Household Income in Pearl River
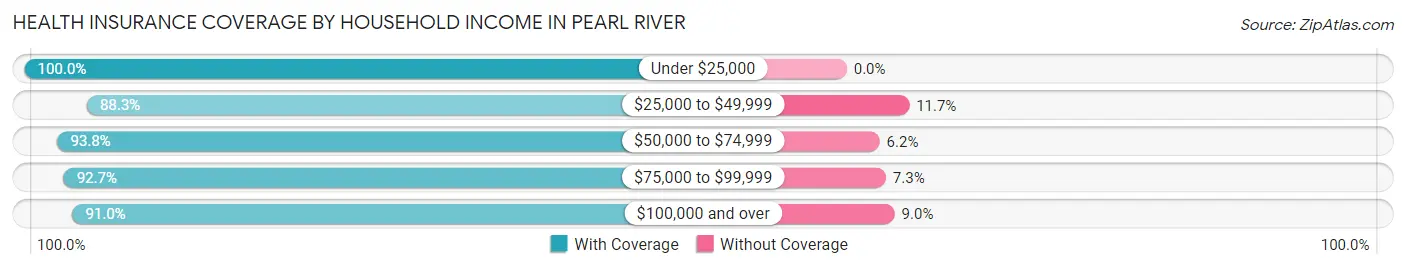
| Household Income | With Coverage | Without Coverage |
| Under $25,000 | 170 (100.0%) | 0 (0.0%) |
| $25,000 to $49,999 | 423 (88.3%) | 56 (11.7%) |
| $50,000 to $74,999 | 670 (93.8%) | 44 (6.2%) |
| $75,000 to $99,999 | 253 (92.7%) | 20 (7.3%) |
| $100,000 and over | 863 (91.0%) | 85 (9.0%) |
Public vs Private Health Insurance Coverage by Age in Pearl River
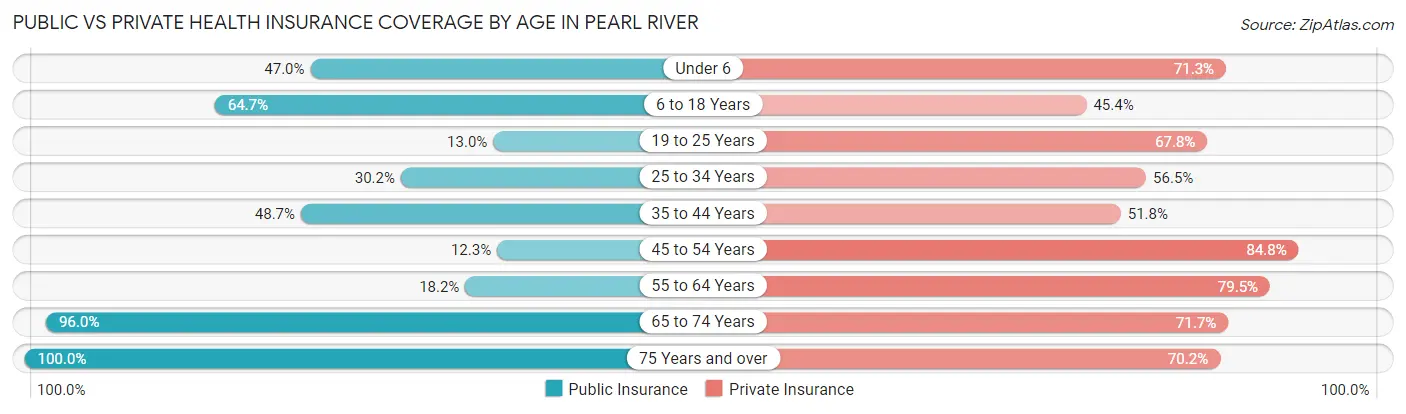
| Age Bracket | Public Insurance | Private Insurance |
| Under 6 | 54 (47.0%) | 82 (71.3%) |
| 6 to 18 Years | 339 (64.7%) | 238 (45.4%) |
| 19 to 25 Years | 34 (13.0%) | 177 (67.8%) |
| 25 to 34 Years | 86 (30.2%) | 161 (56.5%) |
| 35 to 44 Years | 95 (48.7%) | 101 (51.8%) |
| 45 to 54 Years | 34 (12.3%) | 234 (84.8%) |
| 55 to 64 Years | 94 (18.2%) | 410 (79.5%) |
| 65 to 74 Years | 241 (96.0%) | 180 (71.7%) |
| 75 Years and over | 161 (100.0%) | 113 (70.2%) |
| Total | 1,138 (44.0%) | 1,696 (65.6%) |
Disability Status by Sex by Age in Pearl River
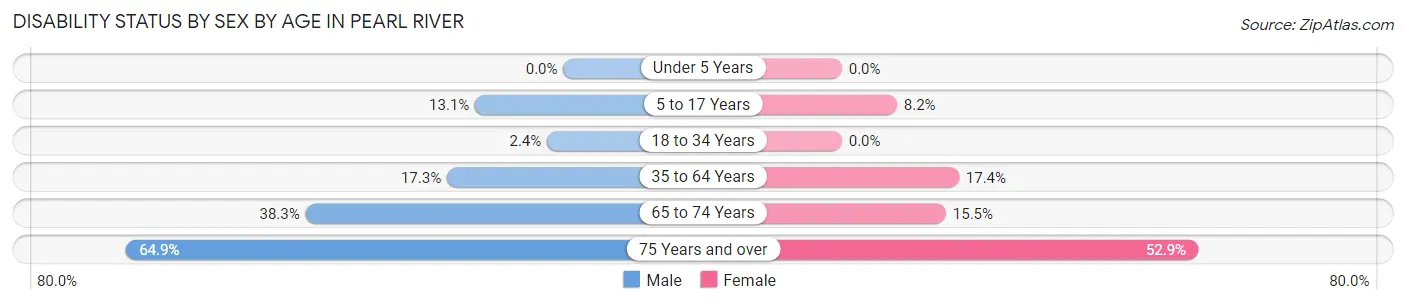
| Age Bracket | Male | Female |
| Under 5 Years | 0 (0.0%) | 0 (0.0%) |
| 5 to 17 Years | 41 (13.1%) | 17 (8.2%) |
| 18 to 34 Years | 9 (2.4%) | 0 (0.0%) |
| 35 to 64 Years | 98 (17.3%) | 73 (17.4%) |
| 65 to 74 Years | 49 (38.3%) | 19 (15.4%) |
| 75 Years and over | 37 (64.9%) | 55 (52.9%) |
Disability Class by Sex by Age in Pearl River
Disability Class: Hearing Difficulty
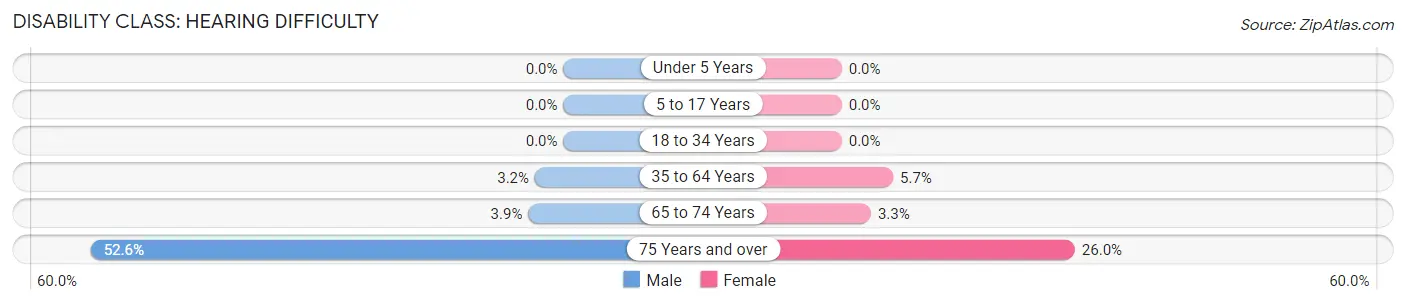
| Age Bracket | Male | Female |
| Under 5 Years | 0 (0.0%) | 0 (0.0%) |
| 5 to 17 Years | 0 (0.0%) | 0 (0.0%) |
| 18 to 34 Years | 0 (0.0%) | 0 (0.0%) |
| 35 to 64 Years | 18 (3.2%) | 24 (5.7%) |
| 65 to 74 Years | 5 (3.9%) | 4 (3.3%) |
| 75 Years and over | 30 (52.6%) | 27 (26.0%) |
Disability Class: Vision Difficulty
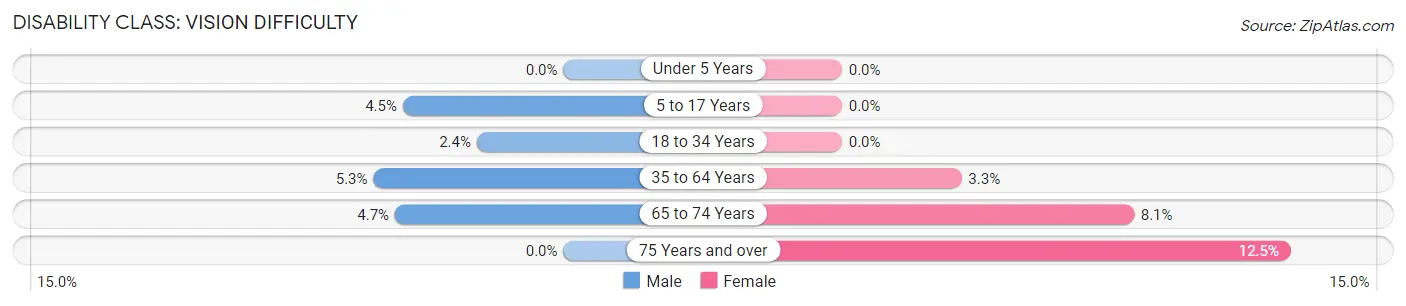
| Age Bracket | Male | Female |
| Under 5 Years | 0 (0.0%) | 0 (0.0%) |
| 5 to 17 Years | 14 (4.5%) | 0 (0.0%) |
| 18 to 34 Years | 9 (2.4%) | 0 (0.0%) |
| 35 to 64 Years | 30 (5.3%) | 14 (3.3%) |
| 65 to 74 Years | 6 (4.7%) | 10 (8.1%) |
| 75 Years and over | 0 (0.0%) | 13 (12.5%) |
Disability Class: Cognitive Difficulty
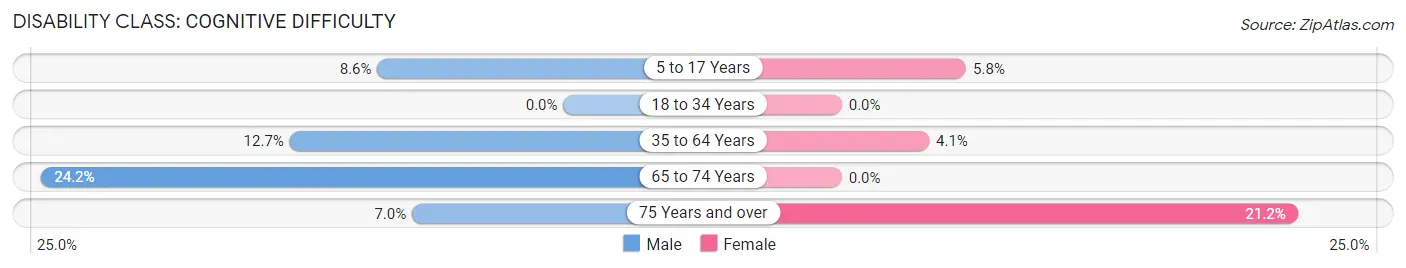
| Age Bracket | Male | Female |
| 5 to 17 Years | 27 (8.6%) | 12 (5.8%) |
| 18 to 34 Years | 0 (0.0%) | 0 (0.0%) |
| 35 to 64 Years | 72 (12.7%) | 17 (4.1%) |
| 65 to 74 Years | 31 (24.2%) | 0 (0.0%) |
| 75 Years and over | 4 (7.0%) | 22 (21.1%) |
Disability Class: Ambulatory Difficulty
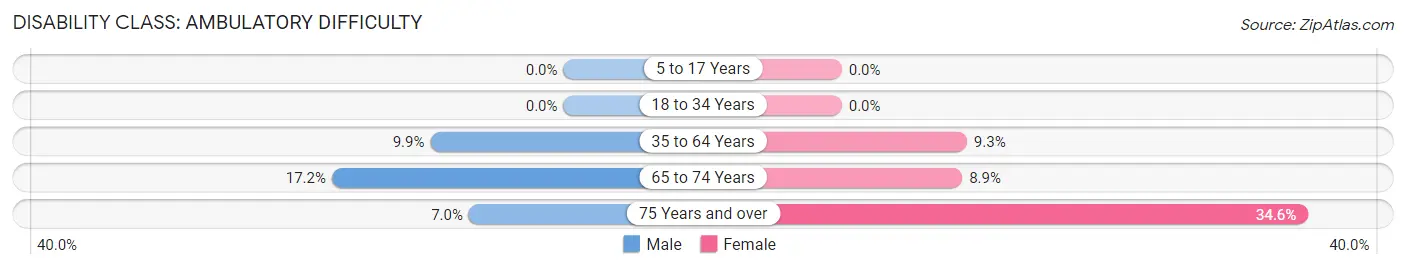
| Age Bracket | Male | Female |
| 5 to 17 Years | 0 (0.0%) | 0 (0.0%) |
| 18 to 34 Years | 0 (0.0%) | 0 (0.0%) |
| 35 to 64 Years | 56 (9.9%) | 39 (9.3%) |
| 65 to 74 Years | 22 (17.2%) | 11 (8.9%) |
| 75 Years and over | 4 (7.0%) | 36 (34.6%) |
Disability Class: Self-Care Difficulty
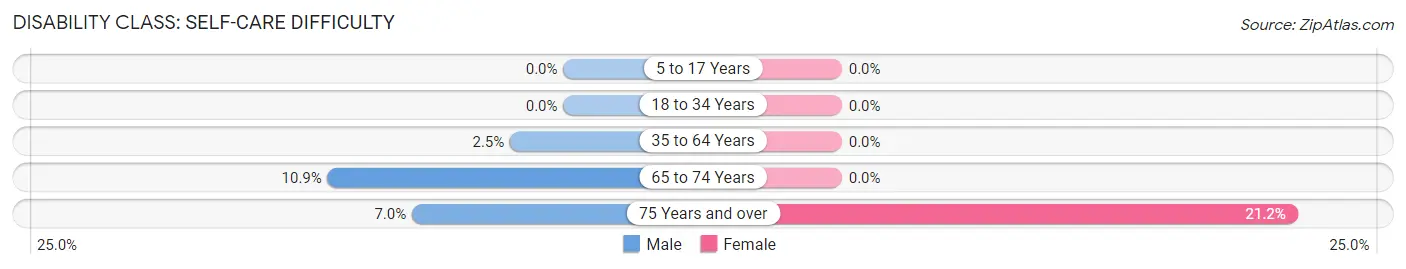
| Age Bracket | Male | Female |
| 5 to 17 Years | 0 (0.0%) | 0 (0.0%) |
| 18 to 34 Years | 0 (0.0%) | 0 (0.0%) |
| 35 to 64 Years | 14 (2.5%) | 0 (0.0%) |
| 65 to 74 Years | 14 (10.9%) | 0 (0.0%) |
| 75 Years and over | 4 (7.0%) | 22 (21.1%) |
Technology Access in Pearl River
Computing Device Access in Pearl River
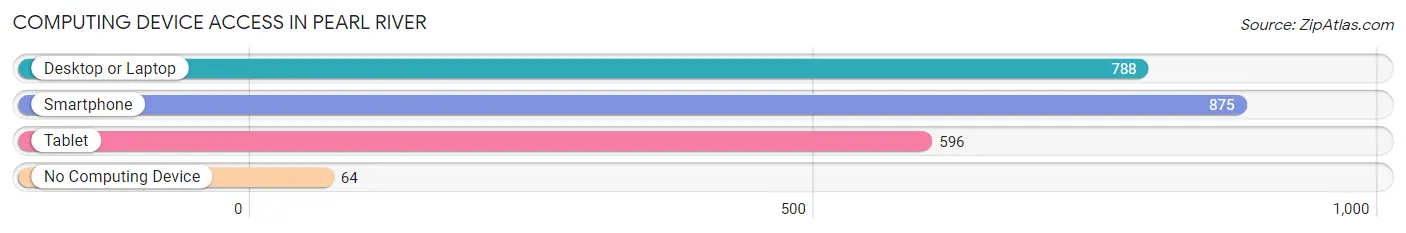
| Device Type | # Households | % Households |
| Desktop or Laptop | 788 | 81.1% |
| Smartphone | 875 | 90.0% |
| Tablet | 596 | 61.3% |
| No Computing Device | 64 | 6.6% |
| Total | 972 | 100.0% |
Internet Access in Pearl River
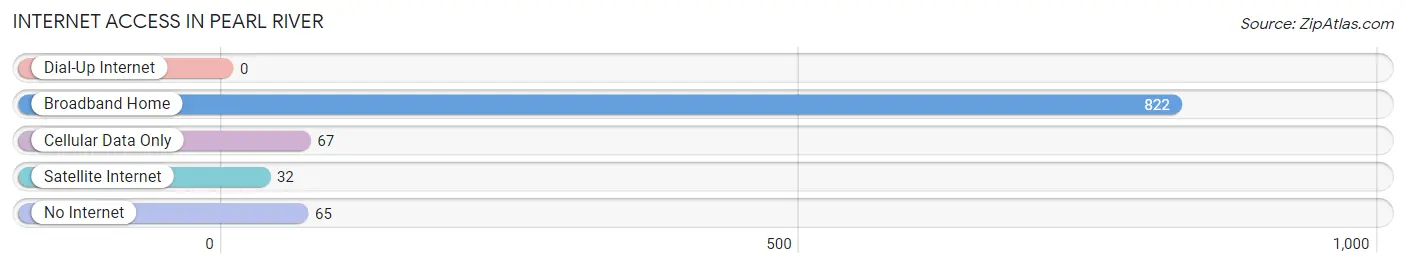
| Internet Type | # Households | % Households |
| Dial-Up Internet | 0 | 0.0% |
| Broadband Home | 822 | 84.6% |
| Cellular Data Only | 67 | 6.9% |
| Satellite Internet | 32 | 3.3% |
| No Internet | 65 | 6.7% |
| Total | 972 | 100.0% |
Pearl River Summary
Pearl River, Louisiana is a small town located in St. Tammany Parish, Louisiana. It is situated on the Pearl River, which is a tributary of the Bogue Chitto River. The town is located about 25 miles north of New Orleans and is part of the New Orleans metropolitan area. The population of Pearl River was estimated to be 8,717 in 2019.
History
The area that is now Pearl River was originally inhabited by the Choctaw Indians. The first European settlers arrived in the area in the late 1700s. The town was originally known as "Hogtown" due to the abundance of wild hogs in the area. The name was changed to Pearl River in 1845 when the post office was established.
The town was an important port for the lumber industry in the late 1800s and early 1900s. The Pearl River Lumber Company was established in 1891 and was one of the largest lumber companies in the area. The company operated until the Great Depression in the 1930s.
The town was also an important stop on the New Orleans and Northeastern Railroad. The railroad was built in the late 1800s and connected New Orleans to Meridian, Mississippi. The railroad was an important factor in the growth of the town.
Geography
Pearl River is located in St. Tammany Parish, Louisiana. It is situated on the Pearl River, which is a tributary of the Bogue Chitto River. The town is located about 25 miles north of New Orleans and is part of the New Orleans metropolitan area.
The town is located in a humid subtropical climate zone. The average temperature in the summer is around 80 degrees Fahrenheit and the average temperature in the winter is around 50 degrees Fahrenheit. The town receives an average of 60 inches of rain per year.
Economy
The economy of Pearl River is largely based on the service industry. The town is home to several restaurants, retail stores, and other businesses. The town is also home to several manufacturing companies, including a paper mill and a plastics factory.
The town is also home to several tourist attractions, including the Pearl River Wildlife Management Area and the Pearl River State Park. The town is also home to several festivals, including the Pearl River Crawfish Festival and the Pearl River Mardi Gras Parade.
Demographics
The population of Pearl River was estimated to be 8,717 in 2019. The town has a diverse population, with the majority of the population being white (77.3%), followed by African American (17.2%), Hispanic (2.7%), and Asian (1.7%). The median household income in the town is $50,945 and the median home value is $179,400.
The town is served by the St. Tammany Parish Public Schools. The town is also home to several private schools, including Pearl River High School and Pearl River Middle School.
Conclusion
Pearl River, Louisiana is a small town located in St. Tammany Parish, Louisiana. It is situated on the Pearl River, which is a tributary of the Bogue Chitto River. The town is located about 25 miles north of New Orleans and is part of the New Orleans metropolitan area. The population of Pearl River was estimated to be 8,717 in 2019. The economy of Pearl River is largely based on the service industry and the town is home to several tourist attractions. The town has a diverse population, with the majority of the population being white. The town is served by the St. Tammany Parish Public Schools and is home to several private schools.
Common Questions
What is Per Capita Income in Pearl River?
Per Capita income in Pearl River is $37,198.
What is the Median Family Income in Pearl River?
Median Family Income in Pearl River is $68,333.
What is the Median Household income in Pearl River?
Median Household Income in Pearl River is $59,702.
What is Income or Wage Gap in Pearl River?
Income or Wage Gap in Pearl River is 15.8%.
Women in Pearl River earn 84.2 cents for every dollar earned by a man.
What is Inequality or Gini Index in Pearl River?
Inequality or Gini Index in Pearl River is 0.51.
What is the Total Population of Pearl River?
Total Population of Pearl River is 2,584.
What is the Total Male Population of Pearl River?
Total Male Population of Pearl River is 1,460.
What is the Total Female Population of Pearl River?
Total Female Population of Pearl River is 1,124.
What is the Ratio of Males per 100 Females in Pearl River?
There are 129.89 Males per 100 Females in Pearl River.
What is the Ratio of Females per 100 Males in Pearl River?
There are 76.99 Females per 100 Males in Pearl River.
What is the Median Population Age in Pearl River?
Median Population Age in Pearl River is 40.6 Years.
What is the Average Family Size in Pearl River
Average Family Size in Pearl River is 3.0 People.
What is the Average Household Size in Pearl River
Average Household Size in Pearl River is 2.7 People.
How Large is the Labor Force in Pearl River?
There are 1,432 People in the Labor Forcein in Pearl River.
What is the Percentage of People in the Labor Force in Pearl River?
69.7% of People are in the Labor Force in Pearl River.
What is the Unemployment Rate in Pearl River?
Unemployment Rate in Pearl River is 4.6%.