Opelousas, LA Map & Demographics
Opelousas Map
Opelousas Overview
$19,174
PER CAPITA INCOME
$40,362
AVG FAMILY INCOME
$34,271
AVG HOUSEHOLD INCOME
14.7%
WAGE / INCOME GAP [ % ]
85.3¢/ $1
WAGE / INCOME GAP [ $ ]
$11,053
FAMILY INCOME DEFICIT
0.49
INEQUALITY / GINI INDEX
15,810
TOTAL POPULATION
7,255
MALE POPULATION
8,555
FEMALE POPULATION
84.80
MALES / 100 FEMALES
117.92
FEMALES / 100 MALES
33.8
MEDIAN AGE
3.6
AVG FAMILY SIZE
2.7
AVG HOUSEHOLD SIZE
5,926
LABOR FORCE [ PEOPLE ]
49.9%
PERCENT IN LABOR FORCE
11.0%
UNEMPLOYMENT RATE
Opelousas Zip Codes
Opelousas Area Codes
Income in Opelousas
Income Overview in Opelousas
Per Capita Income in Opelousas is $19,174, while median incomes of families and households are $40,362 and $34,271 respectively.
| Characteristic | Number | Measure |
| Per Capita Income | 15,810 | $19,174 |
| Median Family Income | 3,376 | $40,362 |
| Mean Family Income | 3,376 | $52,734 |
| Median Household Income | 5,721 | $34,271 |
| Mean Household Income | 5,721 | $46,430 |
| Income Deficit | 3,376 | $11,053 |
| Wage / Income Gap (%) | 15,810 | 14.73% |
| Wage / Income Gap ($) | 15,810 | 85.27¢ per $1 |
| Gini / Inequality Index | 15,810 | 0.49 |
Earnings by Sex in Opelousas
Average Earnings in Opelousas are $31,212, $34,446 for men and $29,371 for women, a difference of 14.7%.
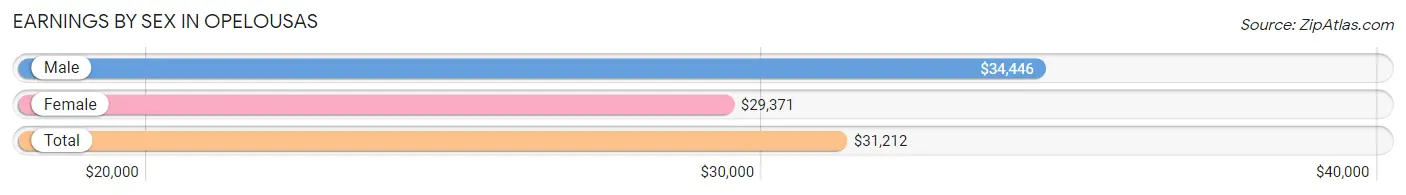
| Sex | Number | Average Earnings |
| Male | 2,829 (47.6%) | $34,446 |
| Female | 3,114 (52.4%) | $29,371 |
| Total | 5,943 (100.0%) | $31,212 |
Earnings by Sex by Income Bracket in Opelousas
The most common earnings brackets in Opelousas are $100,000+ for men (251 | 8.9%) and $25,000 to $29,999 for women (381 | 12.2%).
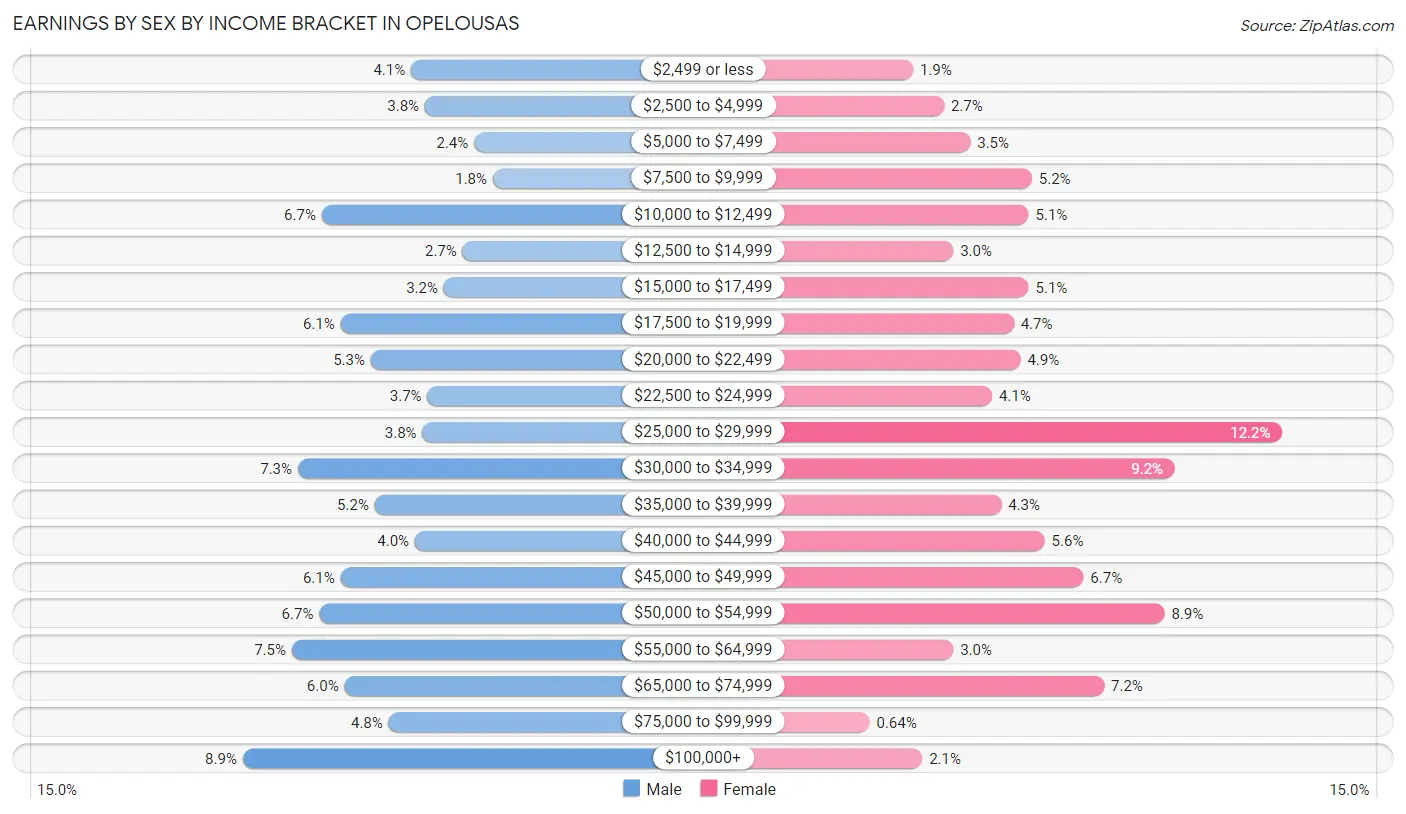
| Income | Male | Female |
| $2,499 or less | 117 (4.1%) | 58 (1.9%) |
| $2,500 to $4,999 | 106 (3.7%) | 85 (2.7%) |
| $5,000 to $7,499 | 67 (2.4%) | 108 (3.5%) |
| $7,500 to $9,999 | 52 (1.8%) | 162 (5.2%) |
| $10,000 to $12,499 | 188 (6.7%) | 159 (5.1%) |
| $12,500 to $14,999 | 76 (2.7%) | 93 (3.0%) |
| $15,000 to $17,499 | 91 (3.2%) | 159 (5.1%) |
| $17,500 to $19,999 | 173 (6.1%) | 146 (4.7%) |
| $20,000 to $22,499 | 149 (5.3%) | 152 (4.9%) |
| $22,500 to $24,999 | 104 (3.7%) | 127 (4.1%) |
| $25,000 to $29,999 | 108 (3.8%) | 381 (12.2%) |
| $30,000 to $34,999 | 207 (7.3%) | 287 (9.2%) |
| $35,000 to $39,999 | 146 (5.2%) | 135 (4.3%) |
| $40,000 to $44,999 | 114 (4.0%) | 173 (5.6%) |
| $45,000 to $49,999 | 173 (6.1%) | 207 (6.7%) |
| $50,000 to $54,999 | 190 (6.7%) | 278 (8.9%) |
| $55,000 to $64,999 | 212 (7.5%) | 93 (3.0%) |
| $65,000 to $74,999 | 170 (6.0%) | 225 (7.2%) |
| $75,000 to $99,999 | 135 (4.8%) | 20 (0.6%) |
| $100,000+ | 251 (8.9%) | 66 (2.1%) |
| Total | 2,829 (100.0%) | 3,114 (100.0%) |
Earnings by Sex by Educational Attainment in Opelousas
Average earnings in Opelousas are $41,588 for men and $29,814 for women, a difference of 28.3%. Men with an educational attainment of bachelor's degree enjoy the highest average annual earnings of $64,545, while those with less than high school education earn the least with $16,308. Women with an educational attainment of graduate degree earn the most with the average annual earnings of $50,147, while those with less than high school education have the smallest earnings of $20,486.
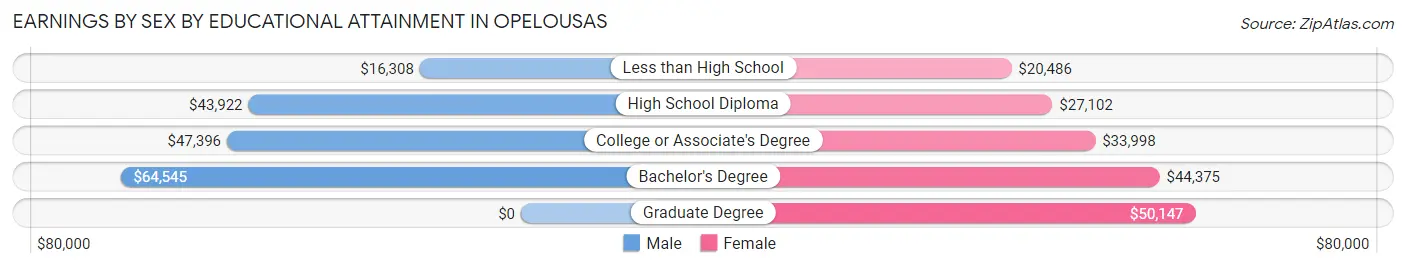
| Educational Attainment | Male Income | Female Income |
| Less than High School | $16,308 | $20,486 |
| High School Diploma | $43,922 | $27,102 |
| College or Associate's Degree | $47,396 | $33,998 |
| Bachelor's Degree | $64,545 | $44,375 |
| Graduate Degree | - | - |
| Total | $41,588 | $29,814 |
Family Income in Opelousas
Family Income Brackets in Opelousas
According to the Opelousas family income data, there are 557 families falling into the $50,000 to $74,999 income range, which is the most common income bracket and makes up 16.5% of all families. Conversely, the $150,000 to $199,999 income bracket is the least frequent group with only 37 families (1.1%) belonging to this category.
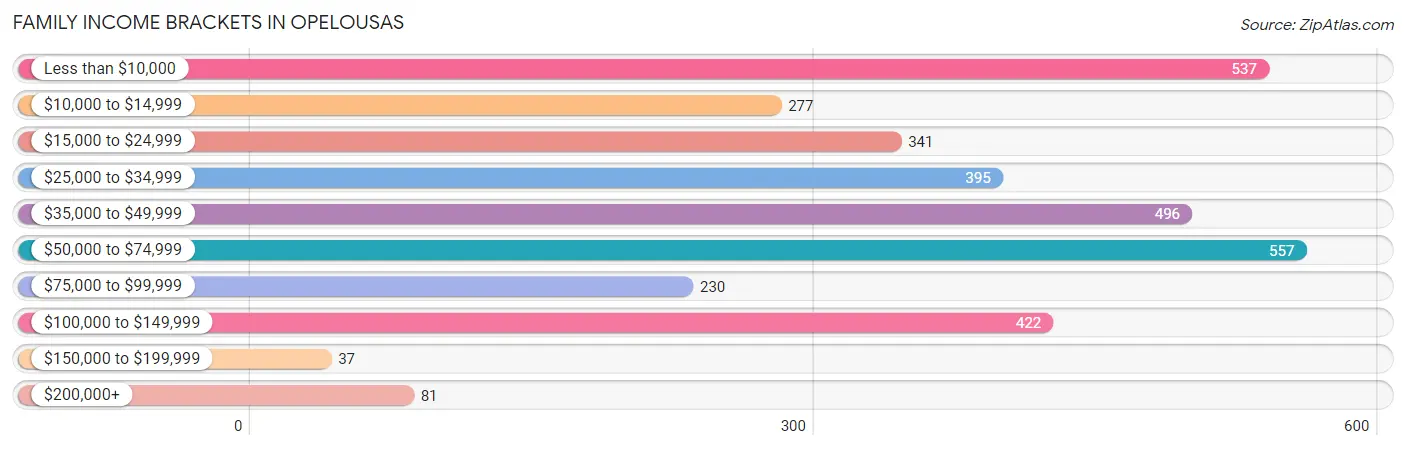
| Income Bracket | # Families | % Families |
| Less than $10,000 | 537 | 15.9% |
| $10,000 to $14,999 | 277 | 8.2% |
| $15,000 to $24,999 | 341 | 10.1% |
| $25,000 to $34,999 | 395 | 11.7% |
| $35,000 to $49,999 | 496 | 14.7% |
| $50,000 to $74,999 | 557 | 16.5% |
| $75,000 to $99,999 | 230 | 6.8% |
| $100,000 to $149,999 | 422 | 12.5% |
| $150,000 to $199,999 | 37 | 1.1% |
| $200,000+ | 81 | 2.4% |
Family Income by Famaliy Size in Opelousas
6-person families (178 | 5.3%) account for the highest median family income in Opelousas with $91,827 per family, while 5-person families (112 | 3.3%) have the highest median income of $17,421 per family member.
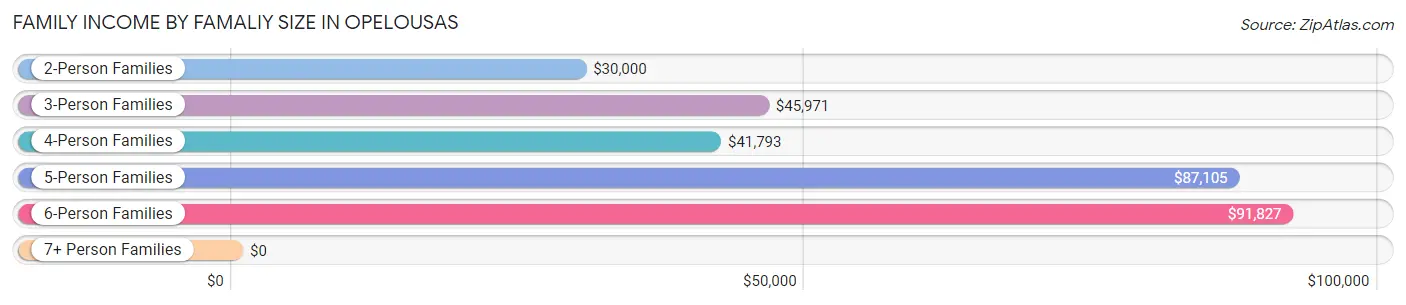
| Income Bracket | # Families | Median Income |
| 2-Person Families | 1,386 (41.0%) | $30,000 |
| 3-Person Families | 782 (23.2%) | $45,971 |
| 4-Person Families | 869 (25.7%) | $41,793 |
| 5-Person Families | 112 (3.3%) | $87,105 |
| 6-Person Families | 178 (5.3%) | $91,827 |
| 7+ Person Families | 49 (1.5%) | $0 |
| Total | 3,376 (100.0%) | $40,362 |
Family Income by Number of Earners in Opelousas
The median family income in Opelousas is $40,362, with families comprising 3+ earners (168) having the highest median family income of $138,077, while families with no earners (877) have the lowest median family income of $11,279, accounting for 5.0% and 26.0% of families, respectively.
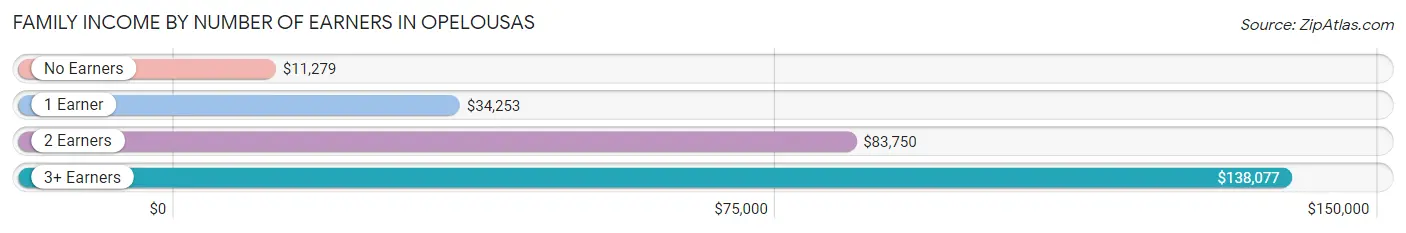
| Number of Earners | # Families | Median Income |
| No Earners | 877 (26.0%) | $11,279 |
| 1 Earner | 1,535 (45.5%) | $34,253 |
| 2 Earners | 796 (23.6%) | $83,750 |
| 3+ Earners | 168 (5.0%) | $138,077 |
| Total | 3,376 (100.0%) | $40,362 |
Household Income in Opelousas
Household Income Brackets in Opelousas
With 915 households falling in the category, the $50,000 to $74,999 income range is the most frequent in Opelousas, accounting for 16.0% of all households. In contrast, only 57 households (1.0%) fall into the $150,000 to $199,999 income bracket, making it the least populous group.
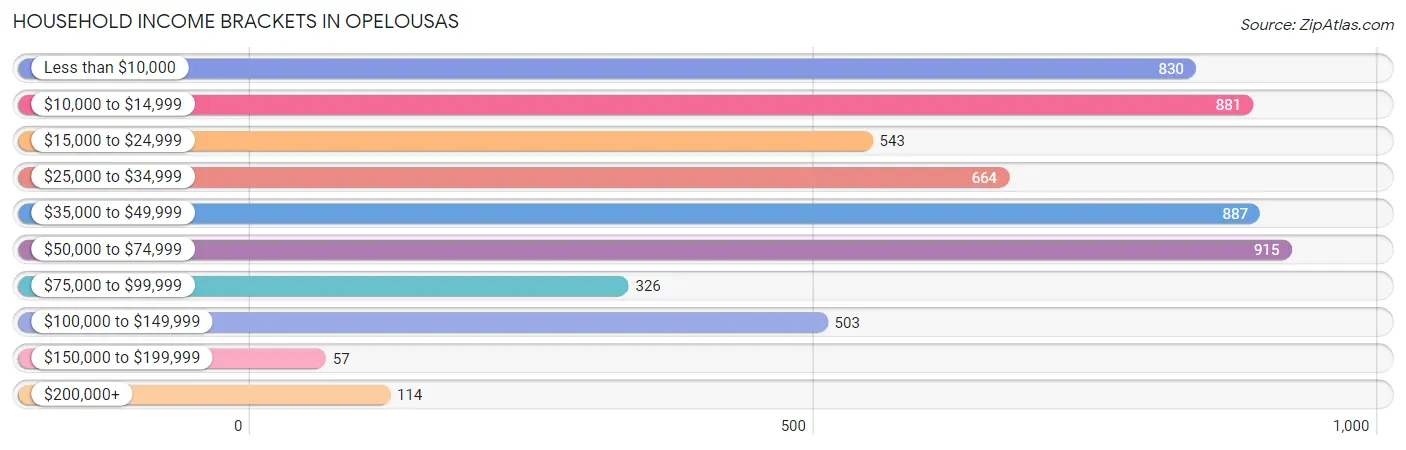
| Income Bracket | # Households | % Households |
| Less than $10,000 | 830 | 14.5% |
| $10,000 to $14,999 | 881 | 15.4% |
| $15,000 to $24,999 | 543 | 9.5% |
| $25,000 to $34,999 | 664 | 11.6% |
| $35,000 to $49,999 | 887 | 15.5% |
| $50,000 to $74,999 | 915 | 16.0% |
| $75,000 to $99,999 | 326 | 5.7% |
| $100,000 to $149,999 | 503 | 8.8% |
| $150,000 to $199,999 | 57 | 1.0% |
| $200,000+ | 114 | 2.0% |
Household Income by Householder Age in Opelousas
The median household income in Opelousas is $34,271, with the highest median household income of $40,301 found in the 25 to 44 years age bracket for the primary householder. A total of 1,810 households (31.6%) fall into this category. Meanwhile, the 15 to 24 years age bracket for the primary householder has the lowest median household income of $2,499, with 133 households (2.3%) in this group.
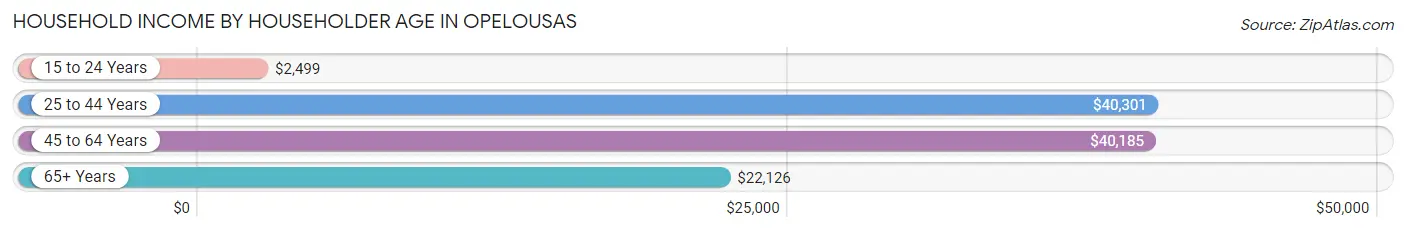
| Income Bracket | # Households | Median Income |
| 15 to 24 Years | 133 (2.3%) | $2,499 |
| 25 to 44 Years | 1,810 (31.6%) | $40,301 |
| 45 to 64 Years | 2,290 (40.0%) | $40,185 |
| 65+ Years | 1,488 (26.0%) | $22,126 |
| Total | 5,721 (100.0%) | $34,271 |
Poverty in Opelousas
Income Below Poverty by Sex and Age in Opelousas
With 34.1% poverty level for males and 42.9% for females among the residents of Opelousas, 5 year old males and 5 year old females are the most vulnerable to poverty, with 49 males (74.2%) and 68 females (80.0%) in their respective age groups living below the poverty level.
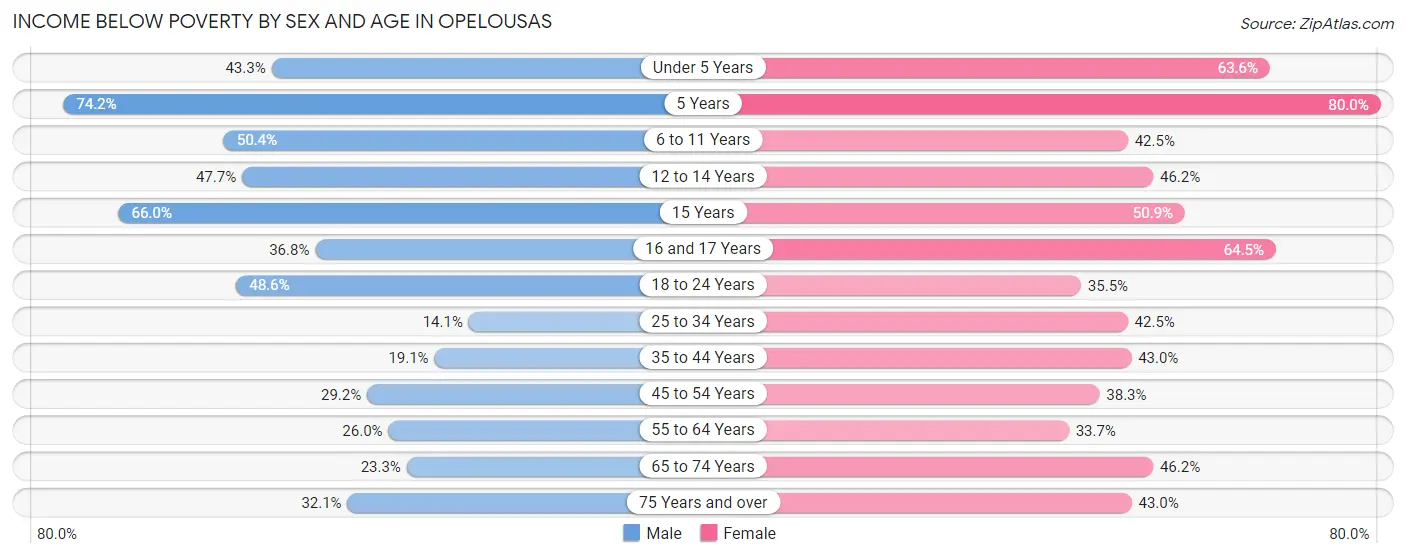
| Age Bracket | Male | Female |
| Under 5 Years | 205 (43.3%) | 279 (63.5%) |
| 5 Years | 49 (74.2%) | 68 (80.0%) |
| 6 to 11 Years | 478 (50.4%) | 338 (42.5%) |
| 12 to 14 Years | 209 (47.7%) | 208 (46.2%) |
| 15 Years | 35 (66.0%) | 54 (50.9%) |
| 16 and 17 Years | 105 (36.8%) | 136 (64.4%) |
| 18 to 24 Years | 404 (48.6%) | 272 (35.5%) |
| 25 to 34 Years | 120 (14.1%) | 467 (42.4%) |
| 35 to 44 Years | 142 (19.1%) | 440 (43.0%) |
| 45 to 54 Years | 232 (29.1%) | 433 (38.3%) |
| 55 to 64 Years | 159 (26.0%) | 345 (33.7%) |
| 65 to 74 Years | 120 (23.3%) | 329 (46.2%) |
| 75 Years and over | 84 (32.1%) | 265 (43.0%) |
| Total | 2,342 (34.1%) | 3,634 (42.9%) |
Income Above Poverty by Sex and Age in Opelousas
According to the poverty statistics in Opelousas, males aged 25 to 34 years and females aged 55 to 64 years are the age groups that are most secure financially, with 86.0% of males and 66.3% of females in these age groups living above the poverty line.
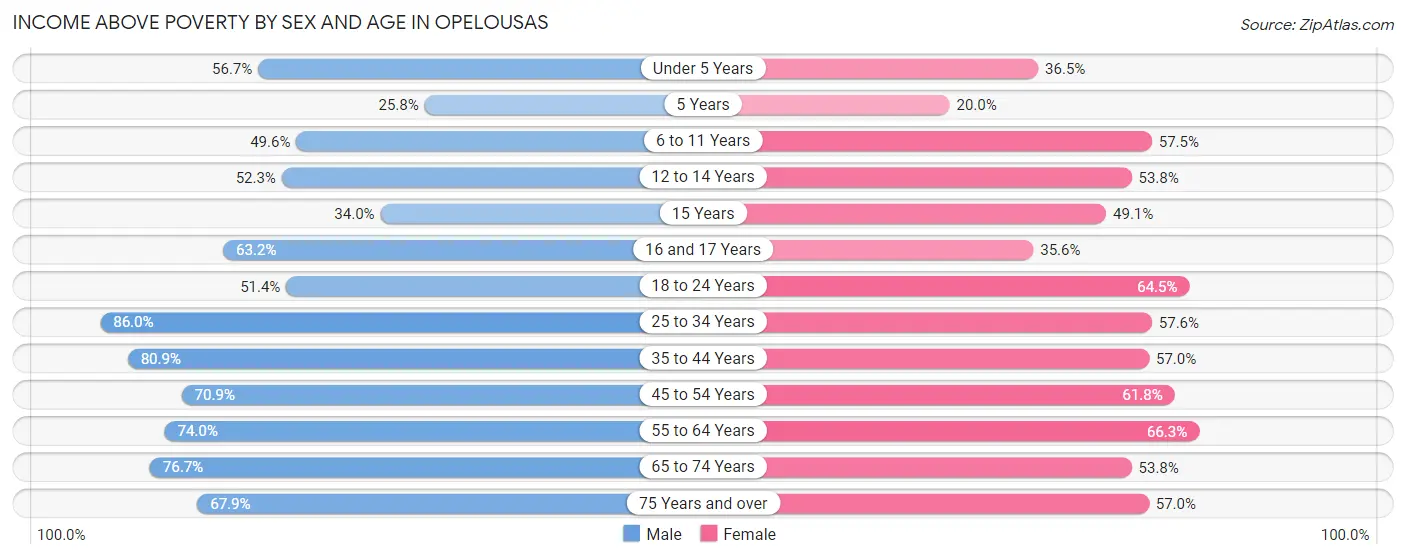
| Age Bracket | Male | Female |
| Under 5 Years | 268 (56.7%) | 160 (36.4%) |
| 5 Years | 17 (25.8%) | 17 (20.0%) |
| 6 to 11 Years | 470 (49.6%) | 458 (57.5%) |
| 12 to 14 Years | 229 (52.3%) | 242 (53.8%) |
| 15 Years | 18 (34.0%) | 52 (49.1%) |
| 16 and 17 Years | 180 (63.2%) | 75 (35.5%) |
| 18 to 24 Years | 428 (51.4%) | 494 (64.5%) |
| 25 to 34 Years | 734 (86.0%) | 633 (57.6%) |
| 35 to 44 Years | 600 (80.9%) | 584 (57.0%) |
| 45 to 54 Years | 564 (70.9%) | 699 (61.8%) |
| 55 to 64 Years | 453 (74.0%) | 679 (66.3%) |
| 65 to 74 Years | 396 (76.7%) | 383 (53.8%) |
| 75 Years and over | 178 (67.9%) | 351 (57.0%) |
| Total | 4,535 (65.9%) | 4,827 (57.1%) |
Income Below Poverty Among Married-Couple Families in Opelousas
The poverty statistics for married-couple families in Opelousas show that 8.5% or 108 of the total 1,266 families live below the poverty line. Families with 3 or 4 children have the highest poverty rate of 30.7%, comprising of 59 families. On the other hand, families with 1 or 2 children have the lowest poverty rate of 2.1%, which includes 9 families.
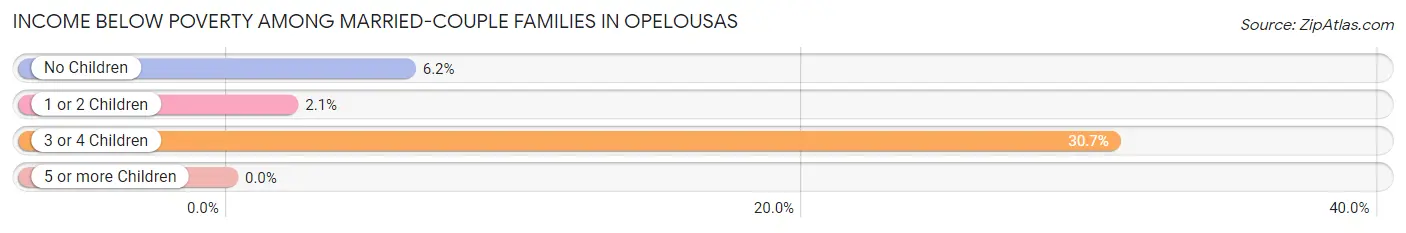
| Children | Above Poverty | Below Poverty |
| No Children | 606 (93.8%) | 40 (6.2%) |
| 1 or 2 Children | 419 (97.9%) | 9 (2.1%) |
| 3 or 4 Children | 133 (69.3%) | 59 (30.7%) |
| 5 or more Children | 0 (0.0%) | 0 (0.0%) |
| Total | 1,158 (91.5%) | 108 (8.5%) |
Income Below Poverty Among Single-Parent Households in Opelousas
According to the poverty data in Opelousas, 39.3% or 105 single-father households and 56.2% or 1,036 single-mother households are living below the poverty line. Among single-father households, those with 1 or 2 children have the highest poverty rate, with 69 households (100.0%) experiencing poverty. Likewise, among single-mother households, those with 5 or more children have the highest poverty rate, with 20 households (100.0%) falling below the poverty line.
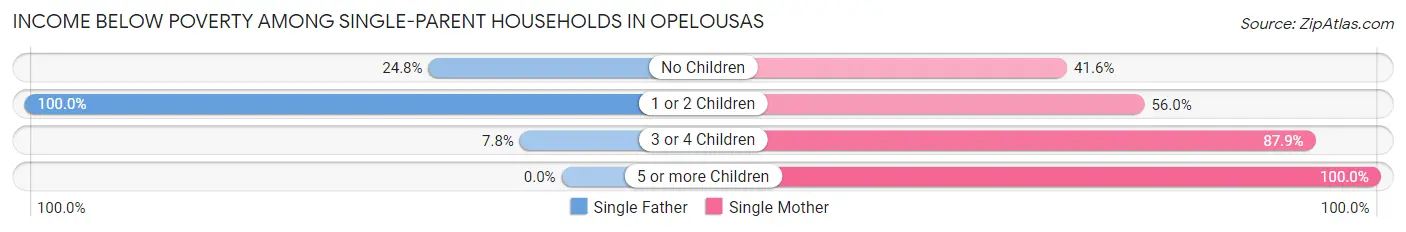
| Children | Single Father | Single Mother |
| No Children | 30 (24.8%) | 266 (41.6%) |
| 1 or 2 Children | 69 (100.0%) | 511 (56.0%) |
| 3 or 4 Children | 6 (7.8%) | 239 (87.9%) |
| 5 or more Children | 0 (0.0%) | 20 (100.0%) |
| Total | 105 (39.3%) | 1,036 (56.2%) |
Income Below Poverty Among Married-Couple vs Single-Parent Households in Opelousas
The poverty data for Opelousas shows that 108 of the married-couple family households (8.5%) and 1,141 of the single-parent households (54.1%) are living below the poverty level. Within the married-couple family households, those with 3 or 4 children have the highest poverty rate, with 59 households (30.7%) falling below the poverty line. Among the single-parent households, those with 5 or more children have the highest poverty rate, with 20 household (100.0%) living below poverty.
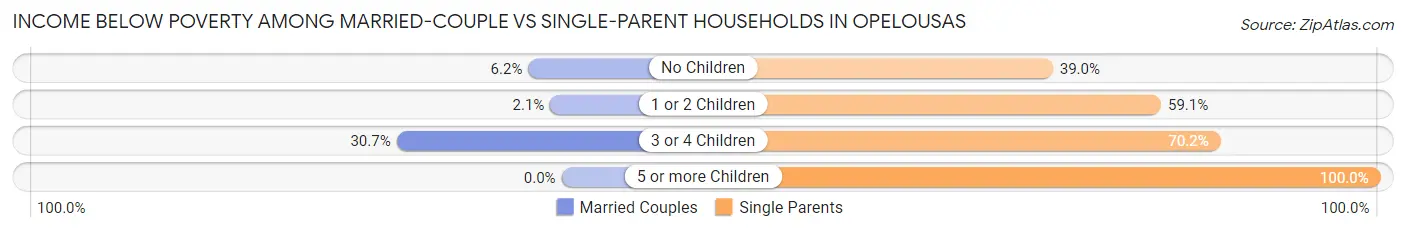
| Children | Married-Couple Families | Single-Parent Households |
| No Children | 40 (6.2%) | 296 (39.0%) |
| 1 or 2 Children | 9 (2.1%) | 580 (59.1%) |
| 3 or 4 Children | 59 (30.7%) | 245 (70.2%) |
| 5 or more Children | 0 (0.0%) | 20 (100.0%) |
| Total | 108 (8.5%) | 1,141 (54.1%) |
Race in Opelousas
The most populous races in Opelousas are Black / African American (12,590 | 79.6%), White / Caucasian (2,770 | 17.5%), and Two or more Races (349 | 2.2%).
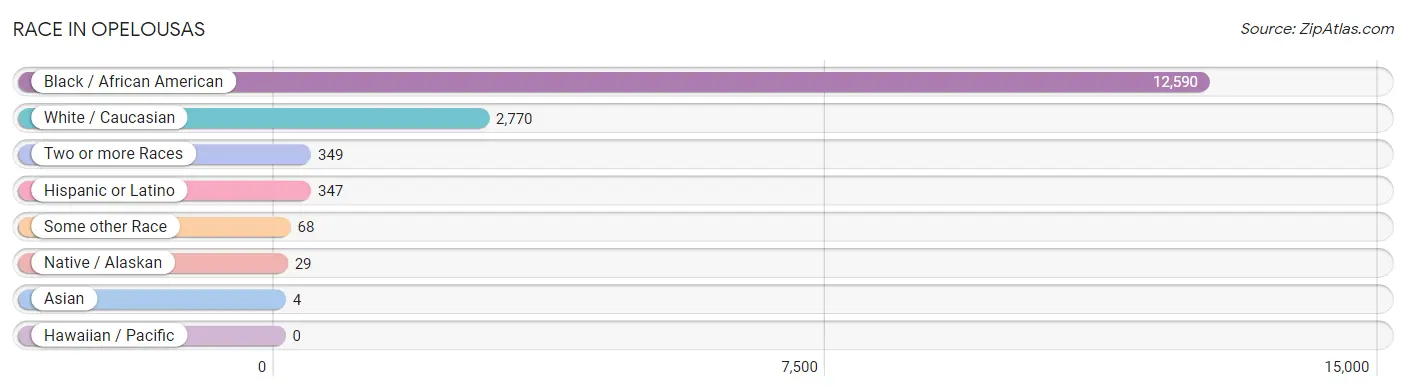
| Race | # Population | % Population |
| Asian | 4 | 0.0% |
| Black / African American | 12,590 | 79.6% |
| Hawaiian / Pacific | 0 | 0.0% |
| Hispanic or Latino | 347 | 2.2% |
| Native / Alaskan | 29 | 0.2% |
| White / Caucasian | 2,770 | 17.5% |
| Two or more Races | 349 | 2.2% |
| Some other Race | 68 | 0.4% |
| Total | 15,810 | 100.0% |
Ancestry in Opelousas
The most populous ancestries reported in Opelousas are French Canadian (765 | 4.8%), French (736 | 4.7%), American (458 | 2.9%), English (234 | 1.5%), and Italian (225 | 1.4%), together accounting for 15.3% of all Opelousas residents.
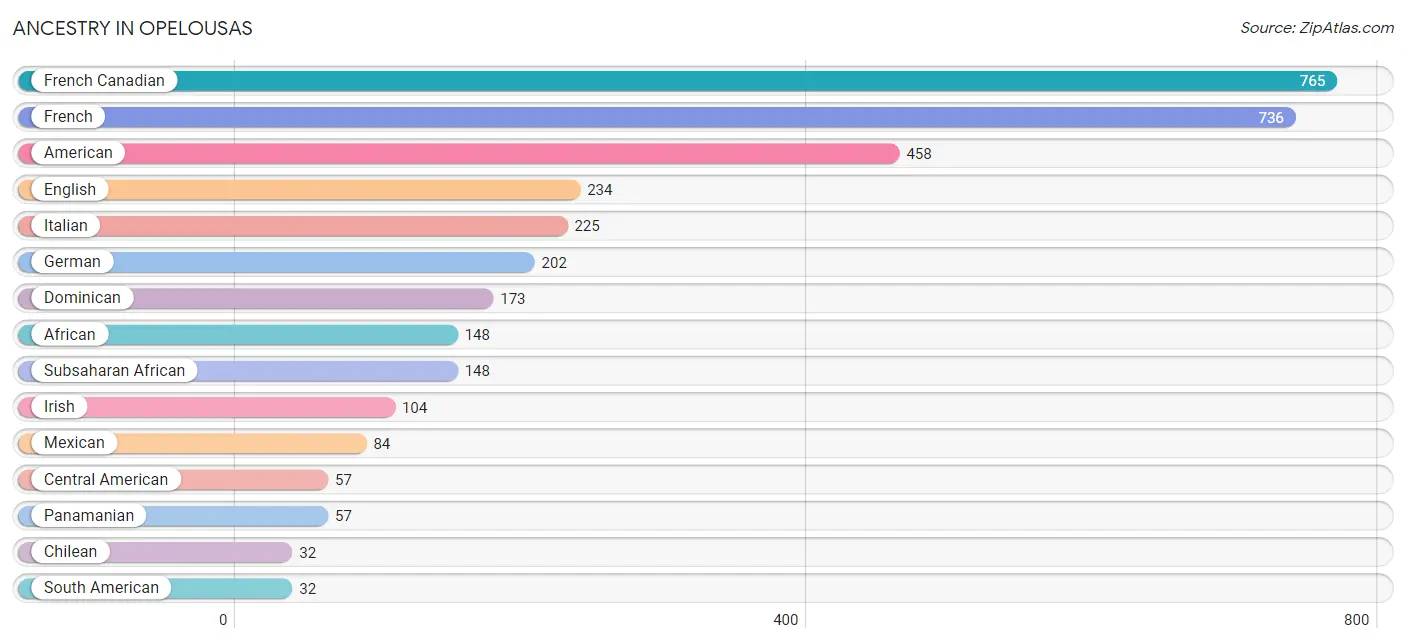
| Ancestry | # Population | % Population |
| African | 148 | 0.9% |
| American | 458 | 2.9% |
| Cajun | 25 | 0.2% |
| Central American | 57 | 0.4% |
| Cherokee | 22 | 0.1% |
| Chilean | 32 | 0.2% |
| Dominican | 173 | 1.1% |
| English | 234 | 1.5% |
| French | 736 | 4.7% |
| French Canadian | 765 | 4.8% |
| German | 202 | 1.3% |
| Haitian | 28 | 0.2% |
| Indian (Asian) | 24 | 0.2% |
| Irish | 104 | 0.7% |
| Italian | 225 | 1.4% |
| Mexican | 84 | 0.5% |
| Native Hawaiian | 11 | 0.1% |
| Panamanian | 57 | 0.4% |
| Portuguese | 26 | 0.2% |
| Russian | 17 | 0.1% |
| Scottish | 24 | 0.2% |
| South American | 32 | 0.2% |
| Spanish | 1 | 0.0% |
| Subsaharan African | 148 | 0.9% |
| Swiss | 6 | 0.0% |
| Thai | 4 | 0.0% |
| Ukrainian | 17 | 0.1% | View All 27 Rows |
Immigrants in Opelousas
The most numerous immigrant groups reported in Opelousas came from Central America (59 | 0.4%), Latin America (59 | 0.4%), Mexico (59 | 0.4%), Europe (22 | 0.1%), and Ireland (13 | 0.1%), together accounting for 1.3% of all Opelousas residents.
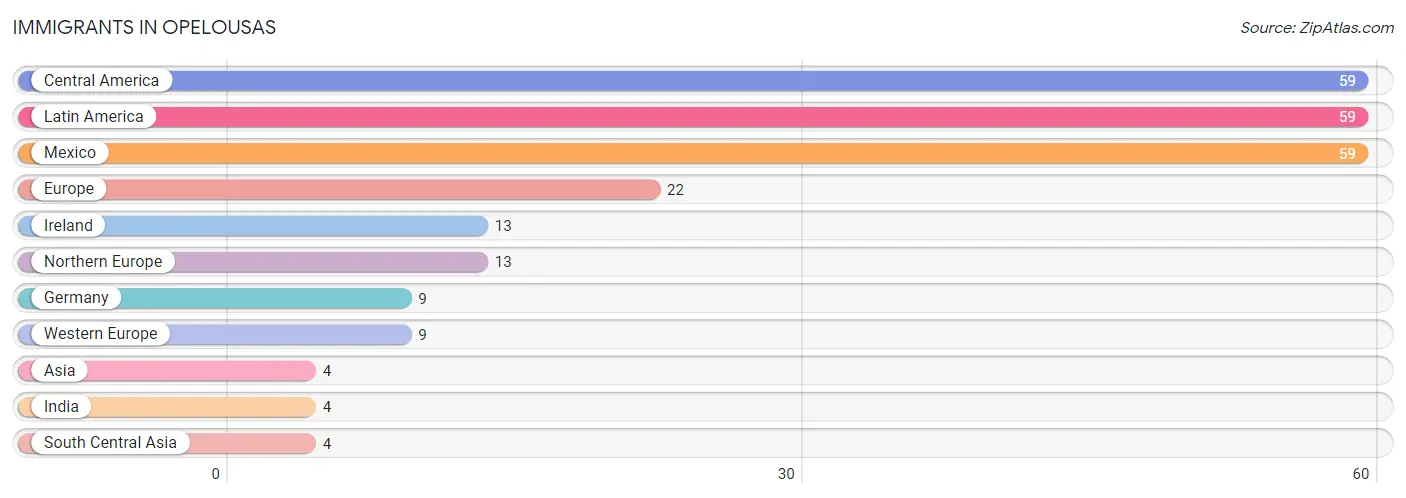
| Immigration Origin | # Population | % Population |
| Asia | 4 | 0.0% |
| Central America | 59 | 0.4% |
| Europe | 22 | 0.1% |
| Germany | 9 | 0.1% |
| India | 4 | 0.0% |
| Ireland | 13 | 0.1% |
| Latin America | 59 | 0.4% |
| Mexico | 59 | 0.4% |
| Northern Europe | 13 | 0.1% |
| South Central Asia | 4 | 0.0% |
| Western Europe | 9 | 0.1% | View All 11 Rows |
Sex and Age in Opelousas
Sex and Age in Opelousas
The most populous age groups in Opelousas are 5 to 9 Years (842 | 11.6%) for men and 10 to 14 Years (689 | 8.1%) for women.
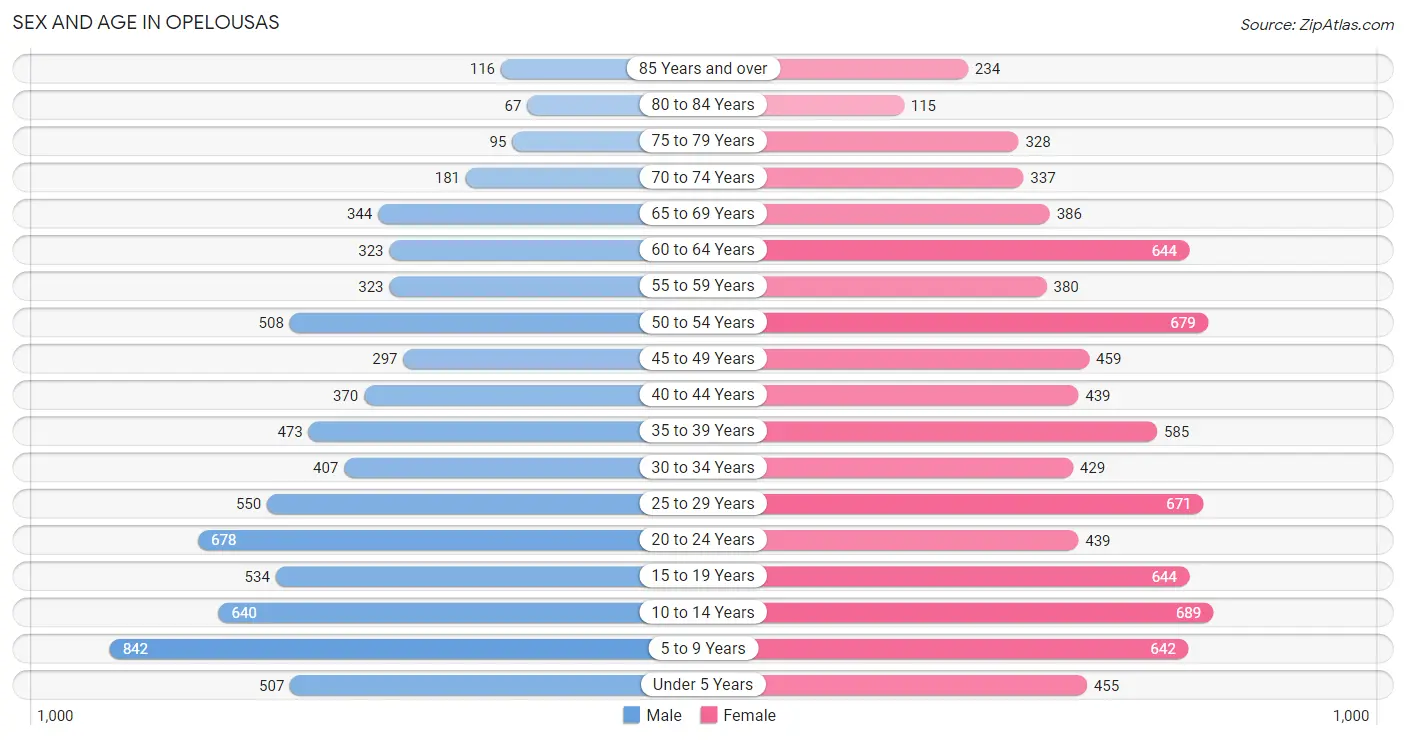
| Age Bracket | Male | Female |
| Under 5 Years | 507 (7.0%) | 455 (5.3%) |
| 5 to 9 Years | 842 (11.6%) | 642 (7.5%) |
| 10 to 14 Years | 640 (8.8%) | 689 (8.1%) |
| 15 to 19 Years | 534 (7.4%) | 644 (7.5%) |
| 20 to 24 Years | 678 (9.3%) | 439 (5.1%) |
| 25 to 29 Years | 550 (7.6%) | 671 (7.8%) |
| 30 to 34 Years | 407 (5.6%) | 429 (5.0%) |
| 35 to 39 Years | 473 (6.5%) | 585 (6.8%) |
| 40 to 44 Years | 370 (5.1%) | 439 (5.1%) |
| 45 to 49 Years | 297 (4.1%) | 459 (5.4%) |
| 50 to 54 Years | 508 (7.0%) | 679 (7.9%) |
| 55 to 59 Years | 323 (4.4%) | 380 (4.4%) |
| 60 to 64 Years | 323 (4.4%) | 644 (7.5%) |
| 65 to 69 Years | 344 (4.7%) | 386 (4.5%) |
| 70 to 74 Years | 181 (2.5%) | 337 (3.9%) |
| 75 to 79 Years | 95 (1.3%) | 328 (3.8%) |
| 80 to 84 Years | 67 (0.9%) | 115 (1.3%) |
| 85 Years and over | 116 (1.6%) | 234 (2.7%) |
| Total | 7,255 (100.0%) | 8,555 (100.0%) |
Families and Households in Opelousas
Median Family Size in Opelousas
The median family size in Opelousas is 3.62 persons per family, with married-couple families (1,266 | 37.5%) accounting for the largest median family size of 3.7 persons per family. On the other hand, single male/father families (267 | 7.9%) represent the smallest median family size with 3.46 persons per family.
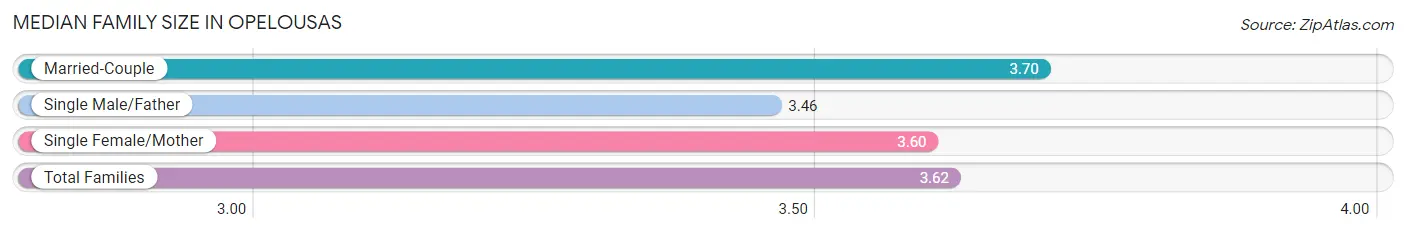
| Family Type | # Families | Family Size |
| Married-Couple | 1,266 (37.5%) | 3.70 |
| Single Male/Father | 267 (7.9%) | 3.46 |
| Single Female/Mother | 1,843 (54.6%) | 3.60 |
| Total Families | 3,376 (100.0%) | 3.62 |
Median Household Size in Opelousas
The median household size in Opelousas is 2.67 persons per household, with single male/father households (267 | 4.7%) accounting for the largest median household size of 3.82 persons per household. non-family households (2,345 | 41.0%) represent the smallest median household size with 1.18 persons per household.
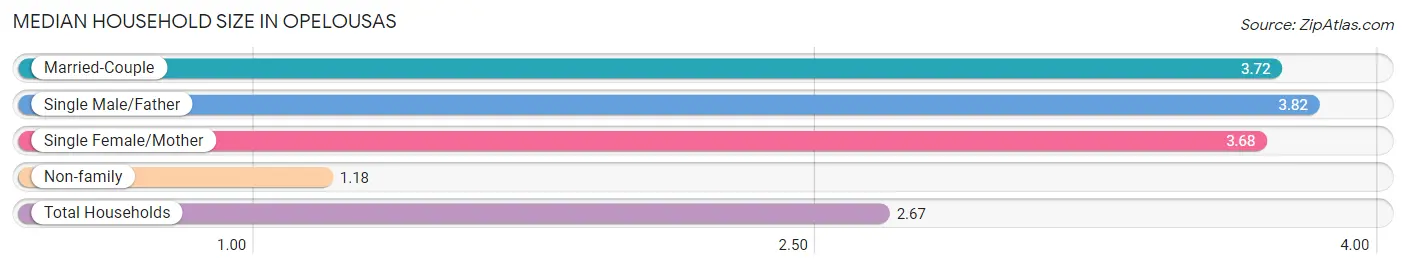
| Household Type | # Households | Household Size |
| Married-Couple | 1,266 (22.1%) | 3.72 |
| Single Male/Father | 267 (4.7%) | 3.82 |
| Single Female/Mother | 1,843 (32.2%) | 3.68 |
| Non-family | 2,345 (41.0%) | 1.18 |
| Total Households | 5,721 (100.0%) | 2.67 |
Household Size by Marriage Status in Opelousas
Out of a total of 5,721 households in Opelousas, 3,376 (59.0%) are family households, while 2,345 (41.0%) are nonfamily households. The most numerous type of family households are 2-person households, comprising 1,276, and the most common type of nonfamily households are 1-person households, comprising 2,128.
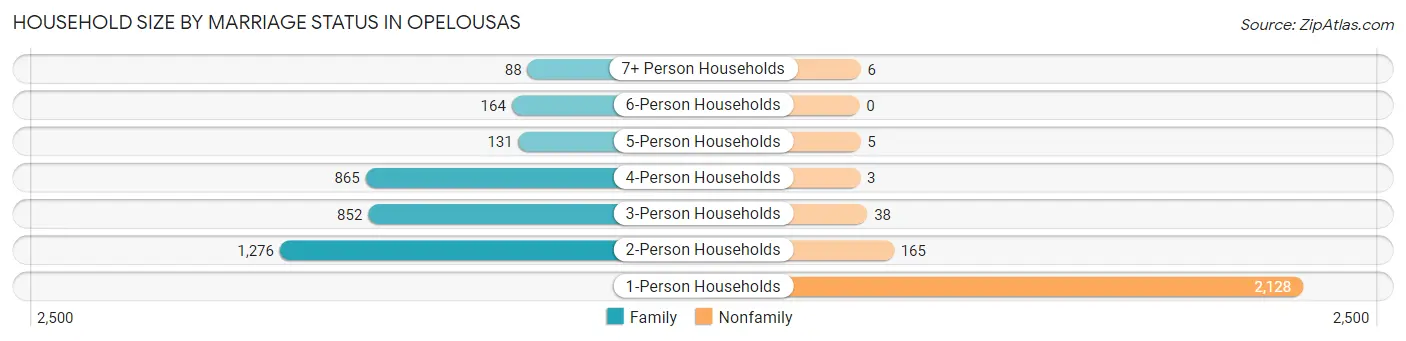
| Household Size | Family Households | Nonfamily Households |
| 1-Person Households | - | 2,128 (37.2%) |
| 2-Person Households | 1,276 (22.3%) | 165 (2.9%) |
| 3-Person Households | 852 (14.9%) | 38 (0.7%) |
| 4-Person Households | 865 (15.1%) | 3 (0.1%) |
| 5-Person Households | 131 (2.3%) | 5 (0.1%) |
| 6-Person Households | 164 (2.9%) | 0 (0.0%) |
| 7+ Person Households | 88 (1.5%) | 6 (0.1%) |
| Total | 3,376 (59.0%) | 2,345 (41.0%) |
Female Fertility in Opelousas
Fertility by Age in Opelousas
Average fertility rate in Opelousas is 38.0 births per 1,000 women. Women in the age bracket of 20 to 34 years have the highest fertility rate with 74.0 births per 1,000 women. Women in the age bracket of 20 to 34 years acount for 78.1% of all women with births.
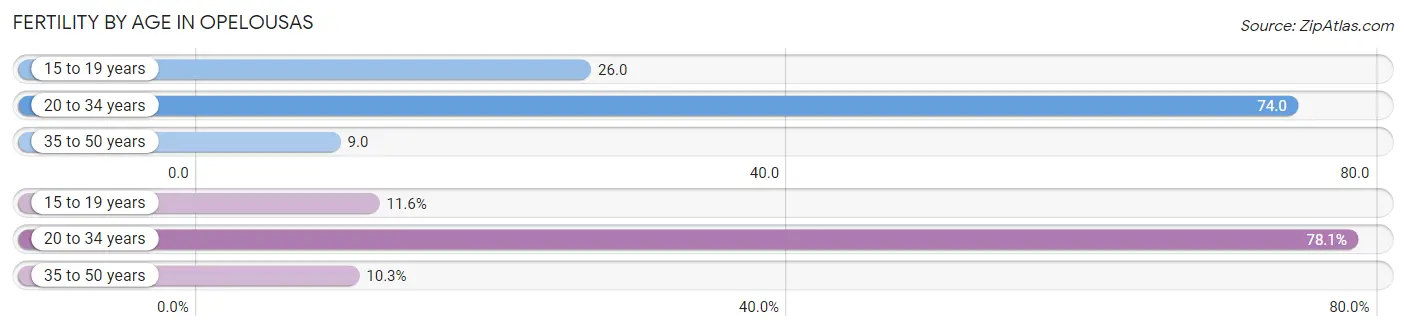
| Age Bracket | Women with Births | Births / 1,000 Women |
| 15 to 19 years | 17 (11.6%) | 26.0 |
| 20 to 34 years | 114 (78.1%) | 74.0 |
| 35 to 50 years | 15 (10.3%) | 9.0 |
| Total | 146 (100.0%) | 38.0 |
Fertility by Age by Marriage Status in Opelousas
9.6% of women with births (146) in Opelousas are married. The highest percentage of unmarried women with births falls into 15 to 19 years age bracket with 100.0% of them unmarried at the time of birth, while the lowest percentage of unmarried women with births belong to 20 to 34 years age bracket with 87.7% of them unmarried.
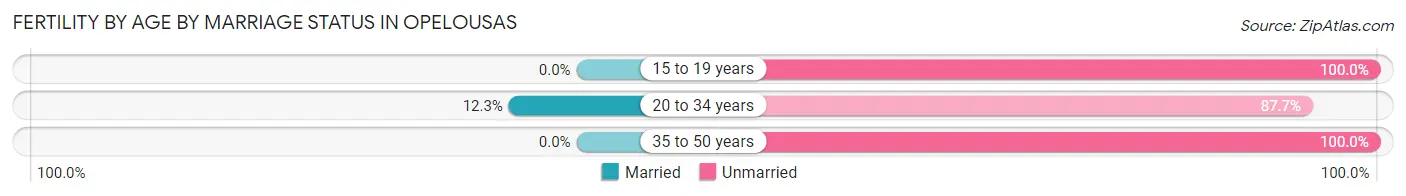
| Age Bracket | Married | Unmarried |
| 15 to 19 years | 0 (0.0%) | 17 (100.0%) |
| 20 to 34 years | 14 (12.3%) | 100 (87.7%) |
| 35 to 50 years | 0 (0.0%) | 15 (100.0%) |
| Total | 14 (9.6%) | 132 (90.4%) |
Fertility by Education in Opelousas
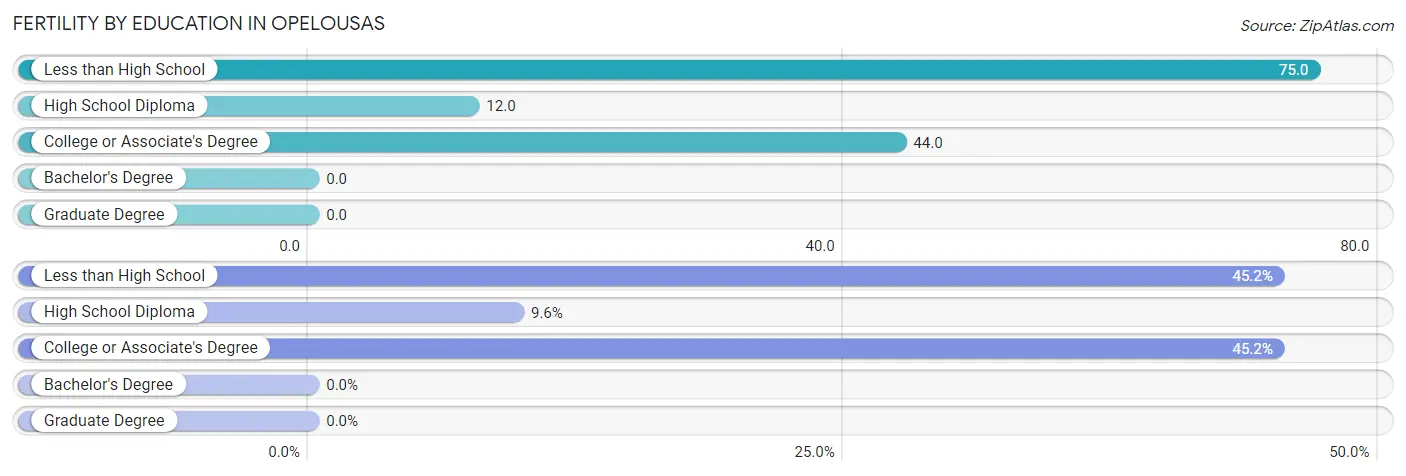
| Educational Attainment | Women with Births | Births / 1,000 Women |
| Less than High School | 66 (45.2%) | 75.0 |
| High School Diploma | 14 (9.6%) | 12.0 |
| College or Associate's Degree | 66 (45.2%) | 44.0 |
| Bachelor's Degree | 0 (0.0%) | 0.0 |
| Graduate Degree | 0 (0.0%) | 0.0 |
| Total | 146 (100.0%) | 38.0 |
Fertility by Education by Marriage Status in Opelousas
90.4% of women with births in Opelousas are unmarried. Women with the educational attainment of less than high school are most likely to be married with 12.1% of them married at childbirth, while women with the educational attainment of high school diploma are least likely to be married with 100.0% of them unmarried at childbirth.
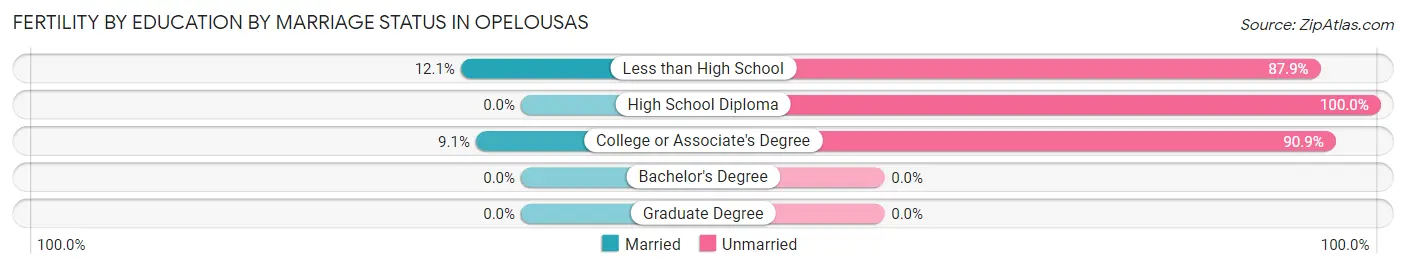
| Educational Attainment | Married | Unmarried |
| Less than High School | 8 (12.1%) | 58 (87.9%) |
| High School Diploma | 0 (0.0%) | 14 (100.0%) |
| College or Associate's Degree | 6 (9.1%) | 60 (90.9%) |
| Bachelor's Degree | 0 (0.0%) | 0 (0.0%) |
| Graduate Degree | 0 (0.0%) | 0 (0.0%) |
| Total | 14 (9.6%) | 132 (90.4%) |
Employment Characteristics in Opelousas
Employment by Class of Employer in Opelousas
Among the 5,200 employed individuals in Opelousas, private company employees (3,878 | 74.6%), self-employed (not incorporated) (346 | 6.7%), and not-for-profit organizations (332 | 6.4%) make up the most common classes of employment.
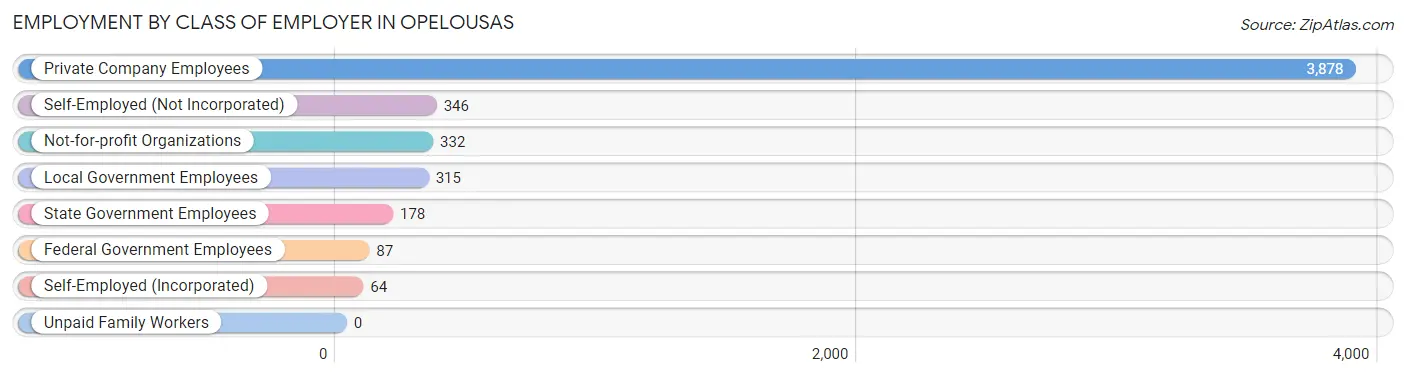
| Employer Class | # Employees | % Employees |
| Private Company Employees | 3,878 | 74.6% |
| Self-Employed (Incorporated) | 64 | 1.2% |
| Self-Employed (Not Incorporated) | 346 | 6.7% |
| Not-for-profit Organizations | 332 | 6.4% |
| Local Government Employees | 315 | 6.1% |
| State Government Employees | 178 | 3.4% |
| Federal Government Employees | 87 | 1.7% |
| Unpaid Family Workers | 0 | 0.0% |
| Total | 5,200 | 100.0% |
Employment Status by Age in Opelousas
According to the labor force statistics for Opelousas, out of the total population over 16 years of age (11,876), 49.9% or 5,926 individuals are in the labor force, with 11.0% or 652 of them unemployed. The age group with the highest labor force participation rate is 30 to 34 years, with 76.9% or 643 individuals in the labor force. Within the labor force, the 16 to 19 years age range has the highest percentage of unemployed individuals, with 22.1% or 47 of them being unemployed.
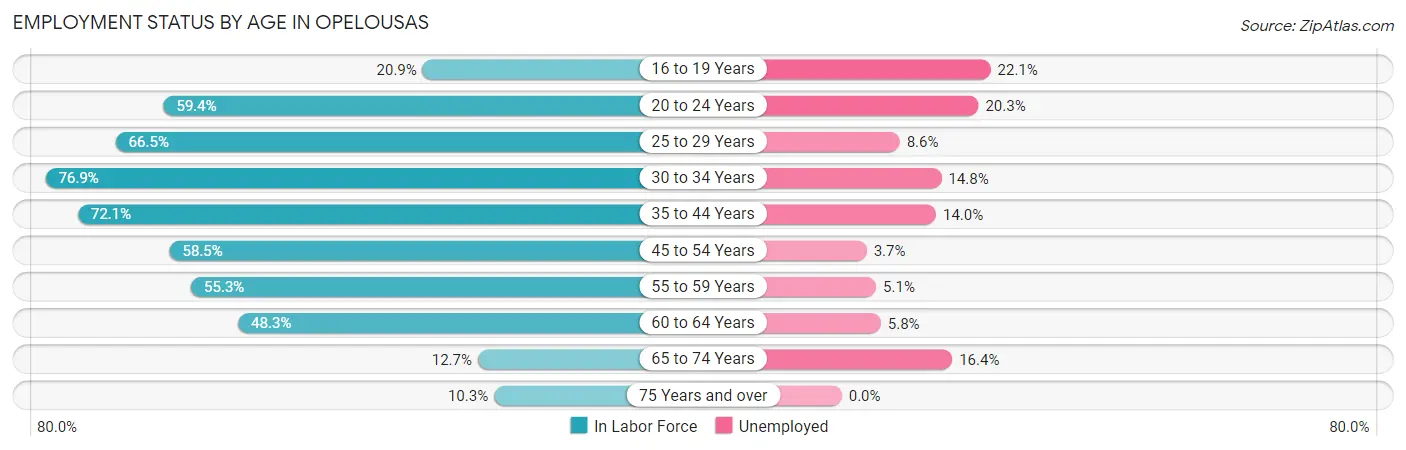
| Age Bracket | In Labor Force | Unemployed |
| 16 to 19 Years | 213 (20.9%) | 47 (22.1%) |
| 20 to 24 Years | 663 (59.4%) | 135 (20.3%) |
| 25 to 29 Years | 812 (66.5%) | 70 (8.6%) |
| 30 to 34 Years | 643 (76.9%) | 95 (14.8%) |
| 35 to 44 Years | 1,346 (72.1%) | 188 (14.0%) |
| 45 to 54 Years | 1,137 (58.5%) | 42 (3.7%) |
| 55 to 59 Years | 389 (55.3%) | 20 (5.1%) |
| 60 to 64 Years | 467 (48.3%) | 27 (5.8%) |
| 65 to 74 Years | 158 (12.7%) | 26 (16.4%) |
| 75 Years and over | 98 (10.3%) | 0 (0.0%) |
| Total | 5,926 (49.9%) | 652 (11.0%) |
Employment Status by Educational Attainment in Opelousas
According to labor force statistics for Opelousas, 63.6% of individuals (4,794) out of the total population between 25 and 64 years of age (7,537) are in the labor force, with 9.3% or 446 of them being unemployed. The group with the highest labor force participation rate are those with the educational attainment of bachelor's degree or higher, with 91.1% or 747 individuals in the labor force. Within the labor force, individuals with less than high school education have the highest percentage of unemployment, with 20.6% or 118 of them being unemployed.
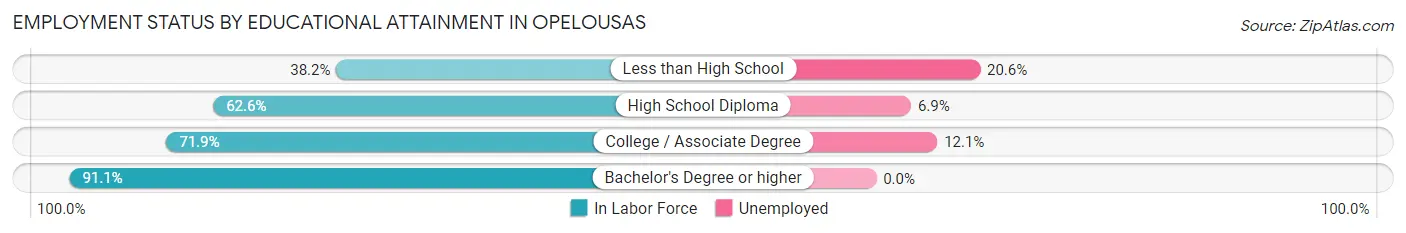
| Educational Attainment | In Labor Force | Unemployed |
| Less than High School | 573 (38.2%) | 309 (20.6%) |
| High School Diploma | 1,869 (62.6%) | 206 (6.9%) |
| College / Associate Degree | 1,605 (71.9%) | 270 (12.1%) |
| Bachelor's Degree or higher | 747 (91.1%) | 0 (0.0%) |
| Total | 4,794 (63.6%) | 701 (9.3%) |
Employment Occupations by Sex in Opelousas
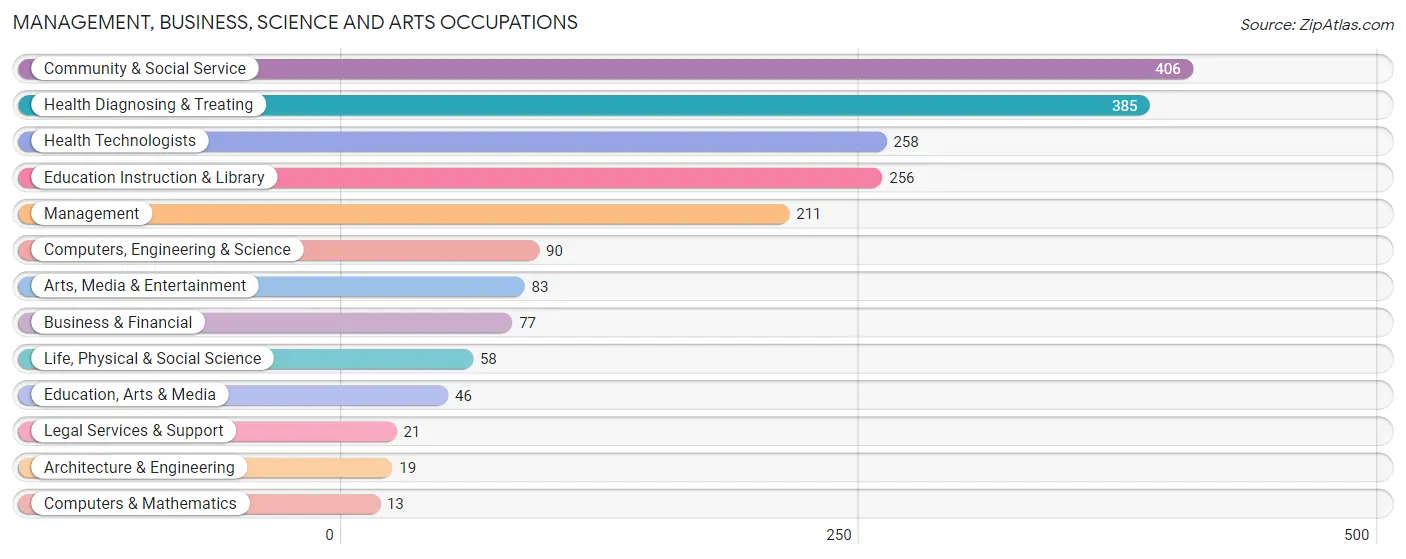
Management, Business, Science and Arts Occupations
The most common Management, Business, Science and Arts occupations in Opelousas are Community & Social Service (406 | 7.7%), Health Diagnosing & Treating (385 | 7.3%), Health Technologists (258 | 4.9%), Education Instruction & Library (256 | 4.9%), and Management (211 | 4.0%).
Management, Business, Science and Arts Occupations by Sex
Within the Management, Business, Science and Arts occupations in Opelousas, the most male-oriented occupations are Computers & Mathematics (100.0%), Architecture & Engineering (100.0%), and Legal Services & Support (100.0%), while the most female-oriented occupations are Education, Arts & Media (100.0%), Health Technologists (88.0%), and Health Diagnosing & Treating (84.7%).
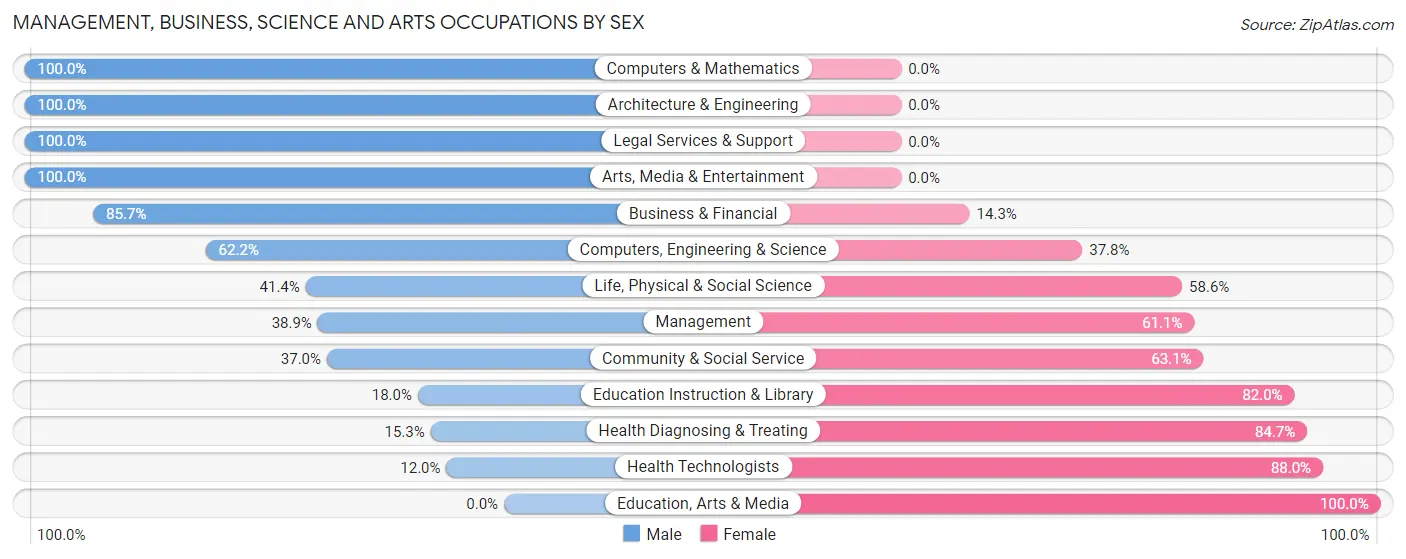
| Occupation | Male | Female |
| Management | 82 (38.9%) | 129 (61.1%) |
| Business & Financial | 66 (85.7%) | 11 (14.3%) |
| Computers, Engineering & Science | 56 (62.2%) | 34 (37.8%) |
| Computers & Mathematics | 13 (100.0%) | 0 (0.0%) |
| Architecture & Engineering | 19 (100.0%) | 0 (0.0%) |
| Life, Physical & Social Science | 24 (41.4%) | 34 (58.6%) |
| Community & Social Service | 150 (36.9%) | 256 (63.0%) |
| Education, Arts & Media | 0 (0.0%) | 46 (100.0%) |
| Legal Services & Support | 21 (100.0%) | 0 (0.0%) |
| Education Instruction & Library | 46 (18.0%) | 210 (82.0%) |
| Arts, Media & Entertainment | 83 (100.0%) | 0 (0.0%) |
| Health Diagnosing & Treating | 59 (15.3%) | 326 (84.7%) |
| Health Technologists | 31 (12.0%) | 227 (88.0%) |
| Total (Category) | 413 (35.3%) | 756 (64.7%) |
| Total (Overall) | 2,386 (45.4%) | 2,865 (54.6%) |
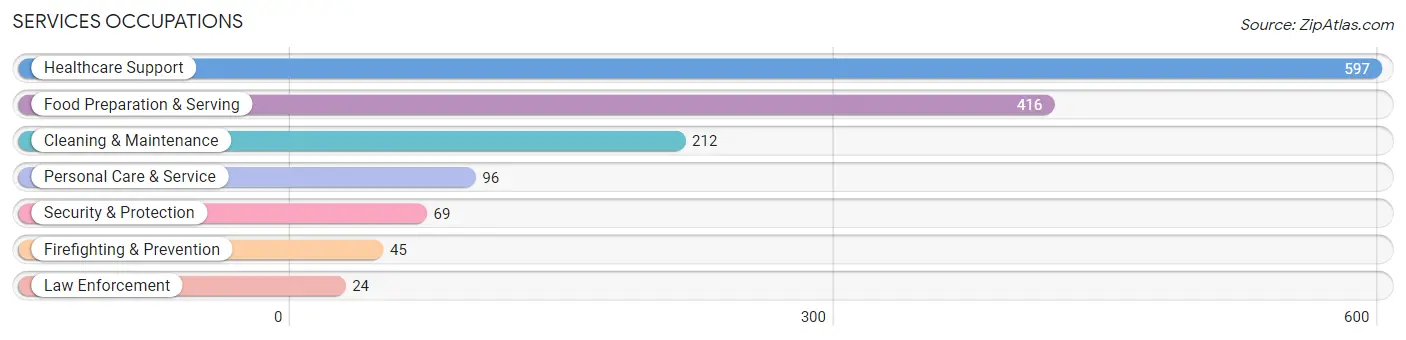
Services Occupations
The most common Services occupations in Opelousas are Healthcare Support (597 | 11.4%), Food Preparation & Serving (416 | 7.9%), Cleaning & Maintenance (212 | 4.0%), Personal Care & Service (96 | 1.8%), and Security & Protection (69 | 1.3%).
Services Occupations by Sex
Within the Services occupations in Opelousas, the most male-oriented occupations are Firefighting & Prevention (100.0%), Security & Protection (76.8%), and Cleaning & Maintenance (48.6%), while the most female-oriented occupations are Healthcare Support (96.7%), Personal Care & Service (74.0%), and Food Preparation & Serving (70.0%).
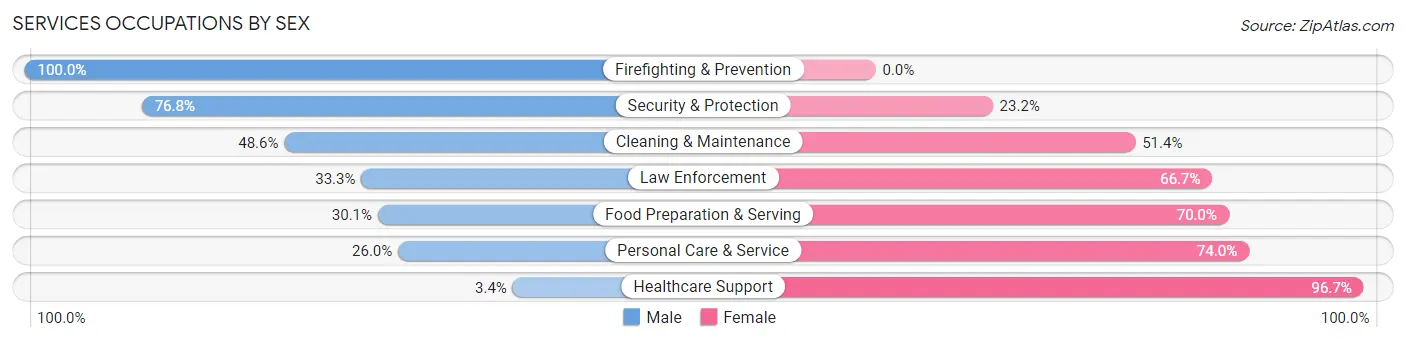
| Occupation | Male | Female |
| Healthcare Support | 20 (3.4%) | 577 (96.7%) |
| Security & Protection | 53 (76.8%) | 16 (23.2%) |
| Firefighting & Prevention | 45 (100.0%) | 0 (0.0%) |
| Law Enforcement | 8 (33.3%) | 16 (66.7%) |
| Food Preparation & Serving | 125 (30.0%) | 291 (70.0%) |
| Cleaning & Maintenance | 103 (48.6%) | 109 (51.4%) |
| Personal Care & Service | 25 (26.0%) | 71 (74.0%) |
| Total (Category) | 326 (23.4%) | 1,064 (76.5%) |
| Total (Overall) | 2,386 (45.4%) | 2,865 (54.6%) |
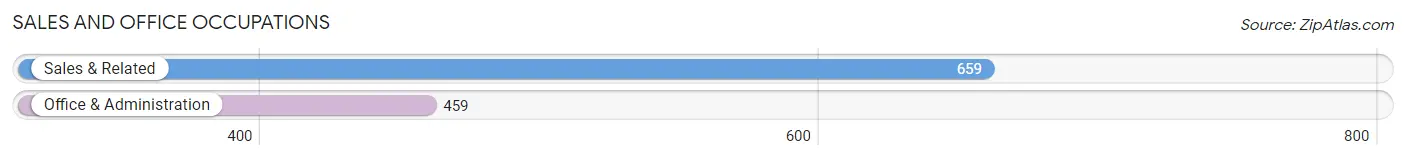
Sales and Office Occupations
The most common Sales and Office occupations in Opelousas are Sales & Related (659 | 12.6%), and Office & Administration (459 | 8.7%).
Sales and Office Occupations by Sex
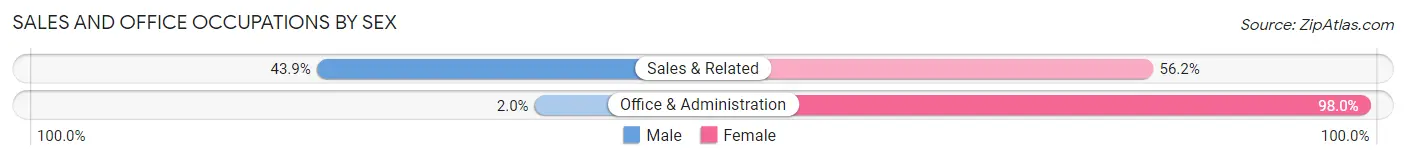
| Occupation | Male | Female |
| Sales & Related | 289 (43.9%) | 370 (56.1%) |
| Office & Administration | 9 (2.0%) | 450 (98.0%) |
| Total (Category) | 298 (26.7%) | 820 (73.4%) |
| Total (Overall) | 2,386 (45.4%) | 2,865 (54.6%) |
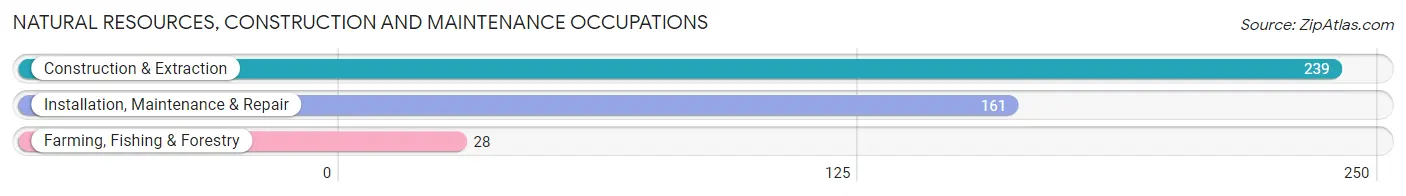
Natural Resources, Construction and Maintenance Occupations
The most common Natural Resources, Construction and Maintenance occupations in Opelousas are Construction & Extraction (239 | 4.5%), Installation, Maintenance & Repair (161 | 3.1%), and Farming, Fishing & Forestry (28 | 0.5%).
Natural Resources, Construction and Maintenance Occupations by Sex
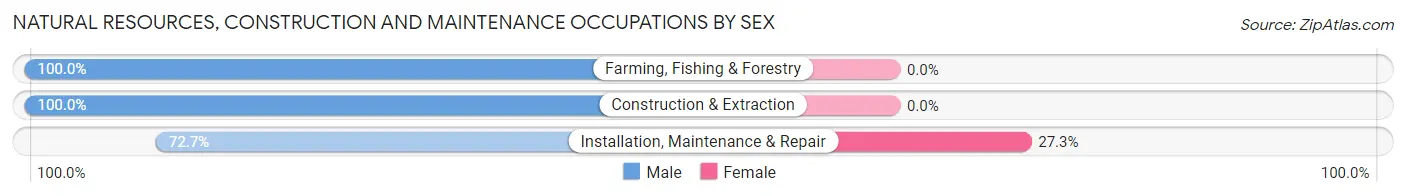
| Occupation | Male | Female |
| Farming, Fishing & Forestry | 28 (100.0%) | 0 (0.0%) |
| Construction & Extraction | 239 (100.0%) | 0 (0.0%) |
| Installation, Maintenance & Repair | 117 (72.7%) | 44 (27.3%) |
| Total (Category) | 384 (89.7%) | 44 (10.3%) |
| Total (Overall) | 2,386 (45.4%) | 2,865 (54.6%) |
Production, Transportation and Moving Occupations
The most common Production, Transportation and Moving occupations in Opelousas are Production (449 | 8.6%), Material Moving (363 | 6.9%), and Transportation (334 | 6.4%).
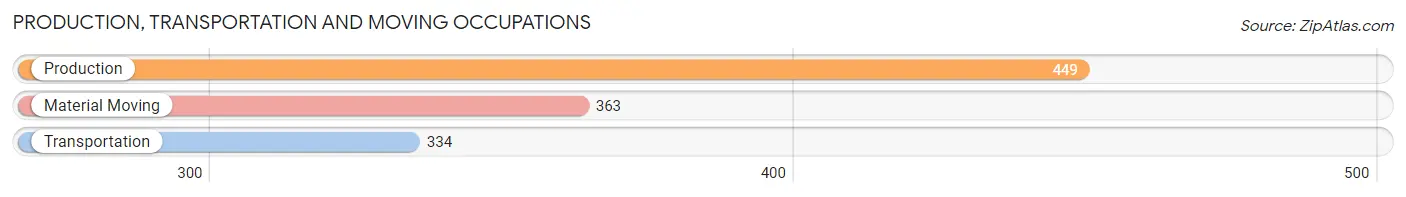
Production, Transportation and Moving Occupations by Sex
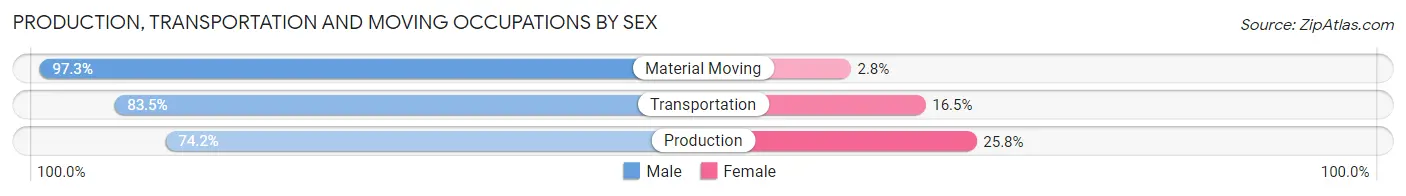
| Occupation | Male | Female |
| Production | 333 (74.2%) | 116 (25.8%) |
| Transportation | 279 (83.5%) | 55 (16.5%) |
| Material Moving | 353 (97.3%) | 10 (2.8%) |
| Total (Category) | 965 (84.2%) | 181 (15.8%) |
| Total (Overall) | 2,386 (45.4%) | 2,865 (54.6%) |
Employment Industries by Sex in Opelousas
Employment Industries in Opelousas
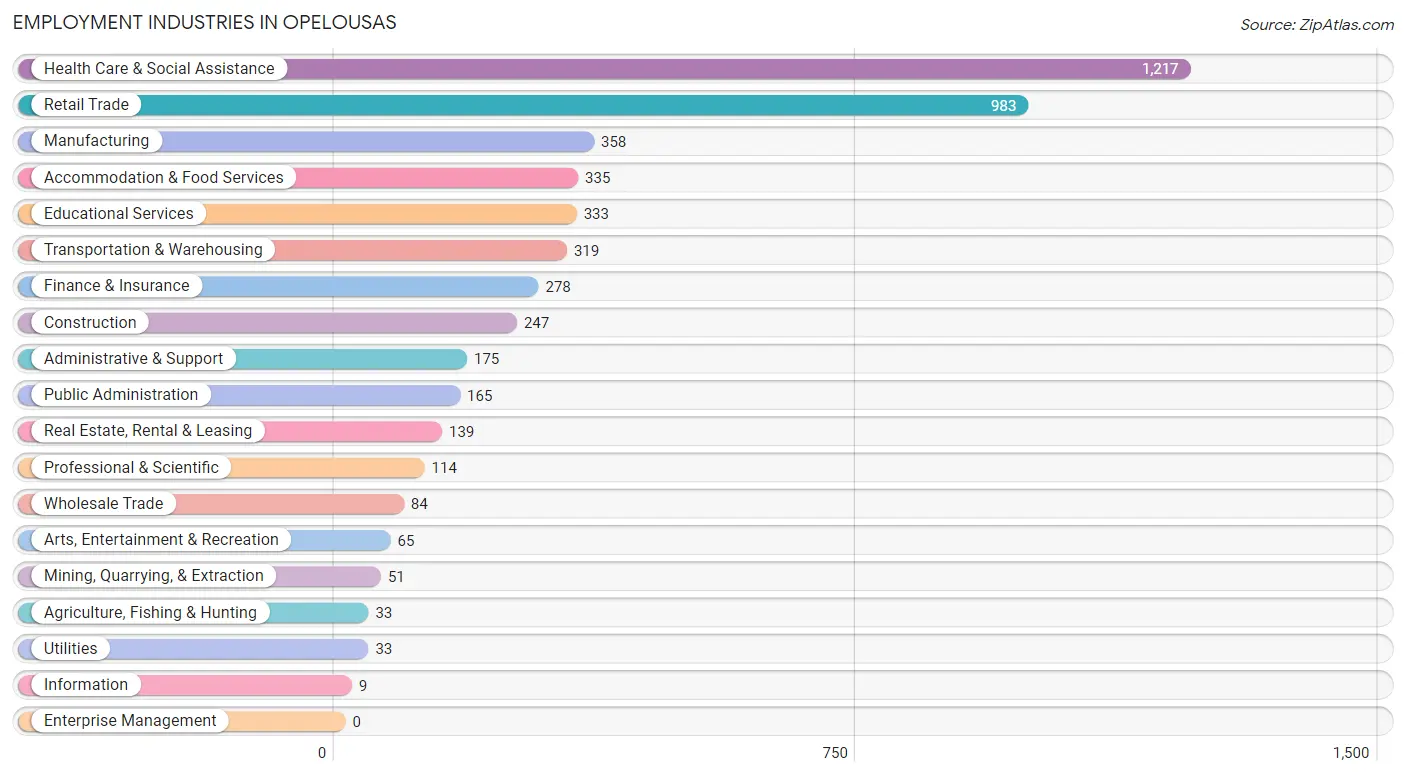
The major employment industries in Opelousas include Health Care & Social Assistance (1,217 | 23.2%), Retail Trade (983 | 18.7%), Manufacturing (358 | 6.8%), Accommodation & Food Services (335 | 6.4%), and Educational Services (333 | 6.3%).
Employment Industries by Sex in Opelousas
The Opelousas industries that see more men than women are Agriculture, Fishing & Hunting (100.0%), Mining, Quarrying, & Extraction (100.0%), and Construction (100.0%), whereas the industries that tend to have a higher number of women are Information (100.0%), Health Care & Social Assistance (95.1%), and Finance & Insurance (83.1%).
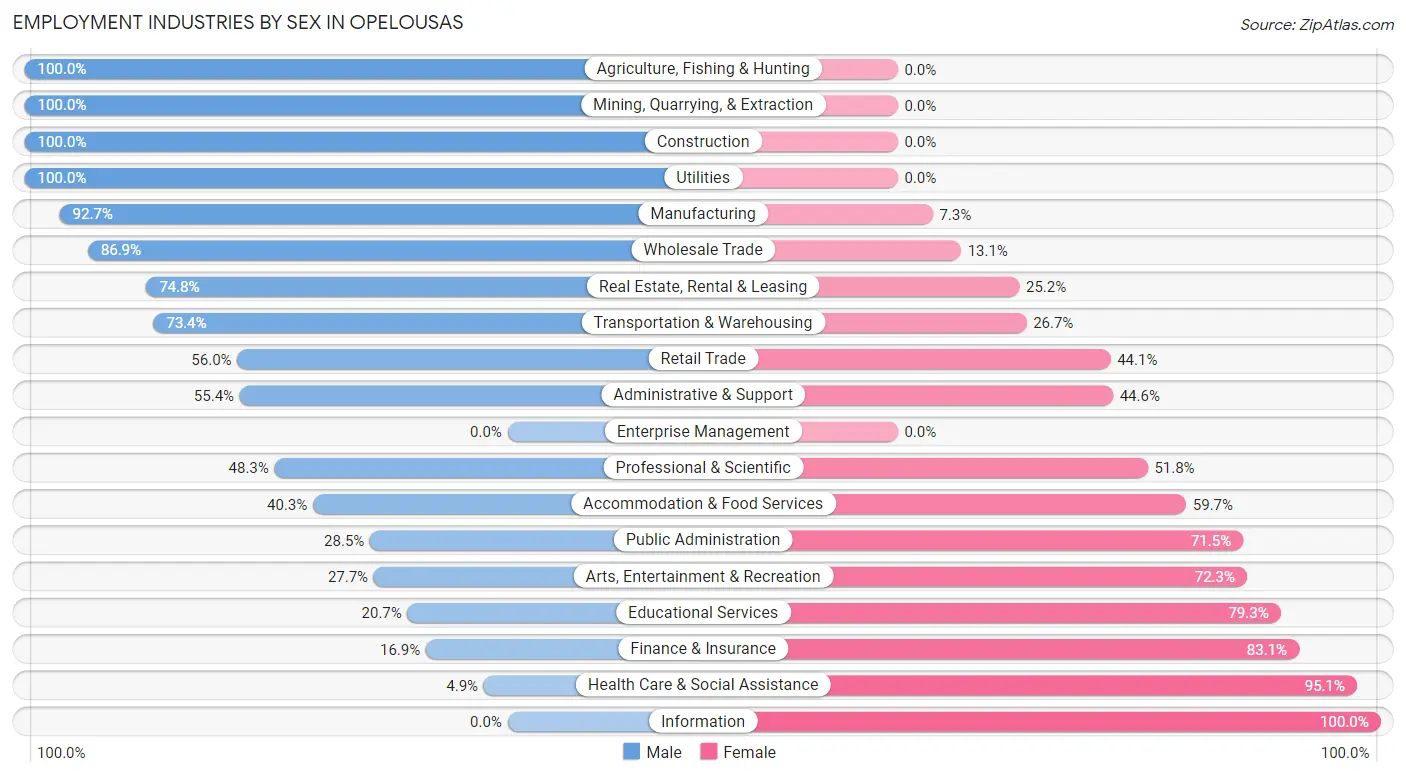
| Industry | Male | Female |
| Agriculture, Fishing & Hunting | 33 (100.0%) | 0 (0.0%) |
| Mining, Quarrying, & Extraction | 51 (100.0%) | 0 (0.0%) |
| Construction | 247 (100.0%) | 0 (0.0%) |
| Manufacturing | 332 (92.7%) | 26 (7.3%) |
| Wholesale Trade | 73 (86.9%) | 11 (13.1%) |
| Retail Trade | 550 (55.9%) | 433 (44.1%) |
| Transportation & Warehousing | 234 (73.4%) | 85 (26.7%) |
| Utilities | 33 (100.0%) | 0 (0.0%) |
| Information | 0 (0.0%) | 9 (100.0%) |
| Finance & Insurance | 47 (16.9%) | 231 (83.1%) |
| Real Estate, Rental & Leasing | 104 (74.8%) | 35 (25.2%) |
| Professional & Scientific | 55 (48.2%) | 59 (51.7%) |
| Enterprise Management | 0 (0.0%) | 0 (0.0%) |
| Administrative & Support | 97 (55.4%) | 78 (44.6%) |
| Educational Services | 69 (20.7%) | 264 (79.3%) |
| Health Care & Social Assistance | 60 (4.9%) | 1,157 (95.1%) |
| Arts, Entertainment & Recreation | 18 (27.7%) | 47 (72.3%) |
| Accommodation & Food Services | 135 (40.3%) | 200 (59.7%) |
| Public Administration | 47 (28.5%) | 118 (71.5%) |
| Total | 2,386 (45.4%) | 2,865 (54.6%) |
Education in Opelousas
School Enrollment in Opelousas
The most common levels of schooling among the 4,270 students in Opelousas are elementary school (1,319 | 30.9%), middle school (1,186 | 27.8%), and high school (796 | 18.6%).
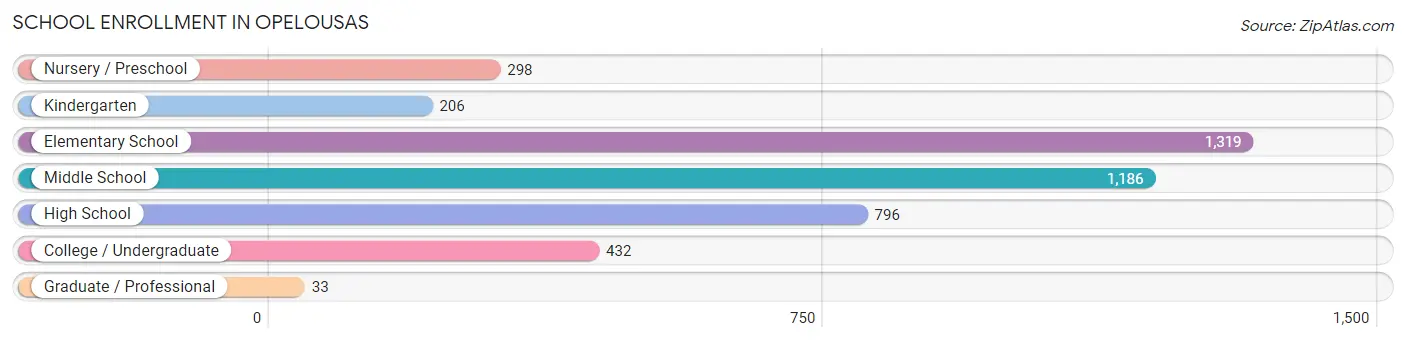
| School Level | # Students | % Students |
| Nursery / Preschool | 298 | 7.0% |
| Kindergarten | 206 | 4.8% |
| Elementary School | 1,319 | 30.9% |
| Middle School | 1,186 | 27.8% |
| High School | 796 | 18.6% |
| College / Undergraduate | 432 | 10.1% |
| Graduate / Professional | 33 | 0.8% |
| Total | 4,270 | 100.0% |
School Enrollment by Age by Funding Source in Opelousas
Out of a total of 4,270 students who are enrolled in schools in Opelousas, 470 (11.0%) attend a private institution, while the remaining 3,800 (89.0%) are enrolled in public schools. The age group of 35 years and over has the highest likelihood of being enrolled in private schools, with 39 (26.7% in the age bracket) enrolled. Conversely, the age group of 20 to 24 year olds has the lowest likelihood of being enrolled in a private school, with 231 (100.0% in the age bracket) attending a public institution.
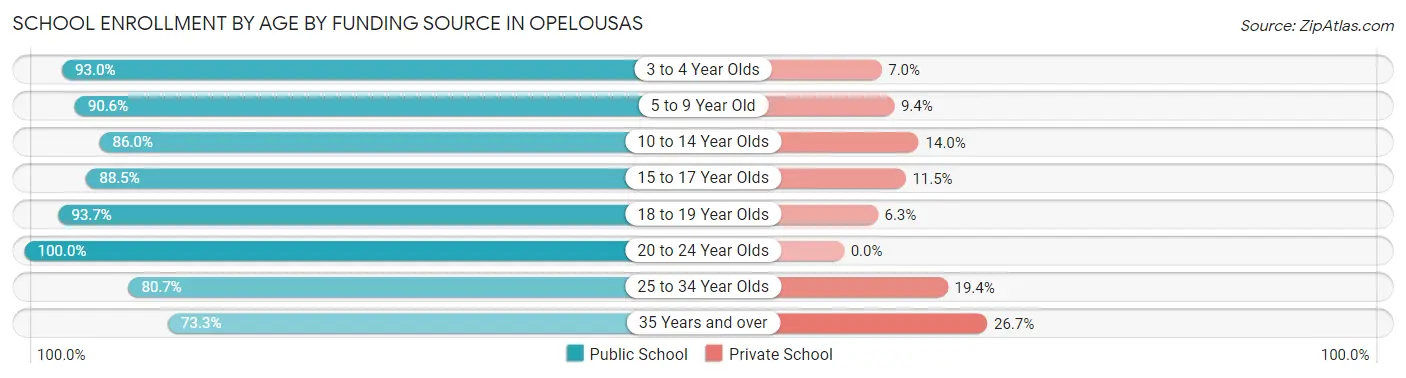
| Age Bracket | Public School | Private School |
| 3 to 4 Year Olds | 186 (93.0%) | 14 (7.0%) |
| 5 to 9 Year Old | 1,345 (90.6%) | 139 (9.4%) |
| 10 to 14 Year Olds | 1,103 (86.0%) | 179 (14.0%) |
| 15 to 17 Year Olds | 569 (88.5%) | 74 (11.5%) |
| 18 to 19 Year Olds | 208 (93.7%) | 14 (6.3%) |
| 20 to 24 Year Olds | 231 (100.0%) | 0 (0.0%) |
| 25 to 34 Year Olds | 50 (80.6%) | 12 (19.4%) |
| 35 Years and over | 107 (73.3%) | 39 (26.7%) |
| Total | 3,800 (89.0%) | 470 (11.0%) |
Educational Attainment by Field of Study in Opelousas
Education (387 | 29.2%), business (198 | 14.9%), science & technology (159 | 12.0%), communications (128 | 9.7%), and liberal arts & history (120 | 9.1%) are the most common fields of study among 1,324 individuals in Opelousas who have obtained a bachelor's degree or higher.
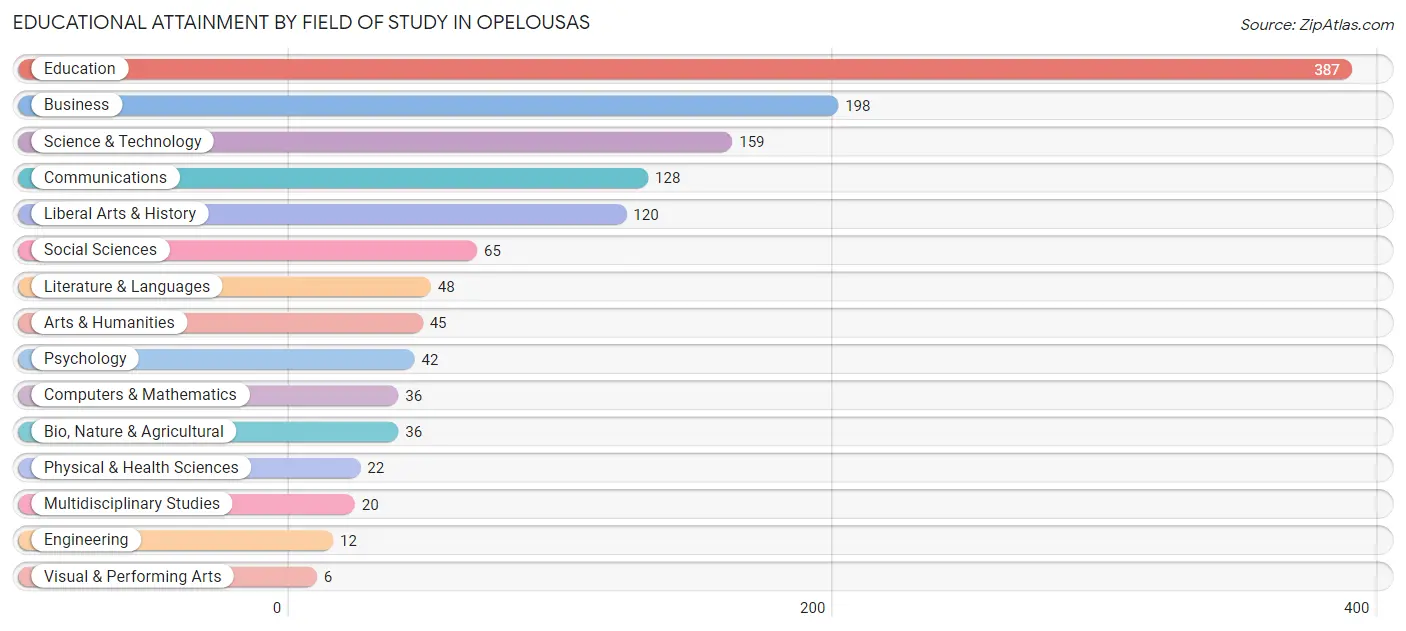
| Field of Study | # Graduates | % Graduates |
| Computers & Mathematics | 36 | 2.7% |
| Bio, Nature & Agricultural | 36 | 2.7% |
| Physical & Health Sciences | 22 | 1.7% |
| Psychology | 42 | 3.2% |
| Social Sciences | 65 | 4.9% |
| Engineering | 12 | 0.9% |
| Multidisciplinary Studies | 20 | 1.5% |
| Science & Technology | 159 | 12.0% |
| Business | 198 | 14.9% |
| Education | 387 | 29.2% |
| Literature & Languages | 48 | 3.6% |
| Liberal Arts & History | 120 | 9.1% |
| Visual & Performing Arts | 6 | 0.4% |
| Communications | 128 | 9.7% |
| Arts & Humanities | 45 | 3.4% |
| Total | 1,324 | 100.0% |
Transportation & Commute in Opelousas
Vehicle Availability by Sex in Opelousas
The most prevalent vehicle ownership categories in Opelousas are males with 2 vehicles (881, accounting for 37.4%) and females with 2 vehicles (1,050, making up 31.1%).
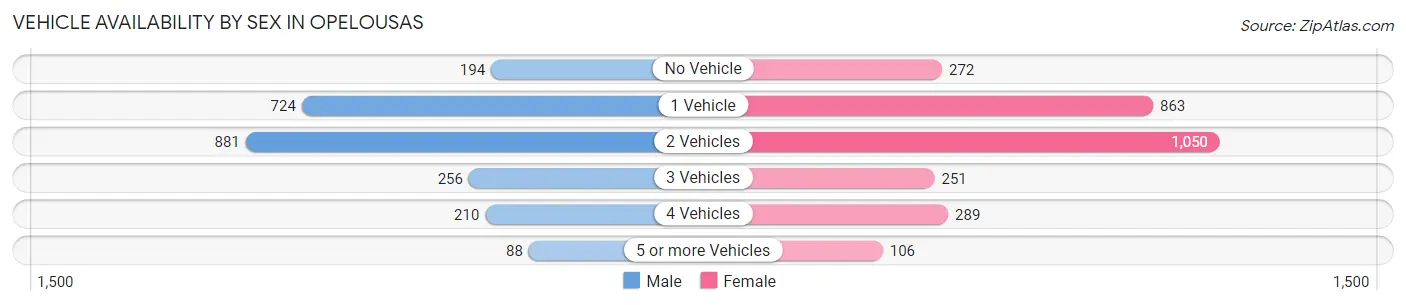
| Vehicles Available | Male | Female |
| No Vehicle | 194 (8.2%) | 272 (9.6%) |
| 1 Vehicle | 724 (30.8%) | 863 (30.5%) |
| 2 Vehicles | 881 (37.4%) | 1,050 (37.1%) |
| 3 Vehicles | 256 (10.9%) | 251 (8.9%) |
| 4 Vehicles | 210 (8.9%) | 289 (10.2%) |
| 5 or more Vehicles | 88 (3.7%) | 106 (3.7%) |
| Total | 2,353 (100.0%) | 2,831 (100.0%) |
Commute Time in Opelousas
The most frequently occuring commute durations in Opelousas are 5 to 9 minutes (1,225 commuters, 24.9%), 30 to 34 minutes (806 commuters, 16.4%), and 10 to 14 minutes (650 commuters, 13.2%).
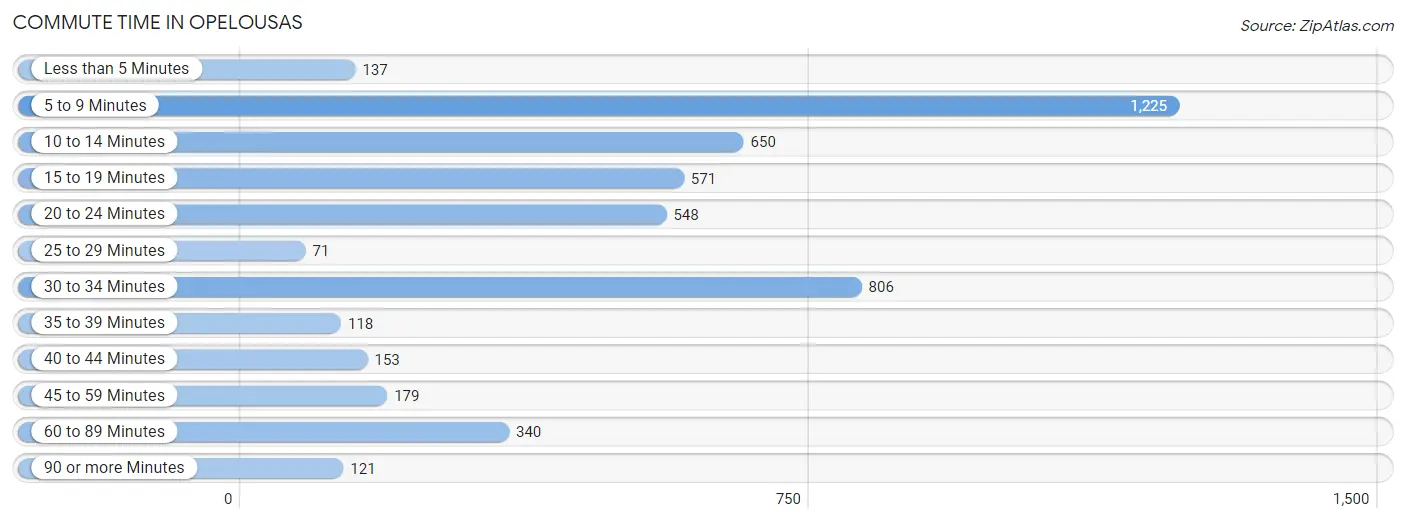
| Commute Time | # Commuters | % Commuters |
| Less than 5 Minutes | 137 | 2.8% |
| 5 to 9 Minutes | 1,225 | 24.9% |
| 10 to 14 Minutes | 650 | 13.2% |
| 15 to 19 Minutes | 571 | 11.6% |
| 20 to 24 Minutes | 548 | 11.1% |
| 25 to 29 Minutes | 71 | 1.4% |
| 30 to 34 Minutes | 806 | 16.4% |
| 35 to 39 Minutes | 118 | 2.4% |
| 40 to 44 Minutes | 153 | 3.1% |
| 45 to 59 Minutes | 179 | 3.6% |
| 60 to 89 Minutes | 340 | 6.9% |
| 90 or more Minutes | 121 | 2.5% |
Commute Time by Sex in Opelousas
The most common commute times in Opelousas are 30 to 34 minutes (464 commuters, 20.5%) for males and 5 to 9 minutes (834 commuters, 31.3%) for females.
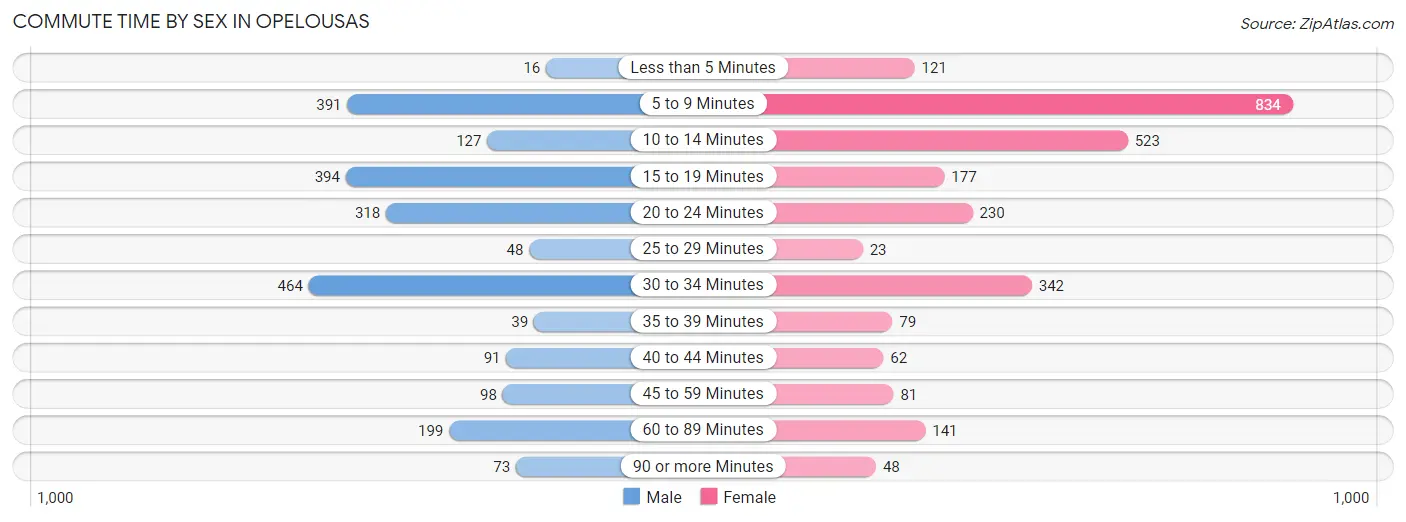
| Commute Time | Male | Female |
| Less than 5 Minutes | 16 (0.7%) | 121 (4.5%) |
| 5 to 9 Minutes | 391 (17.3%) | 834 (31.3%) |
| 10 to 14 Minutes | 127 (5.6%) | 523 (19.7%) |
| 15 to 19 Minutes | 394 (17.4%) | 177 (6.7%) |
| 20 to 24 Minutes | 318 (14.1%) | 230 (8.6%) |
| 25 to 29 Minutes | 48 (2.1%) | 23 (0.9%) |
| 30 to 34 Minutes | 464 (20.5%) | 342 (12.9%) |
| 35 to 39 Minutes | 39 (1.7%) | 79 (3.0%) |
| 40 to 44 Minutes | 91 (4.0%) | 62 (2.3%) |
| 45 to 59 Minutes | 98 (4.3%) | 81 (3.0%) |
| 60 to 89 Minutes | 199 (8.8%) | 141 (5.3%) |
| 90 or more Minutes | 73 (3.2%) | 48 (1.8%) |
Time of Departure to Work by Sex in Opelousas
The most frequent times of departure to work in Opelousas are 7:00 AM to 7:29 AM (550, 24.4%) for males and 7:00 AM to 7:29 AM (523, 19.7%) for females.
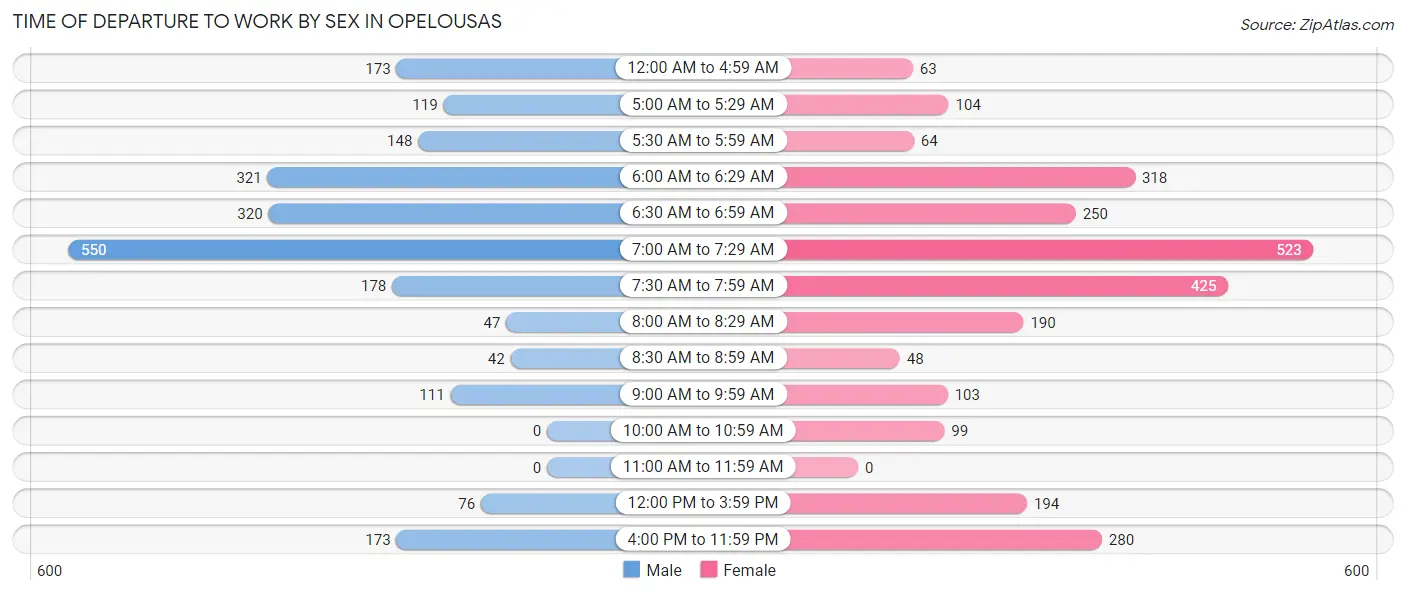
| Time of Departure | Male | Female |
| 12:00 AM to 4:59 AM | 173 (7.7%) | 63 (2.4%) |
| 5:00 AM to 5:29 AM | 119 (5.3%) | 104 (3.9%) |
| 5:30 AM to 5:59 AM | 148 (6.6%) | 64 (2.4%) |
| 6:00 AM to 6:29 AM | 321 (14.2%) | 318 (11.9%) |
| 6:30 AM to 6:59 AM | 320 (14.2%) | 250 (9.4%) |
| 7:00 AM to 7:29 AM | 550 (24.4%) | 523 (19.7%) |
| 7:30 AM to 7:59 AM | 178 (7.9%) | 425 (16.0%) |
| 8:00 AM to 8:29 AM | 47 (2.1%) | 190 (7.1%) |
| 8:30 AM to 8:59 AM | 42 (1.9%) | 48 (1.8%) |
| 9:00 AM to 9:59 AM | 111 (4.9%) | 103 (3.9%) |
| 10:00 AM to 10:59 AM | 0 (0.0%) | 99 (3.7%) |
| 11:00 AM to 11:59 AM | 0 (0.0%) | 0 (0.0%) |
| 12:00 PM to 3:59 PM | 76 (3.4%) | 194 (7.3%) |
| 4:00 PM to 11:59 PM | 173 (7.7%) | 280 (10.5%) |
| Total | 2,258 (100.0%) | 2,661 (100.0%) |
Housing Occupancy in Opelousas
Occupancy by Ownership in Opelousas
Of the total 5,721 dwellings in Opelousas, owner-occupied units account for 2,732 (47.7%), while renter-occupied units make up 2,989 (52.2%).
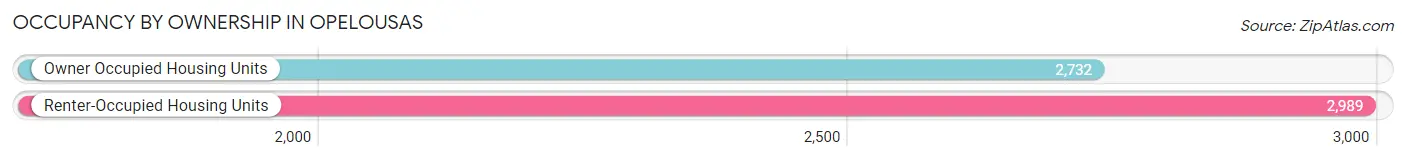
| Occupancy | # Housing Units | % Housing Units |
| Owner Occupied Housing Units | 2,732 | 47.7% |
| Renter-Occupied Housing Units | 2,989 | 52.2% |
| Total Occupied Housing Units | 5,721 | 100.0% |
Occupancy by Household Size in Opelousas
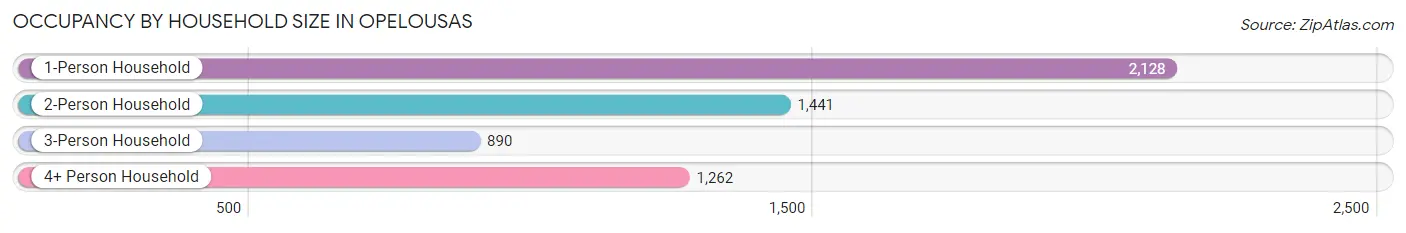
| Household Size | # Housing Units | % Housing Units |
| 1-Person Household | 2,128 | 37.2% |
| 2-Person Household | 1,441 | 25.2% |
| 3-Person Household | 890 | 15.6% |
| 4+ Person Household | 1,262 | 22.1% |
| Total Housing Units | 5,721 | 100.0% |
Occupancy by Ownership by Household Size in Opelousas
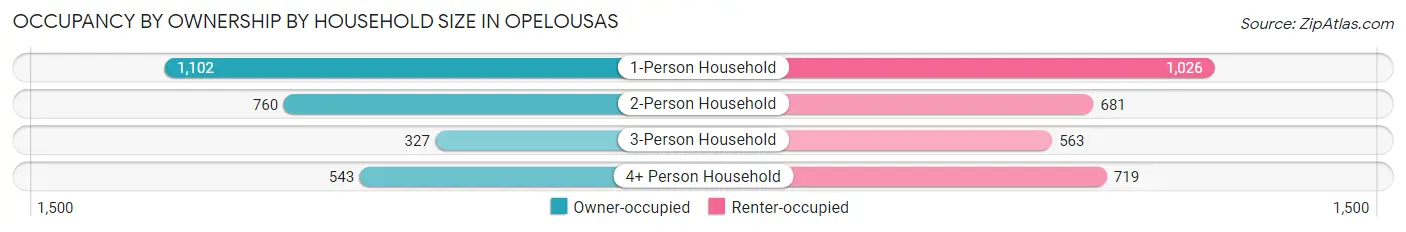
| Household Size | Owner-occupied | Renter-occupied |
| 1-Person Household | 1,102 (51.8%) | 1,026 (48.2%) |
| 2-Person Household | 760 (52.7%) | 681 (47.3%) |
| 3-Person Household | 327 (36.7%) | 563 (63.3%) |
| 4+ Person Household | 543 (43.0%) | 719 (57.0%) |
| Total Housing Units | 2,732 (47.7%) | 2,989 (52.2%) |
Occupancy by Educational Attainment in Opelousas
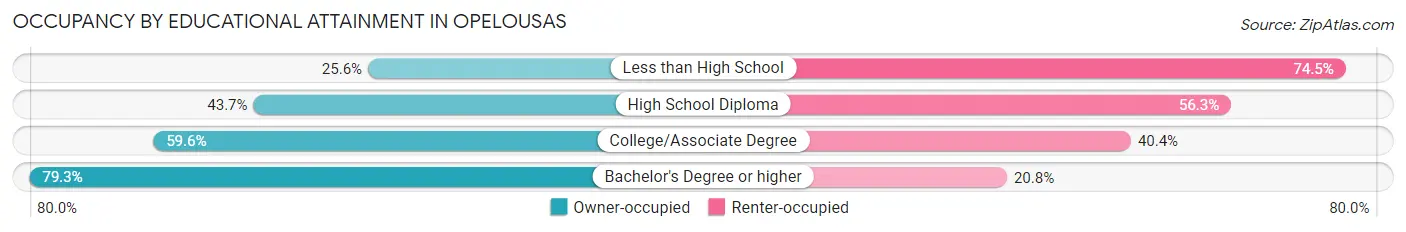
| Household Size | Owner-occupied | Renter-occupied |
| Less than High School | 381 (25.6%) | 1,110 (74.5%) |
| High School Diploma | 815 (43.7%) | 1,049 (56.3%) |
| College/Associate Degree | 1,028 (59.6%) | 697 (40.4%) |
| Bachelor's Degree or higher | 508 (79.2%) | 133 (20.7%) |
Occupancy by Age of Householder in Opelousas
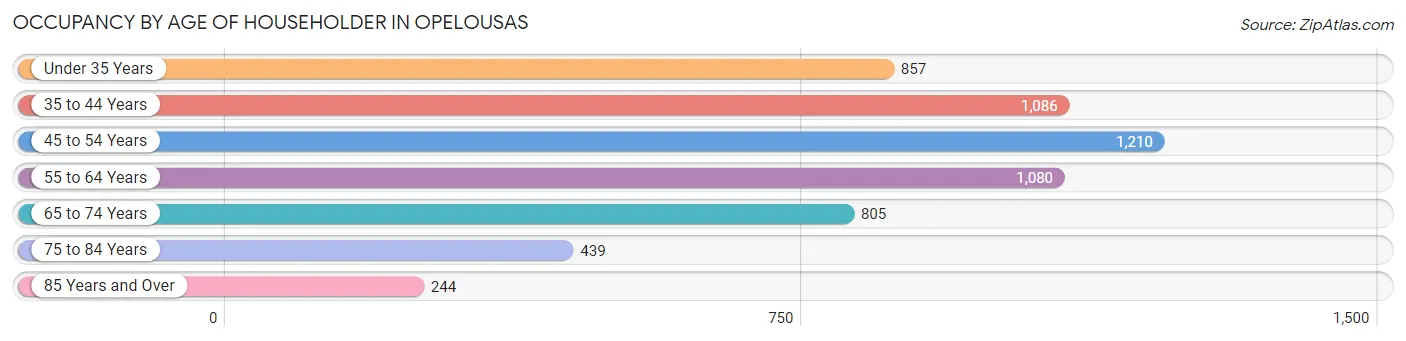
| Age Bracket | # Households | % Households |
| Under 35 Years | 857 | 15.0% |
| 35 to 44 Years | 1,086 | 19.0% |
| 45 to 54 Years | 1,210 | 21.1% |
| 55 to 64 Years | 1,080 | 18.9% |
| 65 to 74 Years | 805 | 14.1% |
| 75 to 84 Years | 439 | 7.7% |
| 85 Years and Over | 244 | 4.3% |
| Total | 5,721 | 100.0% |
Housing Finances in Opelousas
Median Income by Occupancy in Opelousas
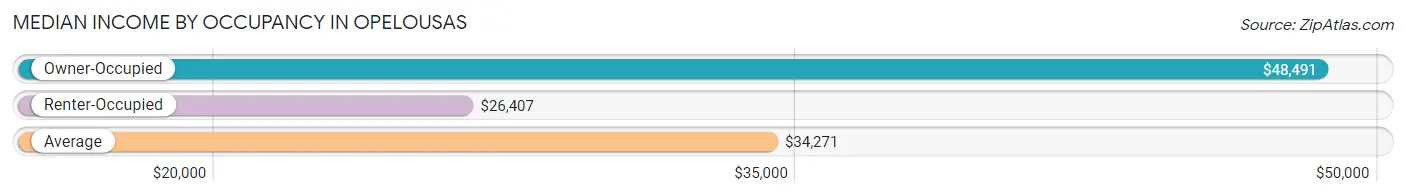
| Occupancy Type | # Households | Median Income |
| Owner-Occupied | 2,732 (47.7%) | $48,491 |
| Renter-Occupied | 2,989 (52.2%) | $26,407 |
| Average | 5,721 (100.0%) | $34,271 |
Occupancy by Householder Income Bracket in Opelousas
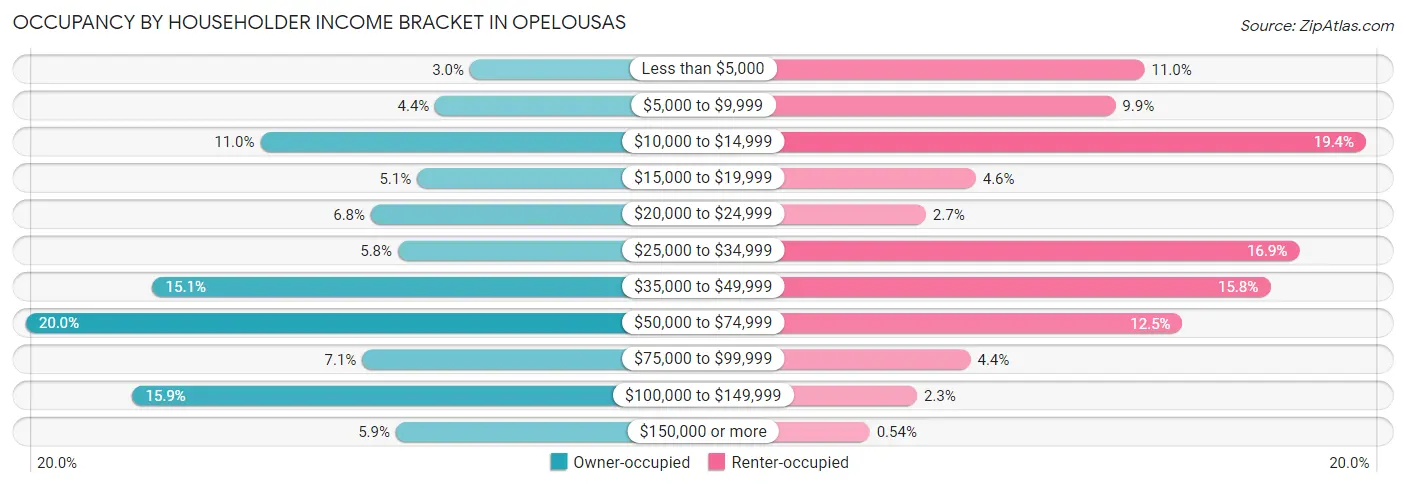
| Income Bracket | Owner-occupied | Renter-occupied |
| Less than $5,000 | 83 (3.0%) | 329 (11.0%) |
| $5,000 to $9,999 | 119 (4.4%) | 296 (9.9%) |
| $10,000 to $14,999 | 301 (11.0%) | 581 (19.4%) |
| $15,000 to $19,999 | 138 (5.1%) | 137 (4.6%) |
| $20,000 to $24,999 | 186 (6.8%) | 80 (2.7%) |
| $25,000 to $34,999 | 158 (5.8%) | 505 (16.9%) |
| $35,000 to $49,999 | 413 (15.1%) | 472 (15.8%) |
| $50,000 to $74,999 | 545 (20.0%) | 372 (12.4%) |
| $75,000 to $99,999 | 195 (7.1%) | 131 (4.4%) |
| $100,000 to $149,999 | 434 (15.9%) | 70 (2.3%) |
| $150,000 or more | 160 (5.9%) | 16 (0.5%) |
| Total | 2,732 (100.0%) | 2,989 (100.0%) |
Monthly Housing Cost Tiers in Opelousas
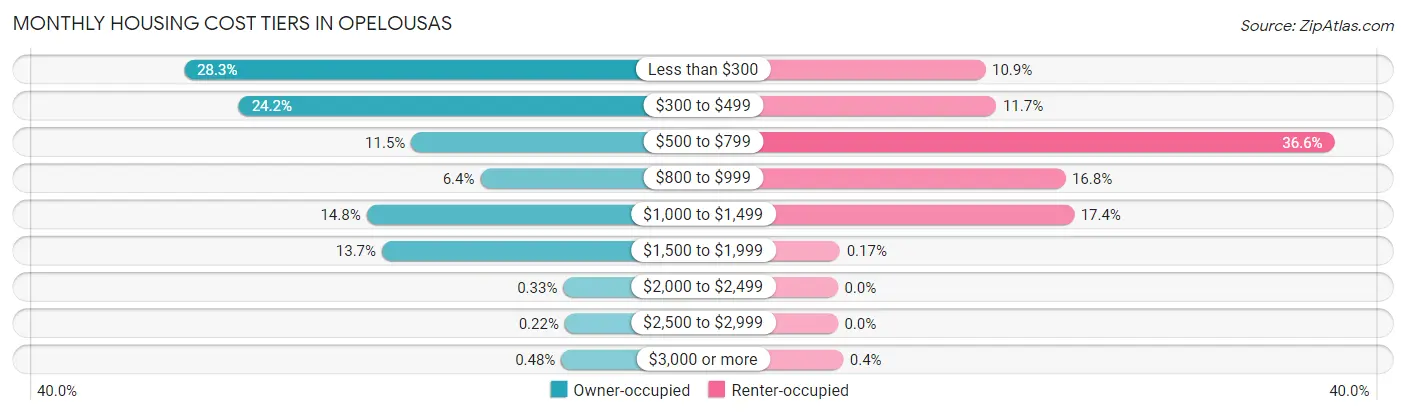
| Monthly Cost | Owner-occupied | Renter-occupied |
| Less than $300 | 772 (28.3%) | 325 (10.9%) |
| $300 to $499 | 662 (24.2%) | 349 (11.7%) |
| $500 to $799 | 315 (11.5%) | 1,094 (36.6%) |
| $800 to $999 | 176 (6.4%) | 501 (16.8%) |
| $1,000 to $1,499 | 405 (14.8%) | 520 (17.4%) |
| $1,500 to $1,999 | 374 (13.7%) | 5 (0.2%) |
| $2,000 to $2,499 | 9 (0.3%) | 0 (0.0%) |
| $2,500 to $2,999 | 6 (0.2%) | 0 (0.0%) |
| $3,000 or more | 13 (0.5%) | 12 (0.4%) |
| Total | 2,732 (100.0%) | 2,989 (100.0%) |
Physical Housing Characteristics in Opelousas
Housing Structures in Opelousas
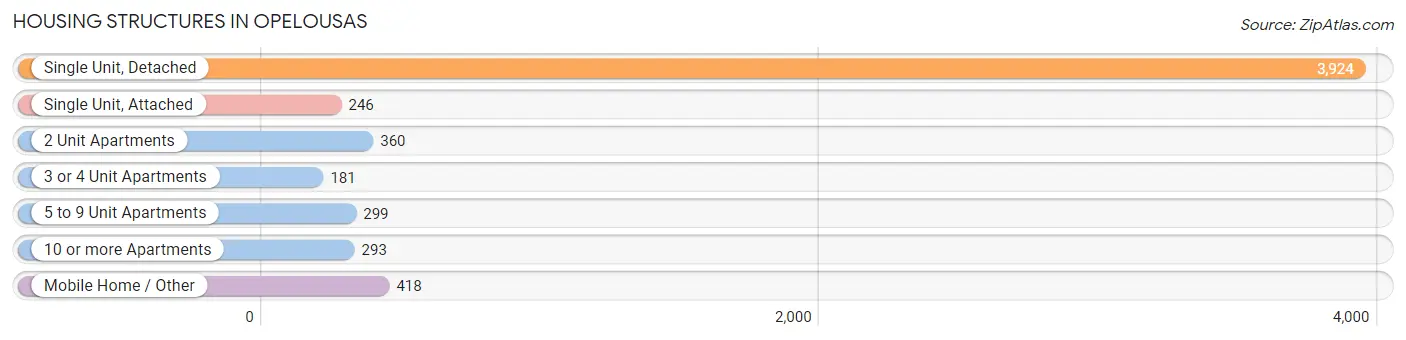
| Structure Type | # Housing Units | % Housing Units |
| Single Unit, Detached | 3,924 | 68.6% |
| Single Unit, Attached | 246 | 4.3% |
| 2 Unit Apartments | 360 | 6.3% |
| 3 or 4 Unit Apartments | 181 | 3.2% |
| 5 to 9 Unit Apartments | 299 | 5.2% |
| 10 or more Apartments | 293 | 5.1% |
| Mobile Home / Other | 418 | 7.3% |
| Total | 5,721 | 100.0% |
Housing Structures by Occupancy in Opelousas
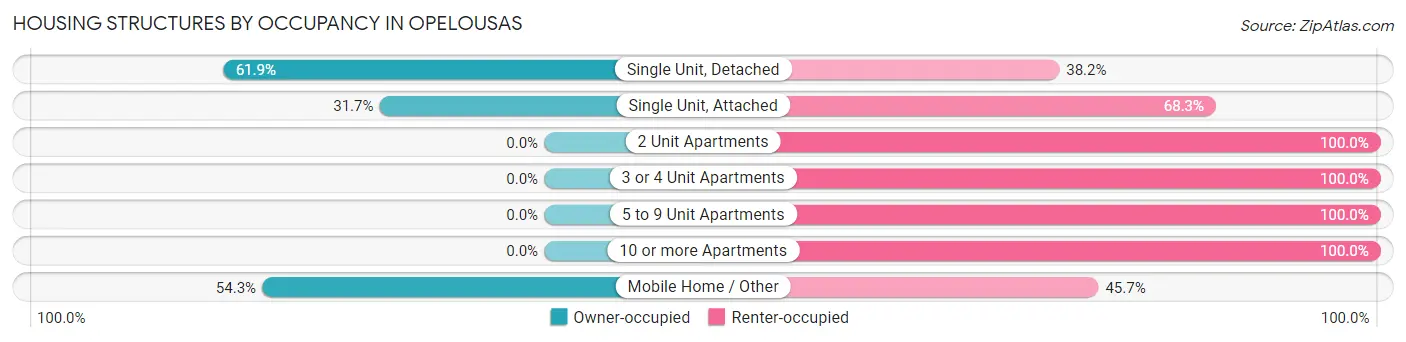
| Structure Type | Owner-occupied | Renter-occupied |
| Single Unit, Detached | 2,427 (61.9%) | 1,497 (38.2%) |
| Single Unit, Attached | 78 (31.7%) | 168 (68.3%) |
| 2 Unit Apartments | 0 (0.0%) | 360 (100.0%) |
| 3 or 4 Unit Apartments | 0 (0.0%) | 181 (100.0%) |
| 5 to 9 Unit Apartments | 0 (0.0%) | 299 (100.0%) |
| 10 or more Apartments | 0 (0.0%) | 293 (100.0%) |
| Mobile Home / Other | 227 (54.3%) | 191 (45.7%) |
| Total | 2,732 (47.7%) | 2,989 (52.2%) |
Housing Structures by Number of Rooms in Opelousas
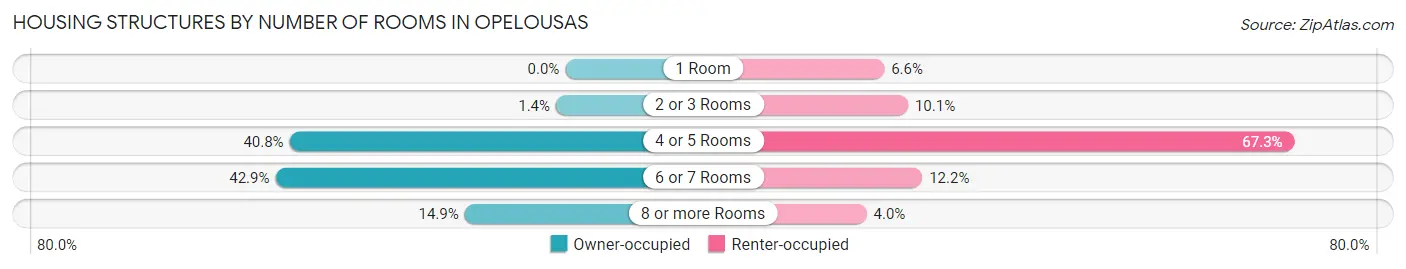
| Number of Rooms | Owner-occupied | Renter-occupied |
| 1 Room | 0 (0.0%) | 196 (6.6%) |
| 2 or 3 Rooms | 38 (1.4%) | 301 (10.1%) |
| 4 or 5 Rooms | 1,115 (40.8%) | 2,010 (67.2%) |
| 6 or 7 Rooms | 1,172 (42.9%) | 364 (12.2%) |
| 8 or more Rooms | 407 (14.9%) | 118 (4.0%) |
| Total | 2,732 (100.0%) | 2,989 (100.0%) |
Housing Structure by Heating Type in Opelousas
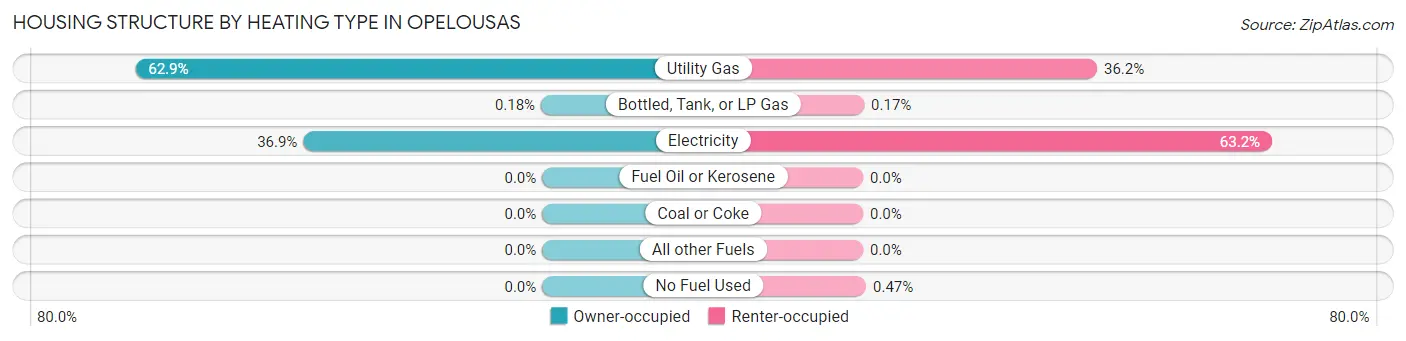
| Heating Type | Owner-occupied | Renter-occupied |
| Utility Gas | 1,718 (62.9%) | 1,081 (36.2%) |
| Bottled, Tank, or LP Gas | 5 (0.2%) | 5 (0.2%) |
| Electricity | 1,009 (36.9%) | 1,889 (63.2%) |
| Fuel Oil or Kerosene | 0 (0.0%) | 0 (0.0%) |
| Coal or Coke | 0 (0.0%) | 0 (0.0%) |
| All other Fuels | 0 (0.0%) | 0 (0.0%) |
| No Fuel Used | 0 (0.0%) | 14 (0.5%) |
| Total | 2,732 (100.0%) | 2,989 (100.0%) |
Household Vehicle Usage in Opelousas
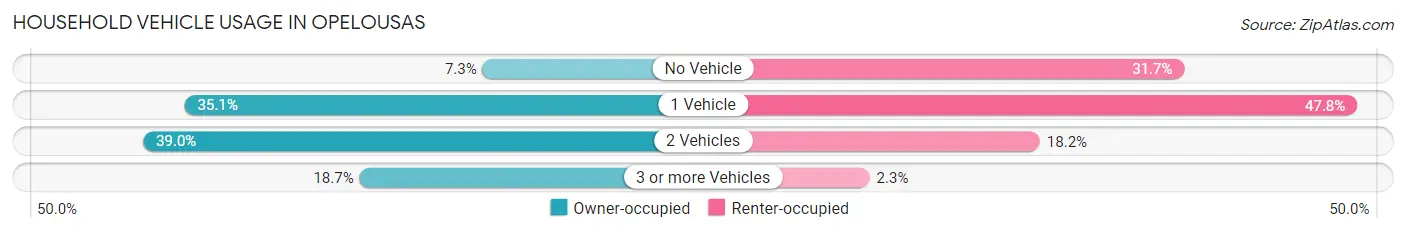
| Vehicles per Household | Owner-occupied | Renter-occupied |
| No Vehicle | 198 (7.2%) | 947 (31.7%) |
| 1 Vehicle | 958 (35.1%) | 1,429 (47.8%) |
| 2 Vehicles | 1,064 (39.0%) | 544 (18.2%) |
| 3 or more Vehicles | 512 (18.7%) | 69 (2.3%) |
| Total | 2,732 (100.0%) | 2,989 (100.0%) |
Real Estate & Mortgages in Opelousas
Real Estate and Mortgage Overview in Opelousas
| Characteristic | Without Mortgage | With Mortgage |
| Housing Units | 1,593 | 1,139 |
| Median Property Value | $88,500 | $159,600 |
| Median Household Income | $36,430 | $104 |
| Monthly Housing Costs | $303 | $13 |
| Real Estate Taxes | $199 | $269 |
Property Value by Mortgage Status in Opelousas
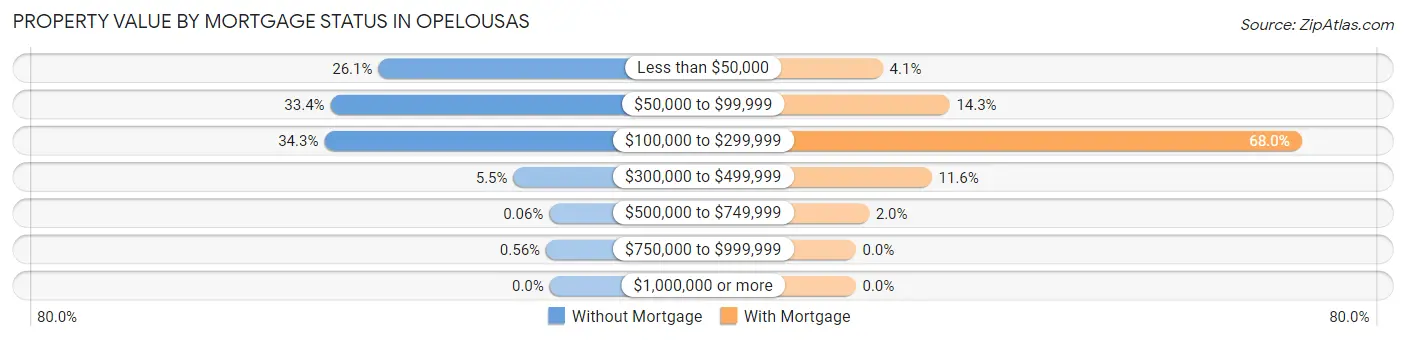
| Property Value | Without Mortgage | With Mortgage |
| Less than $50,000 | 416 (26.1%) | 47 (4.1%) |
| $50,000 to $99,999 | 532 (33.4%) | 163 (14.3%) |
| $100,000 to $299,999 | 547 (34.3%) | 774 (67.9%) |
| $300,000 to $499,999 | 88 (5.5%) | 132 (11.6%) |
| $500,000 to $749,999 | 1 (0.1%) | 23 (2.0%) |
| $750,000 to $999,999 | 9 (0.6%) | 0 (0.0%) |
| $1,000,000 or more | 0 (0.0%) | 0 (0.0%) |
| Total | 1,593 (100.0%) | 1,139 (100.0%) |
Household Income by Mortgage Status in Opelousas
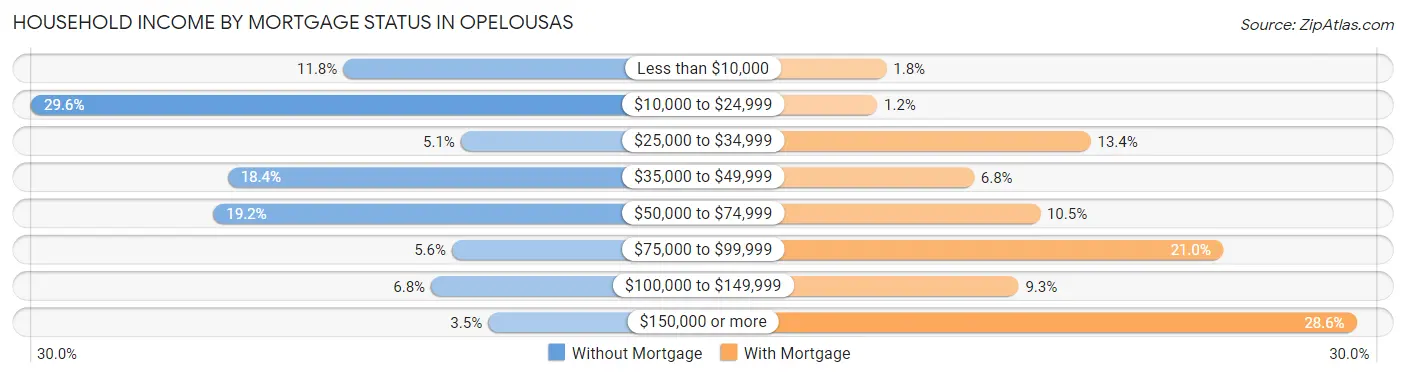
| Household Income | Without Mortgage | With Mortgage |
| Less than $10,000 | 188 (11.8%) | 20 (1.8%) |
| $10,000 to $24,999 | 472 (29.6%) | 14 (1.2%) |
| $25,000 to $34,999 | 81 (5.1%) | 153 (13.4%) |
| $35,000 to $49,999 | 293 (18.4%) | 77 (6.8%) |
| $50,000 to $74,999 | 306 (19.2%) | 120 (10.5%) |
| $75,000 to $99,999 | 89 (5.6%) | 239 (21.0%) |
| $100,000 to $149,999 | 108 (6.8%) | 106 (9.3%) |
| $150,000 or more | 56 (3.5%) | 326 (28.6%) |
| Total | 1,593 (100.0%) | 1,139 (100.0%) |
Property Value to Household Income Ratio in Opelousas
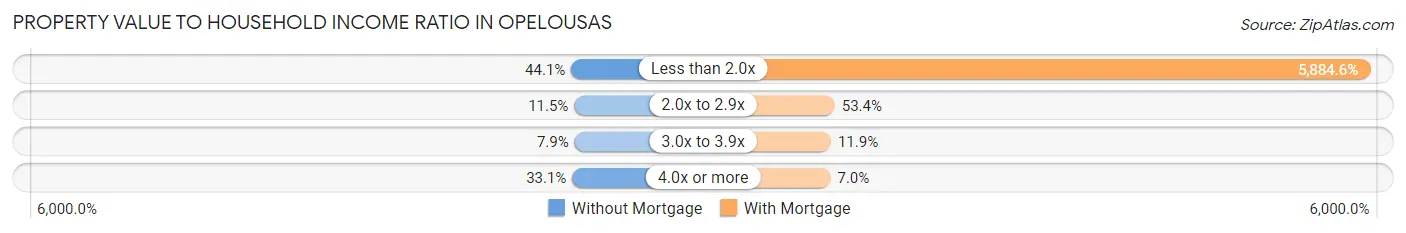
| Value-to-Income Ratio | Without Mortgage | With Mortgage |
| Less than 2.0x | 703 (44.1%) | 67,026 (5,884.6%) |
| 2.0x to 2.9x | 183 (11.5%) | 608 (53.4%) |
| 3.0x to 3.9x | 125 (7.9%) | 135 (11.8%) |
| 4.0x or more | 527 (33.1%) | 80 (7.0%) |
| Total | 1,593 (100.0%) | 1,139 (100.0%) |
Real Estate Taxes by Mortgage Status in Opelousas
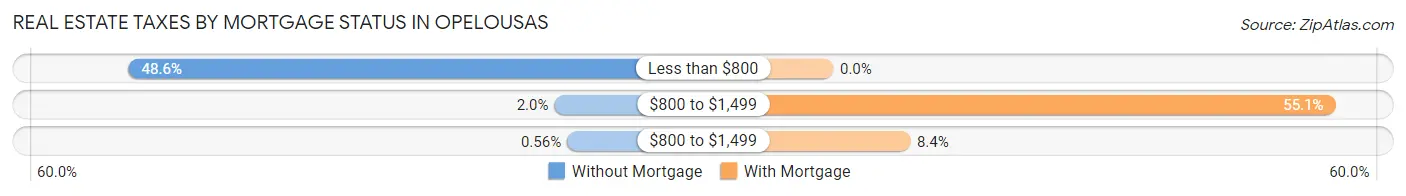
| Property Taxes | Without Mortgage | With Mortgage |
| Less than $800 | 774 (48.6%) | 0 (0.0%) |
| $800 to $1,499 | 31 (1.9%) | 627 (55.0%) |
| $800 to $1,499 | 9 (0.6%) | 96 (8.4%) |
| Total | 1,593 (100.0%) | 1,139 (100.0%) |
Health & Disability in Opelousas
Health Insurance Coverage by Age in Opelousas
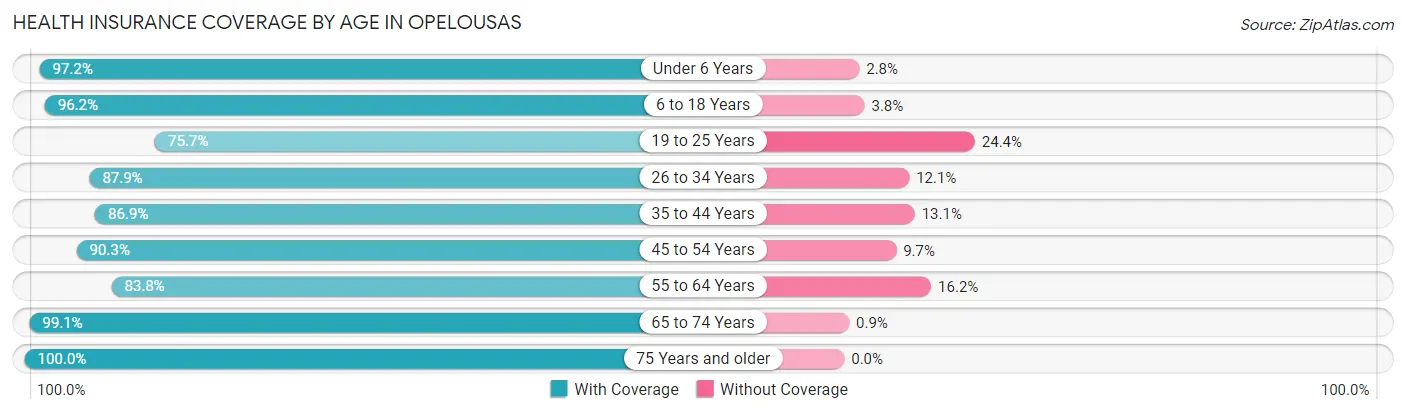
| Age Bracket | With Coverage | Without Coverage |
| Under 6 Years | 1,082 (97.2%) | 31 (2.8%) |
| 6 to 18 Years | 3,422 (96.2%) | 134 (3.8%) |
| 19 to 25 Years | 1,100 (75.6%) | 354 (24.3%) |
| 26 to 34 Years | 1,634 (87.9%) | 225 (12.1%) |
| 35 to 44 Years | 1,534 (86.9%) | 232 (13.1%) |
| 45 to 54 Years | 1,717 (90.3%) | 184 (9.7%) |
| 55 to 64 Years | 1,371 (83.8%) | 265 (16.2%) |
| 65 to 74 Years | 1,217 (99.1%) | 11 (0.9%) |
| 75 Years and older | 878 (100.0%) | 0 (0.0%) |
| Total | 13,955 (90.7%) | 1,436 (9.3%) |
Health Insurance Coverage by Citizenship Status in Opelousas
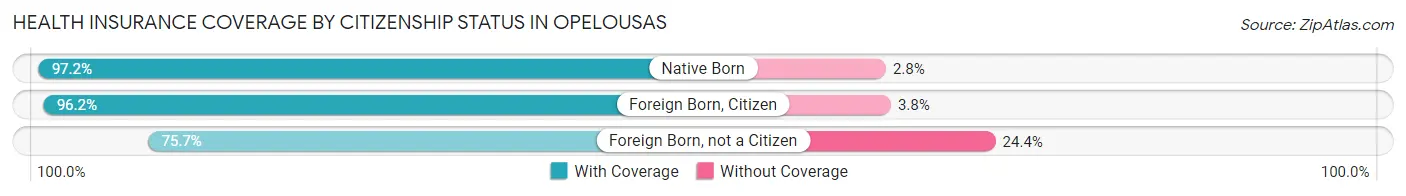
| Citizenship Status | With Coverage | Without Coverage |
| Native Born | 1,082 (97.2%) | 31 (2.8%) |
| Foreign Born, Citizen | 3,422 (96.2%) | 134 (3.8%) |
| Foreign Born, not a Citizen | 1,100 (75.6%) | 354 (24.3%) |
Health Insurance Coverage by Household Income in Opelousas
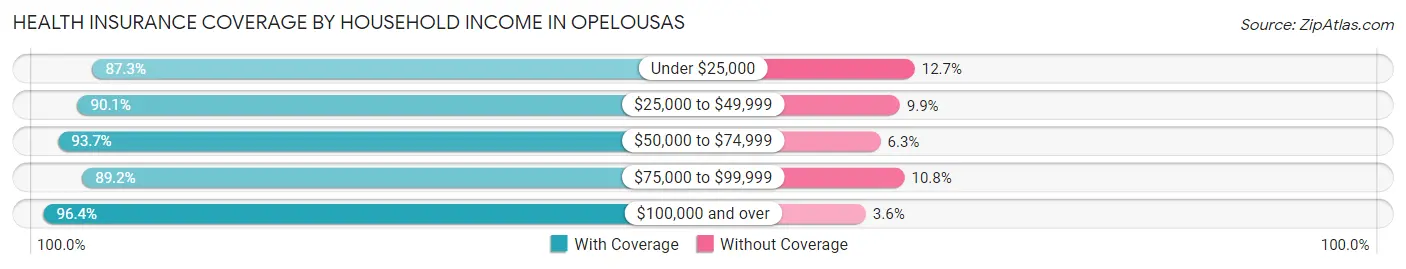
| Household Income | With Coverage | Without Coverage |
| Under $25,000 | 4,166 (87.3%) | 608 (12.7%) |
| $25,000 to $49,999 | 3,623 (90.1%) | 400 (9.9%) |
| $50,000 to $74,999 | 2,525 (93.7%) | 171 (6.3%) |
| $75,000 to $99,999 | 1,030 (89.2%) | 125 (10.8%) |
| $100,000 and over | 2,502 (96.4%) | 93 (3.6%) |
Public vs Private Health Insurance Coverage by Age in Opelousas
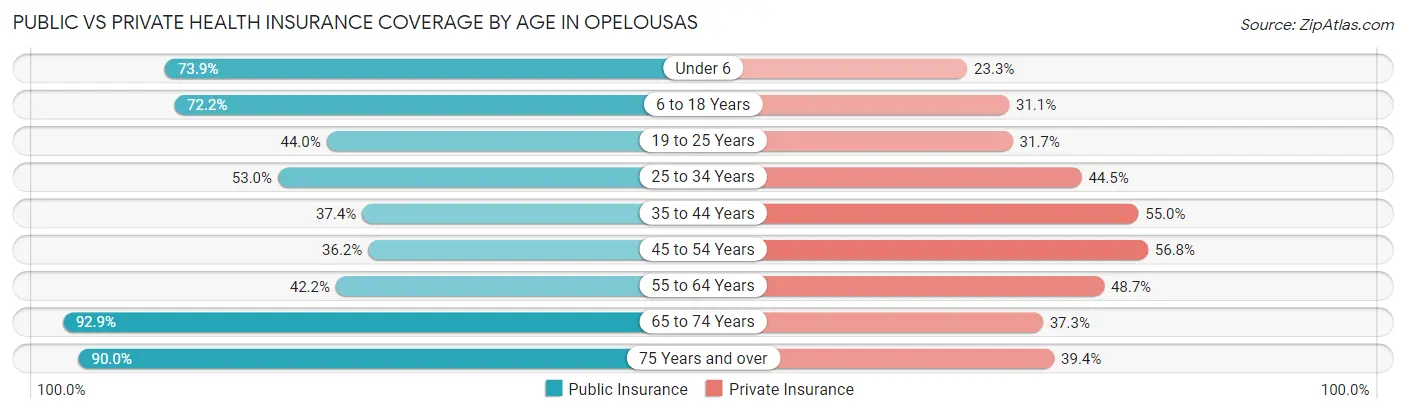
| Age Bracket | Public Insurance | Private Insurance |
| Under 6 | 823 (73.9%) | 259 (23.3%) |
| 6 to 18 Years | 2,569 (72.2%) | 1,104 (31.0%) |
| 19 to 25 Years | 639 (44.0%) | 461 (31.7%) |
| 25 to 34 Years | 985 (53.0%) | 827 (44.5%) |
| 35 to 44 Years | 660 (37.4%) | 972 (55.0%) |
| 45 to 54 Years | 689 (36.2%) | 1,080 (56.8%) |
| 55 to 64 Years | 691 (42.2%) | 796 (48.7%) |
| 65 to 74 Years | 1,141 (92.9%) | 458 (37.3%) |
| 75 Years and over | 790 (90.0%) | 346 (39.4%) |
| Total | 8,987 (58.4%) | 6,303 (40.9%) |
Disability Status by Sex by Age in Opelousas
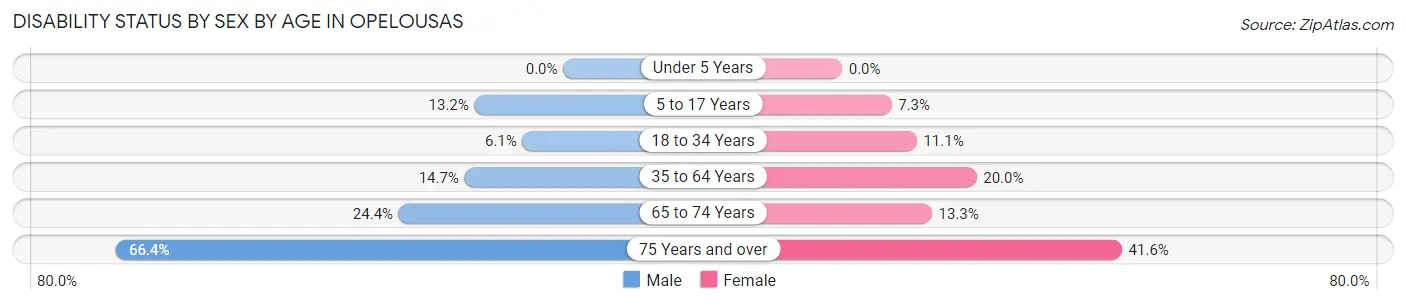
| Age Bracket | Male | Female |
| Under 5 Years | 0 (0.0%) | 0 (0.0%) |
| 5 to 17 Years | 240 (13.2%) | 121 (7.3%) |
| 18 to 34 Years | 102 (6.0%) | 207 (11.1%) |
| 35 to 64 Years | 311 (14.6%) | 635 (20.0%) |
| 65 to 74 Years | 126 (24.4%) | 95 (13.3%) |
| 75 Years and over | 174 (66.4%) | 256 (41.6%) |
Disability Class by Sex by Age in Opelousas
Disability Class: Hearing Difficulty
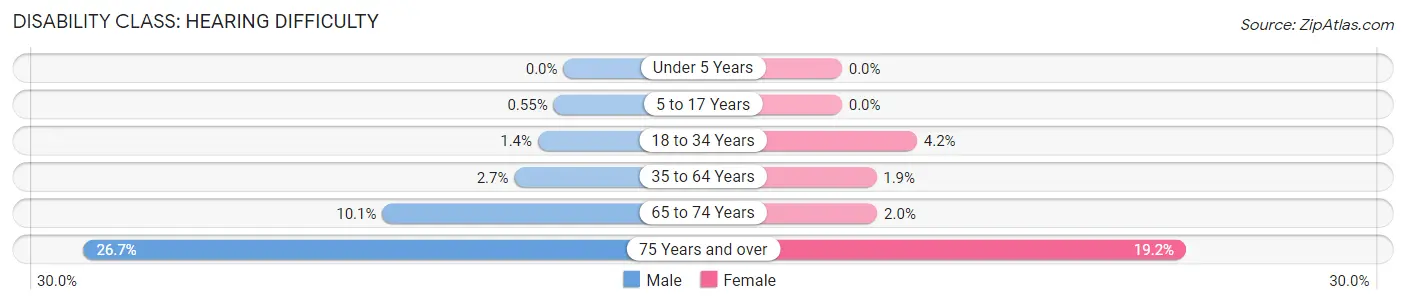
| Age Bracket | Male | Female |
| Under 5 Years | 0 (0.0%) | 0 (0.0%) |
| 5 to 17 Years | 10 (0.5%) | 0 (0.0%) |
| 18 to 34 Years | 24 (1.4%) | 78 (4.2%) |
| 35 to 64 Years | 58 (2.7%) | 61 (1.9%) |
| 65 to 74 Years | 52 (10.1%) | 14 (2.0%) |
| 75 Years and over | 70 (26.7%) | 118 (19.2%) |
Disability Class: Vision Difficulty
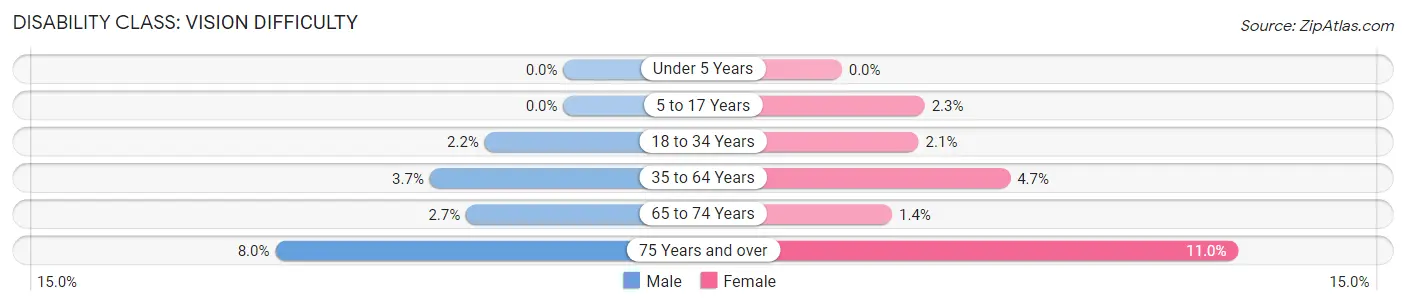
| Age Bracket | Male | Female |
| Under 5 Years | 0 (0.0%) | 0 (0.0%) |
| 5 to 17 Years | 0 (0.0%) | 38 (2.3%) |
| 18 to 34 Years | 37 (2.2%) | 40 (2.1%) |
| 35 to 64 Years | 79 (3.7%) | 149 (4.7%) |
| 65 to 74 Years | 14 (2.7%) | 10 (1.4%) |
| 75 Years and over | 21 (8.0%) | 68 (11.0%) |
Disability Class: Cognitive Difficulty
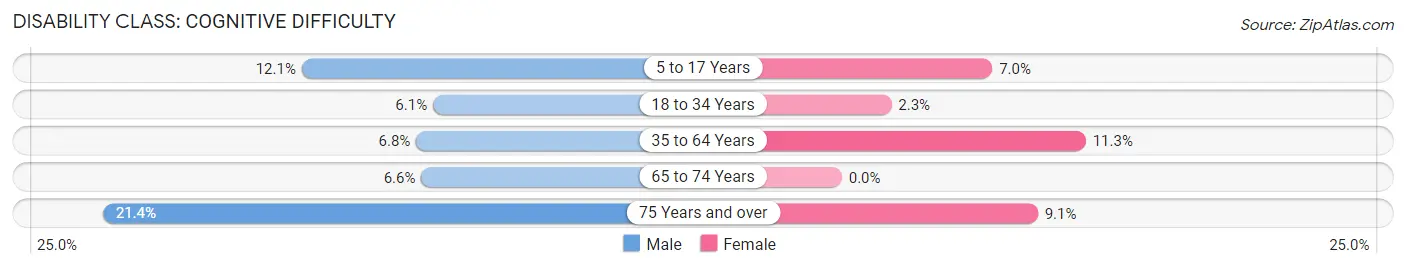
| Age Bracket | Male | Female |
| 5 to 17 Years | 221 (12.1%) | 115 (7.0%) |
| 18 to 34 Years | 102 (6.0%) | 43 (2.3%) |
| 35 to 64 Years | 145 (6.8%) | 360 (11.3%) |
| 65 to 74 Years | 34 (6.6%) | 0 (0.0%) |
| 75 Years and over | 56 (21.4%) | 56 (9.1%) |
Disability Class: Ambulatory Difficulty
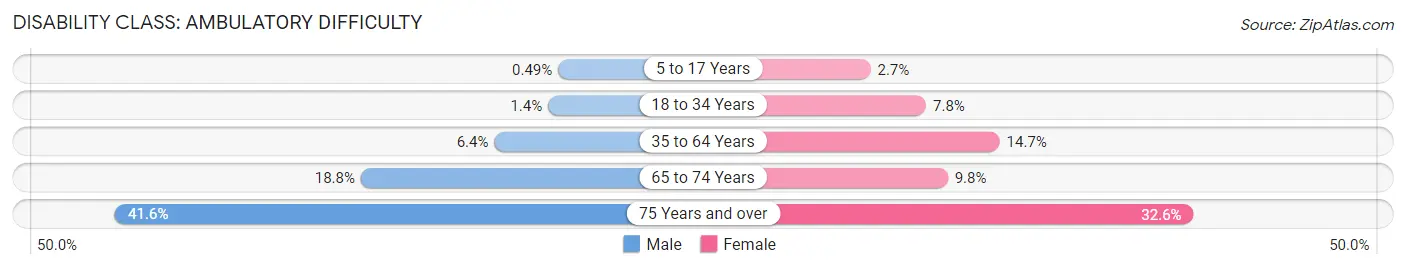
| Age Bracket | Male | Female |
| 5 to 17 Years | 9 (0.5%) | 44 (2.7%) |
| 18 to 34 Years | 24 (1.4%) | 146 (7.8%) |
| 35 to 64 Years | 136 (6.4%) | 466 (14.6%) |
| 65 to 74 Years | 97 (18.8%) | 70 (9.8%) |
| 75 Years and over | 109 (41.6%) | 201 (32.6%) |
Disability Class: Self-Care Difficulty
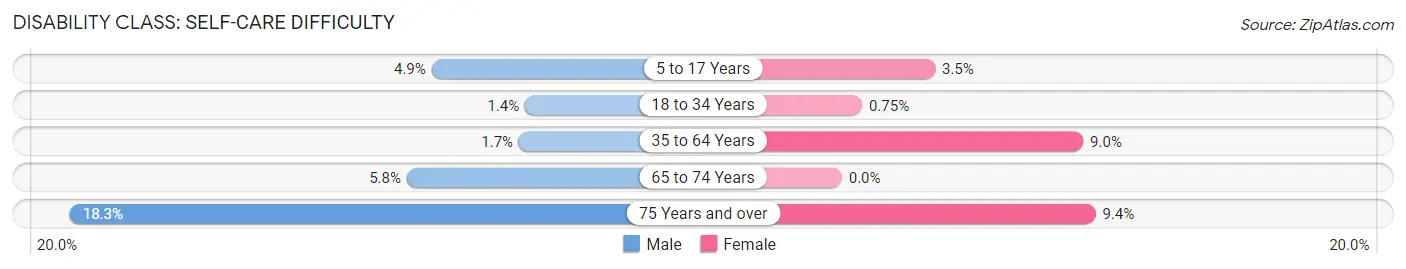
| Age Bracket | Male | Female |
| 5 to 17 Years | 89 (4.9%) | 57 (3.5%) |
| 18 to 34 Years | 24 (1.4%) | 14 (0.7%) |
| 35 to 64 Years | 35 (1.7%) | 285 (9.0%) |
| 65 to 74 Years | 30 (5.8%) | 0 (0.0%) |
| 75 Years and over | 48 (18.3%) | 58 (9.4%) |
Technology Access in Opelousas
Computing Device Access in Opelousas
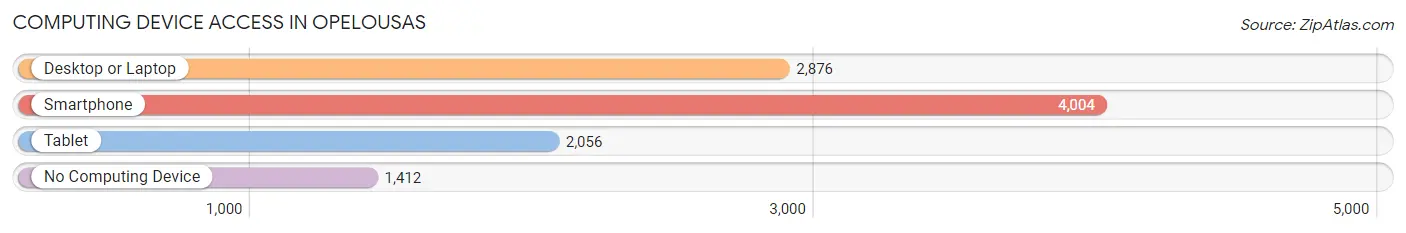
| Device Type | # Households | % Households |
| Desktop or Laptop | 2,876 | 50.3% |
| Smartphone | 4,004 | 70.0% |
| Tablet | 2,056 | 35.9% |
| No Computing Device | 1,412 | 24.7% |
| Total | 5,721 | 100.0% |
Internet Access in Opelousas
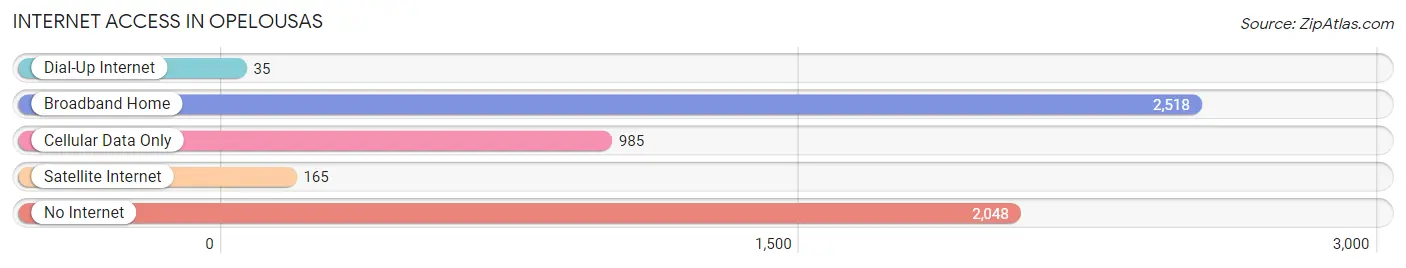
| Internet Type | # Households | % Households |
| Dial-Up Internet | 35 | 0.6% |
| Broadband Home | 2,518 | 44.0% |
| Cellular Data Only | 985 | 17.2% |
| Satellite Internet | 165 | 2.9% |
| No Internet | 2,048 | 35.8% |
| Total | 5,721 | 100.0% |
Opelousas Summary
Opelousas, Louisiana is a city located in St. Landry Parish in the southwestern part of the state. It is the parish seat and the largest city in the parish. The city is located on the banks of the Bayou Teche and is known for its Creole culture and its Cajun heritage.
History
The area that is now Opelousas was first inhabited by the Attakapas Indians, who were part of the Chitimacha tribe. The first European settlers arrived in the area in the late 1700s, and the town was officially founded in 1720 by French-Canadian fur traders. The town was named after the Opelousas Indians, who were a sub-tribe of the Attakapas.
In the early 1800s, the town became a center of the cotton and sugar cane industries. The town was also a major trading center for the area, and it was the site of the first railroad in Louisiana.
During the Civil War, Opelousas was the site of several battles between Union and Confederate forces. After the war, the town experienced a period of economic growth, and it became a center of the lumber industry.
In the late 1800s, the town was the site of a major race riot, which resulted in the deaths of several African Americans. The town was also the site of a major labor strike in the early 1900s.
Geography
Opelousas is located in the southwestern part of Louisiana, about 50 miles west of Baton Rouge. The city is situated on the banks of the Bayou Teche, and it is surrounded by swamps and marshes. The city has a humid subtropical climate, with hot, humid summers and mild winters.
The city covers an area of 8.3 square miles, and it has a population of 16,634 people, according to the 2010 census. The city is divided into several neighborhoods, including the historic downtown area, the Northside, the Southside, and the Westside.
Economy
Opelousas is the economic center of St. Landry Parish. The city is home to several major employers, including the St. Landry Parish School Board, the St. Landry Parish Sheriff’s Office, and the Opelousas General Hospital.
The city is also home to several manufacturing companies, including the Opelousas Manufacturing Company, which produces furniture and other wood products. The city is also home to several retail stores, including Walmart, Kmart, and Target.
Demographics
According to the 2010 census, the population of Opelousas was 16,634 people. The racial makeup of the city was 57.3% African American, 37.2% White, 0.7% Native American, 0.3% Asian, and 4.5% from other races.
The median household income in the city was $25,945, and the median family income was $31,945. The per capita income in the city was $14,945. About 24.3% of the population was below the poverty line.
Opelousas is a diverse city with a rich history and culture. The city is home to a variety of businesses and industries, and it is a major economic center in the region. The city is also home to a vibrant Creole and Cajun culture, and it is a great place to visit and explore.
Common Questions
What is Per Capita Income in Opelousas?
Per Capita income in Opelousas is $19,174.
What is the Median Family Income in Opelousas?
Median Family Income in Opelousas is $40,362.
What is the Median Household income in Opelousas?
Median Household Income in Opelousas is $34,271.
What is Income or Wage Gap in Opelousas?
Income or Wage Gap in Opelousas is 14.7%.
Women in Opelousas earn 85.3 cents for every dollar earned by a man.
What is Family Income Deficit in Opelousas?
Family Income Deficit in Opelousas is $11,053.
Families that are below poverty line in Opelousas earn $11,053 less on average than the poverty threshold level.
What is Inequality or Gini Index in Opelousas?
Inequality or Gini Index in Opelousas is 0.49.
What is the Total Population of Opelousas?
Total Population of Opelousas is 15,810.
What is the Total Male Population of Opelousas?
Total Male Population of Opelousas is 7,255.
What is the Total Female Population of Opelousas?
Total Female Population of Opelousas is 8,555.
What is the Ratio of Males per 100 Females in Opelousas?
There are 84.80 Males per 100 Females in Opelousas.
What is the Ratio of Females per 100 Males in Opelousas?
There are 117.92 Females per 100 Males in Opelousas.
What is the Median Population Age in Opelousas?
Median Population Age in Opelousas is 33.8 Years.
What is the Average Family Size in Opelousas
Average Family Size in Opelousas is 3.6 People.
What is the Average Household Size in Opelousas
Average Household Size in Opelousas is 2.7 People.
How Large is the Labor Force in Opelousas?
There are 5,926 People in the Labor Forcein in Opelousas.
What is the Percentage of People in the Labor Force in Opelousas?
49.9% of People are in the Labor Force in Opelousas.
What is the Unemployment Rate in Opelousas?
Unemployment Rate in Opelousas is 11.0%.