Oberlin, LA Map & Demographics
Oberlin Map
Oberlin Overview
$20,038
PER CAPITA INCOME
$72,925
AVG FAMILY INCOME
$35,673
AVG HOUSEHOLD INCOME
45.2%
WAGE / INCOME GAP [ % ]
54.8¢/ $1
WAGE / INCOME GAP [ $ ]
0.47
INEQUALITY / GINI INDEX
1,676
TOTAL POPULATION
783
MALE POPULATION
893
FEMALE POPULATION
87.68
MALES / 100 FEMALES
114.05
FEMALES / 100 MALES
34.3
MEDIAN AGE
3.7
AVG FAMILY SIZE
2.8
AVG HOUSEHOLD SIZE
468
LABOR FORCE [ PEOPLE ]
40.9%
PERCENT IN LABOR FORCE
1.7%
UNEMPLOYMENT RATE
Oberlin Zip Codes
Oberlin Area Codes
Income in Oberlin
Income Overview in Oberlin
Per Capita Income in Oberlin is $20,038, while median incomes of families and households are $72,925 and $35,673 respectively.
| Characteristic | Number | Measure |
| Per Capita Income | 1,676 | $20,038 |
| Median Family Income | 349 | $72,925 |
| Mean Family Income | 349 | $78,530 |
| Median Household Income | 567 | $35,673 |
| Mean Household Income | 567 | $58,207 |
| Income Deficit | 349 | $0 |
| Wage / Income Gap (%) | 1,676 | 45.18% |
| Wage / Income Gap ($) | 1,676 | 54.82¢ per $1 |
| Gini / Inequality Index | 1,676 | 0.47 |
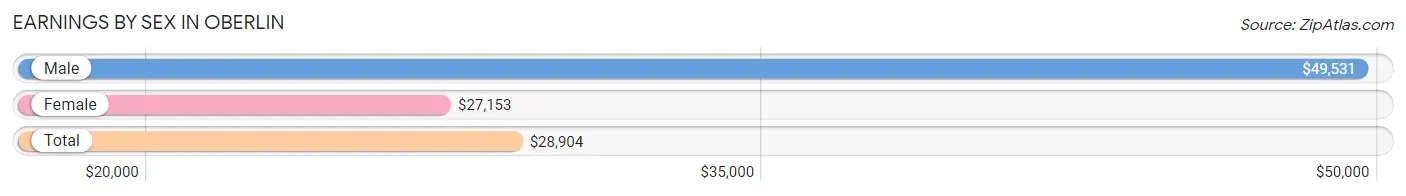
Earnings by Sex in Oberlin
Average Earnings in Oberlin are $28,904, $49,531 for men and $27,153 for women, a difference of 45.2%.
| Sex | Number | Average Earnings |
| Male | 245 (44.2%) | $49,531 |
| Female | 309 (55.8%) | $27,153 |
| Total | 554 (100.0%) | $28,904 |
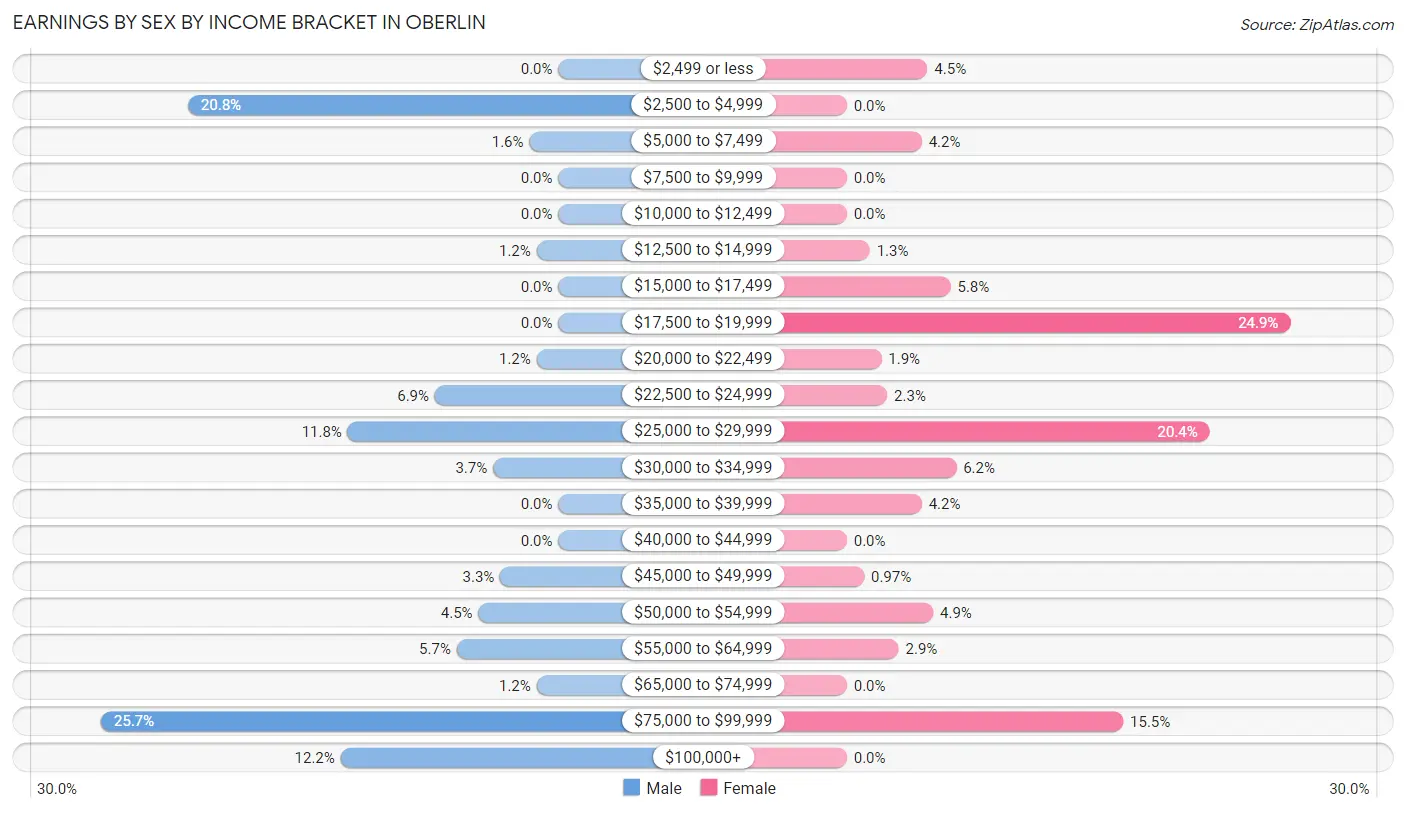
Earnings by Sex by Income Bracket in Oberlin
The most common earnings brackets in Oberlin are $75,000 to $99,999 for men (63 | 25.7%) and $17,500 to $19,999 for women (77 | 24.9%).
| Income | Male | Female |
| $2,499 or less | 0 (0.0%) | 14 (4.5%) |
| $2,500 to $4,999 | 51 (20.8%) | 0 (0.0%) |
| $5,000 to $7,499 | 4 (1.6%) | 13 (4.2%) |
| $7,500 to $9,999 | 0 (0.0%) | 0 (0.0%) |
| $10,000 to $12,499 | 0 (0.0%) | 0 (0.0%) |
| $12,500 to $14,999 | 3 (1.2%) | 4 (1.3%) |
| $15,000 to $17,499 | 0 (0.0%) | 18 (5.8%) |
| $17,500 to $19,999 | 0 (0.0%) | 77 (24.9%) |
| $20,000 to $22,499 | 3 (1.2%) | 6 (1.9%) |
| $22,500 to $24,999 | 17 (6.9%) | 7 (2.3%) |
| $25,000 to $29,999 | 29 (11.8%) | 63 (20.4%) |
| $30,000 to $34,999 | 9 (3.7%) | 19 (6.1%) |
| $35,000 to $39,999 | 0 (0.0%) | 13 (4.2%) |
| $40,000 to $44,999 | 0 (0.0%) | 0 (0.0%) |
| $45,000 to $49,999 | 8 (3.3%) | 3 (1.0%) |
| $50,000 to $54,999 | 11 (4.5%) | 15 (4.9%) |
| $55,000 to $64,999 | 14 (5.7%) | 9 (2.9%) |
| $65,000 to $74,999 | 3 (1.2%) | 0 (0.0%) |
| $75,000 to $99,999 | 63 (25.7%) | 48 (15.5%) |
| $100,000+ | 30 (12.2%) | 0 (0.0%) |
| Total | 245 (100.0%) | 309 (100.0%) |
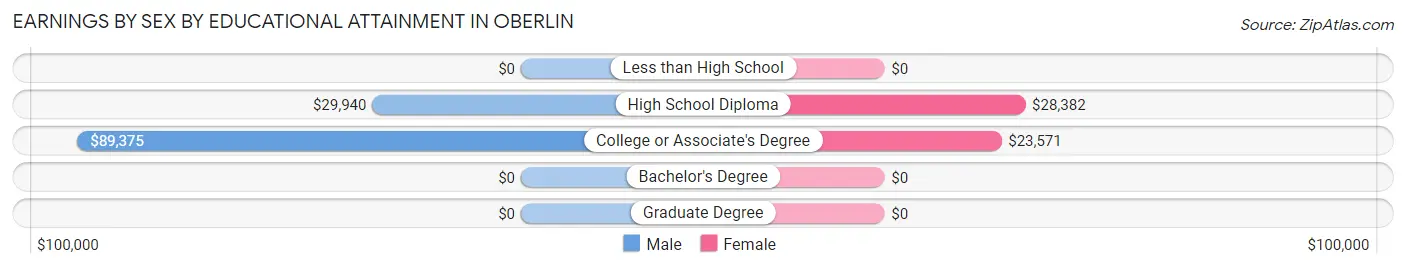
Earnings by Sex by Educational Attainment in Oberlin
Average earnings in Oberlin are $59,219 for men and $28,162 for women, a difference of 52.4%. Men with an educational attainment of college or associate's degree enjoy the highest average annual earnings of $89,375, while those with high school diploma education earn the least with $29,940. Women with an educational attainment of high school diploma earn the most with the average annual earnings of $28,382, while those with college or associate's degree education have the smallest earnings of $23,571.
| Educational Attainment | Male Income | Female Income |
| Less than High School | - | - |
| High School Diploma | $29,940 | $28,382 |
| College or Associate's Degree | $89,375 | $23,571 |
| Bachelor's Degree | - | - |
| Graduate Degree | - | - |
| Total | $59,219 | $28,162 |
Family Income in Oberlin
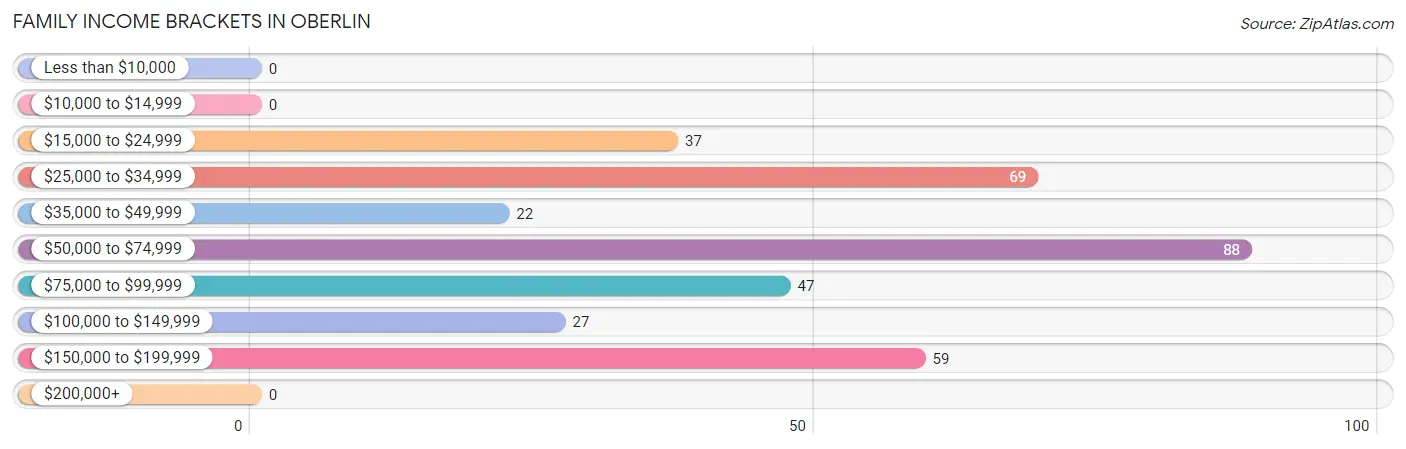
Family Income Brackets in Oberlin
According to the Oberlin family income data, there are 88 families falling into the $50,000 to $74,999 income range, which is the most common income bracket and makes up 25.2% of all families.
| Income Bracket | # Families | % Families |
| Less than $10,000 | 0 | 0.0% |
| $10,000 to $14,999 | 0 | 0.0% |
| $15,000 to $24,999 | 37 | 10.6% |
| $25,000 to $34,999 | 69 | 19.8% |
| $35,000 to $49,999 | 22 | 6.3% |
| $50,000 to $74,999 | 88 | 25.2% |
| $75,000 to $99,999 | 47 | 13.5% |
| $100,000 to $149,999 | 27 | 7.7% |
| $150,000 to $199,999 | 59 | 16.9% |
| $200,000+ | 0 | 0.0% |
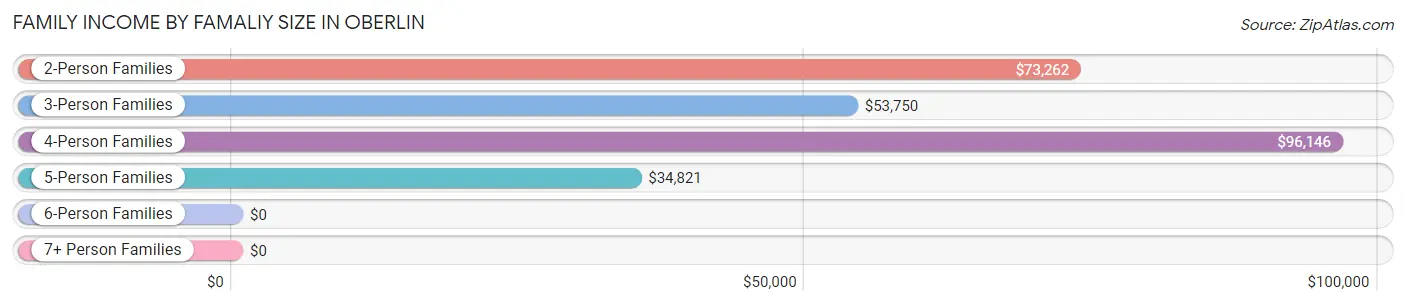
Family Income by Famaliy Size in Oberlin
4-person families (64 | 18.3%) account for the highest median family income in Oberlin with $96,146 per family, while 2-person families (127 | 36.4%) have the highest median income of $36,631 per family member.
| Income Bracket | # Families | Median Income |
| 2-Person Families | 127 (36.4%) | $73,262 |
| 3-Person Families | 80 (22.9%) | $53,750 |
| 4-Person Families | 64 (18.3%) | $96,146 |
| 5-Person Families | 55 (15.8%) | $34,821 |
| 6-Person Families | 0 (0.0%) | $0 |
| 7+ Person Families | 23 (6.6%) | $0 |
| Total | 349 (100.0%) | $72,925 |
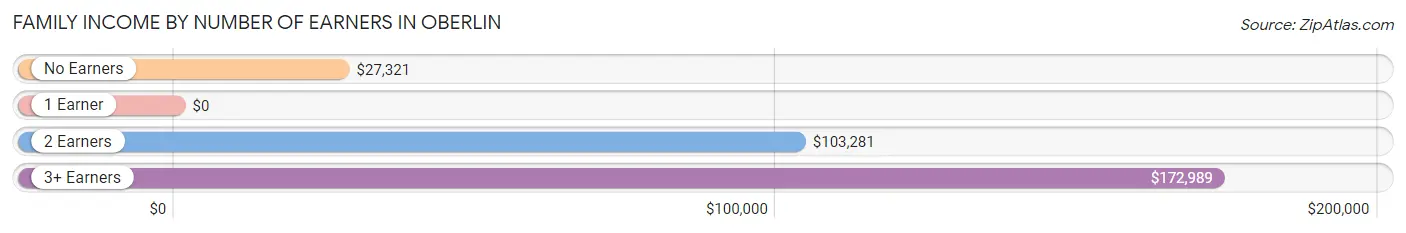
Family Income by Number of Earners in Oberlin
| Number of Earners | # Families | Median Income |
| No Earners | 19 (5.4%) | $27,321 |
| 1 Earner | 222 (63.6%) | $0 |
| 2 Earners | 71 (20.3%) | $103,281 |
| 3+ Earners | 37 (10.6%) | $172,989 |
| Total | 349 (100.0%) | $72,925 |
Household Income in Oberlin
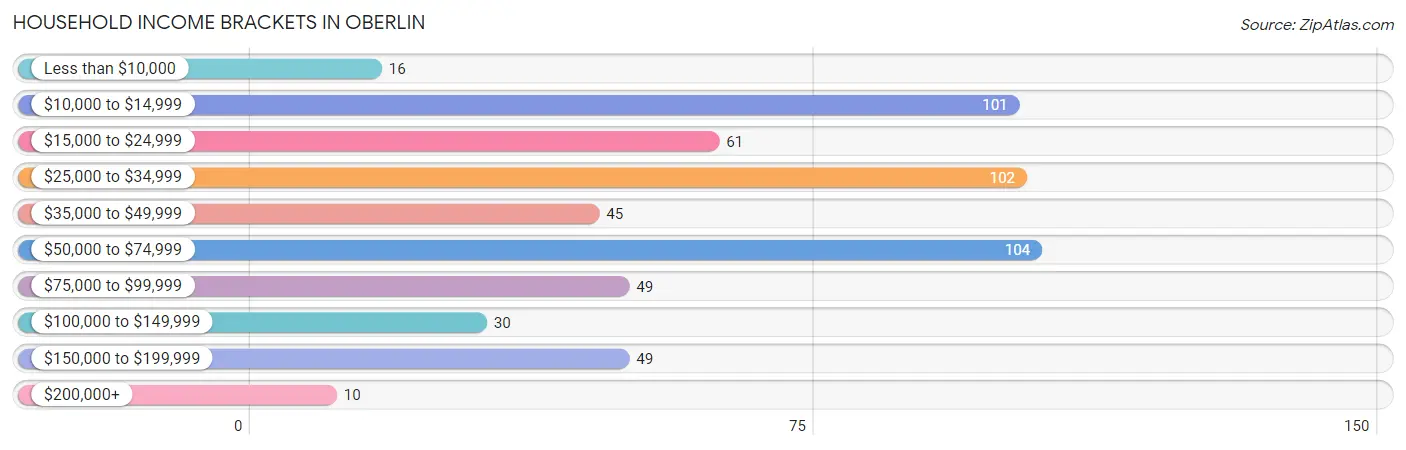
Household Income Brackets in Oberlin
With 104 households falling in the category, the $50,000 to $74,999 income range is the most frequent in Oberlin, accounting for 18.3% of all households. In contrast, only 10 households (1.8%) fall into the $200,000+ income bracket, making it the least populous group.
| Income Bracket | # Households | % Households |
| Less than $10,000 | 16 | 2.8% |
| $10,000 to $14,999 | 101 | 17.8% |
| $15,000 to $24,999 | 61 | 10.8% |
| $25,000 to $34,999 | 102 | 18.0% |
| $35,000 to $49,999 | 45 | 7.9% |
| $50,000 to $74,999 | 104 | 18.3% |
| $75,000 to $99,999 | 49 | 8.6% |
| $100,000 to $149,999 | 30 | 5.3% |
| $150,000 to $199,999 | 49 | 8.6% |
| $200,000+ | 10 | 1.8% |
Household Income by Householder Age in Oberlin
The median household income in Oberlin is $35,673, with the highest median household income of $40,694 found in the 65+ years age bracket for the primary householder. A total of 163 households (28.7%) fall into this category. Meanwhile, the 15 to 24 years age bracket for the primary householder has the lowest median household income of $0, with 33 households (5.8%) in this group.
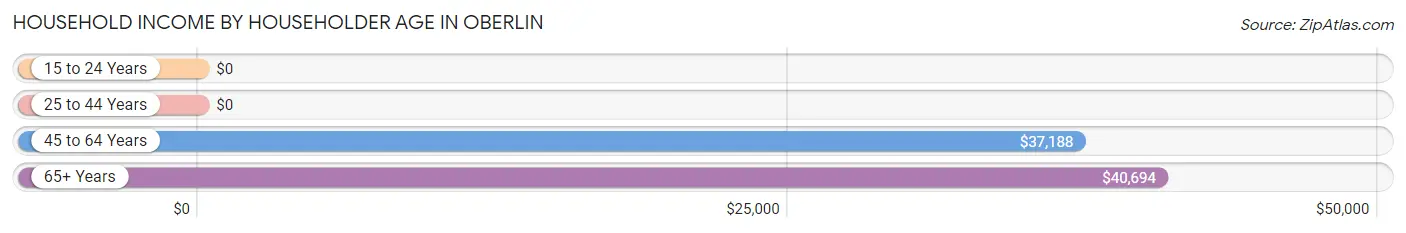
| Income Bracket | # Households | Median Income |
| 15 to 24 Years | 33 (5.8%) | $0 |
| 25 to 44 Years | 190 (33.5%) | $0 |
| 45 to 64 Years | 181 (31.9%) | $37,188 |
| 65+ Years | 163 (28.7%) | $40,694 |
| Total | 567 (100.0%) | $35,673 |
Poverty in Oberlin
Income Below Poverty by Sex and Age in Oberlin
With 27.8% poverty level for males and 24.8% for females among the residents of Oberlin, 25 to 34 year old males and 5 year old females are the most vulnerable to poverty, with 69 males (82.1%) and 6 females (100.0%) in their respective age groups living below the poverty level.
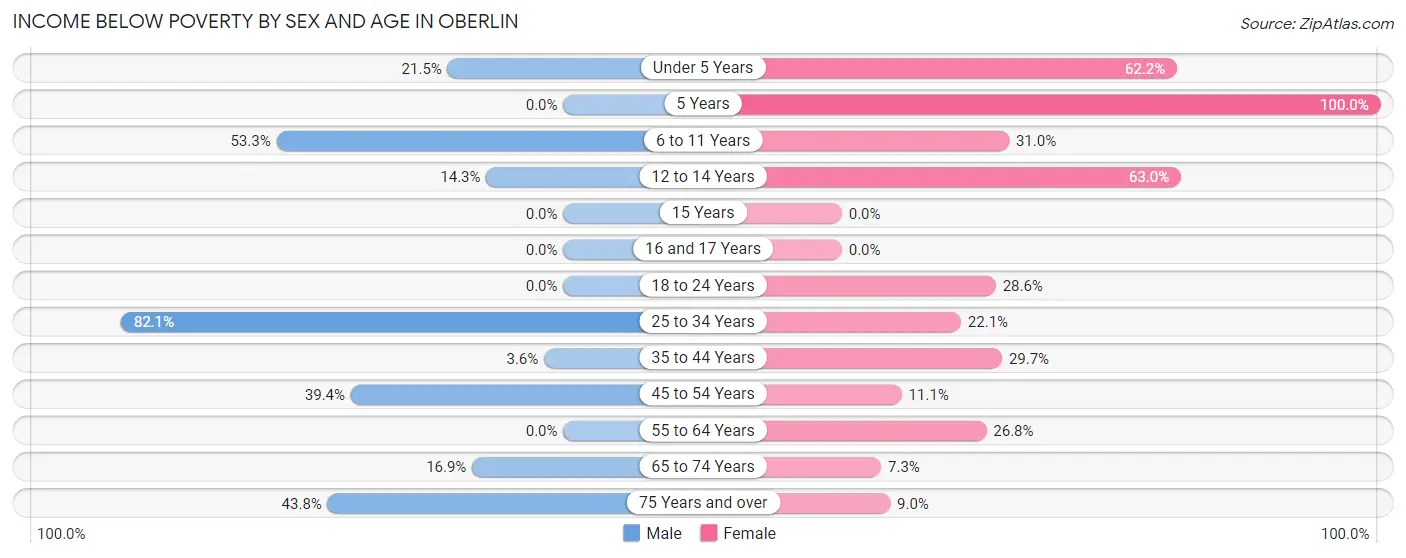
| Age Bracket | Male | Female |
| Under 5 Years | 35 (21.5%) | 28 (62.2%) |
| 5 Years | 0 (0.0%) | 6 (100.0%) |
| 6 to 11 Years | 41 (53.2%) | 36 (31.0%) |
| 12 to 14 Years | 5 (14.3%) | 34 (63.0%) |
| 15 Years | 0 (0.0%) | 0 (0.0%) |
| 16 and 17 Years | 0 (0.0%) | 0 (0.0%) |
| 18 to 24 Years | 0 (0.0%) | 12 (28.6%) |
| 25 to 34 Years | 69 (82.1%) | 21 (22.1%) |
| 35 to 44 Years | 3 (3.6%) | 33 (29.7%) |
| 45 to 54 Years | 28 (39.4%) | 9 (11.1%) |
| 55 to 64 Years | 0 (0.0%) | 22 (26.8%) |
| 65 to 74 Years | 11 (16.9%) | 7 (7.3%) |
| 75 Years and over | 7 (43.8%) | 6 (9.0%) |
| Total | 199 (27.8%) | 214 (24.8%) |
Income Above Poverty by Sex and Age in Oberlin
According to the poverty statistics in Oberlin, males aged 5 years and females aged 15 years are the age groups that are most secure financially, with 100.0% of males and 100.0% of females in these age groups living above the poverty line.
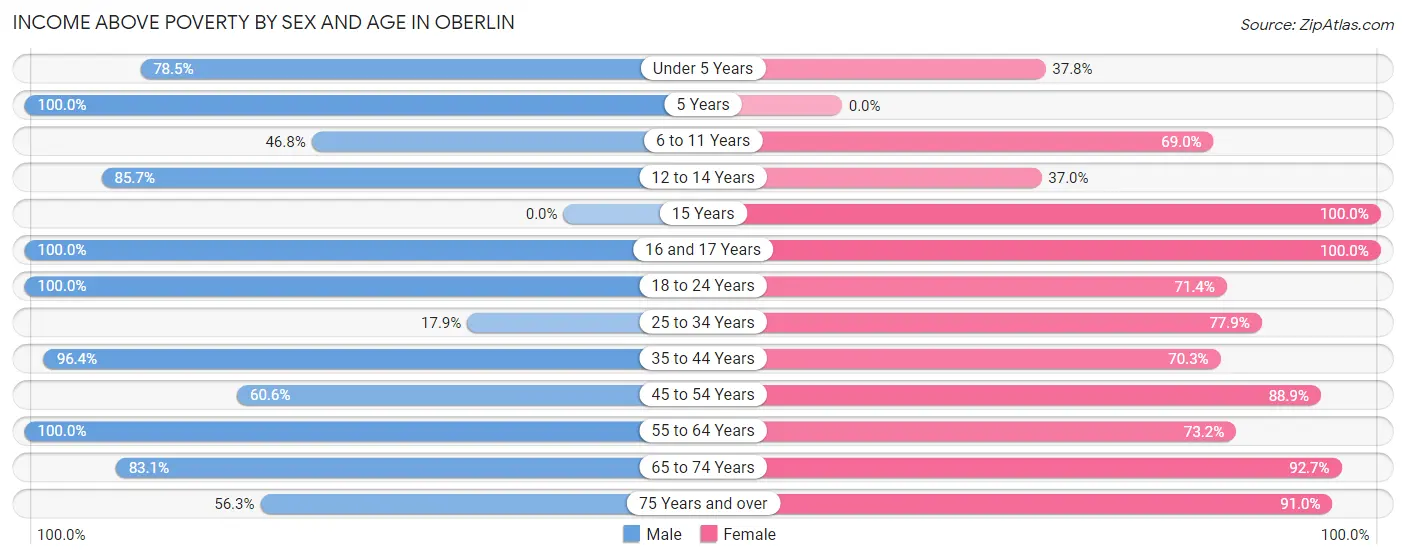
| Age Bracket | Male | Female |
| Under 5 Years | 128 (78.5%) | 17 (37.8%) |
| 5 Years | 18 (100.0%) | 0 (0.0%) |
| 6 to 11 Years | 36 (46.8%) | 80 (69.0%) |
| 12 to 14 Years | 30 (85.7%) | 20 (37.0%) |
| 15 Years | 0 (0.0%) | 6 (100.0%) |
| 16 and 17 Years | 13 (100.0%) | 60 (100.0%) |
| 18 to 24 Years | 68 (100.0%) | 30 (71.4%) |
| 25 to 34 Years | 15 (17.9%) | 74 (77.9%) |
| 35 to 44 Years | 81 (96.4%) | 78 (70.3%) |
| 45 to 54 Years | 43 (60.6%) | 72 (88.9%) |
| 55 to 64 Years | 22 (100.0%) | 60 (73.2%) |
| 65 to 74 Years | 54 (83.1%) | 89 (92.7%) |
| 75 Years and over | 9 (56.2%) | 61 (91.0%) |
| Total | 517 (72.2%) | 647 (75.1%) |
Income Below Poverty Among Married-Couple Families in Oberlin
The poverty statistics for married-couple families in Oberlin show that 6.6% or 14 of the total 211 families live below the poverty line. Families with 1 or 2 children have the highest poverty rate of 16.3%, comprising of 14 families. On the other hand, families with no children have the lowest poverty rate of 0.0%, which includes 0 families.
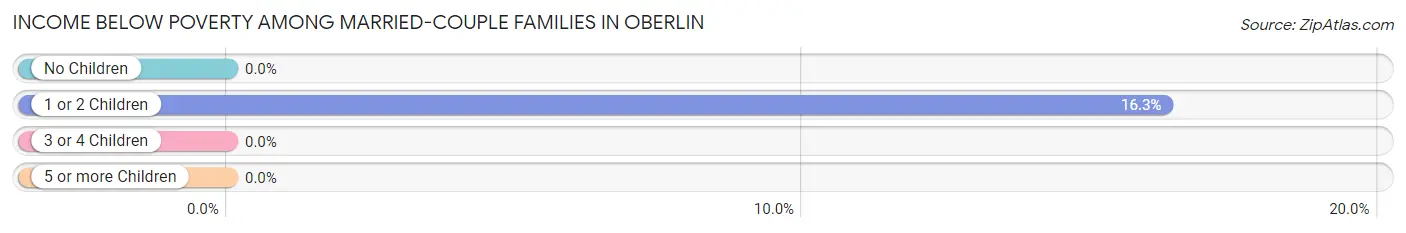
| Children | Above Poverty | Below Poverty |
| No Children | 89 (100.0%) | 0 (0.0%) |
| 1 or 2 Children | 72 (83.7%) | 14 (16.3%) |
| 3 or 4 Children | 36 (100.0%) | 0 (0.0%) |
| 5 or more Children | 0 (0.0%) | 0 (0.0%) |
| Total | 197 (93.4%) | 14 (6.6%) |
Income Below Poverty Among Single-Parent Households in Oberlin
According to the poverty data in Oberlin, 49.1% or 28 single-father households and 24.7% or 20 single-mother households are living below the poverty line. Among single-father households, those with 3 or 4 children have the highest poverty rate, with 28 households (87.5%) experiencing poverty. Likewise, among single-mother households, those with 1 or 2 children have the highest poverty rate, with 20 households (43.5%) falling below the poverty line.
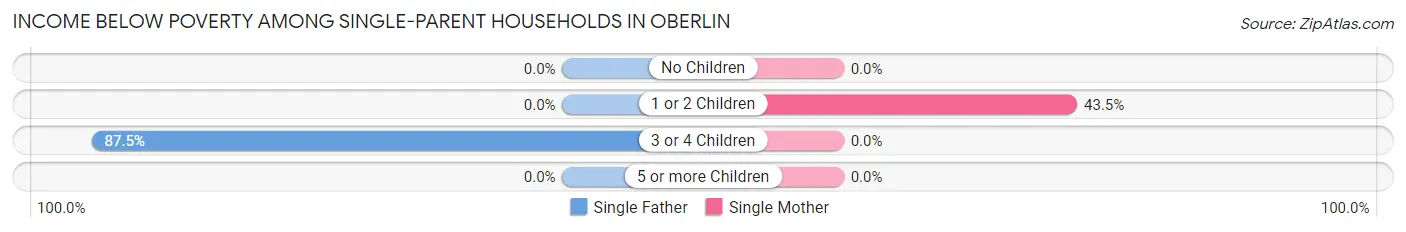
| Children | Single Father | Single Mother |
| No Children | 0 (0.0%) | 0 (0.0%) |
| 1 or 2 Children | 0 (0.0%) | 20 (43.5%) |
| 3 or 4 Children | 28 (87.5%) | 0 (0.0%) |
| 5 or more Children | 0 (0.0%) | 0 (0.0%) |
| Total | 28 (49.1%) | 20 (24.7%) |
Income Below Poverty Among Married-Couple vs Single-Parent Households in Oberlin
The poverty data for Oberlin shows that 14 of the married-couple family households (6.6%) and 48 of the single-parent households (34.8%) are living below the poverty level. Within the married-couple family households, those with 1 or 2 children have the highest poverty rate, with 14 households (16.3%) falling below the poverty line. Among the single-parent households, those with 3 or 4 children have the highest poverty rate, with 28 household (68.3%) living below poverty.
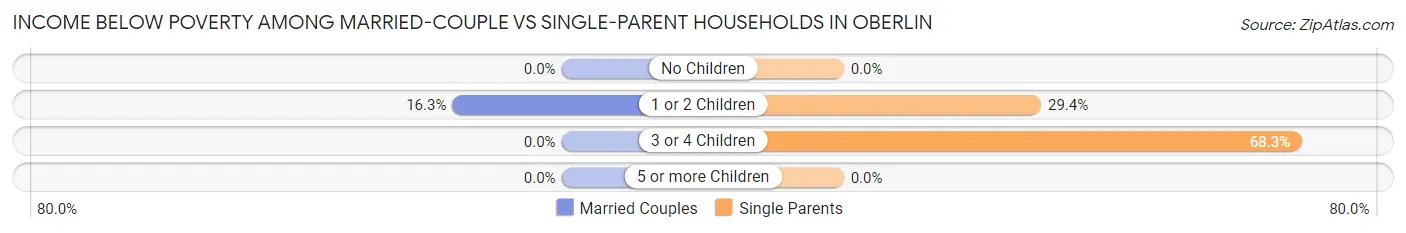
| Children | Married-Couple Families | Single-Parent Households |
| No Children | 0 (0.0%) | 0 (0.0%) |
| 1 or 2 Children | 14 (16.3%) | 20 (29.4%) |
| 3 or 4 Children | 0 (0.0%) | 28 (68.3%) |
| 5 or more Children | 0 (0.0%) | 0 (0.0%) |
| Total | 14 (6.6%) | 48 (34.8%) |
Race in Oberlin
The most populous races in Oberlin are White / Caucasian (1,097 | 65.4%), Black / African American (561 | 33.5%), and Asian (15 | 0.9%).
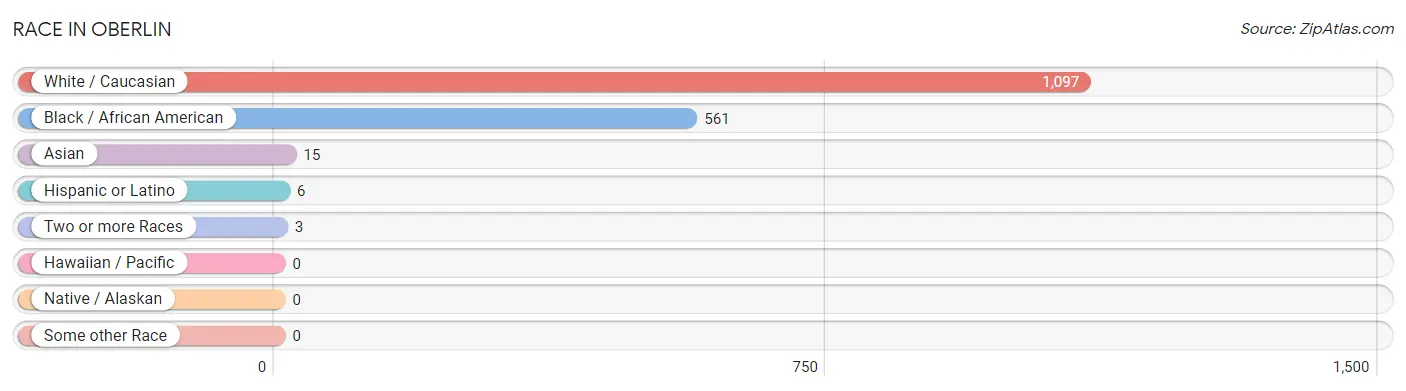
| Race | # Population | % Population |
| Asian | 15 | 0.9% |
| Black / African American | 561 | 33.5% |
| Hawaiian / Pacific | 0 | 0.0% |
| Hispanic or Latino | 6 | 0.4% |
| Native / Alaskan | 0 | 0.0% |
| White / Caucasian | 1,097 | 65.4% |
| Two or more Races | 3 | 0.2% |
| Some other Race | 0 | 0.0% |
| Total | 1,676 | 100.0% |
Ancestry in Oberlin
The most populous ancestries reported in Oberlin are English (329 | 19.6%), French (211 | 12.6%), Irish (57 | 3.4%), French Canadian (30 | 1.8%), and American (26 | 1.5%), together accounting for 39.0% of all Oberlin residents.
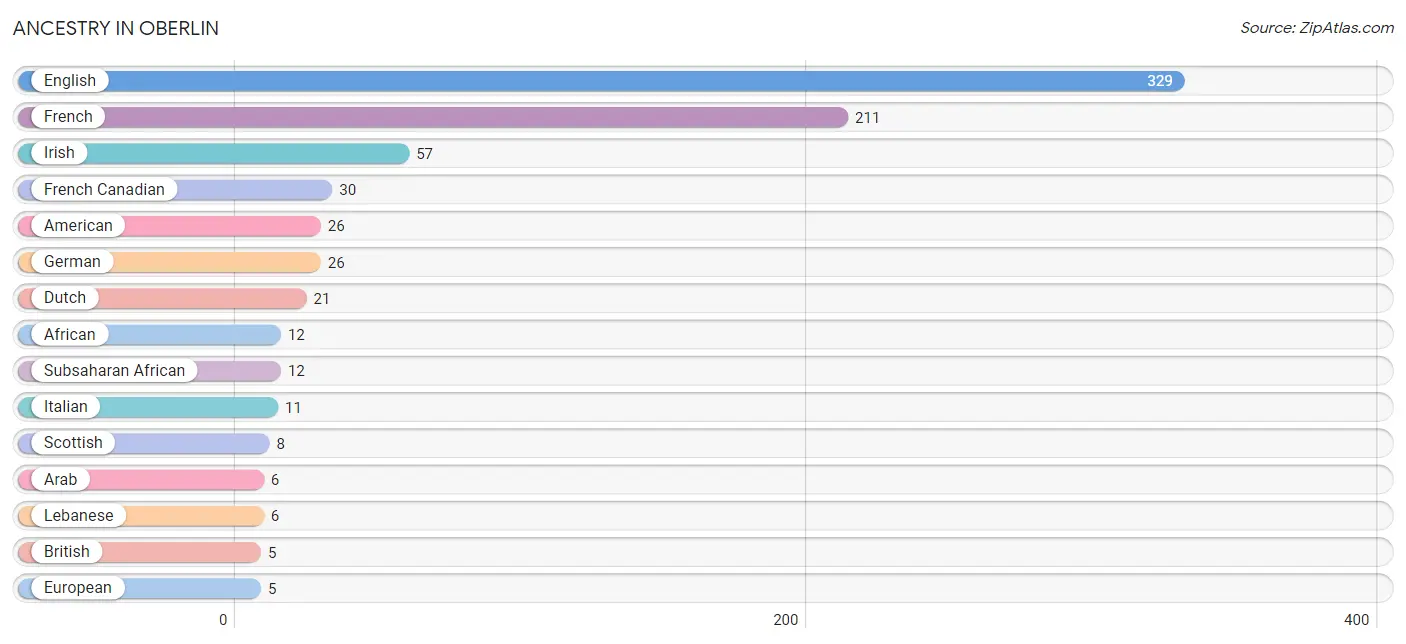
| Ancestry | # Population | % Population |
| African | 12 | 0.7% |
| American | 26 | 1.5% |
| Arab | 6 | 0.4% |
| British | 5 | 0.3% |
| Dutch | 21 | 1.3% |
| English | 329 | 19.6% |
| European | 5 | 0.3% |
| French | 211 | 12.6% |
| French Canadian | 30 | 1.8% |
| German | 26 | 1.5% |
| Irish | 57 | 3.4% |
| Italian | 11 | 0.7% |
| Lebanese | 6 | 0.4% |
| Scottish | 8 | 0.5% |
| Subsaharan African | 12 | 0.7% | View All 15 Rows |
Immigrants in Oberlin
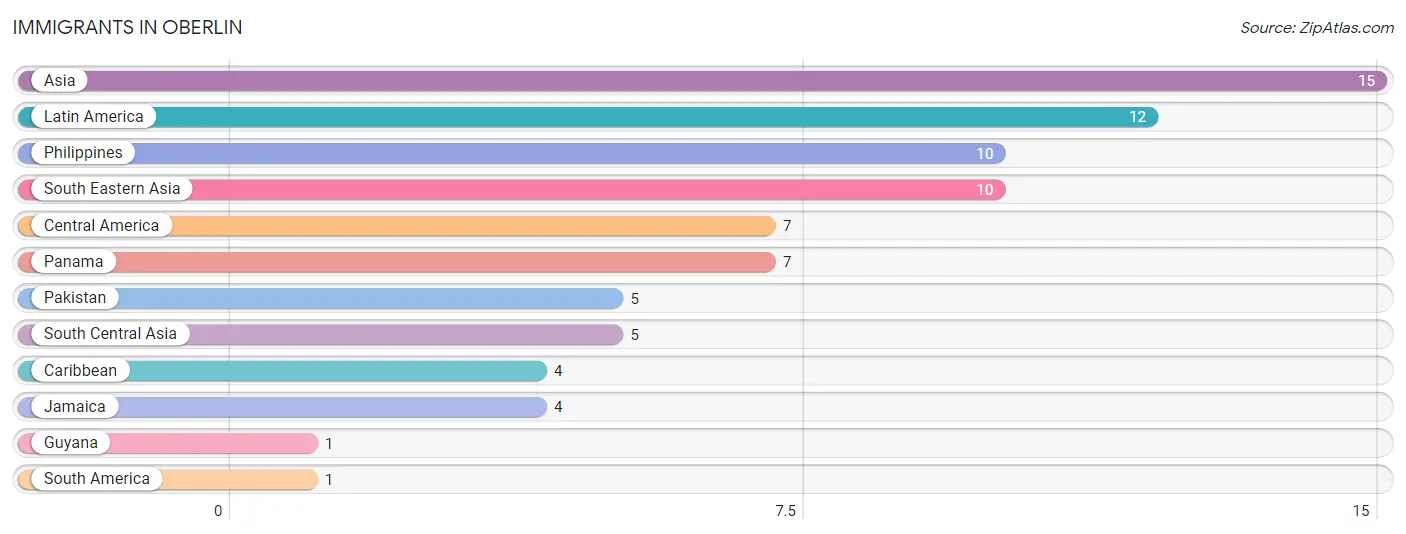
The most numerous immigrant groups reported in Oberlin came from Asia (15 | 0.9%), Latin America (12 | 0.7%), Philippines (10 | 0.6%), South Eastern Asia (10 | 0.6%), and Central America (7 | 0.4%), together accounting for 3.2% of all Oberlin residents.
| Immigration Origin | # Population | % Population |
| Asia | 15 | 0.9% |
| Caribbean | 4 | 0.2% |
| Central America | 7 | 0.4% |
| Guyana | 1 | 0.1% |
| Jamaica | 4 | 0.2% |
| Latin America | 12 | 0.7% |
| Pakistan | 5 | 0.3% |
| Panama | 7 | 0.4% |
| Philippines | 10 | 0.6% |
| South America | 1 | 0.1% |
| South Central Asia | 5 | 0.3% |
| South Eastern Asia | 10 | 0.6% | View All 12 Rows |
Sex and Age in Oberlin
Sex and Age in Oberlin
The most populous age groups in Oberlin are Under 5 Years (163 | 20.8%) for men and 10 to 14 Years (109 | 12.2%) for women.
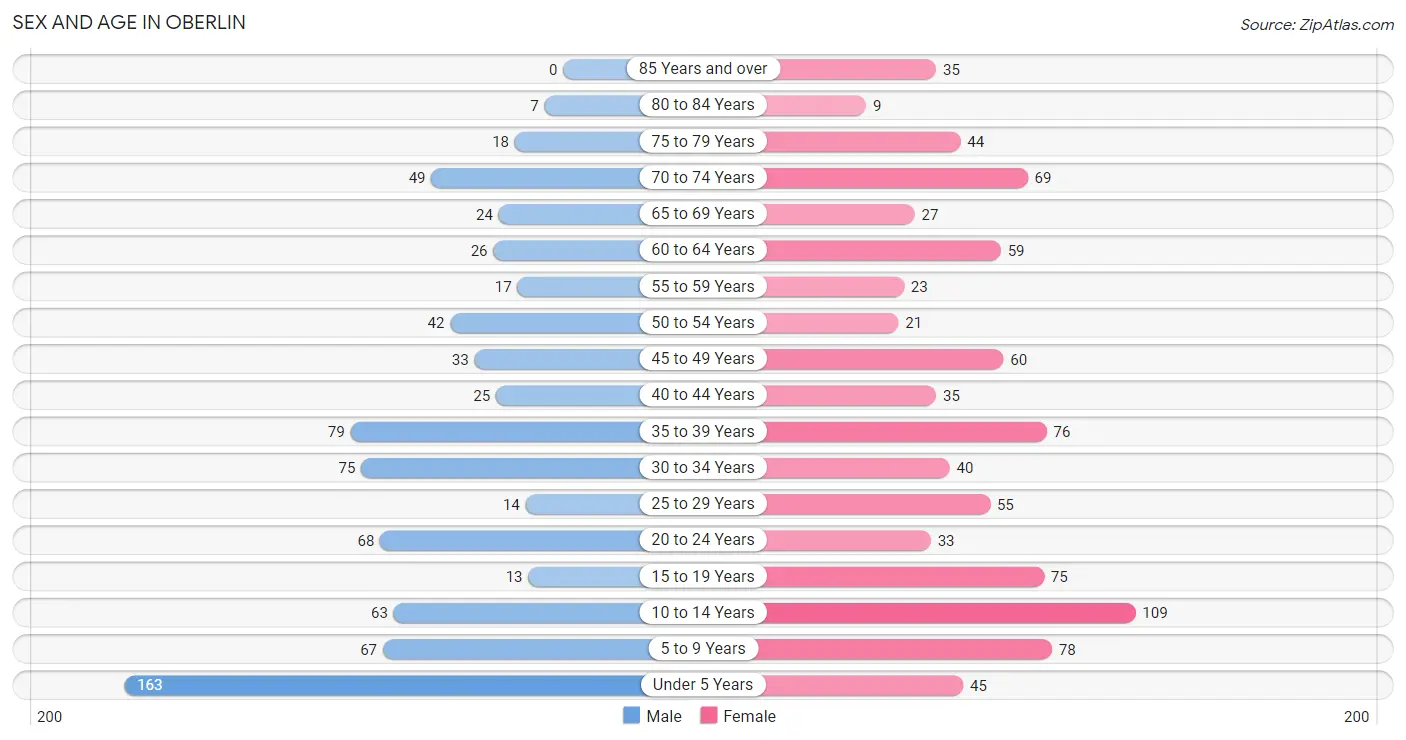
| Age Bracket | Male | Female |
| Under 5 Years | 163 (20.8%) | 45 (5.0%) |
| 5 to 9 Years | 67 (8.6%) | 78 (8.7%) |
| 10 to 14 Years | 63 (8.1%) | 109 (12.2%) |
| 15 to 19 Years | 13 (1.7%) | 75 (8.4%) |
| 20 to 24 Years | 68 (8.7%) | 33 (3.7%) |
| 25 to 29 Years | 14 (1.8%) | 55 (6.2%) |
| 30 to 34 Years | 75 (9.6%) | 40 (4.5%) |
| 35 to 39 Years | 79 (10.1%) | 76 (8.5%) |
| 40 to 44 Years | 25 (3.2%) | 35 (3.9%) |
| 45 to 49 Years | 33 (4.2%) | 60 (6.7%) |
| 50 to 54 Years | 42 (5.4%) | 21 (2.4%) |
| 55 to 59 Years | 17 (2.2%) | 23 (2.6%) |
| 60 to 64 Years | 26 (3.3%) | 59 (6.6%) |
| 65 to 69 Years | 24 (3.1%) | 27 (3.0%) |
| 70 to 74 Years | 49 (6.3%) | 69 (7.7%) |
| 75 to 79 Years | 18 (2.3%) | 44 (4.9%) |
| 80 to 84 Years | 7 (0.9%) | 9 (1.0%) |
| 85 Years and over | 0 (0.0%) | 35 (3.9%) |
| Total | 783 (100.0%) | 893 (100.0%) |
Families and Households in Oberlin
Median Family Size in Oberlin
The median family size in Oberlin is 3.66 persons per family, with single male/father families (57 | 16.3%) accounting for the largest median family size of 4.51 persons per family. On the other hand, single female/mother families (81 | 23.2%) represent the smallest median family size with 3.01 persons per family.
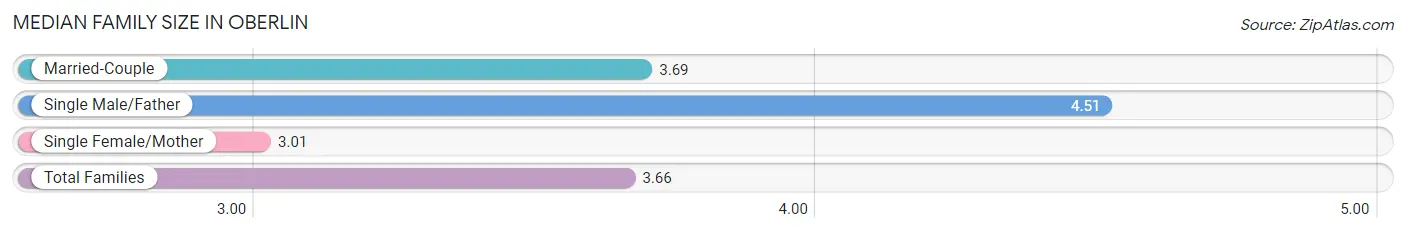
| Family Type | # Families | Family Size |
| Married-Couple | 211 (60.5%) | 3.69 |
| Single Male/Father | 57 (16.3%) | 4.51 |
| Single Female/Mother | 81 (23.2%) | 3.01 |
| Total Families | 349 (100.0%) | 3.66 |
Median Household Size in Oberlin
The median household size in Oberlin is 2.80 persons per household, with single male/father households (57 | 10.1%) accounting for the largest median household size of 5.65 persons per household. non-family households (218 | 38.5%) represent the smallest median household size with 1.11 persons per household.
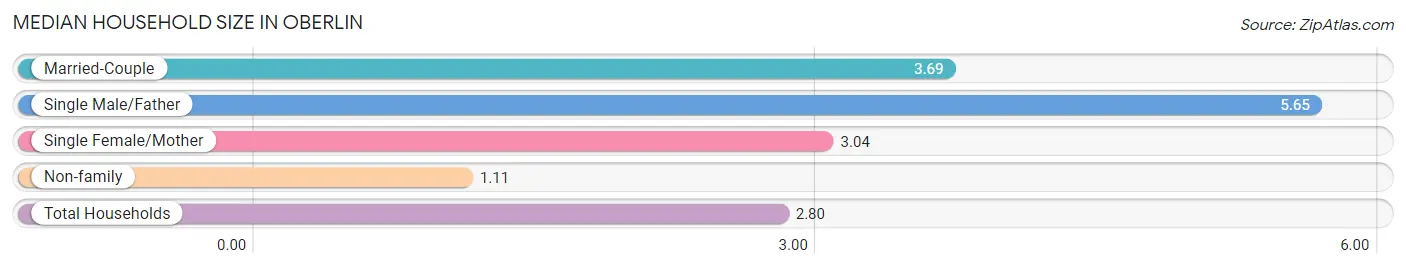
| Household Type | # Households | Household Size |
| Married-Couple | 211 (37.2%) | 3.69 |
| Single Male/Father | 57 (10.1%) | 5.65 |
| Single Female/Mother | 81 (14.3%) | 3.04 |
| Non-family | 218 (38.5%) | 1.11 |
| Total Households | 567 (100.0%) | 2.80 |
Household Size by Marriage Status in Oberlin
Out of a total of 567 households in Oberlin, 349 (61.6%) are family households, while 218 (38.5%) are nonfamily households. The most numerous type of family households are 2-person households, comprising 114, and the most common type of nonfamily households are 1-person households, comprising 207.
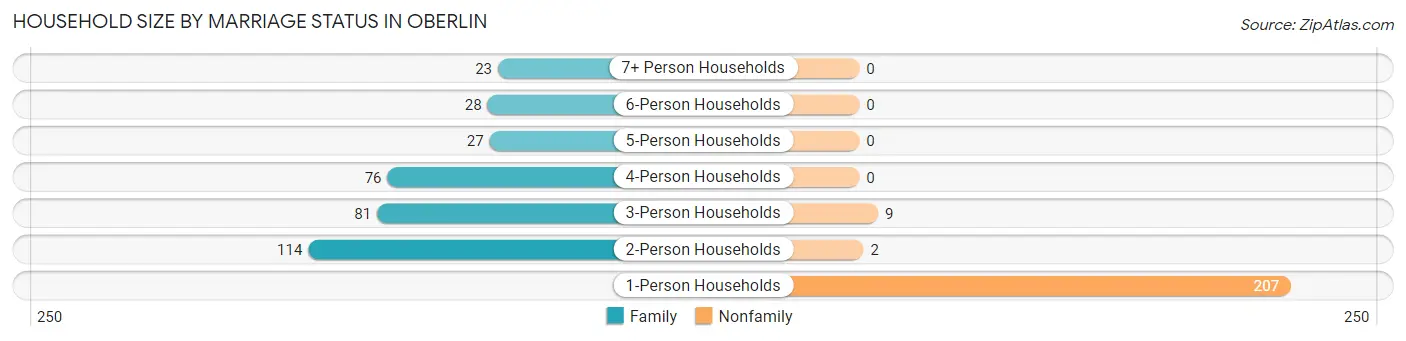
| Household Size | Family Households | Nonfamily Households |
| 1-Person Households | - | 207 (36.5%) |
| 2-Person Households | 114 (20.1%) | 2 (0.4%) |
| 3-Person Households | 81 (14.3%) | 9 (1.6%) |
| 4-Person Households | 76 (13.4%) | 0 (0.0%) |
| 5-Person Households | 27 (4.8%) | 0 (0.0%) |
| 6-Person Households | 28 (4.9%) | 0 (0.0%) |
| 7+ Person Households | 23 (4.1%) | 0 (0.0%) |
| Total | 349 (61.6%) | 218 (38.5%) |
Female Fertility in Oberlin
Fertility by Age in Oberlin
Average fertility rate in Oberlin is 119.0 births per 1,000 women. Women in the age bracket of 20 to 34 years have the highest fertility rate with 359.0 births per 1,000 women. Women in the age bracket of 20 to 34 years acount for 100.0% of all women with births.
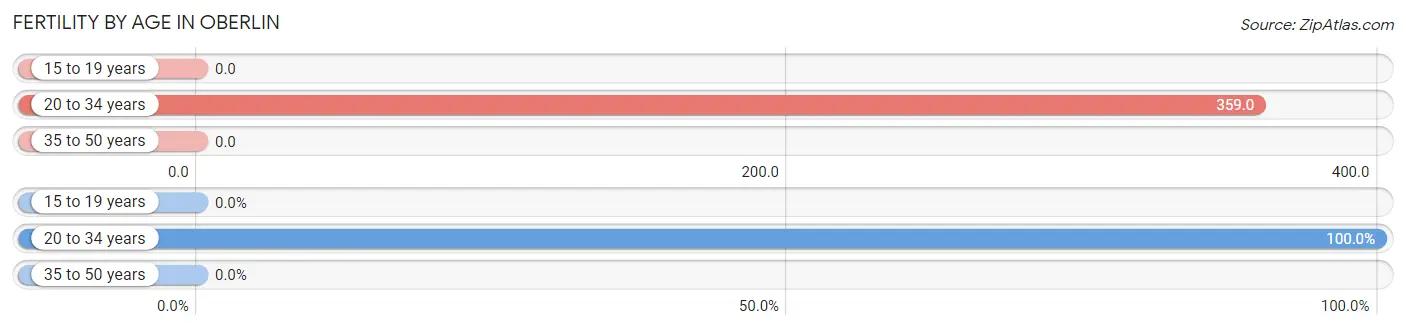
| Age Bracket | Women with Births | Births / 1,000 Women |
| 15 to 19 years | 0 (0.0%) | 0.0 |
| 20 to 34 years | 46 (100.0%) | 359.0 |
| 35 to 50 years | 0 (0.0%) | 0.0 |
| Total | 46 (100.0%) | 119.0 |
Fertility by Age by Marriage Status in Oberlin
73.9% of women with births (46) in Oberlin are married. The highest percentage of unmarried women with births falls into 20 to 34 years age bracket with 26.1% of them unmarried at the time of birth, while the lowest percentage of unmarried women with births belong to 20 to 34 years age bracket with 26.1% of them unmarried.
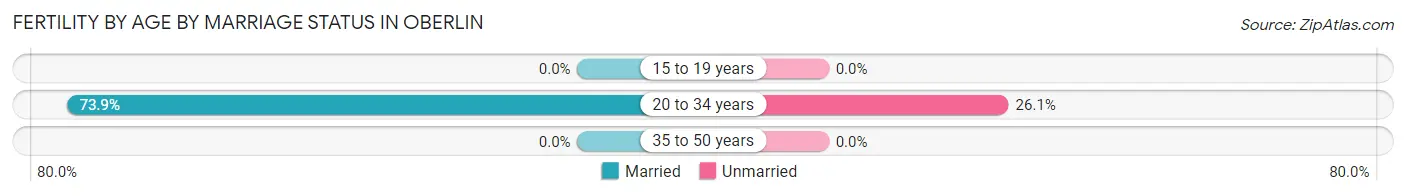
| Age Bracket | Married | Unmarried |
| 15 to 19 years | 0 (0.0%) | 0 (0.0%) |
| 20 to 34 years | 34 (73.9%) | 12 (26.1%) |
| 35 to 50 years | 0 (0.0%) | 0 (0.0%) |
| Total | 34 (73.9%) | 12 (26.1%) |
Fertility by Education in Oberlin
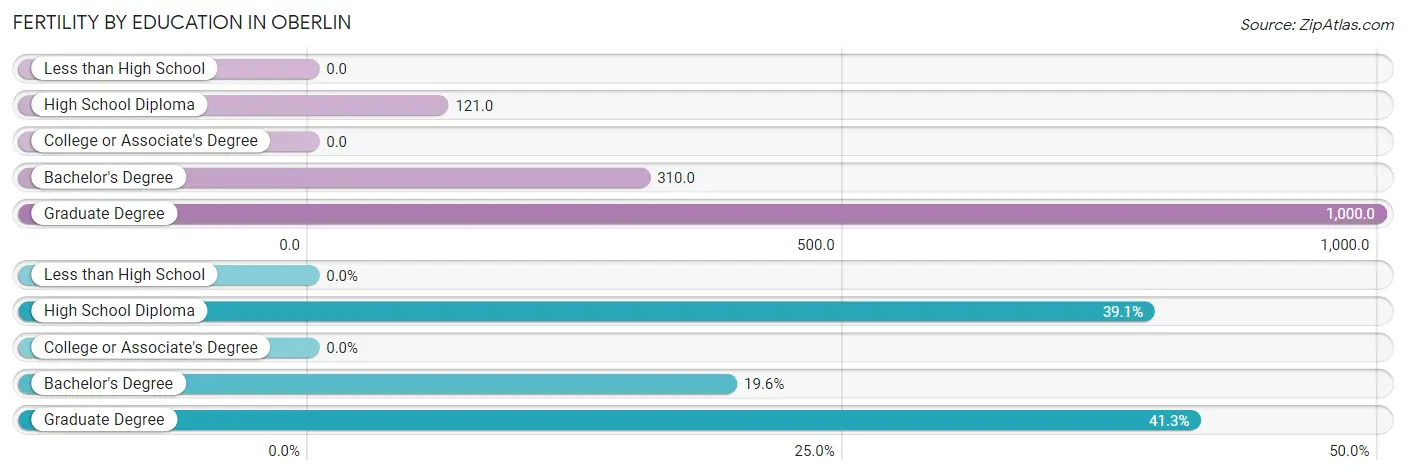
| Educational Attainment | Women with Births | Births / 1,000 Women |
| Less than High School | 0 (0.0%) | 0.0 |
| High School Diploma | 18 (39.1%) | 121.0 |
| College or Associate's Degree | 0 (0.0%) | 0.0 |
| Bachelor's Degree | 9 (19.6%) | 310.0 |
| Graduate Degree | 19 (41.3%) | 1,000.0 |
| Total | 46 (100.0%) | 119.0 |
Fertility by Education by Marriage Status in Oberlin
26.1% of women with births in Oberlin are unmarried. Women with the educational attainment of bachelor's degree are most likely to be married with 100.0% of them married at childbirth, while women with the educational attainment of high school diploma are least likely to be married with 66.7% of them unmarried at childbirth.
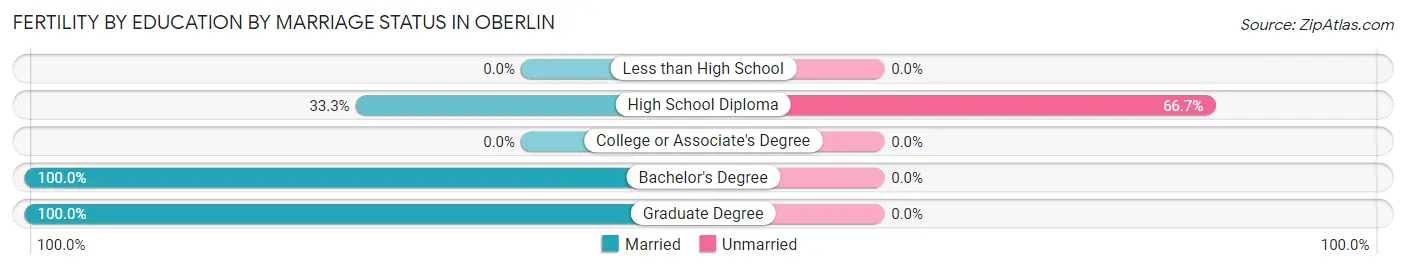
| Educational Attainment | Married | Unmarried |
| Less than High School | 0 (0.0%) | 0 (0.0%) |
| High School Diploma | 6 (33.3%) | 12 (66.7%) |
| College or Associate's Degree | 0 (0.0%) | 0 (0.0%) |
| Bachelor's Degree | 9 (100.0%) | 0 (0.0%) |
| Graduate Degree | 19 (100.0%) | 0 (0.0%) |
| Total | 34 (73.9%) | 12 (26.1%) |
Employment Characteristics in Oberlin
Employment by Class of Employer in Oberlin
Among the 448 employed individuals in Oberlin, private company employees (298 | 66.5%), local government employees (74 | 16.5%), and federal government employees (26 | 5.8%) make up the most common classes of employment.
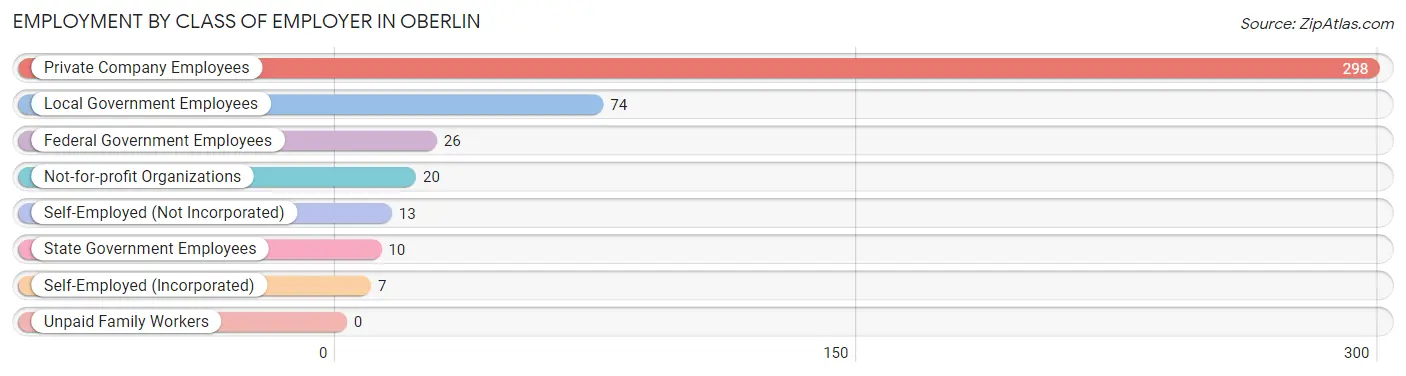
| Employer Class | # Employees | % Employees |
| Private Company Employees | 298 | 66.5% |
| Self-Employed (Incorporated) | 7 | 1.6% |
| Self-Employed (Not Incorporated) | 13 | 2.9% |
| Not-for-profit Organizations | 20 | 4.5% |
| Local Government Employees | 74 | 16.5% |
| State Government Employees | 10 | 2.2% |
| Federal Government Employees | 26 | 5.8% |
| Unpaid Family Workers | 0 | 0.0% |
| Total | 448 | 100.0% |
Employment Status by Age in Oberlin
According to the labor force statistics for Oberlin, out of the total population over 16 years of age (1,145), 40.9% or 468 individuals are in the labor force, with 1.7% or 8 of them unemployed. The age group with the highest labor force participation rate is 25 to 29 years, with 84.1% or 58 individuals in the labor force. Within the labor force, the 45 to 54 years age range has the highest percentage of unemployed individuals, with 6.9% or 8 of them being unemployed.
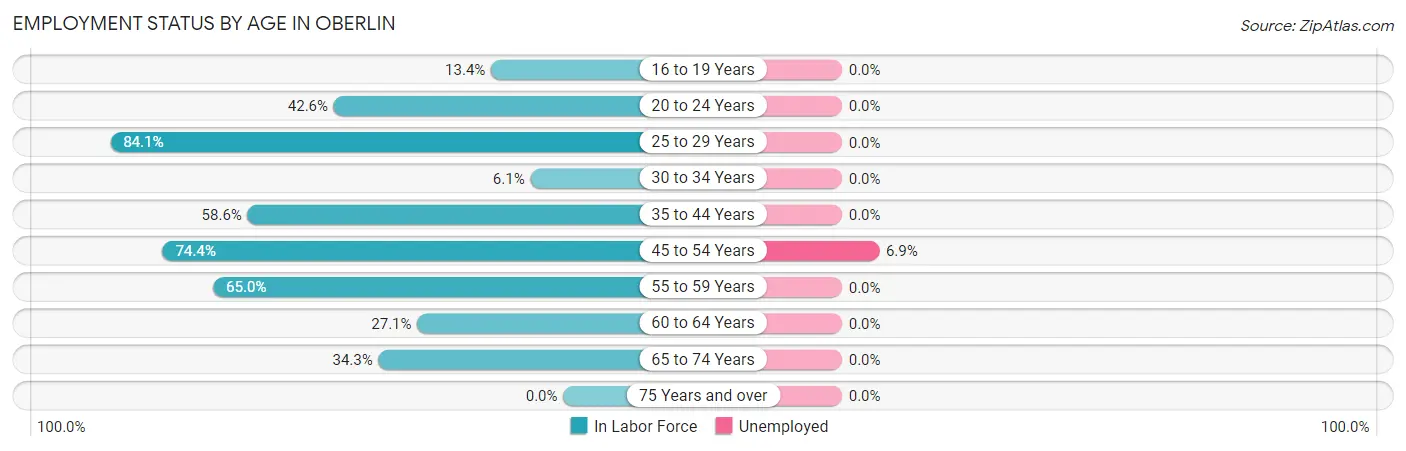
| Age Bracket | In Labor Force | Unemployed |
| 16 to 19 Years | 11 (13.4%) | 0 (0.0%) |
| 20 to 24 Years | 43 (42.6%) | 0 (0.0%) |
| 25 to 29 Years | 58 (84.1%) | 0 (0.0%) |
| 30 to 34 Years | 7 (6.1%) | 0 (0.0%) |
| 35 to 44 Years | 126 (58.6%) | 0 (0.0%) |
| 45 to 54 Years | 116 (74.4%) | 8 (6.9%) |
| 55 to 59 Years | 26 (65.0%) | 0 (0.0%) |
| 60 to 64 Years | 23 (27.1%) | 0 (0.0%) |
| 65 to 74 Years | 58 (34.3%) | 0 (0.0%) |
| 75 Years and over | 0 (0.0%) | 0 (0.0%) |
| Total | 468 (40.9%) | 8 (1.7%) |
Employment Status by Educational Attainment in Oberlin
According to labor force statistics for Oberlin, 52.4% of individuals (356) out of the total population between 25 and 64 years of age (680) are in the labor force, with 2.2% or 8 of them being unemployed. The group with the highest labor force participation rate are those with the educational attainment of college / associate degree, with 86.1% or 186 individuals in the labor force. Within the labor force, individuals with high school diploma education have the highest percentage of unemployment, with 8.2% or 8 of them being unemployed.
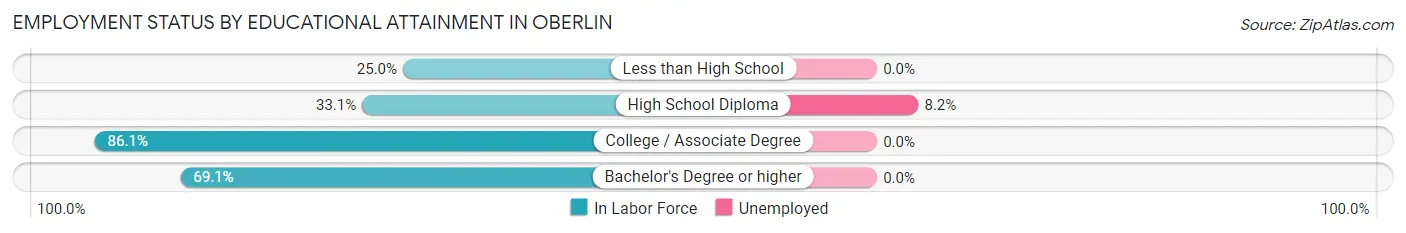
| Educational Attainment | In Labor Force | Unemployed |
| Less than High School | 25 (25.0%) | 0 (0.0%) |
| High School Diploma | 98 (33.1%) | 24 (8.2%) |
| College / Associate Degree | 186 (86.1%) | 0 (0.0%) |
| Bachelor's Degree or higher | 47 (69.1%) | 0 (0.0%) |
| Total | 356 (52.4%) | 15 (2.2%) |
Employment Occupations by Sex in Oberlin
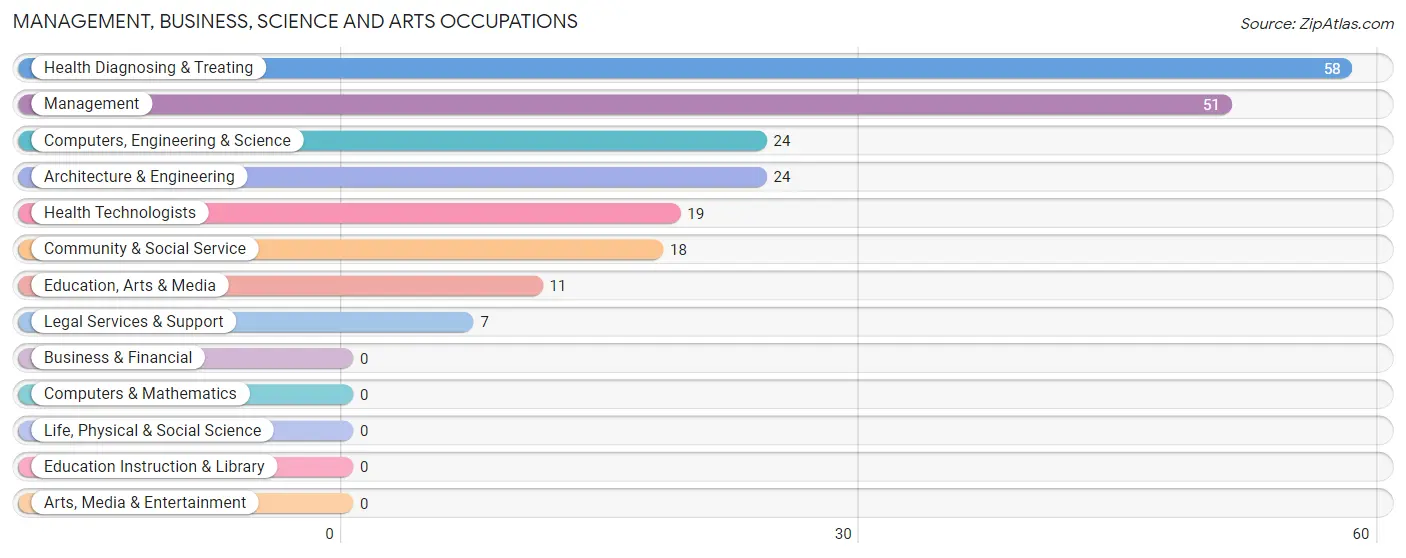
Management, Business, Science and Arts Occupations
The most common Management, Business, Science and Arts occupations in Oberlin are Health Diagnosing & Treating (58 | 12.6%), Management (51 | 11.1%), Computers, Engineering & Science (24 | 5.2%), Architecture & Engineering (24 | 5.2%), and Health Technologists (19 | 4.1%).
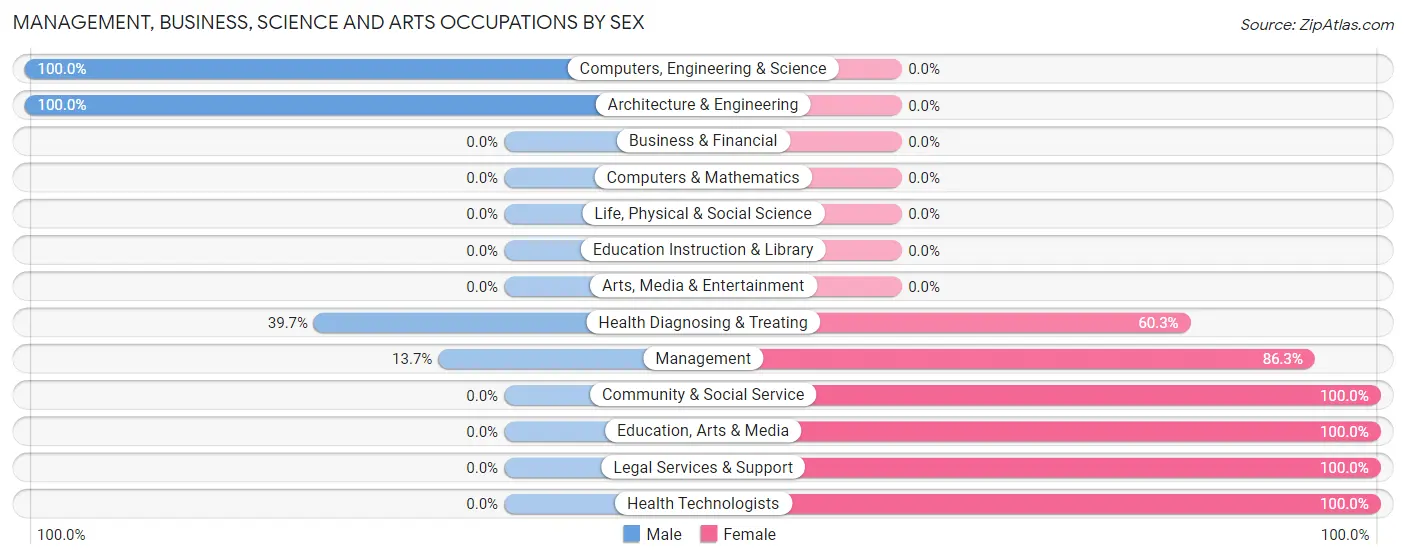
Management, Business, Science and Arts Occupations by Sex
Within the Management, Business, Science and Arts occupations in Oberlin, the most male-oriented occupations are Computers, Engineering & Science (100.0%), Architecture & Engineering (100.0%), and Health Diagnosing & Treating (39.7%), while the most female-oriented occupations are Community & Social Service (100.0%), Education, Arts & Media (100.0%), and Legal Services & Support (100.0%).
| Occupation | Male | Female |
| Management | 7 (13.7%) | 44 (86.3%) |
| Business & Financial | 0 (0.0%) | 0 (0.0%) |
| Computers, Engineering & Science | 24 (100.0%) | 0 (0.0%) |
| Computers & Mathematics | 0 (0.0%) | 0 (0.0%) |
| Architecture & Engineering | 24 (100.0%) | 0 (0.0%) |
| Life, Physical & Social Science | 0 (0.0%) | 0 (0.0%) |
| Community & Social Service | 0 (0.0%) | 18 (100.0%) |
| Education, Arts & Media | 0 (0.0%) | 11 (100.0%) |
| Legal Services & Support | 0 (0.0%) | 7 (100.0%) |
| Education Instruction & Library | 0 (0.0%) | 0 (0.0%) |
| Arts, Media & Entertainment | 0 (0.0%) | 0 (0.0%) |
| Health Diagnosing & Treating | 23 (39.7%) | 35 (60.3%) |
| Health Technologists | 0 (0.0%) | 19 (100.0%) |
| Total (Category) | 54 (35.8%) | 97 (64.2%) |
| Total (Overall) | 191 (41.5%) | 269 (58.5%) |
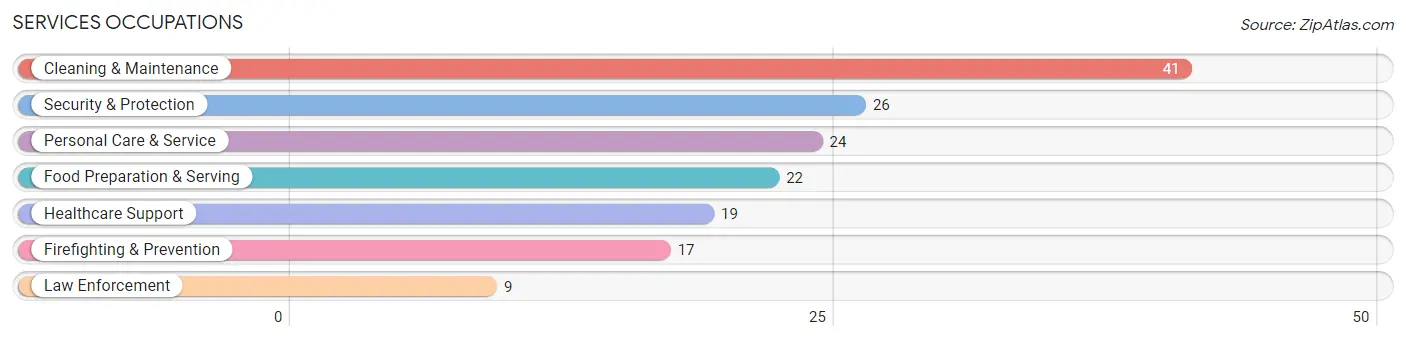
Services Occupations
The most common Services occupations in Oberlin are Cleaning & Maintenance (41 | 8.9%), Security & Protection (26 | 5.7%), Personal Care & Service (24 | 5.2%), Food Preparation & Serving (22 | 4.8%), and Healthcare Support (19 | 4.1%).
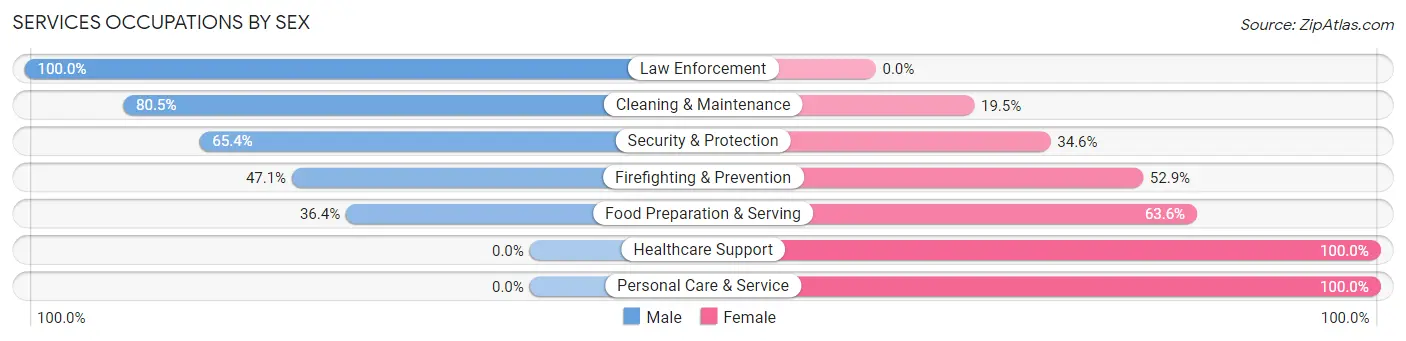
Services Occupations by Sex
Within the Services occupations in Oberlin, the most male-oriented occupations are Law Enforcement (100.0%), Cleaning & Maintenance (80.5%), and Security & Protection (65.4%), while the most female-oriented occupations are Healthcare Support (100.0%), Personal Care & Service (100.0%), and Food Preparation & Serving (63.6%).
| Occupation | Male | Female |
| Healthcare Support | 0 (0.0%) | 19 (100.0%) |
| Security & Protection | 17 (65.4%) | 9 (34.6%) |
| Firefighting & Prevention | 8 (47.1%) | 9 (52.9%) |
| Law Enforcement | 9 (100.0%) | 0 (0.0%) |
| Food Preparation & Serving | 8 (36.4%) | 14 (63.6%) |
| Cleaning & Maintenance | 33 (80.5%) | 8 (19.5%) |
| Personal Care & Service | 0 (0.0%) | 24 (100.0%) |
| Total (Category) | 58 (43.9%) | 74 (56.1%) |
| Total (Overall) | 191 (41.5%) | 269 (58.5%) |
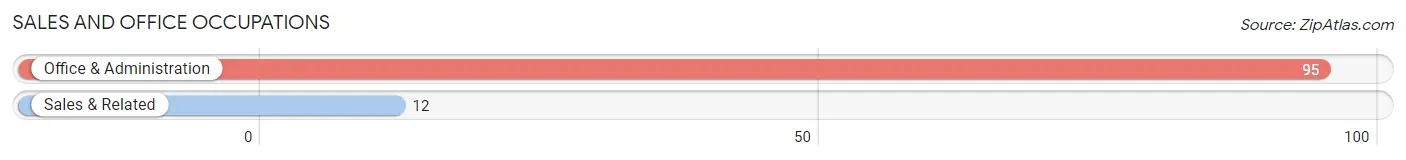
Sales and Office Occupations
The most common Sales and Office occupations in Oberlin are Office & Administration (95 | 20.6%), and Sales & Related (12 | 2.6%).
Sales and Office Occupations by Sex
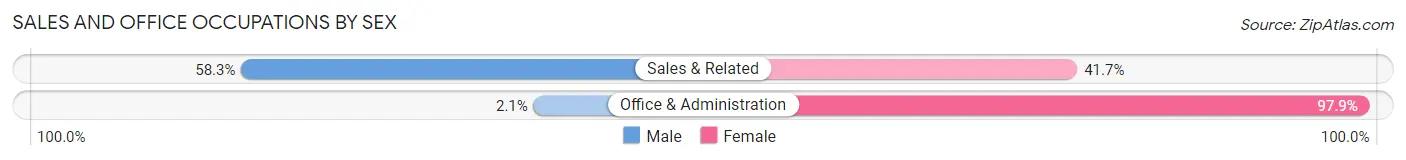
| Occupation | Male | Female |
| Sales & Related | 7 (58.3%) | 5 (41.7%) |
| Office & Administration | 2 (2.1%) | 93 (97.9%) |
| Total (Category) | 9 (8.4%) | 98 (91.6%) |
| Total (Overall) | 191 (41.5%) | 269 (58.5%) |
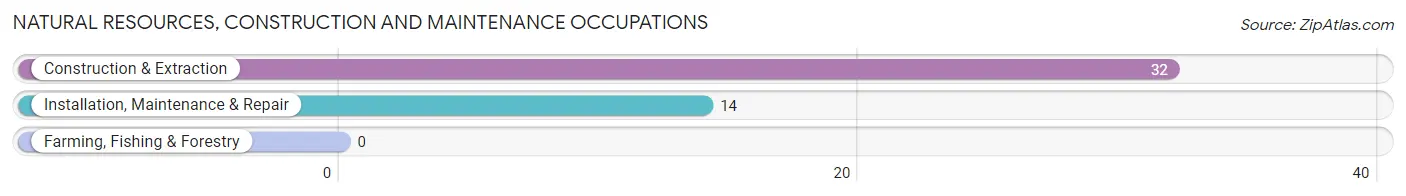
Natural Resources, Construction and Maintenance Occupations
The most common Natural Resources, Construction and Maintenance occupations in Oberlin are Construction & Extraction (32 | 7.0%), and Installation, Maintenance & Repair (14 | 3.0%).
Natural Resources, Construction and Maintenance Occupations by Sex
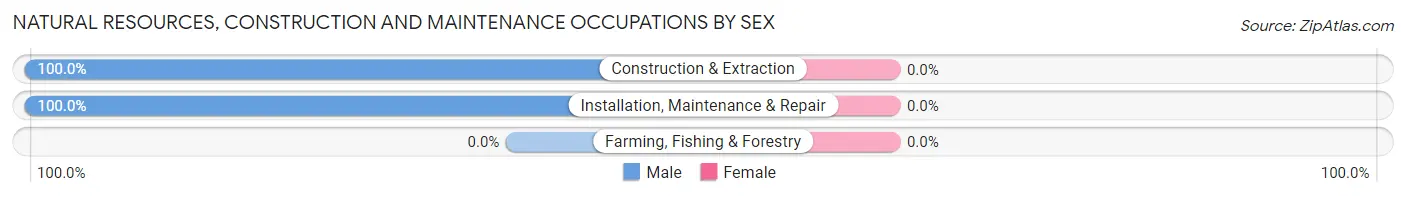
| Occupation | Male | Female |
| Farming, Fishing & Forestry | 0 (0.0%) | 0 (0.0%) |
| Construction & Extraction | 32 (100.0%) | 0 (0.0%) |
| Installation, Maintenance & Repair | 14 (100.0%) | 0 (0.0%) |
| Total (Category) | 46 (100.0%) | 0 (0.0%) |
| Total (Overall) | 191 (41.5%) | 269 (58.5%) |
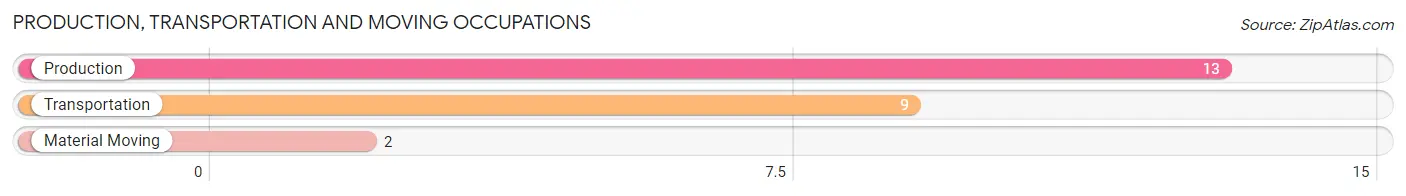
Production, Transportation and Moving Occupations
The most common Production, Transportation and Moving occupations in Oberlin are Production (13 | 2.8%), Transportation (9 | 2.0%), and Material Moving (2 | 0.4%).
Production, Transportation and Moving Occupations by Sex
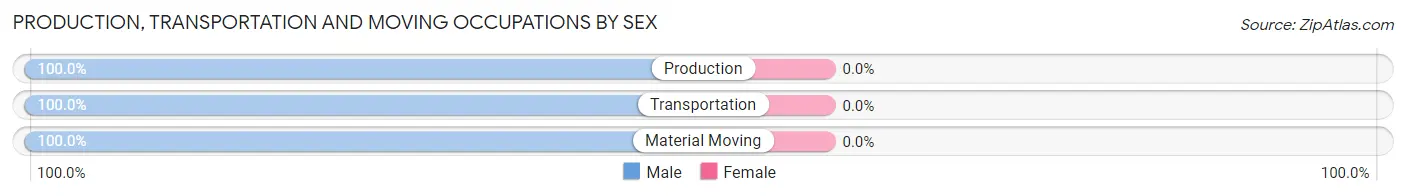
| Occupation | Male | Female |
| Production | 13 (100.0%) | 0 (0.0%) |
| Transportation | 9 (100.0%) | 0 (0.0%) |
| Material Moving | 2 (100.0%) | 0 (0.0%) |
| Total (Category) | 24 (100.0%) | 0 (0.0%) |
| Total (Overall) | 191 (41.5%) | 269 (58.5%) |
Employment Industries by Sex in Oberlin
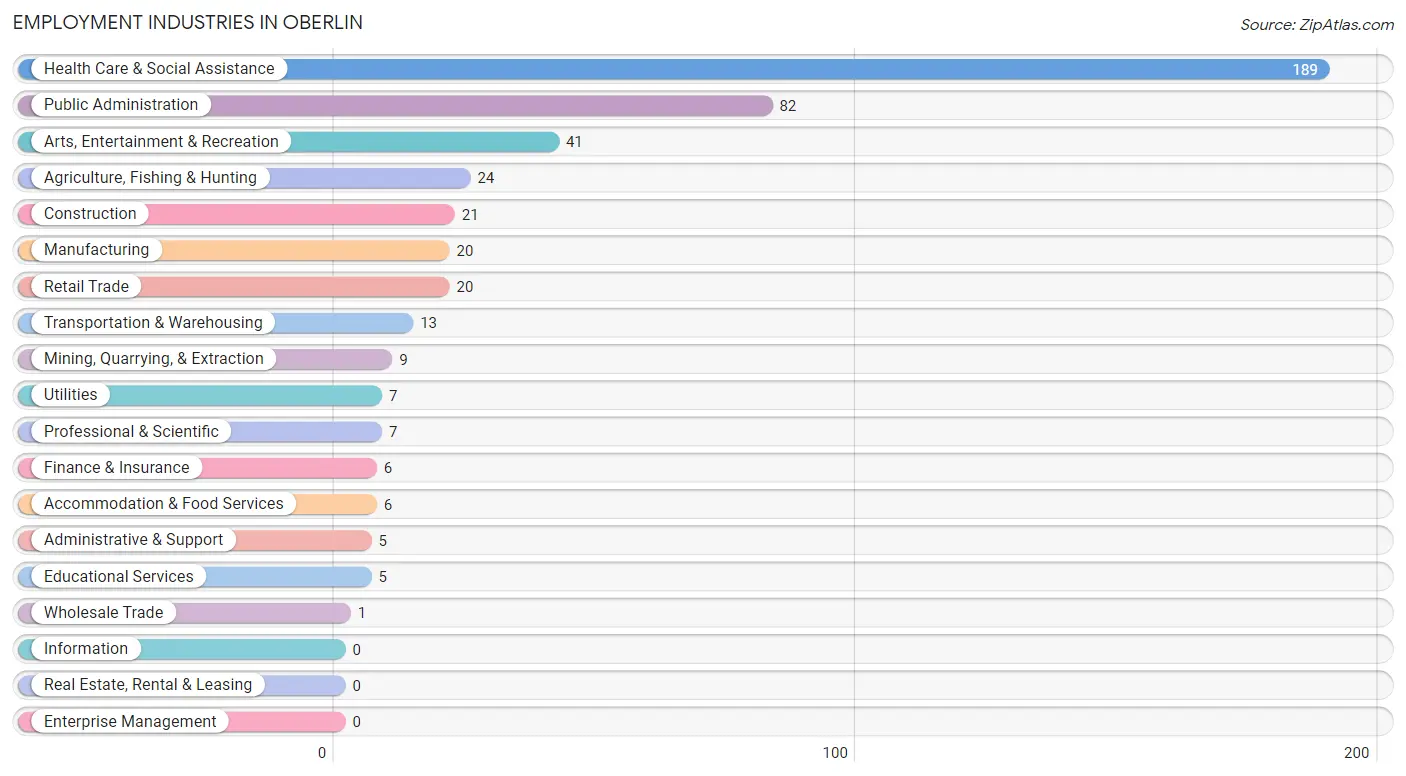
Employment Industries in Oberlin
The major employment industries in Oberlin include Health Care & Social Assistance (189 | 41.1%), Public Administration (82 | 17.8%), Arts, Entertainment & Recreation (41 | 8.9%), Agriculture, Fishing & Hunting (24 | 5.2%), and Construction (21 | 4.6%).
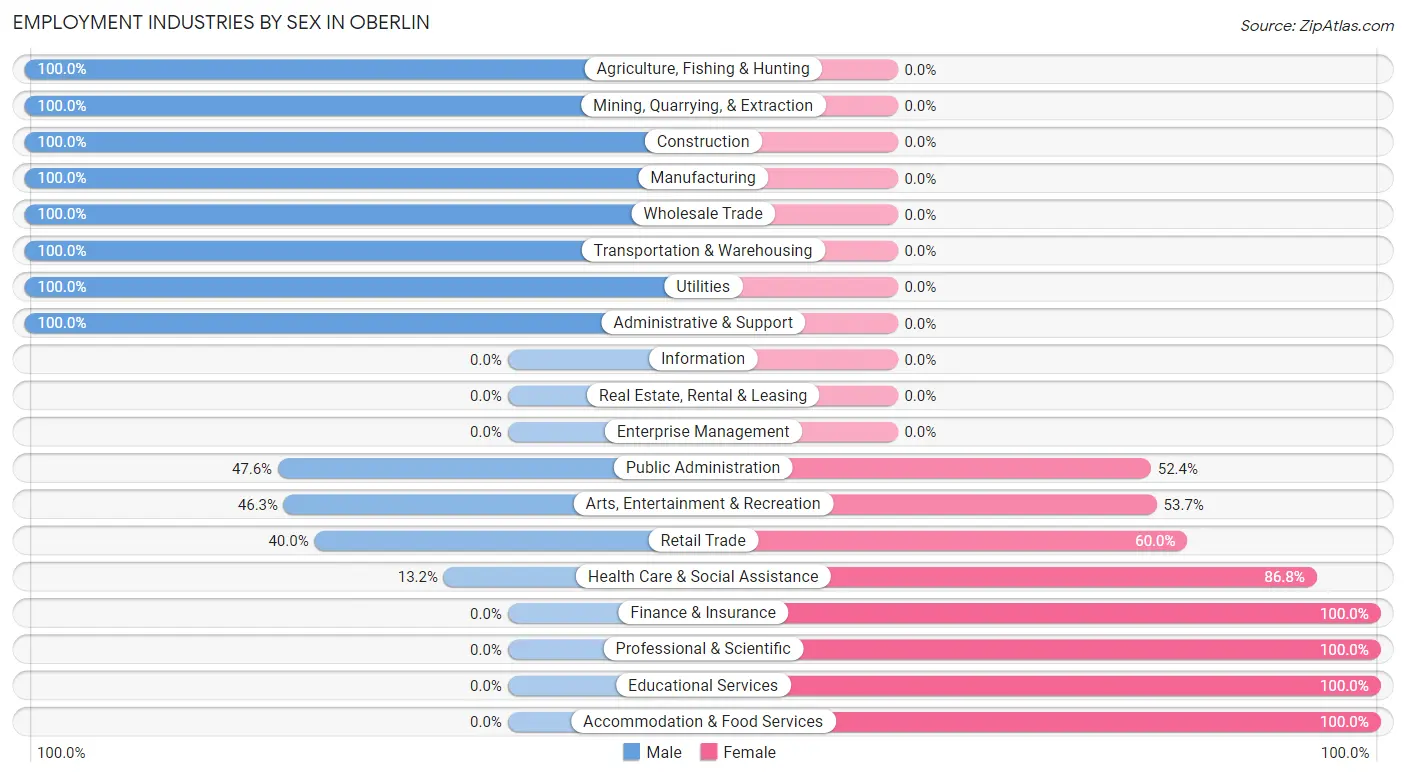
Employment Industries by Sex in Oberlin
The Oberlin industries that see more men than women are Agriculture, Fishing & Hunting (100.0%), Mining, Quarrying, & Extraction (100.0%), and Construction (100.0%), whereas the industries that tend to have a higher number of women are Finance & Insurance (100.0%), Professional & Scientific (100.0%), and Educational Services (100.0%).
| Industry | Male | Female |
| Agriculture, Fishing & Hunting | 24 (100.0%) | 0 (0.0%) |
| Mining, Quarrying, & Extraction | 9 (100.0%) | 0 (0.0%) |
| Construction | 21 (100.0%) | 0 (0.0%) |
| Manufacturing | 20 (100.0%) | 0 (0.0%) |
| Wholesale Trade | 1 (100.0%) | 0 (0.0%) |
| Retail Trade | 8 (40.0%) | 12 (60.0%) |
| Transportation & Warehousing | 13 (100.0%) | 0 (0.0%) |
| Utilities | 7 (100.0%) | 0 (0.0%) |
| Information | 0 (0.0%) | 0 (0.0%) |
| Finance & Insurance | 0 (0.0%) | 6 (100.0%) |
| Real Estate, Rental & Leasing | 0 (0.0%) | 0 (0.0%) |
| Professional & Scientific | 0 (0.0%) | 7 (100.0%) |
| Enterprise Management | 0 (0.0%) | 0 (0.0%) |
| Administrative & Support | 5 (100.0%) | 0 (0.0%) |
| Educational Services | 0 (0.0%) | 5 (100.0%) |
| Health Care & Social Assistance | 25 (13.2%) | 164 (86.8%) |
| Arts, Entertainment & Recreation | 19 (46.3%) | 22 (53.7%) |
| Accommodation & Food Services | 0 (0.0%) | 6 (100.0%) |
| Public Administration | 39 (47.6%) | 43 (52.4%) |
| Total | 191 (41.5%) | 269 (58.5%) |
Education in Oberlin
School Enrollment in Oberlin
The most common levels of schooling among the 486 students in Oberlin are middle school (132 | 27.2%), elementary school (121 | 24.9%), and high school (106 | 21.8%).
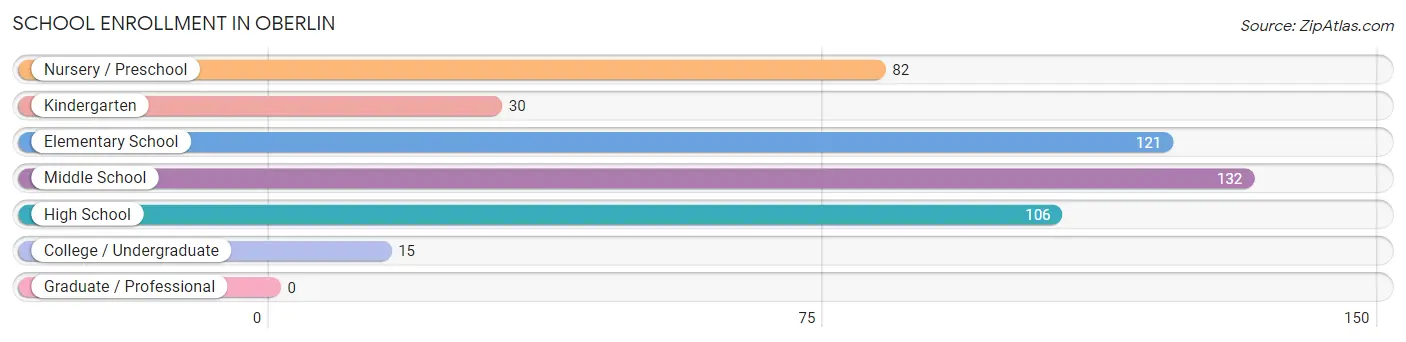
| School Level | # Students | % Students |
| Nursery / Preschool | 82 | 16.9% |
| Kindergarten | 30 | 6.2% |
| Elementary School | 121 | 24.9% |
| Middle School | 132 | 27.2% |
| High School | 106 | 21.8% |
| College / Undergraduate | 15 | 3.1% |
| Graduate / Professional | 0 | 0.0% |
| Total | 486 | 100.0% |
School Enrollment by Age by Funding Source in Oberlin
Out of a total of 486 students who are enrolled in schools in Oberlin, 49 (10.1%) attend a private institution, while the remaining 437 (89.9%) are enrolled in public schools. The age group of 18 to 19 year olds has the highest likelihood of being enrolled in private schools, with 3 (100.0% in the age bracket) enrolled. Conversely, the age group of 5 to 9 year old has the lowest likelihood of being enrolled in a private school, with 145 (100.0% in the age bracket) attending a public institution.
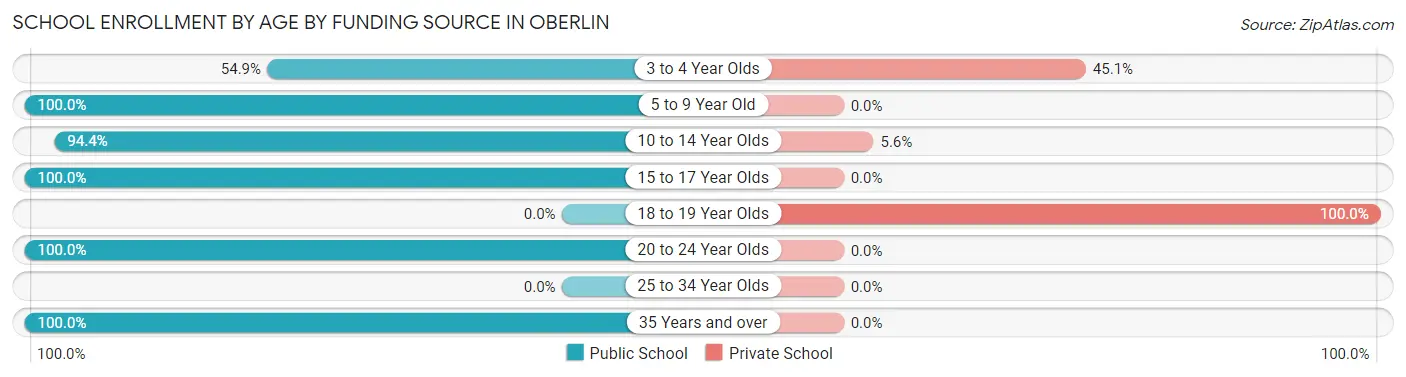
| Age Bracket | Public School | Private School |
| 3 to 4 Year Olds | 45 (54.9%) | 37 (45.1%) |
| 5 to 9 Year Old | 145 (100.0%) | 0 (0.0%) |
| 10 to 14 Year Olds | 153 (94.4%) | 9 (5.6%) |
| 15 to 17 Year Olds | 74 (100.0%) | 0 (0.0%) |
| 18 to 19 Year Olds | 0 (0.0%) | 3 (100.0%) |
| 20 to 24 Year Olds | 5 (100.0%) | 0 (0.0%) |
| 25 to 34 Year Olds | 0 (0.0%) | 0 (0.0%) |
| 35 Years and over | 15 (100.0%) | 0 (0.0%) |
| Total | 437 (89.9%) | 49 (10.1%) |
Educational Attainment by Field of Study in Oberlin
Education (39 | 42.4%), science & technology (28 | 30.4%), arts & humanities (10 | 10.9%), bio, nature & agricultural (7 | 7.6%), and business (7 | 7.6%) are the most common fields of study among 92 individuals in Oberlin who have obtained a bachelor's degree or higher.
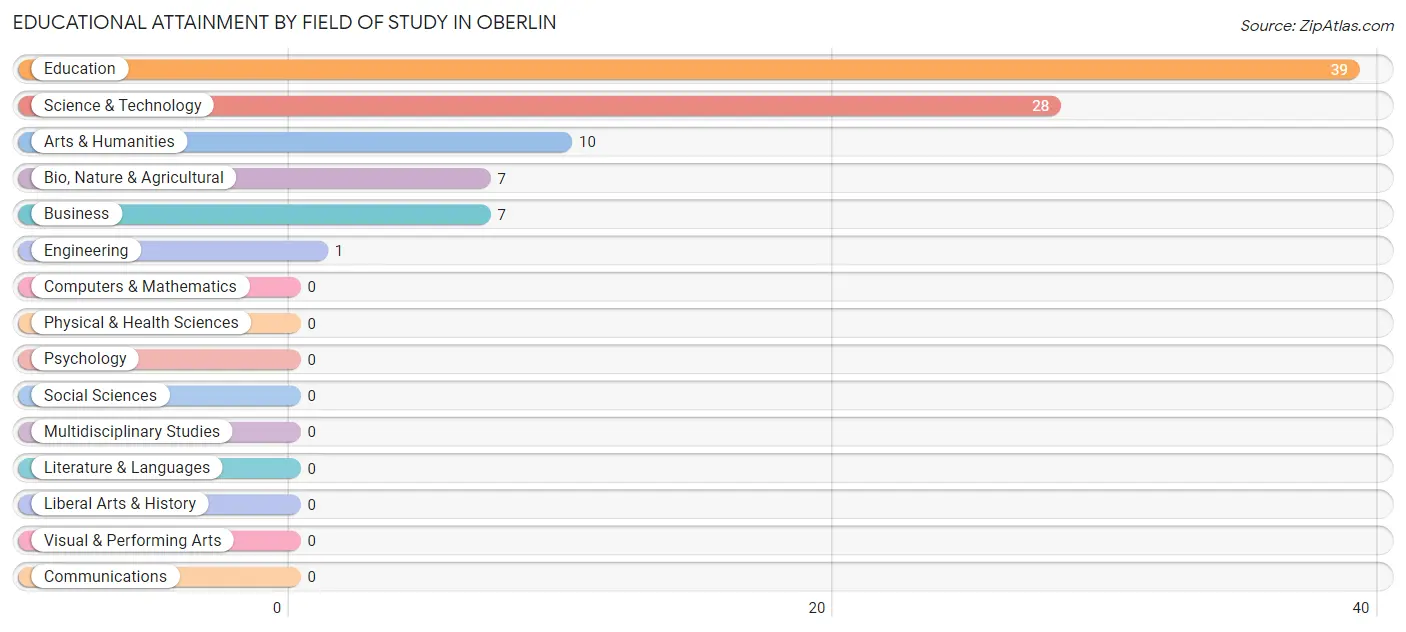
| Field of Study | # Graduates | % Graduates |
| Computers & Mathematics | 0 | 0.0% |
| Bio, Nature & Agricultural | 7 | 7.6% |
| Physical & Health Sciences | 0 | 0.0% |
| Psychology | 0 | 0.0% |
| Social Sciences | 0 | 0.0% |
| Engineering | 1 | 1.1% |
| Multidisciplinary Studies | 0 | 0.0% |
| Science & Technology | 28 | 30.4% |
| Business | 7 | 7.6% |
| Education | 39 | 42.4% |
| Literature & Languages | 0 | 0.0% |
| Liberal Arts & History | 0 | 0.0% |
| Visual & Performing Arts | 0 | 0.0% |
| Communications | 0 | 0.0% |
| Arts & Humanities | 10 | 10.9% |
| Total | 92 | 100.0% |
Transportation & Commute in Oberlin
Vehicle Availability by Sex in Oberlin
The most prevalent vehicle ownership categories in Oberlin are males with 2 vehicles (92, accounting for 48.2%) and females with 2 vehicles (95, making up 35.8%).
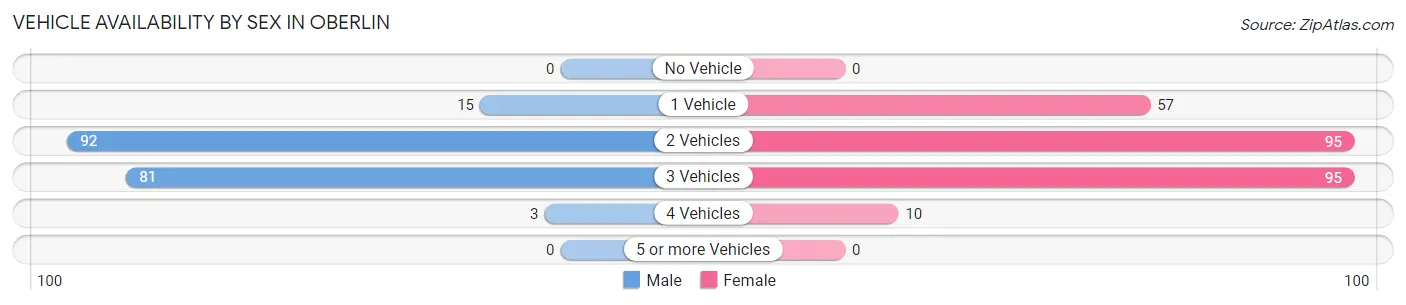
| Vehicles Available | Male | Female |
| No Vehicle | 0 (0.0%) | 0 (0.0%) |
| 1 Vehicle | 15 (7.9%) | 57 (22.2%) |
| 2 Vehicles | 92 (48.2%) | 95 (37.0%) |
| 3 Vehicles | 81 (42.4%) | 95 (37.0%) |
| 4 Vehicles | 3 (1.6%) | 10 (3.9%) |
| 5 or more Vehicles | 0 (0.0%) | 0 (0.0%) |
| Total | 191 (100.0%) | 257 (100.0%) |
Commute Time in Oberlin
The most frequently occuring commute durations in Oberlin are 5 to 9 minutes (78 commuters, 17.5%), less than 5 minutes (74 commuters, 16.6%), and 20 to 24 minutes (63 commuters, 14.2%).
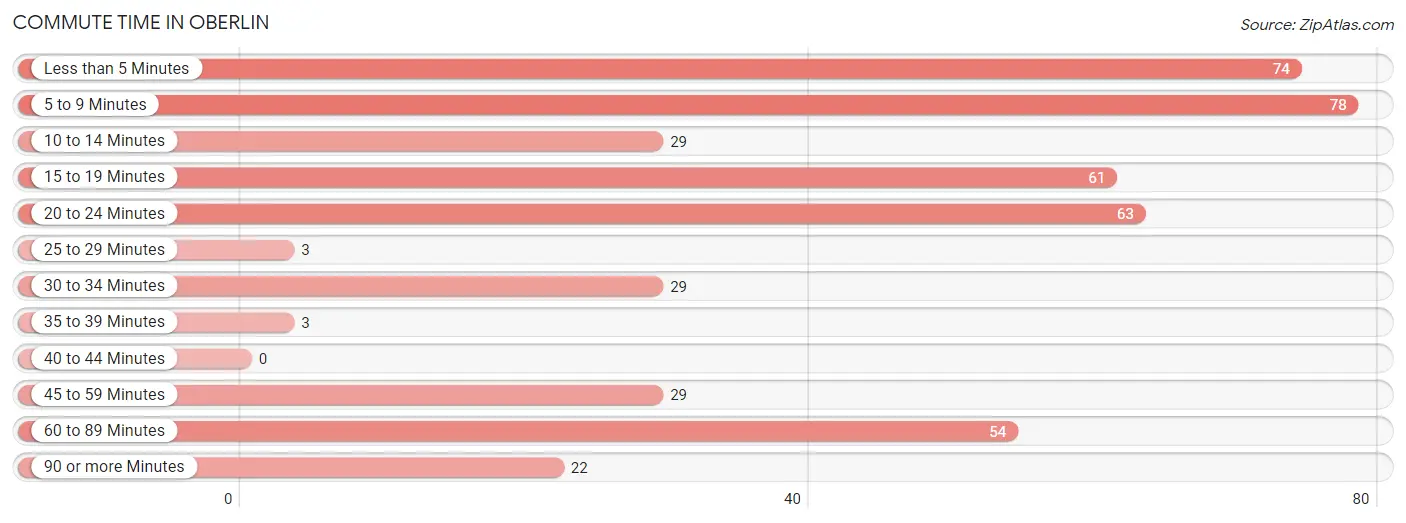
| Commute Time | # Commuters | % Commuters |
| Less than 5 Minutes | 74 | 16.6% |
| 5 to 9 Minutes | 78 | 17.5% |
| 10 to 14 Minutes | 29 | 6.5% |
| 15 to 19 Minutes | 61 | 13.7% |
| 20 to 24 Minutes | 63 | 14.2% |
| 25 to 29 Minutes | 3 | 0.7% |
| 30 to 34 Minutes | 29 | 6.5% |
| 35 to 39 Minutes | 3 | 0.7% |
| 40 to 44 Minutes | 0 | 0.0% |
| 45 to 59 Minutes | 29 | 6.5% |
| 60 to 89 Minutes | 54 | 12.1% |
| 90 or more Minutes | 22 | 4.9% |
Commute Time by Sex in Oberlin
The most common commute times in Oberlin are 60 to 89 minutes (50 commuters, 26.6%) for males and 20 to 24 minutes (63 commuters, 24.5%) for females.
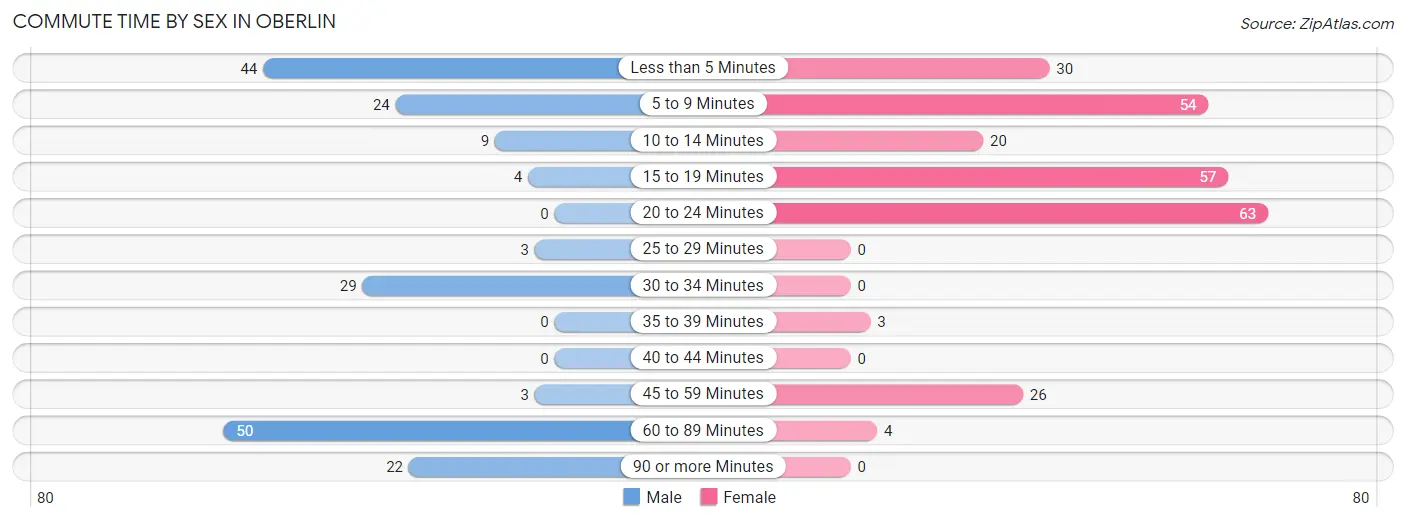
| Commute Time | Male | Female |
| Less than 5 Minutes | 44 (23.4%) | 30 (11.7%) |
| 5 to 9 Minutes | 24 (12.8%) | 54 (21.0%) |
| 10 to 14 Minutes | 9 (4.8%) | 20 (7.8%) |
| 15 to 19 Minutes | 4 (2.1%) | 57 (22.2%) |
| 20 to 24 Minutes | 0 (0.0%) | 63 (24.5%) |
| 25 to 29 Minutes | 3 (1.6%) | 0 (0.0%) |
| 30 to 34 Minutes | 29 (15.4%) | 0 (0.0%) |
| 35 to 39 Minutes | 0 (0.0%) | 3 (1.2%) |
| 40 to 44 Minutes | 0 (0.0%) | 0 (0.0%) |
| 45 to 59 Minutes | 3 (1.6%) | 26 (10.1%) |
| 60 to 89 Minutes | 50 (26.6%) | 4 (1.6%) |
| 90 or more Minutes | 22 (11.7%) | 0 (0.0%) |
Time of Departure to Work by Sex in Oberlin
The most frequent times of departure to work in Oberlin are 12:00 AM to 4:59 AM (65, 34.6%) for males and 12:00 PM to 3:59 PM (71, 27.6%) for females.
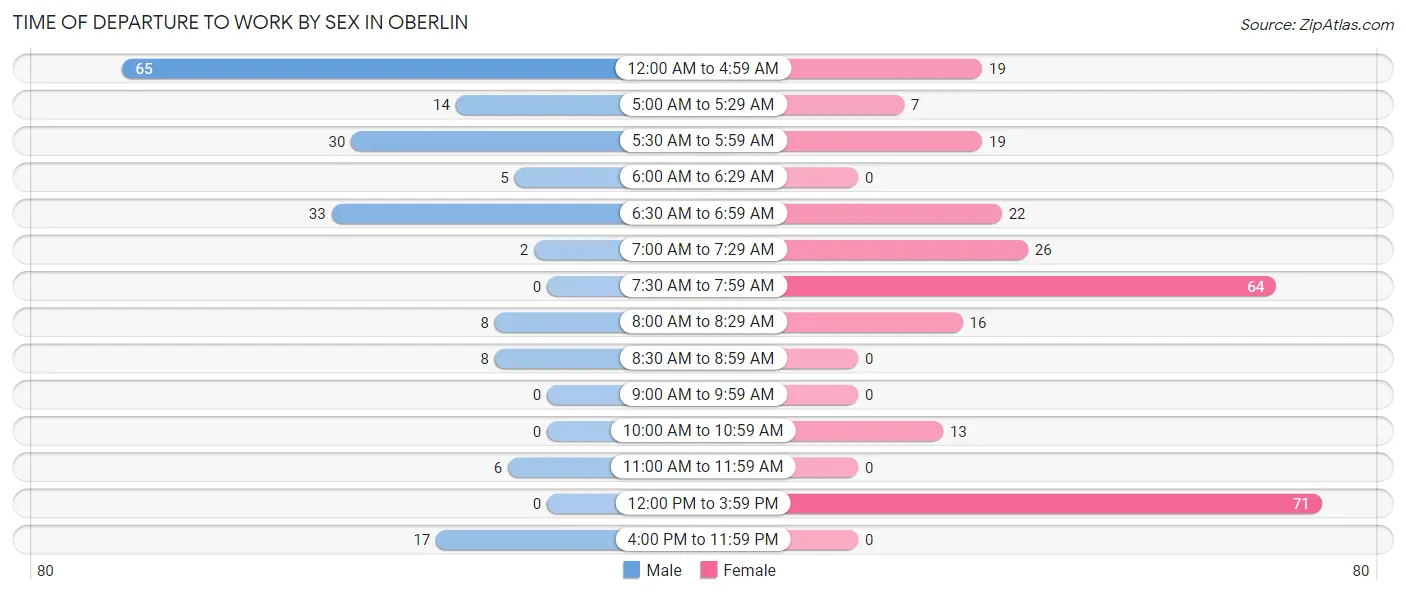
| Time of Departure | Male | Female |
| 12:00 AM to 4:59 AM | 65 (34.6%) | 19 (7.4%) |
| 5:00 AM to 5:29 AM | 14 (7.4%) | 7 (2.7%) |
| 5:30 AM to 5:59 AM | 30 (16.0%) | 19 (7.4%) |
| 6:00 AM to 6:29 AM | 5 (2.7%) | 0 (0.0%) |
| 6:30 AM to 6:59 AM | 33 (17.5%) | 22 (8.6%) |
| 7:00 AM to 7:29 AM | 2 (1.1%) | 26 (10.1%) |
| 7:30 AM to 7:59 AM | 0 (0.0%) | 64 (24.9%) |
| 8:00 AM to 8:29 AM | 8 (4.3%) | 16 (6.2%) |
| 8:30 AM to 8:59 AM | 8 (4.3%) | 0 (0.0%) |
| 9:00 AM to 9:59 AM | 0 (0.0%) | 0 (0.0%) |
| 10:00 AM to 10:59 AM | 0 (0.0%) | 13 (5.1%) |
| 11:00 AM to 11:59 AM | 6 (3.2%) | 0 (0.0%) |
| 12:00 PM to 3:59 PM | 0 (0.0%) | 71 (27.6%) |
| 4:00 PM to 11:59 PM | 17 (9.0%) | 0 (0.0%) |
| Total | 188 (100.0%) | 257 (100.0%) |
Housing Occupancy in Oberlin
Occupancy by Ownership in Oberlin
Of the total 567 dwellings in Oberlin, owner-occupied units account for 323 (57.0%), while renter-occupied units make up 244 (43.0%).
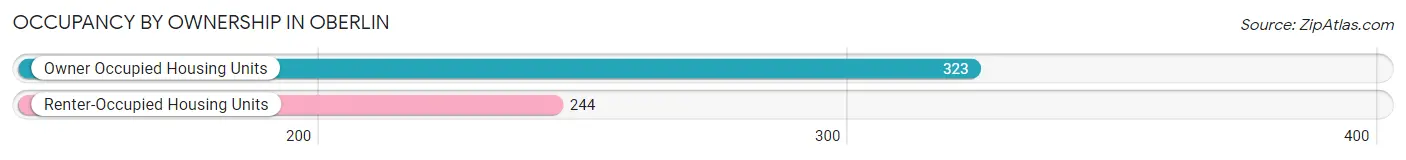
| Occupancy | # Housing Units | % Housing Units |
| Owner Occupied Housing Units | 323 | 57.0% |
| Renter-Occupied Housing Units | 244 | 43.0% |
| Total Occupied Housing Units | 567 | 100.0% |
Occupancy by Household Size in Oberlin
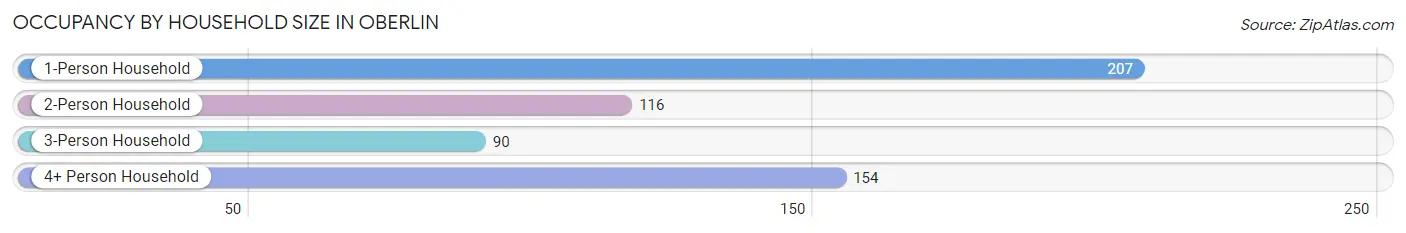
| Household Size | # Housing Units | % Housing Units |
| 1-Person Household | 207 | 36.5% |
| 2-Person Household | 116 | 20.5% |
| 3-Person Household | 90 | 15.9% |
| 4+ Person Household | 154 | 27.2% |
| Total Housing Units | 567 | 100.0% |
Occupancy by Ownership by Household Size in Oberlin
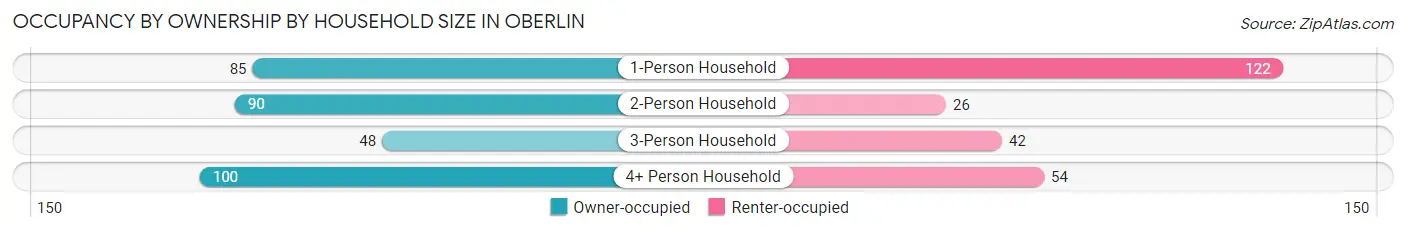
| Household Size | Owner-occupied | Renter-occupied |
| 1-Person Household | 85 (41.1%) | 122 (58.9%) |
| 2-Person Household | 90 (77.6%) | 26 (22.4%) |
| 3-Person Household | 48 (53.3%) | 42 (46.7%) |
| 4+ Person Household | 100 (64.9%) | 54 (35.1%) |
| Total Housing Units | 323 (57.0%) | 244 (43.0%) |
Occupancy by Educational Attainment in Oberlin
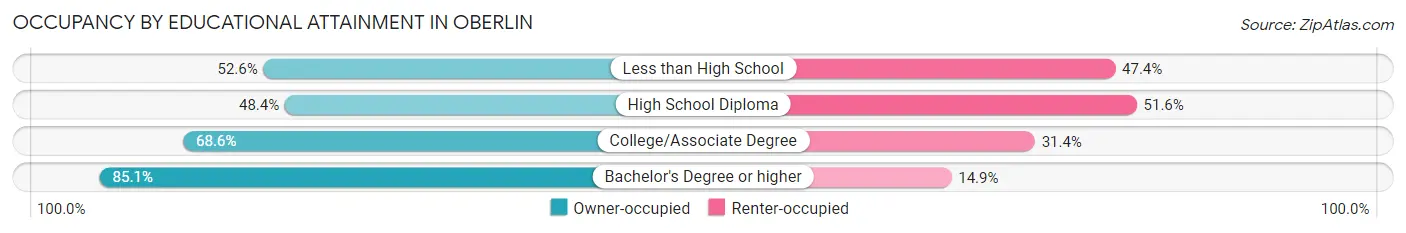
| Household Size | Owner-occupied | Renter-occupied |
| Less than High School | 40 (52.6%) | 36 (47.4%) |
| High School Diploma | 147 (48.4%) | 157 (51.6%) |
| College/Associate Degree | 96 (68.6%) | 44 (31.4%) |
| Bachelor's Degree or higher | 40 (85.1%) | 7 (14.9%) |
Occupancy by Age of Householder in Oberlin
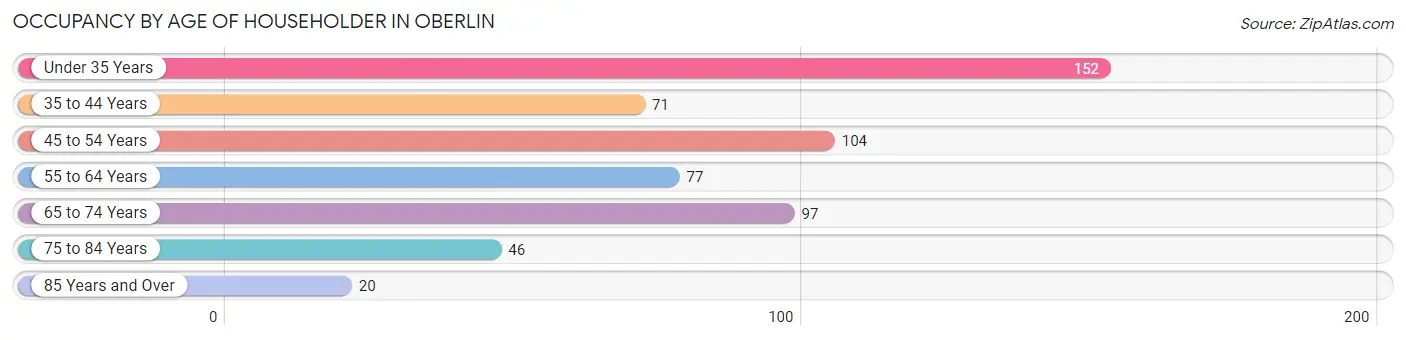
| Age Bracket | # Households | % Households |
| Under 35 Years | 152 | 26.8% |
| 35 to 44 Years | 71 | 12.5% |
| 45 to 54 Years | 104 | 18.3% |
| 55 to 64 Years | 77 | 13.6% |
| 65 to 74 Years | 97 | 17.1% |
| 75 to 84 Years | 46 | 8.1% |
| 85 Years and Over | 20 | 3.5% |
| Total | 567 | 100.0% |
Housing Finances in Oberlin
Median Income by Occupancy in Oberlin
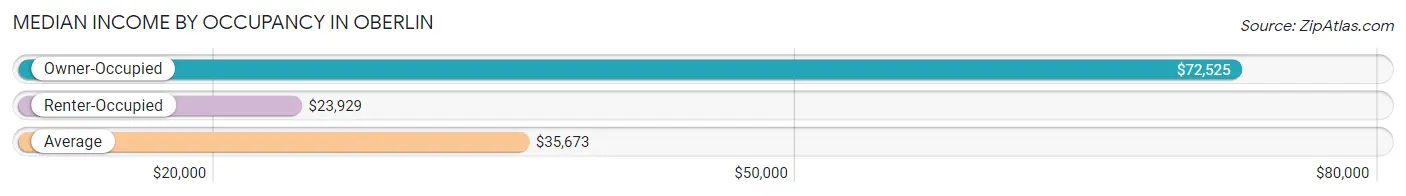
| Occupancy Type | # Households | Median Income |
| Owner-Occupied | 323 (57.0%) | $72,525 |
| Renter-Occupied | 244 (43.0%) | $23,929 |
| Average | 567 (100.0%) | $35,673 |
Occupancy by Householder Income Bracket in Oberlin
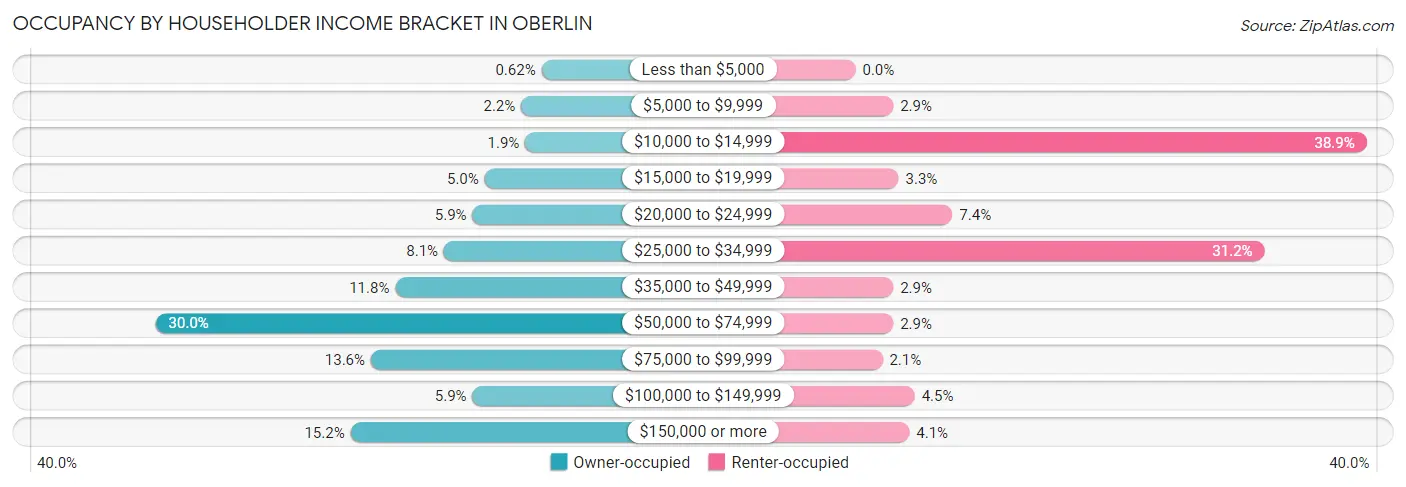
| Income Bracket | Owner-occupied | Renter-occupied |
| Less than $5,000 | 2 (0.6%) | 0 (0.0%) |
| $5,000 to $9,999 | 7 (2.2%) | 7 (2.9%) |
| $10,000 to $14,999 | 6 (1.9%) | 95 (38.9%) |
| $15,000 to $19,999 | 16 (5.0%) | 8 (3.3%) |
| $20,000 to $24,999 | 19 (5.9%) | 18 (7.4%) |
| $25,000 to $34,999 | 26 (8.1%) | 76 (31.1%) |
| $35,000 to $49,999 | 38 (11.8%) | 7 (2.9%) |
| $50,000 to $74,999 | 97 (30.0%) | 7 (2.9%) |
| $75,000 to $99,999 | 44 (13.6%) | 5 (2.1%) |
| $100,000 to $149,999 | 19 (5.9%) | 11 (4.5%) |
| $150,000 or more | 49 (15.2%) | 10 (4.1%) |
| Total | 323 (100.0%) | 244 (100.0%) |
Monthly Housing Cost Tiers in Oberlin
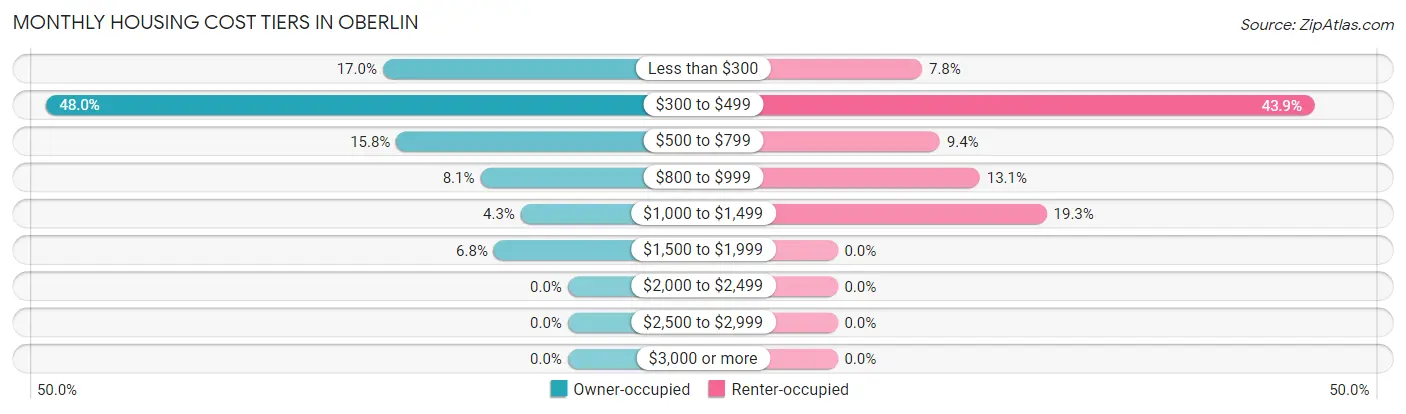
| Monthly Cost | Owner-occupied | Renter-occupied |
| Less than $300 | 55 (17.0%) | 19 (7.8%) |
| $300 to $499 | 155 (48.0%) | 107 (43.9%) |
| $500 to $799 | 51 (15.8%) | 23 (9.4%) |
| $800 to $999 | 26 (8.1%) | 32 (13.1%) |
| $1,000 to $1,499 | 14 (4.3%) | 47 (19.3%) |
| $1,500 to $1,999 | 22 (6.8%) | 0 (0.0%) |
| $2,000 to $2,499 | 0 (0.0%) | 0 (0.0%) |
| $2,500 to $2,999 | 0 (0.0%) | 0 (0.0%) |
| $3,000 or more | 0 (0.0%) | 0 (0.0%) |
| Total | 323 (100.0%) | 244 (100.0%) |
Physical Housing Characteristics in Oberlin
Housing Structures in Oberlin
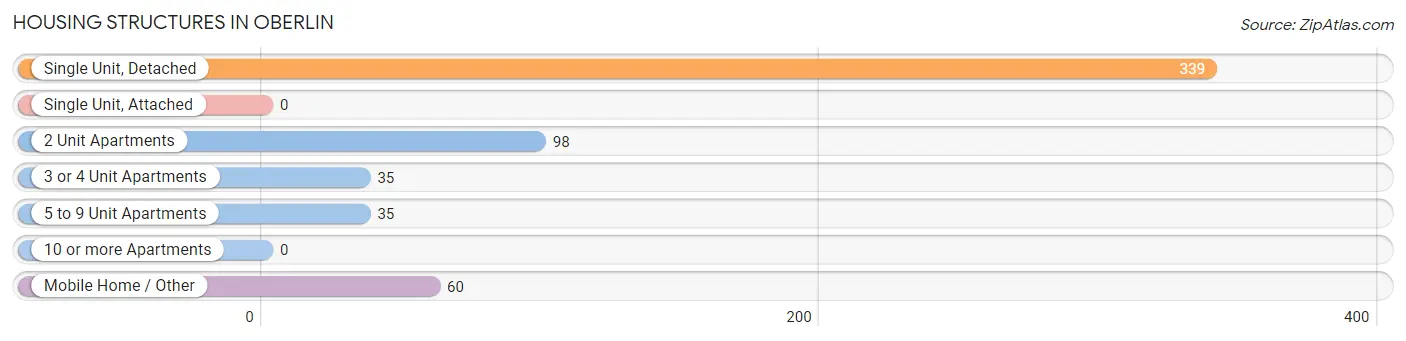
| Structure Type | # Housing Units | % Housing Units |
| Single Unit, Detached | 339 | 59.8% |
| Single Unit, Attached | 0 | 0.0% |
| 2 Unit Apartments | 98 | 17.3% |
| 3 or 4 Unit Apartments | 35 | 6.2% |
| 5 to 9 Unit Apartments | 35 | 6.2% |
| 10 or more Apartments | 0 | 0.0% |
| Mobile Home / Other | 60 | 10.6% |
| Total | 567 | 100.0% |
Housing Structures by Occupancy in Oberlin
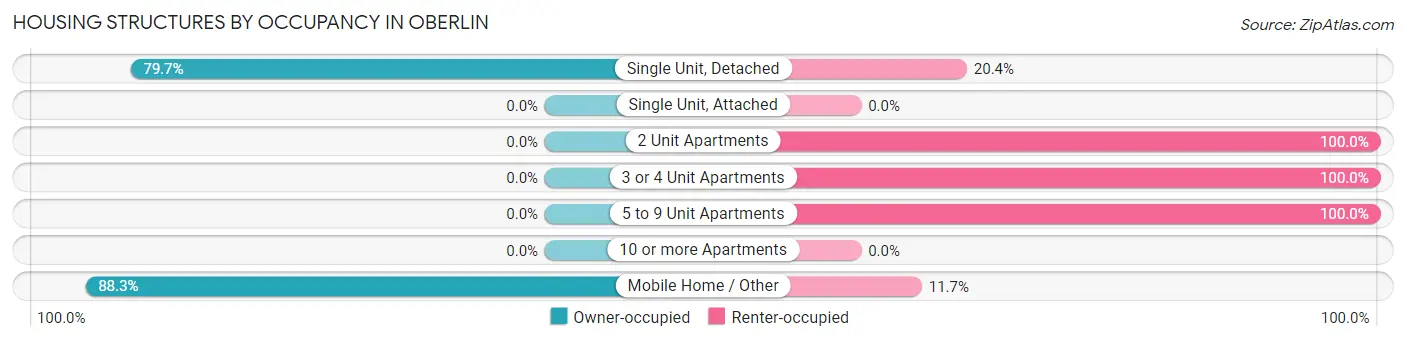
| Structure Type | Owner-occupied | Renter-occupied |
| Single Unit, Detached | 270 (79.6%) | 69 (20.3%) |
| Single Unit, Attached | 0 (0.0%) | 0 (0.0%) |
| 2 Unit Apartments | 0 (0.0%) | 98 (100.0%) |
| 3 or 4 Unit Apartments | 0 (0.0%) | 35 (100.0%) |
| 5 to 9 Unit Apartments | 0 (0.0%) | 35 (100.0%) |
| 10 or more Apartments | 0 (0.0%) | 0 (0.0%) |
| Mobile Home / Other | 53 (88.3%) | 7 (11.7%) |
| Total | 323 (57.0%) | 244 (43.0%) |
Housing Structures by Number of Rooms in Oberlin
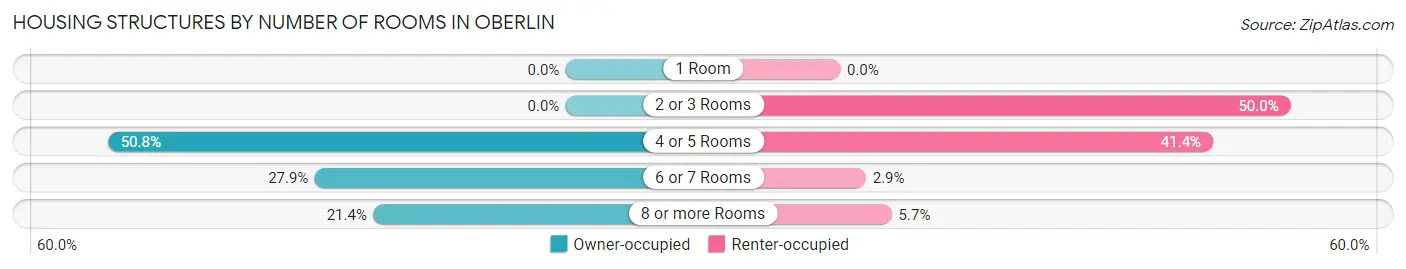
| Number of Rooms | Owner-occupied | Renter-occupied |
| 1 Room | 0 (0.0%) | 0 (0.0%) |
| 2 or 3 Rooms | 0 (0.0%) | 122 (50.0%) |
| 4 or 5 Rooms | 164 (50.8%) | 101 (41.4%) |
| 6 or 7 Rooms | 90 (27.9%) | 7 (2.9%) |
| 8 or more Rooms | 69 (21.4%) | 14 (5.7%) |
| Total | 323 (100.0%) | 244 (100.0%) |
Housing Structure by Heating Type in Oberlin
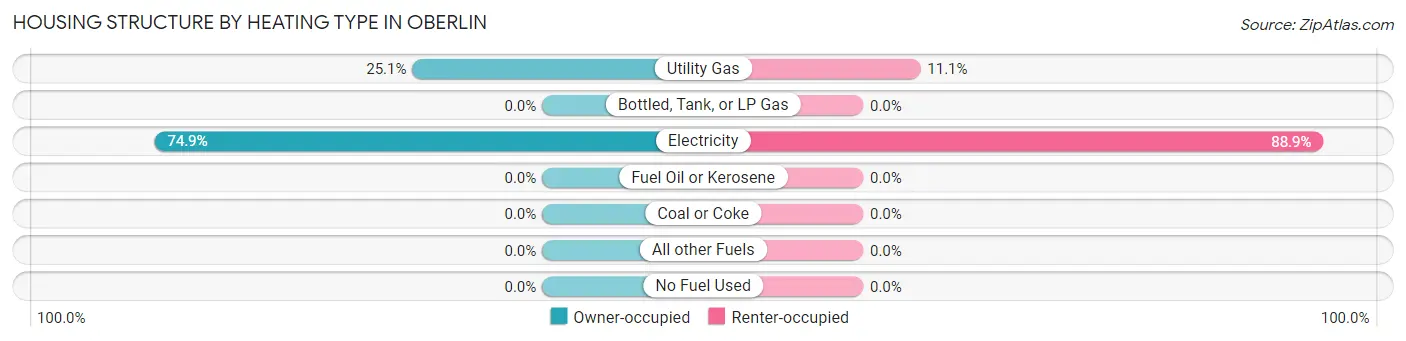
| Heating Type | Owner-occupied | Renter-occupied |
| Utility Gas | 81 (25.1%) | 27 (11.1%) |
| Bottled, Tank, or LP Gas | 0 (0.0%) | 0 (0.0%) |
| Electricity | 242 (74.9%) | 217 (88.9%) |
| Fuel Oil or Kerosene | 0 (0.0%) | 0 (0.0%) |
| Coal or Coke | 0 (0.0%) | 0 (0.0%) |
| All other Fuels | 0 (0.0%) | 0 (0.0%) |
| No Fuel Used | 0 (0.0%) | 0 (0.0%) |
| Total | 323 (100.0%) | 244 (100.0%) |
Household Vehicle Usage in Oberlin
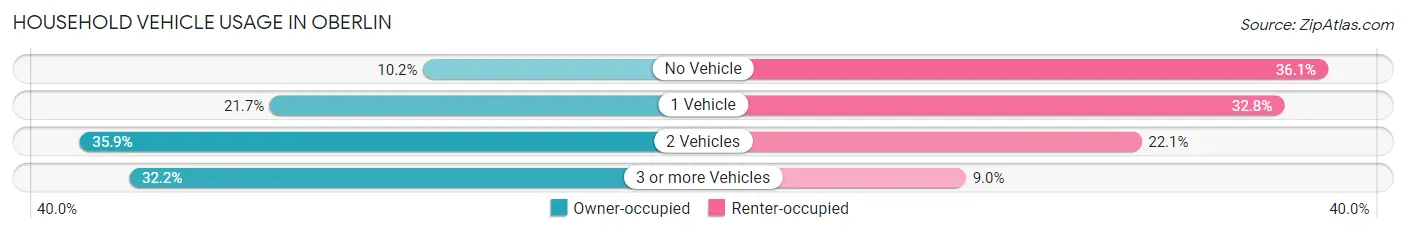
| Vehicles per Household | Owner-occupied | Renter-occupied |
| No Vehicle | 33 (10.2%) | 88 (36.1%) |
| 1 Vehicle | 70 (21.7%) | 80 (32.8%) |
| 2 Vehicles | 116 (35.9%) | 54 (22.1%) |
| 3 or more Vehicles | 104 (32.2%) | 22 (9.0%) |
| Total | 323 (100.0%) | 244 (100.0%) |
Real Estate & Mortgages in Oberlin
Real Estate and Mortgage Overview in Oberlin
| Characteristic | Without Mortgage | With Mortgage |
| Housing Units | 250 | 73 |
| Median Property Value | $90,900 | $0 |
| Median Household Income | $72,683 | $19 |
| Monthly Housing Costs | $335 | $0 |
| Real Estate Taxes | $199 | $8 |
Property Value by Mortgage Status in Oberlin
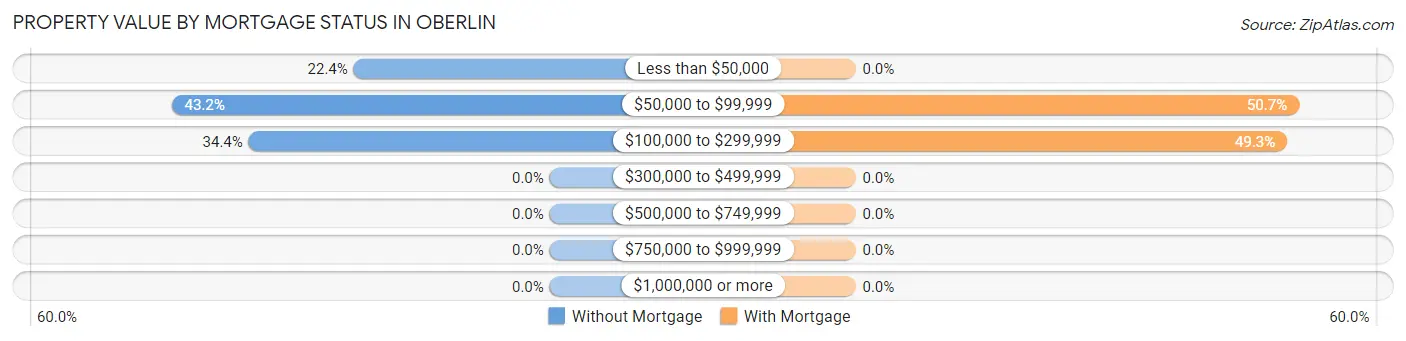
| Property Value | Without Mortgage | With Mortgage |
| Less than $50,000 | 56 (22.4%) | 0 (0.0%) |
| $50,000 to $99,999 | 108 (43.2%) | 37 (50.7%) |
| $100,000 to $299,999 | 86 (34.4%) | 36 (49.3%) |
| $300,000 to $499,999 | 0 (0.0%) | 0 (0.0%) |
| $500,000 to $749,999 | 0 (0.0%) | 0 (0.0%) |
| $750,000 to $999,999 | 0 (0.0%) | 0 (0.0%) |
| $1,000,000 or more | 0 (0.0%) | 0 (0.0%) |
| Total | 250 (100.0%) | 73 (100.0%) |
Household Income by Mortgage Status in Oberlin
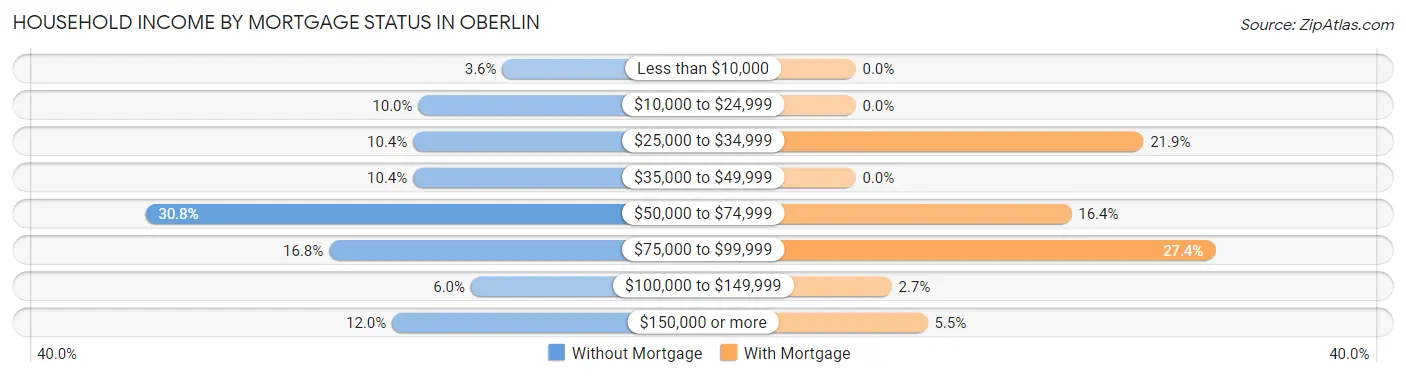
| Household Income | Without Mortgage | With Mortgage |
| Less than $10,000 | 9 (3.6%) | 0 (0.0%) |
| $10,000 to $24,999 | 25 (10.0%) | 0 (0.0%) |
| $25,000 to $34,999 | 26 (10.4%) | 16 (21.9%) |
| $35,000 to $49,999 | 26 (10.4%) | 0 (0.0%) |
| $50,000 to $74,999 | 77 (30.8%) | 12 (16.4%) |
| $75,000 to $99,999 | 42 (16.8%) | 20 (27.4%) |
| $100,000 to $149,999 | 15 (6.0%) | 2 (2.7%) |
| $150,000 or more | 30 (12.0%) | 4 (5.5%) |
| Total | 250 (100.0%) | 73 (100.0%) |
Property Value to Household Income Ratio in Oberlin
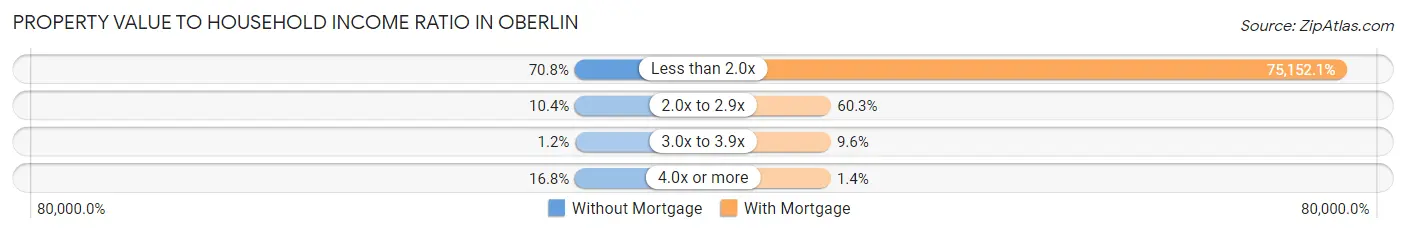
| Value-to-Income Ratio | Without Mortgage | With Mortgage |
| Less than 2.0x | 177 (70.8%) | 54,861 (75,152.0%) |
| 2.0x to 2.9x | 26 (10.4%) | 44 (60.3%) |
| 3.0x to 3.9x | 3 (1.2%) | 7 (9.6%) |
| 4.0x or more | 42 (16.8%) | 1 (1.4%) |
| Total | 250 (100.0%) | 73 (100.0%) |
Real Estate Taxes by Mortgage Status in Oberlin
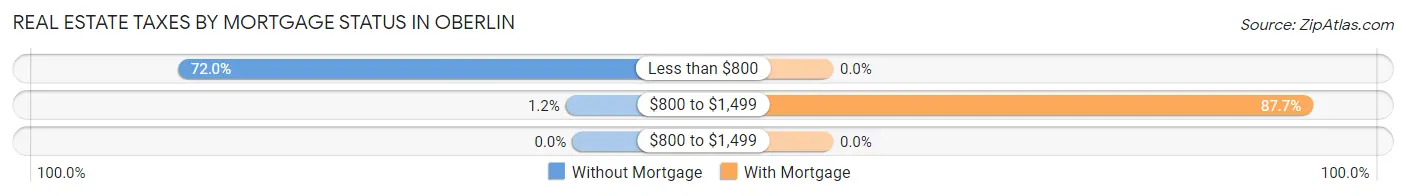
| Property Taxes | Without Mortgage | With Mortgage |
| Less than $800 | 180 (72.0%) | 0 (0.0%) |
| $800 to $1,499 | 3 (1.2%) | 64 (87.7%) |
| $800 to $1,499 | 0 (0.0%) | 0 (0.0%) |
| Total | 250 (100.0%) | 73 (100.0%) |
Health & Disability in Oberlin
Health Insurance Coverage by Age in Oberlin
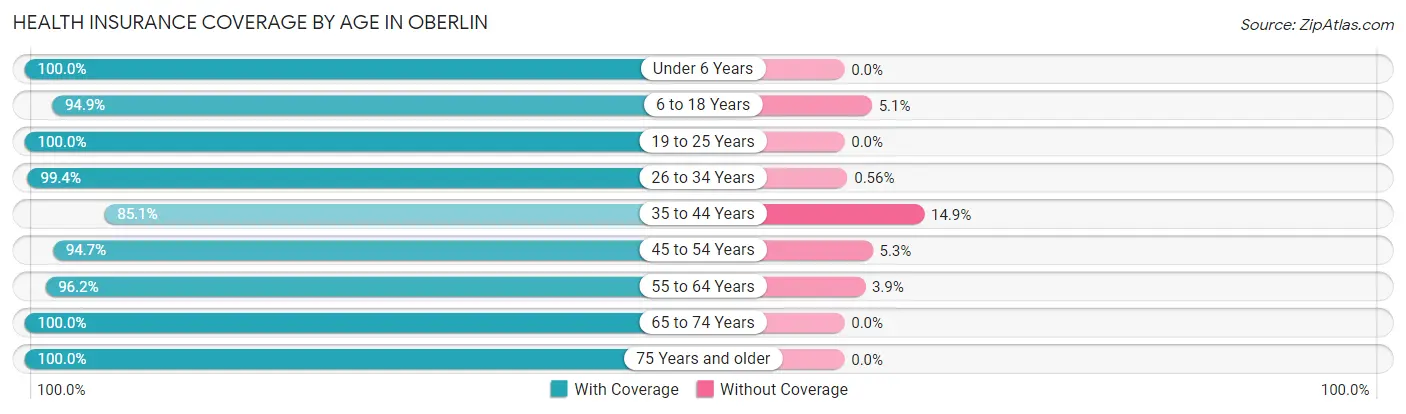
| Age Bracket | With Coverage | Without Coverage |
| Under 6 Years | 232 (100.0%) | 0 (0.0%) |
| 6 to 18 Years | 353 (94.9%) | 19 (5.1%) |
| 19 to 25 Years | 110 (100.0%) | 0 (0.0%) |
| 26 to 34 Years | 178 (99.4%) | 1 (0.6%) |
| 35 to 44 Years | 166 (85.1%) | 29 (14.9%) |
| 45 to 54 Years | 144 (94.7%) | 8 (5.3%) |
| 55 to 64 Years | 100 (96.2%) | 4 (3.8%) |
| 65 to 74 Years | 161 (100.0%) | 0 (0.0%) |
| 75 Years and older | 83 (100.0%) | 0 (0.0%) |
| Total | 1,527 (96.2%) | 61 (3.8%) |
Health Insurance Coverage by Citizenship Status in Oberlin
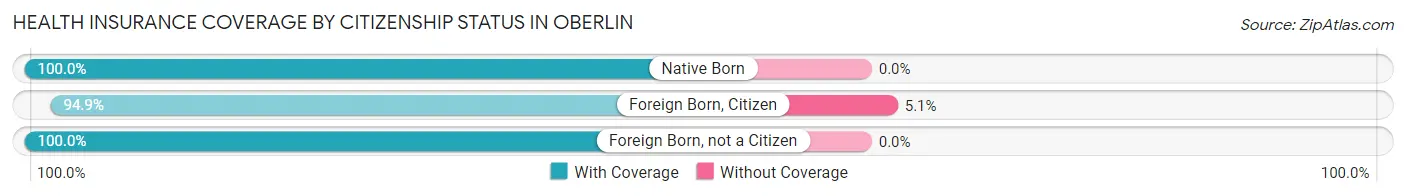
| Citizenship Status | With Coverage | Without Coverage |
| Native Born | 232 (100.0%) | 0 (0.0%) |
| Foreign Born, Citizen | 353 (94.9%) | 19 (5.1%) |
| Foreign Born, not a Citizen | 110 (100.0%) | 0 (0.0%) |
Health Insurance Coverage by Household Income in Oberlin
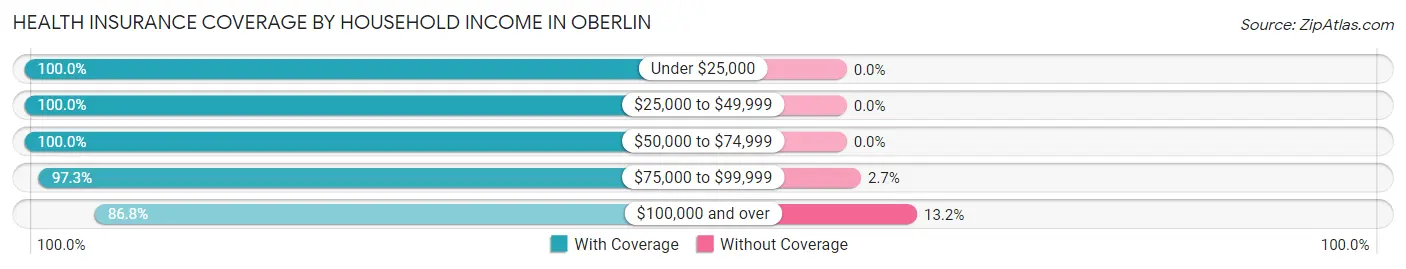
| Household Income | With Coverage | Without Coverage |
| Under $25,000 | 225 (100.0%) | 0 (0.0%) |
| $25,000 to $49,999 | 445 (100.0%) | 0 (0.0%) |
| $50,000 to $74,999 | 275 (100.0%) | 0 (0.0%) |
| $75,000 to $99,999 | 219 (97.3%) | 6 (2.7%) |
| $100,000 and over | 363 (86.8%) | 55 (13.2%) |
Public vs Private Health Insurance Coverage by Age in Oberlin
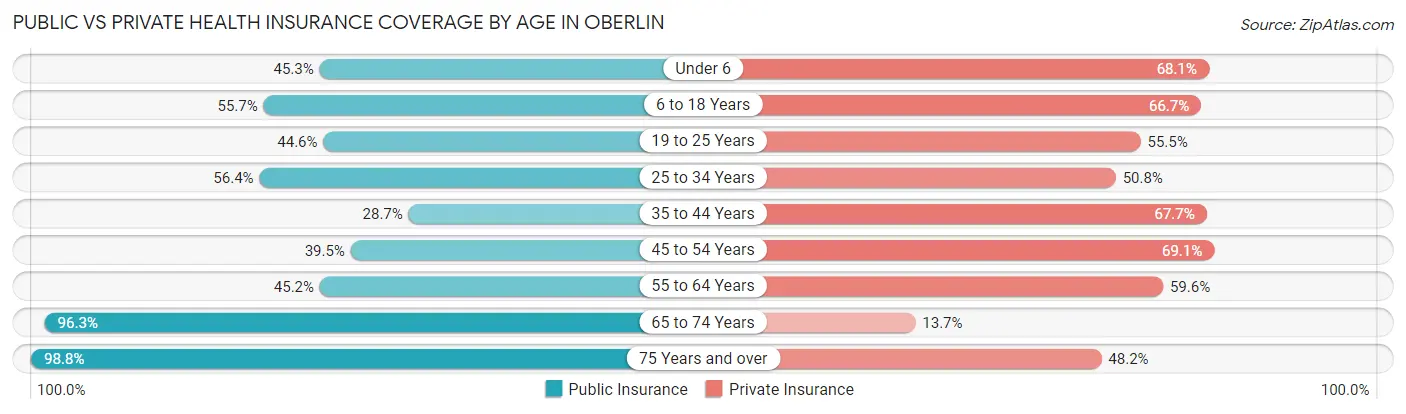
| Age Bracket | Public Insurance | Private Insurance |
| Under 6 | 105 (45.3%) | 158 (68.1%) |
| 6 to 18 Years | 207 (55.6%) | 248 (66.7%) |
| 19 to 25 Years | 49 (44.6%) | 61 (55.4%) |
| 25 to 34 Years | 101 (56.4%) | 91 (50.8%) |
| 35 to 44 Years | 56 (28.7%) | 132 (67.7%) |
| 45 to 54 Years | 60 (39.5%) | 105 (69.1%) |
| 55 to 64 Years | 47 (45.2%) | 62 (59.6%) |
| 65 to 74 Years | 155 (96.3%) | 22 (13.7%) |
| 75 Years and over | 82 (98.8%) | 40 (48.2%) |
| Total | 862 (54.3%) | 919 (57.9%) |
Disability Status by Sex by Age in Oberlin
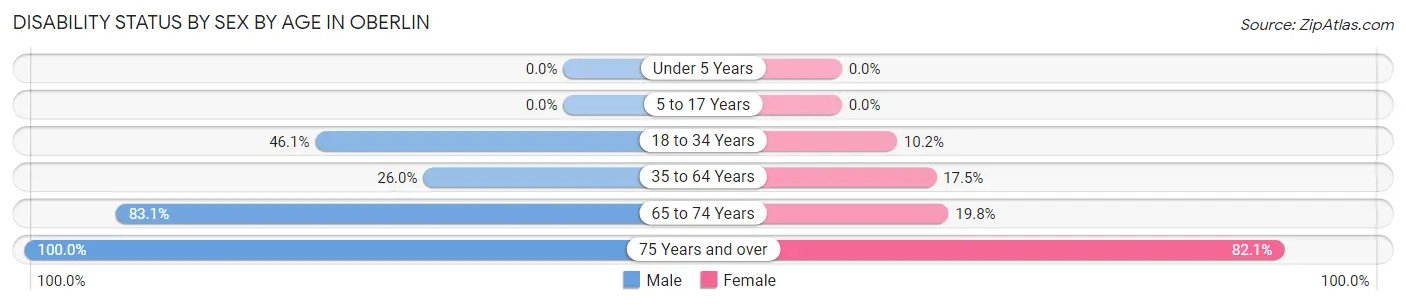
| Age Bracket | Male | Female |
| Under 5 Years | 0 (0.0%) | 0 (0.0%) |
| 5 to 17 Years | 0 (0.0%) | 0 (0.0%) |
| 18 to 34 Years | 70 (46.1%) | 14 (10.2%) |
| 35 to 64 Years | 46 (26.0%) | 48 (17.5%) |
| 65 to 74 Years | 54 (83.1%) | 19 (19.8%) |
| 75 Years and over | 16 (100.0%) | 55 (82.1%) |
Disability Class by Sex by Age in Oberlin
Disability Class: Hearing Difficulty
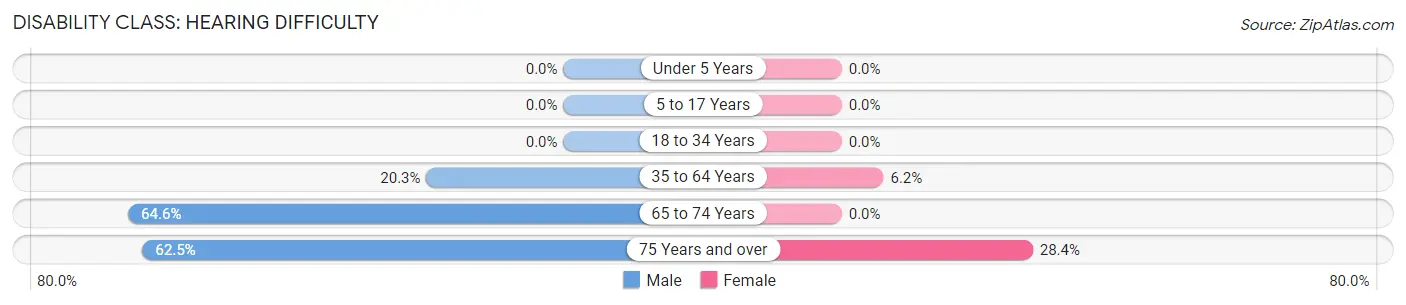
| Age Bracket | Male | Female |
| Under 5 Years | 0 (0.0%) | 0 (0.0%) |
| 5 to 17 Years | 0 (0.0%) | 0 (0.0%) |
| 18 to 34 Years | 0 (0.0%) | 0 (0.0%) |
| 35 to 64 Years | 36 (20.3%) | 17 (6.2%) |
| 65 to 74 Years | 42 (64.6%) | 0 (0.0%) |
| 75 Years and over | 10 (62.5%) | 19 (28.4%) |
Disability Class: Vision Difficulty
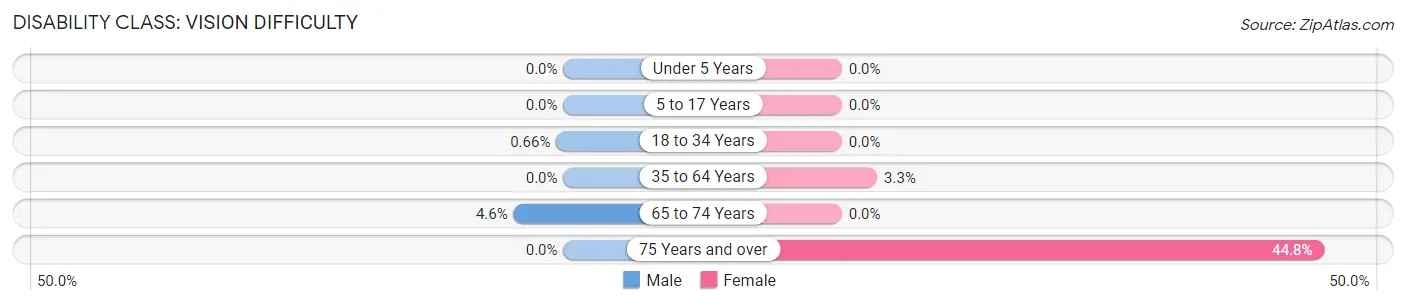
| Age Bracket | Male | Female |
| Under 5 Years | 0 (0.0%) | 0 (0.0%) |
| 5 to 17 Years | 0 (0.0%) | 0 (0.0%) |
| 18 to 34 Years | 1 (0.7%) | 0 (0.0%) |
| 35 to 64 Years | 0 (0.0%) | 9 (3.3%) |
| 65 to 74 Years | 3 (4.6%) | 0 (0.0%) |
| 75 Years and over | 0 (0.0%) | 30 (44.8%) |
Disability Class: Cognitive Difficulty
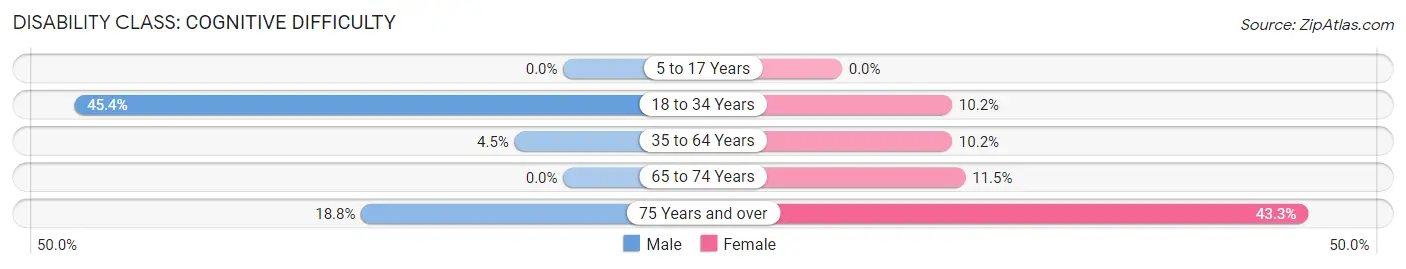
| Age Bracket | Male | Female |
| 5 to 17 Years | 0 (0.0%) | 0 (0.0%) |
| 18 to 34 Years | 69 (45.4%) | 14 (10.2%) |
| 35 to 64 Years | 8 (4.5%) | 28 (10.2%) |
| 65 to 74 Years | 0 (0.0%) | 11 (11.5%) |
| 75 Years and over | 3 (18.8%) | 29 (43.3%) |
Disability Class: Ambulatory Difficulty
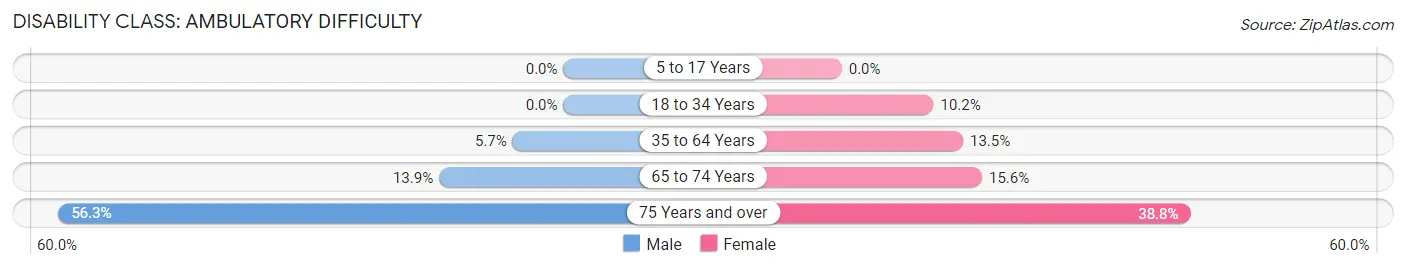
| Age Bracket | Male | Female |
| 5 to 17 Years | 0 (0.0%) | 0 (0.0%) |
| 18 to 34 Years | 0 (0.0%) | 14 (10.2%) |
| 35 to 64 Years | 10 (5.7%) | 37 (13.5%) |
| 65 to 74 Years | 9 (13.9%) | 15 (15.6%) |
| 75 Years and over | 9 (56.2%) | 26 (38.8%) |
Disability Class: Self-Care Difficulty
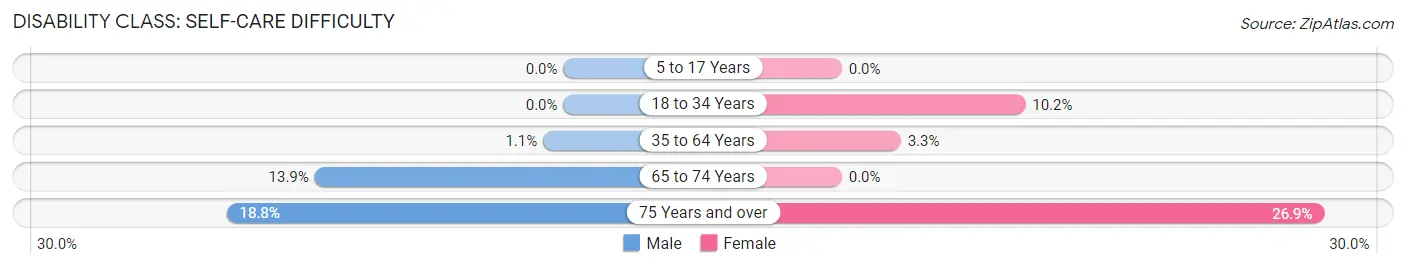
| Age Bracket | Male | Female |
| 5 to 17 Years | 0 (0.0%) | 0 (0.0%) |
| 18 to 34 Years | 0 (0.0%) | 14 (10.2%) |
| 35 to 64 Years | 2 (1.1%) | 9 (3.3%) |
| 65 to 74 Years | 9 (13.9%) | 0 (0.0%) |
| 75 Years and over | 3 (18.8%) | 18 (26.9%) |
Technology Access in Oberlin
Computing Device Access in Oberlin
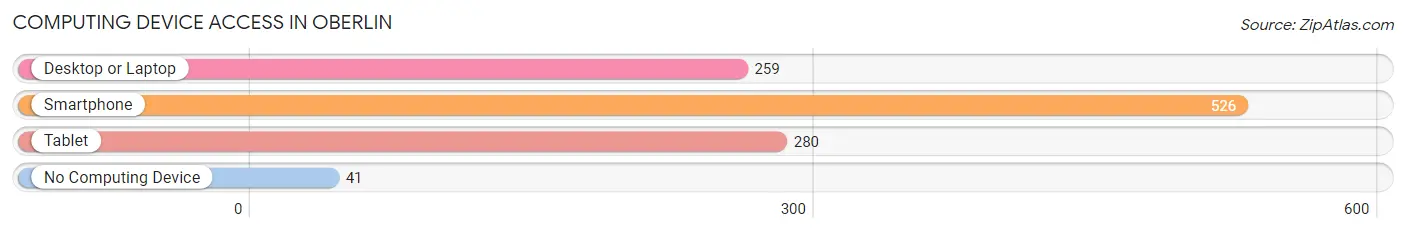
| Device Type | # Households | % Households |
| Desktop or Laptop | 259 | 45.7% |
| Smartphone | 526 | 92.8% |
| Tablet | 280 | 49.4% |
| No Computing Device | 41 | 7.2% |
| Total | 567 | 100.0% |
Internet Access in Oberlin
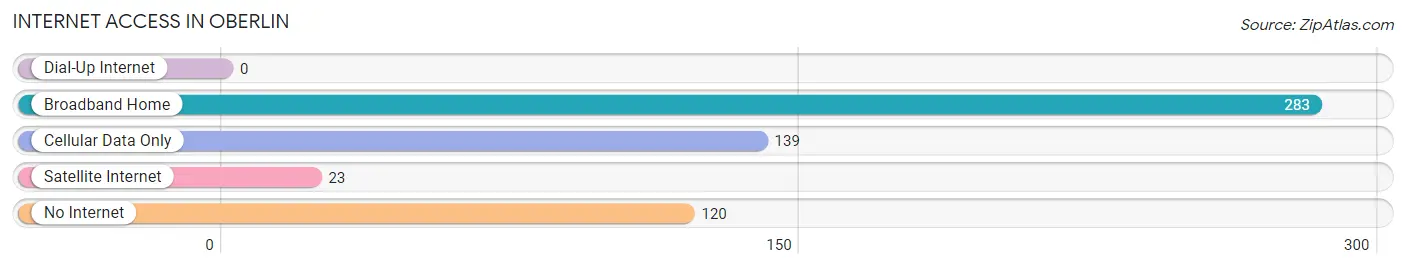
| Internet Type | # Households | % Households |
| Dial-Up Internet | 0 | 0.0% |
| Broadband Home | 283 | 49.9% |
| Cellular Data Only | 139 | 24.5% |
| Satellite Internet | 23 | 4.1% |
| No Internet | 120 | 21.2% |
| Total | 567 | 100.0% |
Oberlin Summary
Oberlin is a small town located in Allen Parish, Louisiana. It is situated in the southwestern part of the state, approximately 25 miles from the Texas border. The town has a population of 1,845 people, according to the 2010 census. The town is known for its rich history, diverse geography, and vibrant economy.
History
Oberlin was founded in 1883 by German immigrants who had settled in the area. The town was named after Oberlin College in Ohio, which was founded by German immigrants. The town was originally a farming community, and the main crops grown were cotton, corn, and sugar cane. The town was also known for its lumber industry, which provided jobs for many of the town's residents.
In the early 1900s, the town began to experience a period of growth and development. The railroad was extended to Oberlin in 1906, and this allowed the town to become more connected to the rest of the state. The town also experienced a population boom, as many people moved to the area to take advantage of the new economic opportunities.
Geography
Oberlin is located in the southwestern part of Louisiana, approximately 25 miles from the Texas border. The town is situated in the foothills of the Sabine National Forest, and is surrounded by rolling hills and lush forests. The town is located on the banks of the Calcasieu River, which provides a source of recreation for the town's residents.
The climate in Oberlin is humid subtropical, with hot summers and mild winters. The average temperature in the summer is around 90 degrees Fahrenheit, and the average temperature in the winter is around 50 degrees Fahrenheit. The town receives an average of 48 inches of rain per year.
Economy
Oberlin's economy is largely based on agriculture and forestry. The town is home to several farms, which produce cotton, corn, and sugar cane. The town is also home to several lumber mills, which provide jobs for many of the town's residents.
The town is also home to several small businesses, including restaurants, retail stores, and service providers. The town is also home to a few manufacturing companies, which produce a variety of products.
Demographics
According to the 2010 census, Oberlin has a population of 1,845 people. The town is predominantly white, with a small African American population. The median household income in the town is $31,250, and the median age is 37.
Conclusion
Oberlin is a small town located in Allen Parish, Louisiana. The town has a rich history, diverse geography, and vibrant economy. The town is predominantly white, with a small African American population. The town is home to several farms, lumber mills, and small businesses, which provide jobs for many of the town's residents. The town is also home to a few manufacturing companies, which produce a variety of products.
Common Questions
What is Per Capita Income in Oberlin?
Per Capita income in Oberlin is $20,038.
What is the Median Family Income in Oberlin?
Median Family Income in Oberlin is $72,925.
What is the Median Household income in Oberlin?
Median Household Income in Oberlin is $35,673.
What is Income or Wage Gap in Oberlin?
Income or Wage Gap in Oberlin is 45.2%.
Women in Oberlin earn 54.8 cents for every dollar earned by a man.
What is Inequality or Gini Index in Oberlin?
Inequality or Gini Index in Oberlin is 0.47.
What is the Total Population of Oberlin?
Total Population of Oberlin is 1,676.
What is the Total Male Population of Oberlin?
Total Male Population of Oberlin is 783.
What is the Total Female Population of Oberlin?
Total Female Population of Oberlin is 893.
What is the Ratio of Males per 100 Females in Oberlin?
There are 87.68 Males per 100 Females in Oberlin.
What is the Ratio of Females per 100 Males in Oberlin?
There are 114.05 Females per 100 Males in Oberlin.
What is the Median Population Age in Oberlin?
Median Population Age in Oberlin is 34.3 Years.
What is the Average Family Size in Oberlin
Average Family Size in Oberlin is 3.7 People.
What is the Average Household Size in Oberlin
Average Household Size in Oberlin is 2.8 People.
How Large is the Labor Force in Oberlin?
There are 468 People in the Labor Forcein in Oberlin.
What is the Percentage of People in the Labor Force in Oberlin?
40.9% of People are in the Labor Force in Oberlin.
What is the Unemployment Rate in Oberlin?
Unemployment Rate in Oberlin is 1.7%.