Napoleonville, LA Map & Demographics
Napoleonville Map
Napoleonville Overview
$13,376
PER CAPITA INCOME
$19,189
AVG HOUSEHOLD INCOME
$7,733
FAMILY INCOME DEFICIT
0.49
INEQUALITY / GINI INDEX
382
TOTAL POPULATION
164
MALE POPULATION
218
FEMALE POPULATION
75.23
MALES / 100 FEMALES
132.93
FEMALES / 100 MALES
35.8
MEDIAN AGE
3.3
AVG FAMILY SIZE
2.5
AVG HOUSEHOLD SIZE
113
LABOR FORCE [ PEOPLE ]
41.9%
PERCENT IN LABOR FORCE
49.6%
UNEMPLOYMENT RATE
Napoleonville Zip Codes
Napoleonville Area Codes
Income in Napoleonville
Income Overview in Napoleonville
| Characteristic | Number | Measure |
| Per Capita Income | 382 | $13,376 |
| Median Family Income | 90 | $0 |
| Mean Family Income | 90 | $52,629 |
| Median Household Income | 150 | $19,189 |
| Mean Household Income | 150 | $38,068 |
| Income Deficit | 90 | $7,733 |
| Wage / Income Gap (%) | 382 | 0.00% |
| Wage / Income Gap ($) | 382 | 100.00¢ per $1 |
| Gini / Inequality Index | 382 | 0.49 |
Earnings by Sex in Napoleonville
| Sex | Number | Average Earnings |
| Male | 62 (54.9%) | $0 |
| Female | 51 (45.1%) | $0 |
| Total | 113 (100.0%) | $0 |
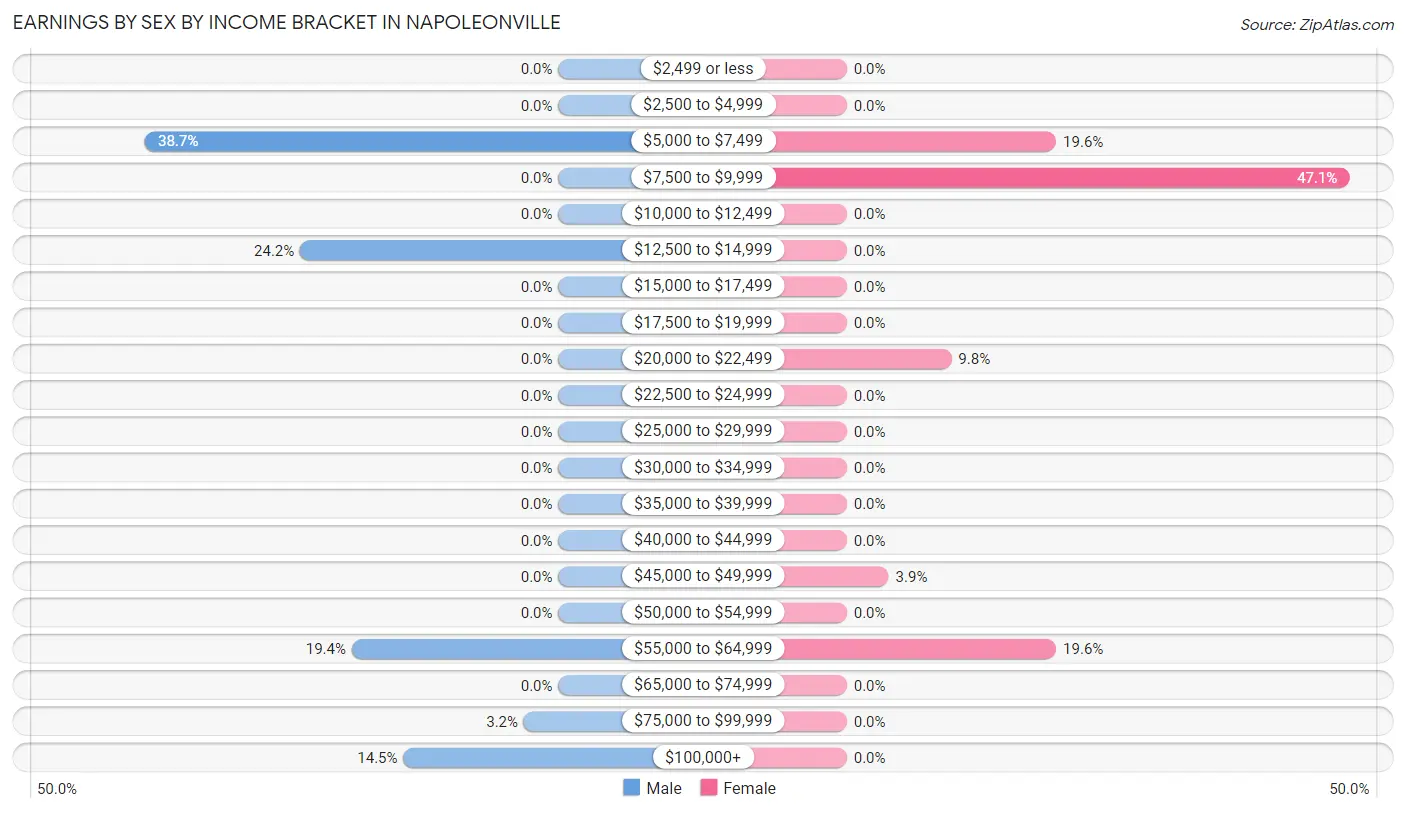
Earnings by Sex by Income Bracket in Napoleonville
The most common earnings brackets in Napoleonville are $5,000 to $7,499 for men (24 | 38.7%) and $7,500 to $9,999 for women (24 | 47.1%).
| Income | Male | Female |
| $2,499 or less | 0 (0.0%) | 0 (0.0%) |
| $2,500 to $4,999 | 0 (0.0%) | 0 (0.0%) |
| $5,000 to $7,499 | 24 (38.7%) | 10 (19.6%) |
| $7,500 to $9,999 | 0 (0.0%) | 24 (47.1%) |
| $10,000 to $12,499 | 0 (0.0%) | 0 (0.0%) |
| $12,500 to $14,999 | 15 (24.2%) | 0 (0.0%) |
| $15,000 to $17,499 | 0 (0.0%) | 0 (0.0%) |
| $17,500 to $19,999 | 0 (0.0%) | 0 (0.0%) |
| $20,000 to $22,499 | 0 (0.0%) | 5 (9.8%) |
| $22,500 to $24,999 | 0 (0.0%) | 0 (0.0%) |
| $25,000 to $29,999 | 0 (0.0%) | 0 (0.0%) |
| $30,000 to $34,999 | 0 (0.0%) | 0 (0.0%) |
| $35,000 to $39,999 | 0 (0.0%) | 0 (0.0%) |
| $40,000 to $44,999 | 0 (0.0%) | 0 (0.0%) |
| $45,000 to $49,999 | 0 (0.0%) | 2 (3.9%) |
| $50,000 to $54,999 | 0 (0.0%) | 0 (0.0%) |
| $55,000 to $64,999 | 12 (19.4%) | 10 (19.6%) |
| $65,000 to $74,999 | 0 (0.0%) | 0 (0.0%) |
| $75,000 to $99,999 | 2 (3.2%) | 0 (0.0%) |
| $100,000+ | 9 (14.5%) | 0 (0.0%) |
| Total | 62 (100.0%) | 51 (100.0%) |
Earnings by Sex by Educational Attainment in Napoleonville
| Educational Attainment | Male Income | Female Income |
| Less than High School | - | - |
| High School Diploma | - | - |
| College or Associate's Degree | - | - |
| Bachelor's Degree | - | - |
| Graduate Degree | - | - |
| Total | - | - |
Family Income in Napoleonville
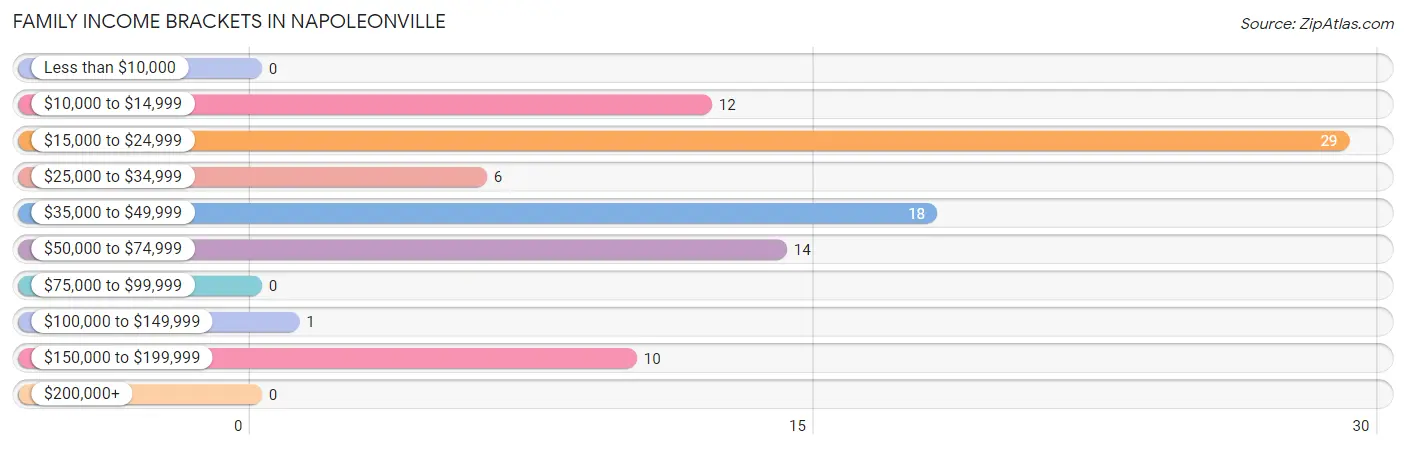
Family Income Brackets in Napoleonville
According to the Napoleonville family income data, there are 29 families falling into the $15,000 to $24,999 income range, which is the most common income bracket and makes up 32.2% of all families.
| Income Bracket | # Families | % Families |
| Less than $10,000 | 0 | 0.0% |
| $10,000 to $14,999 | 12 | 13.3% |
| $15,000 to $24,999 | 29 | 32.2% |
| $25,000 to $34,999 | 6 | 6.7% |
| $35,000 to $49,999 | 18 | 20.0% |
| $50,000 to $74,999 | 14 | 15.6% |
| $75,000 to $99,999 | 0 | 0.0% |
| $100,000 to $149,999 | 1 | 1.1% |
| $150,000 to $199,999 | 10 | 11.1% |
| $200,000+ | 0 | 0.0% |
Family Income by Famaliy Size in Napoleonville
| Income Bracket | # Families | Median Income |
| 2-Person Families | 34 (37.8%) | $0 |
| 3-Person Families | 25 (27.8%) | $0 |
| 4-Person Families | 13 (14.4%) | $0 |
| 5-Person Families | 6 (6.7%) | $0 |
| 6-Person Families | 12 (13.3%) | $0 |
| 7+ Person Families | 0 (0.0%) | $0 |
| Total | 90 (100.0%) | $0 |
Family Income by Number of Earners in Napoleonville
| Number of Earners | # Families | Median Income |
| No Earners | 30 (33.3%) | $0 |
| 1 Earner | 50 (55.6%) | $0 |
| 2 Earners | 10 (11.1%) | $0 |
| 3+ Earners | 0 (0.0%) | $0 |
| Total | 90 (100.0%) | $0 |
Household Income in Napoleonville
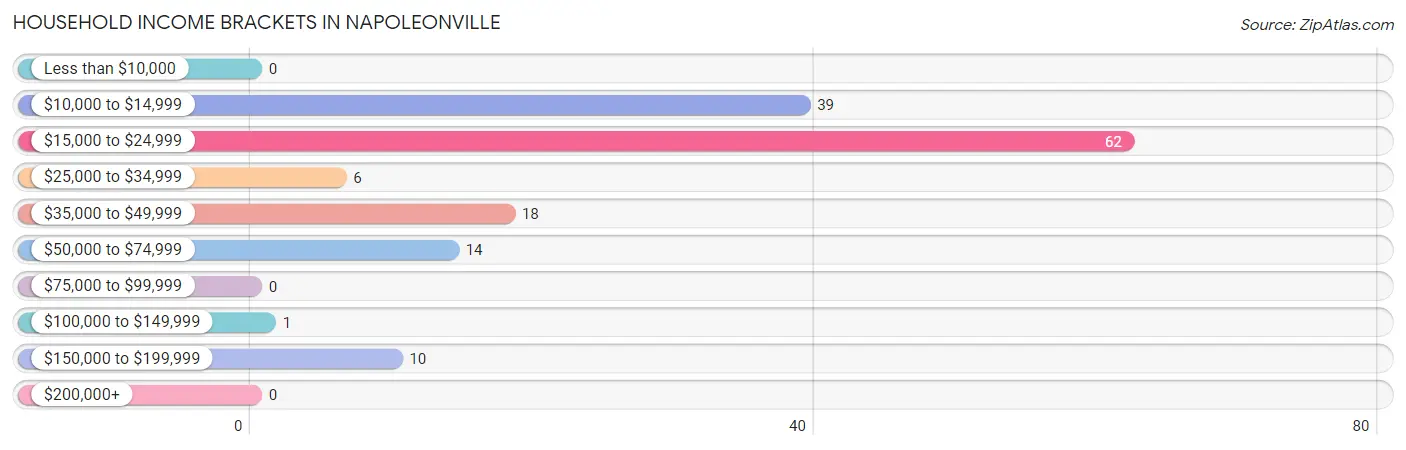
Household Income Brackets in Napoleonville
With 62 households falling in the category, the $15,000 to $24,999 income range is the most frequent in Napoleonville, accounting for 41.3% of all households.
| Income Bracket | # Households | % Households |
| Less than $10,000 | 0 | 0.0% |
| $10,000 to $14,999 | 39 | 26.0% |
| $15,000 to $24,999 | 62 | 41.3% |
| $25,000 to $34,999 | 6 | 4.0% |
| $35,000 to $49,999 | 18 | 12.0% |
| $50,000 to $74,999 | 14 | 9.3% |
| $75,000 to $99,999 | 0 | 0.0% |
| $100,000 to $149,999 | 1 | 0.7% |
| $150,000 to $199,999 | 10 | 6.7% |
| $200,000+ | 0 | 0.0% |
Household Income by Householder Age in Napoleonville
The median household income in Napoleonville is $19,189, with the highest median household income of $46,319 found in the 45 to 64 years age bracket for the primary householder. A total of 65 households (43.3%) fall into this category. Meanwhile, the 15 to 24 years age bracket for the primary householder has the lowest median household income of $0, with 24 households (16.0%) in this group.
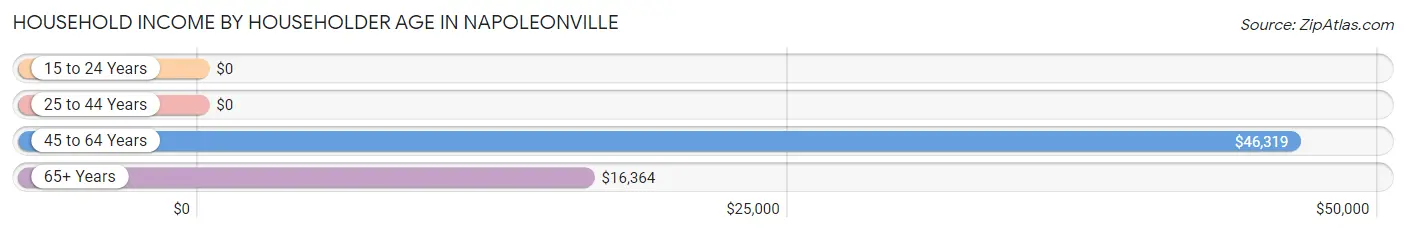
| Income Bracket | # Households | Median Income |
| 15 to 24 Years | 24 (16.0%) | $0 |
| 25 to 44 Years | 5 (3.3%) | $0 |
| 45 to 64 Years | 65 (43.3%) | $46,319 |
| 65+ Years | 56 (37.3%) | $16,364 |
| Total | 150 (100.0%) | $19,189 |
Poverty in Napoleonville
Income Below Poverty by Sex and Age in Napoleonville
With 60.4% poverty level for males and 51.8% for females among the residents of Napoleonville, 35 to 44 year old males and 18 to 24 year old females are the most vulnerable to poverty, with 23 males (100.0%) and 24 females (100.0%) in their respective age groups living below the poverty level.
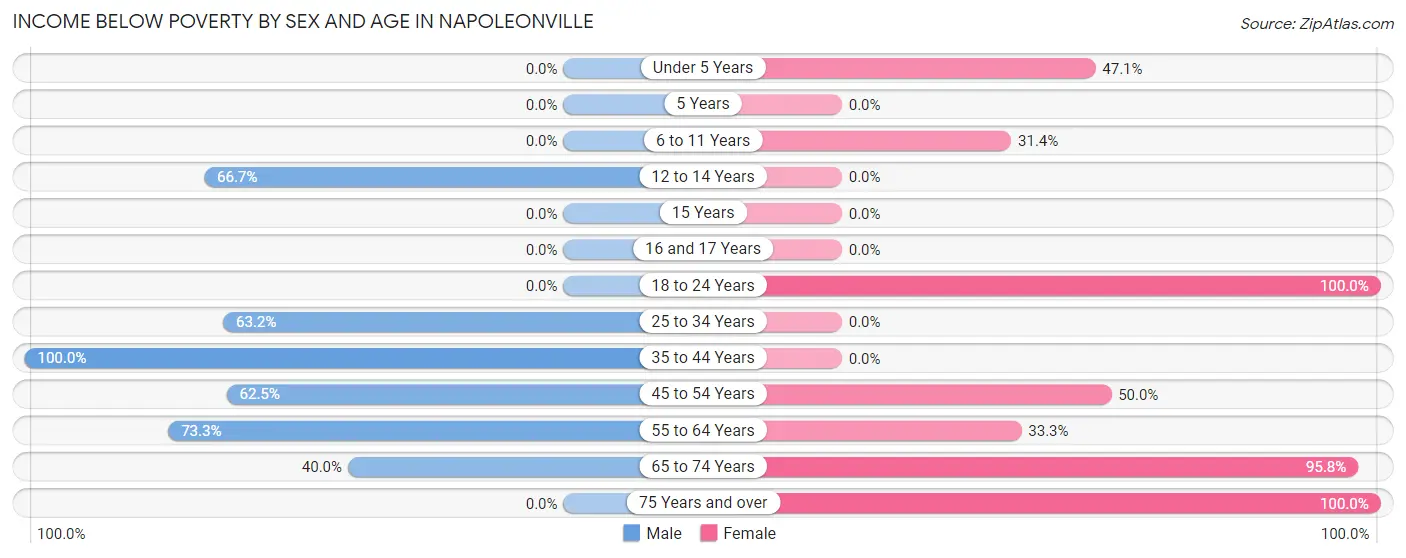
| Age Bracket | Male | Female |
| Under 5 Years | 0 (0.0%) | 16 (47.1%) |
| 5 Years | 0 (0.0%) | 0 (0.0%) |
| 6 to 11 Years | 0 (0.0%) | 11 (31.4%) |
| 12 to 14 Years | 16 (66.7%) | 0 (0.0%) |
| 15 Years | 0 (0.0%) | 0 (0.0%) |
| 16 and 17 Years | 0 (0.0%) | 0 (0.0%) |
| 18 to 24 Years | 0 (0.0%) | 24 (100.0%) |
| 25 to 34 Years | 24 (63.2%) | 0 (0.0%) |
| 35 to 44 Years | 23 (100.0%) | 0 (0.0%) |
| 45 to 54 Years | 15 (62.5%) | 10 (50.0%) |
| 55 to 64 Years | 11 (73.3%) | 16 (33.3%) |
| 65 to 74 Years | 10 (40.0%) | 23 (95.8%) |
| 75 Years and over | 0 (0.0%) | 13 (100.0%) |
| Total | 99 (60.4%) | 113 (51.8%) |
Income Above Poverty by Sex and Age in Napoleonville
According to the poverty statistics in Napoleonville, males aged 6 to 11 years and females aged 12 to 14 years are the age groups that are most secure financially, with 100.0% of males and 100.0% of females in these age groups living above the poverty line.
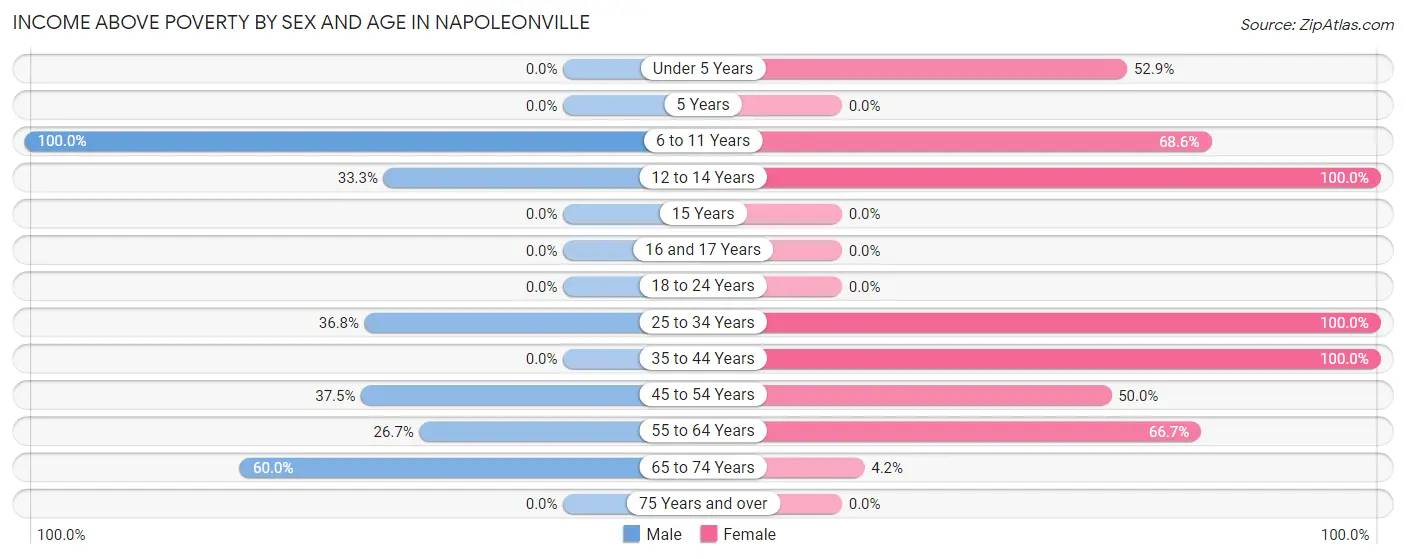
| Age Bracket | Male | Female |
| Under 5 Years | 0 (0.0%) | 18 (52.9%) |
| 5 Years | 0 (0.0%) | 0 (0.0%) |
| 6 to 11 Years | 15 (100.0%) | 24 (68.6%) |
| 12 to 14 Years | 8 (33.3%) | 4 (100.0%) |
| 15 Years | 0 (0.0%) | 0 (0.0%) |
| 16 and 17 Years | 0 (0.0%) | 0 (0.0%) |
| 18 to 24 Years | 0 (0.0%) | 0 (0.0%) |
| 25 to 34 Years | 14 (36.8%) | 11 (100.0%) |
| 35 to 44 Years | 0 (0.0%) | 5 (100.0%) |
| 45 to 54 Years | 9 (37.5%) | 10 (50.0%) |
| 55 to 64 Years | 4 (26.7%) | 32 (66.7%) |
| 65 to 74 Years | 15 (60.0%) | 1 (4.2%) |
| 75 Years and over | 0 (0.0%) | 0 (0.0%) |
| Total | 65 (39.6%) | 105 (48.2%) |
Income Below Poverty Among Married-Couple Families in Napoleonville
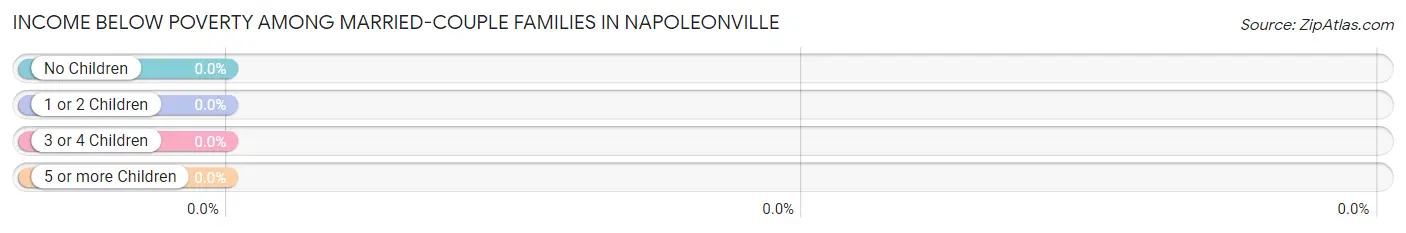
| Children | Above Poverty | Below Poverty |
| No Children | 19 (100.0%) | 0 (0.0%) |
| 1 or 2 Children | 12 (100.0%) | 0 (0.0%) |
| 3 or 4 Children | 0 (0.0%) | 0 (0.0%) |
| 5 or more Children | 0 (0.0%) | 0 (0.0%) |
| Total | 31 (100.0%) | 0 (0.0%) |
Income Below Poverty Among Single-Parent Households in Napoleonville
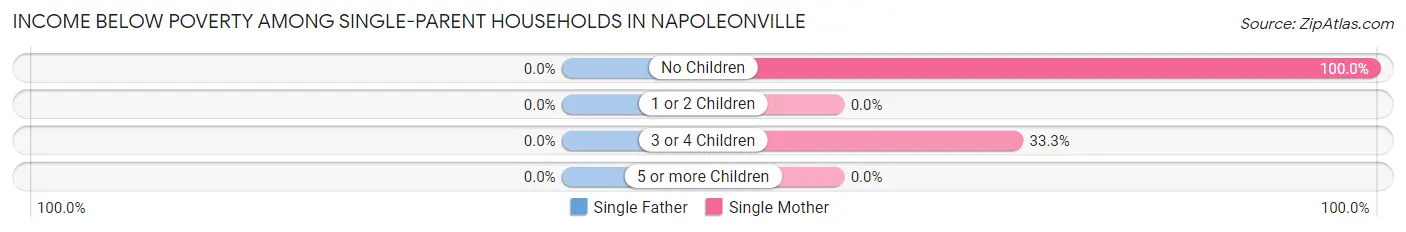
| Children | Single Father | Single Mother |
| No Children | 0 (0.0%) | 36 (100.0%) |
| 1 or 2 Children | 0 (0.0%) | 0 (0.0%) |
| 3 or 4 Children | 0 (0.0%) | 6 (33.3%) |
| 5 or more Children | 0 (0.0%) | 0 (0.0%) |
| Total | 0 (0.0%) | 42 (71.2%) |
Income Below Poverty Among Married-Couple vs Single-Parent Households in Napoleonville
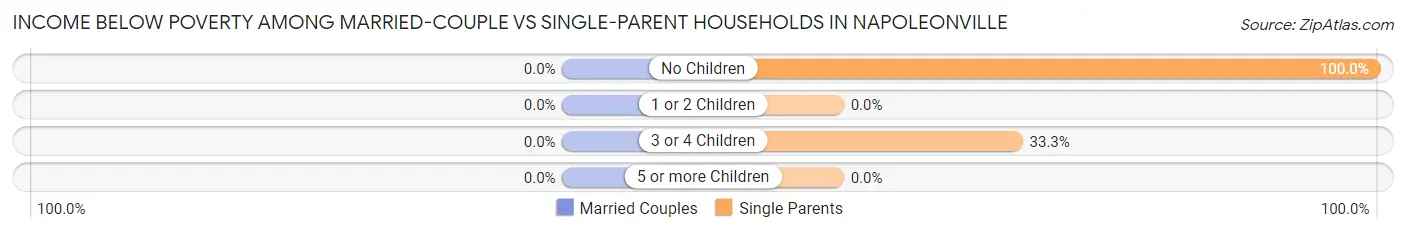
| Children | Married-Couple Families | Single-Parent Households |
| No Children | 0 (0.0%) | 36 (100.0%) |
| 1 or 2 Children | 0 (0.0%) | 0 (0.0%) |
| 3 or 4 Children | 0 (0.0%) | 6 (33.3%) |
| 5 or more Children | 0 (0.0%) | 0 (0.0%) |
| Total | 0 (0.0%) | 42 (71.2%) |
Race in Napoleonville
The most populous races in Napoleonville are Black / African American (297 | 77.7%), and White / Caucasian (85 | 22.3%).
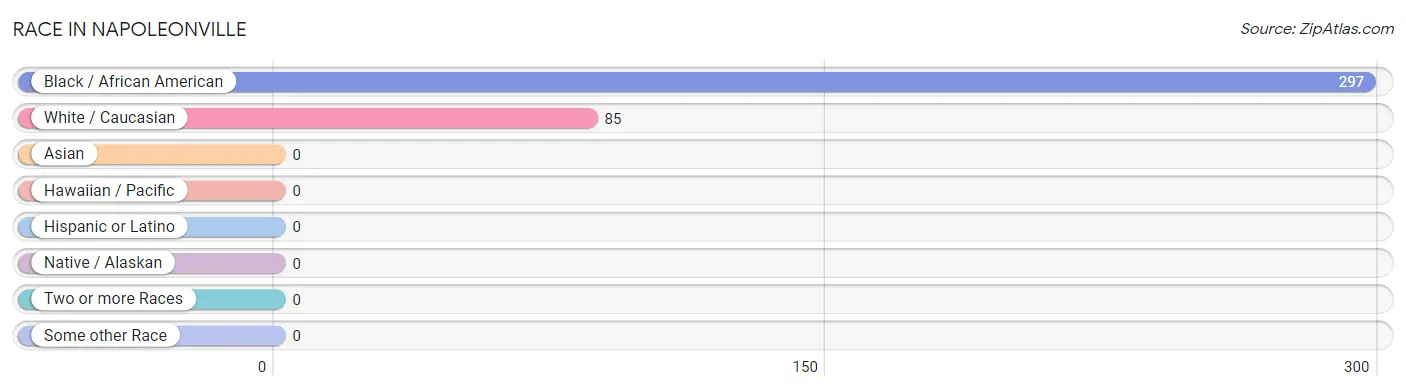
| Race | # Population | % Population |
| Asian | 0 | 0.0% |
| Black / African American | 297 | 77.7% |
| Hawaiian / Pacific | 0 | 0.0% |
| Hispanic or Latino | 0 | 0.0% |
| Native / Alaskan | 0 | 0.0% |
| White / Caucasian | 85 | 22.3% |
| Two or more Races | 0 | 0.0% |
| Some other Race | 0 | 0.0% |
| Total | 382 | 100.0% |
Ancestry in Napoleonville
The most populous ancestries reported in Napoleonville are French (5 | 1.3%), and German (2 | 0.5%), together accounting for 1.8% of all Napoleonville residents.
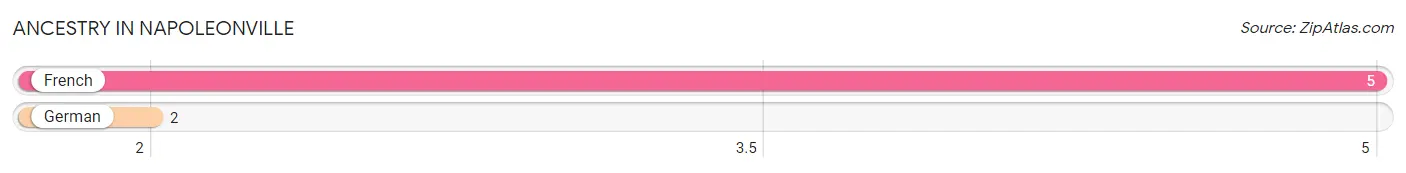
| Ancestry | # Population | % Population |
| French | 5 | 1.3% |
| German | 2 | 0.5% | View All 2 Rows |
Immigrants in Napoleonville

| Immigration Origin | # Population | % Population | View All 0 Rows |
Sex and Age in Napoleonville
Sex and Age in Napoleonville
The most populous age groups in Napoleonville are 25 to 29 Years (38 | 23.2%) for men and Under 5 Years (34 | 15.6%) for women.
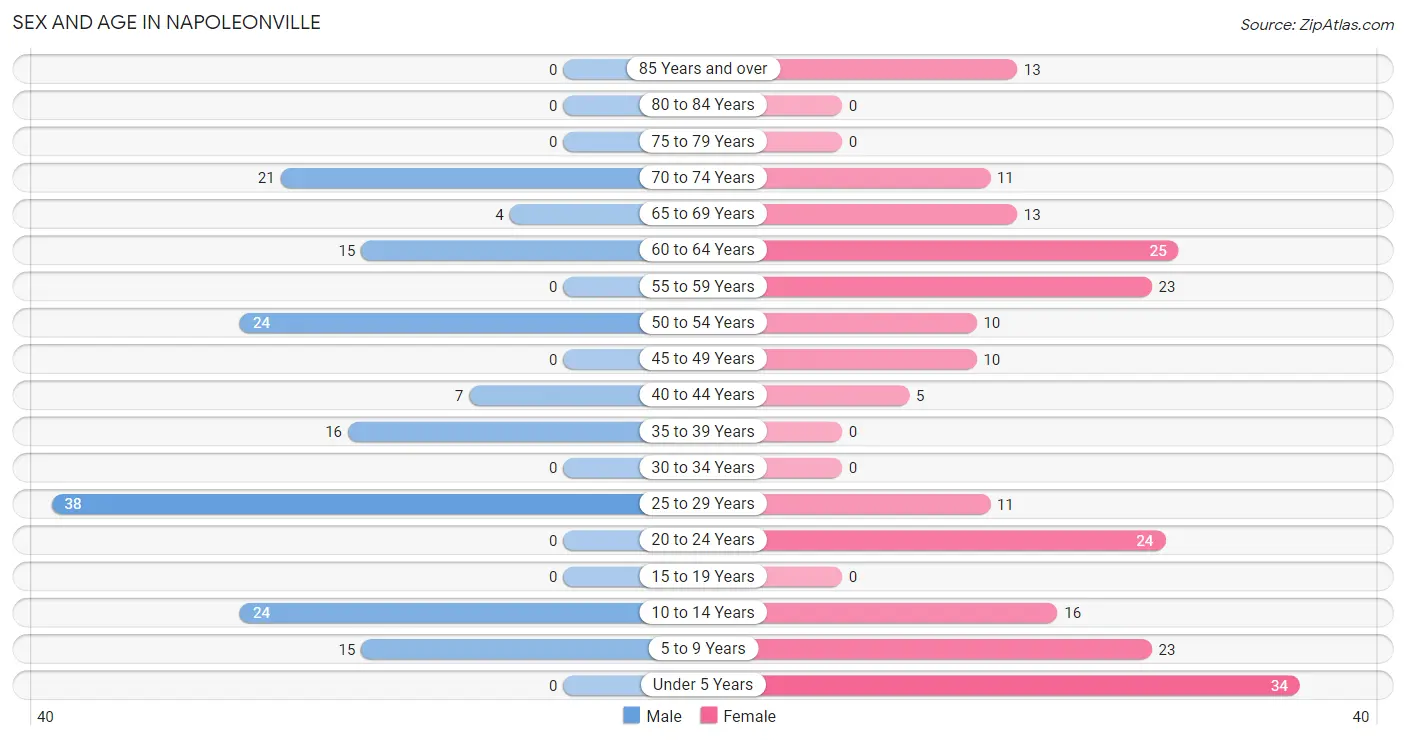
| Age Bracket | Male | Female |
| Under 5 Years | 0 (0.0%) | 34 (15.6%) |
| 5 to 9 Years | 15 (9.1%) | 23 (10.5%) |
| 10 to 14 Years | 24 (14.6%) | 16 (7.3%) |
| 15 to 19 Years | 0 (0.0%) | 0 (0.0%) |
| 20 to 24 Years | 0 (0.0%) | 24 (11.0%) |
| 25 to 29 Years | 38 (23.2%) | 11 (5.1%) |
| 30 to 34 Years | 0 (0.0%) | 0 (0.0%) |
| 35 to 39 Years | 16 (9.8%) | 0 (0.0%) |
| 40 to 44 Years | 7 (4.3%) | 5 (2.3%) |
| 45 to 49 Years | 0 (0.0%) | 10 (4.6%) |
| 50 to 54 Years | 24 (14.6%) | 10 (4.6%) |
| 55 to 59 Years | 0 (0.0%) | 23 (10.5%) |
| 60 to 64 Years | 15 (9.1%) | 25 (11.5%) |
| 65 to 69 Years | 4 (2.4%) | 13 (6.0%) |
| 70 to 74 Years | 21 (12.8%) | 11 (5.1%) |
| 75 to 79 Years | 0 (0.0%) | 0 (0.0%) |
| 80 to 84 Years | 0 (0.0%) | 0 (0.0%) |
| 85 Years and over | 0 (0.0%) | 13 (6.0%) |
| Total | 164 (100.0%) | 218 (100.0%) |
Families and Households in Napoleonville
Median Family Size in Napoleonville
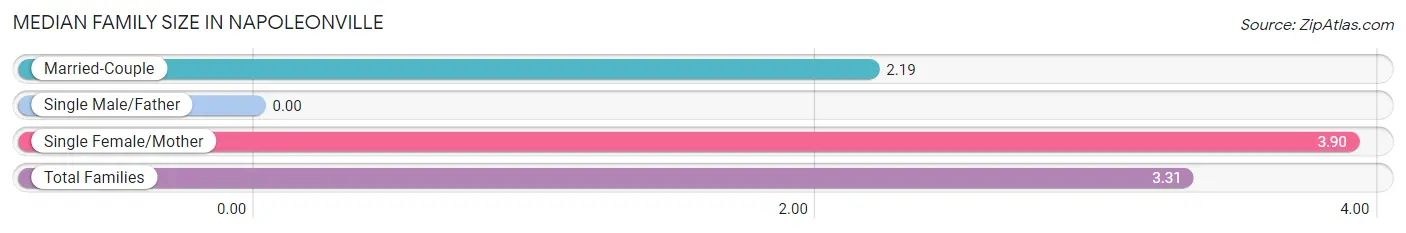
| Family Type | # Families | Family Size |
| Married-Couple | 31 (34.4%) | 2.19 |
| Single Male/Father | 0 (0.0%) | - |
| Single Female/Mother | 59 (65.6%) | 3.90 |
| Total Families | 90 (100.0%) | 3.31 |
Median Household Size in Napoleonville
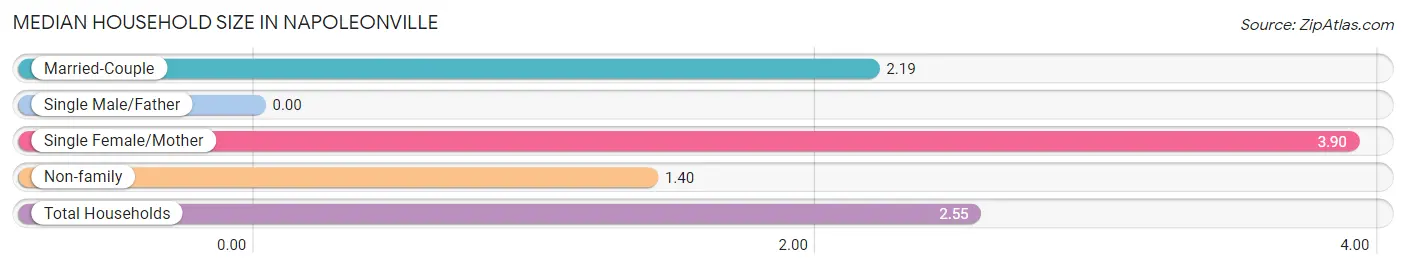
| Household Type | # Households | Household Size |
| Married-Couple | 31 (20.7%) | 2.19 |
| Single Male/Father | 0 (0.0%) | - |
| Single Female/Mother | 59 (39.3%) | 3.90 |
| Non-family | 60 (40.0%) | 1.40 |
| Total Households | 150 (100.0%) | 2.55 |
Household Size by Marriage Status in Napoleonville
Out of a total of 150 households in Napoleonville, 90 (60.0%) are family households, while 60 (40.0%) are nonfamily households. The most numerous type of family households are 2-person households, comprising 34, and the most common type of nonfamily households are 1-person households, comprising 36.
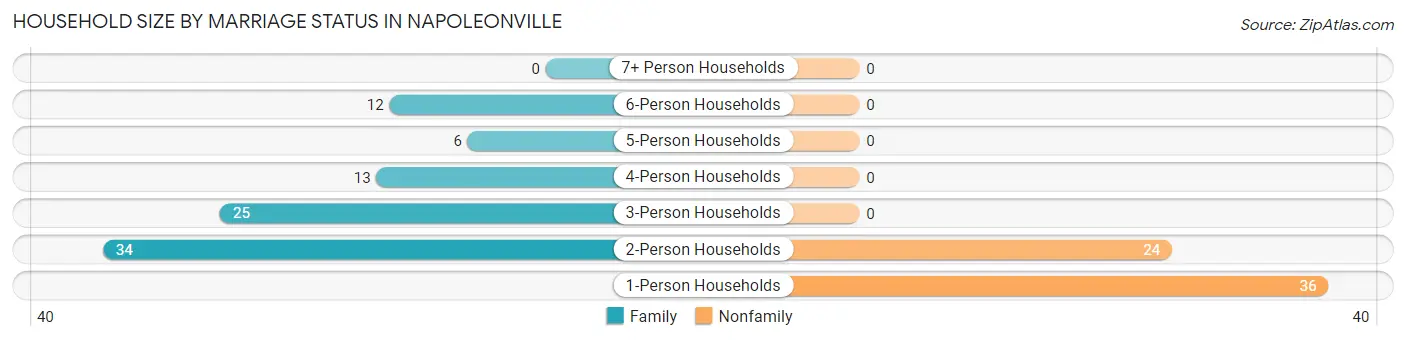
| Household Size | Family Households | Nonfamily Households |
| 1-Person Households | - | 36 (24.0%) |
| 2-Person Households | 34 (22.7%) | 24 (16.0%) |
| 3-Person Households | 25 (16.7%) | 0 (0.0%) |
| 4-Person Households | 13 (8.7%) | 0 (0.0%) |
| 5-Person Households | 6 (4.0%) | 0 (0.0%) |
| 6-Person Households | 12 (8.0%) | 0 (0.0%) |
| 7+ Person Households | 0 (0.0%) | 0 (0.0%) |
| Total | 90 (60.0%) | 60 (40.0%) |
Female Fertility in Napoleonville
Fertility by Age in Napoleonville
| Age Bracket | Women with Births | Births / 1,000 Women |
| 15 to 19 years | 0 (0.0%) | 0.0 |
| 20 to 34 years | 0 (0.0%) | 0.0 |
| 35 to 50 years | 0 (0.0%) | 0.0 |
| Total | 0 (0.0%) | 0.0 |
Fertility by Age by Marriage Status in Napoleonville
| Age Bracket | Married | Unmarried |
| 15 to 19 years | 0 (0.0%) | 0 (0.0%) |
| 20 to 34 years | 0 (0.0%) | 0 (0.0%) |
| 35 to 50 years | 0 (0.0%) | 0 (0.0%) |
| Total | 0 (0.0%) | 0 (0.0%) |
Fertility by Education in Napoleonville
| Educational Attainment | Women with Births | Births / 1,000 Women |
| Less than High School | 0 (0.0%) | 0.0 |
| High School Diploma | 0 (0.0%) | 0.0 |
| College or Associate's Degree | 0 (0.0%) | 0.0 |
| Bachelor's Degree | 0 (0.0%) | 0.0 |
| Graduate Degree | 0 (0.0%) | 0.0 |
| Total | 0 (0.0%) | 0.0 |
Fertility by Education by Marriage Status in Napoleonville
| Educational Attainment | Married | Unmarried |
| Less than High School | 0 (0.0%) | 0 (0.0%) |
| High School Diploma | 0 (0.0%) | 0 (0.0%) |
| College or Associate's Degree | 0 (0.0%) | 0 (0.0%) |
| Bachelor's Degree | 0 (0.0%) | 0 (0.0%) |
| Graduate Degree | 0 (0.0%) | 0 (0.0%) |
| Total | 0 (0.0%) | 0 (0.0%) |
Employment Characteristics in Napoleonville
Employment by Class of Employer in Napoleonville
Among the 57 employed individuals in Napoleonville, private company employees (26 | 45.6%), state government employees (14 | 24.6%), and self-employed (not incorporated) (12 | 21.0%) make up the most common classes of employment.
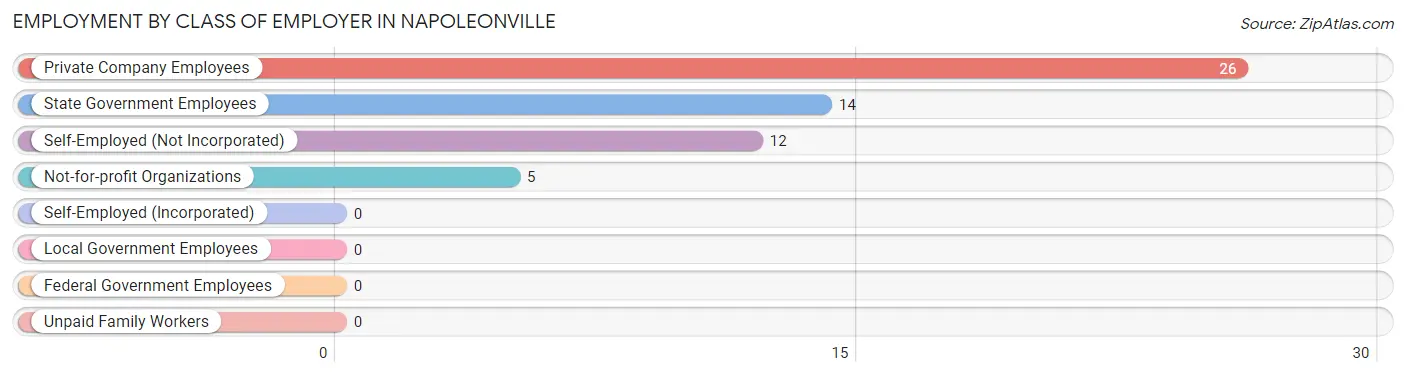
| Employer Class | # Employees | % Employees |
| Private Company Employees | 26 | 45.6% |
| Self-Employed (Incorporated) | 0 | 0.0% |
| Self-Employed (Not Incorporated) | 12 | 21.0% |
| Not-for-profit Organizations | 5 | 8.8% |
| Local Government Employees | 0 | 0.0% |
| State Government Employees | 14 | 24.6% |
| Federal Government Employees | 0 | 0.0% |
| Unpaid Family Workers | 0 | 0.0% |
| Total | 57 | 100.0% |
Employment Status by Age in Napoleonville
According to the labor force statistics for Napoleonville, out of the total population over 16 years of age (270), 41.9% or 113 individuals are in the labor force, with 49.6% or 56 of them unemployed. The age group with the highest labor force participation rate is 20 to 24 years, with 100.0% or 24 individuals in the labor force. Within the labor force, the 20 to 24 years age range has the highest percentage of unemployed individuals, with 100.0% or 24 of them being unemployed.
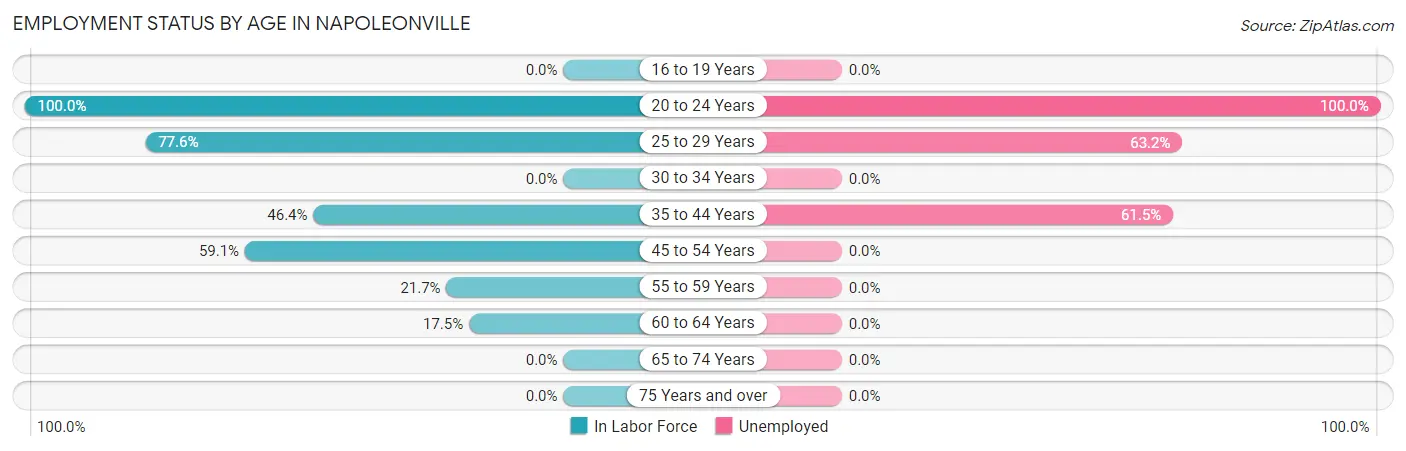
| Age Bracket | In Labor Force | Unemployed |
| 16 to 19 Years | 0 (0.0%) | 0 (0.0%) |
| 20 to 24 Years | 24 (100.0%) | 24 (100.0%) |
| 25 to 29 Years | 38 (77.6%) | 24 (63.2%) |
| 30 to 34 Years | 0 (0.0%) | 0 (0.0%) |
| 35 to 44 Years | 13 (46.4%) | 8 (61.5%) |
| 45 to 54 Years | 26 (59.1%) | 0 (0.0%) |
| 55 to 59 Years | 5 (21.7%) | 0 (0.0%) |
| 60 to 64 Years | 7 (17.5%) | 0 (0.0%) |
| 65 to 74 Years | 0 (0.0%) | 0 (0.0%) |
| 75 Years and over | 0 (0.0%) | 0 (0.0%) |
| Total | 113 (41.9%) | 56 (49.6%) |
Employment Status by Educational Attainment in Napoleonville
According to labor force statistics for Napoleonville, 48.4% of individuals (89) out of the total population between 25 and 64 years of age (184) are in the labor force, with 36.0% or 32 of them being unemployed. The group with the highest labor force participation rate are those with the educational attainment of high school diploma, with 63.8% or 44 individuals in the labor force. Within the labor force, individuals with high school diploma education have the highest percentage of unemployment, with 72.7% or 32 of them being unemployed.
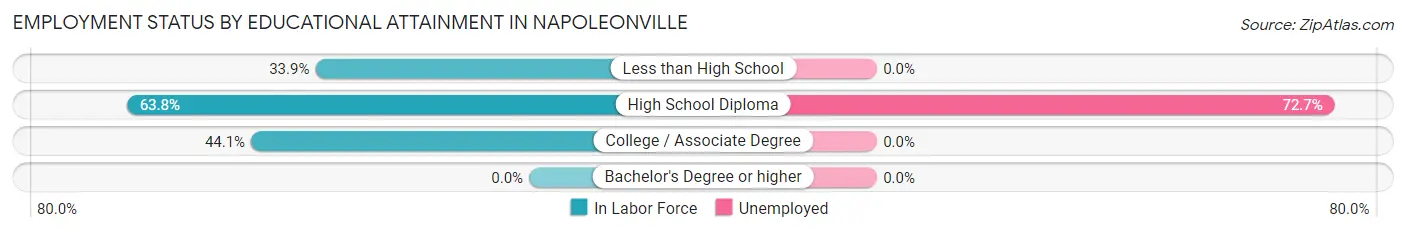
| Educational Attainment | In Labor Force | Unemployed |
| Less than High School | 19 (33.9%) | 0 (0.0%) |
| High School Diploma | 44 (63.8%) | 50 (72.7%) |
| College / Associate Degree | 26 (44.1%) | 0 (0.0%) |
| Bachelor's Degree or higher | 0 (0.0%) | 0 (0.0%) |
| Total | 89 (48.4%) | 66 (36.0%) |
Employment Occupations by Sex in Napoleonville
Management, Business, Science and Arts Occupations
The most common Management, Business, Science and Arts occupations in Napoleonville are , and Management (11 | 19.3%).
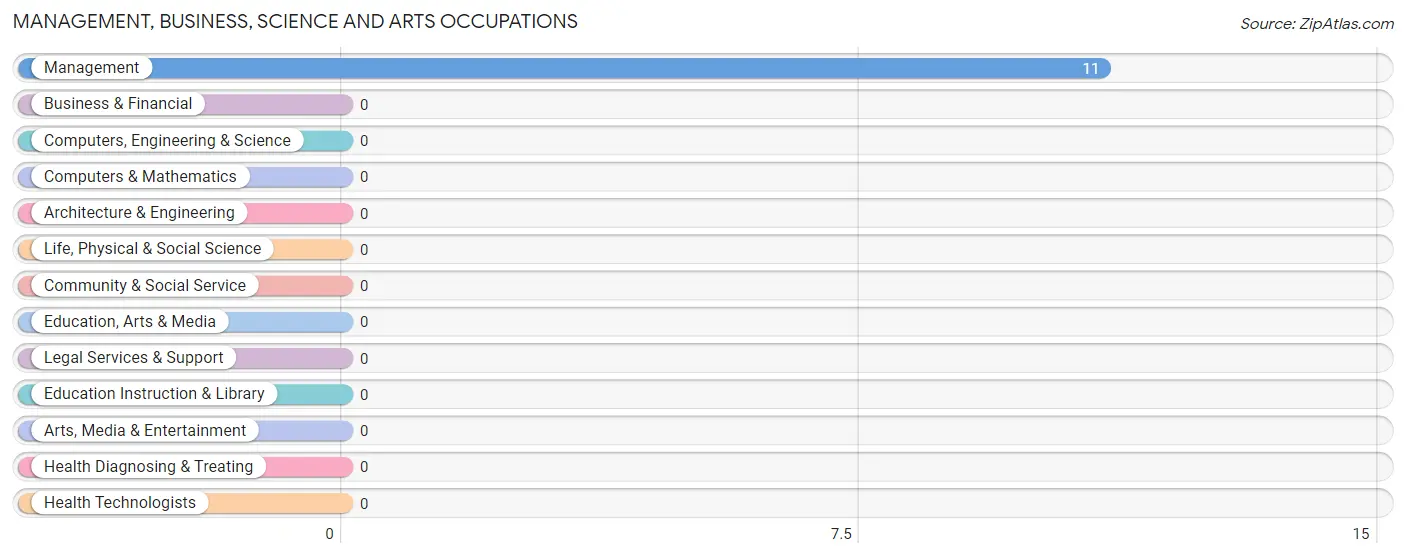
Management, Business, Science and Arts Occupations by Sex
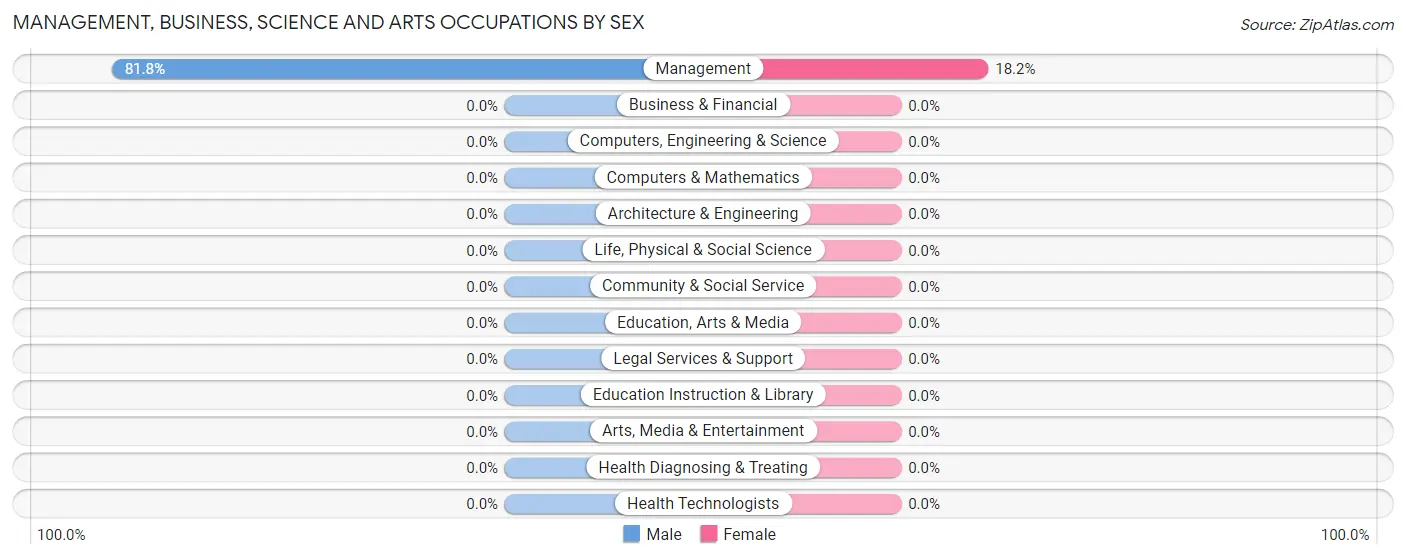
| Occupation | Male | Female |
| Management | 9 (81.8%) | 2 (18.2%) |
| Business & Financial | 0 (0.0%) | 0 (0.0%) |
| Computers, Engineering & Science | 0 (0.0%) | 0 (0.0%) |
| Computers & Mathematics | 0 (0.0%) | 0 (0.0%) |
| Architecture & Engineering | 0 (0.0%) | 0 (0.0%) |
| Life, Physical & Social Science | 0 (0.0%) | 0 (0.0%) |
| Community & Social Service | 0 (0.0%) | 0 (0.0%) |
| Education, Arts & Media | 0 (0.0%) | 0 (0.0%) |
| Legal Services & Support | 0 (0.0%) | 0 (0.0%) |
| Education Instruction & Library | 0 (0.0%) | 0 (0.0%) |
| Arts, Media & Entertainment | 0 (0.0%) | 0 (0.0%) |
| Health Diagnosing & Treating | 0 (0.0%) | 0 (0.0%) |
| Health Technologists | 0 (0.0%) | 0 (0.0%) |
| Total (Category) | 9 (81.8%) | 2 (18.2%) |
| Total (Overall) | 30 (52.6%) | 27 (47.4%) |
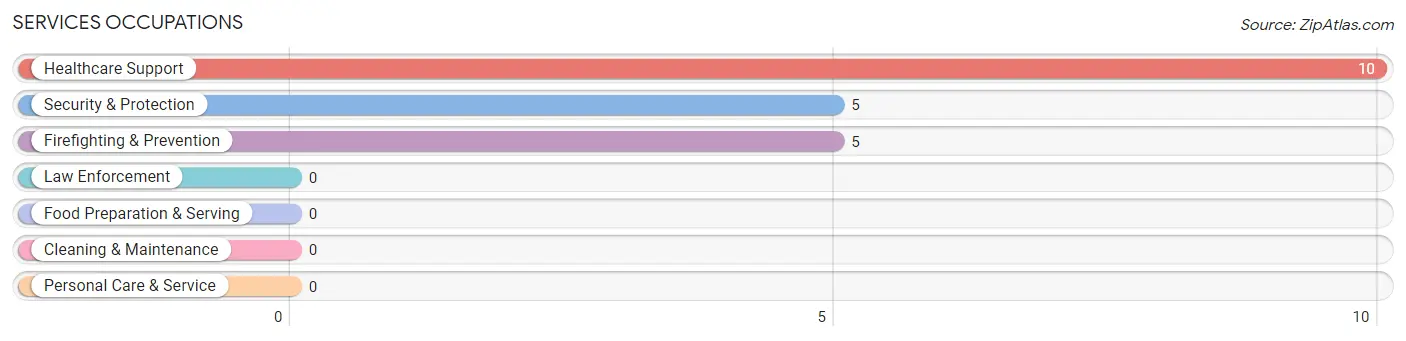
Services Occupations
The most common Services occupations in Napoleonville are Healthcare Support (10 | 17.5%), Security & Protection (5 | 8.8%), and Firefighting & Prevention (5 | 8.8%).
Services Occupations by Sex
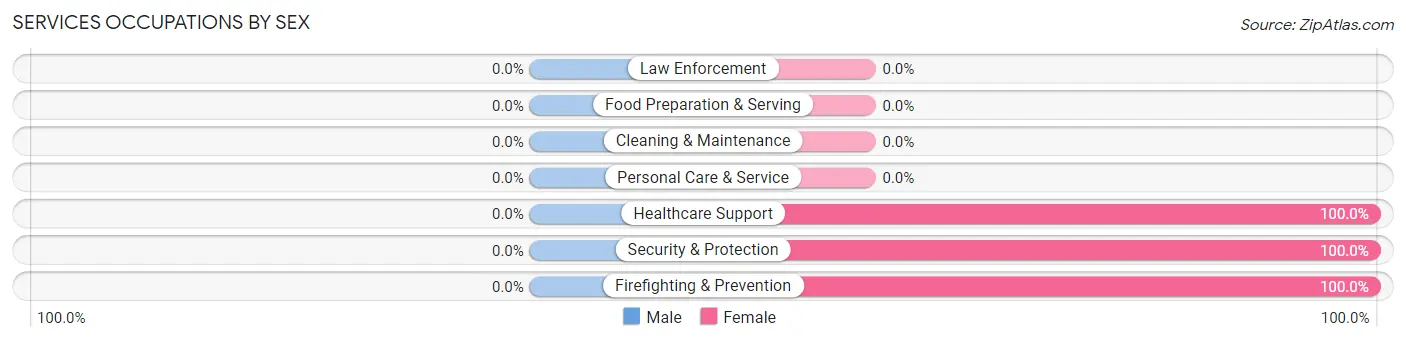
| Occupation | Male | Female |
| Healthcare Support | 0 (0.0%) | 10 (100.0%) |
| Security & Protection | 0 (0.0%) | 5 (100.0%) |
| Firefighting & Prevention | 0 (0.0%) | 5 (100.0%) |
| Law Enforcement | 0 (0.0%) | 0 (0.0%) |
| Food Preparation & Serving | 0 (0.0%) | 0 (0.0%) |
| Cleaning & Maintenance | 0 (0.0%) | 0 (0.0%) |
| Personal Care & Service | 0 (0.0%) | 0 (0.0%) |
| Total (Category) | 0 (0.0%) | 15 (100.0%) |
| Total (Overall) | 30 (52.6%) | 27 (47.4%) |
Sales and Office Occupations
The most common Sales and Office occupations in Napoleonville are , and Office & Administration (10 | 17.5%).

Sales and Office Occupations by Sex

| Occupation | Male | Female |
| Sales & Related | 0 (0.0%) | 0 (0.0%) |
| Office & Administration | 0 (0.0%) | 10 (100.0%) |
| Total (Category) | 0 (0.0%) | 10 (100.0%) |
| Total (Overall) | 30 (52.6%) | 27 (47.4%) |
Natural Resources, Construction and Maintenance Occupations
The most common Natural Resources, Construction and Maintenance occupations in Napoleonville are Installation, Maintenance & Repair (12 | 21.0%), and Construction & Extraction (2 | 3.5%).

Natural Resources, Construction and Maintenance Occupations by Sex

| Occupation | Male | Female |
| Farming, Fishing & Forestry | 0 (0.0%) | 0 (0.0%) |
| Construction & Extraction | 2 (100.0%) | 0 (0.0%) |
| Installation, Maintenance & Repair | 12 (100.0%) | 0 (0.0%) |
| Total (Category) | 14 (100.0%) | 0 (0.0%) |
| Total (Overall) | 30 (52.6%) | 27 (47.4%) |
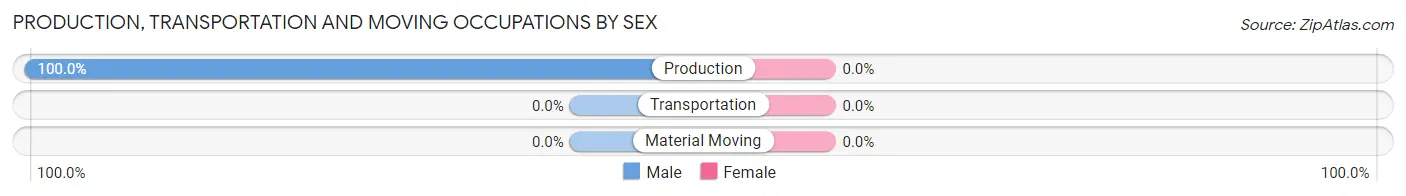
Production, Transportation and Moving Occupations
The most common Production, Transportation and Moving occupations in Napoleonville are , and Production (7 | 12.3%).
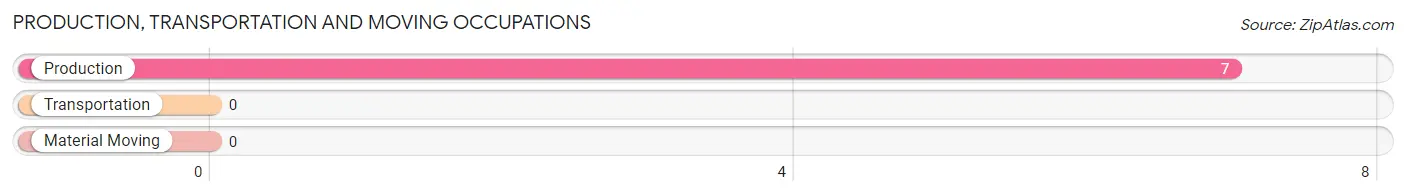
Production, Transportation and Moving Occupations by Sex
| Occupation | Male | Female |
| Production | 7 (100.0%) | 0 (0.0%) |
| Transportation | 0 (0.0%) | 0 (0.0%) |
| Material Moving | 0 (0.0%) | 0 (0.0%) |
| Total (Category) | 7 (100.0%) | 0 (0.0%) |
| Total (Overall) | 30 (52.6%) | 27 (47.4%) |
Employment Industries by Sex in Napoleonville
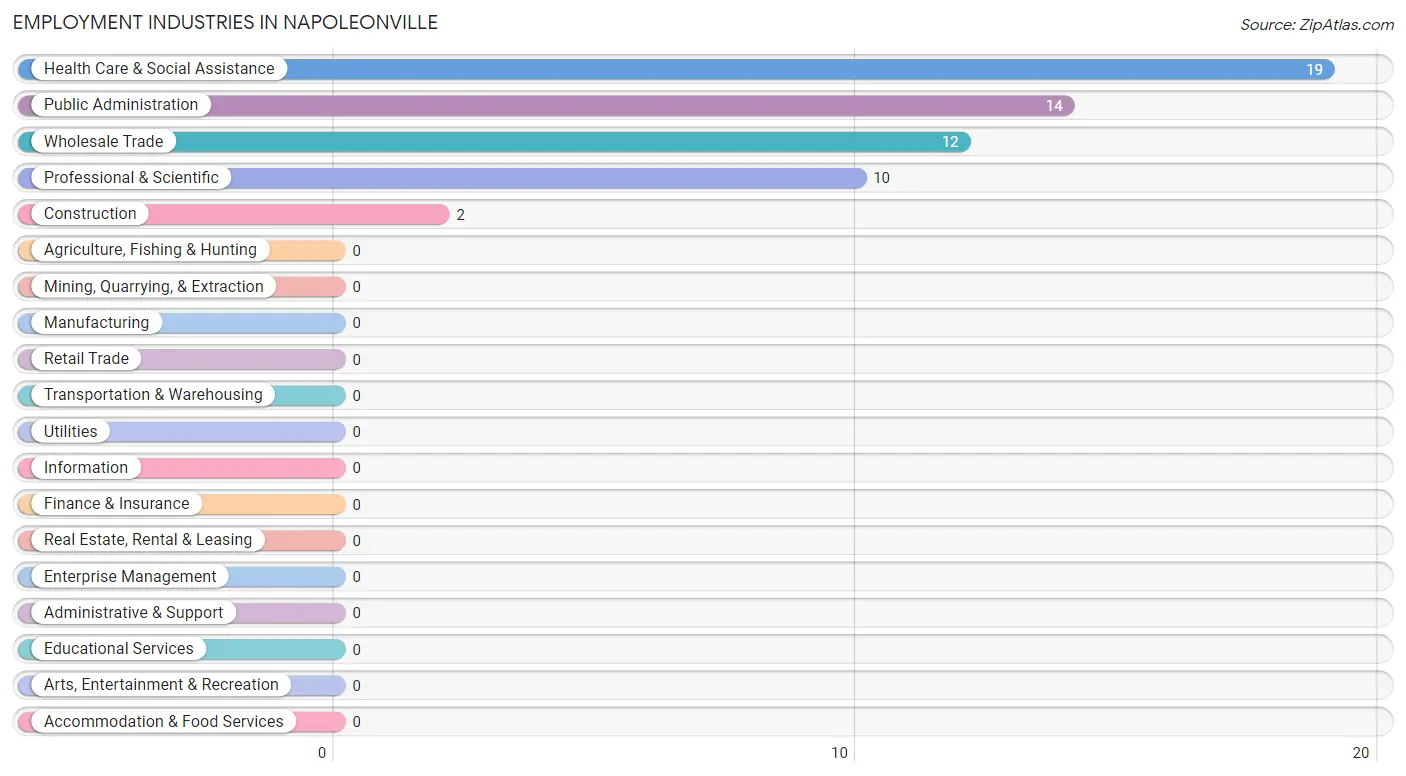
Employment Industries in Napoleonville
The major employment industries in Napoleonville include Health Care & Social Assistance (19 | 33.3%), Public Administration (14 | 24.6%), Wholesale Trade (12 | 21.0%), Professional & Scientific (10 | 17.5%), and Construction (2 | 3.5%).
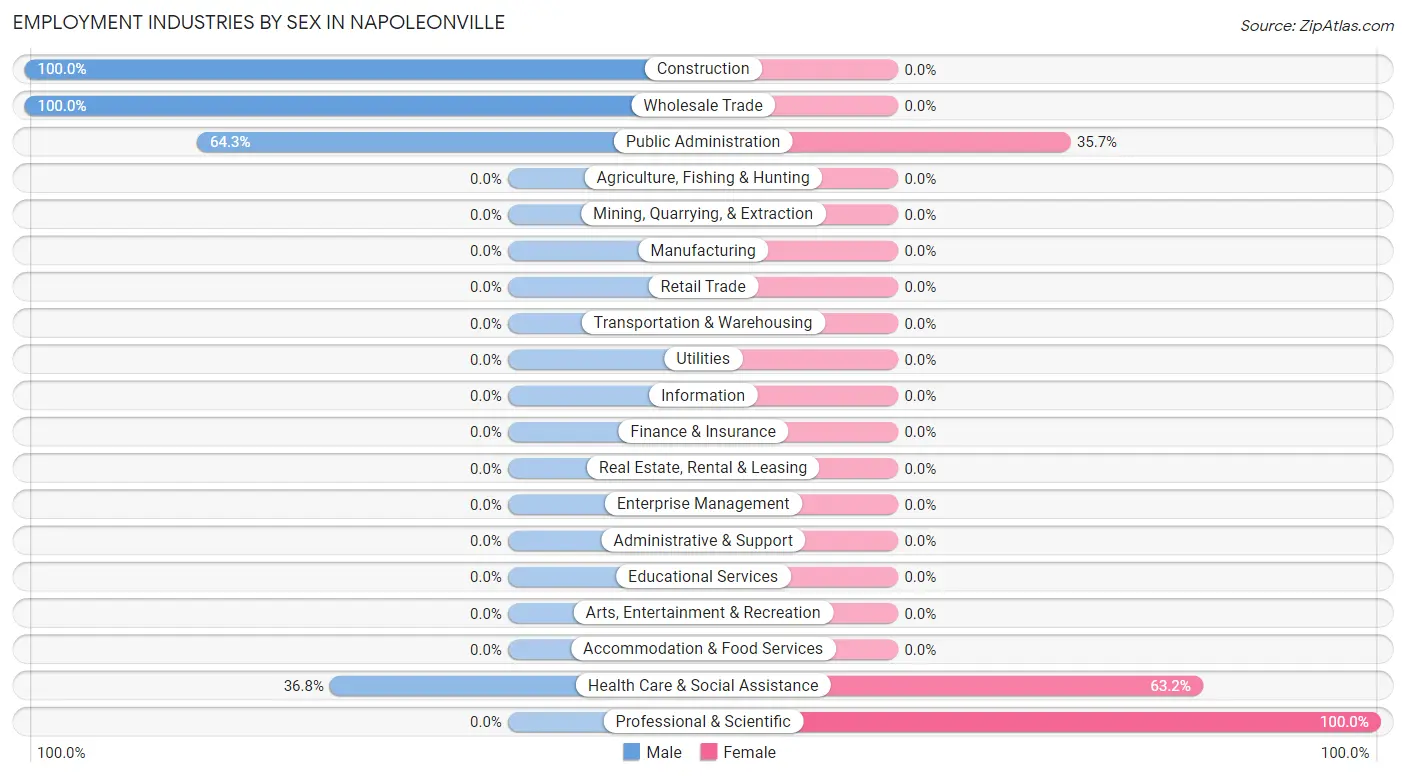
Employment Industries by Sex in Napoleonville
The Napoleonville industries that see more men than women are Construction (100.0%), Wholesale Trade (100.0%), and Public Administration (64.3%), whereas the industries that tend to have a higher number of women are Professional & Scientific (100.0%), Health Care & Social Assistance (63.2%), and Public Administration (35.7%).
| Industry | Male | Female |
| Agriculture, Fishing & Hunting | 0 (0.0%) | 0 (0.0%) |
| Mining, Quarrying, & Extraction | 0 (0.0%) | 0 (0.0%) |
| Construction | 2 (100.0%) | 0 (0.0%) |
| Manufacturing | 0 (0.0%) | 0 (0.0%) |
| Wholesale Trade | 12 (100.0%) | 0 (0.0%) |
| Retail Trade | 0 (0.0%) | 0 (0.0%) |
| Transportation & Warehousing | 0 (0.0%) | 0 (0.0%) |
| Utilities | 0 (0.0%) | 0 (0.0%) |
| Information | 0 (0.0%) | 0 (0.0%) |
| Finance & Insurance | 0 (0.0%) | 0 (0.0%) |
| Real Estate, Rental & Leasing | 0 (0.0%) | 0 (0.0%) |
| Professional & Scientific | 0 (0.0%) | 10 (100.0%) |
| Enterprise Management | 0 (0.0%) | 0 (0.0%) |
| Administrative & Support | 0 (0.0%) | 0 (0.0%) |
| Educational Services | 0 (0.0%) | 0 (0.0%) |
| Health Care & Social Assistance | 7 (36.8%) | 12 (63.2%) |
| Arts, Entertainment & Recreation | 0 (0.0%) | 0 (0.0%) |
| Accommodation & Food Services | 0 (0.0%) | 0 (0.0%) |
| Public Administration | 9 (64.3%) | 5 (35.7%) |
| Total | 30 (52.6%) | 27 (47.4%) |
Education in Napoleonville
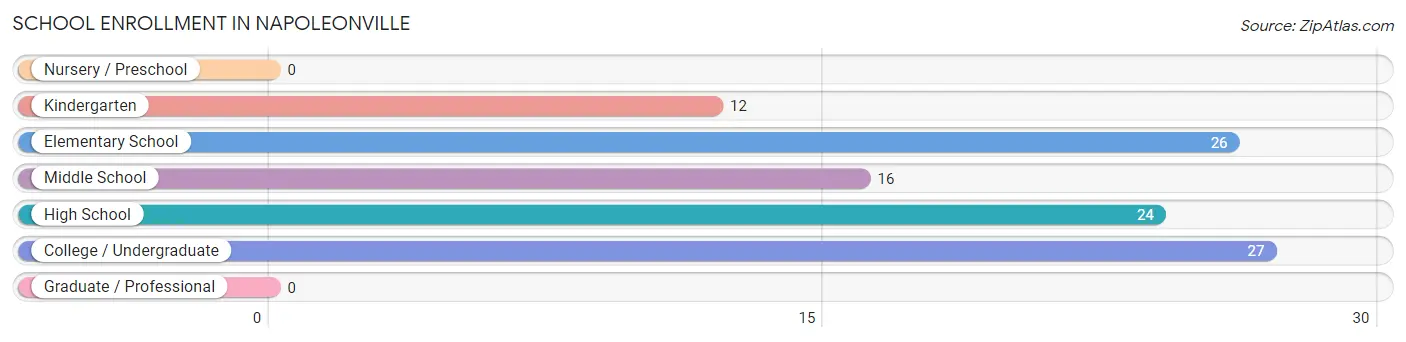
School Enrollment in Napoleonville
The most common levels of schooling among the 105 students in Napoleonville are college / undergraduate (27 | 25.7%), elementary school (26 | 24.8%), and high school (24 | 22.9%).
| School Level | # Students | % Students |
| Nursery / Preschool | 0 | 0.0% |
| Kindergarten | 12 | 11.4% |
| Elementary School | 26 | 24.8% |
| Middle School | 16 | 15.2% |
| High School | 24 | 22.9% |
| College / Undergraduate | 27 | 25.7% |
| Graduate / Professional | 0 | 0.0% |
| Total | 105 | 100.0% |
School Enrollment by Age by Funding Source in Napoleonville
Out of a total of 105 students who are enrolled in schools in Napoleonville, 7 (6.7%) attend a private institution, while the remaining 98 (93.3%) are enrolled in public schools. The age group of 25 to 34 year olds has the highest likelihood of being enrolled in private schools, with 2 (100.0% in the age bracket) enrolled. Conversely, the age group of 5 to 9 year old has the lowest likelihood of being enrolled in a private school, with 38 (100.0% in the age bracket) attending a public institution.
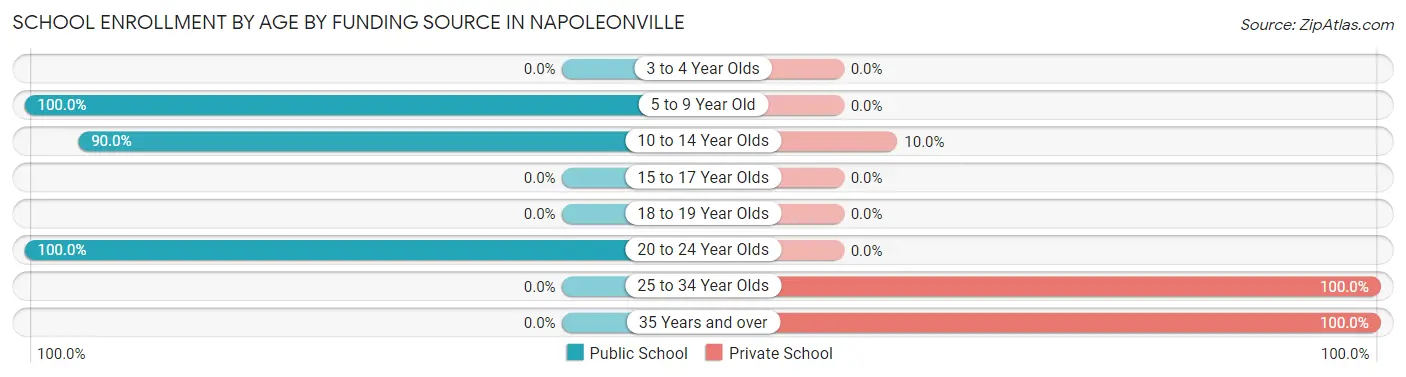
| Age Bracket | Public School | Private School |
| 3 to 4 Year Olds | 0 (0.0%) | 0 (0.0%) |
| 5 to 9 Year Old | 38 (100.0%) | 0 (0.0%) |
| 10 to 14 Year Olds | 36 (90.0%) | 4 (10.0%) |
| 15 to 17 Year Olds | 0 (0.0%) | 0 (0.0%) |
| 18 to 19 Year Olds | 0 (0.0%) | 0 (0.0%) |
| 20 to 24 Year Olds | 24 (100.0%) | 0 (0.0%) |
| 25 to 34 Year Olds | 0 (0.0%) | 2 (100.0%) |
| 35 Years and over | 0 (0.0%) | 1 (100.0%) |
| Total | 98 (93.3%) | 7 (6.7%) |
Educational Attainment by Field of Study in Napoleonville
, and business (2 | 100.0%) are the most common fields of study among 2 individuals in Napoleonville who have obtained a bachelor's degree or higher.
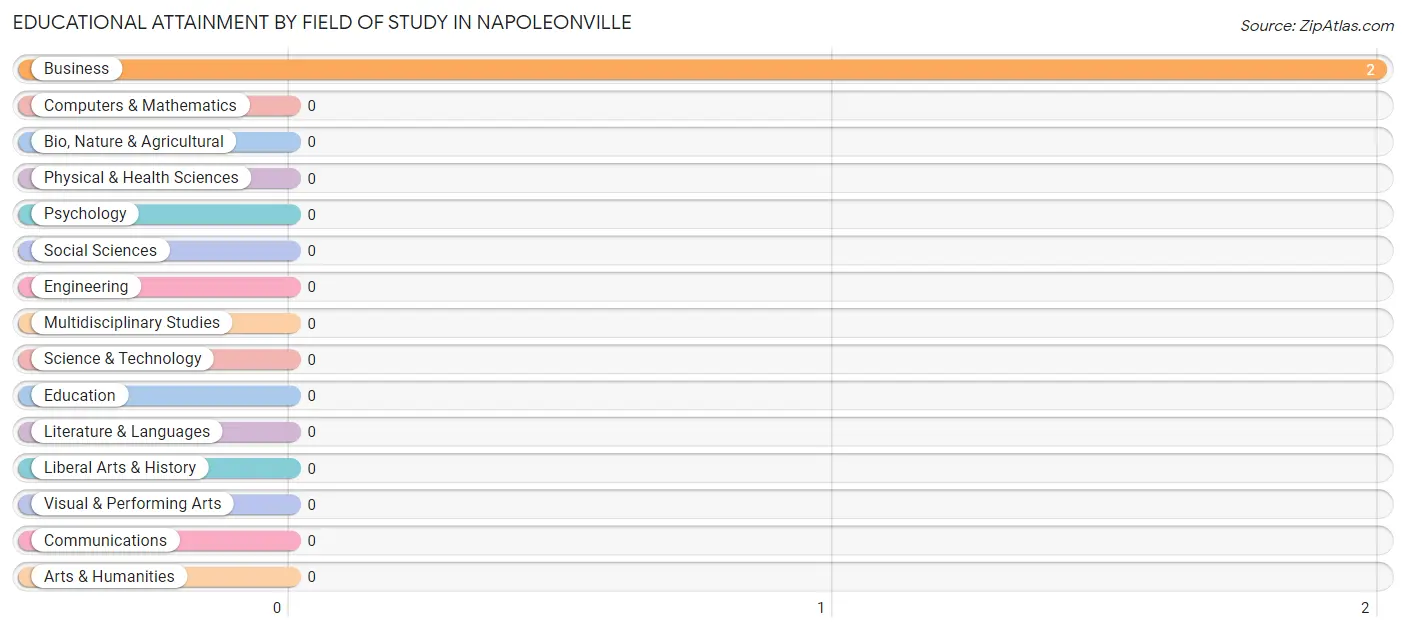
| Field of Study | # Graduates | % Graduates |
| Computers & Mathematics | 0 | 0.0% |
| Bio, Nature & Agricultural | 0 | 0.0% |
| Physical & Health Sciences | 0 | 0.0% |
| Psychology | 0 | 0.0% |
| Social Sciences | 0 | 0.0% |
| Engineering | 0 | 0.0% |
| Multidisciplinary Studies | 0 | 0.0% |
| Science & Technology | 0 | 0.0% |
| Business | 2 | 100.0% |
| Education | 0 | 0.0% |
| Literature & Languages | 0 | 0.0% |
| Liberal Arts & History | 0 | 0.0% |
| Visual & Performing Arts | 0 | 0.0% |
| Communications | 0 | 0.0% |
| Arts & Humanities | 0 | 0.0% |
| Total | 2 | 100.0% |
Transportation & Commute in Napoleonville
Vehicle Availability by Sex in Napoleonville
The most prevalent vehicle ownership categories in Napoleonville are males with 1 vehicle (23, accounting for 76.7%) and females with 1 vehicle (20, making up 85.2%).
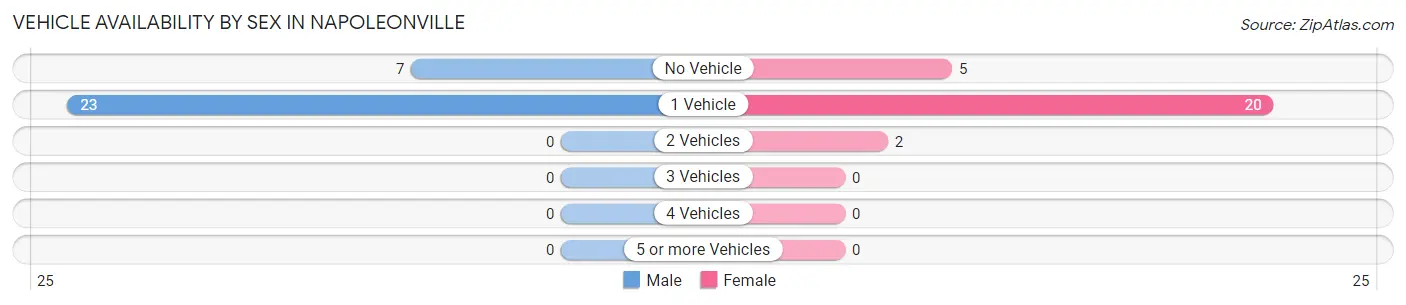
| Vehicles Available | Male | Female |
| No Vehicle | 7 (23.3%) | 5 (18.5%) |
| 1 Vehicle | 23 (76.7%) | 20 (74.1%) |
| 2 Vehicles | 0 (0.0%) | 2 (7.4%) |
| 3 Vehicles | 0 (0.0%) | 0 (0.0%) |
| 4 Vehicles | 0 (0.0%) | 0 (0.0%) |
| 5 or more Vehicles | 0 (0.0%) | 0 (0.0%) |
| Total | 30 (100.0%) | 27 (100.0%) |
Commute Time in Napoleonville
The most frequently occuring commute durations in Napoleonville are 5 to 9 minutes (24 commuters, 42.1%), 30 to 34 minutes (12 commuters, 21.0%), and 15 to 19 minutes (7 commuters, 12.3%).
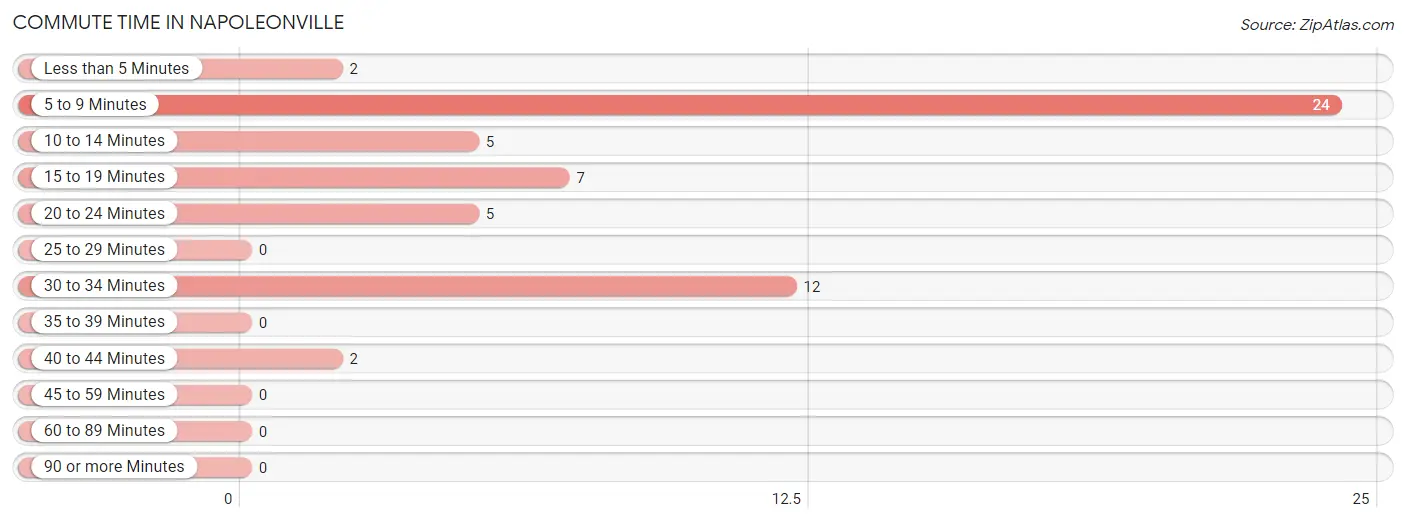
| Commute Time | # Commuters | % Commuters |
| Less than 5 Minutes | 2 | 3.5% |
| 5 to 9 Minutes | 24 | 42.1% |
| 10 to 14 Minutes | 5 | 8.8% |
| 15 to 19 Minutes | 7 | 12.3% |
| 20 to 24 Minutes | 5 | 8.8% |
| 25 to 29 Minutes | 0 | 0.0% |
| 30 to 34 Minutes | 12 | 21.0% |
| 35 to 39 Minutes | 0 | 0.0% |
| 40 to 44 Minutes | 2 | 3.5% |
| 45 to 59 Minutes | 0 | 0.0% |
| 60 to 89 Minutes | 0 | 0.0% |
| 90 or more Minutes | 0 | 0.0% |
Commute Time by Sex in Napoleonville
The most common commute times in Napoleonville are 30 to 34 minutes (12 commuters, 40.0%) for males and 5 to 9 minutes (15 commuters, 55.6%) for females.
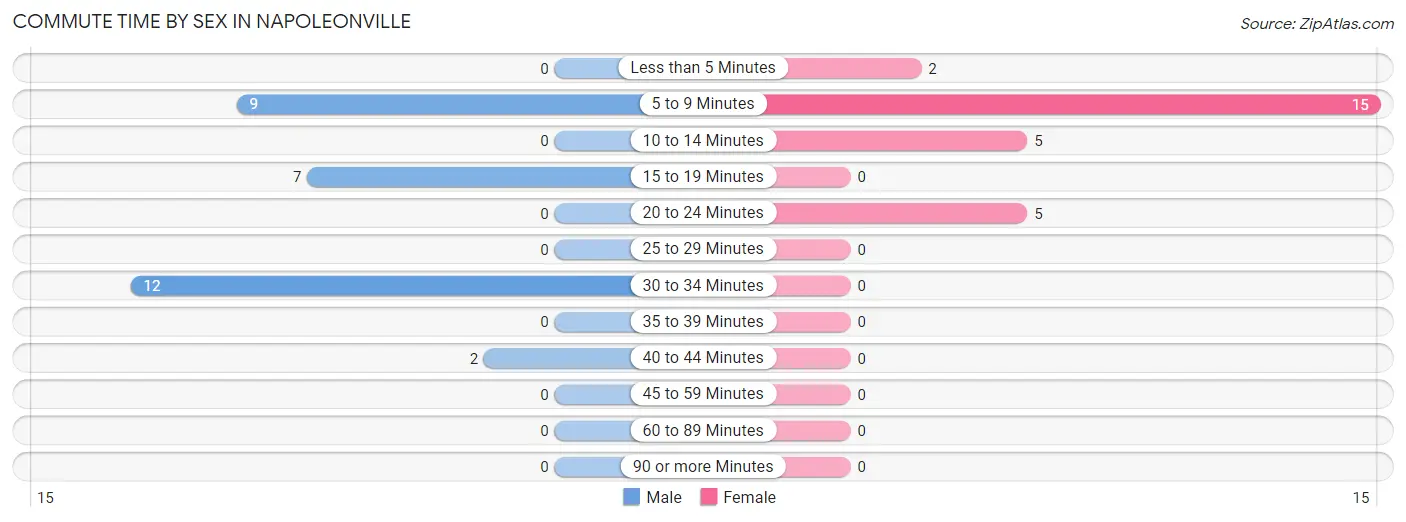
| Commute Time | Male | Female |
| Less than 5 Minutes | 0 (0.0%) | 2 (7.4%) |
| 5 to 9 Minutes | 9 (30.0%) | 15 (55.6%) |
| 10 to 14 Minutes | 0 (0.0%) | 5 (18.5%) |
| 15 to 19 Minutes | 7 (23.3%) | 0 (0.0%) |
| 20 to 24 Minutes | 0 (0.0%) | 5 (18.5%) |
| 25 to 29 Minutes | 0 (0.0%) | 0 (0.0%) |
| 30 to 34 Minutes | 12 (40.0%) | 0 (0.0%) |
| 35 to 39 Minutes | 0 (0.0%) | 0 (0.0%) |
| 40 to 44 Minutes | 2 (6.7%) | 0 (0.0%) |
| 45 to 59 Minutes | 0 (0.0%) | 0 (0.0%) |
| 60 to 89 Minutes | 0 (0.0%) | 0 (0.0%) |
| 90 or more Minutes | 0 (0.0%) | 0 (0.0%) |
Time of Departure to Work by Sex in Napoleonville
The most frequent times of departure to work in Napoleonville are 5:00 AM to 5:29 AM (21, 70.0%) for males and 7:30 AM to 7:59 AM (15, 55.6%) for females.
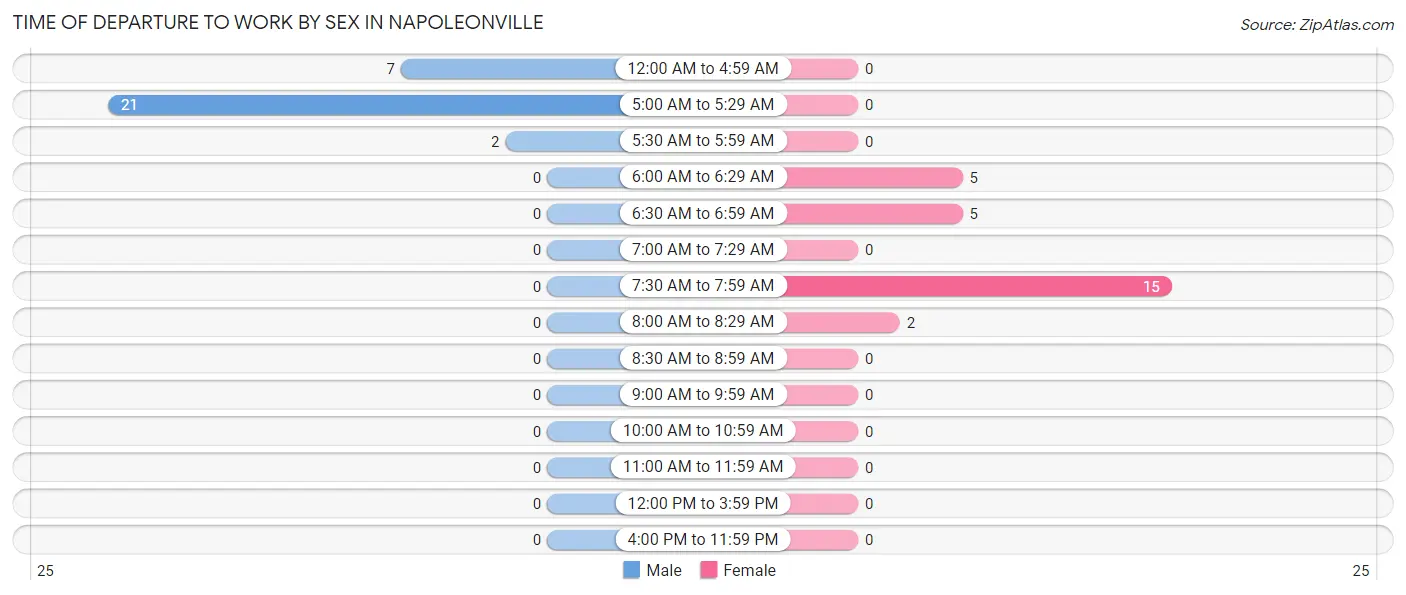
| Time of Departure | Male | Female |
| 12:00 AM to 4:59 AM | 7 (23.3%) | 0 (0.0%) |
| 5:00 AM to 5:29 AM | 21 (70.0%) | 0 (0.0%) |
| 5:30 AM to 5:59 AM | 2 (6.7%) | 0 (0.0%) |
| 6:00 AM to 6:29 AM | 0 (0.0%) | 5 (18.5%) |
| 6:30 AM to 6:59 AM | 0 (0.0%) | 5 (18.5%) |
| 7:00 AM to 7:29 AM | 0 (0.0%) | 0 (0.0%) |
| 7:30 AM to 7:59 AM | 0 (0.0%) | 15 (55.6%) |
| 8:00 AM to 8:29 AM | 0 (0.0%) | 2 (7.4%) |
| 8:30 AM to 8:59 AM | 0 (0.0%) | 0 (0.0%) |
| 9:00 AM to 9:59 AM | 0 (0.0%) | 0 (0.0%) |
| 10:00 AM to 10:59 AM | 0 (0.0%) | 0 (0.0%) |
| 11:00 AM to 11:59 AM | 0 (0.0%) | 0 (0.0%) |
| 12:00 PM to 3:59 PM | 0 (0.0%) | 0 (0.0%) |
| 4:00 PM to 11:59 PM | 0 (0.0%) | 0 (0.0%) |
| Total | 30 (100.0%) | 27 (100.0%) |
Housing Occupancy in Napoleonville
Occupancy by Ownership in Napoleonville
Of the total 150 dwellings in Napoleonville, owner-occupied units account for 63 (42.0%), while renter-occupied units make up 87 (58.0%).
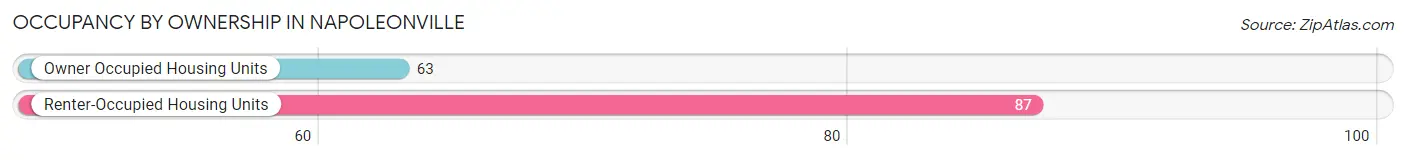
| Occupancy | # Housing Units | % Housing Units |
| Owner Occupied Housing Units | 63 | 42.0% |
| Renter-Occupied Housing Units | 87 | 58.0% |
| Total Occupied Housing Units | 150 | 100.0% |
Occupancy by Household Size in Napoleonville
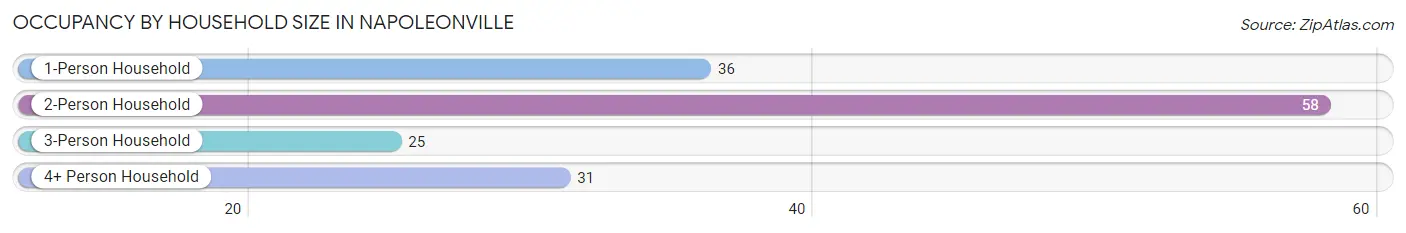
| Household Size | # Housing Units | % Housing Units |
| 1-Person Household | 36 | 24.0% |
| 2-Person Household | 58 | 38.7% |
| 3-Person Household | 25 | 16.7% |
| 4+ Person Household | 31 | 20.7% |
| Total Housing Units | 150 | 100.0% |
Occupancy by Ownership by Household Size in Napoleonville
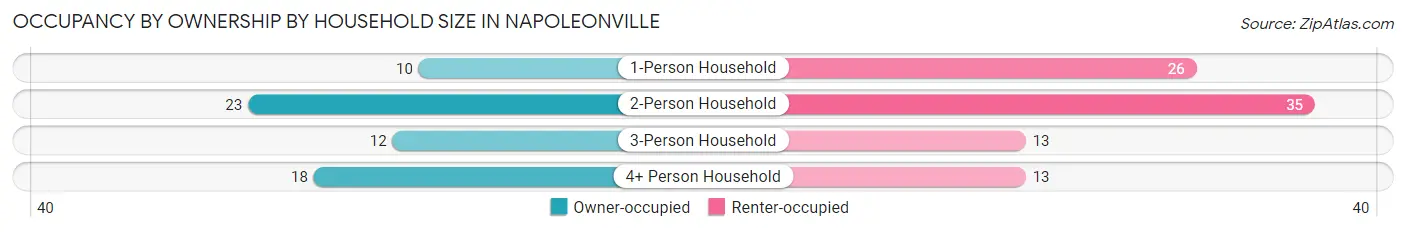
| Household Size | Owner-occupied | Renter-occupied |
| 1-Person Household | 10 (27.8%) | 26 (72.2%) |
| 2-Person Household | 23 (39.7%) | 35 (60.3%) |
| 3-Person Household | 12 (48.0%) | 13 (52.0%) |
| 4+ Person Household | 18 (58.1%) | 13 (41.9%) |
| Total Housing Units | 63 (42.0%) | 87 (58.0%) |
Occupancy by Educational Attainment in Napoleonville
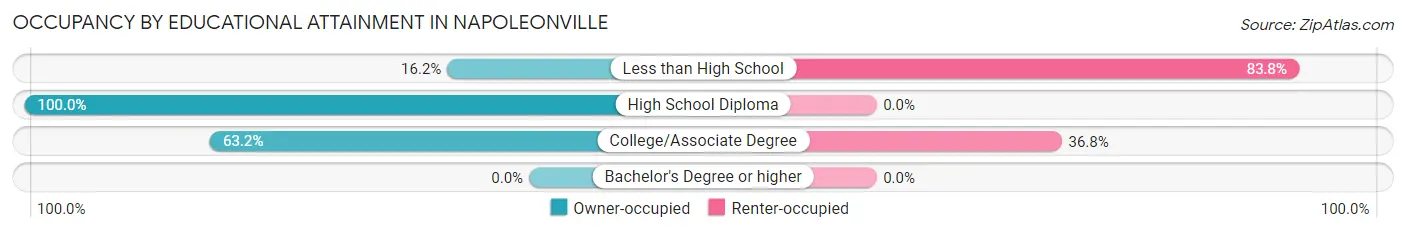
| Household Size | Owner-occupied | Renter-occupied |
| Less than High School | 12 (16.2%) | 62 (83.8%) |
| High School Diploma | 8 (100.0%) | 0 (0.0%) |
| College/Associate Degree | 43 (63.2%) | 25 (36.8%) |
| Bachelor's Degree or higher | 0 (0.0%) | 0 (0.0%) |
Occupancy by Age of Householder in Napoleonville
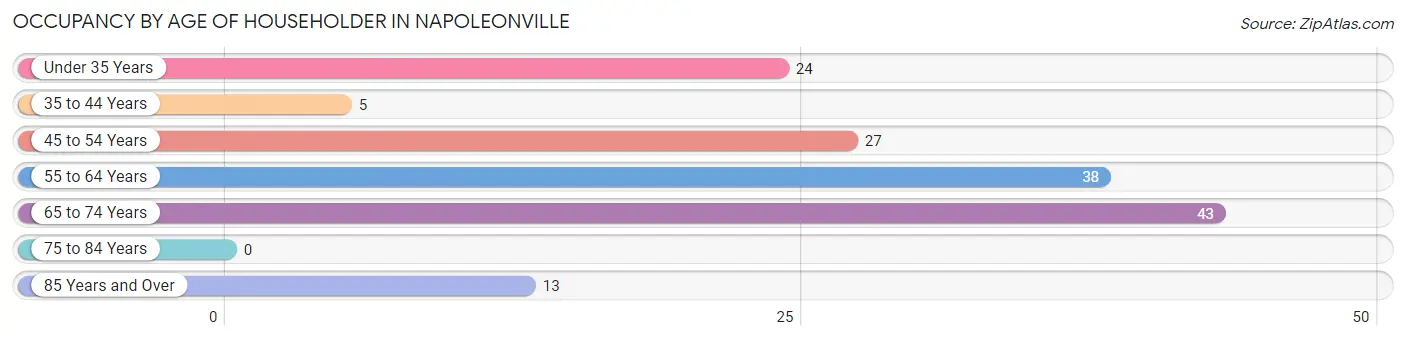
| Age Bracket | # Households | % Households |
| Under 35 Years | 24 | 16.0% |
| 35 to 44 Years | 5 | 3.3% |
| 45 to 54 Years | 27 | 18.0% |
| 55 to 64 Years | 38 | 25.3% |
| 65 to 74 Years | 43 | 28.7% |
| 75 to 84 Years | 0 | 0.0% |
| 85 Years and Over | 13 | 8.7% |
| Total | 150 | 100.0% |
Housing Finances in Napoleonville
Median Income by Occupancy in Napoleonville
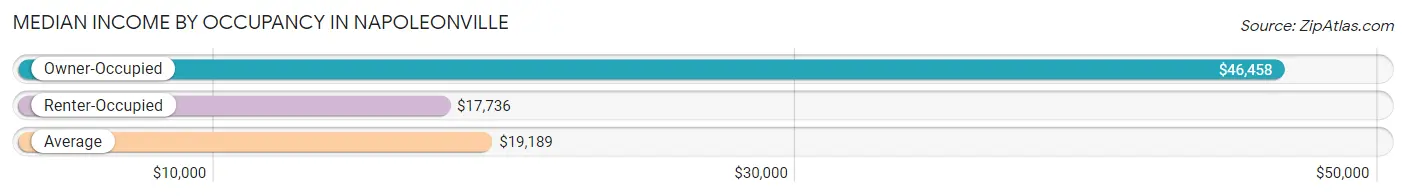
| Occupancy Type | # Households | Median Income |
| Owner-Occupied | 63 (42.0%) | $46,458 |
| Renter-Occupied | 87 (58.0%) | $17,736 |
| Average | 150 (100.0%) | $19,189 |
Occupancy by Householder Income Bracket in Napoleonville
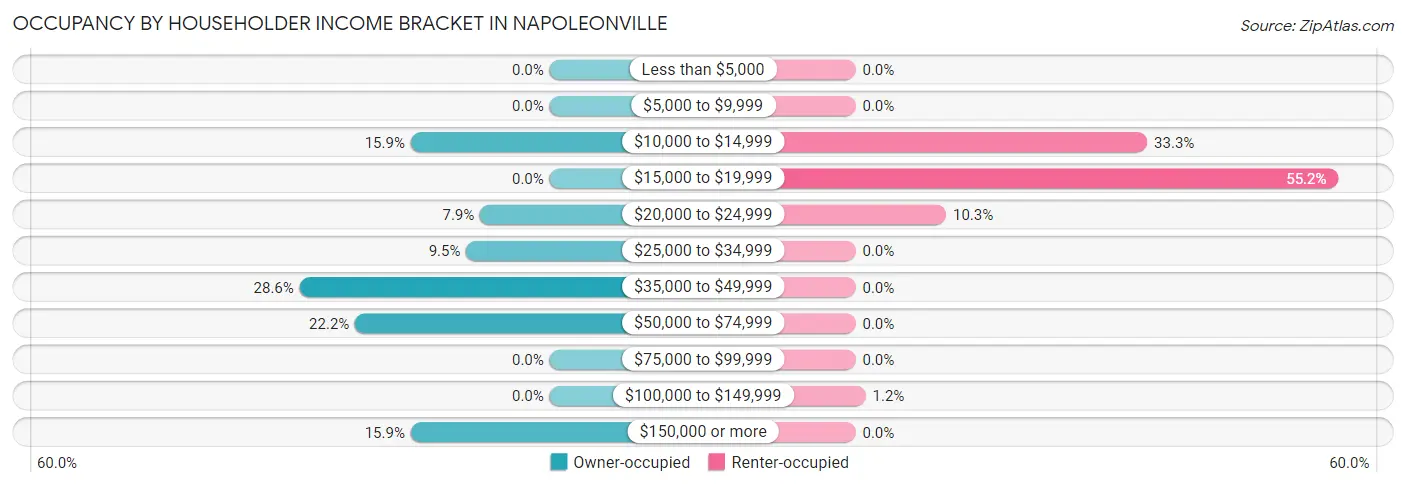
| Income Bracket | Owner-occupied | Renter-occupied |
| Less than $5,000 | 0 (0.0%) | 0 (0.0%) |
| $5,000 to $9,999 | 0 (0.0%) | 0 (0.0%) |
| $10,000 to $14,999 | 10 (15.9%) | 29 (33.3%) |
| $15,000 to $19,999 | 0 (0.0%) | 48 (55.2%) |
| $20,000 to $24,999 | 5 (7.9%) | 9 (10.3%) |
| $25,000 to $34,999 | 6 (9.5%) | 0 (0.0%) |
| $35,000 to $49,999 | 18 (28.6%) | 0 (0.0%) |
| $50,000 to $74,999 | 14 (22.2%) | 0 (0.0%) |
| $75,000 to $99,999 | 0 (0.0%) | 0 (0.0%) |
| $100,000 to $149,999 | 0 (0.0%) | 1 (1.1%) |
| $150,000 or more | 10 (15.9%) | 0 (0.0%) |
| Total | 63 (100.0%) | 87 (100.0%) |
Monthly Housing Cost Tiers in Napoleonville
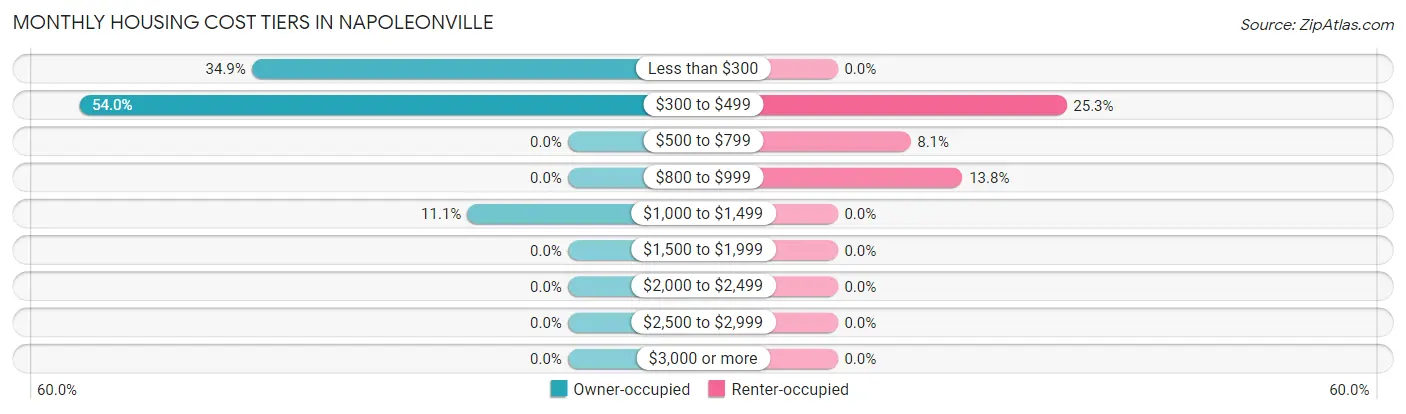
| Monthly Cost | Owner-occupied | Renter-occupied |
| Less than $300 | 22 (34.9%) | 0 (0.0%) |
| $300 to $499 | 34 (54.0%) | 22 (25.3%) |
| $500 to $799 | 0 (0.0%) | 7 (8.1%) |
| $800 to $999 | 0 (0.0%) | 12 (13.8%) |
| $1,000 to $1,499 | 7 (11.1%) | 0 (0.0%) |
| $1,500 to $1,999 | 0 (0.0%) | 0 (0.0%) |
| $2,000 to $2,499 | 0 (0.0%) | 0 (0.0%) |
| $2,500 to $2,999 | 0 (0.0%) | 0 (0.0%) |
| $3,000 or more | 0 (0.0%) | 0 (0.0%) |
| Total | 63 (100.0%) | 87 (100.0%) |
Physical Housing Characteristics in Napoleonville
Housing Structures in Napoleonville
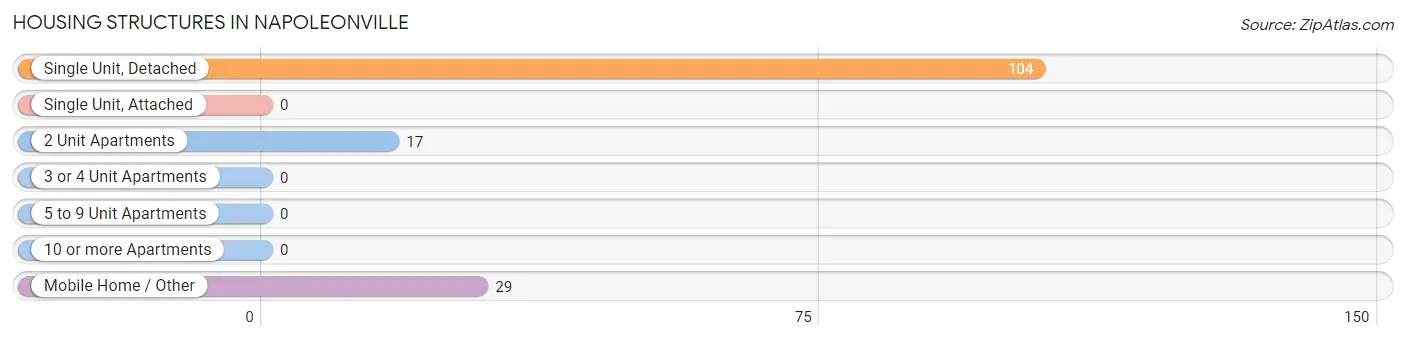
| Structure Type | # Housing Units | % Housing Units |
| Single Unit, Detached | 104 | 69.3% |
| Single Unit, Attached | 0 | 0.0% |
| 2 Unit Apartments | 17 | 11.3% |
| 3 or 4 Unit Apartments | 0 | 0.0% |
| 5 to 9 Unit Apartments | 0 | 0.0% |
| 10 or more Apartments | 0 | 0.0% |
| Mobile Home / Other | 29 | 19.3% |
| Total | 150 | 100.0% |
Housing Structures by Occupancy in Napoleonville
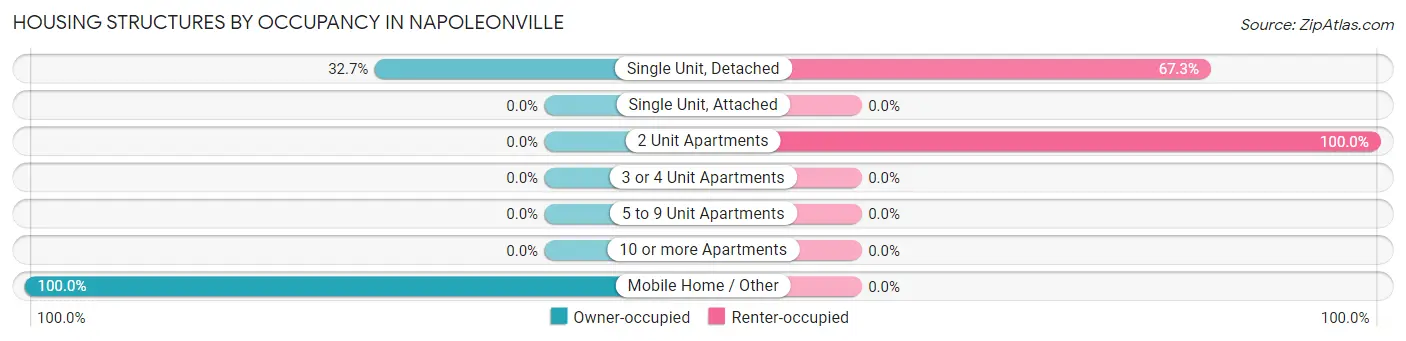
| Structure Type | Owner-occupied | Renter-occupied |
| Single Unit, Detached | 34 (32.7%) | 70 (67.3%) |
| Single Unit, Attached | 0 (0.0%) | 0 (0.0%) |
| 2 Unit Apartments | 0 (0.0%) | 17 (100.0%) |
| 3 or 4 Unit Apartments | 0 (0.0%) | 0 (0.0%) |
| 5 to 9 Unit Apartments | 0 (0.0%) | 0 (0.0%) |
| 10 or more Apartments | 0 (0.0%) | 0 (0.0%) |
| Mobile Home / Other | 29 (100.0%) | 0 (0.0%) |
| Total | 63 (42.0%) | 87 (58.0%) |
Housing Structures by Number of Rooms in Napoleonville
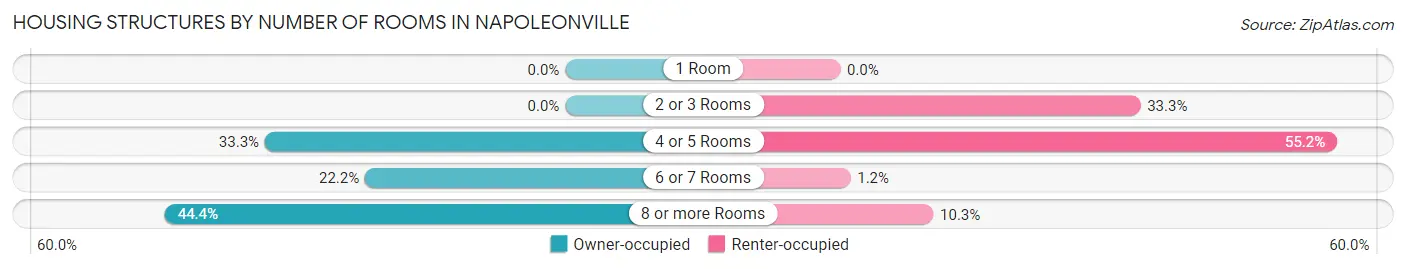
| Number of Rooms | Owner-occupied | Renter-occupied |
| 1 Room | 0 (0.0%) | 0 (0.0%) |
| 2 or 3 Rooms | 0 (0.0%) | 29 (33.3%) |
| 4 or 5 Rooms | 21 (33.3%) | 48 (55.2%) |
| 6 or 7 Rooms | 14 (22.2%) | 1 (1.1%) |
| 8 or more Rooms | 28 (44.4%) | 9 (10.3%) |
| Total | 63 (100.0%) | 87 (100.0%) |
Housing Structure by Heating Type in Napoleonville
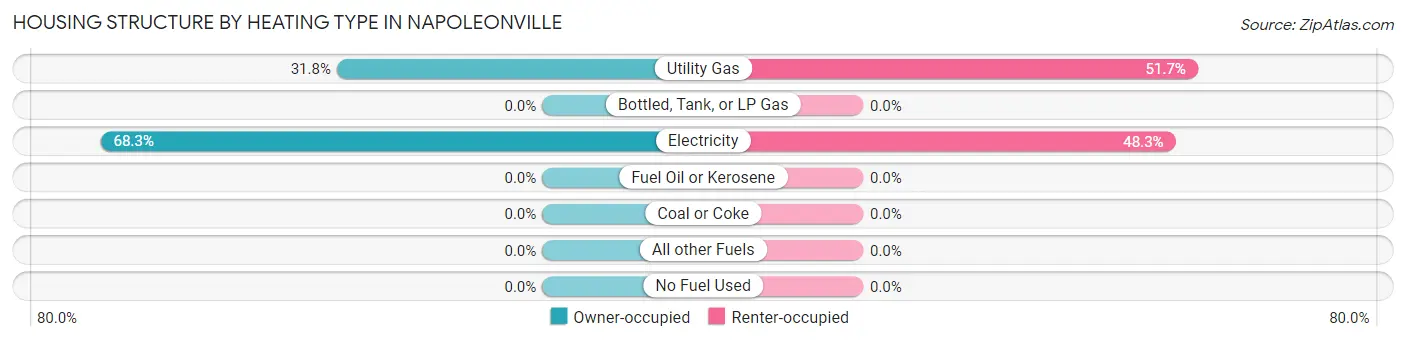
| Heating Type | Owner-occupied | Renter-occupied |
| Utility Gas | 20 (31.8%) | 45 (51.7%) |
| Bottled, Tank, or LP Gas | 0 (0.0%) | 0 (0.0%) |
| Electricity | 43 (68.2%) | 42 (48.3%) |
| Fuel Oil or Kerosene | 0 (0.0%) | 0 (0.0%) |
| Coal or Coke | 0 (0.0%) | 0 (0.0%) |
| All other Fuels | 0 (0.0%) | 0 (0.0%) |
| No Fuel Used | 0 (0.0%) | 0 (0.0%) |
| Total | 63 (100.0%) | 87 (100.0%) |
Household Vehicle Usage in Napoleonville
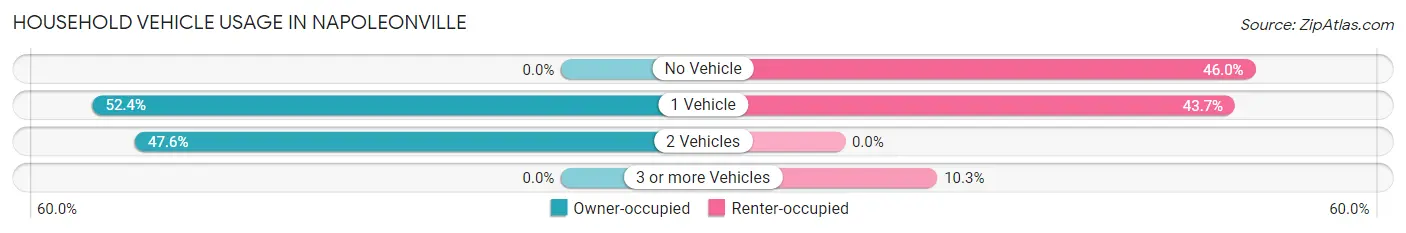
| Vehicles per Household | Owner-occupied | Renter-occupied |
| No Vehicle | 0 (0.0%) | 40 (46.0%) |
| 1 Vehicle | 33 (52.4%) | 38 (43.7%) |
| 2 Vehicles | 30 (47.6%) | 0 (0.0%) |
| 3 or more Vehicles | 0 (0.0%) | 9 (10.3%) |
| Total | 63 (100.0%) | 87 (100.0%) |
Real Estate & Mortgages in Napoleonville
Real Estate and Mortgage Overview in Napoleonville
| Characteristic | Without Mortgage | With Mortgage |
| Housing Units | 56 | 7 |
| Median Property Value | - | - |
| Median Household Income | $46,667 | $0 |
| Monthly Housing Costs | $363 | $0 |
| Real Estate Taxes | $199 | $0 |
Property Value by Mortgage Status in Napoleonville
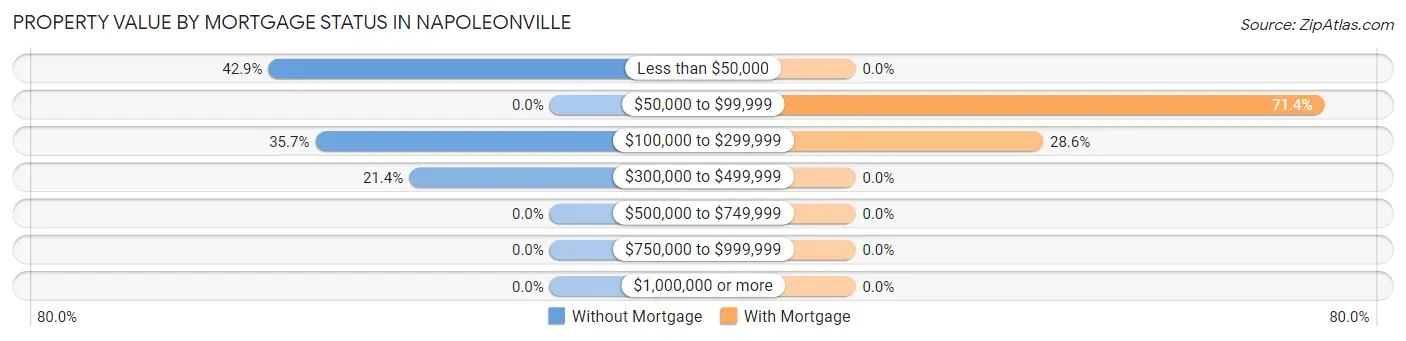
| Property Value | Without Mortgage | With Mortgage |
| Less than $50,000 | 24 (42.9%) | 0 (0.0%) |
| $50,000 to $99,999 | 0 (0.0%) | 5 (71.4%) |
| $100,000 to $299,999 | 20 (35.7%) | 2 (28.6%) |
| $300,000 to $499,999 | 12 (21.4%) | 0 (0.0%) |
| $500,000 to $749,999 | 0 (0.0%) | 0 (0.0%) |
| $750,000 to $999,999 | 0 (0.0%) | 0 (0.0%) |
| $1,000,000 or more | 0 (0.0%) | 0 (0.0%) |
| Total | 56 (100.0%) | 7 (100.0%) |
Household Income by Mortgage Status in Napoleonville
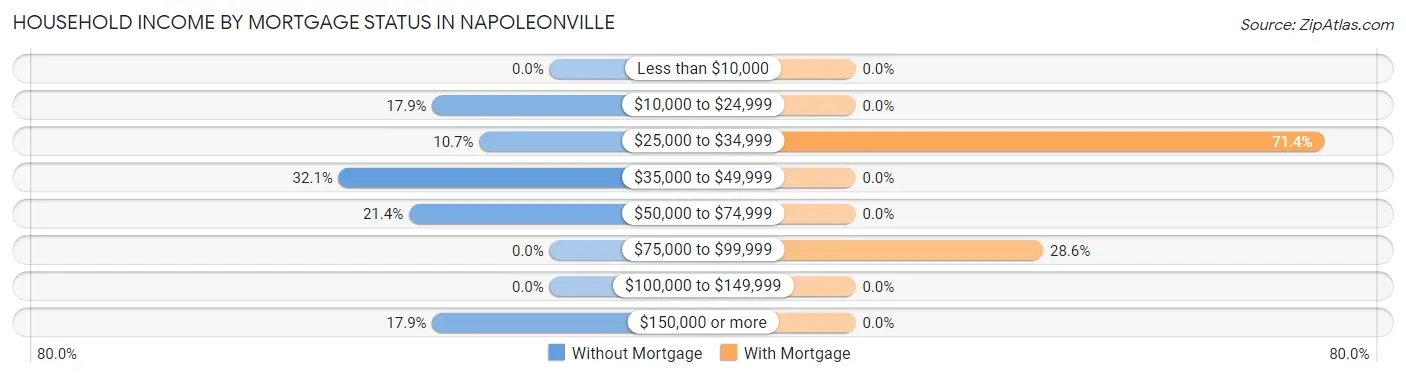
| Household Income | Without Mortgage | With Mortgage |
| Less than $10,000 | 0 (0.0%) | 0 (0.0%) |
| $10,000 to $24,999 | 10 (17.9%) | 0 (0.0%) |
| $25,000 to $34,999 | 6 (10.7%) | 5 (71.4%) |
| $35,000 to $49,999 | 18 (32.1%) | 0 (0.0%) |
| $50,000 to $74,999 | 12 (21.4%) | 0 (0.0%) |
| $75,000 to $99,999 | 0 (0.0%) | 2 (28.6%) |
| $100,000 to $149,999 | 0 (0.0%) | 0 (0.0%) |
| $150,000 or more | 10 (17.9%) | 0 (0.0%) |
| Total | 56 (100.0%) | 7 (100.0%) |
Property Value to Household Income Ratio in Napoleonville
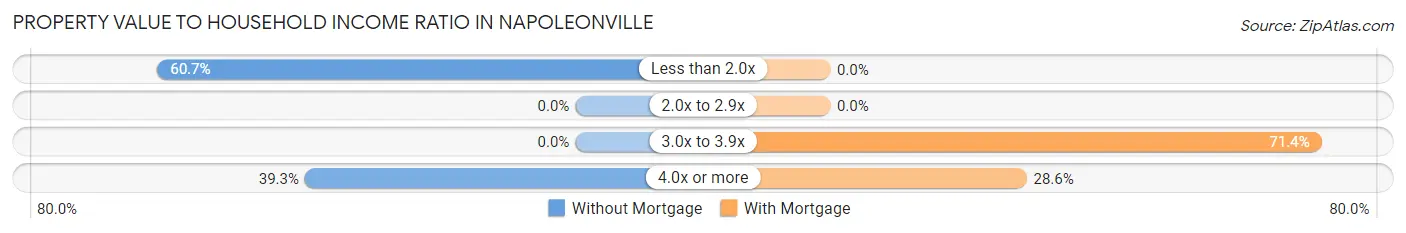
| Value-to-Income Ratio | Without Mortgage | With Mortgage |
| Less than 2.0x | 34 (60.7%) | 0 (0.0%) |
| 2.0x to 2.9x | 0 (0.0%) | 0 (0.0%) |
| 3.0x to 3.9x | 0 (0.0%) | 5 (71.4%) |
| 4.0x or more | 22 (39.3%) | 2 (28.6%) |
| Total | 56 (100.0%) | 7 (100.0%) |
Real Estate Taxes by Mortgage Status in Napoleonville
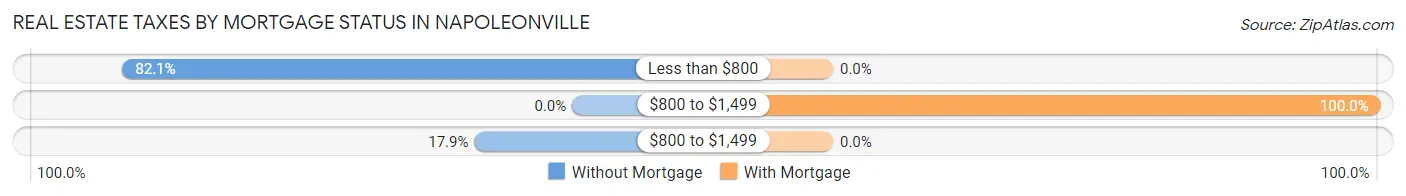
| Property Taxes | Without Mortgage | With Mortgage |
| Less than $800 | 46 (82.1%) | 0 (0.0%) |
| $800 to $1,499 | 0 (0.0%) | 7 (100.0%) |
| $800 to $1,499 | 10 (17.9%) | 0 (0.0%) |
| Total | 56 (100.0%) | 7 (100.0%) |
Health & Disability in Napoleonville
Health Insurance Coverage by Age in Napoleonville
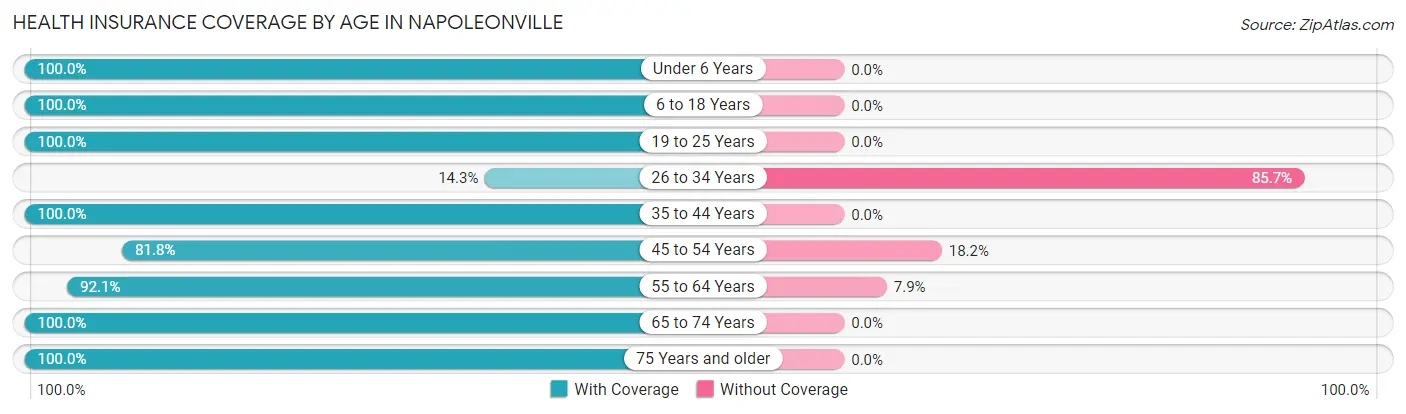
| Age Bracket | With Coverage | Without Coverage |
| Under 6 Years | 34 (100.0%) | 0 (0.0%) |
| 6 to 18 Years | 78 (100.0%) | 0 (0.0%) |
| 19 to 25 Years | 59 (100.0%) | 0 (0.0%) |
| 26 to 34 Years | 2 (14.3%) | 12 (85.7%) |
| 35 to 44 Years | 28 (100.0%) | 0 (0.0%) |
| 45 to 54 Years | 36 (81.8%) | 8 (18.2%) |
| 55 to 64 Years | 58 (92.1%) | 5 (7.9%) |
| 65 to 74 Years | 49 (100.0%) | 0 (0.0%) |
| 75 Years and older | 13 (100.0%) | 0 (0.0%) |
| Total | 357 (93.5%) | 25 (6.5%) |
Health Insurance Coverage by Citizenship Status in Napoleonville

| Citizenship Status | With Coverage | Without Coverage |
| Native Born | 34 (100.0%) | 0 (0.0%) |
| Foreign Born, Citizen | 78 (100.0%) | 0 (0.0%) |
| Foreign Born, not a Citizen | 59 (100.0%) | 0 (0.0%) |
Health Insurance Coverage by Household Income in Napoleonville
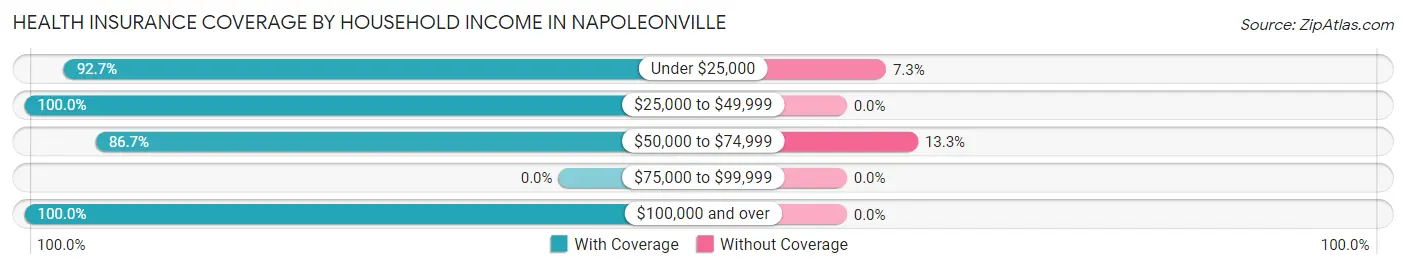
| Household Income | With Coverage | Without Coverage |
| Under $25,000 | 164 (92.7%) | 13 (7.3%) |
| $25,000 to $49,999 | 79 (100.0%) | 0 (0.0%) |
| $50,000 to $74,999 | 78 (86.7%) | 12 (13.3%) |
| $75,000 to $99,999 | 0 (0.0%) | 0 (0.0%) |
| $100,000 and over | 36 (100.0%) | 0 (0.0%) |
Public vs Private Health Insurance Coverage by Age in Napoleonville
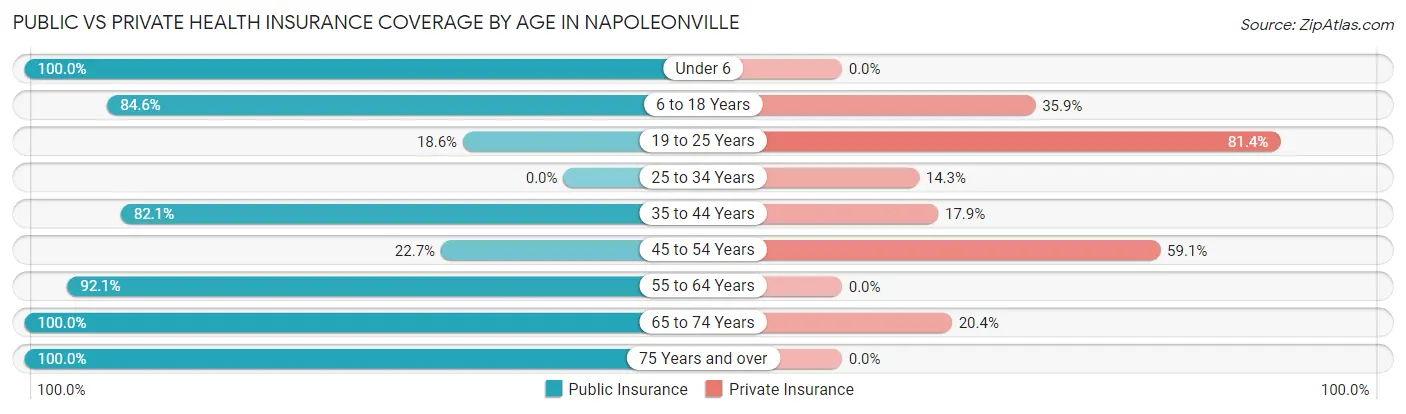
| Age Bracket | Public Insurance | Private Insurance |
| Under 6 | 34 (100.0%) | 0 (0.0%) |
| 6 to 18 Years | 66 (84.6%) | 28 (35.9%) |
| 19 to 25 Years | 11 (18.6%) | 48 (81.4%) |
| 25 to 34 Years | 0 (0.0%) | 2 (14.3%) |
| 35 to 44 Years | 23 (82.1%) | 5 (17.9%) |
| 45 to 54 Years | 10 (22.7%) | 26 (59.1%) |
| 55 to 64 Years | 58 (92.1%) | 0 (0.0%) |
| 65 to 74 Years | 49 (100.0%) | 10 (20.4%) |
| 75 Years and over | 13 (100.0%) | 0 (0.0%) |
| Total | 264 (69.1%) | 119 (31.1%) |
Disability Status by Sex by Age in Napoleonville
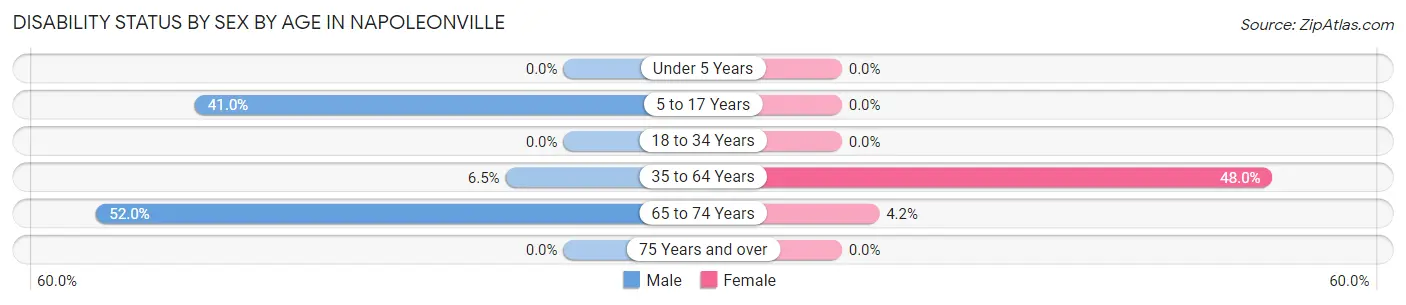
| Age Bracket | Male | Female |
| Under 5 Years | 0 (0.0%) | 0 (0.0%) |
| 5 to 17 Years | 16 (41.0%) | 0 (0.0%) |
| 18 to 34 Years | 0 (0.0%) | 0 (0.0%) |
| 35 to 64 Years | 4 (6.5%) | 35 (47.9%) |
| 65 to 74 Years | 13 (52.0%) | 1 (4.2%) |
| 75 Years and over | 0 (0.0%) | 0 (0.0%) |
Disability Class by Sex by Age in Napoleonville
Disability Class: Hearing Difficulty
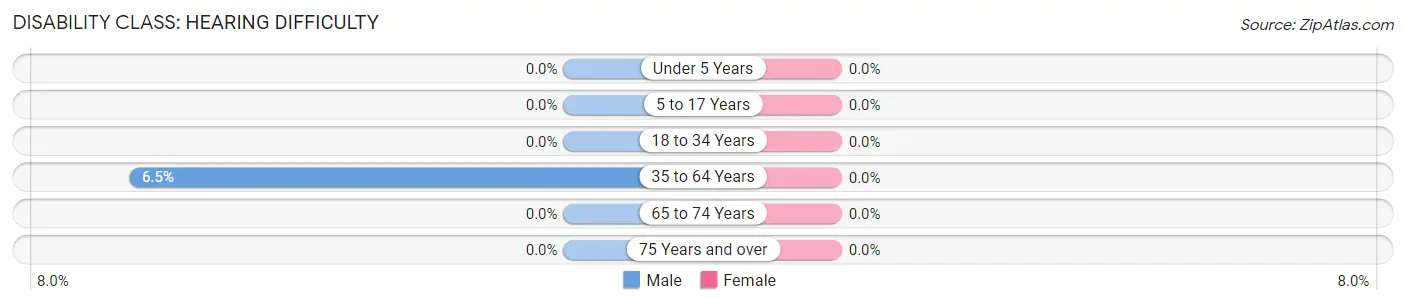
| Age Bracket | Male | Female |
| Under 5 Years | 0 (0.0%) | 0 (0.0%) |
| 5 to 17 Years | 0 (0.0%) | 0 (0.0%) |
| 18 to 34 Years | 0 (0.0%) | 0 (0.0%) |
| 35 to 64 Years | 4 (6.5%) | 0 (0.0%) |
| 65 to 74 Years | 0 (0.0%) | 0 (0.0%) |
| 75 Years and over | 0 (0.0%) | 0 (0.0%) |
Disability Class: Vision Difficulty
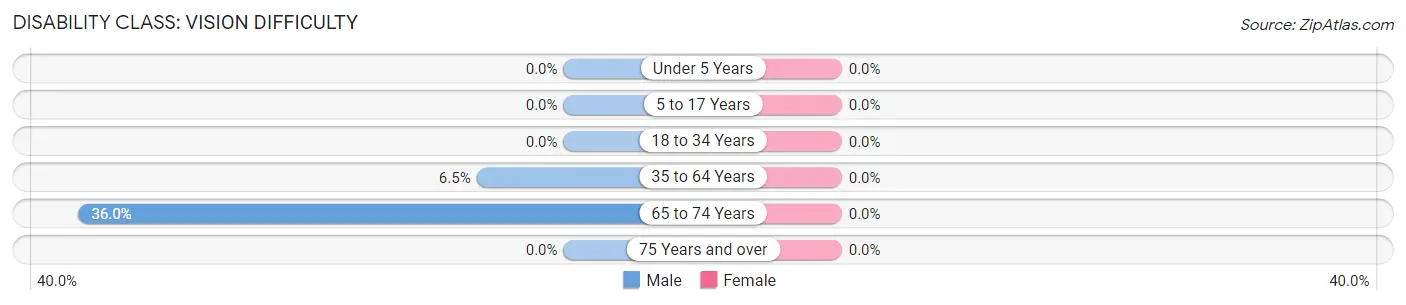
| Age Bracket | Male | Female |
| Under 5 Years | 0 (0.0%) | 0 (0.0%) |
| 5 to 17 Years | 0 (0.0%) | 0 (0.0%) |
| 18 to 34 Years | 0 (0.0%) | 0 (0.0%) |
| 35 to 64 Years | 4 (6.5%) | 0 (0.0%) |
| 65 to 74 Years | 9 (36.0%) | 0 (0.0%) |
| 75 Years and over | 0 (0.0%) | 0 (0.0%) |
Disability Class: Cognitive Difficulty
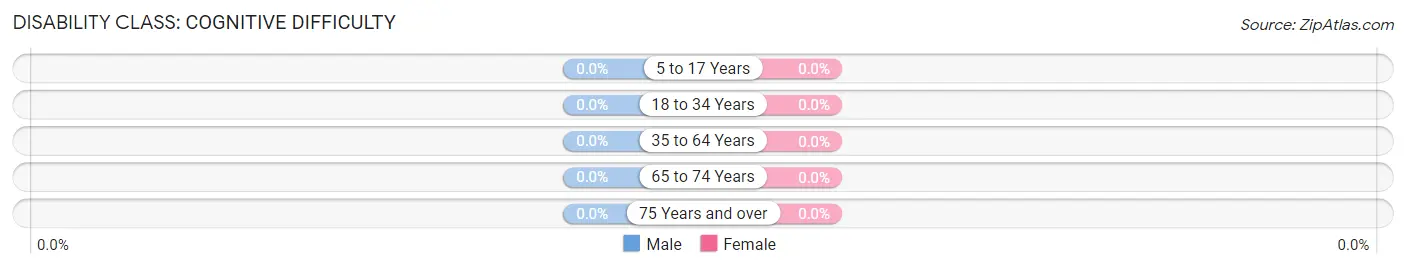
| Age Bracket | Male | Female |
| 5 to 17 Years | 0 (0.0%) | 0 (0.0%) |
| 18 to 34 Years | 0 (0.0%) | 0 (0.0%) |
| 35 to 64 Years | 0 (0.0%) | 0 (0.0%) |
| 65 to 74 Years | 0 (0.0%) | 0 (0.0%) |
| 75 Years and over | 0 (0.0%) | 0 (0.0%) |
Disability Class: Ambulatory Difficulty
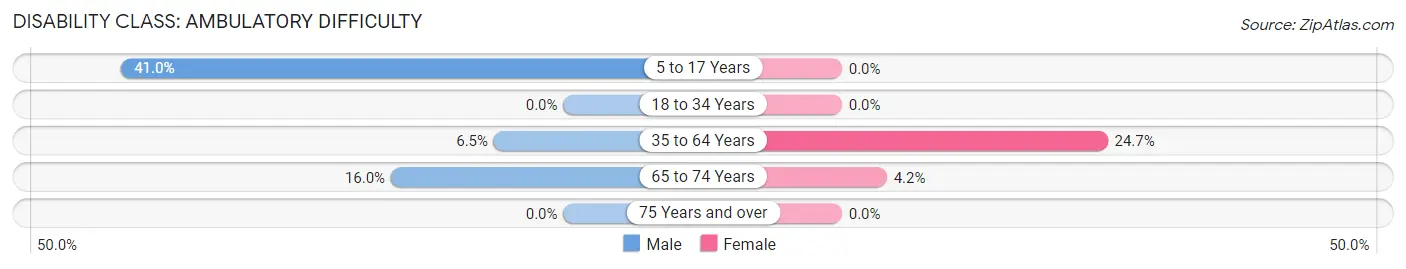
| Age Bracket | Male | Female |
| 5 to 17 Years | 16 (41.0%) | 0 (0.0%) |
| 18 to 34 Years | 0 (0.0%) | 0 (0.0%) |
| 35 to 64 Years | 4 (6.5%) | 18 (24.7%) |
| 65 to 74 Years | 4 (16.0%) | 1 (4.2%) |
| 75 Years and over | 0 (0.0%) | 0 (0.0%) |
Disability Class: Self-Care Difficulty
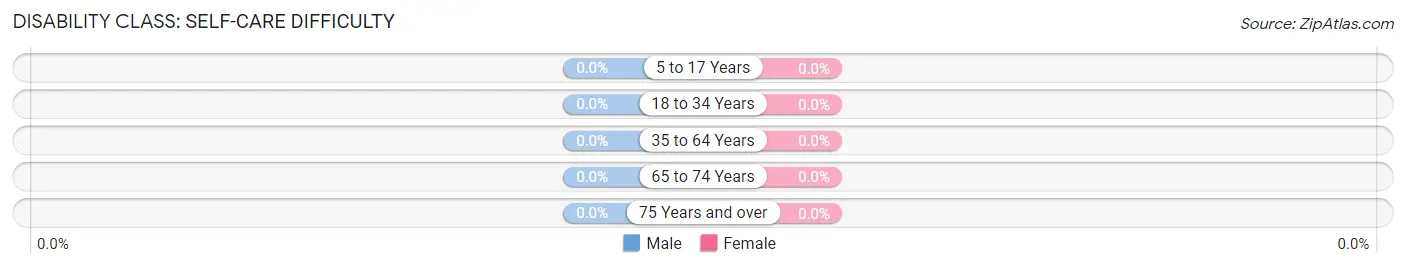
| Age Bracket | Male | Female |
| 5 to 17 Years | 0 (0.0%) | 0 (0.0%) |
| 18 to 34 Years | 0 (0.0%) | 0 (0.0%) |
| 35 to 64 Years | 0 (0.0%) | 0 (0.0%) |
| 65 to 74 Years | 0 (0.0%) | 0 (0.0%) |
| 75 Years and over | 0 (0.0%) | 0 (0.0%) |
Technology Access in Napoleonville
Computing Device Access in Napoleonville
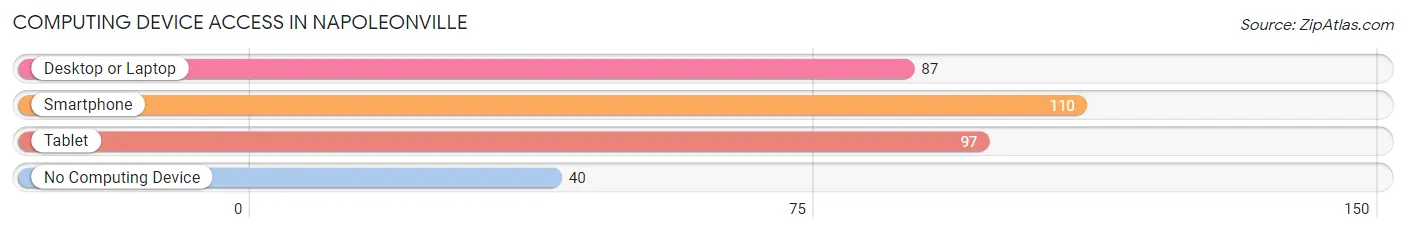
| Device Type | # Households | % Households |
| Desktop or Laptop | 87 | 58.0% |
| Smartphone | 110 | 73.3% |
| Tablet | 97 | 64.7% |
| No Computing Device | 40 | 26.7% |
| Total | 150 | 100.0% |
Internet Access in Napoleonville
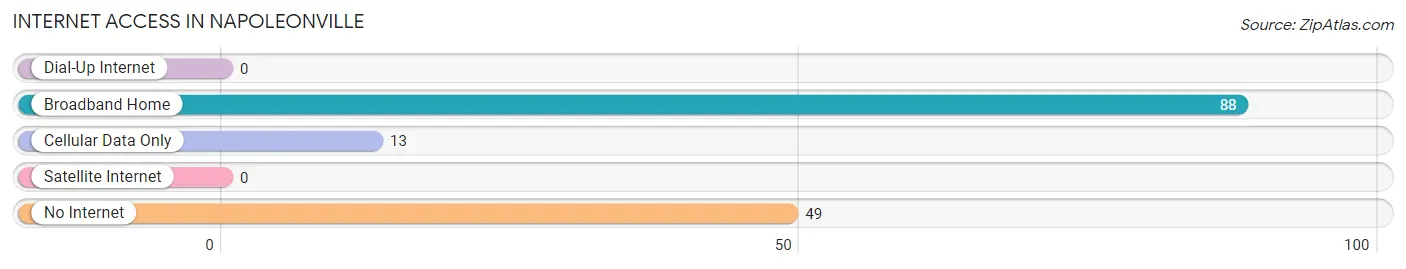
| Internet Type | # Households | % Households |
| Dial-Up Internet | 0 | 0.0% |
| Broadband Home | 88 | 58.7% |
| Cellular Data Only | 13 | 8.7% |
| Satellite Internet | 0 | 0.0% |
| No Internet | 49 | 32.7% |
| Total | 150 | 100.0% |
Napoleonville Summary
Napoleonville is a small town located in Assumption Parish, Louisiana. It is situated on the banks of Bayou Lafourche, about 25 miles south of Thibodaux and 40 miles southwest of New Orleans. The town was founded in 1810 and named after Napoleon Bonaparte, the French emperor. It is the parish seat of Assumption Parish and has a population of 1,845 as of the 2010 census.
History
Napoleonville was founded in 1810 by French settlers who named it after Napoleon Bonaparte. The town was incorporated in 1831 and was the parish seat of Assumption Parish. During the Civil War, the town was occupied by Union forces and served as a base for their operations in the area. After the war, the town experienced a period of growth and development, with the construction of a railroad line in 1883 and the establishment of a sugar mill in 1885.
In the early 20th century, the town was a center of the sugar industry, with several sugar mills and refineries in the area. The town also had a thriving lumber industry, with several sawmills and lumber yards. In the 1950s, the town experienced a period of decline as the sugar industry began to decline and the lumber industry moved away.
Geography
Napoleonville is located in Assumption Parish, Louisiana, on the banks of Bayou Lafourche. The town is situated about 25 miles south of Thibodaux and 40 miles southwest of New Orleans. The town has a total area of 1.3 square miles, all of which is land.
Economy
The economy of Napoleonville is largely based on agriculture and tourism. The town is home to several sugar mills and refineries, as well as a number of small businesses. The town also has a thriving tourism industry, with several bed and breakfasts, restaurants, and other attractions.
Demographics
As of the 2010 census, the population of Napoleonville was 1,845. The racial makeup of the town was 79.2% White, 19.2% African American, 0.3% Native American, 0.2% Asian, 0.1% Pacific Islander, and 0.9% from other races. The median household income was $30,938, and the median family income was $37,917. The per capita income was $17,845. About 17.2% of the population was below the poverty line.
Common Questions
What is Per Capita Income in Napoleonville?
Per Capita income in Napoleonville is $13,376.
What is the Median Household income in Napoleonville?
Median Household Income in Napoleonville is $19,189.
What is Family Income Deficit in Napoleonville?
Family Income Deficit in Napoleonville is $7,733.
Families that are below poverty line in Napoleonville earn $7,733 less on average than the poverty threshold level.
What is Inequality or Gini Index in Napoleonville?
Inequality or Gini Index in Napoleonville is 0.49.
What is the Total Population of Napoleonville?
Total Population of Napoleonville is 382.
What is the Total Male Population of Napoleonville?
Total Male Population of Napoleonville is 164.
What is the Total Female Population of Napoleonville?
Total Female Population of Napoleonville is 218.
What is the Ratio of Males per 100 Females in Napoleonville?
There are 75.23 Males per 100 Females in Napoleonville.
What is the Ratio of Females per 100 Males in Napoleonville?
There are 132.93 Females per 100 Males in Napoleonville.
What is the Median Population Age in Napoleonville?
Median Population Age in Napoleonville is 35.8 Years.
What is the Average Family Size in Napoleonville
Average Family Size in Napoleonville is 3.3 People.
What is the Average Household Size in Napoleonville
Average Household Size in Napoleonville is 2.5 People.
How Large is the Labor Force in Napoleonville?
There are 113 People in the Labor Forcein in Napoleonville.
What is the Percentage of People in the Labor Force in Napoleonville?
41.9% of People are in the Labor Force in Napoleonville.
What is the Unemployment Rate in Napoleonville?
Unemployment Rate in Napoleonville is 49.6%.