Montegut, LA Map & Demographics
Montegut Map
Montegut Overview
$18,176
PER CAPITA INCOME
$45,000
AVG FAMILY INCOME
$32,989
AVG HOUSEHOLD INCOME
62.3%
WAGE / INCOME GAP [ % ]
37.7¢/ $1
WAGE / INCOME GAP [ $ ]
0.41
INEQUALITY / GINI INDEX
1,347
TOTAL POPULATION
731
MALE POPULATION
616
FEMALE POPULATION
118.67
MALES / 100 FEMALES
84.27
FEMALES / 100 MALES
51.1
MEDIAN AGE
3.3
AVG FAMILY SIZE
2.7
AVG HOUSEHOLD SIZE
347
LABOR FORCE [ PEOPLE ]
30.1%
PERCENT IN LABOR FORCE
0.9%
UNEMPLOYMENT RATE
Montegut Zip Codes
Montegut Area Codes
Income in Montegut
Income Overview in Montegut
Per Capita Income in Montegut is $18,176, while median incomes of families and households are $45,000 and $32,989 respectively.
| Characteristic | Number | Measure |
| Per Capita Income | 1,347 | $18,176 |
| Median Family Income | 338 | $45,000 |
| Mean Family Income | 338 | $48,000 |
| Median Household Income | 497 | $32,989 |
| Mean Household Income | 497 | $45,054 |
| Income Deficit | 338 | $0 |
| Wage / Income Gap (%) | 1,347 | 62.34% |
| Wage / Income Gap ($) | 1,347 | 37.66¢ per $1 |
| Gini / Inequality Index | 1,347 | 0.41 |
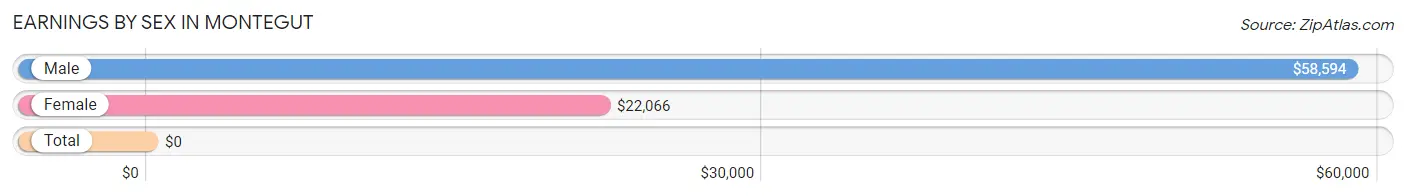
Earnings by Sex in Montegut
| Sex | Number | Average Earnings |
| Male | 142 (40.0%) | $58,594 |
| Female | 213 (60.0%) | $22,066 |
| Total | 355 (100.0%) | $0 |
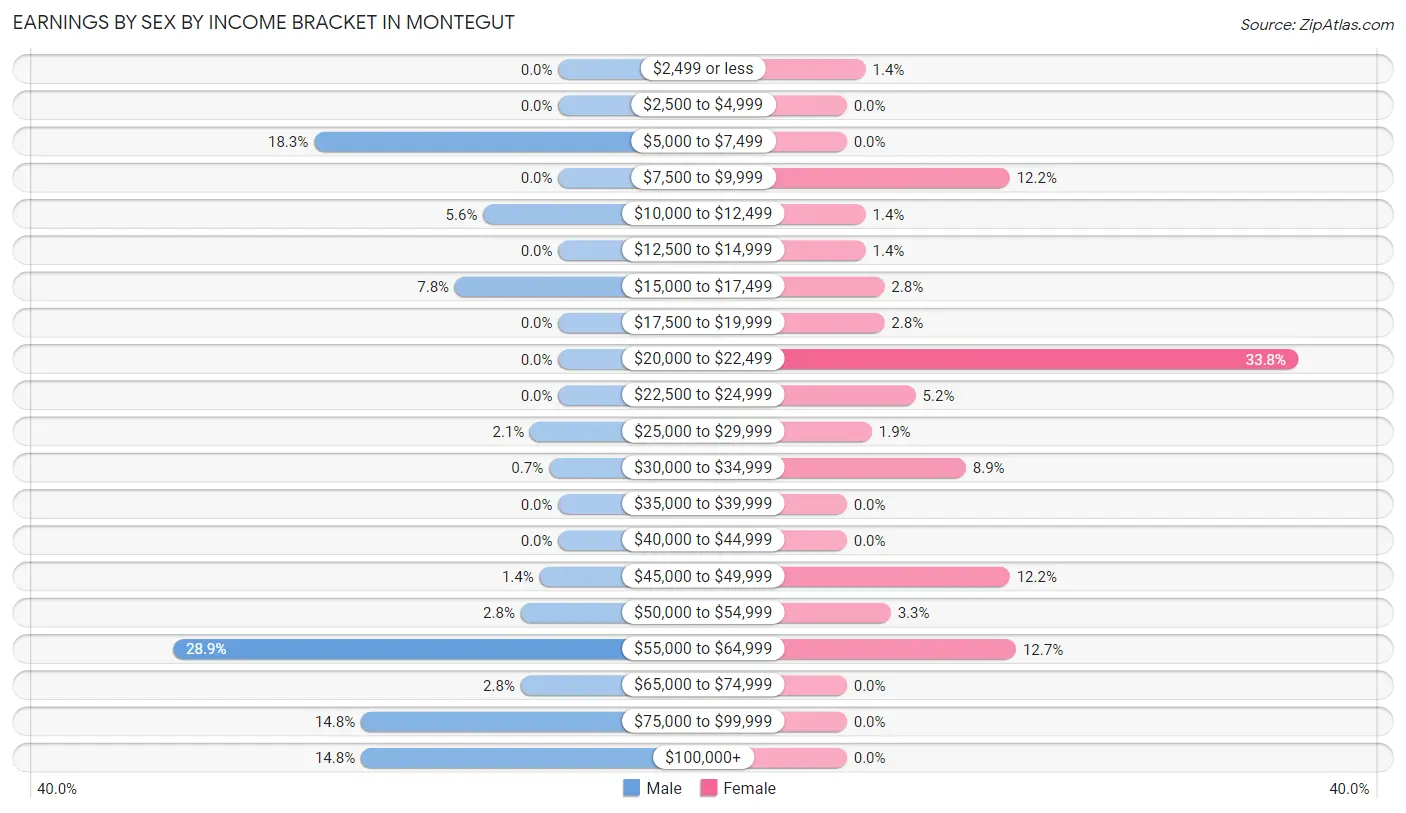
Earnings by Sex by Income Bracket in Montegut
The most common earnings brackets in Montegut are $55,000 to $64,999 for men (41 | 28.9%) and $20,000 to $22,499 for women (72 | 33.8%).
| Income | Male | Female |
| $2,499 or less | 0 (0.0%) | 3 (1.4%) |
| $2,500 to $4,999 | 0 (0.0%) | 0 (0.0%) |
| $5,000 to $7,499 | 26 (18.3%) | 0 (0.0%) |
| $7,500 to $9,999 | 0 (0.0%) | 26 (12.2%) |
| $10,000 to $12,499 | 8 (5.6%) | 3 (1.4%) |
| $12,500 to $14,999 | 0 (0.0%) | 3 (1.4%) |
| $15,000 to $17,499 | 11 (7.7%) | 6 (2.8%) |
| $17,500 to $19,999 | 0 (0.0%) | 6 (2.8%) |
| $20,000 to $22,499 | 0 (0.0%) | 72 (33.8%) |
| $22,500 to $24,999 | 0 (0.0%) | 11 (5.2%) |
| $25,000 to $29,999 | 3 (2.1%) | 4 (1.9%) |
| $30,000 to $34,999 | 1 (0.7%) | 19 (8.9%) |
| $35,000 to $39,999 | 0 (0.0%) | 0 (0.0%) |
| $40,000 to $44,999 | 0 (0.0%) | 0 (0.0%) |
| $45,000 to $49,999 | 2 (1.4%) | 26 (12.2%) |
| $50,000 to $54,999 | 4 (2.8%) | 7 (3.3%) |
| $55,000 to $64,999 | 41 (28.9%) | 27 (12.7%) |
| $65,000 to $74,999 | 4 (2.8%) | 0 (0.0%) |
| $75,000 to $99,999 | 21 (14.8%) | 0 (0.0%) |
| $100,000+ | 21 (14.8%) | 0 (0.0%) |
| Total | 142 (100.0%) | 213 (100.0%) |
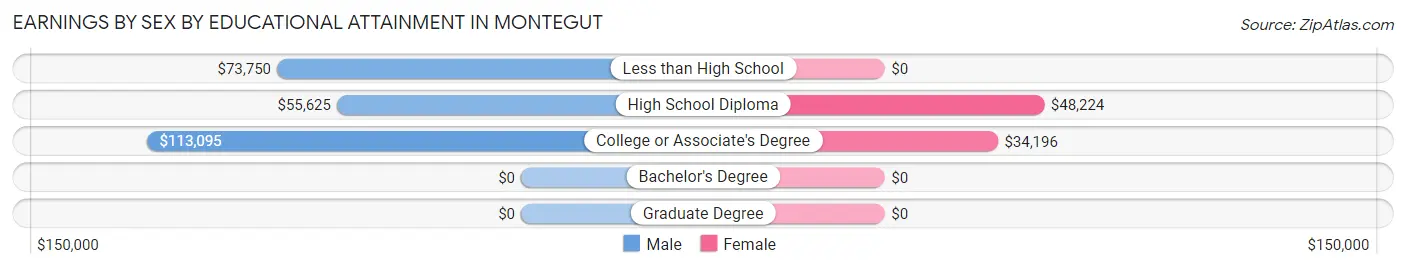
Earnings by Sex by Educational Attainment in Montegut
Average earnings in Montegut are $81,500 for men and $22,955 for women, a difference of 71.8%. Men with an educational attainment of college or associate's degree enjoy the highest average annual earnings of $113,095, while those with high school diploma education earn the least with $55,625. Women with an educational attainment of high school diploma earn the most with the average annual earnings of $48,224, while those with college or associate's degree education have the smallest earnings of $34,196.
| Educational Attainment | Male Income | Female Income |
| Less than High School | $73,750 | $0 |
| High School Diploma | $55,625 | $48,224 |
| College or Associate's Degree | $113,095 | $34,196 |
| Bachelor's Degree | - | - |
| Graduate Degree | - | - |
| Total | $81,500 | $22,955 |
Family Income in Montegut
Family Income Brackets in Montegut
According to the Montegut family income data, there are 103 families falling into the $50,000 to $74,999 income range, which is the most common income bracket and makes up 30.5% of all families.
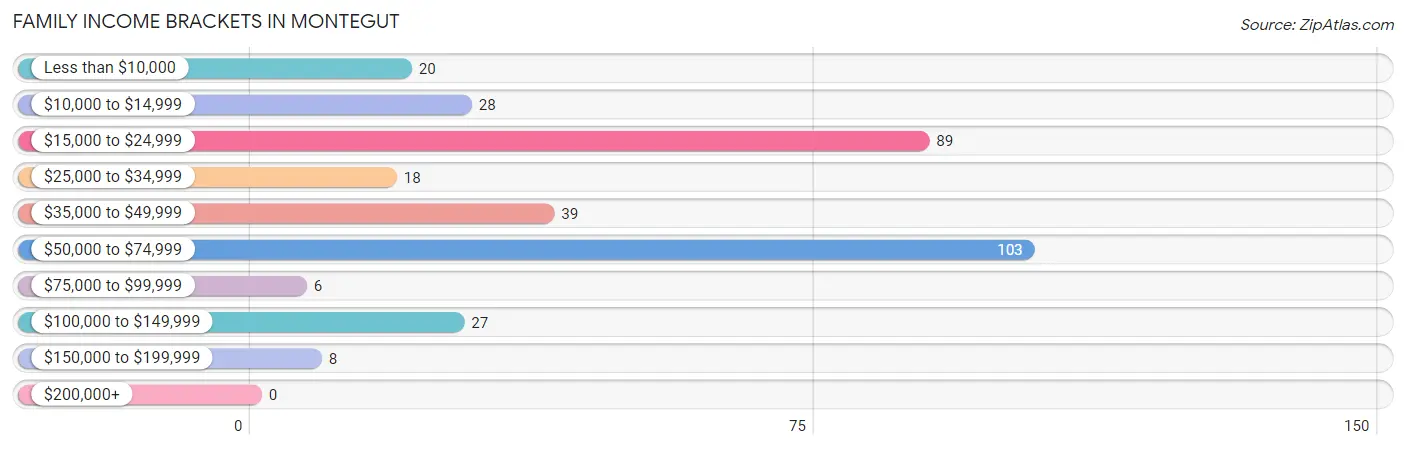
| Income Bracket | # Families | % Families |
| Less than $10,000 | 20 | 5.9% |
| $10,000 to $14,999 | 28 | 8.3% |
| $15,000 to $24,999 | 89 | 26.3% |
| $25,000 to $34,999 | 18 | 5.3% |
| $35,000 to $49,999 | 39 | 11.5% |
| $50,000 to $74,999 | 103 | 30.5% |
| $75,000 to $99,999 | 6 | 1.8% |
| $100,000 to $149,999 | 27 | 8.0% |
| $150,000 to $199,999 | 8 | 2.4% |
| $200,000+ | 0 | 0.0% |
Family Income by Famaliy Size in Montegut
2-person families (168 | 49.7%) account for the highest median family income in Montegut with $52,843 per family, while 2-person families (168 | 49.7%) have the highest median income of $26,422 per family member.
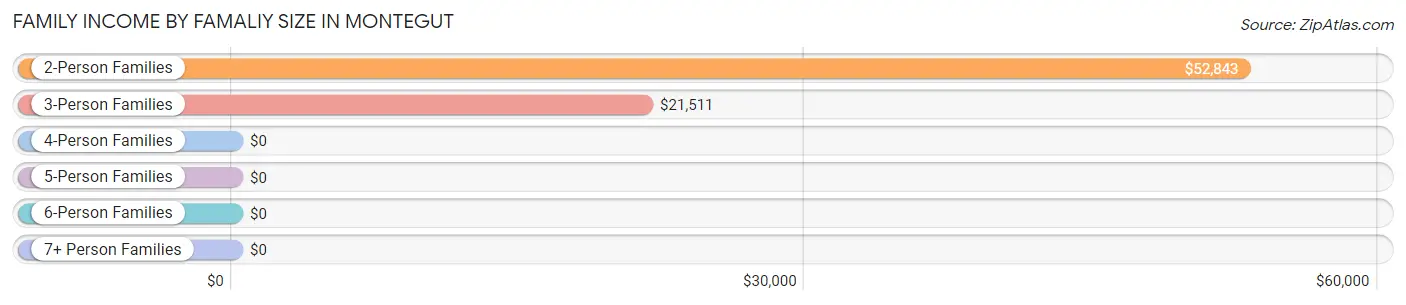
| Income Bracket | # Families | Median Income |
| 2-Person Families | 168 (49.7%) | $52,843 |
| 3-Person Families | 93 (27.5%) | $21,511 |
| 4-Person Families | 28 (8.3%) | $0 |
| 5-Person Families | 46 (13.6%) | $0 |
| 6-Person Families | 3 (0.9%) | $0 |
| 7+ Person Families | 0 (0.0%) | $0 |
| Total | 338 (100.0%) | $45,000 |
Family Income by Number of Earners in Montegut
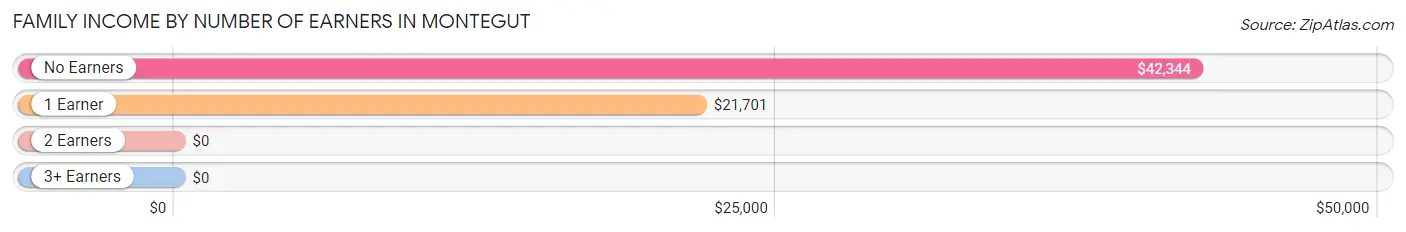
| Number of Earners | # Families | Median Income |
| No Earners | 119 (35.2%) | $42,344 |
| 1 Earner | 160 (47.3%) | $21,701 |
| 2 Earners | 53 (15.7%) | $0 |
| 3+ Earners | 6 (1.8%) | $0 |
| Total | 338 (100.0%) | $45,000 |
Household Income in Montegut
Household Income Brackets in Montegut
With 149 households falling in the category, the $15,000 to $24,999 income range is the most frequent in Montegut, accounting for 30.0% of all households.
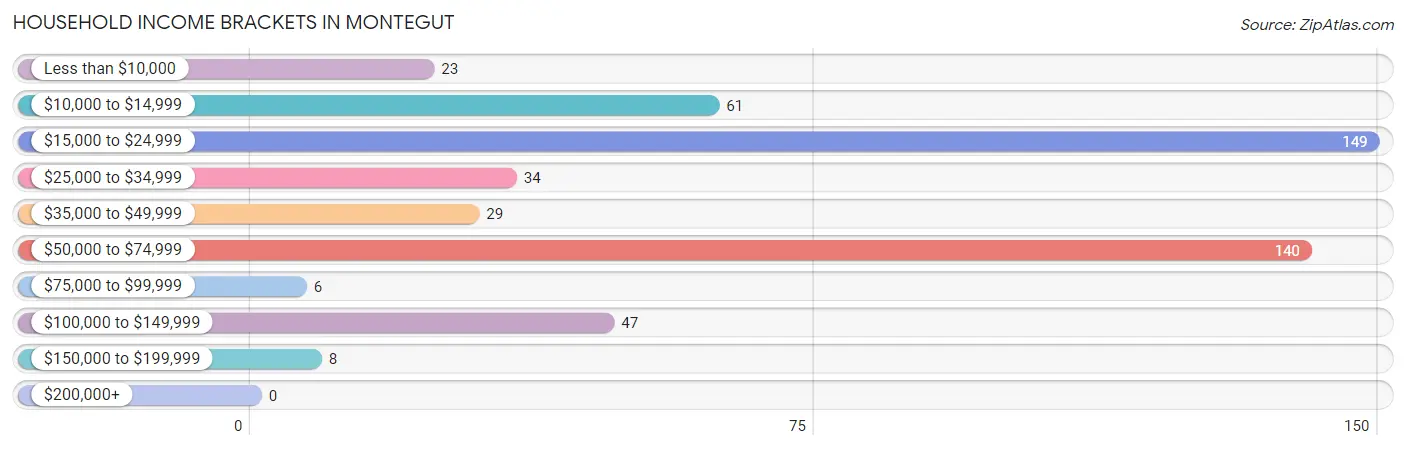
| Income Bracket | # Households | % Households |
| Less than $10,000 | 23 | 4.6% |
| $10,000 to $14,999 | 61 | 12.3% |
| $15,000 to $24,999 | 149 | 30.0% |
| $25,000 to $34,999 | 34 | 6.8% |
| $35,000 to $49,999 | 29 | 5.8% |
| $50,000 to $74,999 | 140 | 28.2% |
| $75,000 to $99,999 | 6 | 1.2% |
| $100,000 to $149,999 | 47 | 9.5% |
| $150,000 to $199,999 | 8 | 1.6% |
| $200,000+ | 0 | 0.0% |
Household Income by Householder Age in Montegut
The median household income in Montegut is $32,989, with the highest median household income of $53,137 found in the 65+ years age bracket for the primary householder. A total of 174 households (35.0%) fall into this category. Meanwhile, the 15 to 24 years age bracket for the primary householder has the lowest median household income of $0, with 26 households (5.2%) in this group.
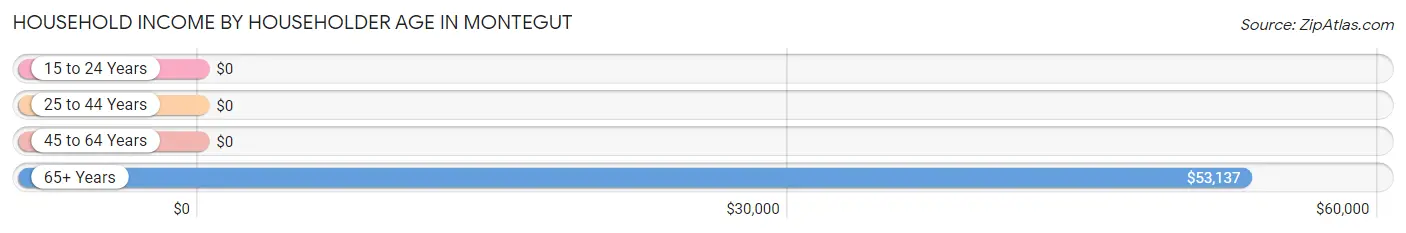
| Income Bracket | # Households | Median Income |
| 15 to 24 Years | 26 (5.2%) | $0 |
| 25 to 44 Years | 108 (21.7%) | $0 |
| 45 to 64 Years | 189 (38.0%) | $0 |
| 65+ Years | 174 (35.0%) | $53,137 |
| Total | 497 (100.0%) | $32,989 |
Poverty in Montegut
Income Below Poverty by Sex and Age in Montegut
With 46.2% poverty level for males and 35.4% for females among the residents of Montegut, 5 year old males and 25 to 34 year old females are the most vulnerable to poverty, with 4 males (100.0%) and 58 females (86.6%) in their respective age groups living below the poverty level.
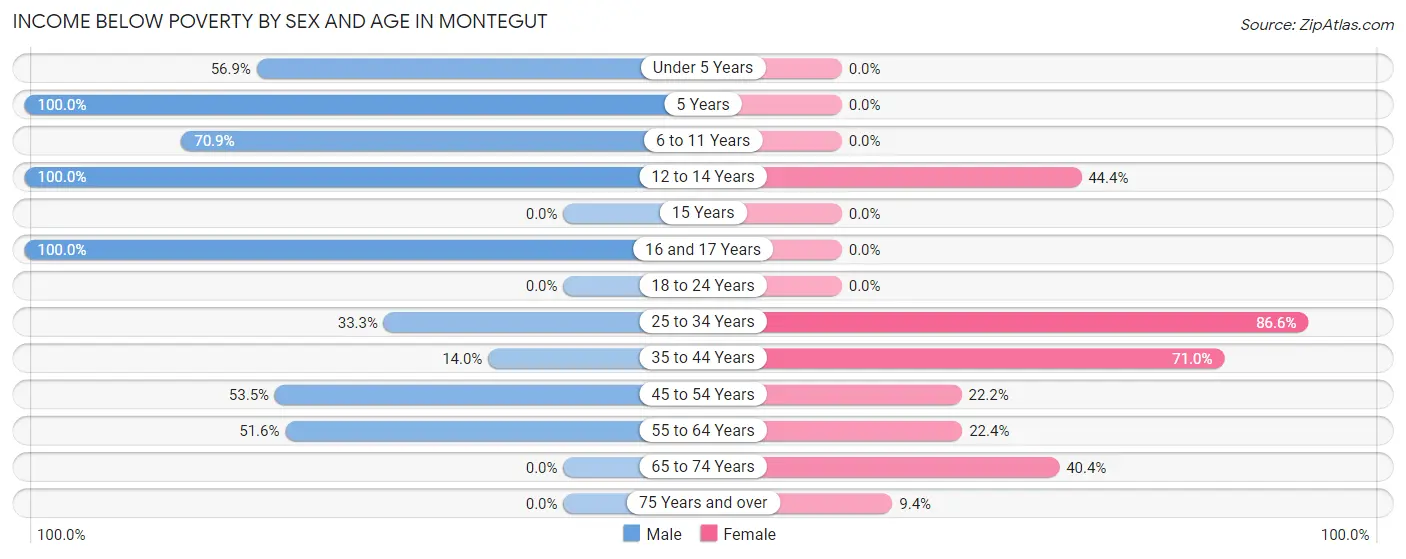
| Age Bracket | Male | Female |
| Under 5 Years | 37 (56.9%) | 0 (0.0%) |
| 5 Years | 4 (100.0%) | 0 (0.0%) |
| 6 to 11 Years | 39 (70.9%) | 0 (0.0%) |
| 12 to 14 Years | 4 (100.0%) | 4 (44.4%) |
| 15 Years | 0 (0.0%) | 0 (0.0%) |
| 16 and 17 Years | 104 (100.0%) | 0 (0.0%) |
| 18 to 24 Years | 0 (0.0%) | 0 (0.0%) |
| 25 to 34 Years | 6 (33.3%) | 58 (86.6%) |
| 35 to 44 Years | 6 (14.0%) | 71 (71.0%) |
| 45 to 54 Years | 106 (53.5%) | 4 (22.2%) |
| 55 to 64 Years | 32 (51.6%) | 55 (22.4%) |
| 65 to 74 Years | 0 (0.0%) | 23 (40.4%) |
| 75 Years and over | 0 (0.0%) | 3 (9.4%) |
| Total | 338 (46.2%) | 218 (35.4%) |
Income Above Poverty by Sex and Age in Montegut
According to the poverty statistics in Montegut, males aged 18 to 24 years and females aged under 5 years are the age groups that are most secure financially, with 100.0% of males and 100.0% of females in these age groups living above the poverty line.
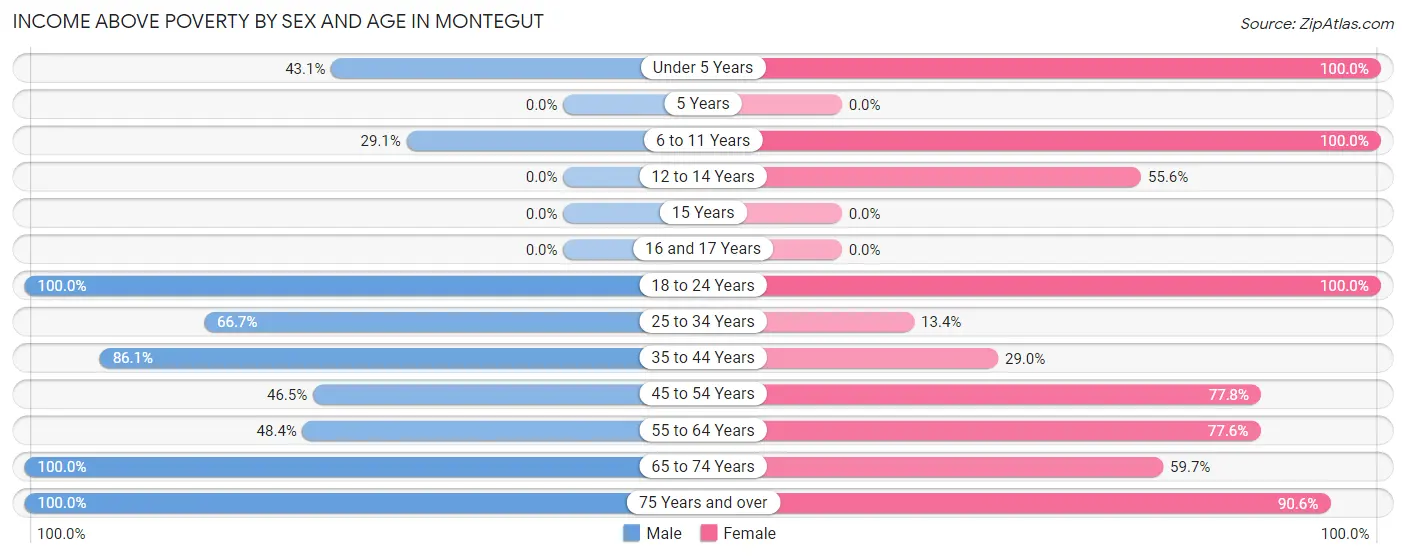
| Age Bracket | Male | Female |
| Under 5 Years | 28 (43.1%) | 27 (100.0%) |
| 5 Years | 0 (0.0%) | 0 (0.0%) |
| 6 to 11 Years | 16 (29.1%) | 31 (100.0%) |
| 12 to 14 Years | 0 (0.0%) | 5 (55.6%) |
| 15 Years | 0 (0.0%) | 0 (0.0%) |
| 16 and 17 Years | 0 (0.0%) | 0 (0.0%) |
| 18 to 24 Years | 56 (100.0%) | 29 (100.0%) |
| 25 to 34 Years | 12 (66.7%) | 9 (13.4%) |
| 35 to 44 Years | 37 (86.1%) | 29 (29.0%) |
| 45 to 54 Years | 92 (46.5%) | 14 (77.8%) |
| 55 to 64 Years | 30 (48.4%) | 191 (77.6%) |
| 65 to 74 Years | 112 (100.0%) | 34 (59.7%) |
| 75 Years and over | 10 (100.0%) | 29 (90.6%) |
| Total | 393 (53.8%) | 398 (64.6%) |
Income Below Poverty Among Married-Couple Families in Montegut
The poverty statistics for married-couple families in Montegut show that 34.9% or 95 of the total 272 families live below the poverty line. Families with 1 or 2 children have the highest poverty rate of 62.6%, comprising of 67 families. On the other hand, families with 3 or 4 children have the lowest poverty rate of 0.0%, which includes 0 families.

| Children | Above Poverty | Below Poverty |
| No Children | 130 (82.3%) | 28 (17.7%) |
| 1 or 2 Children | 40 (37.4%) | 67 (62.6%) |
| 3 or 4 Children | 7 (100.0%) | 0 (0.0%) |
| 5 or more Children | 0 (0.0%) | 0 (0.0%) |
| Total | 177 (65.1%) | 95 (34.9%) |
Income Below Poverty Among Single-Parent Households in Montegut
According to the poverty data in Montegut, 73.3% or 11 single-father households and 45.1% or 23 single-mother households are living below the poverty line. Among single-father households, those with 1 or 2 children have the highest poverty rate, with 6 households (100.0%) experiencing poverty. Likewise, among single-mother households, those with 3 or 4 children have the highest poverty rate, with 23 households (100.0%) falling below the poverty line.
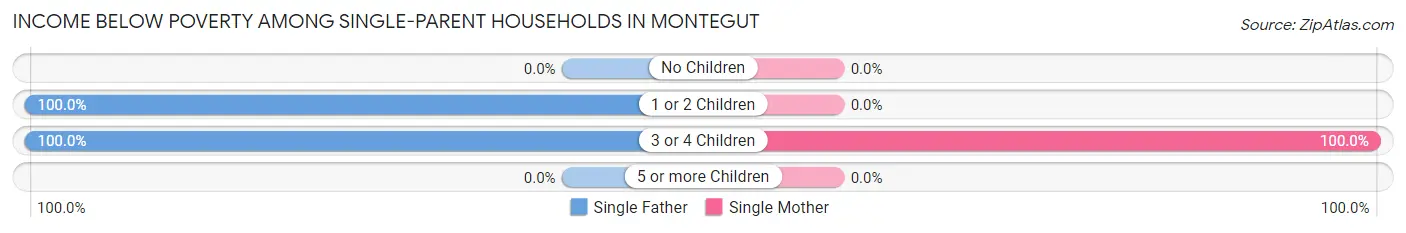
| Children | Single Father | Single Mother |
| No Children | 0 (0.0%) | 0 (0.0%) |
| 1 or 2 Children | 6 (100.0%) | 0 (0.0%) |
| 3 or 4 Children | 5 (100.0%) | 23 (100.0%) |
| 5 or more Children | 0 (0.0%) | 0 (0.0%) |
| Total | 11 (73.3%) | 23 (45.1%) |
Income Below Poverty Among Married-Couple vs Single-Parent Households in Montegut
The poverty data for Montegut shows that 95 of the married-couple family households (34.9%) and 34 of the single-parent households (51.5%) are living below the poverty level. Within the married-couple family households, those with 1 or 2 children have the highest poverty rate, with 67 households (62.6%) falling below the poverty line. Among the single-parent households, those with 3 or 4 children have the highest poverty rate, with 28 household (100.0%) living below poverty.
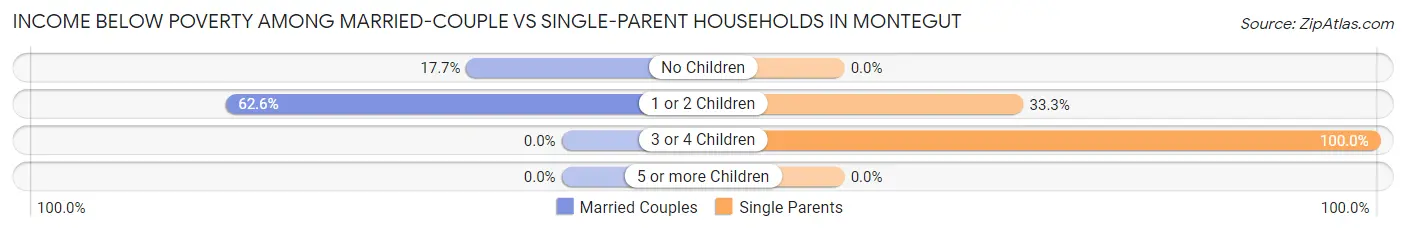
| Children | Married-Couple Families | Single-Parent Households |
| No Children | 28 (17.7%) | 0 (0.0%) |
| 1 or 2 Children | 67 (62.6%) | 6 (33.3%) |
| 3 or 4 Children | 0 (0.0%) | 28 (100.0%) |
| 5 or more Children | 0 (0.0%) | 0 (0.0%) |
| Total | 95 (34.9%) | 34 (51.5%) |
Race in Montegut
The most populous races in Montegut are White / Caucasian (1,130 | 83.9%), Native / Alaskan (172 | 12.8%), and Two or more Races (37 | 2.8%).
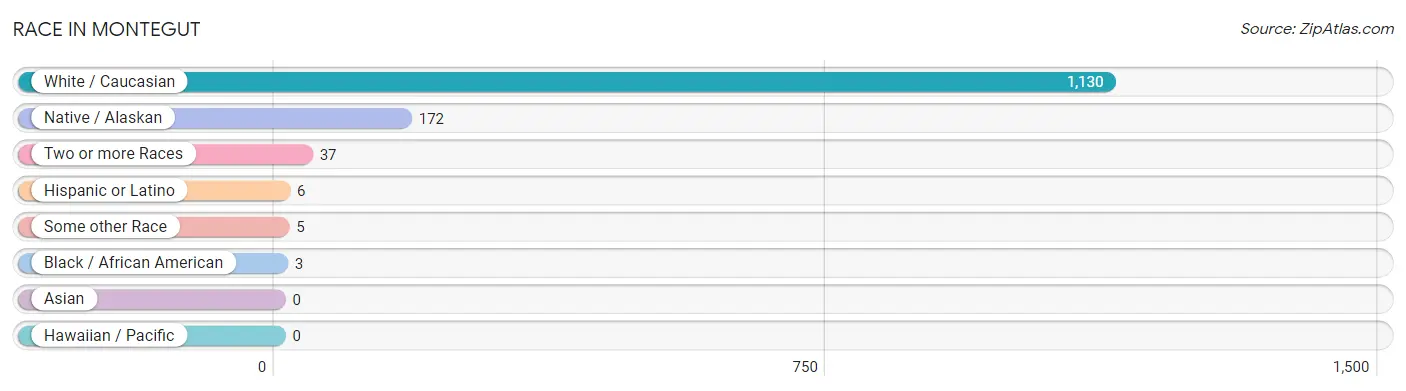
| Race | # Population | % Population |
| Asian | 0 | 0.0% |
| Black / African American | 3 | 0.2% |
| Hawaiian / Pacific | 0 | 0.0% |
| Hispanic or Latino | 6 | 0.4% |
| Native / Alaskan | 172 | 12.8% |
| White / Caucasian | 1,130 | 83.9% |
| Two or more Races | 37 | 2.8% |
| Some other Race | 5 | 0.4% |
| Total | 1,347 | 100.0% |
Ancestry in Montegut
The most populous ancestries reported in Montegut are French Canadian (275 | 20.4%), Houma (191 | 14.2%), English (156 | 11.6%), French (154 | 11.4%), and American (126 | 9.3%), together accounting for 67.0% of all Montegut residents.
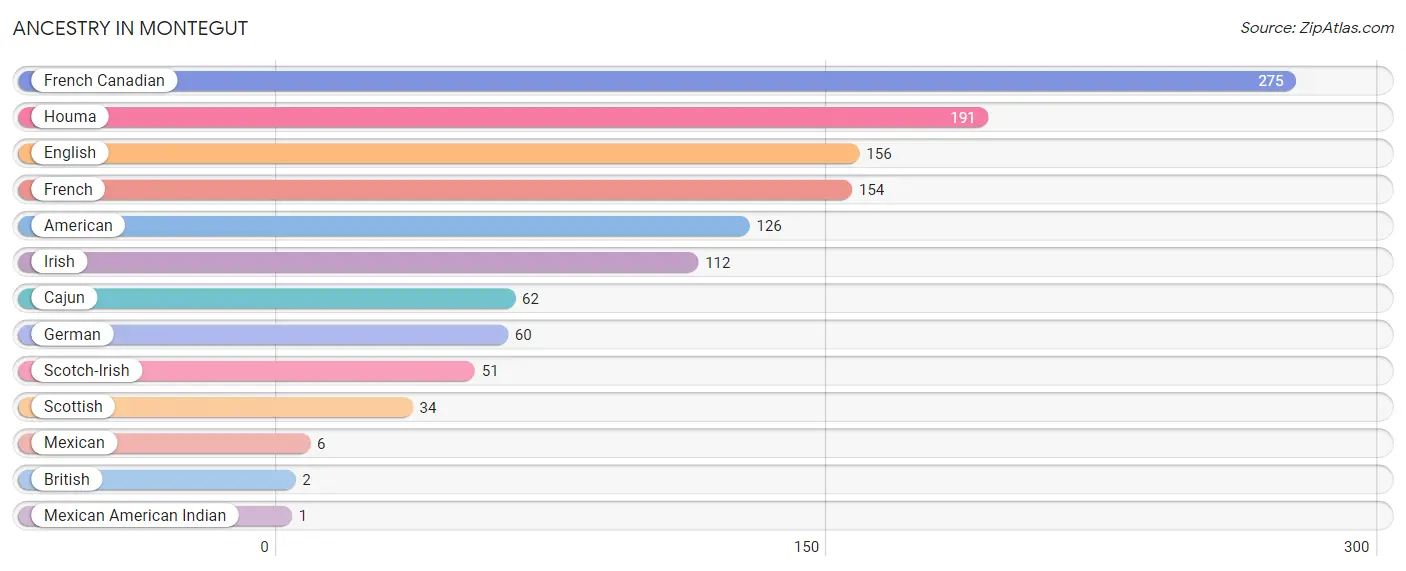
| Ancestry | # Population | % Population |
| American | 126 | 9.3% |
| British | 2 | 0.2% |
| Cajun | 62 | 4.6% |
| English | 156 | 11.6% |
| French | 154 | 11.4% |
| French Canadian | 275 | 20.4% |
| German | 60 | 4.4% |
| Houma | 191 | 14.2% |
| Irish | 112 | 8.3% |
| Mexican | 6 | 0.4% |
| Mexican American Indian | 1 | 0.1% |
| Scotch-Irish | 51 | 3.8% |
| Scottish | 34 | 2.5% | View All 13 Rows |
Immigrants in Montegut
The most numerous immigrant groups reported in Montegut came from Europe (32 | 2.4%), Northern Europe (32 | 2.4%), and Scotland (30 | 2.2%), together accounting for 7.0% of all Montegut residents.
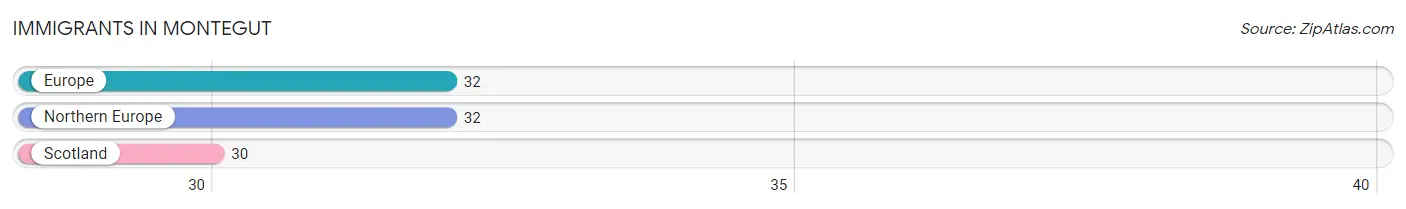
| Immigration Origin | # Population | % Population |
| Europe | 32 | 2.4% |
| Northern Europe | 32 | 2.4% |
| Scotland | 30 | 2.2% | View All 3 Rows |
Sex and Age in Montegut
Sex and Age in Montegut
The most populous age groups in Montegut are 50 to 54 Years (175 | 23.9%) for men and 60 to 64 Years (174 | 28.2%) for women.
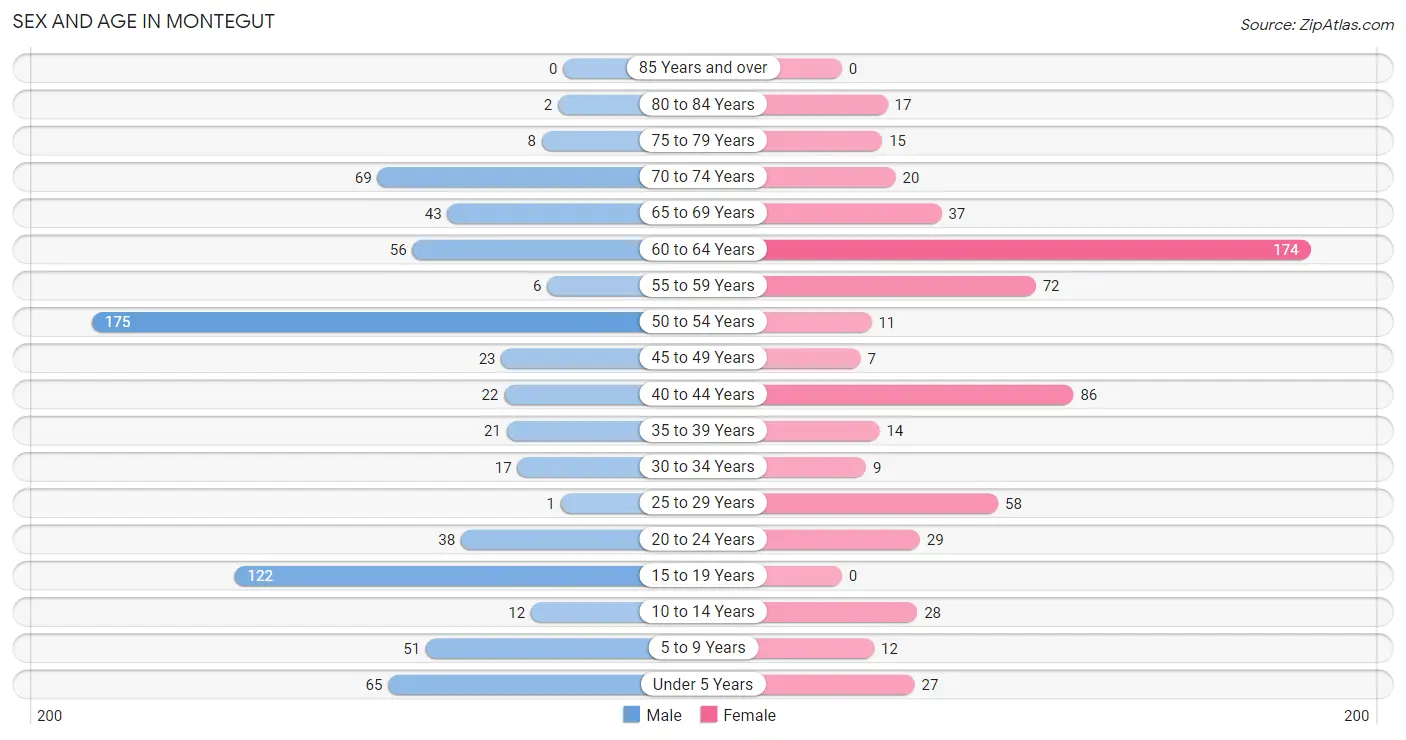
| Age Bracket | Male | Female |
| Under 5 Years | 65 (8.9%) | 27 (4.4%) |
| 5 to 9 Years | 51 (7.0%) | 12 (1.9%) |
| 10 to 14 Years | 12 (1.6%) | 28 (4.5%) |
| 15 to 19 Years | 122 (16.7%) | 0 (0.0%) |
| 20 to 24 Years | 38 (5.2%) | 29 (4.7%) |
| 25 to 29 Years | 1 (0.1%) | 58 (9.4%) |
| 30 to 34 Years | 17 (2.3%) | 9 (1.5%) |
| 35 to 39 Years | 21 (2.9%) | 14 (2.3%) |
| 40 to 44 Years | 22 (3.0%) | 86 (14.0%) |
| 45 to 49 Years | 23 (3.2%) | 7 (1.1%) |
| 50 to 54 Years | 175 (23.9%) | 11 (1.8%) |
| 55 to 59 Years | 6 (0.8%) | 72 (11.7%) |
| 60 to 64 Years | 56 (7.7%) | 174 (28.2%) |
| 65 to 69 Years | 43 (5.9%) | 37 (6.0%) |
| 70 to 74 Years | 69 (9.4%) | 20 (3.3%) |
| 75 to 79 Years | 8 (1.1%) | 15 (2.4%) |
| 80 to 84 Years | 2 (0.3%) | 17 (2.8%) |
| 85 Years and over | 0 (0.0%) | 0 (0.0%) |
| Total | 731 (100.0%) | 616 (100.0%) |
Families and Households in Montegut
Median Family Size in Montegut
The median family size in Montegut is 3.33 persons per family, with single female/mother families (51 | 15.1%) accounting for the largest median family size of 5.12 persons per family. On the other hand, married-couple families (272 | 80.5%) represent the smallest median family size with 3.00 persons per family.
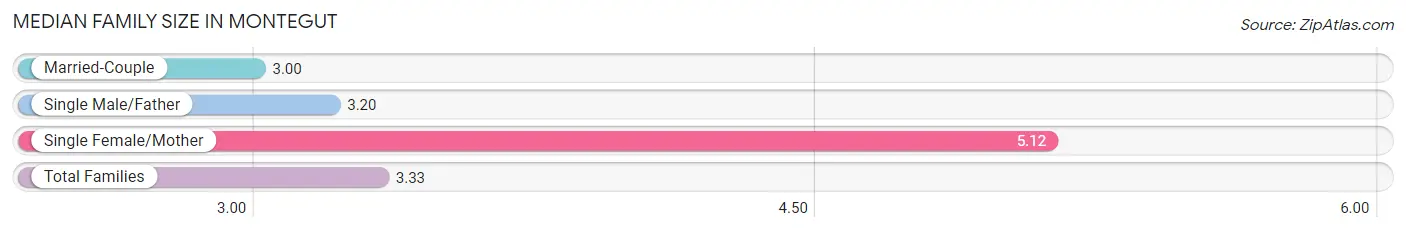
| Family Type | # Families | Family Size |
| Married-Couple | 272 (80.5%) | 3.00 |
| Single Male/Father | 15 (4.4%) | 3.20 |
| Single Female/Mother | 51 (15.1%) | 5.12 |
| Total Families | 338 (100.0%) | 3.33 |
Median Household Size in Montegut
The median household size in Montegut is 2.71 persons per household, with single female/mother households (51 | 10.3%) accounting for the largest median household size of 5.35 persons per household. non-family households (159 | 32.0%) represent the smallest median household size with 1.23 persons per household.
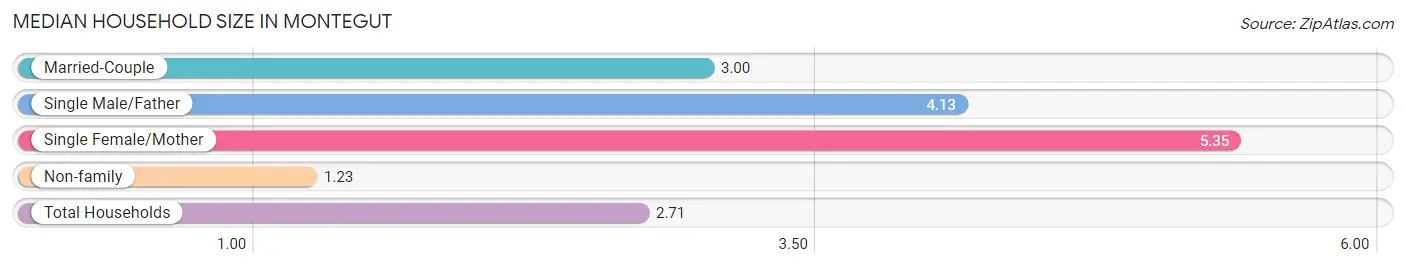
| Household Type | # Households | Household Size |
| Married-Couple | 272 (54.7%) | 3.00 |
| Single Male/Father | 15 (3.0%) | 4.13 |
| Single Female/Mother | 51 (10.3%) | 5.35 |
| Non-family | 159 (32.0%) | 1.23 |
| Total Households | 497 (100.0%) | 2.71 |
Household Size by Marriage Status in Montegut
Out of a total of 497 households in Montegut, 338 (68.0%) are family households, while 159 (32.0%) are nonfamily households. The most numerous type of family households are 2-person households, comprising 168, and the most common type of nonfamily households are 1-person households, comprising 118.
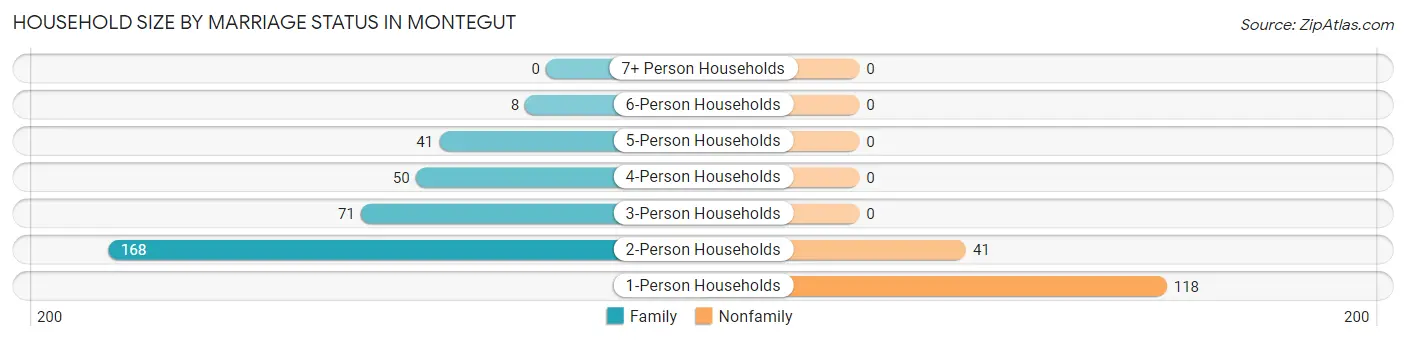
| Household Size | Family Households | Nonfamily Households |
| 1-Person Households | - | 118 (23.7%) |
| 2-Person Households | 168 (33.8%) | 41 (8.3%) |
| 3-Person Households | 71 (14.3%) | 0 (0.0%) |
| 4-Person Households | 50 (10.1%) | 0 (0.0%) |
| 5-Person Households | 41 (8.3%) | 0 (0.0%) |
| 6-Person Households | 8 (1.6%) | 0 (0.0%) |
| 7+ Person Households | 0 (0.0%) | 0 (0.0%) |
| Total | 338 (68.0%) | 159 (32.0%) |
Female Fertility in Montegut
Fertility by Age in Montegut
Average fertility rate in Montegut is 125.0 births per 1,000 women. Women in the age bracket of 20 to 34 years have the highest fertility rate with 271.0 births per 1,000 women. Women in the age bracket of 20 to 34 years acount for 100.0% of all women with births.
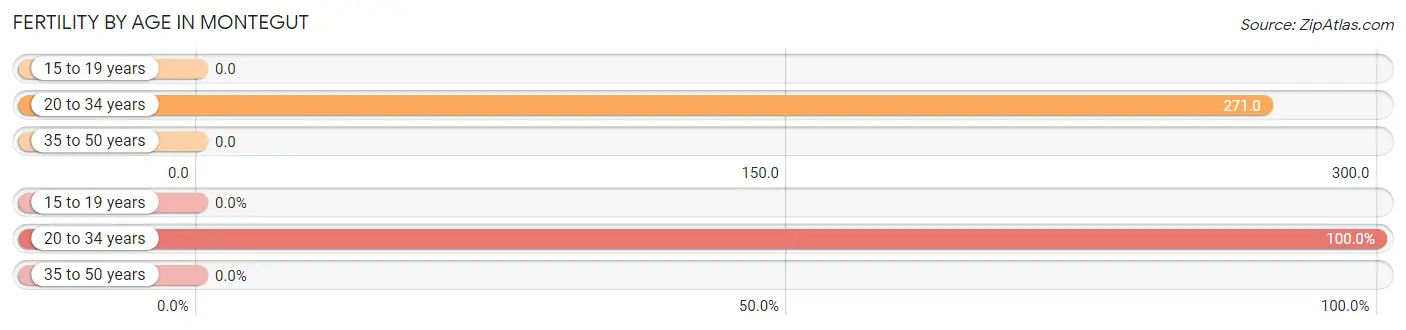
| Age Bracket | Women with Births | Births / 1,000 Women |
| 15 to 19 years | 0 (0.0%) | 0.0 |
| 20 to 34 years | 26 (100.0%) | 271.0 |
| 35 to 50 years | 0 (0.0%) | 0.0 |
| Total | 26 (100.0%) | 125.0 |
Fertility by Age by Marriage Status in Montegut
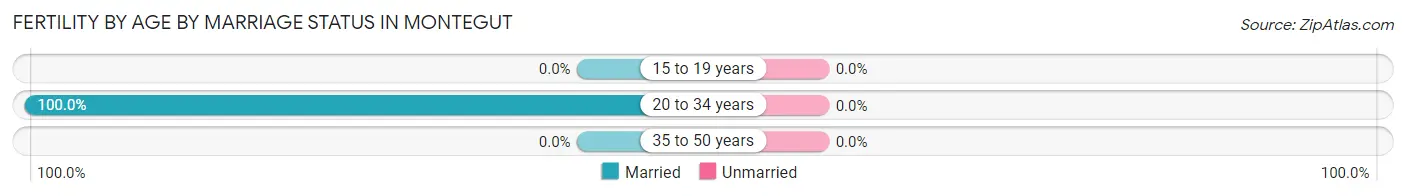
| Age Bracket | Married | Unmarried |
| 15 to 19 years | 0 (0.0%) | 0 (0.0%) |
| 20 to 34 years | 26 (100.0%) | 0 (0.0%) |
| 35 to 50 years | 0 (0.0%) | 0 (0.0%) |
| Total | 26 (100.0%) | 0 (0.0%) |
Fertility by Education in Montegut
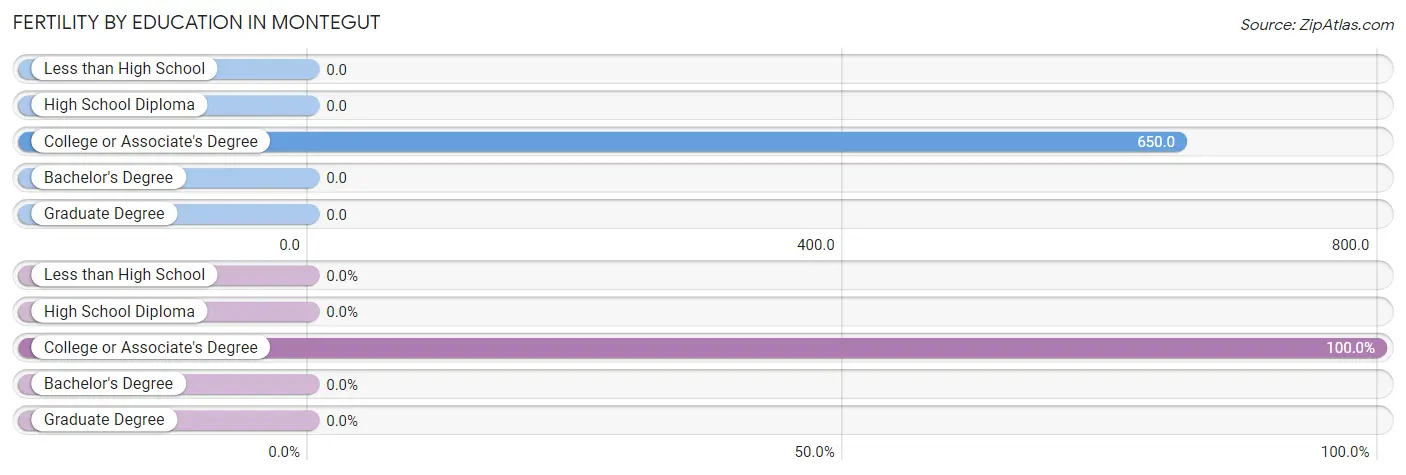
| Educational Attainment | Women with Births | Births / 1,000 Women |
| Less than High School | 0 (0.0%) | 0.0 |
| High School Diploma | 0 (0.0%) | 0.0 |
| College or Associate's Degree | 26 (100.0%) | 650.0 |
| Bachelor's Degree | 0 (0.0%) | 0.0 |
| Graduate Degree | 0 (0.0%) | 0.0 |
| Total | 26 (100.0%) | 125.0 |
Fertility by Education by Marriage Status in Montegut
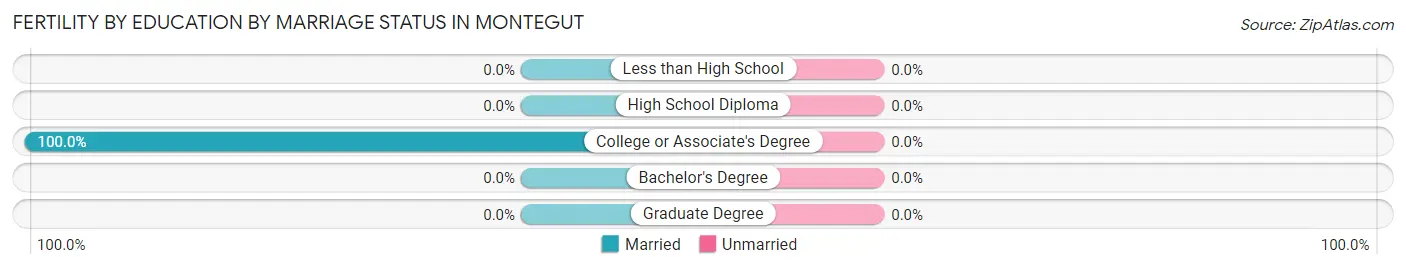
| Educational Attainment | Married | Unmarried |
| Less than High School | 0 (0.0%) | 0 (0.0%) |
| High School Diploma | 0 (0.0%) | 0 (0.0%) |
| College or Associate's Degree | 26 (100.0%) | 0 (0.0%) |
| Bachelor's Degree | 0 (0.0%) | 0 (0.0%) |
| Graduate Degree | 0 (0.0%) | 0 (0.0%) |
| Total | 26 (100.0%) | 0 (0.0%) |
Employment Characteristics in Montegut
Employment by Class of Employer in Montegut
Among the 344 employed individuals in Montegut, private company employees (274 | 79.6%), local government employees (42 | 12.2%), and not-for-profit organizations (19 | 5.5%) make up the most common classes of employment.
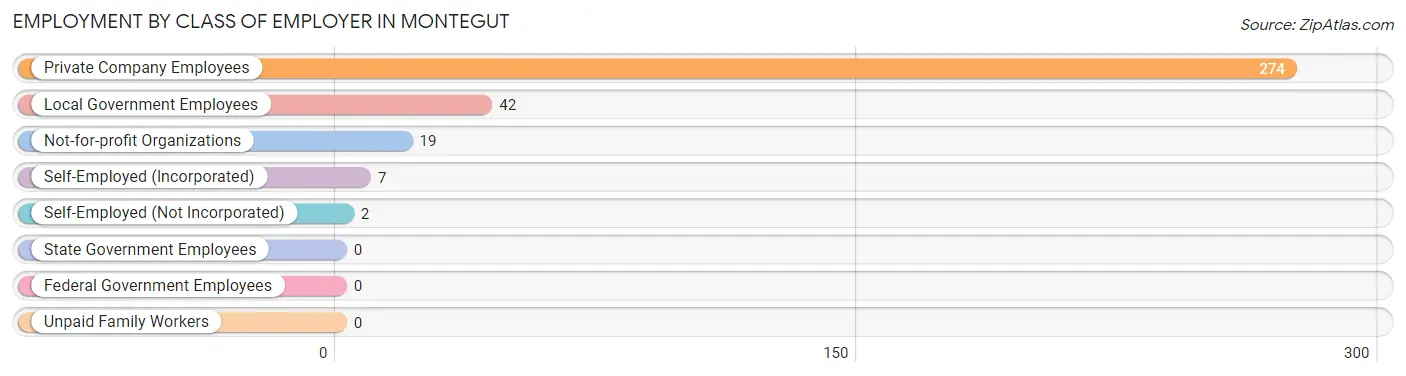
| Employer Class | # Employees | % Employees |
| Private Company Employees | 274 | 79.6% |
| Self-Employed (Incorporated) | 7 | 2.0% |
| Self-Employed (Not Incorporated) | 2 | 0.6% |
| Not-for-profit Organizations | 19 | 5.5% |
| Local Government Employees | 42 | 12.2% |
| State Government Employees | 0 | 0.0% |
| Federal Government Employees | 0 | 0.0% |
| Unpaid Family Workers | 0 | 0.0% |
| Total | 344 | 100.0% |
Employment Status by Age in Montegut
According to the labor force statistics for Montegut, out of the total population over 16 years of age (1,152), 30.1% or 347 individuals are in the labor force, with 0.9% or 3 of them unemployed. The age group with the highest labor force participation rate is 20 to 24 years, with 100.0% or 67 individuals in the labor force. Within the labor force, the 35 to 44 years age range has the highest percentage of unemployed individuals, with 2.2% or 3 of them being unemployed.
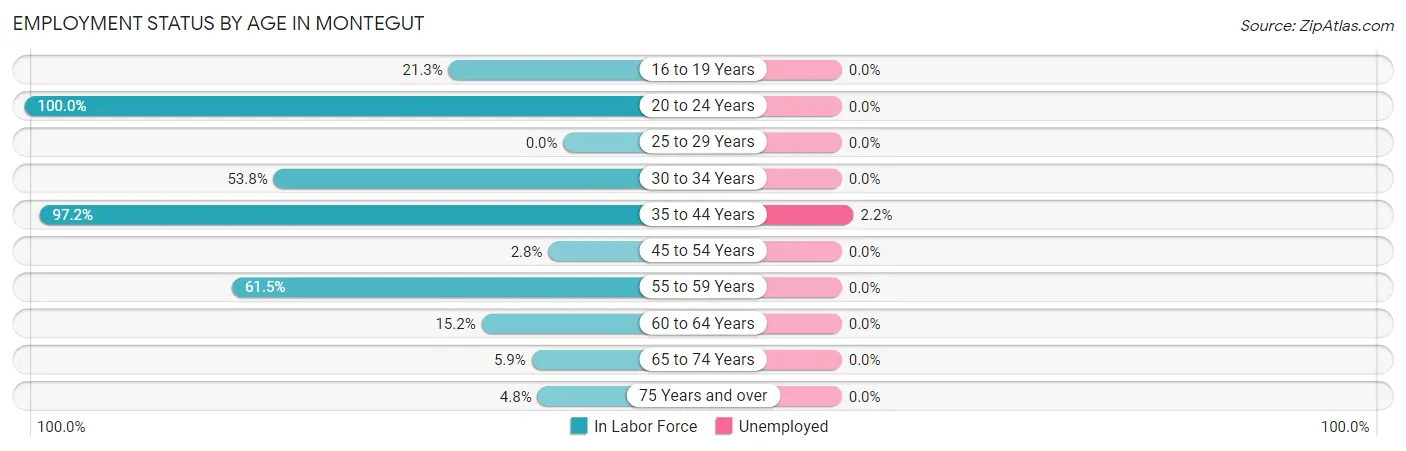
| Age Bracket | In Labor Force | Unemployed |
| 16 to 19 Years | 26 (21.3%) | 0 (0.0%) |
| 20 to 24 Years | 67 (100.0%) | 0 (0.0%) |
| 25 to 29 Years | 0 (0.0%) | 0 (0.0%) |
| 30 to 34 Years | 14 (53.8%) | 0 (0.0%) |
| 35 to 44 Years | 139 (97.2%) | 3 (2.2%) |
| 45 to 54 Years | 6 (2.8%) | 0 (0.0%) |
| 55 to 59 Years | 48 (61.5%) | 0 (0.0%) |
| 60 to 64 Years | 35 (15.2%) | 0 (0.0%) |
| 65 to 74 Years | 10 (5.9%) | 0 (0.0%) |
| 75 Years and over | 2 (4.8%) | 0 (0.0%) |
| Total | 347 (30.1%) | 3 (0.9%) |
Employment Status by Educational Attainment in Montegut
According to labor force statistics for Montegut, 32.2% of individuals (242) out of the total population between 25 and 64 years of age (752) are in the labor force, with 1.2% or 3 of them being unemployed. The group with the highest labor force participation rate are those with the educational attainment of college / associate degree, with 91.7% or 44 individuals in the labor force. Within the labor force, individuals with high school diploma education have the highest percentage of unemployment, with 3.0% or 3 of them being unemployed.
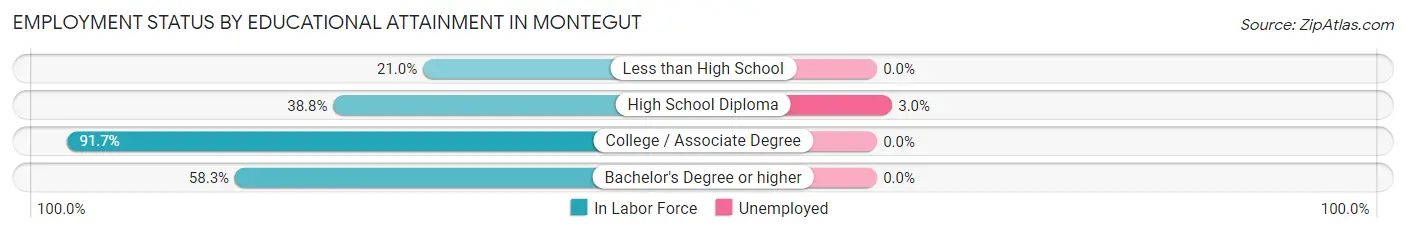
| Educational Attainment | In Labor Force | Unemployed |
| Less than High School | 91 (21.0%) | 0 (0.0%) |
| High School Diploma | 100 (38.8%) | 8 (3.0%) |
| College / Associate Degree | 44 (91.7%) | 0 (0.0%) |
| Bachelor's Degree or higher | 7 (58.3%) | 0 (0.0%) |
| Total | 242 (32.2%) | 9 (1.2%) |
Employment Occupations by Sex in Montegut
Management, Business, Science and Arts Occupations
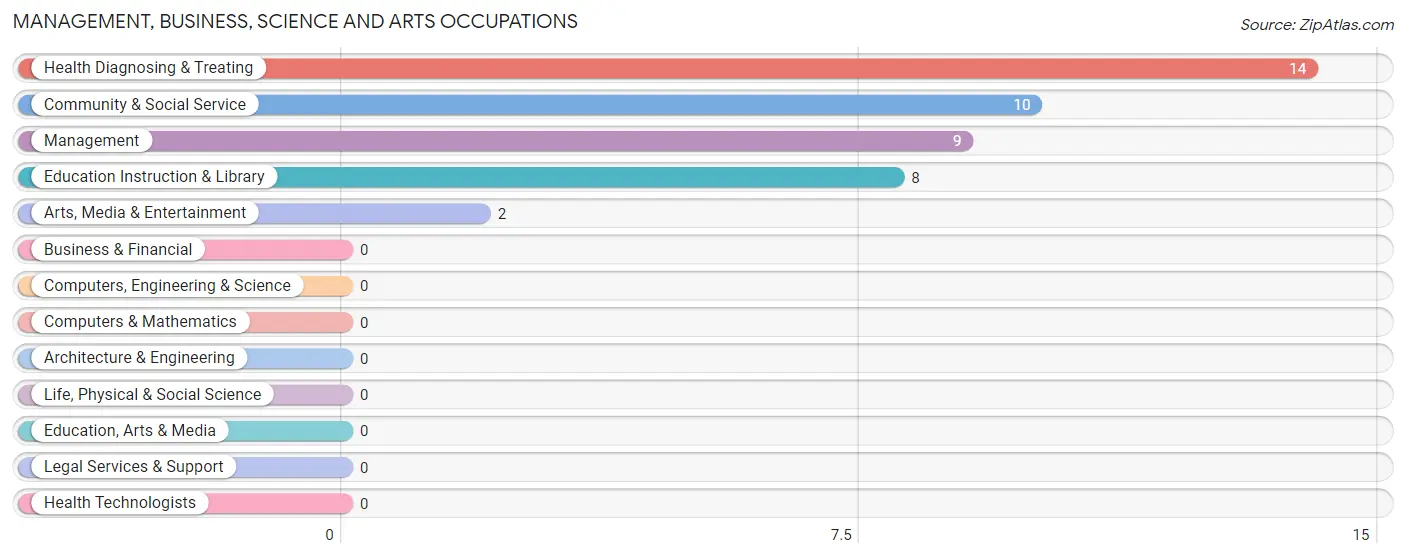
The most common Management, Business, Science and Arts occupations in Montegut are Health Diagnosing & Treating (14 | 4.1%), Community & Social Service (10 | 2.9%), Management (9 | 2.6%), Education Instruction & Library (8 | 2.3%), and Arts, Media & Entertainment (2 | 0.6%).
Management, Business, Science and Arts Occupations by Sex
Within the Management, Business, Science and Arts occupations in Montegut, the most male-oriented occupations are Management (100.0%), Education Instruction & Library (12.5%), and Community & Social Service (10.0%), while the most female-oriented occupations are Arts, Media & Entertainment (100.0%), Health Diagnosing & Treating (100.0%), and Community & Social Service (90.0%).
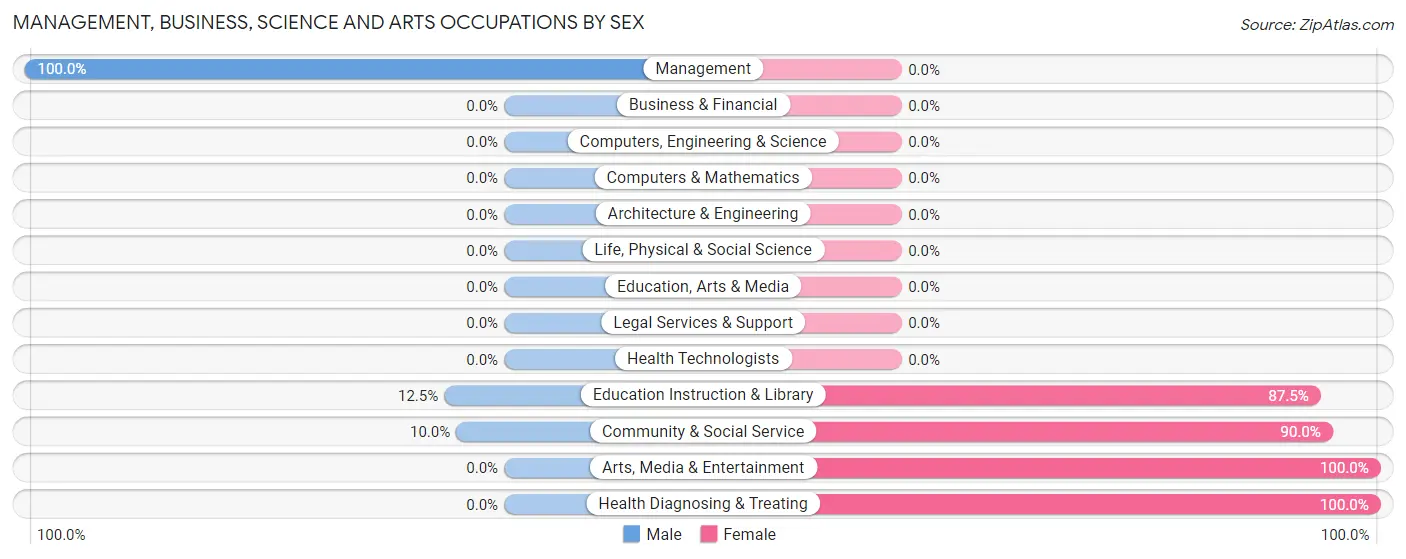
| Occupation | Male | Female |
| Management | 9 (100.0%) | 0 (0.0%) |
| Business & Financial | 0 (0.0%) | 0 (0.0%) |
| Computers, Engineering & Science | 0 (0.0%) | 0 (0.0%) |
| Computers & Mathematics | 0 (0.0%) | 0 (0.0%) |
| Architecture & Engineering | 0 (0.0%) | 0 (0.0%) |
| Life, Physical & Social Science | 0 (0.0%) | 0 (0.0%) |
| Community & Social Service | 1 (10.0%) | 9 (90.0%) |
| Education, Arts & Media | 0 (0.0%) | 0 (0.0%) |
| Legal Services & Support | 0 (0.0%) | 0 (0.0%) |
| Education Instruction & Library | 1 (12.5%) | 7 (87.5%) |
| Arts, Media & Entertainment | 0 (0.0%) | 2 (100.0%) |
| Health Diagnosing & Treating | 0 (0.0%) | 14 (100.0%) |
| Health Technologists | 0 (0.0%) | 0 (0.0%) |
| Total (Category) | 10 (30.3%) | 23 (69.7%) |
| Total (Overall) | 142 (41.3%) | 202 (58.7%) |
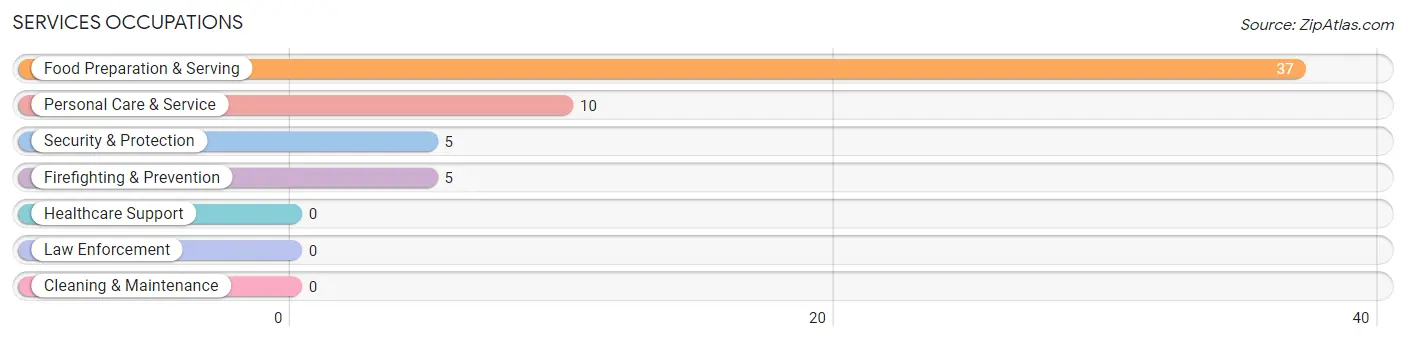
Services Occupations
The most common Services occupations in Montegut are Food Preparation & Serving (37 | 10.8%), Personal Care & Service (10 | 2.9%), Security & Protection (5 | 1.5%), and Firefighting & Prevention (5 | 1.5%).
Services Occupations by Sex
Within the Services occupations in Montegut, the most male-oriented occupations are Security & Protection (100.0%), and Firefighting & Prevention (100.0%), while the most female-oriented occupations are Food Preparation & Serving (100.0%), and Personal Care & Service (100.0%).
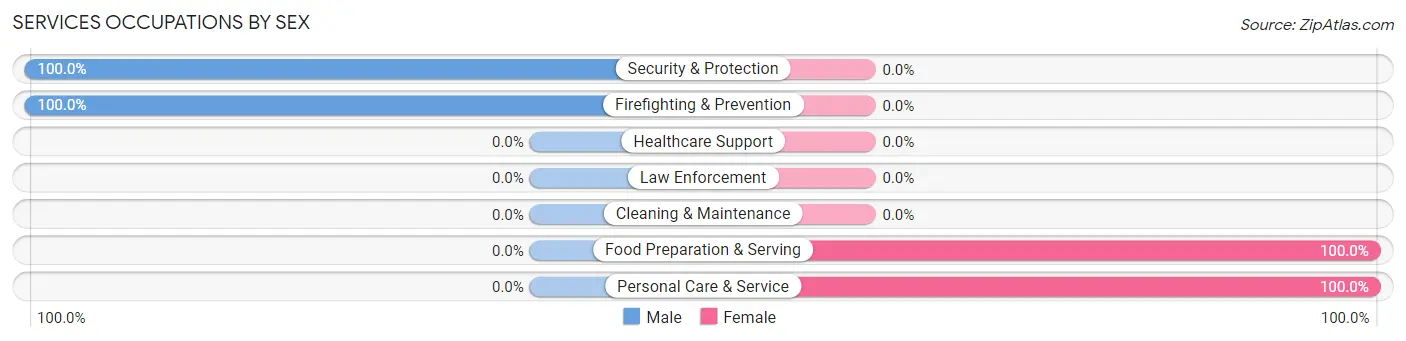
| Occupation | Male | Female |
| Healthcare Support | 0 (0.0%) | 0 (0.0%) |
| Security & Protection | 5 (100.0%) | 0 (0.0%) |
| Firefighting & Prevention | 5 (100.0%) | 0 (0.0%) |
| Law Enforcement | 0 (0.0%) | 0 (0.0%) |
| Food Preparation & Serving | 0 (0.0%) | 37 (100.0%) |
| Cleaning & Maintenance | 0 (0.0%) | 0 (0.0%) |
| Personal Care & Service | 0 (0.0%) | 10 (100.0%) |
| Total (Category) | 5 (9.6%) | 47 (90.4%) |
| Total (Overall) | 142 (41.3%) | 202 (58.7%) |
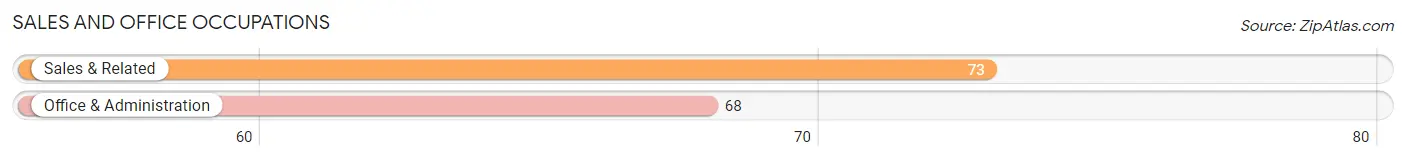
Sales and Office Occupations
The most common Sales and Office occupations in Montegut are Sales & Related (73 | 21.2%), and Office & Administration (68 | 19.8%).
Sales and Office Occupations by Sex
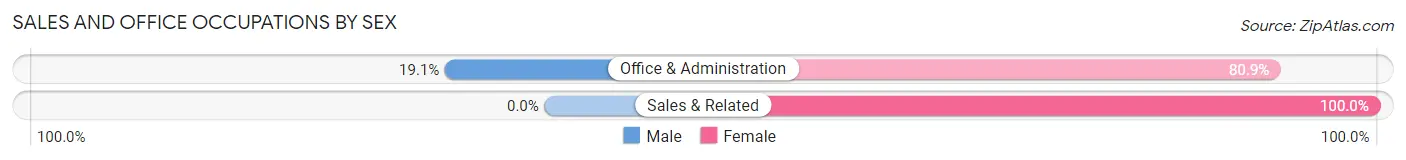
| Occupation | Male | Female |
| Sales & Related | 0 (0.0%) | 73 (100.0%) |
| Office & Administration | 13 (19.1%) | 55 (80.9%) |
| Total (Category) | 13 (9.2%) | 128 (90.8%) |
| Total (Overall) | 142 (41.3%) | 202 (58.7%) |
Natural Resources, Construction and Maintenance Occupations
The most common Natural Resources, Construction and Maintenance occupations in Montegut are Construction & Extraction (19 | 5.5%), and Farming, Fishing & Forestry (7 | 2.0%).

Natural Resources, Construction and Maintenance Occupations by Sex
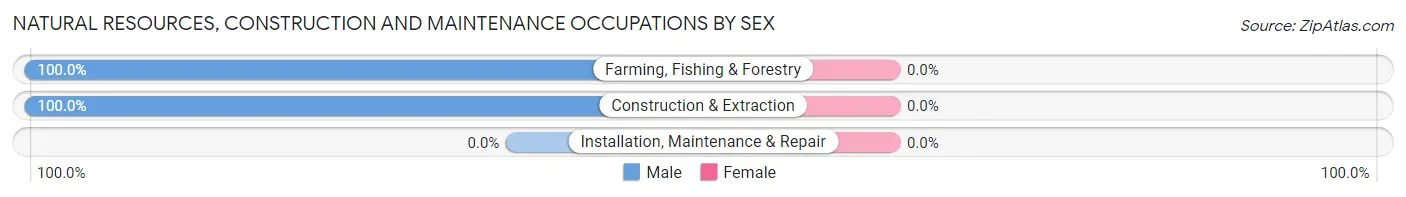
| Occupation | Male | Female |
| Farming, Fishing & Forestry | 7 (100.0%) | 0 (0.0%) |
| Construction & Extraction | 19 (100.0%) | 0 (0.0%) |
| Installation, Maintenance & Repair | 0 (0.0%) | 0 (0.0%) |
| Total (Category) | 26 (100.0%) | 0 (0.0%) |
| Total (Overall) | 142 (41.3%) | 202 (58.7%) |
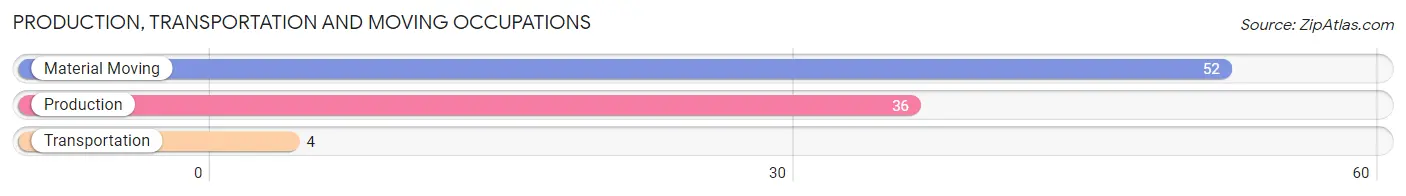
Production, Transportation and Moving Occupations
The most common Production, Transportation and Moving occupations in Montegut are Material Moving (52 | 15.1%), Production (36 | 10.5%), and Transportation (4 | 1.2%).
Production, Transportation and Moving Occupations by Sex
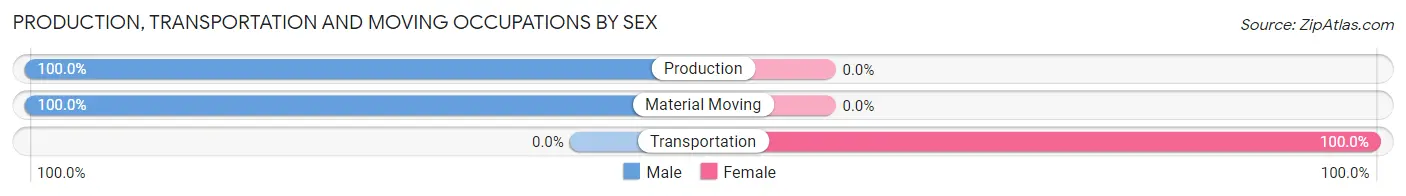
| Occupation | Male | Female |
| Production | 36 (100.0%) | 0 (0.0%) |
| Transportation | 0 (0.0%) | 4 (100.0%) |
| Material Moving | 52 (100.0%) | 0 (0.0%) |
| Total (Category) | 88 (95.7%) | 4 (4.3%) |
| Total (Overall) | 142 (41.3%) | 202 (58.7%) |
Employment Industries by Sex in Montegut
Employment Industries in Montegut
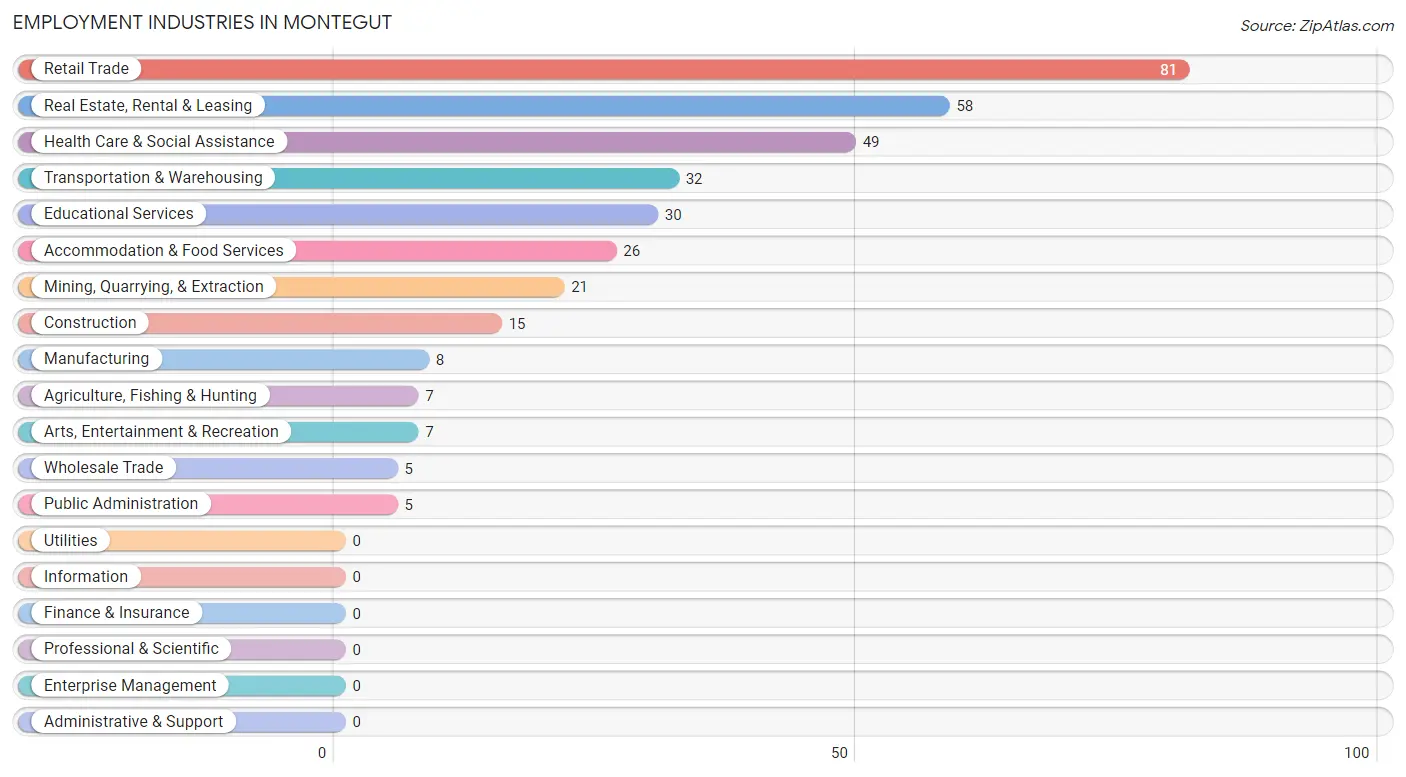
The major employment industries in Montegut include Retail Trade (81 | 23.5%), Real Estate, Rental & Leasing (58 | 16.9%), Health Care & Social Assistance (49 | 14.2%), Transportation & Warehousing (32 | 9.3%), and Educational Services (30 | 8.7%).
Employment Industries by Sex in Montegut
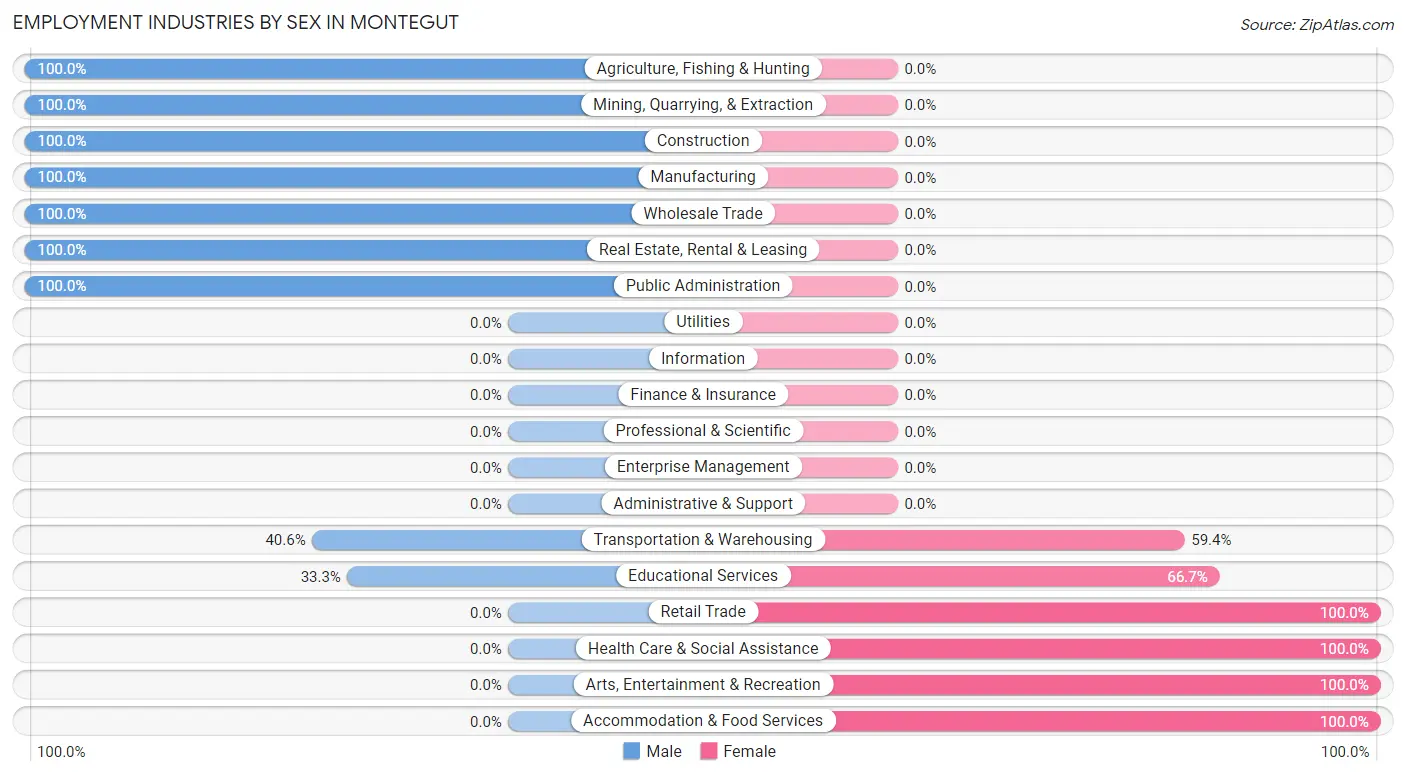
The Montegut industries that see more men than women are Agriculture, Fishing & Hunting (100.0%), Mining, Quarrying, & Extraction (100.0%), and Construction (100.0%), whereas the industries that tend to have a higher number of women are Retail Trade (100.0%), Health Care & Social Assistance (100.0%), and Arts, Entertainment & Recreation (100.0%).
| Industry | Male | Female |
| Agriculture, Fishing & Hunting | 7 (100.0%) | 0 (0.0%) |
| Mining, Quarrying, & Extraction | 21 (100.0%) | 0 (0.0%) |
| Construction | 15 (100.0%) | 0 (0.0%) |
| Manufacturing | 8 (100.0%) | 0 (0.0%) |
| Wholesale Trade | 5 (100.0%) | 0 (0.0%) |
| Retail Trade | 0 (0.0%) | 81 (100.0%) |
| Transportation & Warehousing | 13 (40.6%) | 19 (59.4%) |
| Utilities | 0 (0.0%) | 0 (0.0%) |
| Information | 0 (0.0%) | 0 (0.0%) |
| Finance & Insurance | 0 (0.0%) | 0 (0.0%) |
| Real Estate, Rental & Leasing | 58 (100.0%) | 0 (0.0%) |
| Professional & Scientific | 0 (0.0%) | 0 (0.0%) |
| Enterprise Management | 0 (0.0%) | 0 (0.0%) |
| Administrative & Support | 0 (0.0%) | 0 (0.0%) |
| Educational Services | 10 (33.3%) | 20 (66.7%) |
| Health Care & Social Assistance | 0 (0.0%) | 49 (100.0%) |
| Arts, Entertainment & Recreation | 0 (0.0%) | 7 (100.0%) |
| Accommodation & Food Services | 0 (0.0%) | 26 (100.0%) |
| Public Administration | 5 (100.0%) | 0 (0.0%) |
| Total | 142 (41.3%) | 202 (58.7%) |
Education in Montegut
School Enrollment in Montegut
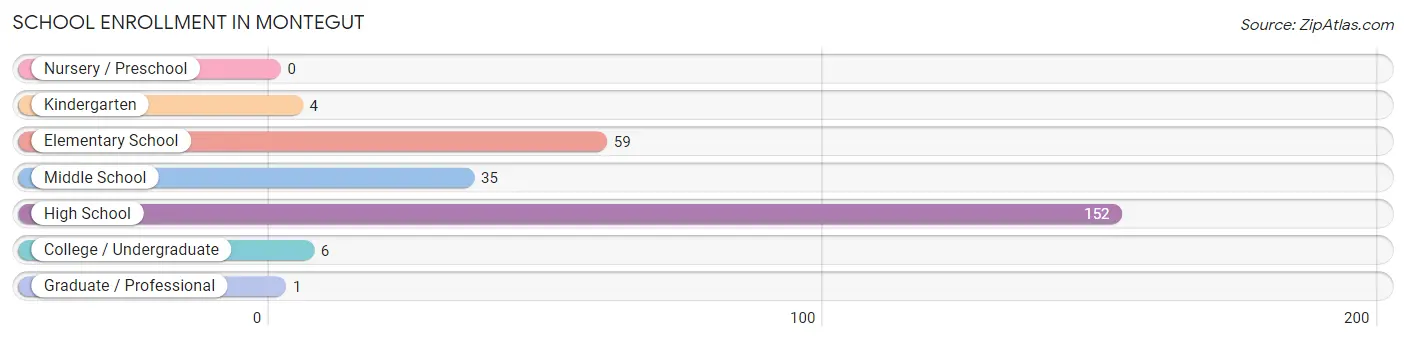
The most common levels of schooling among the 257 students in Montegut are high school (152 | 59.1%), elementary school (59 | 23.0%), and middle school (35 | 13.6%).
| School Level | # Students | % Students |
| Nursery / Preschool | 0 | 0.0% |
| Kindergarten | 4 | 1.6% |
| Elementary School | 59 | 23.0% |
| Middle School | 35 | 13.6% |
| High School | 152 | 59.1% |
| College / Undergraduate | 6 | 2.3% |
| Graduate / Professional | 1 | 0.4% |
| Total | 257 | 100.0% |
School Enrollment by Age by Funding Source in Montegut
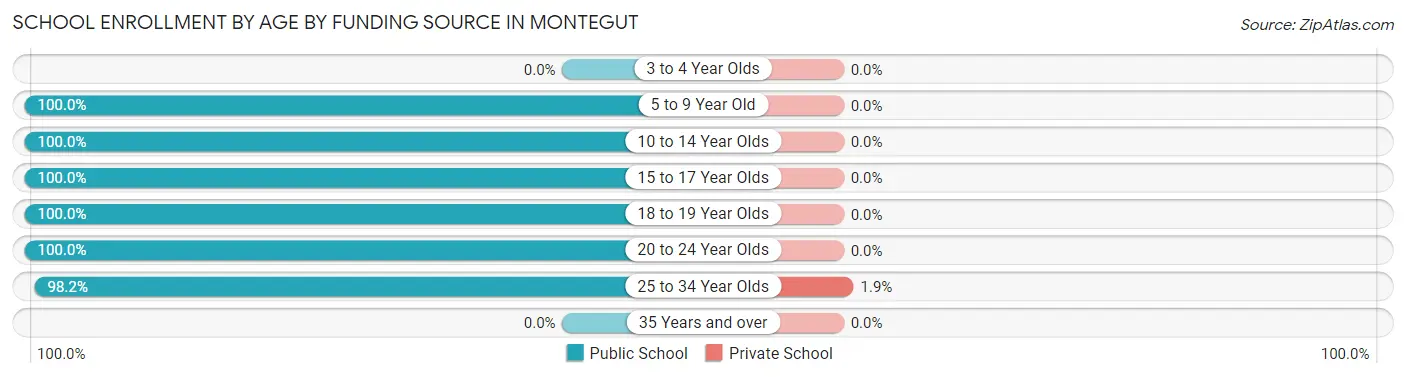
Out of a total of 257 students who are enrolled in schools in Montegut, 1 (0.4%) attend a private institution, while the remaining 256 (99.6%) are enrolled in public schools. The age group of 25 to 34 year olds has the highest likelihood of being enrolled in private schools, with 1 (1.8% in the age bracket) enrolled. Conversely, the age group of 5 to 9 year old has the lowest likelihood of being enrolled in a private school, with 63 (100.0% in the age bracket) attending a public institution.
| Age Bracket | Public School | Private School |
| 3 to 4 Year Olds | 0 (0.0%) | 0 (0.0%) |
| 5 to 9 Year Old | 63 (100.0%) | 0 (0.0%) |
| 10 to 14 Year Olds | 40 (100.0%) | 0 (0.0%) |
| 15 to 17 Year Olds | 78 (100.0%) | 0 (0.0%) |
| 18 to 19 Year Olds | 16 (100.0%) | 0 (0.0%) |
| 20 to 24 Year Olds | 6 (100.0%) | 0 (0.0%) |
| 25 to 34 Year Olds | 53 (98.2%) | 1 (1.8%) |
| 35 Years and over | 0 (0.0%) | 0 (0.0%) |
| Total | 256 (99.6%) | 1 (0.4%) |
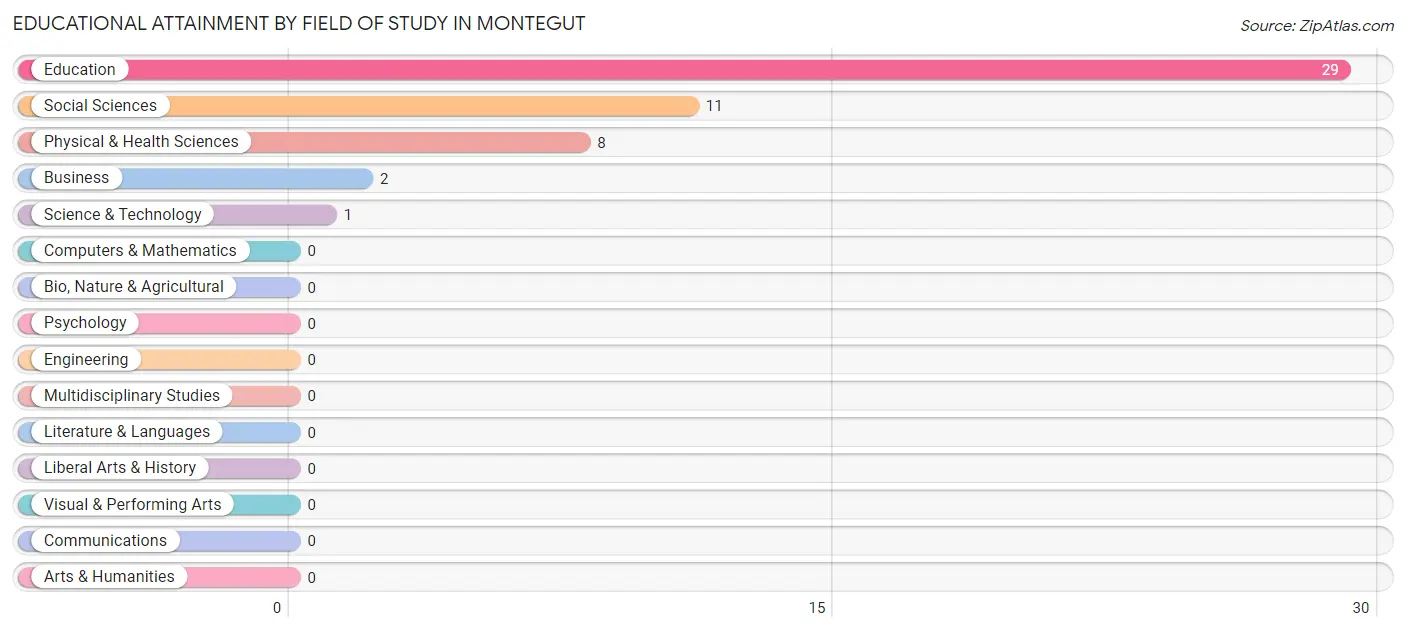
Educational Attainment by Field of Study in Montegut
Education (29 | 56.9%), social sciences (11 | 21.6%), physical & health sciences (8 | 15.7%), business (2 | 3.9%), and science & technology (1 | 2.0%) are the most common fields of study among 51 individuals in Montegut who have obtained a bachelor's degree or higher.
| Field of Study | # Graduates | % Graduates |
| Computers & Mathematics | 0 | 0.0% |
| Bio, Nature & Agricultural | 0 | 0.0% |
| Physical & Health Sciences | 8 | 15.7% |
| Psychology | 0 | 0.0% |
| Social Sciences | 11 | 21.6% |
| Engineering | 0 | 0.0% |
| Multidisciplinary Studies | 0 | 0.0% |
| Science & Technology | 1 | 2.0% |
| Business | 2 | 3.9% |
| Education | 29 | 56.9% |
| Literature & Languages | 0 | 0.0% |
| Liberal Arts & History | 0 | 0.0% |
| Visual & Performing Arts | 0 | 0.0% |
| Communications | 0 | 0.0% |
| Arts & Humanities | 0 | 0.0% |
| Total | 51 | 100.0% |
Transportation & Commute in Montegut
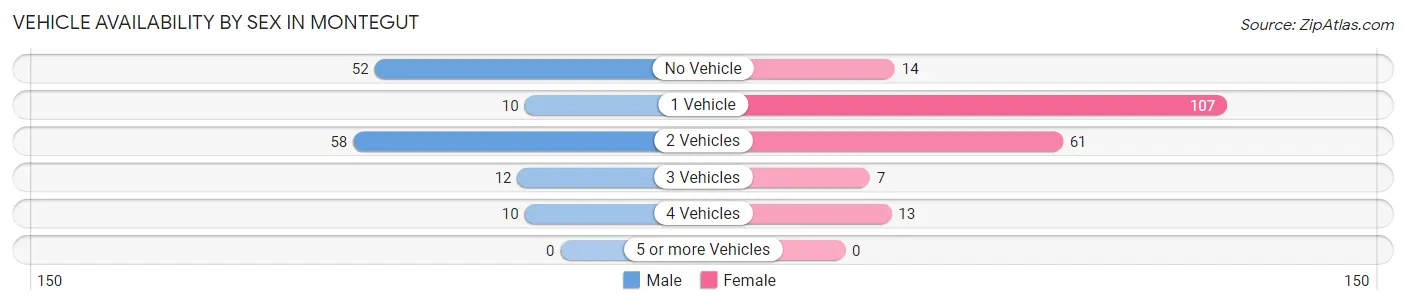
Vehicle Availability by Sex in Montegut
The most prevalent vehicle ownership categories in Montegut are males with 2 vehicles (58, accounting for 40.8%) and females with 2 vehicles (61, making up 28.7%).
| Vehicles Available | Male | Female |
| No Vehicle | 52 (36.6%) | 14 (6.9%) |
| 1 Vehicle | 10 (7.0%) | 107 (53.0%) |
| 2 Vehicles | 58 (40.8%) | 61 (30.2%) |
| 3 Vehicles | 12 (8.5%) | 7 (3.5%) |
| 4 Vehicles | 10 (7.0%) | 13 (6.4%) |
| 5 or more Vehicles | 0 (0.0%) | 0 (0.0%) |
| Total | 142 (100.0%) | 202 (100.0%) |
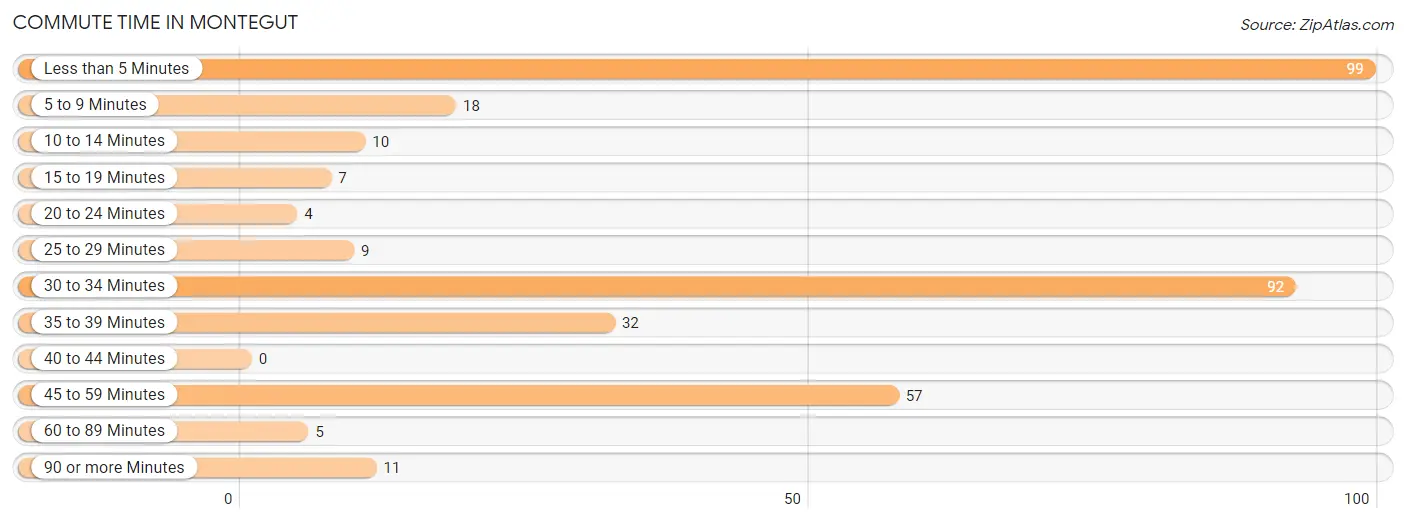
Commute Time in Montegut
The most frequently occuring commute durations in Montegut are less than 5 minutes (99 commuters, 28.8%), 30 to 34 minutes (92 commuters, 26.7%), and 45 to 59 minutes (57 commuters, 16.6%).
| Commute Time | # Commuters | % Commuters |
| Less than 5 Minutes | 99 | 28.8% |
| 5 to 9 Minutes | 18 | 5.2% |
| 10 to 14 Minutes | 10 | 2.9% |
| 15 to 19 Minutes | 7 | 2.0% |
| 20 to 24 Minutes | 4 | 1.2% |
| 25 to 29 Minutes | 9 | 2.6% |
| 30 to 34 Minutes | 92 | 26.7% |
| 35 to 39 Minutes | 32 | 9.3% |
| 40 to 44 Minutes | 0 | 0.0% |
| 45 to 59 Minutes | 57 | 16.6% |
| 60 to 89 Minutes | 5 | 1.5% |
| 90 or more Minutes | 11 | 3.2% |
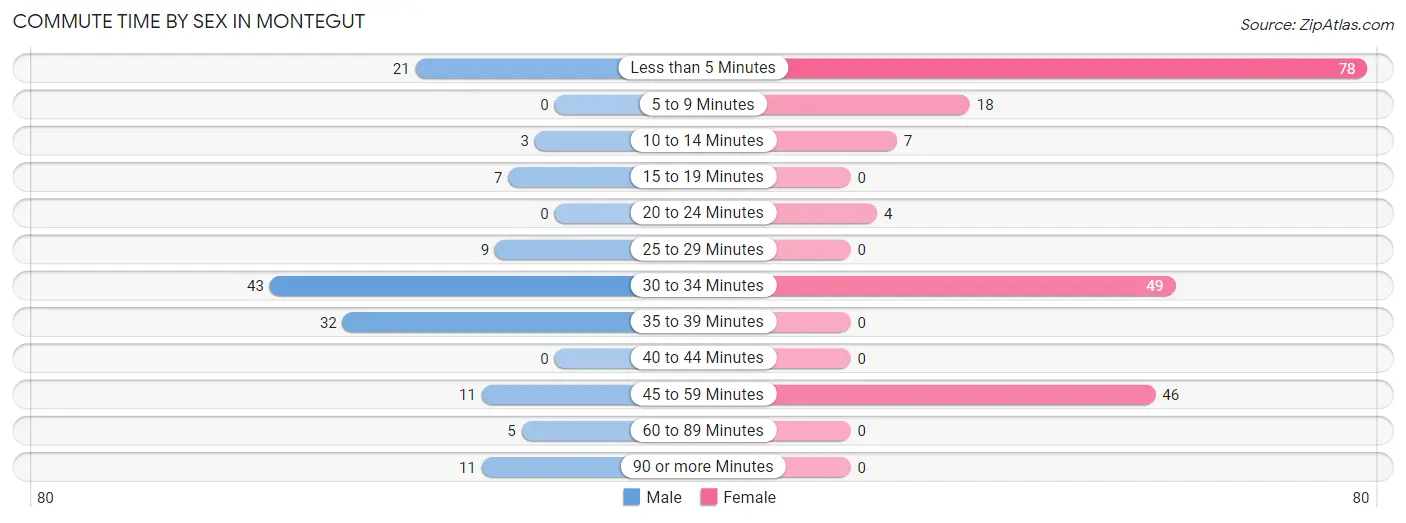
Commute Time by Sex in Montegut
The most common commute times in Montegut are 30 to 34 minutes (43 commuters, 30.3%) for males and less than 5 minutes (78 commuters, 38.6%) for females.
| Commute Time | Male | Female |
| Less than 5 Minutes | 21 (14.8%) | 78 (38.6%) |
| 5 to 9 Minutes | 0 (0.0%) | 18 (8.9%) |
| 10 to 14 Minutes | 3 (2.1%) | 7 (3.5%) |
| 15 to 19 Minutes | 7 (4.9%) | 0 (0.0%) |
| 20 to 24 Minutes | 0 (0.0%) | 4 (2.0%) |
| 25 to 29 Minutes | 9 (6.3%) | 0 (0.0%) |
| 30 to 34 Minutes | 43 (30.3%) | 49 (24.3%) |
| 35 to 39 Minutes | 32 (22.5%) | 0 (0.0%) |
| 40 to 44 Minutes | 0 (0.0%) | 0 (0.0%) |
| 45 to 59 Minutes | 11 (7.7%) | 46 (22.8%) |
| 60 to 89 Minutes | 5 (3.5%) | 0 (0.0%) |
| 90 or more Minutes | 11 (7.7%) | 0 (0.0%) |
Time of Departure to Work by Sex in Montegut
The most frequent times of departure to work in Montegut are 6:00 AM to 6:29 AM (42, 29.6%) for males and 5:00 AM to 5:29 AM (67, 33.2%) for females.
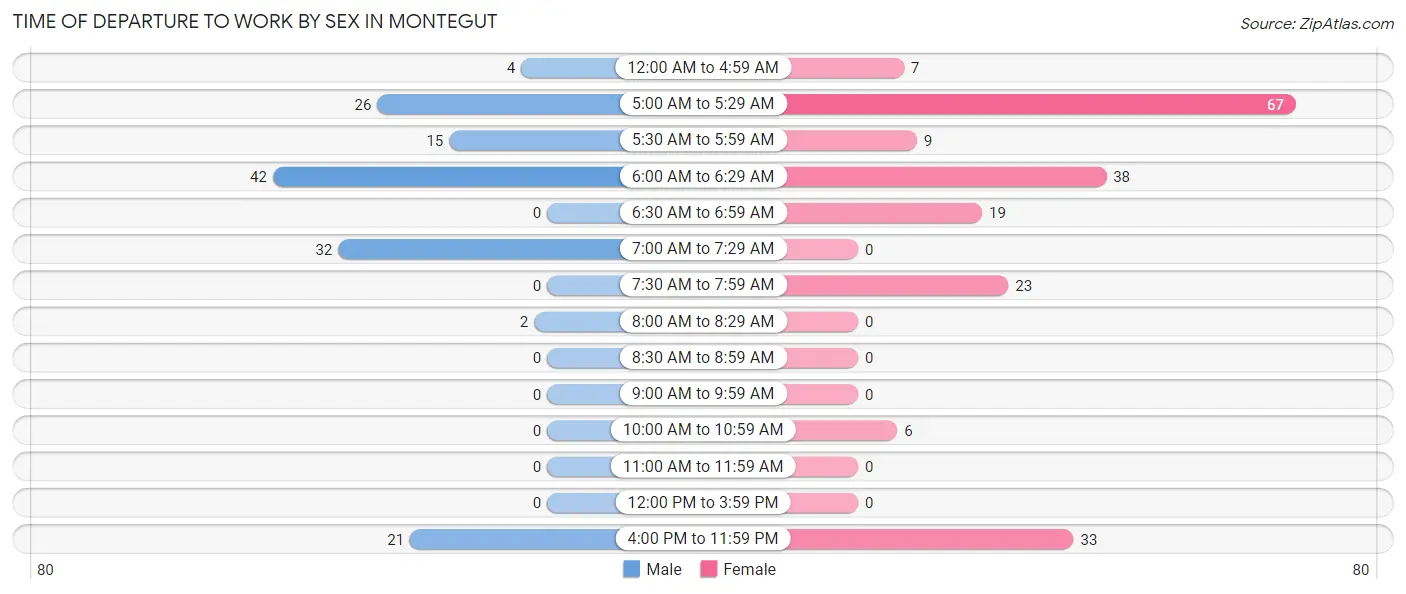
| Time of Departure | Male | Female |
| 12:00 AM to 4:59 AM | 4 (2.8%) | 7 (3.5%) |
| 5:00 AM to 5:29 AM | 26 (18.3%) | 67 (33.2%) |
| 5:30 AM to 5:59 AM | 15 (10.6%) | 9 (4.5%) |
| 6:00 AM to 6:29 AM | 42 (29.6%) | 38 (18.8%) |
| 6:30 AM to 6:59 AM | 0 (0.0%) | 19 (9.4%) |
| 7:00 AM to 7:29 AM | 32 (22.5%) | 0 (0.0%) |
| 7:30 AM to 7:59 AM | 0 (0.0%) | 23 (11.4%) |
| 8:00 AM to 8:29 AM | 2 (1.4%) | 0 (0.0%) |
| 8:30 AM to 8:59 AM | 0 (0.0%) | 0 (0.0%) |
| 9:00 AM to 9:59 AM | 0 (0.0%) | 0 (0.0%) |
| 10:00 AM to 10:59 AM | 0 (0.0%) | 6 (3.0%) |
| 11:00 AM to 11:59 AM | 0 (0.0%) | 0 (0.0%) |
| 12:00 PM to 3:59 PM | 0 (0.0%) | 0 (0.0%) |
| 4:00 PM to 11:59 PM | 21 (14.8%) | 33 (16.3%) |
| Total | 142 (100.0%) | 202 (100.0%) |
Housing Occupancy in Montegut
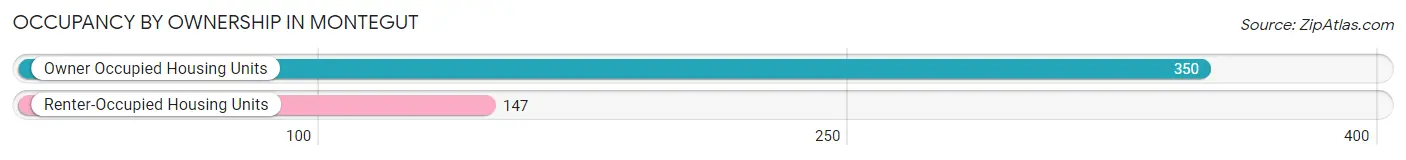
Occupancy by Ownership in Montegut
Of the total 497 dwellings in Montegut, owner-occupied units account for 350 (70.4%), while renter-occupied units make up 147 (29.6%).
| Occupancy | # Housing Units | % Housing Units |
| Owner Occupied Housing Units | 350 | 70.4% |
| Renter-Occupied Housing Units | 147 | 29.6% |
| Total Occupied Housing Units | 497 | 100.0% |
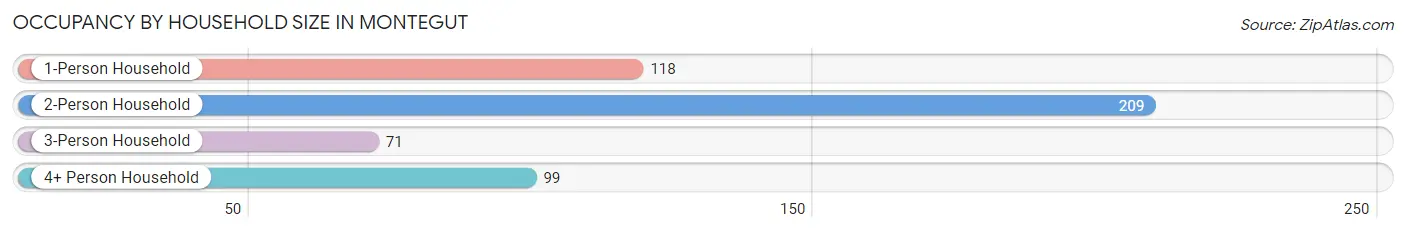
Occupancy by Household Size in Montegut
| Household Size | # Housing Units | % Housing Units |
| 1-Person Household | 118 | 23.7% |
| 2-Person Household | 209 | 42.0% |
| 3-Person Household | 71 | 14.3% |
| 4+ Person Household | 99 | 19.9% |
| Total Housing Units | 497 | 100.0% |
Occupancy by Ownership by Household Size in Montegut
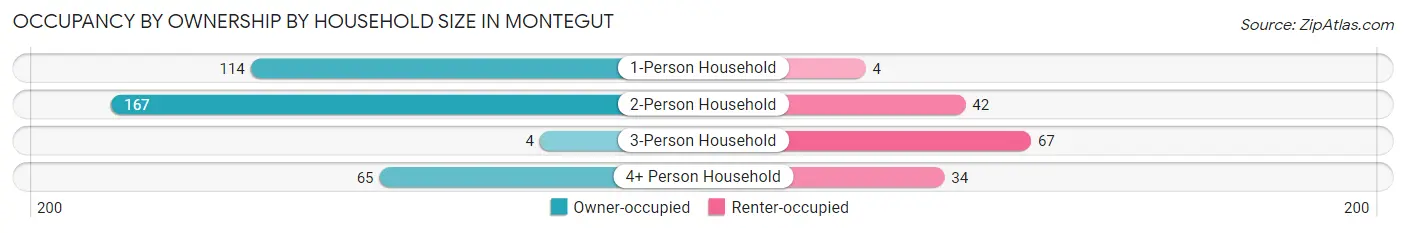
| Household Size | Owner-occupied | Renter-occupied |
| 1-Person Household | 114 (96.6%) | 4 (3.4%) |
| 2-Person Household | 167 (79.9%) | 42 (20.1%) |
| 3-Person Household | 4 (5.6%) | 67 (94.4%) |
| 4+ Person Household | 65 (65.7%) | 34 (34.3%) |
| Total Housing Units | 350 (70.4%) | 147 (29.6%) |
Occupancy by Educational Attainment in Montegut
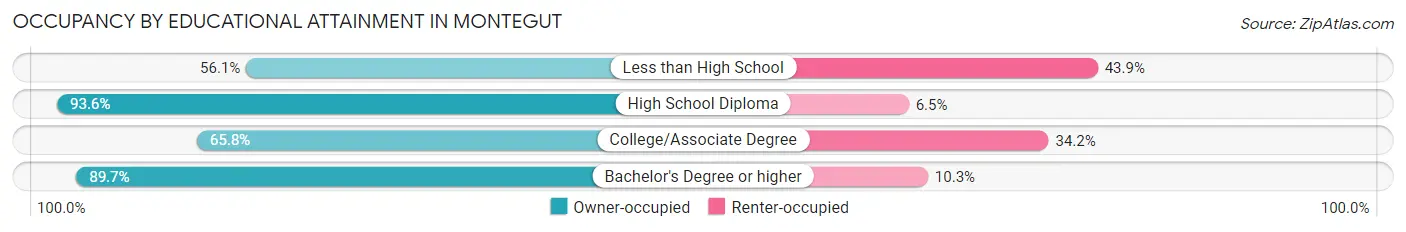
| Household Size | Owner-occupied | Renter-occupied |
| Less than High School | 120 (56.1%) | 94 (43.9%) |
| High School Diploma | 116 (93.5%) | 8 (6.5%) |
| College/Associate Degree | 79 (65.8%) | 41 (34.2%) |
| Bachelor's Degree or higher | 35 (89.7%) | 4 (10.3%) |
Occupancy by Age of Householder in Montegut
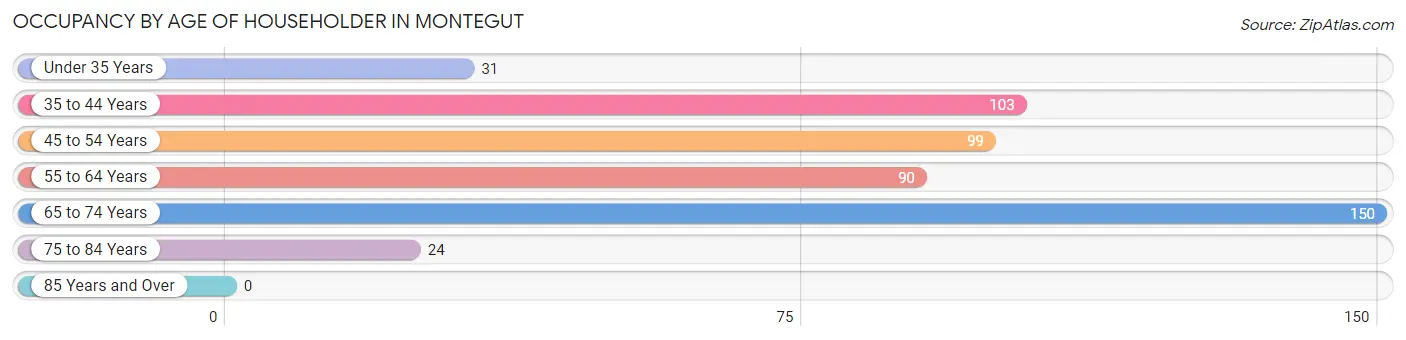
| Age Bracket | # Households | % Households |
| Under 35 Years | 31 | 6.2% |
| 35 to 44 Years | 103 | 20.7% |
| 45 to 54 Years | 99 | 19.9% |
| 55 to 64 Years | 90 | 18.1% |
| 65 to 74 Years | 150 | 30.2% |
| 75 to 84 Years | 24 | 4.8% |
| 85 Years and Over | 0 | 0.0% |
| Total | 497 | 100.0% |
Housing Finances in Montegut
Median Income by Occupancy in Montegut
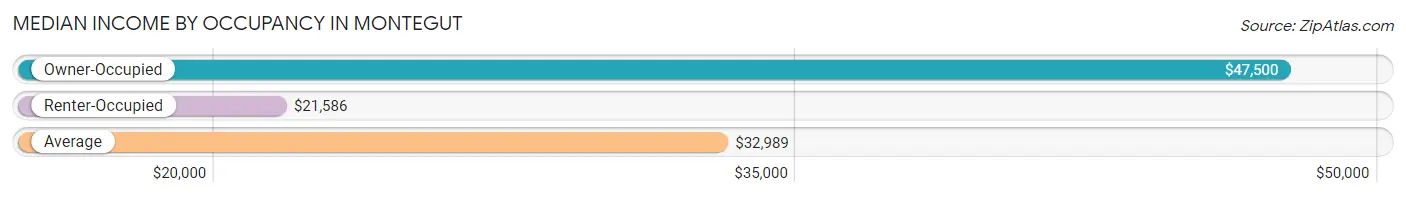
| Occupancy Type | # Households | Median Income |
| Owner-Occupied | 350 (70.4%) | $47,500 |
| Renter-Occupied | 147 (29.6%) | $21,586 |
| Average | 497 (100.0%) | $32,989 |
Occupancy by Householder Income Bracket in Montegut
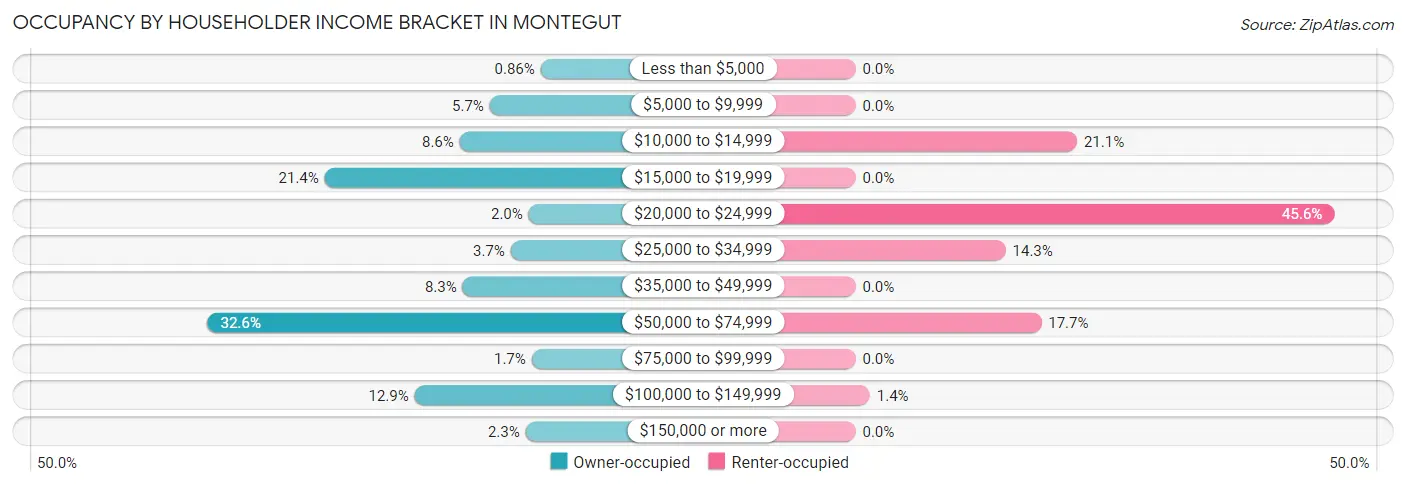
| Income Bracket | Owner-occupied | Renter-occupied |
| Less than $5,000 | 3 (0.9%) | 0 (0.0%) |
| $5,000 to $9,999 | 20 (5.7%) | 0 (0.0%) |
| $10,000 to $14,999 | 30 (8.6%) | 31 (21.1%) |
| $15,000 to $19,999 | 75 (21.4%) | 0 (0.0%) |
| $20,000 to $24,999 | 7 (2.0%) | 67 (45.6%) |
| $25,000 to $34,999 | 13 (3.7%) | 21 (14.3%) |
| $35,000 to $49,999 | 29 (8.3%) | 0 (0.0%) |
| $50,000 to $74,999 | 114 (32.6%) | 26 (17.7%) |
| $75,000 to $99,999 | 6 (1.7%) | 0 (0.0%) |
| $100,000 to $149,999 | 45 (12.9%) | 2 (1.4%) |
| $150,000 or more | 8 (2.3%) | 0 (0.0%) |
| Total | 350 (100.0%) | 147 (100.0%) |
Monthly Housing Cost Tiers in Montegut
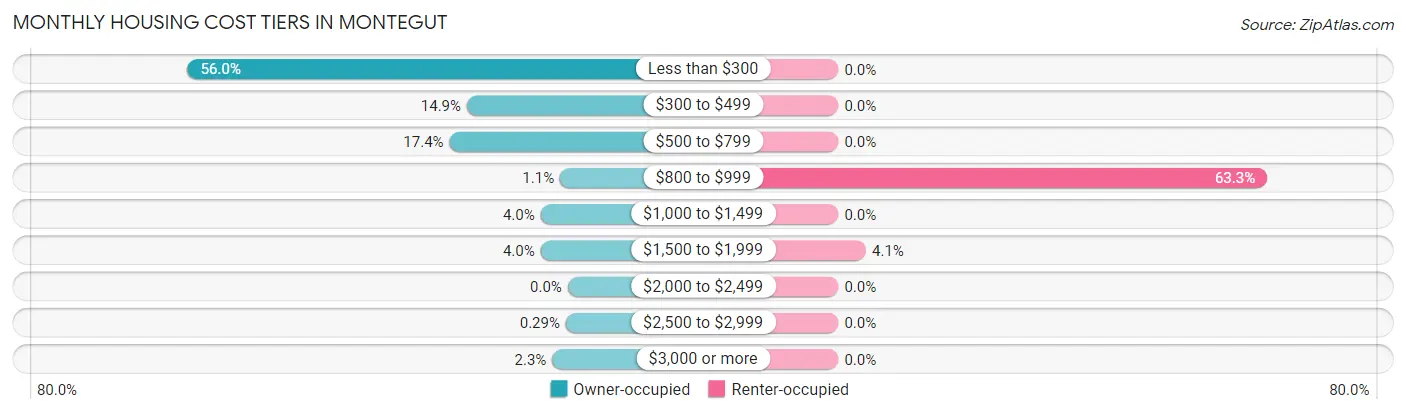
| Monthly Cost | Owner-occupied | Renter-occupied |
| Less than $300 | 196 (56.0%) | 0 (0.0%) |
| $300 to $499 | 52 (14.9%) | 0 (0.0%) |
| $500 to $799 | 61 (17.4%) | 0 (0.0%) |
| $800 to $999 | 4 (1.1%) | 93 (63.3%) |
| $1,000 to $1,499 | 14 (4.0%) | 0 (0.0%) |
| $1,500 to $1,999 | 14 (4.0%) | 6 (4.1%) |
| $2,000 to $2,499 | 0 (0.0%) | 0 (0.0%) |
| $2,500 to $2,999 | 1 (0.3%) | 0 (0.0%) |
| $3,000 or more | 8 (2.3%) | 0 (0.0%) |
| Total | 350 (100.0%) | 147 (100.0%) |
Physical Housing Characteristics in Montegut
Housing Structures in Montegut
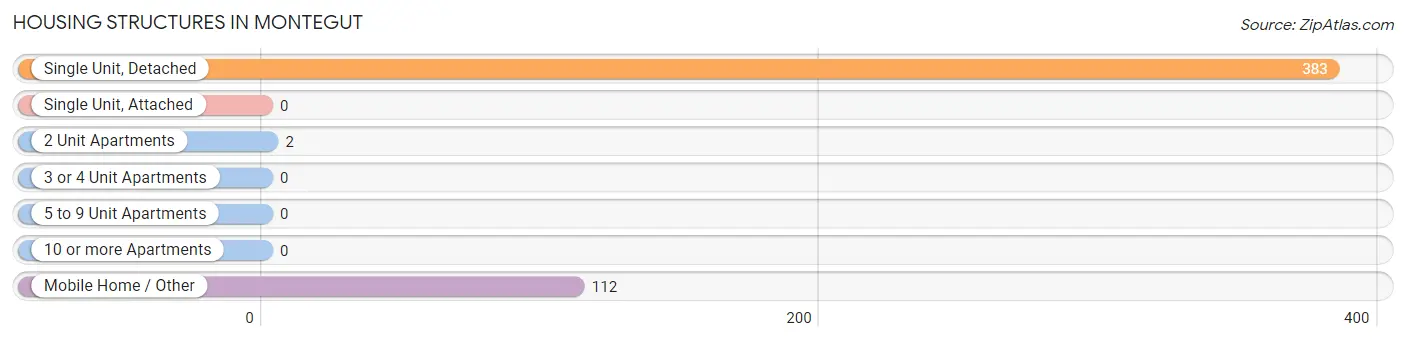
| Structure Type | # Housing Units | % Housing Units |
| Single Unit, Detached | 383 | 77.1% |
| Single Unit, Attached | 0 | 0.0% |
| 2 Unit Apartments | 2 | 0.4% |
| 3 or 4 Unit Apartments | 0 | 0.0% |
| 5 to 9 Unit Apartments | 0 | 0.0% |
| 10 or more Apartments | 0 | 0.0% |
| Mobile Home / Other | 112 | 22.5% |
| Total | 497 | 100.0% |
Housing Structures by Occupancy in Montegut
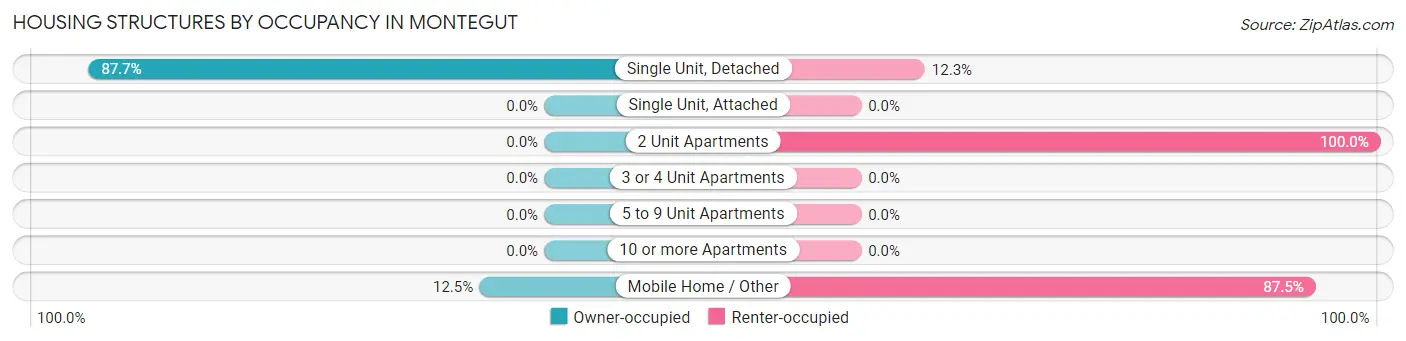
| Structure Type | Owner-occupied | Renter-occupied |
| Single Unit, Detached | 336 (87.7%) | 47 (12.3%) |
| Single Unit, Attached | 0 (0.0%) | 0 (0.0%) |
| 2 Unit Apartments | 0 (0.0%) | 2 (100.0%) |
| 3 or 4 Unit Apartments | 0 (0.0%) | 0 (0.0%) |
| 5 to 9 Unit Apartments | 0 (0.0%) | 0 (0.0%) |
| 10 or more Apartments | 0 (0.0%) | 0 (0.0%) |
| Mobile Home / Other | 14 (12.5%) | 98 (87.5%) |
| Total | 350 (70.4%) | 147 (29.6%) |
Housing Structures by Number of Rooms in Montegut
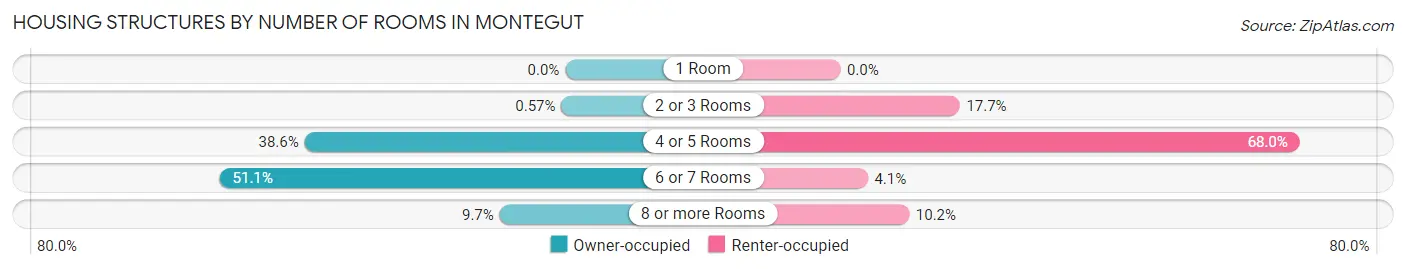
| Number of Rooms | Owner-occupied | Renter-occupied |
| 1 Room | 0 (0.0%) | 0 (0.0%) |
| 2 or 3 Rooms | 2 (0.6%) | 26 (17.7%) |
| 4 or 5 Rooms | 135 (38.6%) | 100 (68.0%) |
| 6 or 7 Rooms | 179 (51.1%) | 6 (4.1%) |
| 8 or more Rooms | 34 (9.7%) | 15 (10.2%) |
| Total | 350 (100.0%) | 147 (100.0%) |
Housing Structure by Heating Type in Montegut
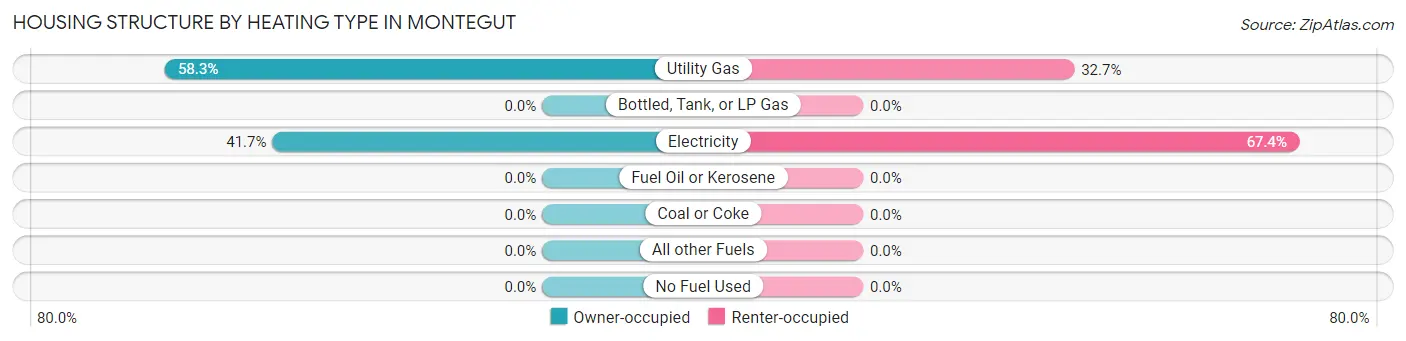
| Heating Type | Owner-occupied | Renter-occupied |
| Utility Gas | 204 (58.3%) | 48 (32.7%) |
| Bottled, Tank, or LP Gas | 0 (0.0%) | 0 (0.0%) |
| Electricity | 146 (41.7%) | 99 (67.3%) |
| Fuel Oil or Kerosene | 0 (0.0%) | 0 (0.0%) |
| Coal or Coke | 0 (0.0%) | 0 (0.0%) |
| All other Fuels | 0 (0.0%) | 0 (0.0%) |
| No Fuel Used | 0 (0.0%) | 0 (0.0%) |
| Total | 350 (100.0%) | 147 (100.0%) |
Household Vehicle Usage in Montegut
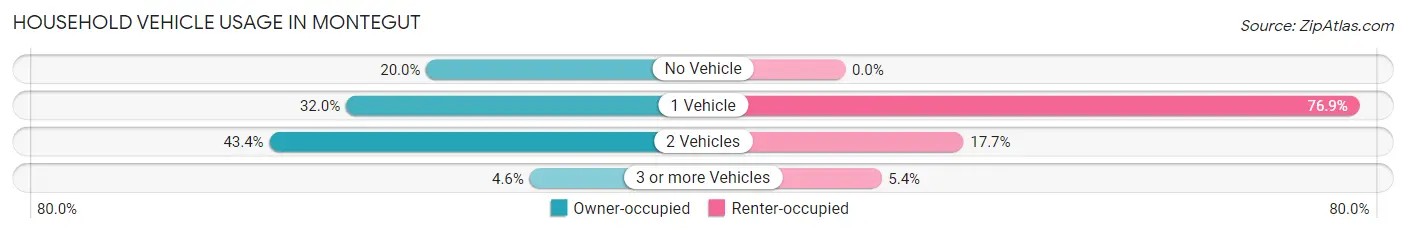
| Vehicles per Household | Owner-occupied | Renter-occupied |
| No Vehicle | 70 (20.0%) | 0 (0.0%) |
| 1 Vehicle | 112 (32.0%) | 113 (76.9%) |
| 2 Vehicles | 152 (43.4%) | 26 (17.7%) |
| 3 or more Vehicles | 16 (4.6%) | 8 (5.4%) |
| Total | 350 (100.0%) | 147 (100.0%) |
Real Estate & Mortgages in Montegut
Real Estate and Mortgage Overview in Montegut
| Characteristic | Without Mortgage | With Mortgage |
| Housing Units | 282 | 68 |
| Median Property Value | $89,200 | $105,400 |
| Median Household Income | - | - |
| Monthly Housing Costs | $275 | $8 |
| Real Estate Taxes | $199 | $31 |
Property Value by Mortgage Status in Montegut
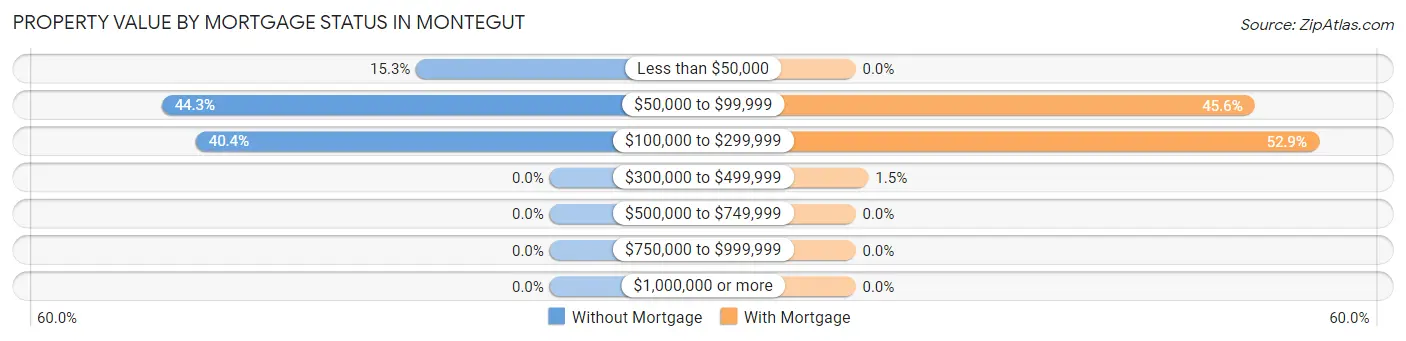
| Property Value | Without Mortgage | With Mortgage |
| Less than $50,000 | 43 (15.2%) | 0 (0.0%) |
| $50,000 to $99,999 | 125 (44.3%) | 31 (45.6%) |
| $100,000 to $299,999 | 114 (40.4%) | 36 (52.9%) |
| $300,000 to $499,999 | 0 (0.0%) | 1 (1.5%) |
| $500,000 to $749,999 | 0 (0.0%) | 0 (0.0%) |
| $750,000 to $999,999 | 0 (0.0%) | 0 (0.0%) |
| $1,000,000 or more | 0 (0.0%) | 0 (0.0%) |
| Total | 282 (100.0%) | 68 (100.0%) |
Household Income by Mortgage Status in Montegut
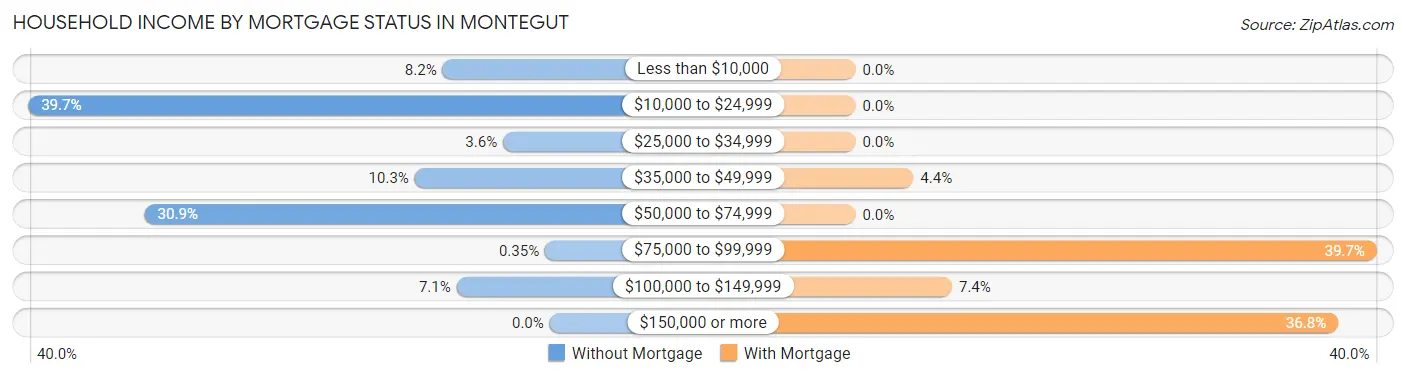
| Household Income | Without Mortgage | With Mortgage |
| Less than $10,000 | 23 (8.2%) | 0 (0.0%) |
| $10,000 to $24,999 | 112 (39.7%) | 0 (0.0%) |
| $25,000 to $34,999 | 10 (3.5%) | 0 (0.0%) |
| $35,000 to $49,999 | 29 (10.3%) | 3 (4.4%) |
| $50,000 to $74,999 | 87 (30.8%) | 0 (0.0%) |
| $75,000 to $99,999 | 1 (0.4%) | 27 (39.7%) |
| $100,000 to $149,999 | 20 (7.1%) | 5 (7.3%) |
| $150,000 or more | 0 (0.0%) | 25 (36.8%) |
| Total | 282 (100.0%) | 68 (100.0%) |
Property Value to Household Income Ratio in Montegut
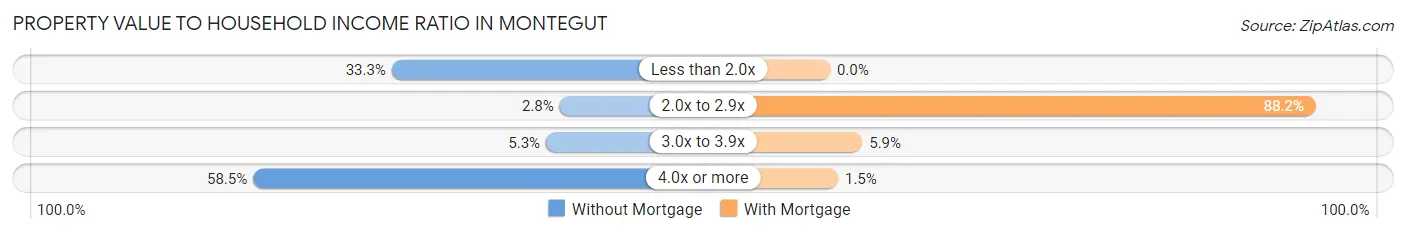
| Value-to-Income Ratio | Without Mortgage | With Mortgage |
| Less than 2.0x | 94 (33.3%) | 0 (0.0%) |
| 2.0x to 2.9x | 8 (2.8%) | 60 (88.2%) |
| 3.0x to 3.9x | 15 (5.3%) | 4 (5.9%) |
| 4.0x or more | 165 (58.5%) | 1 (1.5%) |
| Total | 282 (100.0%) | 68 (100.0%) |
Real Estate Taxes by Mortgage Status in Montegut
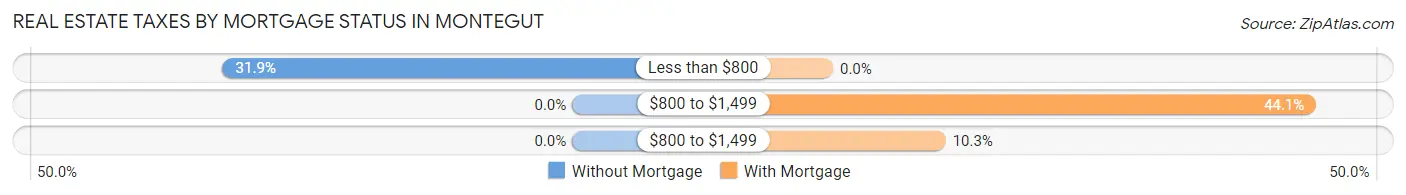
| Property Taxes | Without Mortgage | With Mortgage |
| Less than $800 | 90 (31.9%) | 0 (0.0%) |
| $800 to $1,499 | 0 (0.0%) | 30 (44.1%) |
| $800 to $1,499 | 0 (0.0%) | 7 (10.3%) |
| Total | 282 (100.0%) | 68 (100.0%) |
Health & Disability in Montegut
Health Insurance Coverage by Age in Montegut
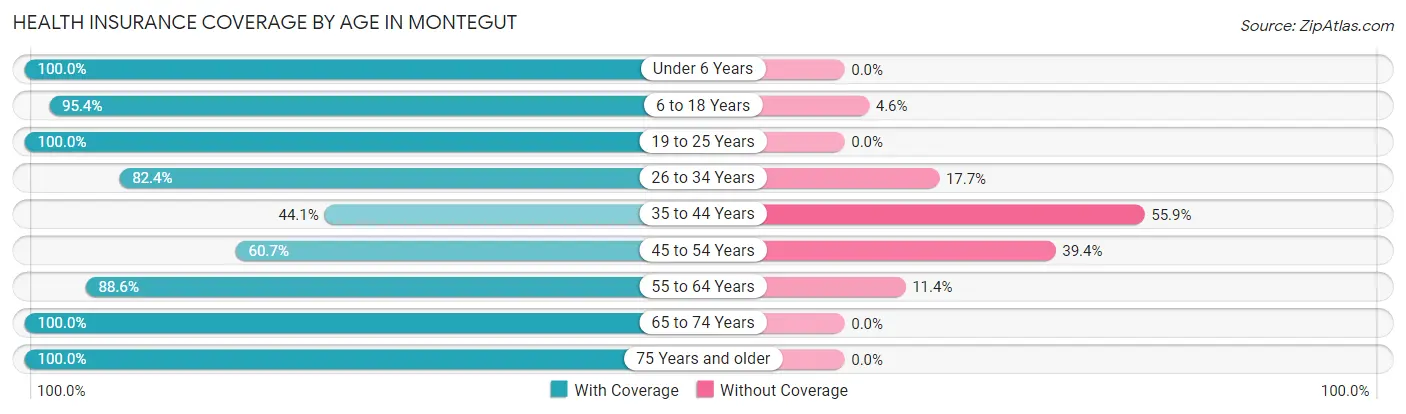
| Age Bracket | With Coverage | Without Coverage |
| Under 6 Years | 96 (100.0%) | 0 (0.0%) |
| 6 to 18 Years | 209 (95.4%) | 10 (4.6%) |
| 19 to 25 Years | 69 (100.0%) | 0 (0.0%) |
| 26 to 34 Years | 70 (82.4%) | 15 (17.6%) |
| 35 to 44 Years | 63 (44.1%) | 80 (55.9%) |
| 45 to 54 Years | 131 (60.7%) | 85 (39.4%) |
| 55 to 64 Years | 273 (88.6%) | 35 (11.4%) |
| 65 to 74 Years | 169 (100.0%) | 0 (0.0%) |
| 75 Years and older | 42 (100.0%) | 0 (0.0%) |
| Total | 1,122 (83.3%) | 225 (16.7%) |
Health Insurance Coverage by Citizenship Status in Montegut
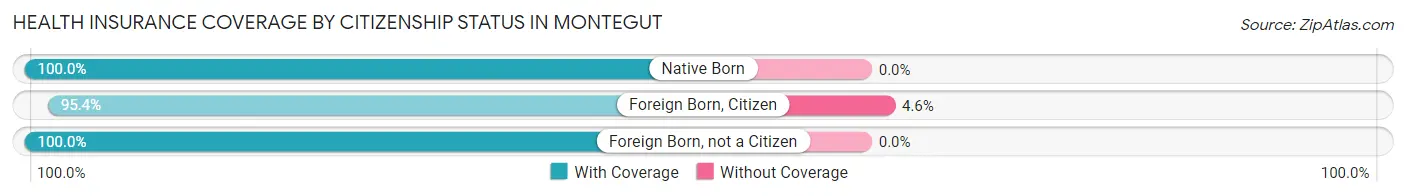
| Citizenship Status | With Coverage | Without Coverage |
| Native Born | 96 (100.0%) | 0 (0.0%) |
| Foreign Born, Citizen | 209 (95.4%) | 10 (4.6%) |
| Foreign Born, not a Citizen | 69 (100.0%) | 0 (0.0%) |
Health Insurance Coverage by Household Income in Montegut
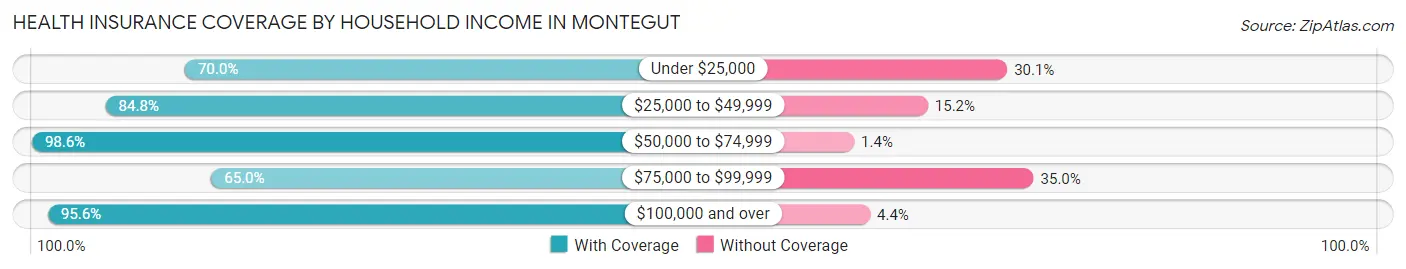
| Household Income | With Coverage | Without Coverage |
| Under $25,000 | 419 (70.0%) | 180 (30.0%) |
| $25,000 to $49,999 | 134 (84.8%) | 24 (15.2%) |
| $50,000 to $74,999 | 358 (98.6%) | 5 (1.4%) |
| $75,000 to $99,999 | 13 (65.0%) | 7 (35.0%) |
| $100,000 and over | 197 (95.6%) | 9 (4.4%) |
Public vs Private Health Insurance Coverage by Age in Montegut
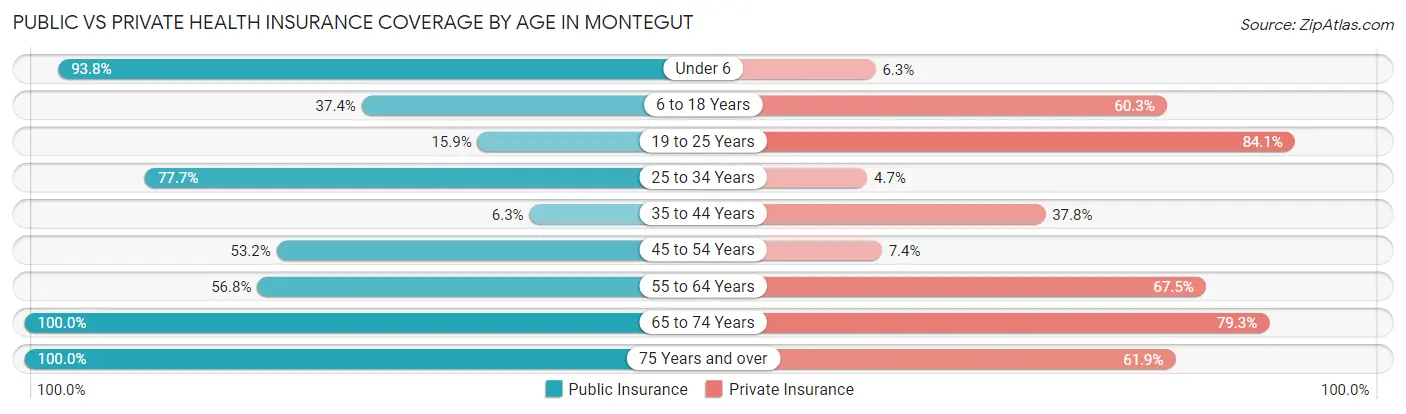
| Age Bracket | Public Insurance | Private Insurance |
| Under 6 | 90 (93.8%) | 6 (6.2%) |
| 6 to 18 Years | 82 (37.4%) | 132 (60.3%) |
| 19 to 25 Years | 11 (15.9%) | 58 (84.1%) |
| 25 to 34 Years | 66 (77.6%) | 4 (4.7%) |
| 35 to 44 Years | 9 (6.3%) | 54 (37.8%) |
| 45 to 54 Years | 115 (53.2%) | 16 (7.4%) |
| 55 to 64 Years | 175 (56.8%) | 208 (67.5%) |
| 65 to 74 Years | 169 (100.0%) | 134 (79.3%) |
| 75 Years and over | 42 (100.0%) | 26 (61.9%) |
| Total | 759 (56.4%) | 638 (47.4%) |
Disability Status by Sex by Age in Montegut
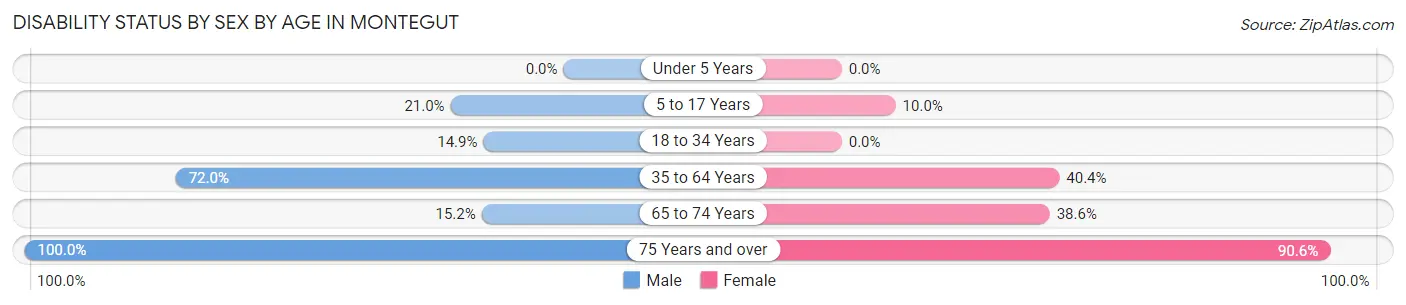
| Age Bracket | Male | Female |
| Under 5 Years | 0 (0.0%) | 0 (0.0%) |
| 5 to 17 Years | 35 (21.0%) | 4 (10.0%) |
| 18 to 34 Years | 11 (14.9%) | 0 (0.0%) |
| 35 to 64 Years | 218 (72.0%) | 147 (40.4%) |
| 65 to 74 Years | 17 (15.2%) | 22 (38.6%) |
| 75 Years and over | 10 (100.0%) | 29 (90.6%) |
Disability Class by Sex by Age in Montegut
Disability Class: Hearing Difficulty
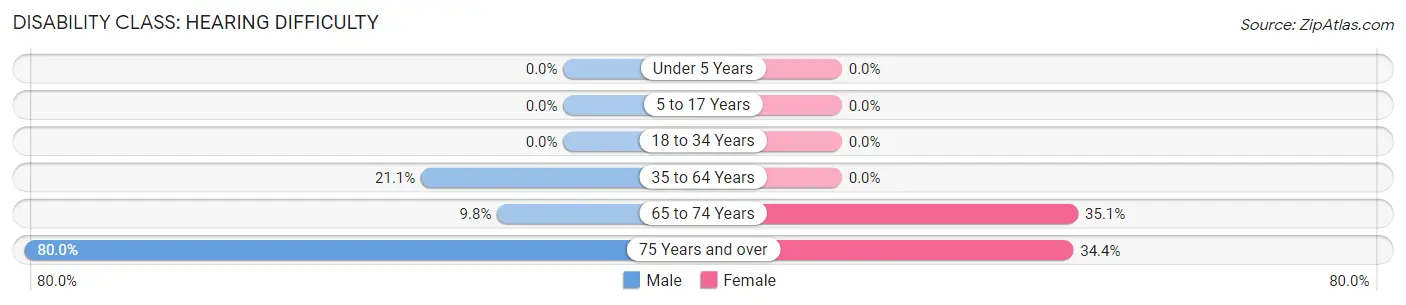
| Age Bracket | Male | Female |
| Under 5 Years | 0 (0.0%) | 0 (0.0%) |
| 5 to 17 Years | 0 (0.0%) | 0 (0.0%) |
| 18 to 34 Years | 0 (0.0%) | 0 (0.0%) |
| 35 to 64 Years | 64 (21.1%) | 0 (0.0%) |
| 65 to 74 Years | 11 (9.8%) | 20 (35.1%) |
| 75 Years and over | 8 (80.0%) | 11 (34.4%) |
Disability Class: Vision Difficulty
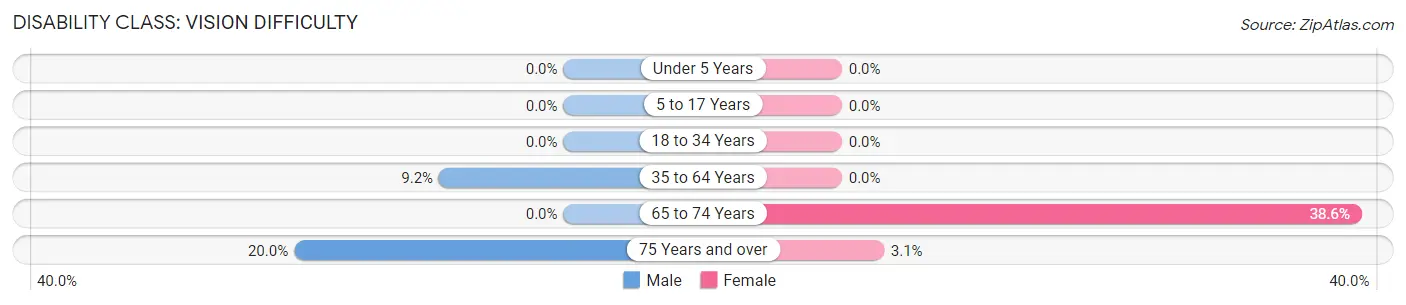
| Age Bracket | Male | Female |
| Under 5 Years | 0 (0.0%) | 0 (0.0%) |
| 5 to 17 Years | 0 (0.0%) | 0 (0.0%) |
| 18 to 34 Years | 0 (0.0%) | 0 (0.0%) |
| 35 to 64 Years | 28 (9.2%) | 0 (0.0%) |
| 65 to 74 Years | 0 (0.0%) | 22 (38.6%) |
| 75 Years and over | 2 (20.0%) | 1 (3.1%) |
Disability Class: Cognitive Difficulty
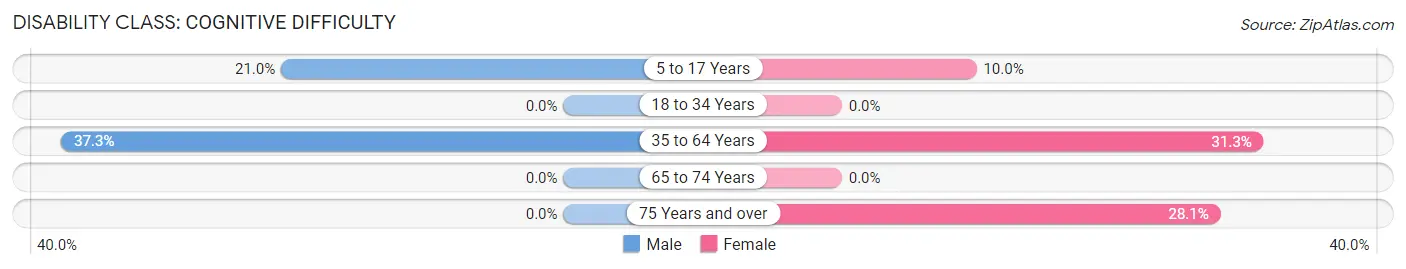
| Age Bracket | Male | Female |
| 5 to 17 Years | 35 (21.0%) | 4 (10.0%) |
| 18 to 34 Years | 0 (0.0%) | 0 (0.0%) |
| 35 to 64 Years | 113 (37.3%) | 114 (31.3%) |
| 65 to 74 Years | 0 (0.0%) | 0 (0.0%) |
| 75 Years and over | 0 (0.0%) | 9 (28.1%) |
Disability Class: Ambulatory Difficulty
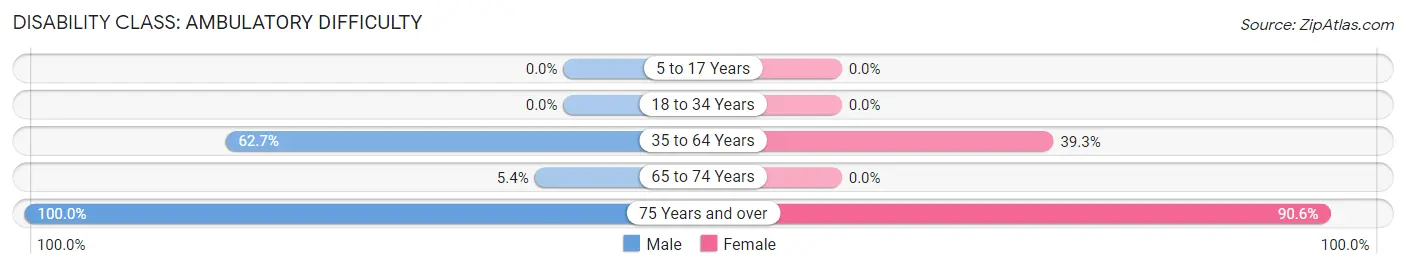
| Age Bracket | Male | Female |
| 5 to 17 Years | 0 (0.0%) | 0 (0.0%) |
| 18 to 34 Years | 0 (0.0%) | 0 (0.0%) |
| 35 to 64 Years | 190 (62.7%) | 143 (39.3%) |
| 65 to 74 Years | 6 (5.4%) | 0 (0.0%) |
| 75 Years and over | 10 (100.0%) | 29 (90.6%) |
Disability Class: Self-Care Difficulty
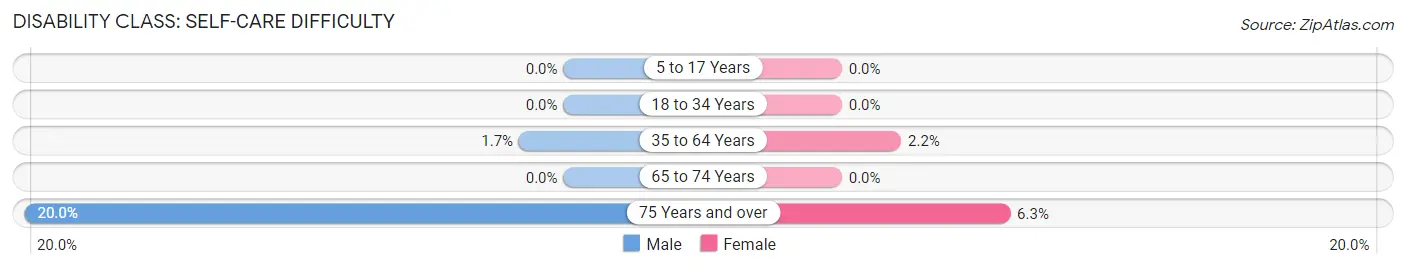
| Age Bracket | Male | Female |
| 5 to 17 Years | 0 (0.0%) | 0 (0.0%) |
| 18 to 34 Years | 0 (0.0%) | 0 (0.0%) |
| 35 to 64 Years | 5 (1.7%) | 8 (2.2%) |
| 65 to 74 Years | 0 (0.0%) | 0 (0.0%) |
| 75 Years and over | 2 (20.0%) | 2 (6.2%) |
Technology Access in Montegut
Computing Device Access in Montegut
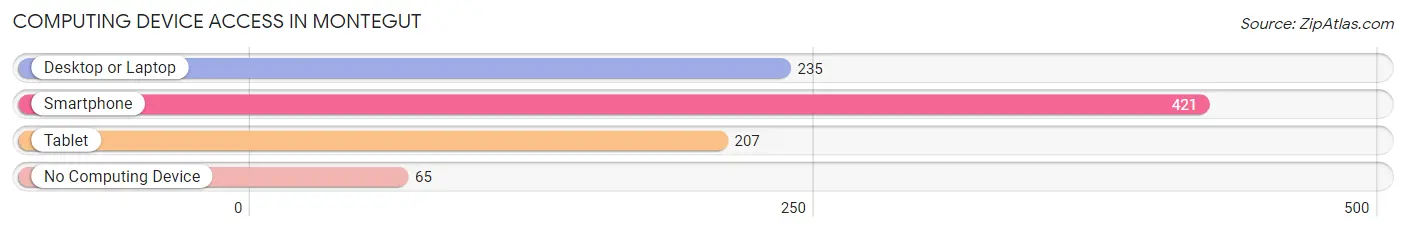
| Device Type | # Households | % Households |
| Desktop or Laptop | 235 | 47.3% |
| Smartphone | 421 | 84.7% |
| Tablet | 207 | 41.6% |
| No Computing Device | 65 | 13.1% |
| Total | 497 | 100.0% |
Internet Access in Montegut
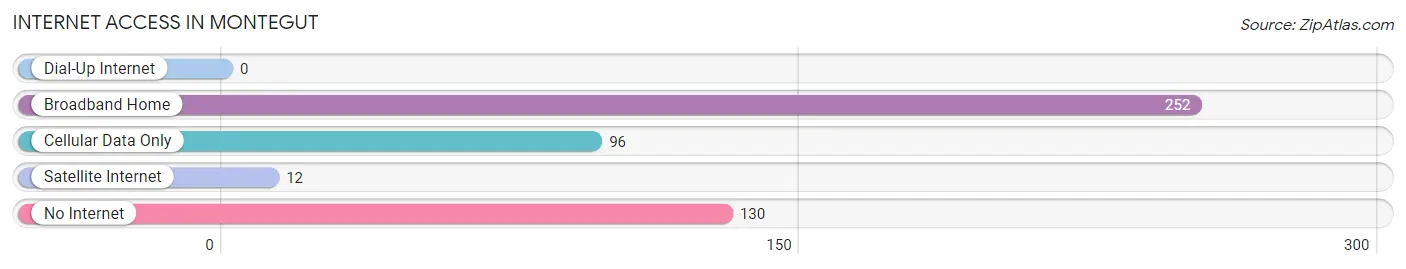
| Internet Type | # Households | % Households |
| Dial-Up Internet | 0 | 0.0% |
| Broadband Home | 252 | 50.7% |
| Cellular Data Only | 96 | 19.3% |
| Satellite Internet | 12 | 2.4% |
| No Internet | 130 | 26.2% |
| Total | 497 | 100.0% |
Montegut Summary
Montegut is a small unincorporated community located in Terrebonne Parish, Louisiana. It is situated along the Gulf of Mexico, approximately 25 miles south of Houma. The population of Montegut was 2,945 at the 2010 census.
History
Montegut was founded in the late 19th century by French settlers. The name Montegut is derived from the French phrase “mont gout” which means “mountain of taste”. The area was originally used for farming and fishing, and the first settlers built a small church in the area.
In the early 20th century, Montegut began to grow as a commercial center. The first store was opened in 1910, and the first post office was established in 1911. The town was incorporated in 1912, and the first mayor was elected in 1913.
In the 1950s, Montegut began to experience a population boom as oil and gas exploration increased in the area. The population grew from 1,000 in 1950 to over 3,000 by the end of the decade.
Geography
Montegut is located in Terrebonne Parish, Louisiana, approximately 25 miles south of Houma. The town is situated along the Gulf of Mexico, and is bordered by the towns of Chauvin, Dulac, and Pointe-aux-Chenes.
The terrain of Montegut is mostly flat, with some low hills in the area. The town is located in a coastal marshland, and is surrounded by numerous bayous and canals.
Economy
The economy of Montegut is largely based on the oil and gas industry. The town is home to several oil and gas companies, as well as several related businesses.
In addition to the oil and gas industry, Montegut is also home to several seafood processing plants. The town is also home to several retail stores, restaurants, and other businesses.
Demographics
As of the 2010 census, the population of Montegut was 2,945. The racial makeup of the town was 79.3% White, 17.2% African American, 0.7% Native American, 0.3% Asian, 0.1% Pacific Islander, and 2.4% from other races.
The median household income in Montegut was $37,917, and the median family income was $45,938. The per capita income was $18,945. About 17.2% of the population was below the poverty line.
Montegut is served by the Terrebonne Parish School District. The town is home to several public schools, including Montegut Elementary School, Montegut Middle School, and Montegut High School.
Common Questions
What is Per Capita Income in Montegut?
Per Capita income in Montegut is $18,176.
What is the Median Family Income in Montegut?
Median Family Income in Montegut is $45,000.
What is the Median Household income in Montegut?
Median Household Income in Montegut is $32,989.
What is Income or Wage Gap in Montegut?
Income or Wage Gap in Montegut is 62.3%.
Women in Montegut earn 37.7 cents for every dollar earned by a man.
What is Inequality or Gini Index in Montegut?
Inequality or Gini Index in Montegut is 0.41.
What is the Total Population of Montegut?
Total Population of Montegut is 1,347.
What is the Total Male Population of Montegut?
Total Male Population of Montegut is 731.
What is the Total Female Population of Montegut?
Total Female Population of Montegut is 616.
What is the Ratio of Males per 100 Females in Montegut?
There are 118.67 Males per 100 Females in Montegut.
What is the Ratio of Females per 100 Males in Montegut?
There are 84.27 Females per 100 Males in Montegut.
What is the Median Population Age in Montegut?
Median Population Age in Montegut is 51.1 Years.
What is the Average Family Size in Montegut
Average Family Size in Montegut is 3.3 People.
What is the Average Household Size in Montegut
Average Household Size in Montegut is 2.7 People.
How Large is the Labor Force in Montegut?
There are 347 People in the Labor Forcein in Montegut.
What is the Percentage of People in the Labor Force in Montegut?
30.1% of People are in the Labor Force in Montegut.
What is the Unemployment Rate in Montegut?
Unemployment Rate in Montegut is 0.9%.