Zip Codes with the Highest Percentage of Population Employed in Transportation in Monroe, LA
RELATED REPORTS & OPTIONS
Transportation
Monroe
Compare Zip Codes
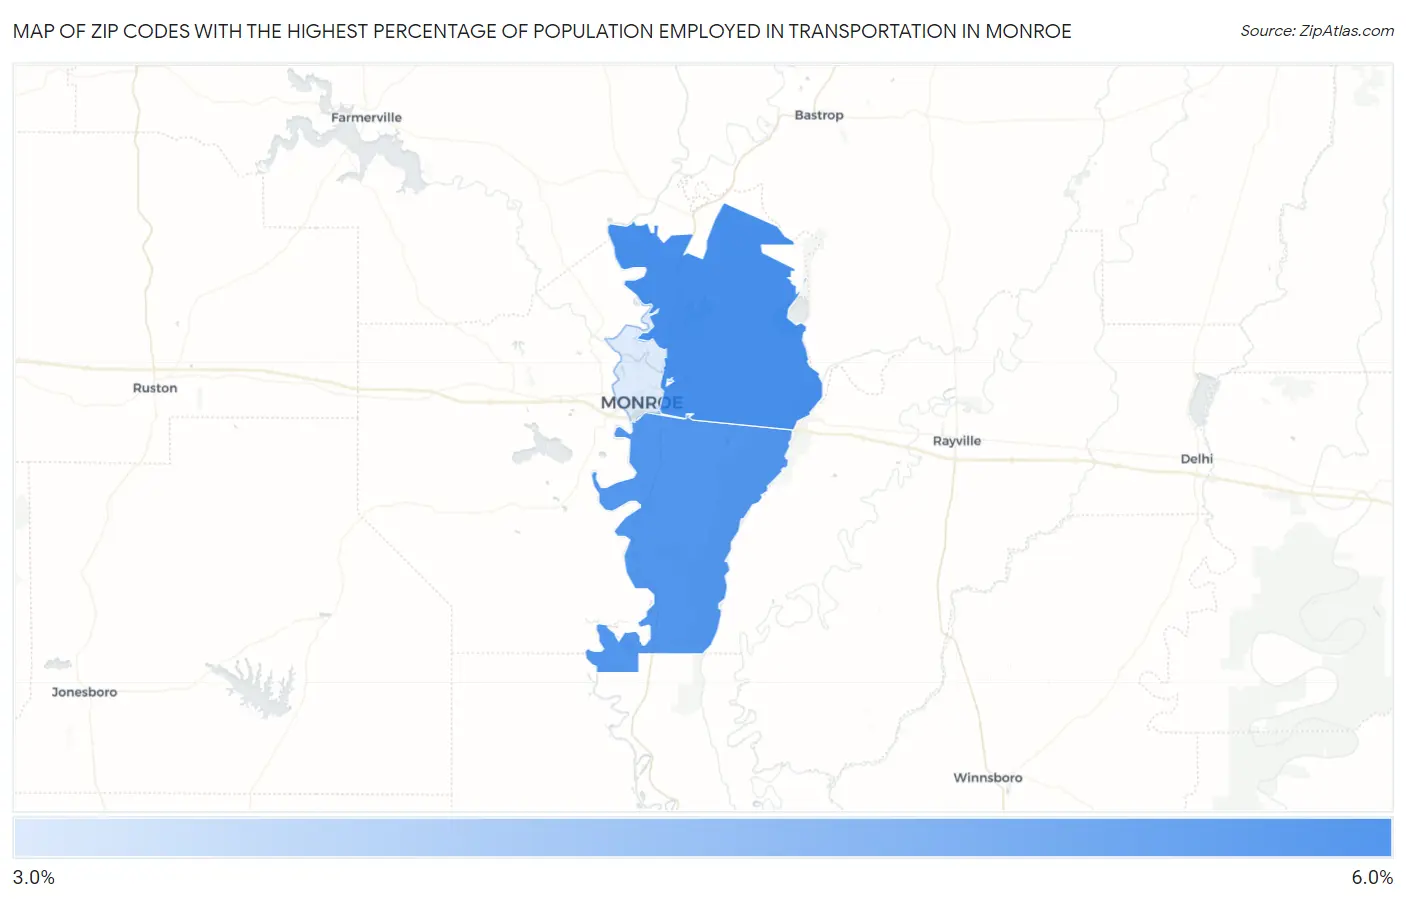
Map of Zip Codes with the Highest Percentage of Population Employed in Transportation in Monroe
0.0%
6.0%
Zip Codes with the Highest Percentage of Population Employed in Transportation in Monroe, LA
| Zip Code | % Employed | vs State | vs National | |
| 1. | 71203 | 5.6% | 4.3%(+1.27)#163 | 3.8%(+1.75)#8,544 |
| 2. | 71202 | 5.4% | 4.3%(+1.13)#168 | 3.8%(+1.61)#8,970 |
| 3. | 71201 | 3.7% | 4.3%(-0.616)#267 | 3.8%(-0.140)#15,944 |
1
Common Questions
What are the Top 3 Zip Codes with the Highest Percentage of Population Employed in Transportation in Monroe, LA?
Top 3 Zip Codes with the Highest Percentage of Population Employed in Transportation in Monroe, LA are:
What zip code has the Highest Percentage of Population Employed in Transportation in Monroe, LA?
71203 has the Highest Percentage of Population Employed in Transportation in Monroe, LA with 5.6%.
What is the Percentage of Population Employed in Transportation in Monroe, LA?
Percentage of Population Employed in Transportation in Monroe is 3.6%.
What is the Percentage of Population Employed in Transportation in Louisiana?
Percentage of Population Employed in Transportation in Louisiana is 4.3%.
What is the Percentage of Population Employed in Transportation in the United States?
Percentage of Population Employed in Transportation in the United States is 3.8%.