Mamou, LA Map & Demographics
Mamou Map
Mamou Overview
$13,825
PER CAPITA INCOME
$25,558
AVG FAMILY INCOME
$23,310
AVG HOUSEHOLD INCOME
16.7%
WAGE / INCOME GAP [ % ]
83.3¢/ $1
WAGE / INCOME GAP [ $ ]
0.44
INEQUALITY / GINI INDEX
2,918
TOTAL POPULATION
1,442
MALE POPULATION
1,476
FEMALE POPULATION
97.70
MALES / 100 FEMALES
102.36
FEMALES / 100 MALES
34.0
MEDIAN AGE
3.4
AVG FAMILY SIZE
2.5
AVG HOUSEHOLD SIZE
1,130
LABOR FORCE [ PEOPLE ]
54.7%
PERCENT IN LABOR FORCE
16.2%
UNEMPLOYMENT RATE
Mamou Zip Codes
Mamou Area Codes
Income in Mamou
Income Overview in Mamou
Per Capita Income in Mamou is $13,825, while median incomes of families and households are $25,558 and $23,310 respectively.
| Characteristic | Number | Measure |
| Per Capita Income | 2,918 | $13,825 |
| Median Family Income | 680 | $25,558 |
| Mean Family Income | 680 | $31,170 |
| Median Household Income | 1,145 | $23,310 |
| Mean Household Income | 1,145 | $33,534 |
| Income Deficit | 680 | $0 |
| Wage / Income Gap (%) | 2,918 | 16.65% |
| Wage / Income Gap ($) | 2,918 | 83.35¢ per $1 |
| Gini / Inequality Index | 2,918 | 0.44 |
Earnings by Sex in Mamou
Average Earnings in Mamou are $17,808, $15,918 for men and $19,098 for women, a difference of 16.7%.
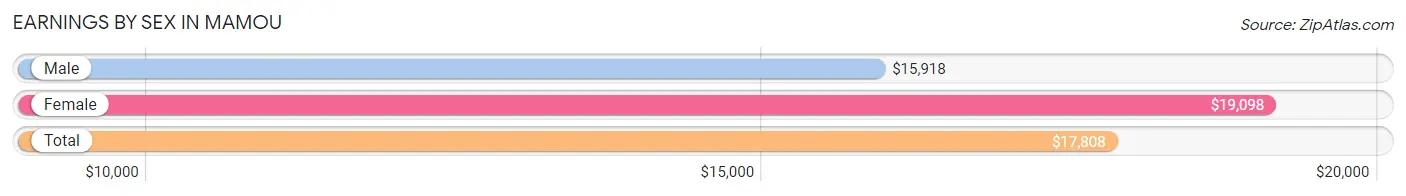
| Sex | Number | Average Earnings |
| Male | 480 (42.5%) | $15,918 |
| Female | 648 (57.5%) | $19,098 |
| Total | 1,128 (100.0%) | $17,808 |
Earnings by Sex by Income Bracket in Mamou
The most common earnings brackets in Mamou are $2,499 or less for men (180 | 37.5%) and $17,500 to $19,999 for women (183 | 28.2%).
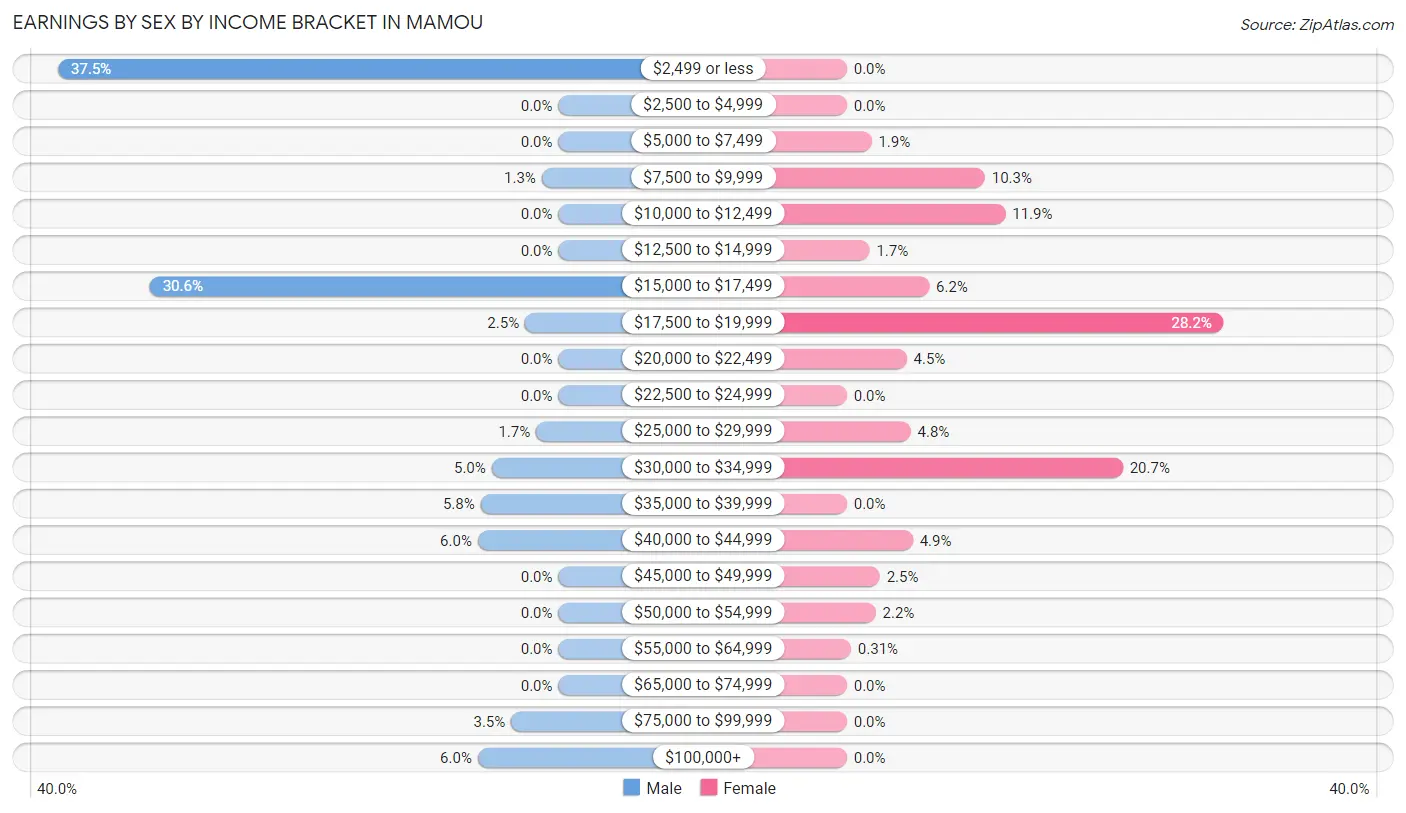
| Income | Male | Female |
| $2,499 or less | 180 (37.5%) | 0 (0.0%) |
| $2,500 to $4,999 | 0 (0.0%) | 0 (0.0%) |
| $5,000 to $7,499 | 0 (0.0%) | 12 (1.8%) |
| $7,500 to $9,999 | 6 (1.3%) | 67 (10.3%) |
| $10,000 to $12,499 | 0 (0.0%) | 77 (11.9%) |
| $12,500 to $14,999 | 0 (0.0%) | 11 (1.7%) |
| $15,000 to $17,499 | 147 (30.6%) | 40 (6.2%) |
| $17,500 to $19,999 | 12 (2.5%) | 183 (28.2%) |
| $20,000 to $22,499 | 0 (0.0%) | 29 (4.5%) |
| $22,500 to $24,999 | 0 (0.0%) | 0 (0.0%) |
| $25,000 to $29,999 | 8 (1.7%) | 31 (4.8%) |
| $30,000 to $34,999 | 24 (5.0%) | 134 (20.7%) |
| $35,000 to $39,999 | 28 (5.8%) | 0 (0.0%) |
| $40,000 to $44,999 | 29 (6.0%) | 32 (4.9%) |
| $45,000 to $49,999 | 0 (0.0%) | 16 (2.5%) |
| $50,000 to $54,999 | 0 (0.0%) | 14 (2.2%) |
| $55,000 to $64,999 | 0 (0.0%) | 2 (0.3%) |
| $65,000 to $74,999 | 0 (0.0%) | 0 (0.0%) |
| $75,000 to $99,999 | 17 (3.5%) | 0 (0.0%) |
| $100,000+ | 29 (6.0%) | 0 (0.0%) |
| Total | 480 (100.0%) | 648 (100.0%) |
Earnings by Sex by Educational Attainment in Mamou
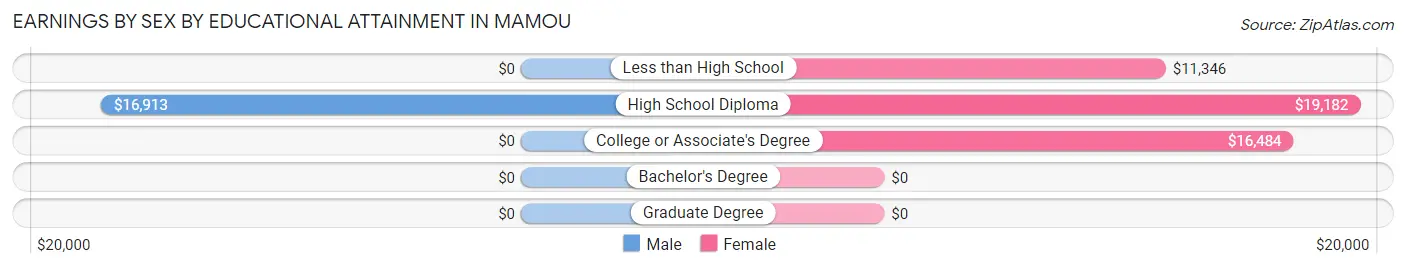
| Educational Attainment | Male Income | Female Income |
| Less than High School | - | - |
| High School Diploma | $16,913 | $19,182 |
| College or Associate's Degree | - | - |
| Bachelor's Degree | - | - |
| Graduate Degree | - | - |
| Total | - | - |
Family Income in Mamou
Family Income Brackets in Mamou
According to the Mamou family income data, there are 262 families falling into the $25,000 to $34,999 income range, which is the most common income bracket and makes up 38.5% of all families.
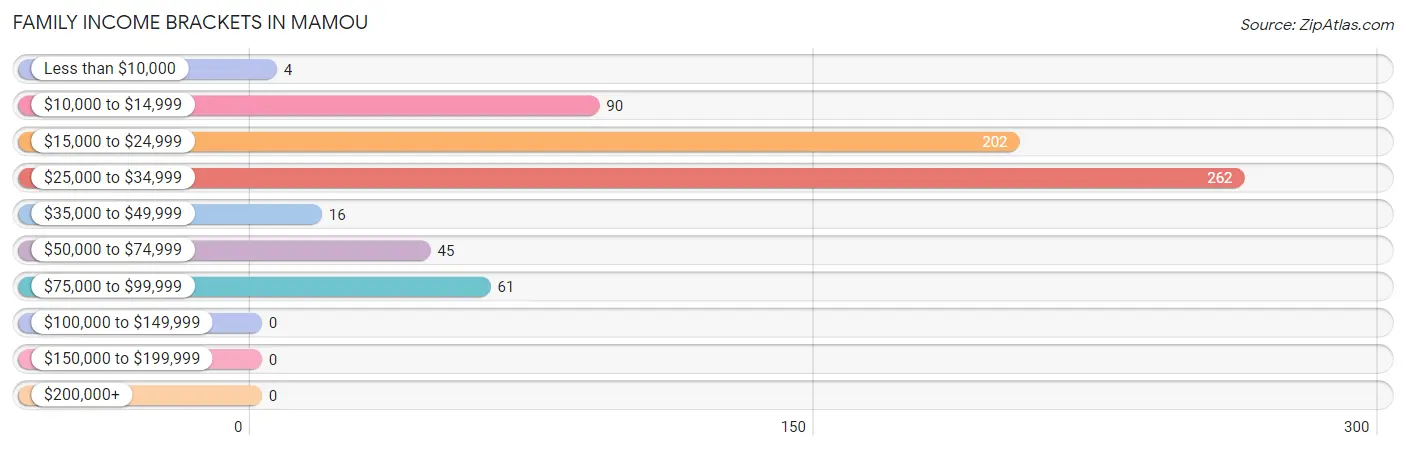
| Income Bracket | # Families | % Families |
| Less than $10,000 | 4 | 0.6% |
| $10,000 to $14,999 | 90 | 13.2% |
| $15,000 to $24,999 | 202 | 29.7% |
| $25,000 to $34,999 | 262 | 38.5% |
| $35,000 to $49,999 | 16 | 2.4% |
| $50,000 to $74,999 | 45 | 6.6% |
| $75,000 to $99,999 | 61 | 9.0% |
| $100,000 to $149,999 | 0 | 0.0% |
| $150,000 to $199,999 | 0 | 0.0% |
| $200,000+ | 0 | 0.0% |
Family Income by Famaliy Size in Mamou
4-person families (210 | 30.9%) account for the highest median family income in Mamou with $26,686 per family, while 2-person families (386 | 56.8%) have the highest median income of $9,461 per family member.
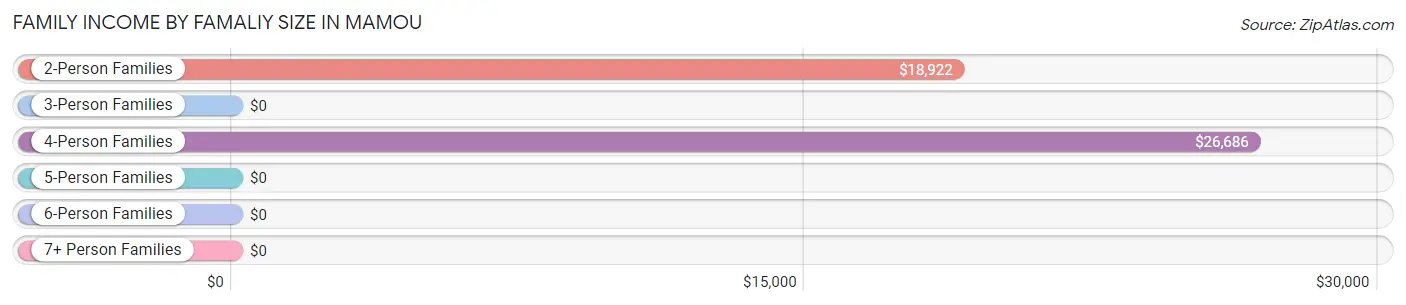
| Income Bracket | # Families | Median Income |
| 2-Person Families | 386 (56.8%) | $18,922 |
| 3-Person Families | 45 (6.6%) | $0 |
| 4-Person Families | 210 (30.9%) | $26,686 |
| 5-Person Families | 16 (2.4%) | $0 |
| 6-Person Families | 0 (0.0%) | $0 |
| 7+ Person Families | 23 (3.4%) | $0 |
| Total | 680 (100.0%) | $25,558 |
Family Income by Number of Earners in Mamou
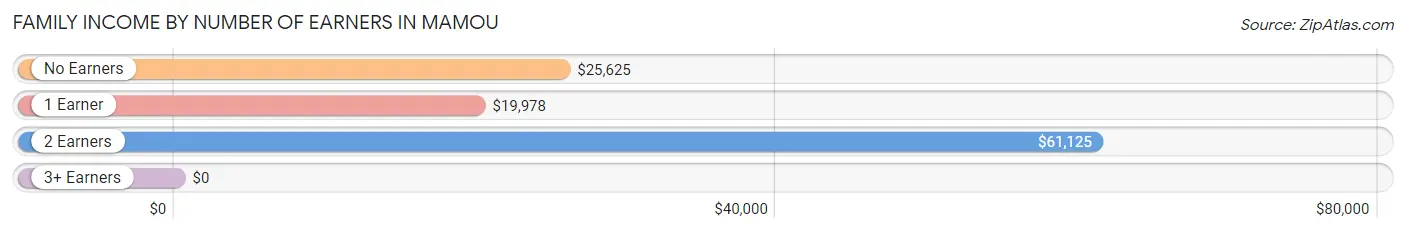
| Number of Earners | # Families | Median Income |
| No Earners | 95 (14.0%) | $25,625 |
| 1 Earner | 459 (67.5%) | $19,978 |
| 2 Earners | 97 (14.3%) | $61,125 |
| 3+ Earners | 29 (4.3%) | $0 |
| Total | 680 (100.0%) | $25,558 |
Household Income in Mamou
Household Income Brackets in Mamou
With 335 households falling in the category, the $15,000 to $24,999 income range is the most frequent in Mamou, accounting for 29.3% of all households.
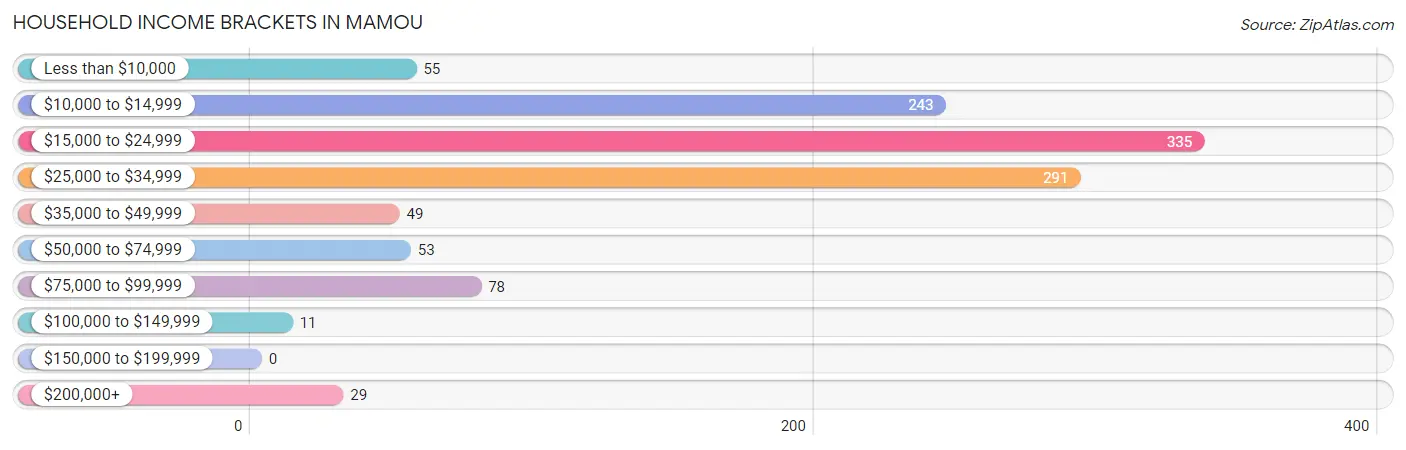
| Income Bracket | # Households | % Households |
| Less than $10,000 | 55 | 4.8% |
| $10,000 to $14,999 | 243 | 21.2% |
| $15,000 to $24,999 | 335 | 29.3% |
| $25,000 to $34,999 | 291 | 25.4% |
| $35,000 to $49,999 | 49 | 4.3% |
| $50,000 to $74,999 | 53 | 4.6% |
| $75,000 to $99,999 | 78 | 6.8% |
| $100,000 to $149,999 | 11 | 1.0% |
| $150,000 to $199,999 | 0 | 0.0% |
| $200,000+ | 29 | 2.5% |
Household Income by Householder Age in Mamou
The median household income in Mamou is $23,310, with the highest median household income of $25,502 found in the 25 to 44 years age bracket for the primary householder. A total of 459 households (40.1%) fall into this category. Meanwhile, the 15 to 24 years age bracket for the primary householder has the lowest median household income of $0, with 14 households (1.2%) in this group.
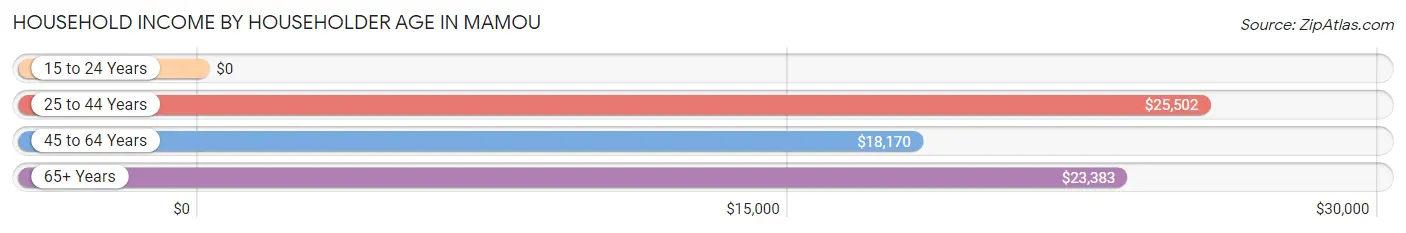
| Income Bracket | # Households | Median Income |
| 15 to 24 Years | 14 (1.2%) | $0 |
| 25 to 44 Years | 459 (40.1%) | $25,502 |
| 45 to 64 Years | 379 (33.1%) | $18,170 |
| 65+ Years | 293 (25.6%) | $23,383 |
| Total | 1,145 (100.0%) | $23,310 |
Poverty in Mamou
Income Below Poverty by Sex and Age in Mamou
With 62.4% poverty level for males and 56.4% for females among the residents of Mamou, 12 to 14 year old males and 6 to 11 year old females are the most vulnerable to poverty, with 5 males (100.0%) and 99 females (100.0%) in their respective age groups living below the poverty level.
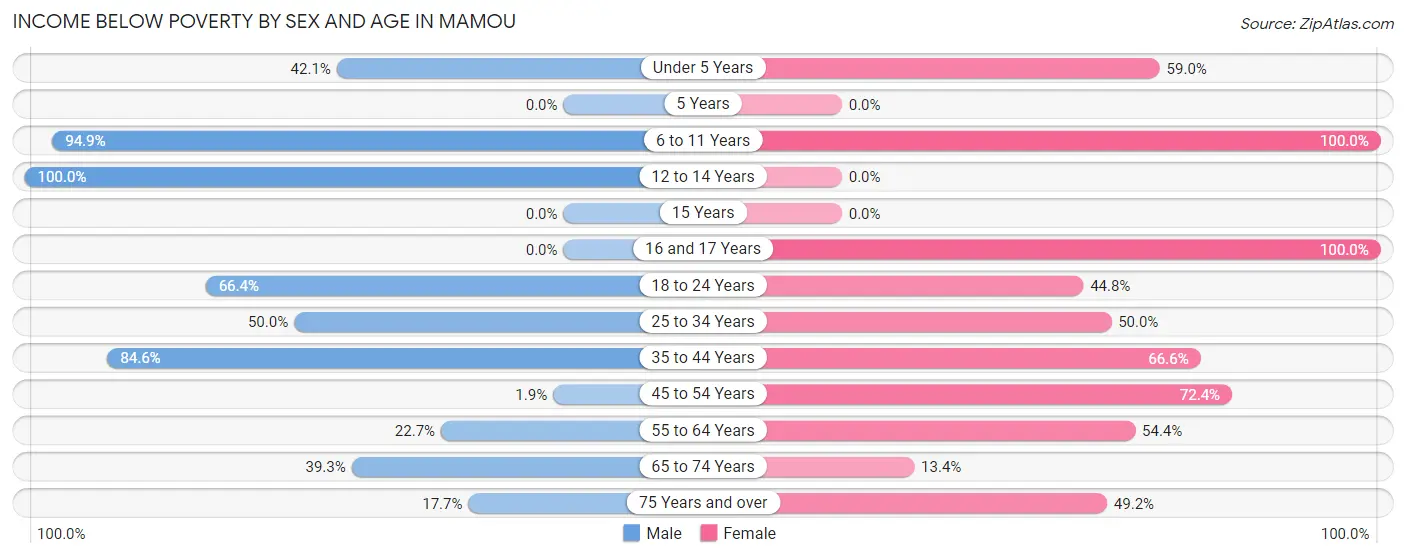
| Age Bracket | Male | Female |
| Under 5 Years | 93 (42.1%) | 59 (59.0%) |
| 5 Years | 0 (0.0%) | 0 (0.0%) |
| 6 to 11 Years | 368 (94.9%) | 99 (100.0%) |
| 12 to 14 Years | 5 (100.0%) | 0 (0.0%) |
| 15 Years | 0 (0.0%) | 0 (0.0%) |
| 16 and 17 Years | 0 (0.0%) | 36 (100.0%) |
| 18 to 24 Years | 156 (66.4%) | 95 (44.8%) |
| 25 to 34 Years | 46 (50.0%) | 16 (50.0%) |
| 35 to 44 Years | 132 (84.6%) | 233 (66.6%) |
| 45 to 54 Years | 1 (1.9%) | 84 (72.4%) |
| 55 to 64 Years | 25 (22.7%) | 135 (54.4%) |
| 65 to 74 Years | 57 (39.3%) | 18 (13.4%) |
| 75 Years and over | 3 (17.6%) | 31 (49.2%) |
| Total | 886 (62.4%) | 806 (56.4%) |
Income Above Poverty by Sex and Age in Mamou
According to the poverty statistics in Mamou, males aged 45 to 54 years and females aged 12 to 14 years are the age groups that are most secure financially, with 98.1% of males and 100.0% of females in these age groups living above the poverty line.
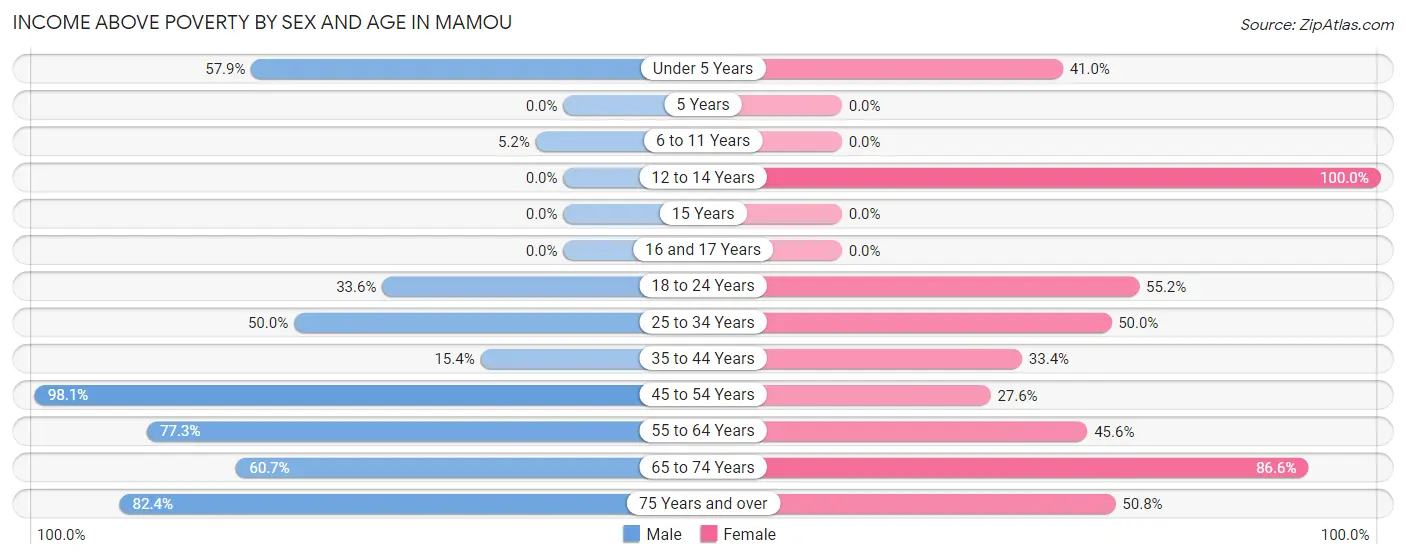
| Age Bracket | Male | Female |
| Under 5 Years | 128 (57.9%) | 41 (41.0%) |
| 5 Years | 0 (0.0%) | 0 (0.0%) |
| 6 to 11 Years | 20 (5.1%) | 0 (0.0%) |
| 12 to 14 Years | 0 (0.0%) | 40 (100.0%) |
| 15 Years | 0 (0.0%) | 0 (0.0%) |
| 16 and 17 Years | 0 (0.0%) | 0 (0.0%) |
| 18 to 24 Years | 79 (33.6%) | 117 (55.2%) |
| 25 to 34 Years | 46 (50.0%) | 16 (50.0%) |
| 35 to 44 Years | 24 (15.4%) | 117 (33.4%) |
| 45 to 54 Years | 51 (98.1%) | 32 (27.6%) |
| 55 to 64 Years | 85 (77.3%) | 113 (45.6%) |
| 65 to 74 Years | 88 (60.7%) | 116 (86.6%) |
| 75 Years and over | 14 (82.4%) | 32 (50.8%) |
| Total | 535 (37.7%) | 624 (43.6%) |
Income Below Poverty Among Married-Couple Families in Mamou
The poverty statistics for married-couple families in Mamou show that 46.0% or 155 of the total 337 families live below the poverty line. Families with 3 or 4 children have the highest poverty rate of 100.0%, comprising of 23 families. On the other hand, families with no children have the lowest poverty rate of 0.0%, which includes 0 families.
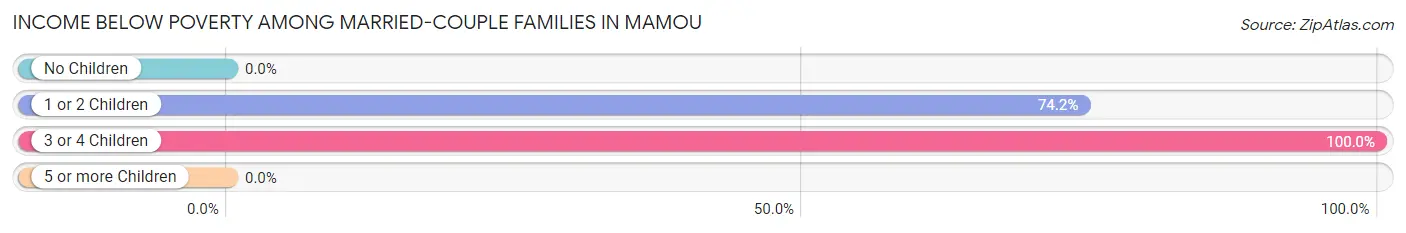
| Children | Above Poverty | Below Poverty |
| No Children | 136 (100.0%) | 0 (0.0%) |
| 1 or 2 Children | 46 (25.8%) | 132 (74.2%) |
| 3 or 4 Children | 0 (0.0%) | 23 (100.0%) |
| 5 or more Children | 0 (0.0%) | 0 (0.0%) |
| Total | 182 (54.0%) | 155 (46.0%) |
Income Below Poverty Among Single-Parent Households in Mamou
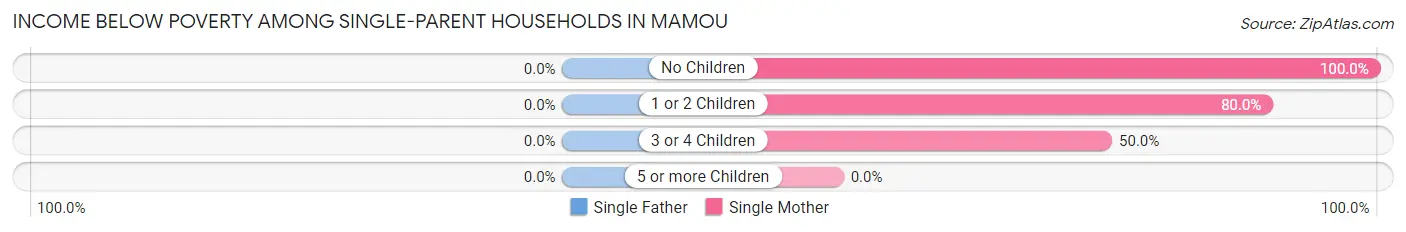
| Children | Single Father | Single Mother |
| No Children | 0 (0.0%) | 66 (100.0%) |
| 1 or 2 Children | 0 (0.0%) | 196 (80.0%) |
| 3 or 4 Children | 0 (0.0%) | 16 (50.0%) |
| 5 or more Children | 0 (0.0%) | 0 (0.0%) |
| Total | 0 (0.0%) | 278 (81.0%) |
Income Below Poverty Among Married-Couple vs Single-Parent Households in Mamou
The poverty data for Mamou shows that 155 of the married-couple family households (46.0%) and 278 of the single-parent households (81.0%) are living below the poverty level. Within the married-couple family households, those with 3 or 4 children have the highest poverty rate, with 23 households (100.0%) falling below the poverty line. Among the single-parent households, those with no children have the highest poverty rate, with 66 household (100.0%) living below poverty.
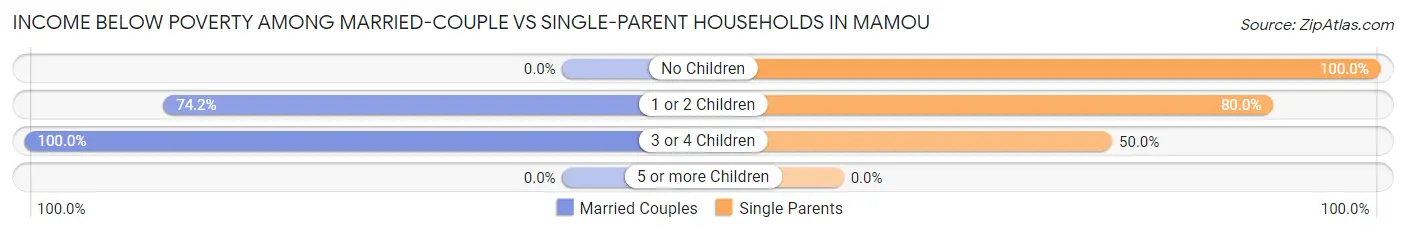
| Children | Married-Couple Families | Single-Parent Households |
| No Children | 0 (0.0%) | 66 (100.0%) |
| 1 or 2 Children | 132 (74.2%) | 196 (80.0%) |
| 3 or 4 Children | 23 (100.0%) | 16 (50.0%) |
| 5 or more Children | 0 (0.0%) | 0 (0.0%) |
| Total | 155 (46.0%) | 278 (81.0%) |
Race in Mamou
The most populous races in Mamou are Black / African American (1,520 | 52.1%), White / Caucasian (825 | 28.3%), and Some other Race (365 | 12.5%).
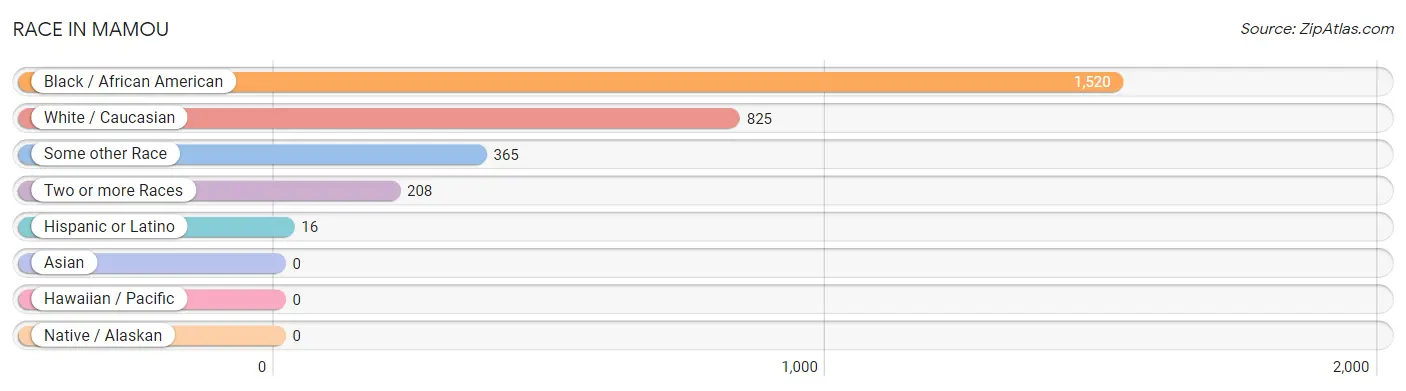
| Race | # Population | % Population |
| Asian | 0 | 0.0% |
| Black / African American | 1,520 | 52.1% |
| Hawaiian / Pacific | 0 | 0.0% |
| Hispanic or Latino | 16 | 0.5% |
| Native / Alaskan | 0 | 0.0% |
| White / Caucasian | 825 | 28.3% |
| Two or more Races | 208 | 7.1% |
| Some other Race | 365 | 12.5% |
| Total | 2,918 | 100.0% |
Ancestry in Mamou
The most populous ancestries reported in Mamou are French (287 | 9.8%), Canadian (88 | 3.0%), Romanian (72 | 2.5%), Japanese (56 | 1.9%), and French Canadian (49 | 1.7%), together accounting for 18.9% of all Mamou residents.
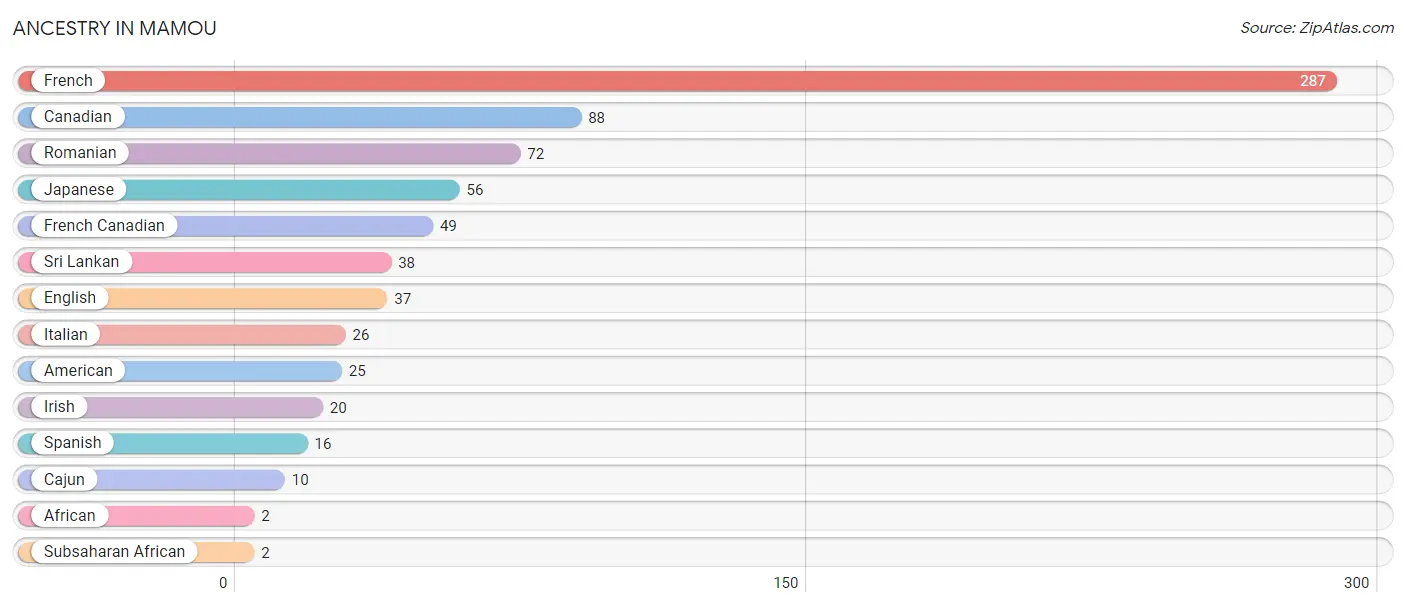
| Ancestry | # Population | % Population |
| African | 2 | 0.1% |
| American | 25 | 0.9% |
| Cajun | 10 | 0.3% |
| Canadian | 88 | 3.0% |
| English | 37 | 1.3% |
| French | 287 | 9.8% |
| French Canadian | 49 | 1.7% |
| Irish | 20 | 0.7% |
| Italian | 26 | 0.9% |
| Japanese | 56 | 1.9% |
| Romanian | 72 | 2.5% |
| Spanish | 16 | 0.5% |
| Sri Lankan | 38 | 1.3% |
| Subsaharan African | 2 | 0.1% | View All 14 Rows |
Immigrants in Mamou

| Immigration Origin | # Population | % Population | View All 0 Rows |
Sex and Age in Mamou
Sex and Age in Mamou
The most populous age groups in Mamou are 5 to 9 Years (388 | 26.9%) for men and 40 to 44 Years (294 | 19.9%) for women.
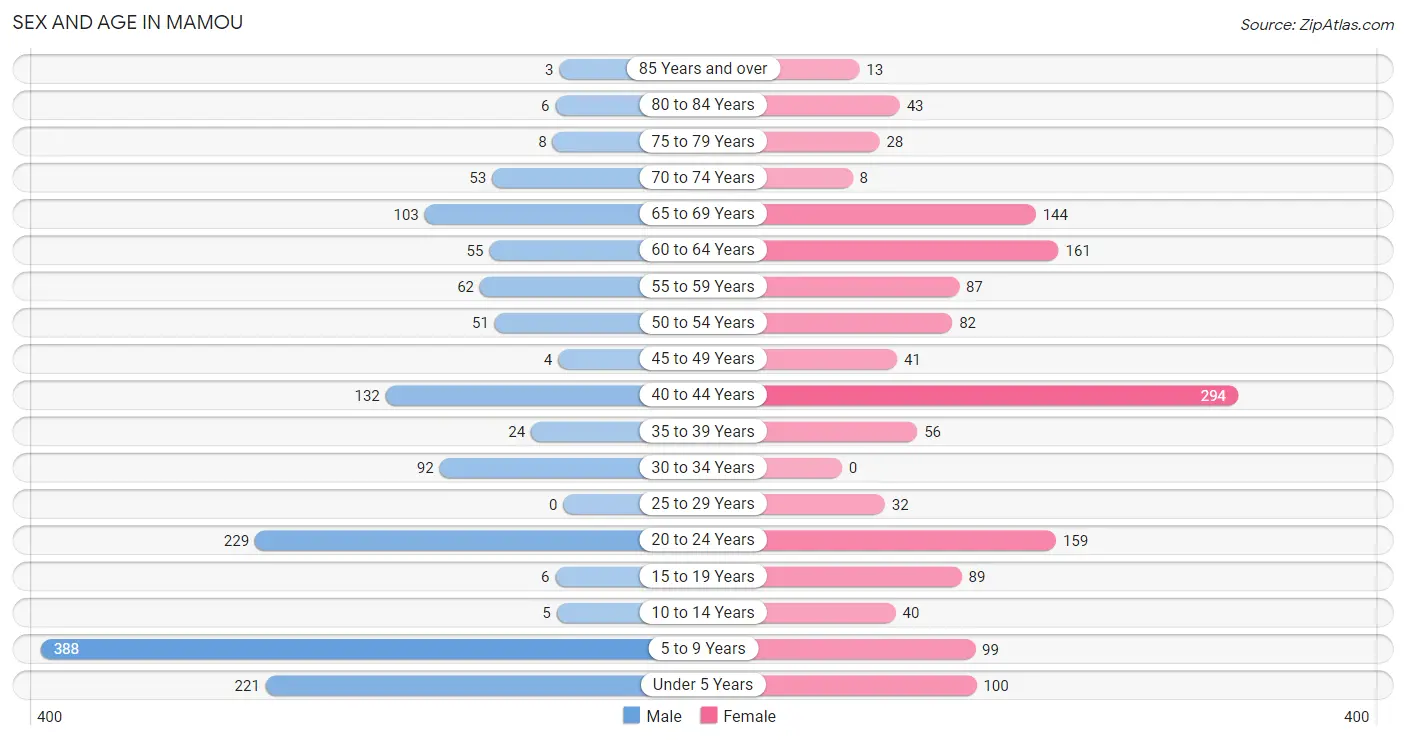
| Age Bracket | Male | Female |
| Under 5 Years | 221 (15.3%) | 100 (6.8%) |
| 5 to 9 Years | 388 (26.9%) | 99 (6.7%) |
| 10 to 14 Years | 5 (0.4%) | 40 (2.7%) |
| 15 to 19 Years | 6 (0.4%) | 89 (6.0%) |
| 20 to 24 Years | 229 (15.9%) | 159 (10.8%) |
| 25 to 29 Years | 0 (0.0%) | 32 (2.2%) |
| 30 to 34 Years | 92 (6.4%) | 0 (0.0%) |
| 35 to 39 Years | 24 (1.7%) | 56 (3.8%) |
| 40 to 44 Years | 132 (9.1%) | 294 (19.9%) |
| 45 to 49 Years | 4 (0.3%) | 41 (2.8%) |
| 50 to 54 Years | 51 (3.5%) | 82 (5.6%) |
| 55 to 59 Years | 62 (4.3%) | 87 (5.9%) |
| 60 to 64 Years | 55 (3.8%) | 161 (10.9%) |
| 65 to 69 Years | 103 (7.1%) | 144 (9.8%) |
| 70 to 74 Years | 53 (3.7%) | 8 (0.5%) |
| 75 to 79 Years | 8 (0.5%) | 28 (1.9%) |
| 80 to 84 Years | 6 (0.4%) | 43 (2.9%) |
| 85 Years and over | 3 (0.2%) | 13 (0.9%) |
| Total | 1,442 (100.0%) | 1,476 (100.0%) |
Families and Households in Mamou
Median Family Size in Mamou
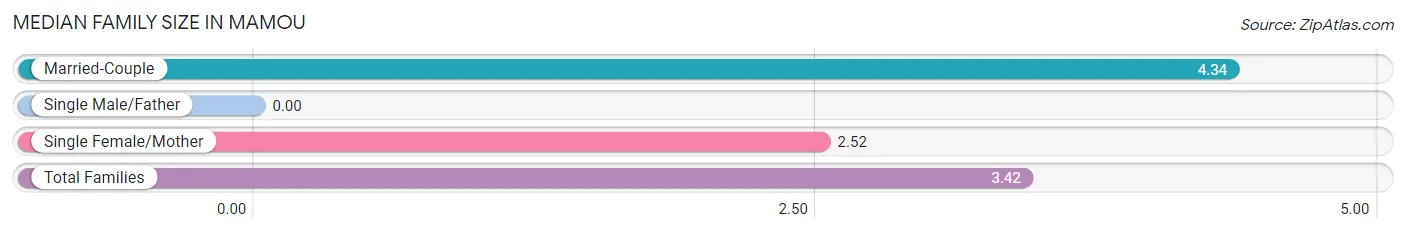
| Family Type | # Families | Family Size |
| Married-Couple | 337 (49.6%) | 4.34 |
| Single Male/Father | 0 (0.0%) | - |
| Single Female/Mother | 343 (50.4%) | 2.52 |
| Total Families | 680 (100.0%) | 3.42 |
Median Household Size in Mamou
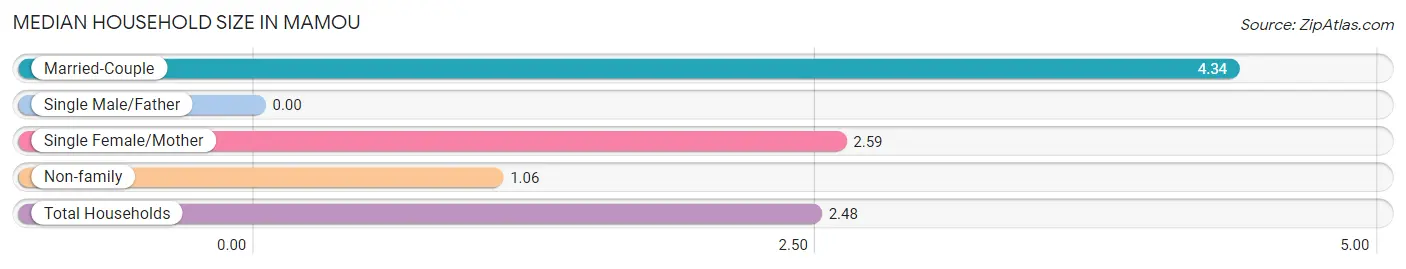
| Household Type | # Households | Household Size |
| Married-Couple | 337 (29.4%) | 4.34 |
| Single Male/Father | 0 (0.0%) | - |
| Single Female/Mother | 343 (30.0%) | 2.59 |
| Non-family | 465 (40.6%) | 1.06 |
| Total Households | 1,145 (100.0%) | 2.48 |
Household Size by Marriage Status in Mamou
Out of a total of 1,145 households in Mamou, 680 (59.4%) are family households, while 465 (40.6%) are nonfamily households. The most numerous type of family households are 2-person households, comprising 373, and the most common type of nonfamily households are 1-person households, comprising 440.
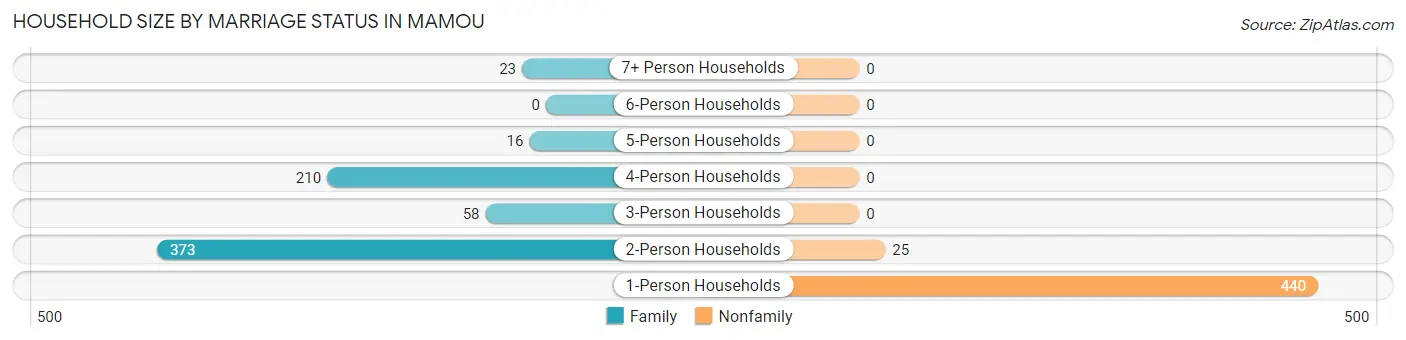
| Household Size | Family Households | Nonfamily Households |
| 1-Person Households | - | 440 (38.4%) |
| 2-Person Households | 373 (32.6%) | 25 (2.2%) |
| 3-Person Households | 58 (5.1%) | 0 (0.0%) |
| 4-Person Households | 210 (18.3%) | 0 (0.0%) |
| 5-Person Households | 16 (1.4%) | 0 (0.0%) |
| 6-Person Households | 0 (0.0%) | 0 (0.0%) |
| 7+ Person Households | 23 (2.0%) | 0 (0.0%) |
| Total | 680 (59.4%) | 465 (40.6%) |
Female Fertility in Mamou
Fertility by Age in Mamou
Average fertility rate in Mamou is 24.0 births per 1,000 women. Women in the age bracket of 20 to 34 years have the highest fertility rate with 84.0 births per 1,000 women. Women in the age bracket of 20 to 34 years acount for 100.0% of all women with births.
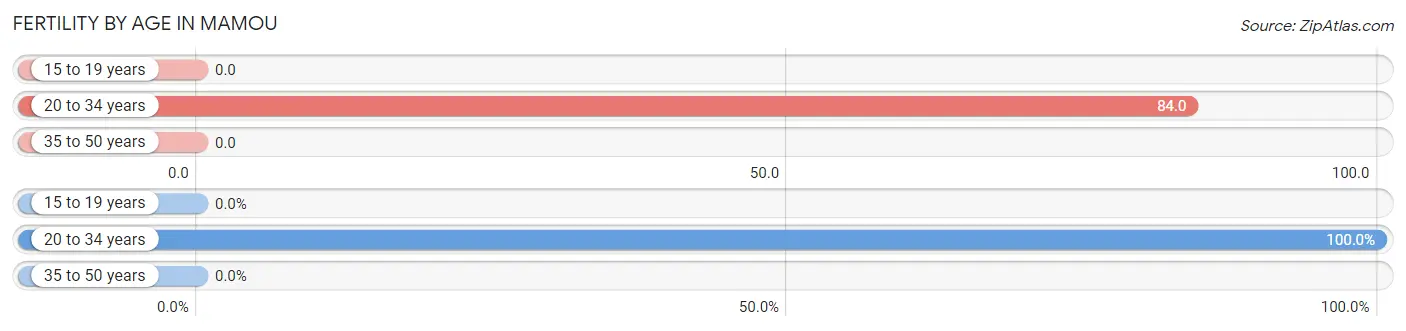
| Age Bracket | Women with Births | Births / 1,000 Women |
| 15 to 19 years | 0 (0.0%) | 0.0 |
| 20 to 34 years | 16 (100.0%) | 84.0 |
| 35 to 50 years | 0 (0.0%) | 0.0 |
| Total | 16 (100.0%) | 24.0 |
Fertility by Age by Marriage Status in Mamou
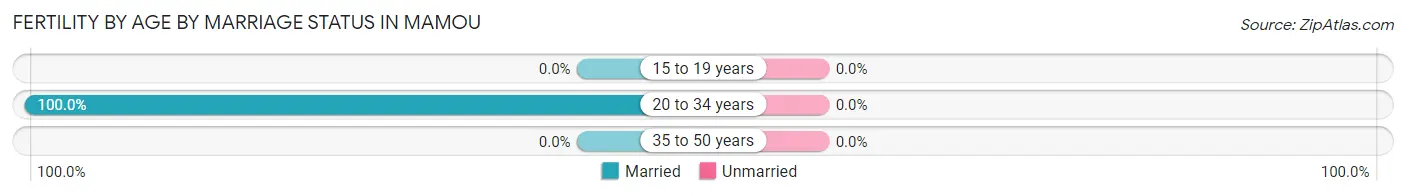
| Age Bracket | Married | Unmarried |
| 15 to 19 years | 0 (0.0%) | 0 (0.0%) |
| 20 to 34 years | 16 (100.0%) | 0 (0.0%) |
| 35 to 50 years | 0 (0.0%) | 0 (0.0%) |
| Total | 16 (100.0%) | 0 (0.0%) |
Fertility by Education in Mamou
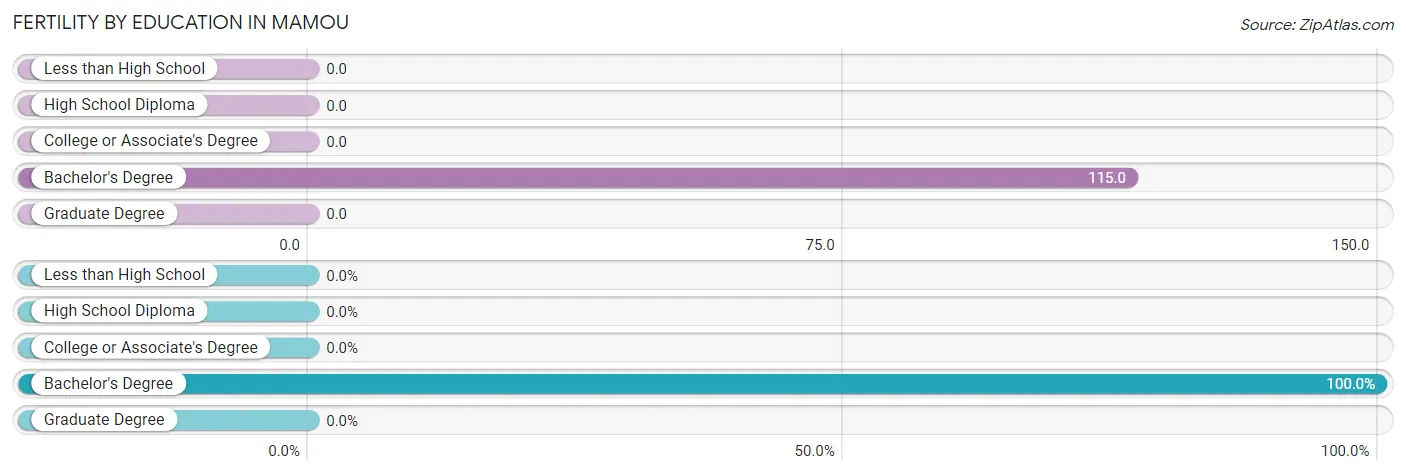
| Educational Attainment | Women with Births | Births / 1,000 Women |
| Less than High School | 0 (0.0%) | 0.0 |
| High School Diploma | 0 (0.0%) | 0.0 |
| College or Associate's Degree | 0 (0.0%) | 0.0 |
| Bachelor's Degree | 16 (100.0%) | 115.0 |
| Graduate Degree | 0 (0.0%) | 0.0 |
| Total | 16 (100.0%) | 24.0 |
Fertility by Education by Marriage Status in Mamou
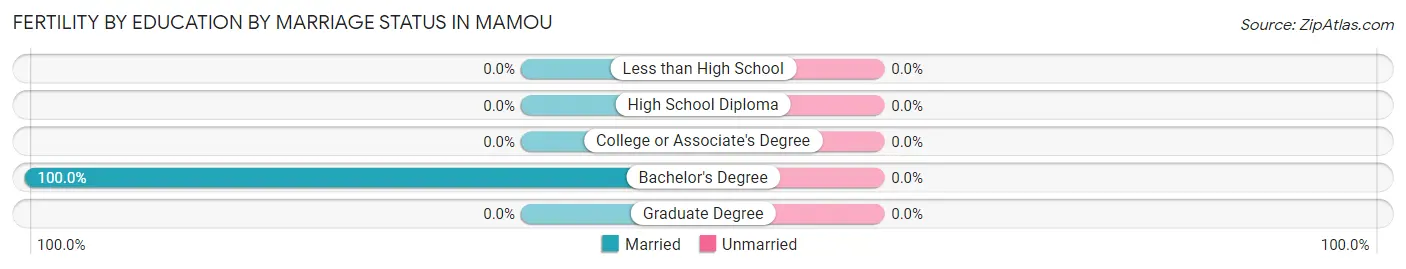
| Educational Attainment | Married | Unmarried |
| Less than High School | 0 (0.0%) | 0 (0.0%) |
| High School Diploma | 0 (0.0%) | 0 (0.0%) |
| College or Associate's Degree | 0 (0.0%) | 0 (0.0%) |
| Bachelor's Degree | 16 (100.0%) | 0 (0.0%) |
| Graduate Degree | 0 (0.0%) | 0 (0.0%) |
| Total | 16 (100.0%) | 0 (0.0%) |
Employment Characteristics in Mamou
Employment by Class of Employer in Mamou
Among the 930 employed individuals in Mamou, private company employees (346 | 37.2%), local government employees (288 | 31.0%), and not-for-profit organizations (279 | 30.0%) make up the most common classes of employment.
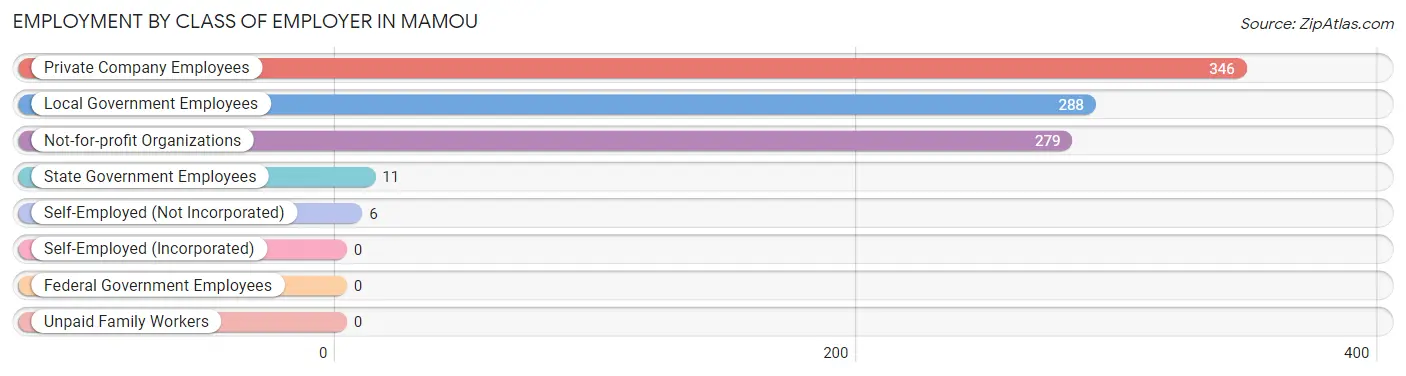
| Employer Class | # Employees | % Employees |
| Private Company Employees | 346 | 37.2% |
| Self-Employed (Incorporated) | 0 | 0.0% |
| Self-Employed (Not Incorporated) | 6 | 0.6% |
| Not-for-profit Organizations | 279 | 30.0% |
| Local Government Employees | 288 | 31.0% |
| State Government Employees | 11 | 1.2% |
| Federal Government Employees | 0 | 0.0% |
| Unpaid Family Workers | 0 | 0.0% |
| Total | 930 | 100.0% |
Employment Status by Age in Mamou
According to the labor force statistics for Mamou, out of the total population over 16 years of age (2,065), 54.7% or 1,130 individuals are in the labor force, with 16.2% or 183 of them unemployed. The age group with the highest labor force participation rate is 25 to 29 years, with 100.0% or 32 individuals in the labor force. Within the labor force, the 20 to 24 years age range has the highest percentage of unemployed individuals, with 61.5% or 169 of them being unemployed.
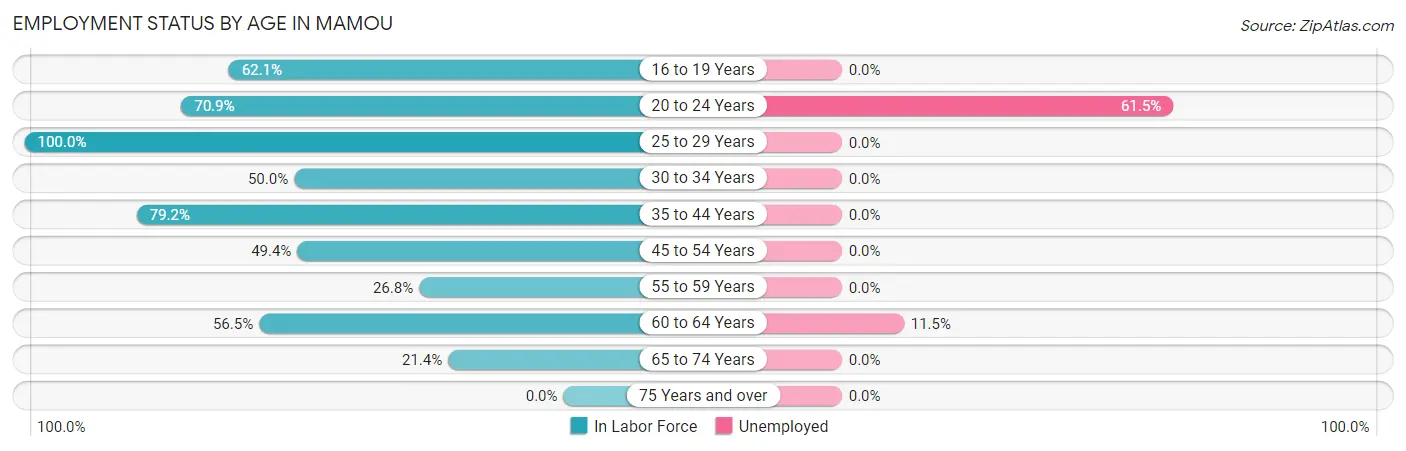
| Age Bracket | In Labor Force | Unemployed |
| 16 to 19 Years | 59 (62.1%) | 0 (0.0%) |
| 20 to 24 Years | 275 (70.9%) | 169 (61.5%) |
| 25 to 29 Years | 32 (100.0%) | 0 (0.0%) |
| 30 to 34 Years | 46 (50.0%) | 0 (0.0%) |
| 35 to 44 Years | 401 (79.2%) | 0 (0.0%) |
| 45 to 54 Years | 88 (49.4%) | 0 (0.0%) |
| 55 to 59 Years | 40 (26.8%) | 0 (0.0%) |
| 60 to 64 Years | 122 (56.5%) | 14 (11.5%) |
| 65 to 74 Years | 66 (21.4%) | 0 (0.0%) |
| 75 Years and over | 0 (0.0%) | 0 (0.0%) |
| Total | 1,130 (54.7%) | 183 (16.2%) |
Employment Status by Educational Attainment in Mamou
According to labor force statistics for Mamou, 62.1% of individuals (728) out of the total population between 25 and 64 years of age (1,173) are in the labor force, with 1.9% or 14 of them being unemployed. The group with the highest labor force participation rate are those with the educational attainment of bachelor's degree or higher, with 95.0% or 113 individuals in the labor force. Within the labor force, individuals with college / associate degree education have the highest percentage of unemployment, with 12.0% or 14 of them being unemployed.
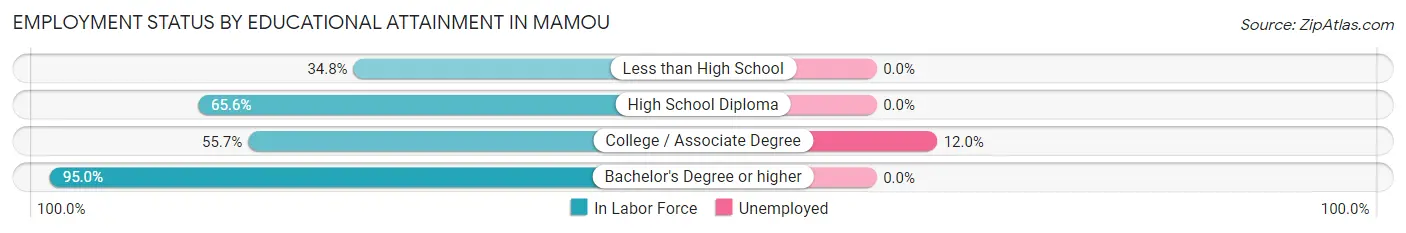
| Educational Attainment | In Labor Force | Unemployed |
| Less than High School | 62 (34.8%) | 0 (0.0%) |
| High School Diploma | 437 (65.6%) | 0 (0.0%) |
| College / Associate Degree | 117 (55.7%) | 25 (12.0%) |
| Bachelor's Degree or higher | 113 (95.0%) | 0 (0.0%) |
| Total | 728 (62.1%) | 22 (1.9%) |
Employment Occupations by Sex in Mamou
Management, Business, Science and Arts Occupations
The most common Management, Business, Science and Arts occupations in Mamou are Business & Financial (90 | 9.5%), Community & Social Service (80 | 8.5%), Education Instruction & Library (80 | 8.5%), Management (12 | 1.3%), and Health Diagnosing & Treating (8 | 0.9%).
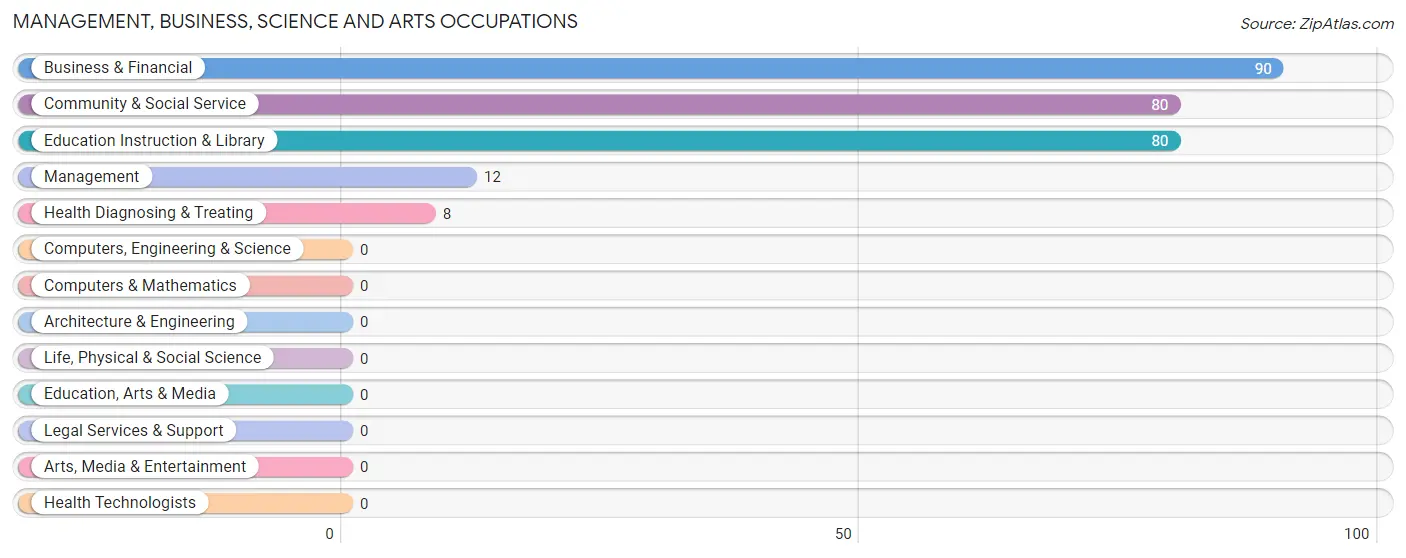
Management, Business, Science and Arts Occupations by Sex
Within the Management, Business, Science and Arts occupations in Mamou, the most male-oriented occupations are Management (100.0%), and Business & Financial (32.2%), while the most female-oriented occupations are Community & Social Service (100.0%), Education Instruction & Library (100.0%), and Health Diagnosing & Treating (100.0%).
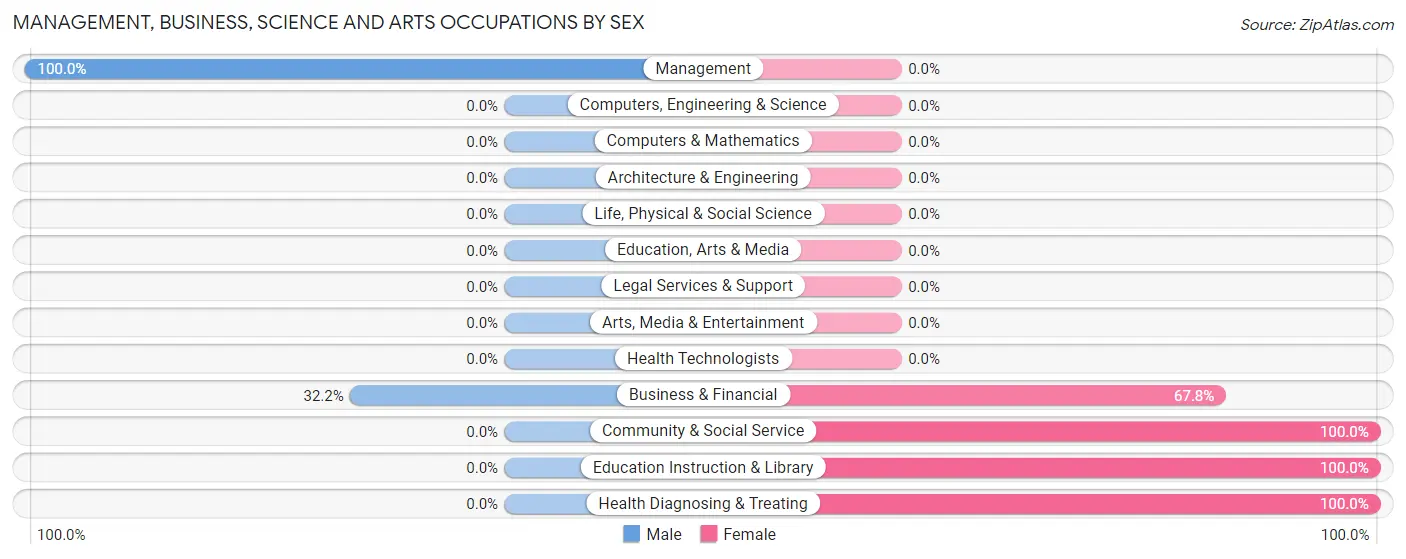
| Occupation | Male | Female |
| Management | 12 (100.0%) | 0 (0.0%) |
| Business & Financial | 29 (32.2%) | 61 (67.8%) |
| Computers, Engineering & Science | 0 (0.0%) | 0 (0.0%) |
| Computers & Mathematics | 0 (0.0%) | 0 (0.0%) |
| Architecture & Engineering | 0 (0.0%) | 0 (0.0%) |
| Life, Physical & Social Science | 0 (0.0%) | 0 (0.0%) |
| Community & Social Service | 0 (0.0%) | 80 (100.0%) |
| Education, Arts & Media | 0 (0.0%) | 0 (0.0%) |
| Legal Services & Support | 0 (0.0%) | 0 (0.0%) |
| Education Instruction & Library | 0 (0.0%) | 80 (100.0%) |
| Arts, Media & Entertainment | 0 (0.0%) | 0 (0.0%) |
| Health Diagnosing & Treating | 0 (0.0%) | 8 (100.0%) |
| Health Technologists | 0 (0.0%) | 0 (0.0%) |
| Total (Category) | 41 (21.6%) | 149 (78.4%) |
| Total (Overall) | 386 (40.8%) | 560 (59.2%) |
Services Occupations
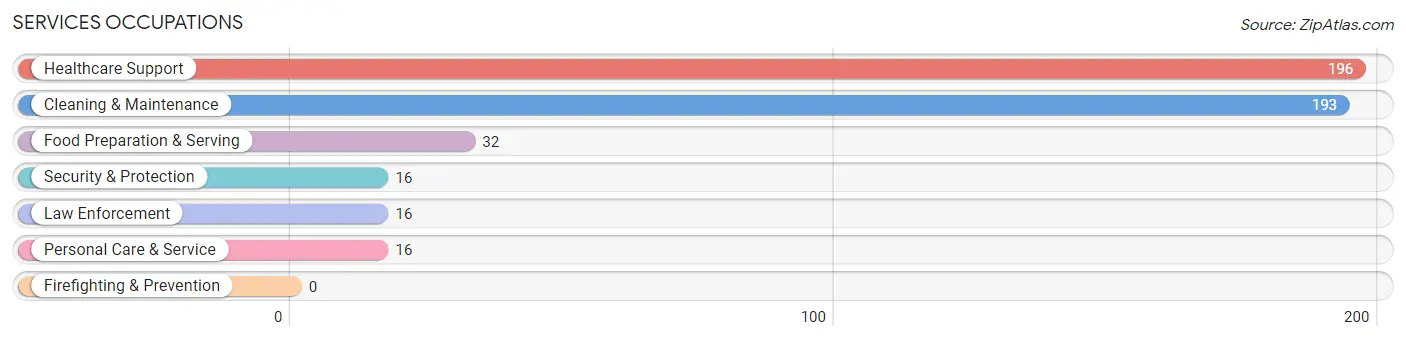
The most common Services occupations in Mamou are Healthcare Support (196 | 20.7%), Cleaning & Maintenance (193 | 20.4%), Food Preparation & Serving (32 | 3.4%), Security & Protection (16 | 1.7%), and Law Enforcement (16 | 1.7%).
Services Occupations by Sex
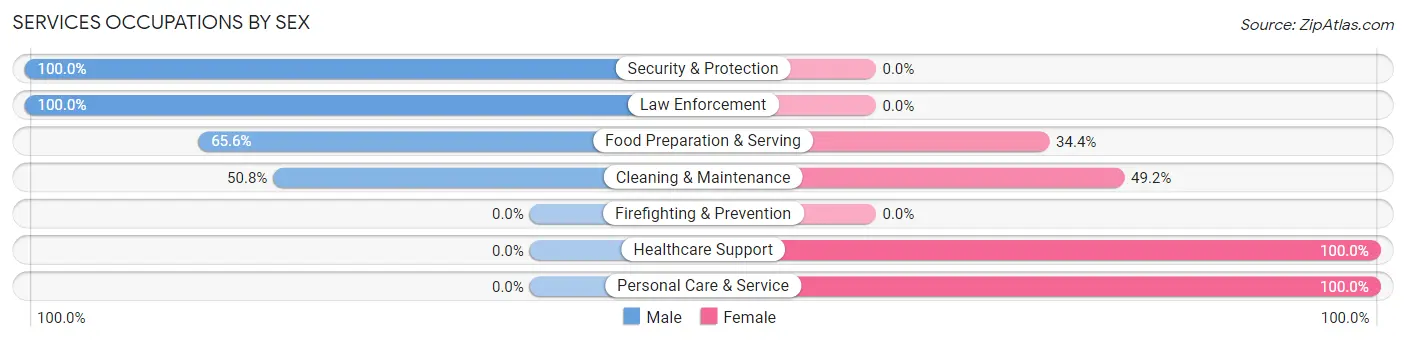
Within the Services occupations in Mamou, the most male-oriented occupations are Security & Protection (100.0%), Law Enforcement (100.0%), and Food Preparation & Serving (65.6%), while the most female-oriented occupations are Healthcare Support (100.0%), Personal Care & Service (100.0%), and Cleaning & Maintenance (49.2%).
| Occupation | Male | Female |
| Healthcare Support | 0 (0.0%) | 196 (100.0%) |
| Security & Protection | 16 (100.0%) | 0 (0.0%) |
| Firefighting & Prevention | 0 (0.0%) | 0 (0.0%) |
| Law Enforcement | 16 (100.0%) | 0 (0.0%) |
| Food Preparation & Serving | 21 (65.6%) | 11 (34.4%) |
| Cleaning & Maintenance | 98 (50.8%) | 95 (49.2%) |
| Personal Care & Service | 0 (0.0%) | 16 (100.0%) |
| Total (Category) | 135 (29.8%) | 318 (70.2%) |
| Total (Overall) | 386 (40.8%) | 560 (59.2%) |
Sales and Office Occupations
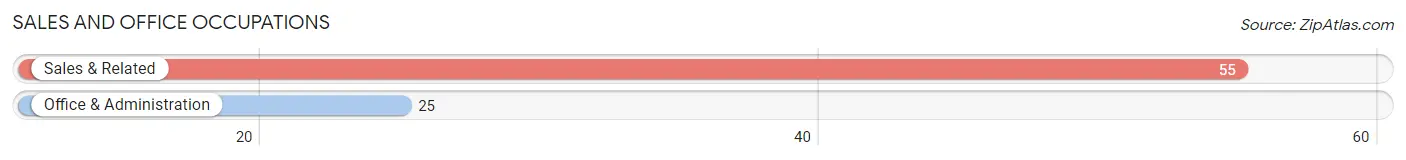
The most common Sales and Office occupations in Mamou are Sales & Related (55 | 5.8%), and Office & Administration (25 | 2.6%).
Sales and Office Occupations by Sex
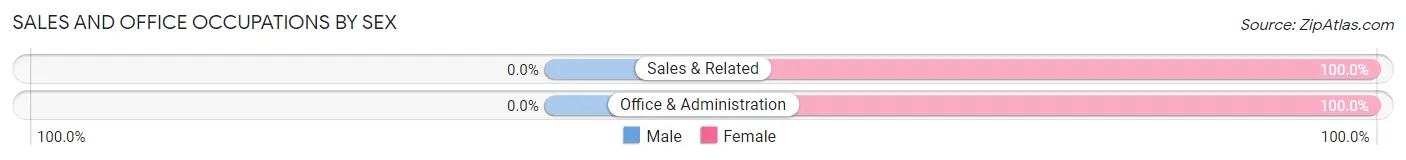
| Occupation | Male | Female |
| Sales & Related | 0 (0.0%) | 55 (100.0%) |
| Office & Administration | 0 (0.0%) | 25 (100.0%) |
| Total (Category) | 0 (0.0%) | 80 (100.0%) |
| Total (Overall) | 386 (40.8%) | 560 (59.2%) |
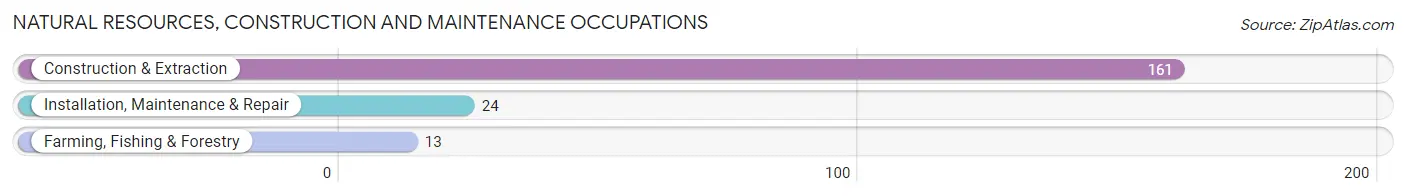
Natural Resources, Construction and Maintenance Occupations
The most common Natural Resources, Construction and Maintenance occupations in Mamou are Construction & Extraction (161 | 17.0%), Installation, Maintenance & Repair (24 | 2.5%), and Farming, Fishing & Forestry (13 | 1.4%).
Natural Resources, Construction and Maintenance Occupations by Sex
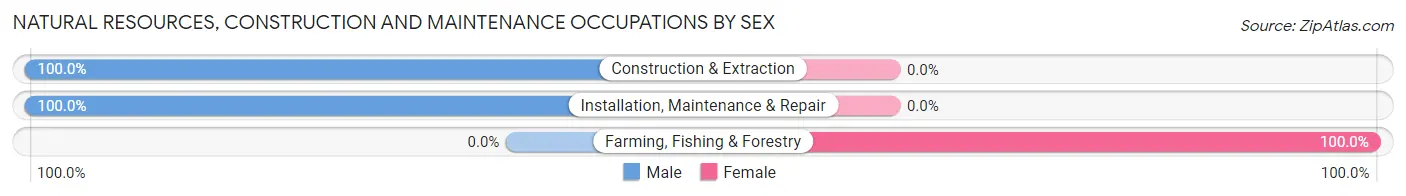
| Occupation | Male | Female |
| Farming, Fishing & Forestry | 0 (0.0%) | 13 (100.0%) |
| Construction & Extraction | 161 (100.0%) | 0 (0.0%) |
| Installation, Maintenance & Repair | 24 (100.0%) | 0 (0.0%) |
| Total (Category) | 185 (93.4%) | 13 (6.6%) |
| Total (Overall) | 386 (40.8%) | 560 (59.2%) |
Production, Transportation and Moving Occupations
The most common Production, Transportation and Moving occupations in Mamou are Material Moving (17 | 1.8%), and Production (8 | 0.9%).
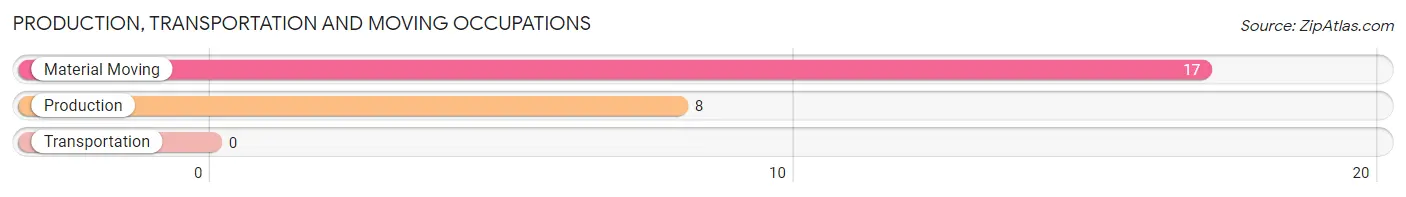
Production, Transportation and Moving Occupations by Sex
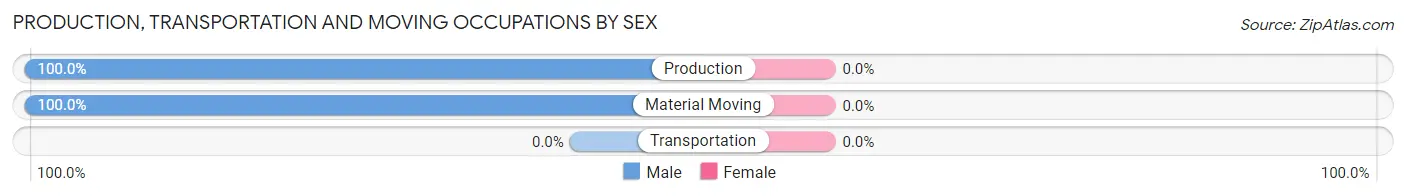
| Occupation | Male | Female |
| Production | 8 (100.0%) | 0 (0.0%) |
| Transportation | 0 (0.0%) | 0 (0.0%) |
| Material Moving | 17 (100.0%) | 0 (0.0%) |
| Total (Category) | 25 (100.0%) | 0 (0.0%) |
| Total (Overall) | 386 (40.8%) | 560 (59.2%) |
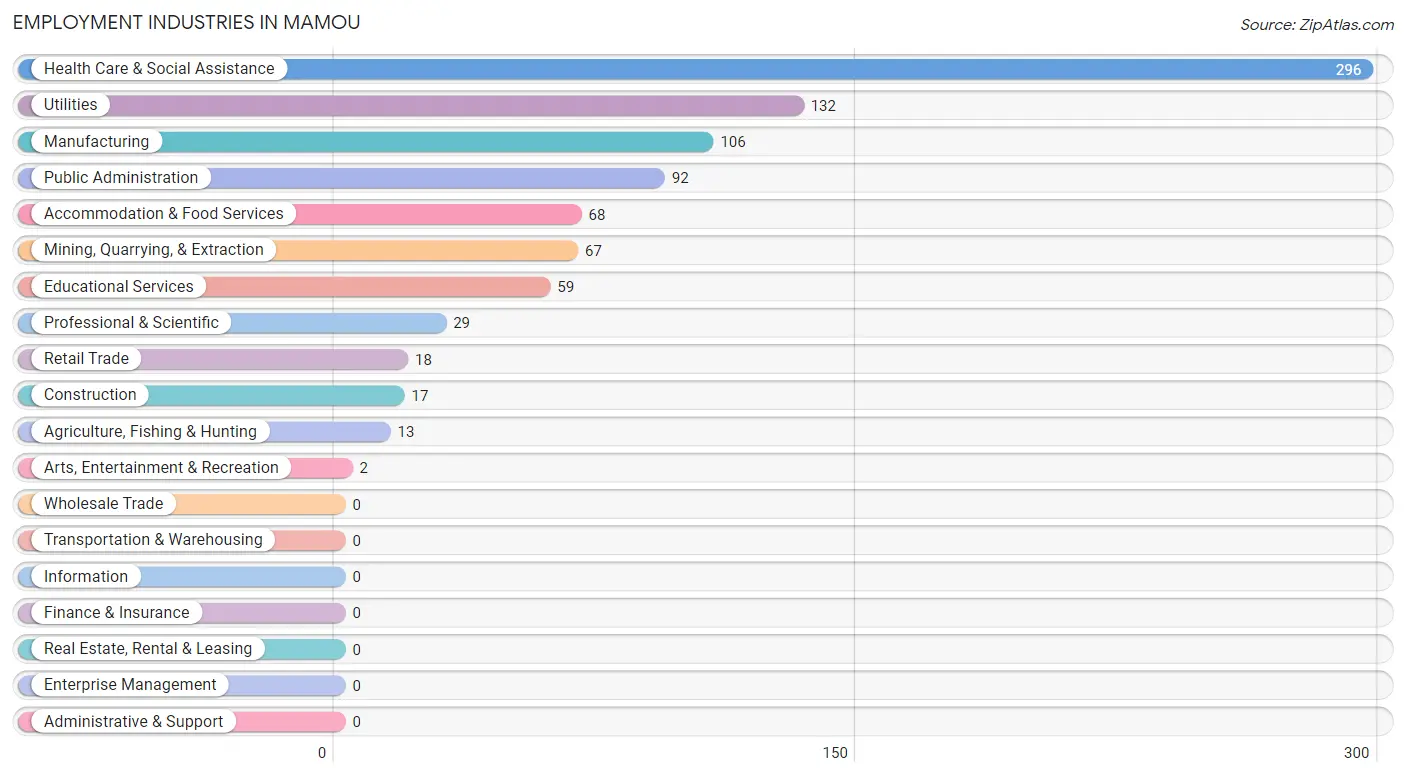
Employment Industries by Sex in Mamou
Employment Industries in Mamou
The major employment industries in Mamou include Health Care & Social Assistance (296 | 31.3%), Utilities (132 | 14.0%), Manufacturing (106 | 11.2%), Public Administration (92 | 9.7%), and Accommodation & Food Services (68 | 7.2%).
Employment Industries by Sex in Mamou
The Mamou industries that see more men than women are Construction (100.0%), Manufacturing (100.0%), and Utilities (100.0%), whereas the industries that tend to have a higher number of women are Agriculture, Fishing & Hunting (100.0%), Educational Services (100.0%), and Health Care & Social Assistance (100.0%).
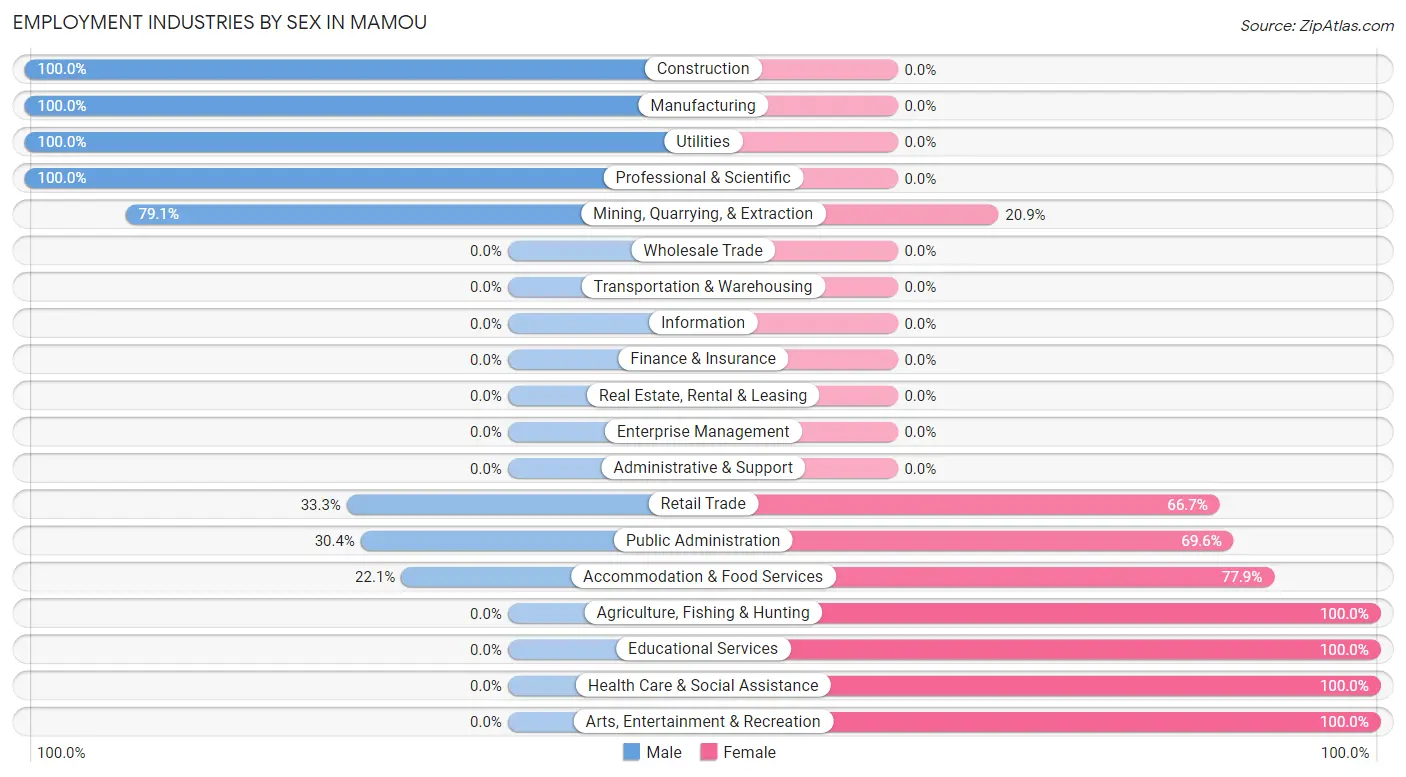
| Industry | Male | Female |
| Agriculture, Fishing & Hunting | 0 (0.0%) | 13 (100.0%) |
| Mining, Quarrying, & Extraction | 53 (79.1%) | 14 (20.9%) |
| Construction | 17 (100.0%) | 0 (0.0%) |
| Manufacturing | 106 (100.0%) | 0 (0.0%) |
| Wholesale Trade | 0 (0.0%) | 0 (0.0%) |
| Retail Trade | 6 (33.3%) | 12 (66.7%) |
| Transportation & Warehousing | 0 (0.0%) | 0 (0.0%) |
| Utilities | 132 (100.0%) | 0 (0.0%) |
| Information | 0 (0.0%) | 0 (0.0%) |
| Finance & Insurance | 0 (0.0%) | 0 (0.0%) |
| Real Estate, Rental & Leasing | 0 (0.0%) | 0 (0.0%) |
| Professional & Scientific | 29 (100.0%) | 0 (0.0%) |
| Enterprise Management | 0 (0.0%) | 0 (0.0%) |
| Administrative & Support | 0 (0.0%) | 0 (0.0%) |
| Educational Services | 0 (0.0%) | 59 (100.0%) |
| Health Care & Social Assistance | 0 (0.0%) | 296 (100.0%) |
| Arts, Entertainment & Recreation | 0 (0.0%) | 2 (100.0%) |
| Accommodation & Food Services | 15 (22.1%) | 53 (77.9%) |
| Public Administration | 28 (30.4%) | 64 (69.6%) |
| Total | 386 (40.8%) | 560 (59.2%) |
Education in Mamou
School Enrollment in Mamou
The most common levels of schooling among the 743 students in Mamou are elementary school (362 | 48.7%), high school (115 | 15.5%), and kindergarten (105 | 14.1%).
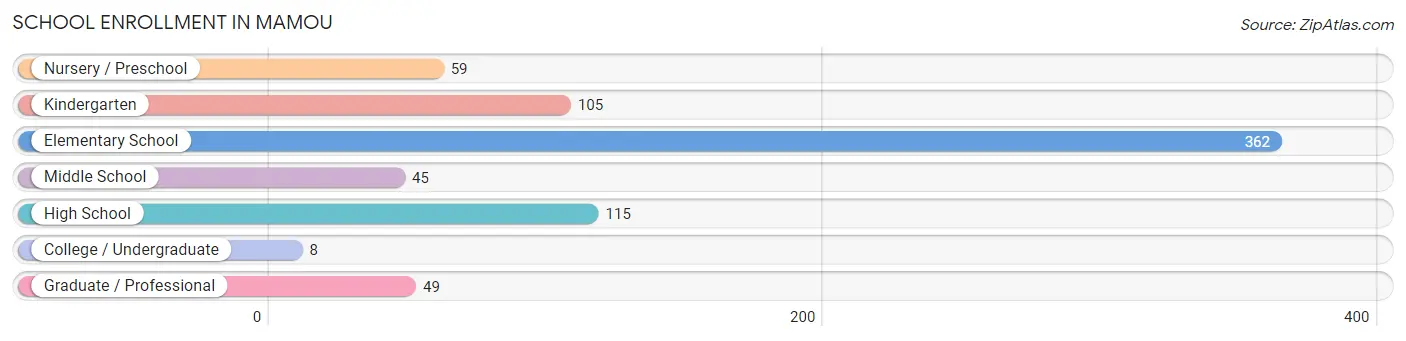
| School Level | # Students | % Students |
| Nursery / Preschool | 59 | 7.9% |
| Kindergarten | 105 | 14.1% |
| Elementary School | 362 | 48.7% |
| Middle School | 45 | 6.1% |
| High School | 115 | 15.5% |
| College / Undergraduate | 8 | 1.1% |
| Graduate / Professional | 49 | 6.6% |
| Total | 743 | 100.0% |
School Enrollment by Age by Funding Source in Mamou
Out of a total of 743 students who are enrolled in schools in Mamou, 204 (27.5%) attend a private institution, while the remaining 539 (72.5%) are enrolled in public schools. The age group of 5 to 9 year old has the highest likelihood of being enrolled in private schools, with 204 (43.7% in the age bracket) enrolled. Conversely, the age group of 3 to 4 year olds has the lowest likelihood of being enrolled in a private school, with 59 (100.0% in the age bracket) attending a public institution.
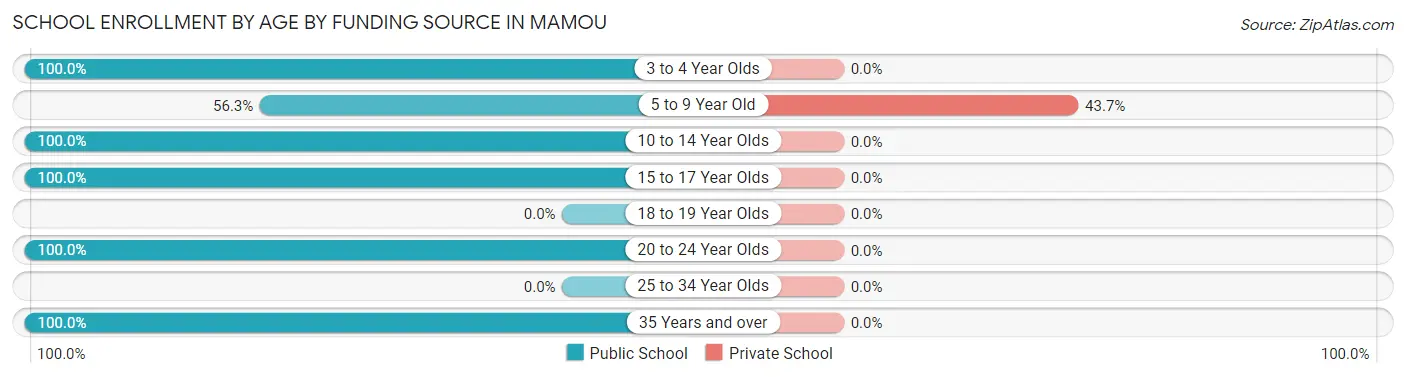
| Age Bracket | Public School | Private School |
| 3 to 4 Year Olds | 59 (100.0%) | 0 (0.0%) |
| 5 to 9 Year Old | 263 (56.3%) | 204 (43.7%) |
| 10 to 14 Year Olds | 45 (100.0%) | 0 (0.0%) |
| 15 to 17 Year Olds | 36 (100.0%) | 0 (0.0%) |
| 18 to 19 Year Olds | 0 (0.0%) | 0 (0.0%) |
| 20 to 24 Year Olds | 87 (100.0%) | 0 (0.0%) |
| 25 to 34 Year Olds | 0 (0.0%) | 0 (0.0%) |
| 35 Years and over | 49 (100.0%) | 0 (0.0%) |
| Total | 539 (72.5%) | 204 (27.5%) |
Educational Attainment by Field of Study in Mamou
Arts & humanities (70 | 32.9%), bio, nature & agricultural (55 | 25.8%), business (48 | 22.5%), and education (40 | 18.8%) are the most common fields of study among 213 individuals in Mamou who have obtained a bachelor's degree or higher.
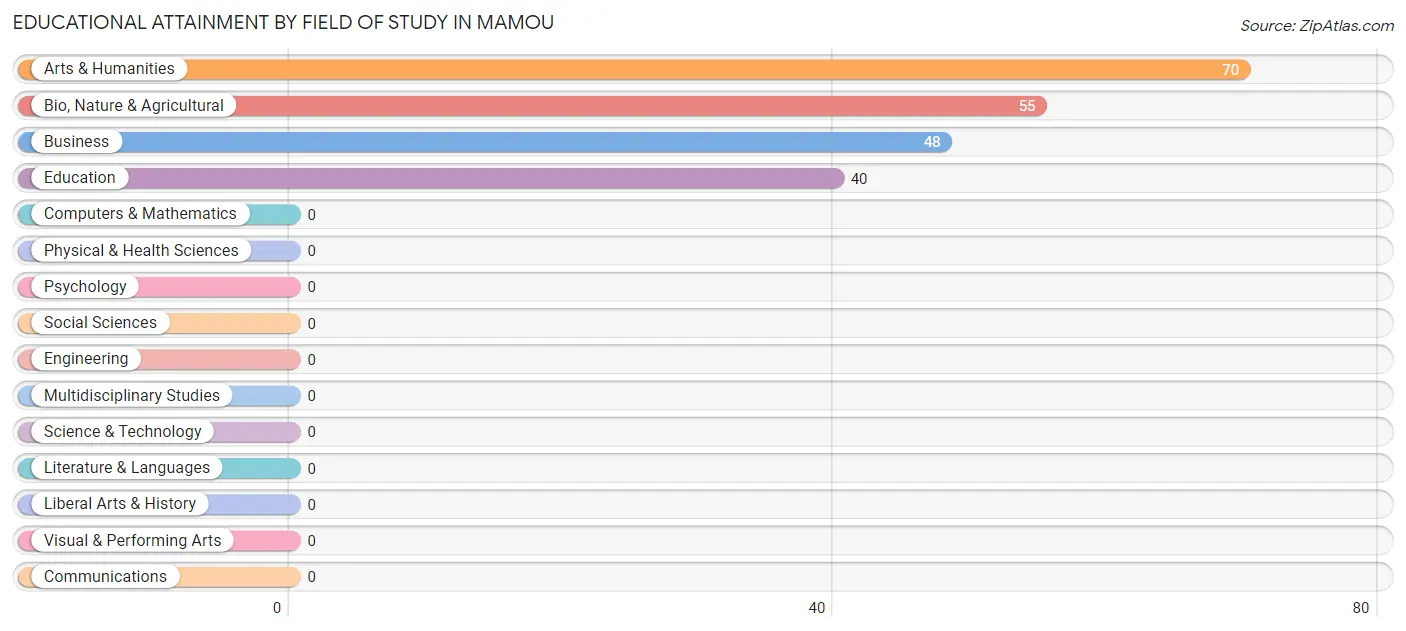
| Field of Study | # Graduates | % Graduates |
| Computers & Mathematics | 0 | 0.0% |
| Bio, Nature & Agricultural | 55 | 25.8% |
| Physical & Health Sciences | 0 | 0.0% |
| Psychology | 0 | 0.0% |
| Social Sciences | 0 | 0.0% |
| Engineering | 0 | 0.0% |
| Multidisciplinary Studies | 0 | 0.0% |
| Science & Technology | 0 | 0.0% |
| Business | 48 | 22.5% |
| Education | 40 | 18.8% |
| Literature & Languages | 0 | 0.0% |
| Liberal Arts & History | 0 | 0.0% |
| Visual & Performing Arts | 0 | 0.0% |
| Communications | 0 | 0.0% |
| Arts & Humanities | 70 | 32.9% |
| Total | 213 | 100.0% |
Transportation & Commute in Mamou
Vehicle Availability by Sex in Mamou
The most prevalent vehicle ownership categories in Mamou are males with 1 vehicle (169, accounting for 43.8%) and females with 1 vehicle (357, making up 31.1%).
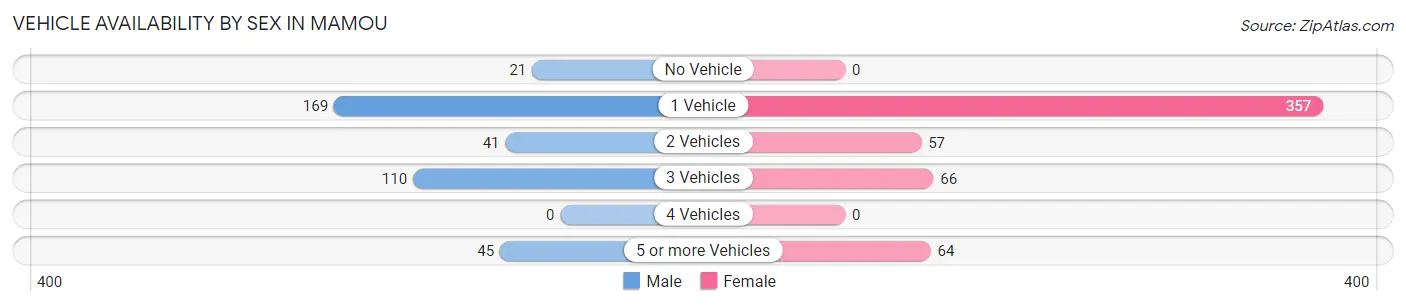
| Vehicles Available | Male | Female |
| No Vehicle | 21 (5.4%) | 0 (0.0%) |
| 1 Vehicle | 169 (43.8%) | 357 (65.6%) |
| 2 Vehicles | 41 (10.6%) | 57 (10.5%) |
| 3 Vehicles | 110 (28.5%) | 66 (12.1%) |
| 4 Vehicles | 0 (0.0%) | 0 (0.0%) |
| 5 or more Vehicles | 45 (11.7%) | 64 (11.8%) |
| Total | 386 (100.0%) | 544 (100.0%) |
Commute Time in Mamou
The most frequently occuring commute durations in Mamou are 15 to 19 minutes (288 commuters, 31.0%), less than 5 minutes (189 commuters, 20.3%), and 10 to 14 minutes (84 commuters, 9.0%).
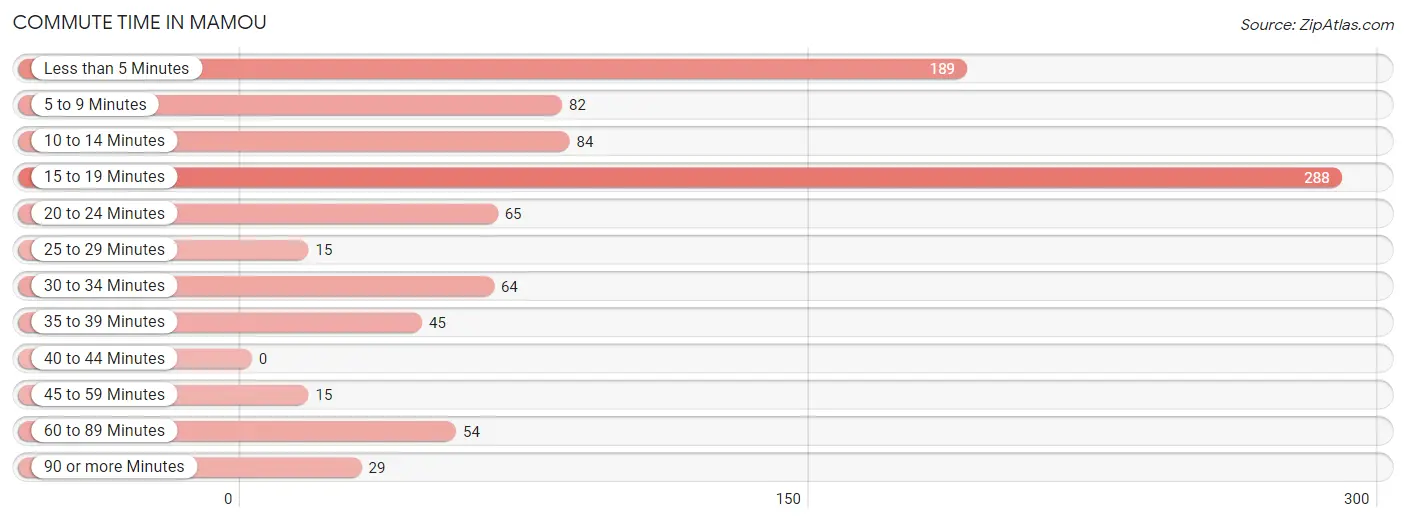
| Commute Time | # Commuters | % Commuters |
| Less than 5 Minutes | 189 | 20.3% |
| 5 to 9 Minutes | 82 | 8.8% |
| 10 to 14 Minutes | 84 | 9.0% |
| 15 to 19 Minutes | 288 | 31.0% |
| 20 to 24 Minutes | 65 | 7.0% |
| 25 to 29 Minutes | 15 | 1.6% |
| 30 to 34 Minutes | 64 | 6.9% |
| 35 to 39 Minutes | 45 | 4.8% |
| 40 to 44 Minutes | 0 | 0.0% |
| 45 to 59 Minutes | 15 | 1.6% |
| 60 to 89 Minutes | 54 | 5.8% |
| 90 or more Minutes | 29 | 3.1% |
Commute Time by Sex in Mamou
The most common commute times in Mamou are less than 5 minutes (132 commuters, 34.2%) for males and 15 to 19 minutes (184 commuters, 33.8%) for females.
| Commute Time | Male | Female |
| Less than 5 Minutes | 132 (34.2%) | 57 (10.5%) |
| 5 to 9 Minutes | 15 (3.9%) | 67 (12.3%) |
| 10 to 14 Minutes | 20 (5.2%) | 64 (11.8%) |
| 15 to 19 Minutes | 104 (26.9%) | 184 (33.8%) |
| 20 to 24 Minutes | 0 (0.0%) | 65 (11.9%) |
| 25 to 29 Minutes | 0 (0.0%) | 15 (2.8%) |
| 30 to 34 Minutes | 0 (0.0%) | 64 (11.8%) |
| 35 to 39 Minutes | 45 (11.7%) | 0 (0.0%) |
| 40 to 44 Minutes | 0 (0.0%) | 0 (0.0%) |
| 45 to 59 Minutes | 0 (0.0%) | 15 (2.8%) |
| 60 to 89 Minutes | 41 (10.6%) | 13 (2.4%) |
| 90 or more Minutes | 29 (7.5%) | 0 (0.0%) |
Time of Departure to Work by Sex in Mamou
The most frequent times of departure to work in Mamou are 7:00 AM to 7:29 AM (230, 59.6%) for males and 4:00 PM to 11:59 PM (234, 43.0%) for females.
| Time of Departure | Male | Female |
| 12:00 AM to 4:59 AM | 94 (24.3%) | 0 (0.0%) |
| 5:00 AM to 5:29 AM | 17 (4.4%) | 42 (7.7%) |
| 5:30 AM to 5:59 AM | 0 (0.0%) | 0 (0.0%) |
| 6:00 AM to 6:29 AM | 39 (10.1%) | 13 (2.4%) |
| 6:30 AM to 6:59 AM | 0 (0.0%) | 0 (0.0%) |
| 7:00 AM to 7:29 AM | 230 (59.6%) | 64 (11.8%) |
| 7:30 AM to 7:59 AM | 0 (0.0%) | 62 (11.4%) |
| 8:00 AM to 8:29 AM | 0 (0.0%) | 25 (4.6%) |
| 8:30 AM to 8:59 AM | 0 (0.0%) | 0 (0.0%) |
| 9:00 AM to 9:59 AM | 0 (0.0%) | 84 (15.4%) |
| 10:00 AM to 10:59 AM | 0 (0.0%) | 0 (0.0%) |
| 11:00 AM to 11:59 AM | 0 (0.0%) | 12 (2.2%) |
| 12:00 PM to 3:59 PM | 6 (1.5%) | 8 (1.5%) |
| 4:00 PM to 11:59 PM | 0 (0.0%) | 234 (43.0%) |
| Total | 386 (100.0%) | 544 (100.0%) |
Housing Occupancy in Mamou
Occupancy by Ownership in Mamou
Of the total 1,145 dwellings in Mamou, owner-occupied units account for 579 (50.6%), while renter-occupied units make up 566 (49.4%).
| Occupancy | # Housing Units | % Housing Units |
| Owner Occupied Housing Units | 579 | 50.6% |
| Renter-Occupied Housing Units | 566 | 49.4% |
| Total Occupied Housing Units | 1,145 | 100.0% |
Occupancy by Household Size in Mamou
| Household Size | # Housing Units | % Housing Units |
| 1-Person Household | 440 | 38.4% |
| 2-Person Household | 398 | 34.8% |
| 3-Person Household | 58 | 5.1% |
| 4+ Person Household | 249 | 21.7% |
| Total Housing Units | 1,145 | 100.0% |
Occupancy by Ownership by Household Size in Mamou
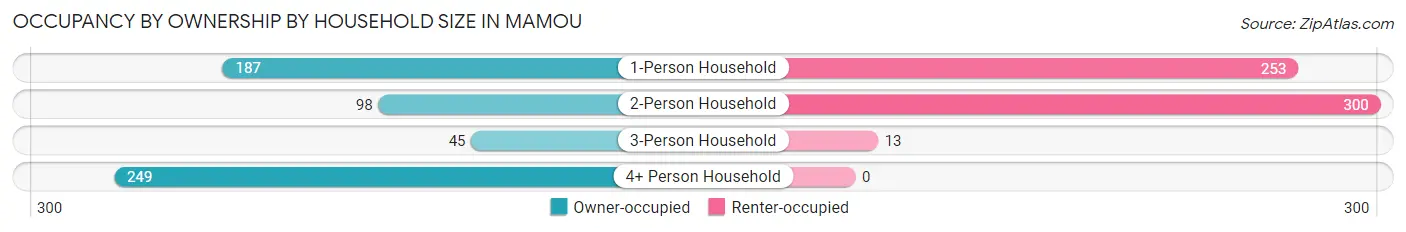
| Household Size | Owner-occupied | Renter-occupied |
| 1-Person Household | 187 (42.5%) | 253 (57.5%) |
| 2-Person Household | 98 (24.6%) | 300 (75.4%) |
| 3-Person Household | 45 (77.6%) | 13 (22.4%) |
| 4+ Person Household | 249 (100.0%) | 0 (0.0%) |
| Total Housing Units | 579 (50.6%) | 566 (49.4%) |
Occupancy by Educational Attainment in Mamou
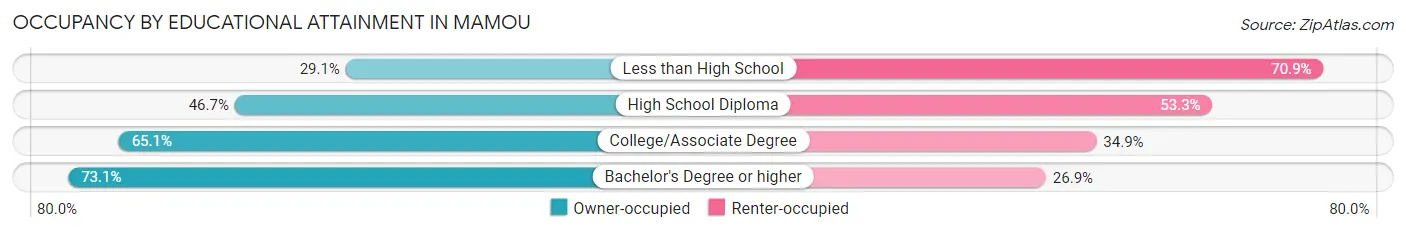
| Household Size | Owner-occupied | Renter-occupied |
| Less than High School | 50 (29.1%) | 122 (70.9%) |
| High School Diploma | 301 (46.7%) | 344 (53.3%) |
| College/Associate Degree | 95 (65.1%) | 51 (34.9%) |
| Bachelor's Degree or higher | 133 (73.1%) | 49 (26.9%) |
Occupancy by Age of Householder in Mamou
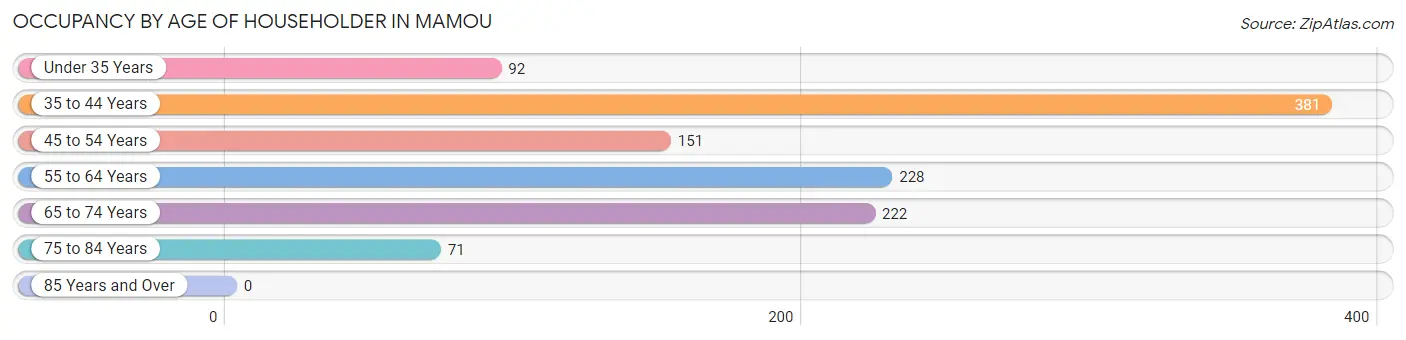
| Age Bracket | # Households | % Households |
| Under 35 Years | 92 | 8.0% |
| 35 to 44 Years | 381 | 33.3% |
| 45 to 54 Years | 151 | 13.2% |
| 55 to 64 Years | 228 | 19.9% |
| 65 to 74 Years | 222 | 19.4% |
| 75 to 84 Years | 71 | 6.2% |
| 85 Years and Over | 0 | 0.0% |
| Total | 1,145 | 100.0% |
Housing Finances in Mamou
Median Income by Occupancy in Mamou
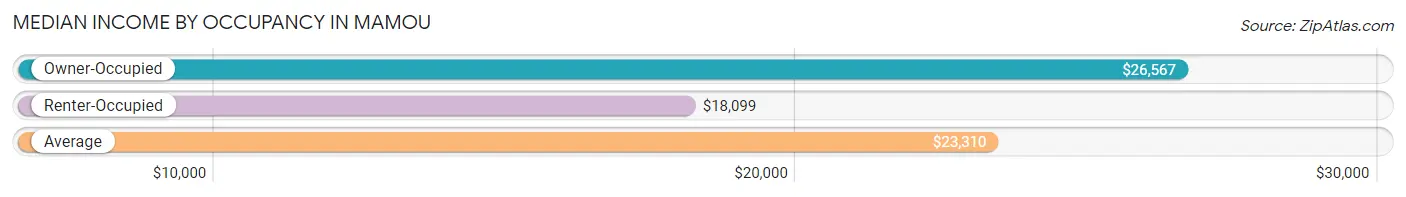
| Occupancy Type | # Households | Median Income |
| Owner-Occupied | 579 (50.6%) | $26,567 |
| Renter-Occupied | 566 (49.4%) | $18,099 |
| Average | 1,145 (100.0%) | $23,310 |
Occupancy by Householder Income Bracket in Mamou
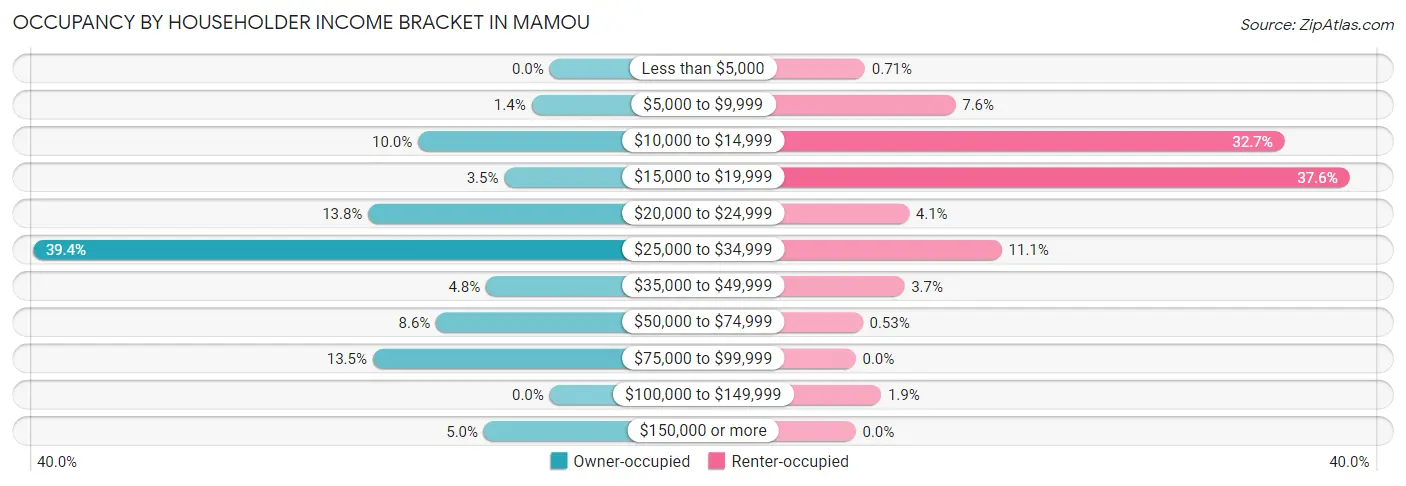
| Income Bracket | Owner-occupied | Renter-occupied |
| Less than $5,000 | 0 (0.0%) | 4 (0.7%) |
| $5,000 to $9,999 | 8 (1.4%) | 43 (7.6%) |
| $10,000 to $14,999 | 58 (10.0%) | 185 (32.7%) |
| $15,000 to $19,999 | 20 (3.5%) | 213 (37.6%) |
| $20,000 to $24,999 | 80 (13.8%) | 23 (4.1%) |
| $25,000 to $34,999 | 228 (39.4%) | 63 (11.1%) |
| $35,000 to $49,999 | 28 (4.8%) | 21 (3.7%) |
| $50,000 to $74,999 | 50 (8.6%) | 3 (0.5%) |
| $75,000 to $99,999 | 78 (13.5%) | 0 (0.0%) |
| $100,000 to $149,999 | 0 (0.0%) | 11 (1.9%) |
| $150,000 or more | 29 (5.0%) | 0 (0.0%) |
| Total | 579 (100.0%) | 566 (100.0%) |
Monthly Housing Cost Tiers in Mamou
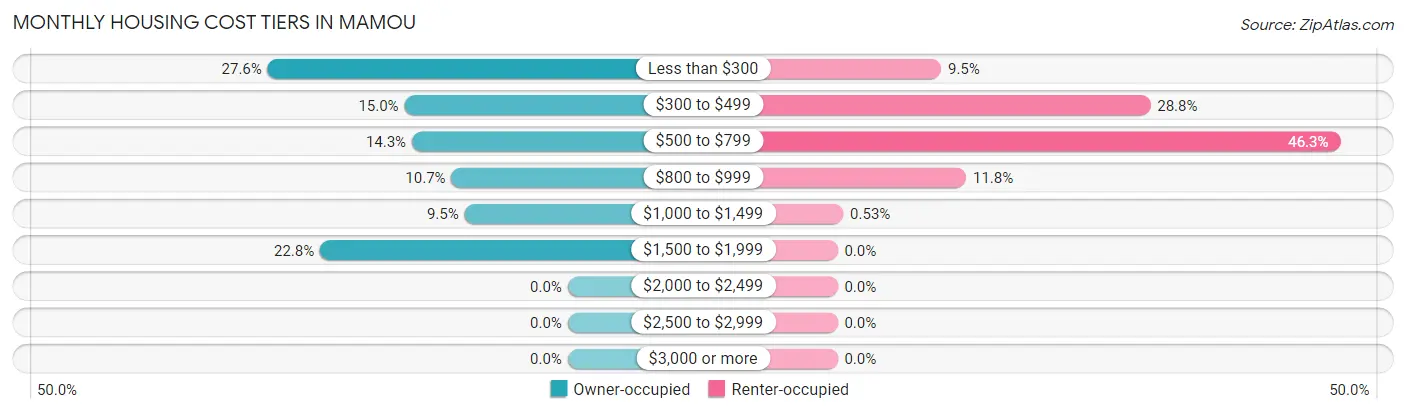
| Monthly Cost | Owner-occupied | Renter-occupied |
| Less than $300 | 160 (27.6%) | 54 (9.5%) |
| $300 to $499 | 87 (15.0%) | 163 (28.8%) |
| $500 to $799 | 83 (14.3%) | 262 (46.3%) |
| $800 to $999 | 62 (10.7%) | 67 (11.8%) |
| $1,000 to $1,499 | 55 (9.5%) | 3 (0.5%) |
| $1,500 to $1,999 | 132 (22.8%) | 0 (0.0%) |
| $2,000 to $2,499 | 0 (0.0%) | 0 (0.0%) |
| $2,500 to $2,999 | 0 (0.0%) | 0 (0.0%) |
| $3,000 or more | 0 (0.0%) | 0 (0.0%) |
| Total | 579 (100.0%) | 566 (100.0%) |
Physical Housing Characteristics in Mamou
Housing Structures in Mamou
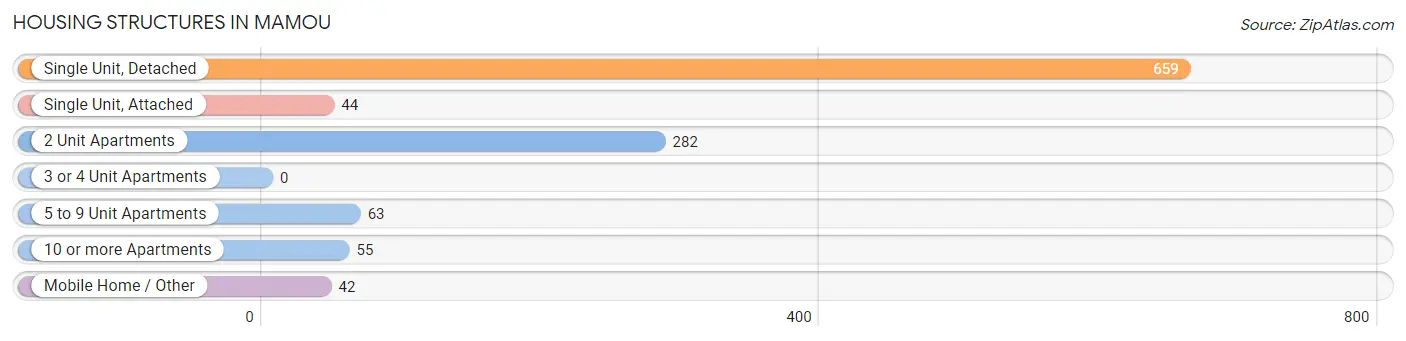
| Structure Type | # Housing Units | % Housing Units |
| Single Unit, Detached | 659 | 57.6% |
| Single Unit, Attached | 44 | 3.8% |
| 2 Unit Apartments | 282 | 24.6% |
| 3 or 4 Unit Apartments | 0 | 0.0% |
| 5 to 9 Unit Apartments | 63 | 5.5% |
| 10 or more Apartments | 55 | 4.8% |
| Mobile Home / Other | 42 | 3.7% |
| Total | 1,145 | 100.0% |
Housing Structures by Occupancy in Mamou
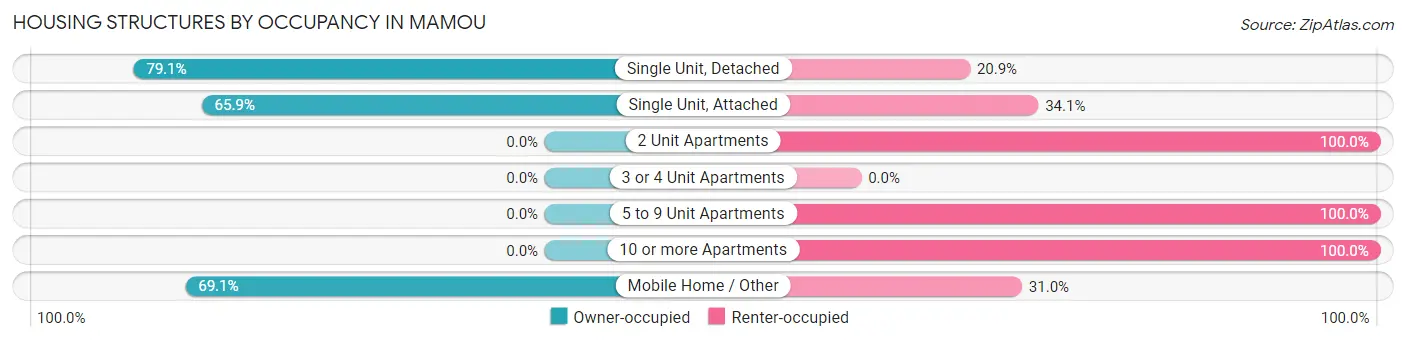
| Structure Type | Owner-occupied | Renter-occupied |
| Single Unit, Detached | 521 (79.1%) | 138 (20.9%) |
| Single Unit, Attached | 29 (65.9%) | 15 (34.1%) |
| 2 Unit Apartments | 0 (0.0%) | 282 (100.0%) |
| 3 or 4 Unit Apartments | 0 (0.0%) | 0 (0.0%) |
| 5 to 9 Unit Apartments | 0 (0.0%) | 63 (100.0%) |
| 10 or more Apartments | 0 (0.0%) | 55 (100.0%) |
| Mobile Home / Other | 29 (69.1%) | 13 (30.9%) |
| Total | 579 (50.6%) | 566 (49.4%) |
Housing Structures by Number of Rooms in Mamou
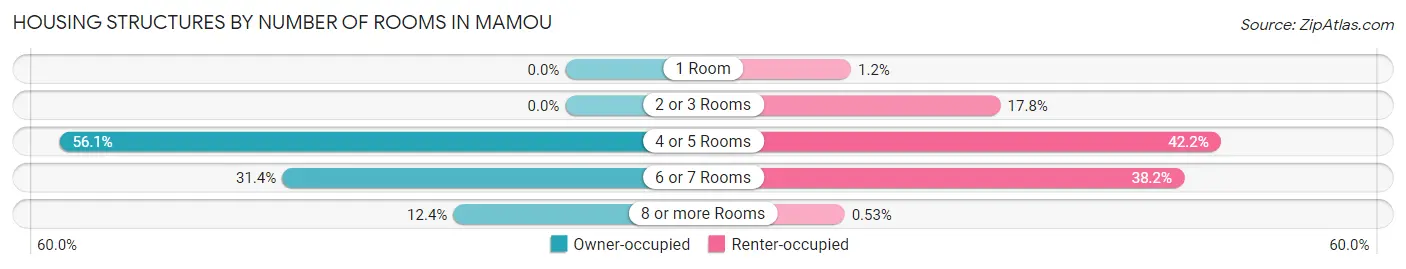
| Number of Rooms | Owner-occupied | Renter-occupied |
| 1 Room | 0 (0.0%) | 7 (1.2%) |
| 2 or 3 Rooms | 0 (0.0%) | 101 (17.8%) |
| 4 or 5 Rooms | 325 (56.1%) | 239 (42.2%) |
| 6 or 7 Rooms | 182 (31.4%) | 216 (38.2%) |
| 8 or more Rooms | 72 (12.4%) | 3 (0.5%) |
| Total | 579 (100.0%) | 566 (100.0%) |
Housing Structure by Heating Type in Mamou
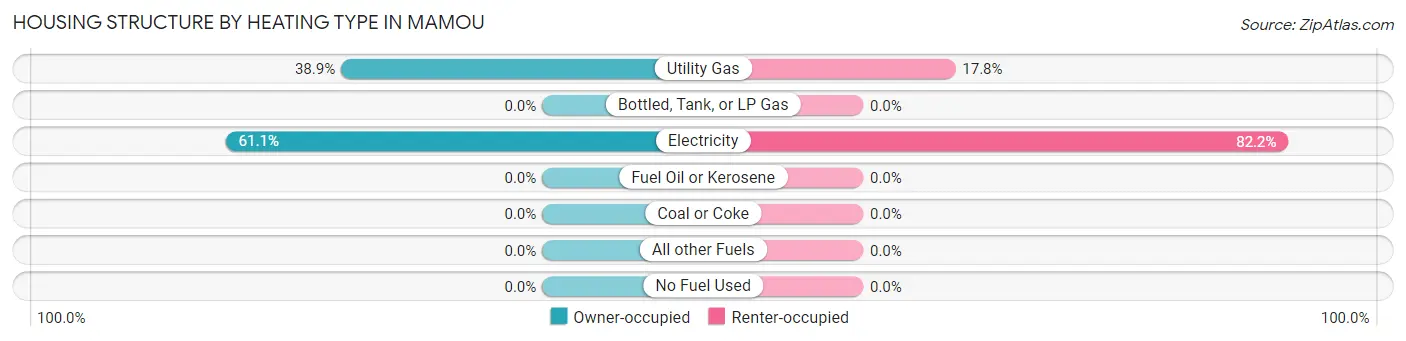
| Heating Type | Owner-occupied | Renter-occupied |
| Utility Gas | 225 (38.9%) | 101 (17.8%) |
| Bottled, Tank, or LP Gas | 0 (0.0%) | 0 (0.0%) |
| Electricity | 354 (61.1%) | 465 (82.2%) |
| Fuel Oil or Kerosene | 0 (0.0%) | 0 (0.0%) |
| Coal or Coke | 0 (0.0%) | 0 (0.0%) |
| All other Fuels | 0 (0.0%) | 0 (0.0%) |
| No Fuel Used | 0 (0.0%) | 0 (0.0%) |
| Total | 579 (100.0%) | 566 (100.0%) |
Household Vehicle Usage in Mamou
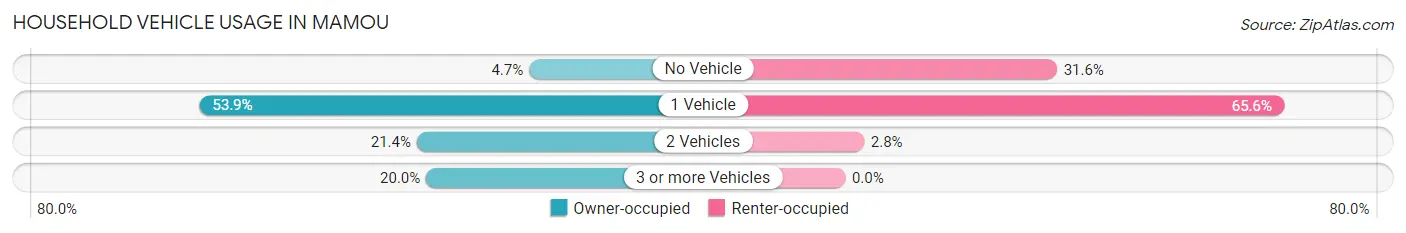
| Vehicles per Household | Owner-occupied | Renter-occupied |
| No Vehicle | 27 (4.7%) | 179 (31.6%) |
| 1 Vehicle | 312 (53.9%) | 371 (65.5%) |
| 2 Vehicles | 124 (21.4%) | 16 (2.8%) |
| 3 or more Vehicles | 116 (20.0%) | 0 (0.0%) |
| Total | 579 (100.0%) | 566 (100.0%) |
Real Estate & Mortgages in Mamou
Real Estate and Mortgage Overview in Mamou
| Characteristic | Without Mortgage | With Mortgage |
| Housing Units | 218 | 361 |
| Median Property Value | $72,500 | $89,100 |
| Median Household Income | $34,063 | $29 |
| Monthly Housing Costs | $263 | $0 |
| Real Estate Taxes | $199 | $16 |
Property Value by Mortgage Status in Mamou
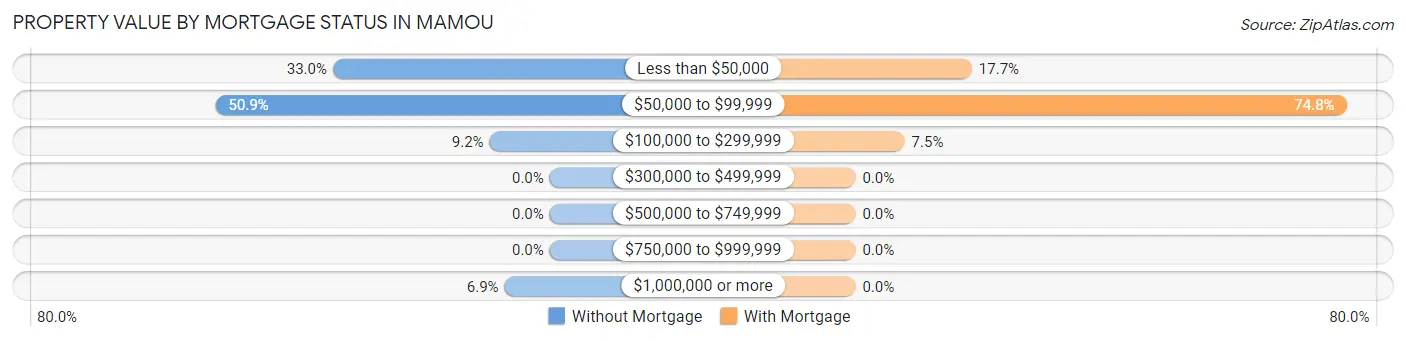
| Property Value | Without Mortgage | With Mortgage |
| Less than $50,000 | 72 (33.0%) | 64 (17.7%) |
| $50,000 to $99,999 | 111 (50.9%) | 270 (74.8%) |
| $100,000 to $299,999 | 20 (9.2%) | 27 (7.5%) |
| $300,000 to $499,999 | 0 (0.0%) | 0 (0.0%) |
| $500,000 to $749,999 | 0 (0.0%) | 0 (0.0%) |
| $750,000 to $999,999 | 0 (0.0%) | 0 (0.0%) |
| $1,000,000 or more | 15 (6.9%) | 0 (0.0%) |
| Total | 218 (100.0%) | 361 (100.0%) |
Household Income by Mortgage Status in Mamou
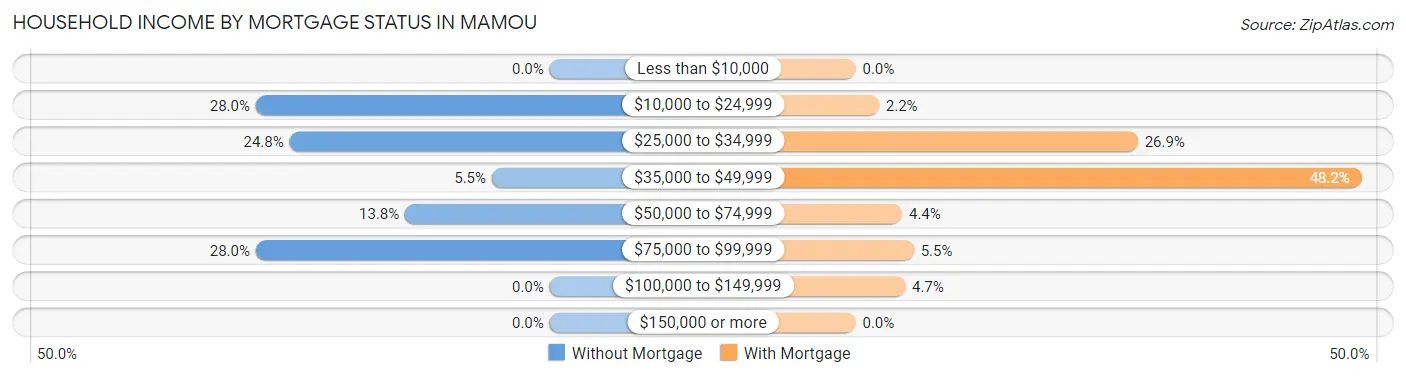
| Household Income | Without Mortgage | With Mortgage |
| Less than $10,000 | 0 (0.0%) | 0 (0.0%) |
| $10,000 to $24,999 | 61 (28.0%) | 8 (2.2%) |
| $25,000 to $34,999 | 54 (24.8%) | 97 (26.9%) |
| $35,000 to $49,999 | 12 (5.5%) | 174 (48.2%) |
| $50,000 to $74,999 | 30 (13.8%) | 16 (4.4%) |
| $75,000 to $99,999 | 61 (28.0%) | 20 (5.5%) |
| $100,000 to $149,999 | 0 (0.0%) | 17 (4.7%) |
| $150,000 or more | 0 (0.0%) | 0 (0.0%) |
| Total | 218 (100.0%) | 361 (100.0%) |
Property Value to Household Income Ratio in Mamou
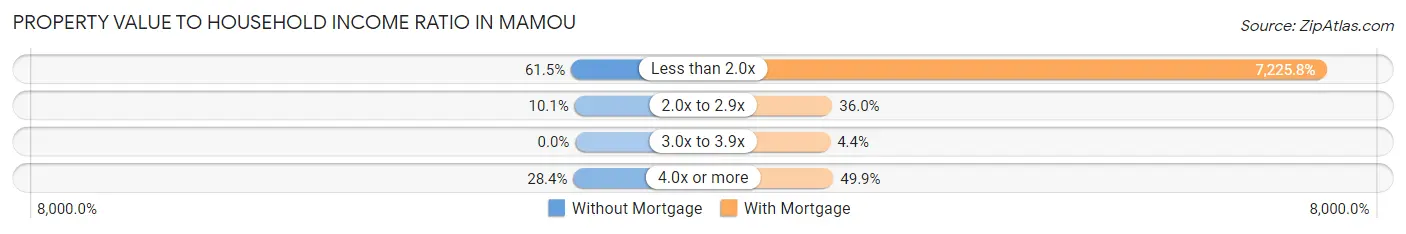
| Value-to-Income Ratio | Without Mortgage | With Mortgage |
| Less than 2.0x | 134 (61.5%) | 26,085 (7,225.8%) |
| 2.0x to 2.9x | 22 (10.1%) | 130 (36.0%) |
| 3.0x to 3.9x | 0 (0.0%) | 16 (4.4%) |
| 4.0x or more | 62 (28.4%) | 180 (49.9%) |
| Total | 218 (100.0%) | 361 (100.0%) |
Real Estate Taxes by Mortgage Status in Mamou
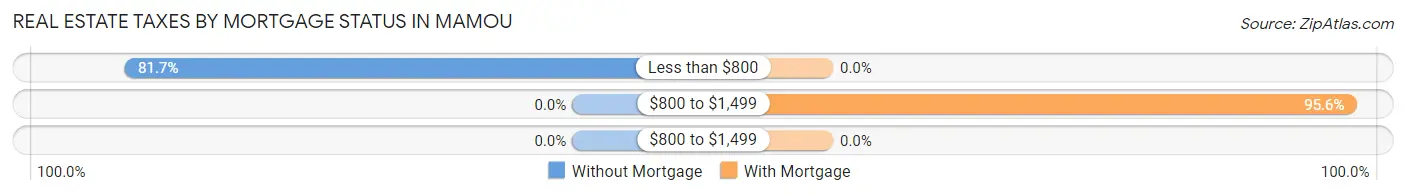
| Property Taxes | Without Mortgage | With Mortgage |
| Less than $800 | 178 (81.7%) | 0 (0.0%) |
| $800 to $1,499 | 0 (0.0%) | 345 (95.6%) |
| $800 to $1,499 | 0 (0.0%) | 0 (0.0%) |
| Total | 218 (100.0%) | 361 (100.0%) |
Health & Disability in Mamou
Health Insurance Coverage by Age in Mamou
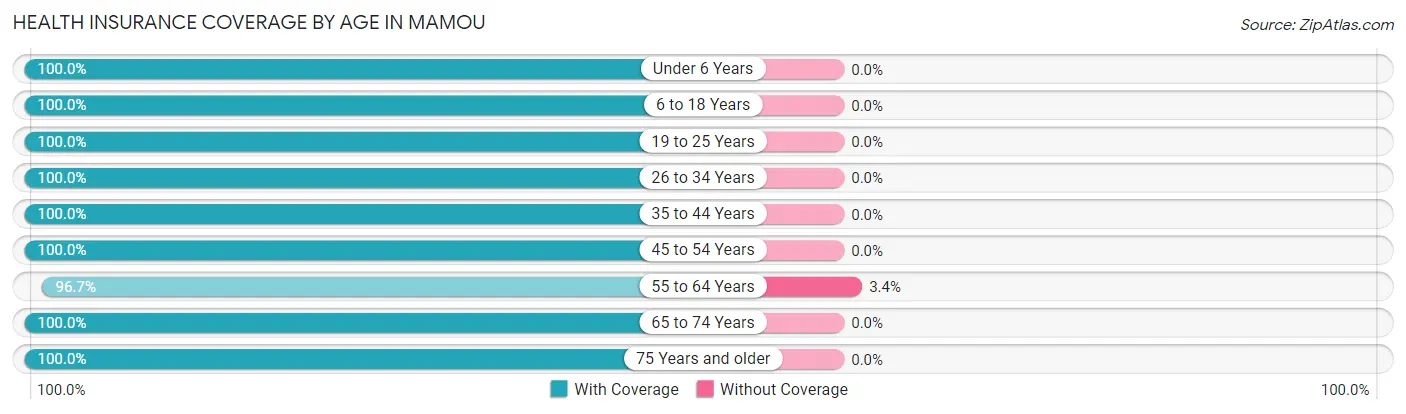
| Age Bracket | With Coverage | Without Coverage |
| Under 6 Years | 321 (100.0%) | 0 (0.0%) |
| 6 to 18 Years | 568 (100.0%) | 0 (0.0%) |
| 19 to 25 Years | 447 (100.0%) | 0 (0.0%) |
| 26 to 34 Years | 124 (100.0%) | 0 (0.0%) |
| 35 to 44 Years | 506 (100.0%) | 0 (0.0%) |
| 45 to 54 Years | 168 (100.0%) | 0 (0.0%) |
| 55 to 64 Years | 346 (96.7%) | 12 (3.4%) |
| 65 to 74 Years | 279 (100.0%) | 0 (0.0%) |
| 75 Years and older | 80 (100.0%) | 0 (0.0%) |
| Total | 2,839 (99.6%) | 12 (0.4%) |
Health Insurance Coverage by Citizenship Status in Mamou
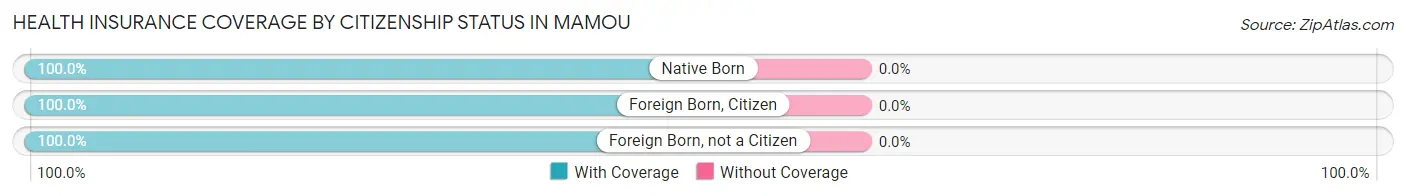
| Citizenship Status | With Coverage | Without Coverage |
| Native Born | 321 (100.0%) | 0 (0.0%) |
| Foreign Born, Citizen | 568 (100.0%) | 0 (0.0%) |
| Foreign Born, not a Citizen | 447 (100.0%) | 0 (0.0%) |
Health Insurance Coverage by Household Income in Mamou
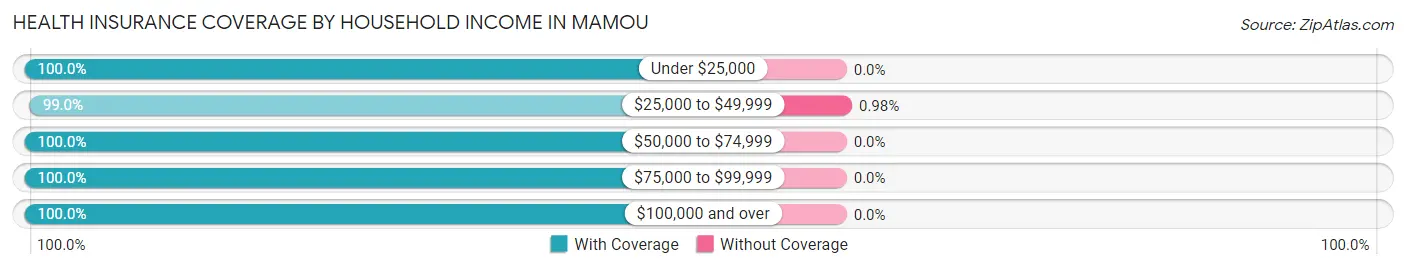
| Household Income | With Coverage | Without Coverage |
| Under $25,000 | 1,025 (100.0%) | 0 (0.0%) |
| $25,000 to $49,999 | 1,212 (99.0%) | 12 (1.0%) |
| $50,000 to $74,999 | 218 (100.0%) | 0 (0.0%) |
| $75,000 to $99,999 | 322 (100.0%) | 0 (0.0%) |
| $100,000 and over | 54 (100.0%) | 0 (0.0%) |
Public vs Private Health Insurance Coverage by Age in Mamou
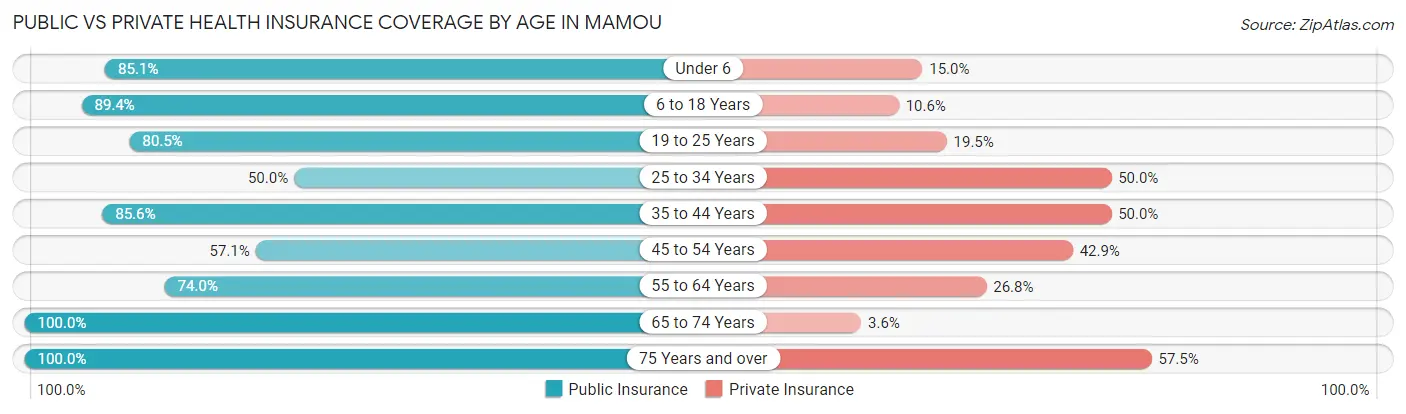
| Age Bracket | Public Insurance | Private Insurance |
| Under 6 | 273 (85.1%) | 48 (14.9%) |
| 6 to 18 Years | 508 (89.4%) | 60 (10.6%) |
| 19 to 25 Years | 360 (80.5%) | 87 (19.5%) |
| 25 to 34 Years | 62 (50.0%) | 62 (50.0%) |
| 35 to 44 Years | 433 (85.6%) | 253 (50.0%) |
| 45 to 54 Years | 96 (57.1%) | 72 (42.9%) |
| 55 to 64 Years | 265 (74.0%) | 96 (26.8%) |
| 65 to 74 Years | 279 (100.0%) | 10 (3.6%) |
| 75 Years and over | 80 (100.0%) | 46 (57.5%) |
| Total | 2,356 (82.6%) | 734 (25.8%) |
Disability Status by Sex by Age in Mamou
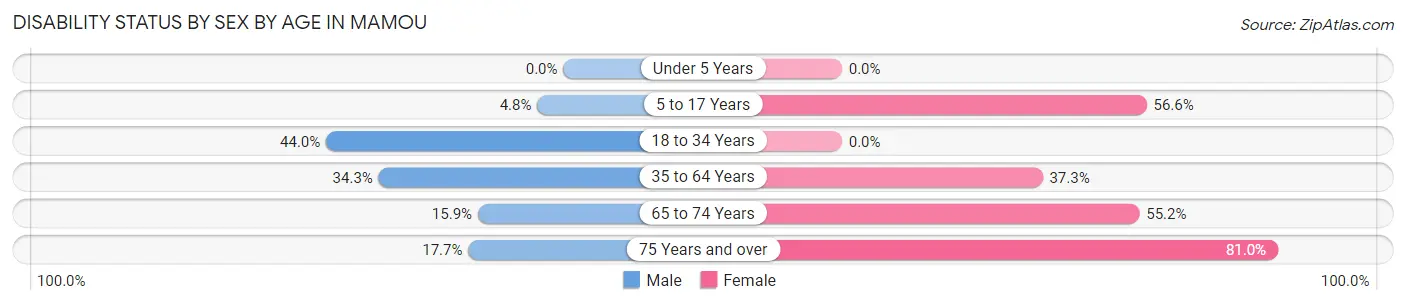
| Age Bracket | Male | Female |
| Under 5 Years | 0 (0.0%) | 0 (0.0%) |
| 5 to 17 Years | 19 (4.8%) | 99 (56.6%) |
| 18 to 34 Years | 144 (44.0%) | 0 (0.0%) |
| 35 to 64 Years | 109 (34.3%) | 266 (37.2%) |
| 65 to 74 Years | 23 (15.9%) | 74 (55.2%) |
| 75 Years and over | 3 (17.6%) | 51 (80.9%) |
Disability Class by Sex by Age in Mamou
Disability Class: Hearing Difficulty
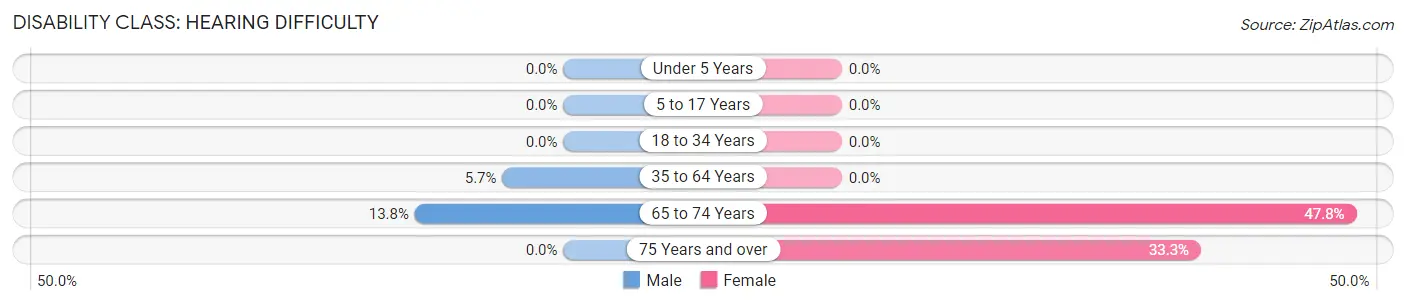
| Age Bracket | Male | Female |
| Under 5 Years | 0 (0.0%) | 0 (0.0%) |
| 5 to 17 Years | 0 (0.0%) | 0 (0.0%) |
| 18 to 34 Years | 0 (0.0%) | 0 (0.0%) |
| 35 to 64 Years | 18 (5.7%) | 0 (0.0%) |
| 65 to 74 Years | 20 (13.8%) | 64 (47.8%) |
| 75 Years and over | 0 (0.0%) | 21 (33.3%) |
Disability Class: Vision Difficulty
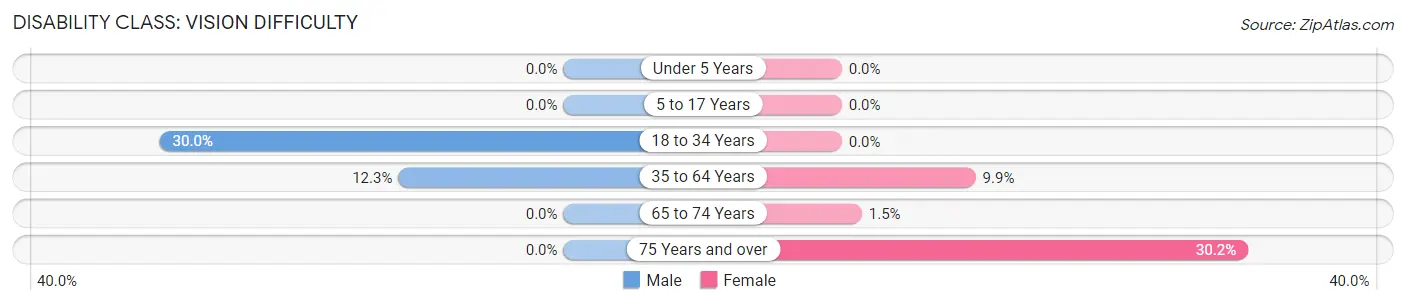
| Age Bracket | Male | Female |
| Under 5 Years | 0 (0.0%) | 0 (0.0%) |
| 5 to 17 Years | 0 (0.0%) | 0 (0.0%) |
| 18 to 34 Years | 98 (30.0%) | 0 (0.0%) |
| 35 to 64 Years | 39 (12.3%) | 71 (9.9%) |
| 65 to 74 Years | 0 (0.0%) | 2 (1.5%) |
| 75 Years and over | 0 (0.0%) | 19 (30.2%) |
Disability Class: Cognitive Difficulty
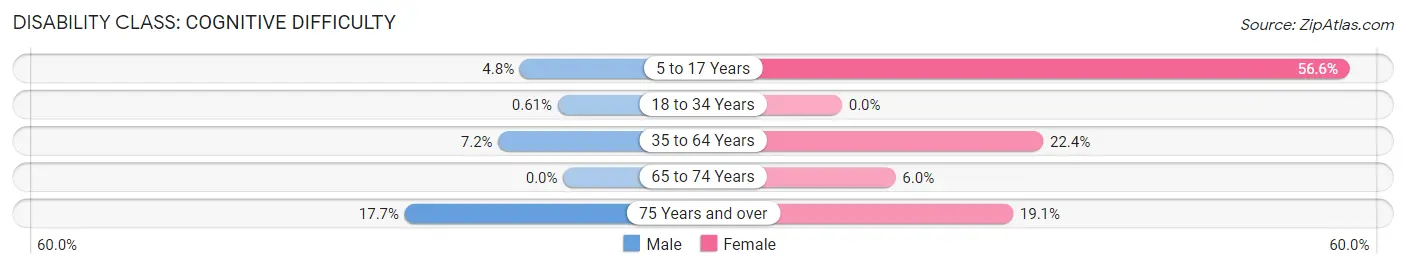
| Age Bracket | Male | Female |
| 5 to 17 Years | 19 (4.8%) | 99 (56.6%) |
| 18 to 34 Years | 2 (0.6%) | 0 (0.0%) |
| 35 to 64 Years | 23 (7.2%) | 160 (22.4%) |
| 65 to 74 Years | 0 (0.0%) | 8 (6.0%) |
| 75 Years and over | 3 (17.6%) | 12 (19.1%) |
Disability Class: Ambulatory Difficulty
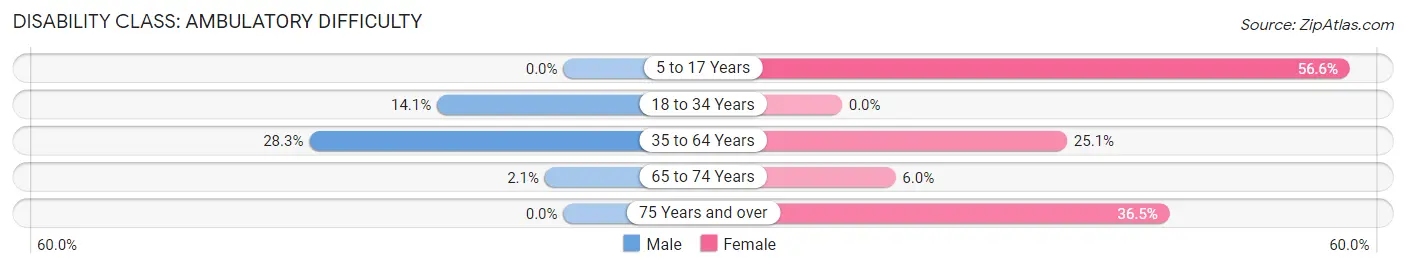
| Age Bracket | Male | Female |
| 5 to 17 Years | 0 (0.0%) | 99 (56.6%) |
| 18 to 34 Years | 46 (14.1%) | 0 (0.0%) |
| 35 to 64 Years | 90 (28.3%) | 179 (25.1%) |
| 65 to 74 Years | 3 (2.1%) | 8 (6.0%) |
| 75 Years and over | 0 (0.0%) | 23 (36.5%) |
Disability Class: Self-Care Difficulty
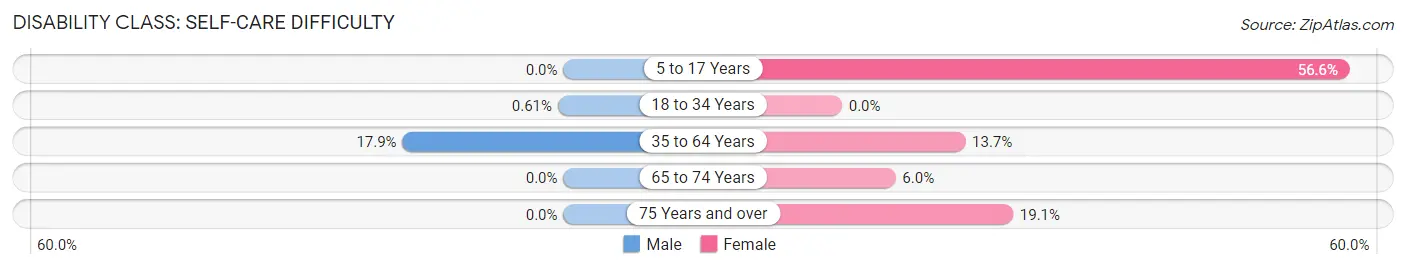
| Age Bracket | Male | Female |
| 5 to 17 Years | 0 (0.0%) | 99 (56.6%) |
| 18 to 34 Years | 2 (0.6%) | 0 (0.0%) |
| 35 to 64 Years | 57 (17.9%) | 98 (13.7%) |
| 65 to 74 Years | 0 (0.0%) | 8 (6.0%) |
| 75 Years and over | 0 (0.0%) | 12 (19.1%) |
Technology Access in Mamou
Computing Device Access in Mamou
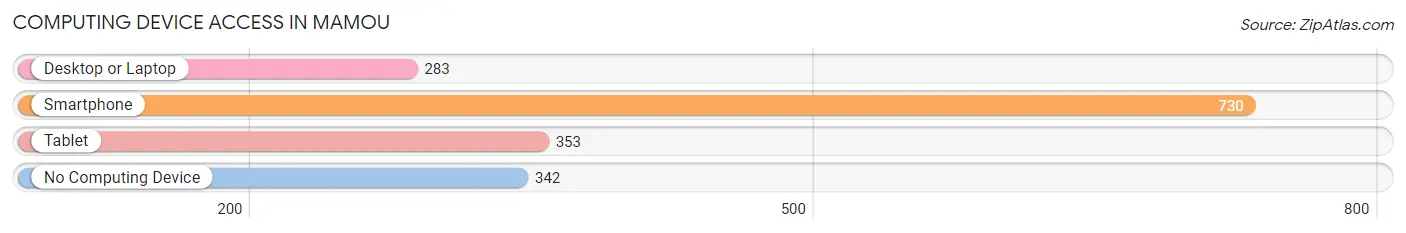
| Device Type | # Households | % Households |
| Desktop or Laptop | 283 | 24.7% |
| Smartphone | 730 | 63.8% |
| Tablet | 353 | 30.8% |
| No Computing Device | 342 | 29.9% |
| Total | 1,145 | 100.0% |
Internet Access in Mamou
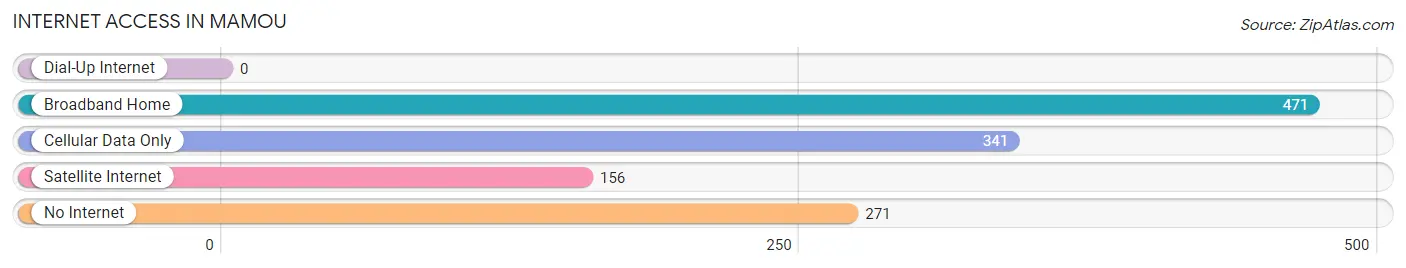
| Internet Type | # Households | % Households |
| Dial-Up Internet | 0 | 0.0% |
| Broadband Home | 471 | 41.1% |
| Cellular Data Only | 341 | 29.8% |
| Satellite Internet | 156 | 13.6% |
| No Internet | 271 | 23.7% |
| Total | 1,145 | 100.0% |
Mamou Summary
Mamou is a small town located in Evangeline Parish, Louisiana. It is situated in the heart of Cajun Country, and is known for its unique culture and history. The town has a population of approximately 3,000 people, and is home to a variety of businesses, including restaurants, retail stores, and other services.
History
Mamou was founded in 1883 by French-speaking settlers from Canada. The town was named after the Mamou River, which runs through the area. The town was originally a trading post, and the settlers quickly established a thriving economy based on the production of sugar cane, cotton, and other agricultural products.
In the early 1900s, Mamou became a popular destination for tourists, who were drawn to the town's unique culture and history. The town was also known for its music, which was heavily influenced by the Cajun culture.
In the 1950s, Mamou experienced a period of economic decline, as many of the town's businesses closed or moved away. However, the town has since experienced a resurgence, and is now home to a variety of businesses, including restaurants, retail stores, and other services.
Geography
Mamou is located in the heart of Cajun Country, in the southwestern part of Evangeline Parish. The town is situated on the Mamou River, and is surrounded by rolling hills and forests. The town is located approximately 30 miles from the city of Lafayette, and is accessible by car or bus.
Economy
Mamou's economy is largely based on agriculture, with sugar cane, cotton, and other crops being grown in the area. The town is also home to a variety of businesses, including restaurants, retail stores, and other services.
Demographics
As of the 2010 census, Mamou had a population of 3,074 people. The town is predominantly white, with approximately 75% of the population being of European descent. The town also has a small African American population, as well as a small Hispanic population. The median household income in Mamou is $30,000, and the median home value is $90,000.
Conclusion
Mamou is a small town located in Evangeline Parish, Louisiana. It is situated in the heart of Cajun Country, and is known for its unique culture and history. The town has a population of approximately 3,000 people, and is home to a variety of businesses, including restaurants, retail stores, and other services. The town's economy is largely based on agriculture, and the town is also home to a variety of businesses. The town is predominantly white, with approximately 75% of the population being of European descent.
Common Questions
What is Per Capita Income in Mamou?
Per Capita income in Mamou is $13,825.
What is the Median Family Income in Mamou?
Median Family Income in Mamou is $25,558.
What is the Median Household income in Mamou?
Median Household Income in Mamou is $23,310.
What is Income or Wage Gap in Mamou?
Income or Wage Gap in Mamou is 16.7%.
Women in Mamou earn 83.3 cents for every dollar earned by a man.
What is Inequality or Gini Index in Mamou?
Inequality or Gini Index in Mamou is 0.44.
What is the Total Population of Mamou?
Total Population of Mamou is 2,918.
What is the Total Male Population of Mamou?
Total Male Population of Mamou is 1,442.
What is the Total Female Population of Mamou?
Total Female Population of Mamou is 1,476.
What is the Ratio of Males per 100 Females in Mamou?
There are 97.70 Males per 100 Females in Mamou.
What is the Ratio of Females per 100 Males in Mamou?
There are 102.36 Females per 100 Males in Mamou.
What is the Median Population Age in Mamou?
Median Population Age in Mamou is 34.0 Years.
What is the Average Family Size in Mamou
Average Family Size in Mamou is 3.4 People.
What is the Average Household Size in Mamou
Average Household Size in Mamou is 2.5 People.
How Large is the Labor Force in Mamou?
There are 1,130 People in the Labor Forcein in Mamou.
What is the Percentage of People in the Labor Force in Mamou?
54.7% of People are in the Labor Force in Mamou.
What is the Unemployment Rate in Mamou?
Unemployment Rate in Mamou is 16.2%.