Madisonville, LA Map & Demographics
Madisonville Map
Madisonville Overview
$49,551
PER CAPITA INCOME
$109,844
AVG FAMILY INCOME
$108,281
AVG HOUSEHOLD INCOME
47.7%
WAGE / INCOME GAP [ % ]
52.3¢/ $1
WAGE / INCOME GAP [ $ ]
$12,221
FAMILY INCOME DEFICIT
0.41
INEQUALITY / GINI INDEX
981
TOTAL POPULATION
490
MALE POPULATION
491
FEMALE POPULATION
99.80
MALES / 100 FEMALES
100.20
FEMALES / 100 MALES
45.3
MEDIAN AGE
2.9
AVG FAMILY SIZE
2.5
AVG HOUSEHOLD SIZE
512
LABOR FORCE [ PEOPLE ]
63.1%
PERCENT IN LABOR FORCE
5.5%
UNEMPLOYMENT RATE
Madisonville Zip Codes
Madisonville Area Codes
Income in Madisonville
Income Overview in Madisonville
Per Capita Income in Madisonville is $49,551, while median incomes of families and households are $109,844 and $108,281 respectively.
| Characteristic | Number | Measure |
| Per Capita Income | 981 | $49,551 |
| Median Family Income | 281 | $109,844 |
| Mean Family Income | 281 | $134,963 |
| Median Household Income | 389 | $108,281 |
| Mean Household Income | 389 | $120,394 |
| Income Deficit | 281 | $12,221 |
| Wage / Income Gap (%) | 981 | 47.71% |
| Wage / Income Gap ($) | 981 | 52.29¢ per $1 |
| Gini / Inequality Index | 981 | 0.41 |
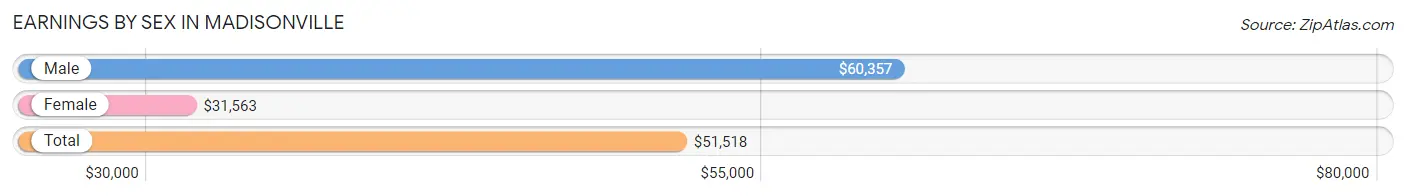
Earnings by Sex in Madisonville
Average Earnings in Madisonville are $51,518, $60,357 for men and $31,563 for women, a difference of 47.7%.
| Sex | Number | Average Earnings |
| Male | 322 (62.4%) | $60,357 |
| Female | 194 (37.6%) | $31,563 |
| Total | 516 (100.0%) | $51,518 |
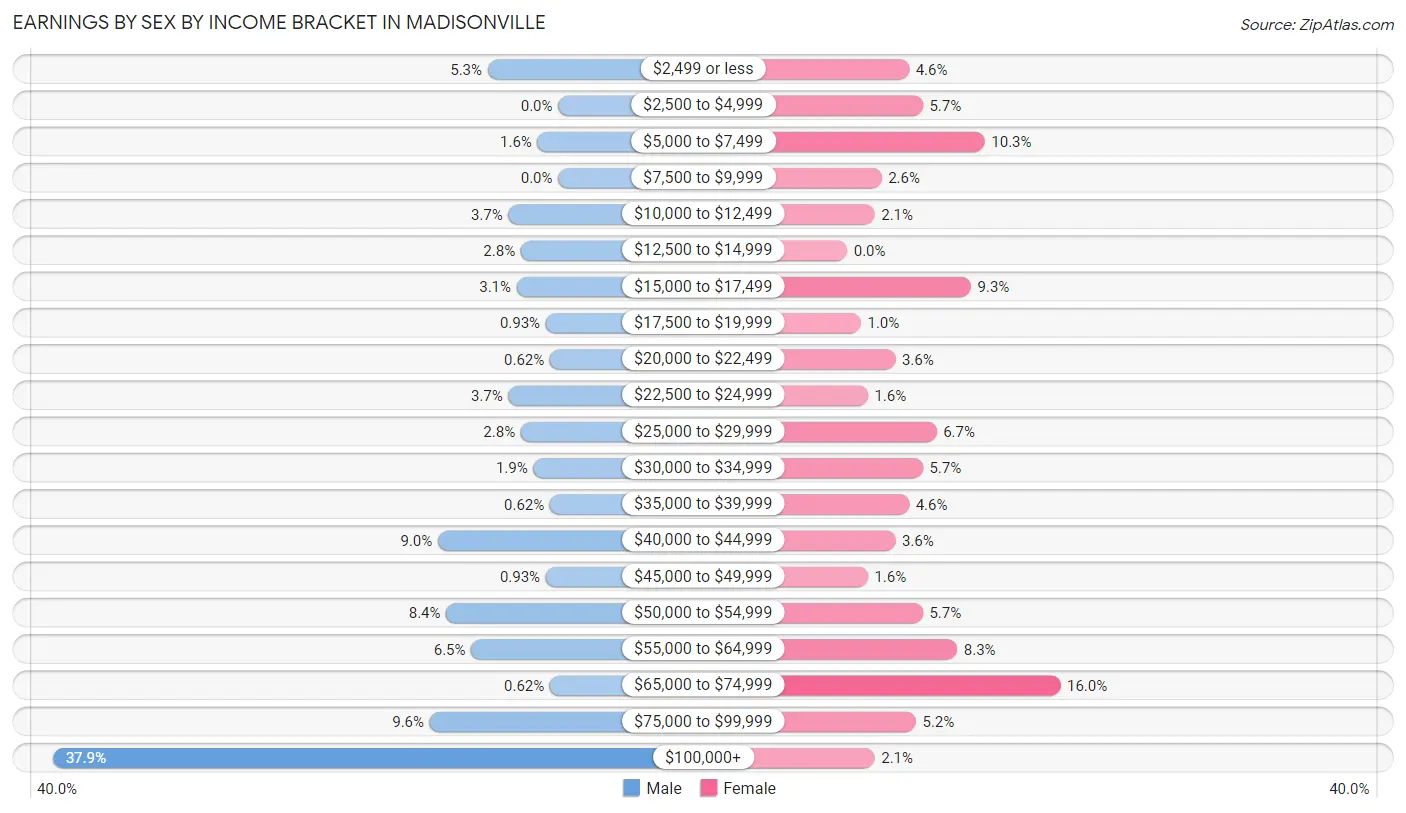
Earnings by Sex by Income Bracket in Madisonville
The most common earnings brackets in Madisonville are $100,000+ for men (122 | 37.9%) and $65,000 to $74,999 for women (31 | 16.0%).
| Income | Male | Female |
| $2,499 or less | 17 (5.3%) | 9 (4.6%) |
| $2,500 to $4,999 | 0 (0.0%) | 11 (5.7%) |
| $5,000 to $7,499 | 5 (1.5%) | 20 (10.3%) |
| $7,500 to $9,999 | 0 (0.0%) | 5 (2.6%) |
| $10,000 to $12,499 | 12 (3.7%) | 4 (2.1%) |
| $12,500 to $14,999 | 9 (2.8%) | 0 (0.0%) |
| $15,000 to $17,499 | 10 (3.1%) | 18 (9.3%) |
| $17,500 to $19,999 | 3 (0.9%) | 2 (1.0%) |
| $20,000 to $22,499 | 2 (0.6%) | 7 (3.6%) |
| $22,500 to $24,999 | 12 (3.7%) | 3 (1.5%) |
| $25,000 to $29,999 | 9 (2.8%) | 13 (6.7%) |
| $30,000 to $34,999 | 6 (1.9%) | 11 (5.7%) |
| $35,000 to $39,999 | 2 (0.6%) | 9 (4.6%) |
| $40,000 to $44,999 | 29 (9.0%) | 7 (3.6%) |
| $45,000 to $49,999 | 3 (0.9%) | 3 (1.5%) |
| $50,000 to $54,999 | 27 (8.4%) | 11 (5.7%) |
| $55,000 to $64,999 | 21 (6.5%) | 16 (8.3%) |
| $65,000 to $74,999 | 2 (0.6%) | 31 (16.0%) |
| $75,000 to $99,999 | 31 (9.6%) | 10 (5.1%) |
| $100,000+ | 122 (37.9%) | 4 (2.1%) |
| Total | 322 (100.0%) | 194 (100.0%) |
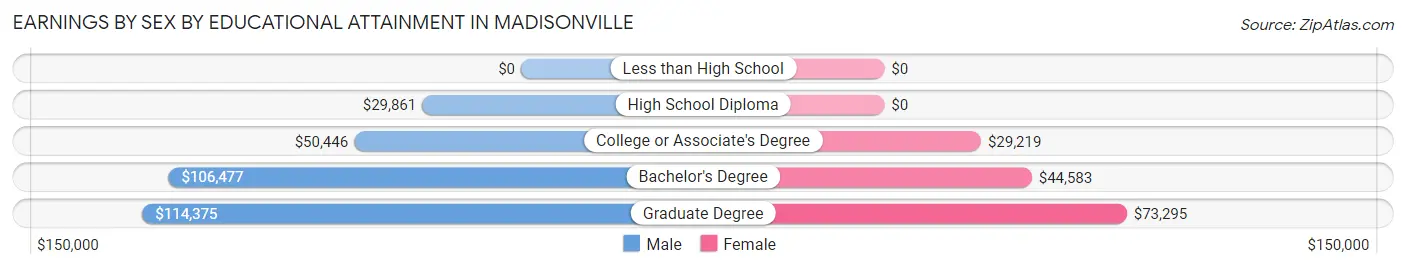
Earnings by Sex by Educational Attainment in Madisonville
Average earnings in Madisonville are $81,250 for men and $40,625 for women, a difference of 50.0%. Men with an educational attainment of graduate degree enjoy the highest average annual earnings of $114,375, while those with high school diploma education earn the least with $29,861. Women with an educational attainment of graduate degree earn the most with the average annual earnings of $73,295, while those with college or associate's degree education have the smallest earnings of $29,219.
| Educational Attainment | Male Income | Female Income |
| Less than High School | - | - |
| High School Diploma | $29,861 | $0 |
| College or Associate's Degree | $50,446 | $29,219 |
| Bachelor's Degree | $106,477 | $44,583 |
| Graduate Degree | $114,375 | $73,295 |
| Total | $81,250 | $40,625 |
Family Income in Madisonville
Family Income Brackets in Madisonville
According to the Madisonville family income data, there are 62 families falling into the $200,000+ income range, which is the most common income bracket and makes up 22.1% of all families. Conversely, the $15,000 to $24,999 income bracket is the least frequent group with only 2 families (0.7%) belonging to this category.
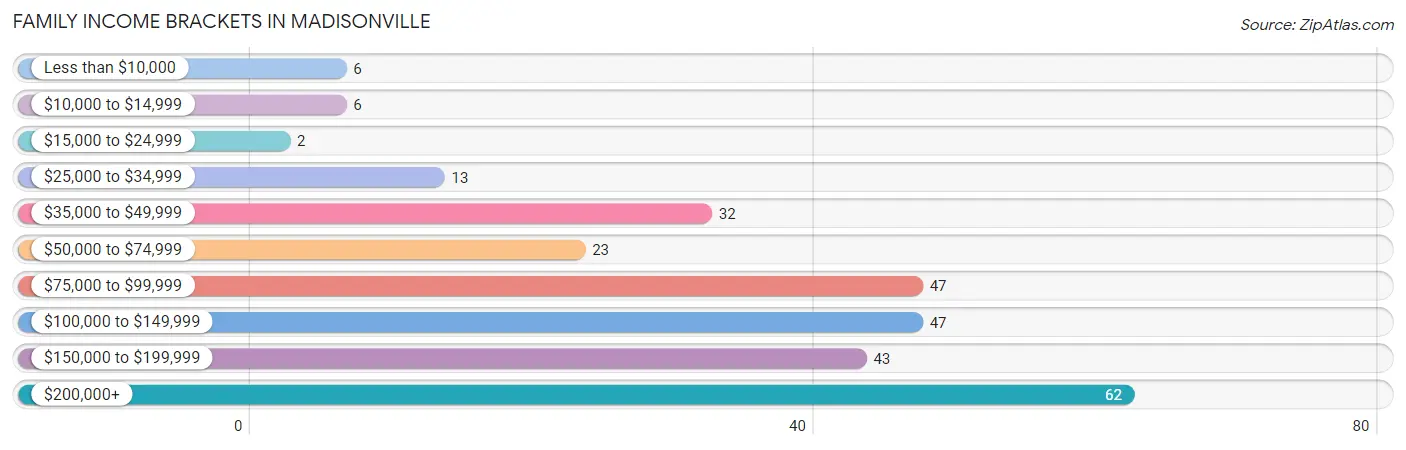
| Income Bracket | # Families | % Families |
| Less than $10,000 | 6 | 2.1% |
| $10,000 to $14,999 | 6 | 2.1% |
| $15,000 to $24,999 | 2 | 0.7% |
| $25,000 to $34,999 | 13 | 4.6% |
| $35,000 to $49,999 | 32 | 11.4% |
| $50,000 to $74,999 | 23 | 8.2% |
| $75,000 to $99,999 | 47 | 16.7% |
| $100,000 to $149,999 | 47 | 16.7% |
| $150,000 to $199,999 | 43 | 15.3% |
| $200,000+ | 62 | 22.1% |
Family Income by Famaliy Size in Madisonville
6-person families (9 | 3.2%) account for the highest median family income in Madisonville with $181,563 per family, while 3-person families (85 | 30.2%) have the highest median income of $58,906 per family member.
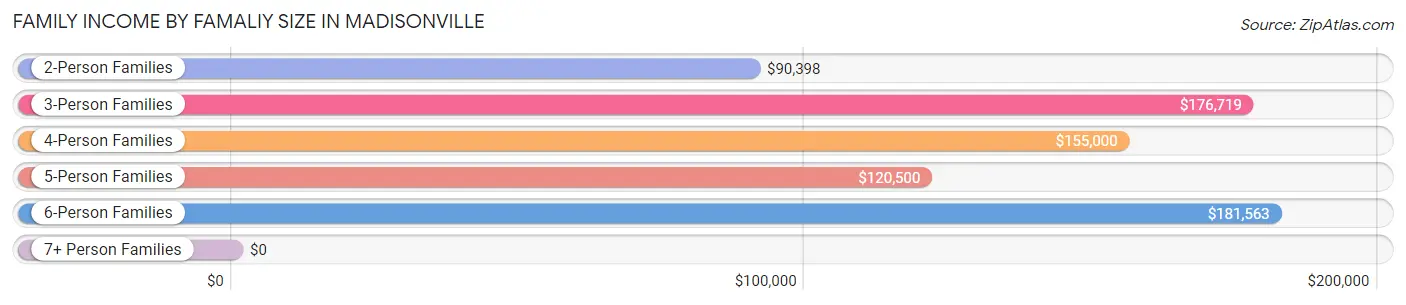
| Income Bracket | # Families | Median Income |
| 2-Person Families | 135 (48.0%) | $90,398 |
| 3-Person Families | 85 (30.2%) | $176,719 |
| 4-Person Families | 36 (12.8%) | $155,000 |
| 5-Person Families | 14 (5.0%) | $120,500 |
| 6-Person Families | 9 (3.2%) | $181,563 |
| 7+ Person Families | 2 (0.7%) | $0 |
| Total | 281 (100.0%) | $109,844 |
Family Income by Number of Earners in Madisonville
The median family income in Madisonville is $109,844, with families comprising 3+ earners (20) having the highest median family income of $176,563, while families with no earners (41) have the lowest median family income of $48,854, accounting for 7.1% and 14.6% of families, respectively.
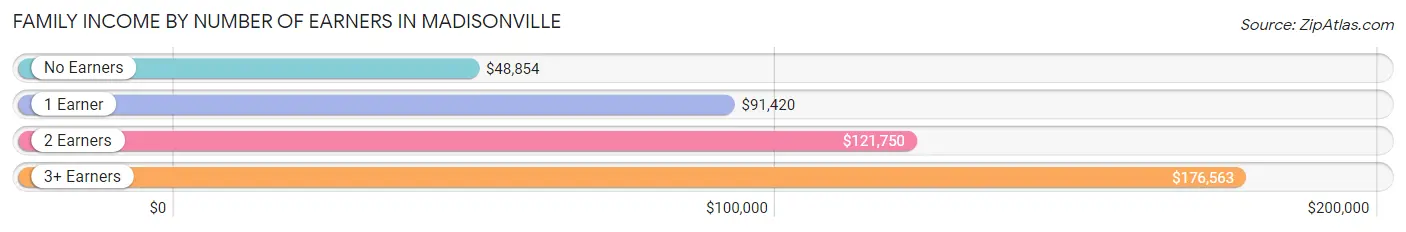
| Number of Earners | # Families | Median Income |
| No Earners | 41 (14.6%) | $48,854 |
| 1 Earner | 115 (40.9%) | $91,420 |
| 2 Earners | 105 (37.4%) | $121,750 |
| 3+ Earners | 20 (7.1%) | $176,563 |
| Total | 281 (100.0%) | $109,844 |
Household Income in Madisonville
Household Income Brackets in Madisonville
With 75 households falling in the category, the $100,000 to $149,999 income range is the most frequent in Madisonville, accounting for 19.3% of all households. In contrast, only 6 households (1.5%) fall into the $10,000 to $14,999 income bracket, making it the least populous group.
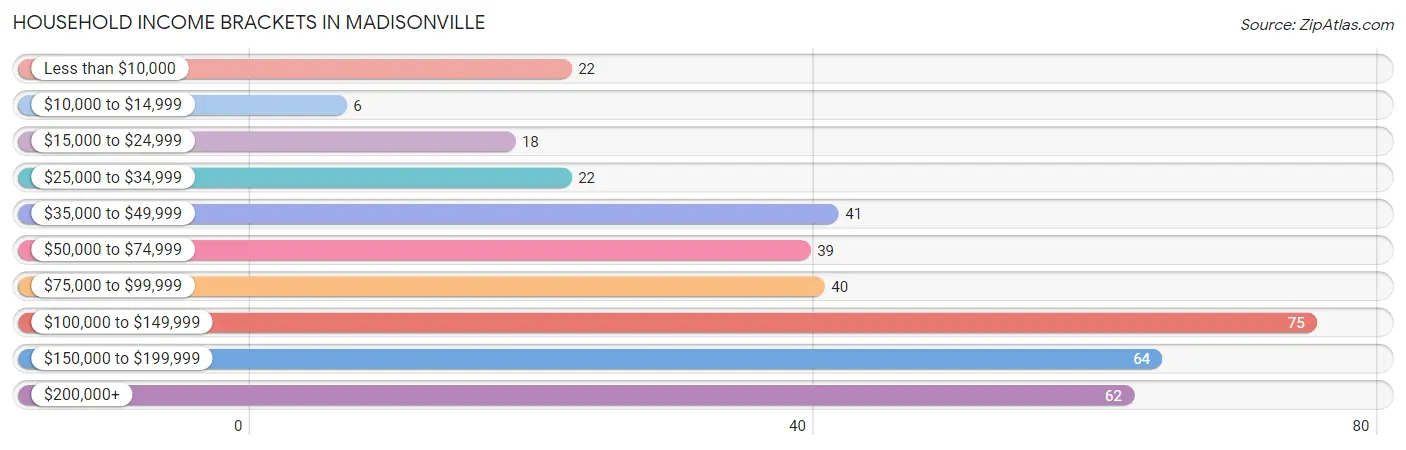
| Income Bracket | # Households | % Households |
| Less than $10,000 | 22 | 5.7% |
| $10,000 to $14,999 | 6 | 1.5% |
| $15,000 to $24,999 | 18 | 4.6% |
| $25,000 to $34,999 | 22 | 5.7% |
| $35,000 to $49,999 | 41 | 10.5% |
| $50,000 to $74,999 | 39 | 10.0% |
| $75,000 to $99,999 | 40 | 10.3% |
| $100,000 to $149,999 | 75 | 19.3% |
| $150,000 to $199,999 | 64 | 16.5% |
| $200,000+ | 62 | 15.9% |
Household Income by Householder Age in Madisonville
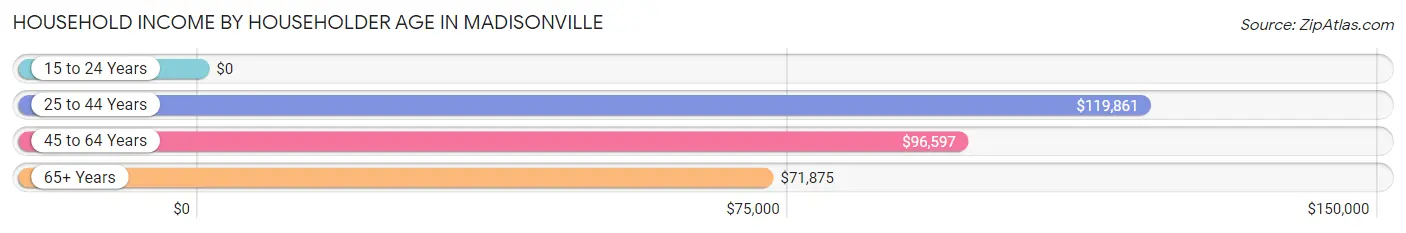
The median household income in Madisonville is $108,281, with the highest median household income of $119,861 found in the 25 to 44 years age bracket for the primary householder. A total of 77 households (19.8%) fall into this category.
| Income Bracket | # Households | Median Income |
| 15 to 24 Years | 0 (0.0%) | $0 |
| 25 to 44 Years | 77 (19.8%) | $119,861 |
| 45 to 64 Years | 229 (58.9%) | $96,597 |
| 65+ Years | 83 (21.3%) | $71,875 |
| Total | 389 (100.0%) | $108,281 |
Poverty in Madisonville
Income Below Poverty by Sex and Age in Madisonville
With 7.1% poverty level for males and 7.2% for females among the residents of Madisonville, 12 to 14 year old males and 16 and 17 year old females are the most vulnerable to poverty, with 5 males (50.0%) and 9 females (69.2%) in their respective age groups living below the poverty level.
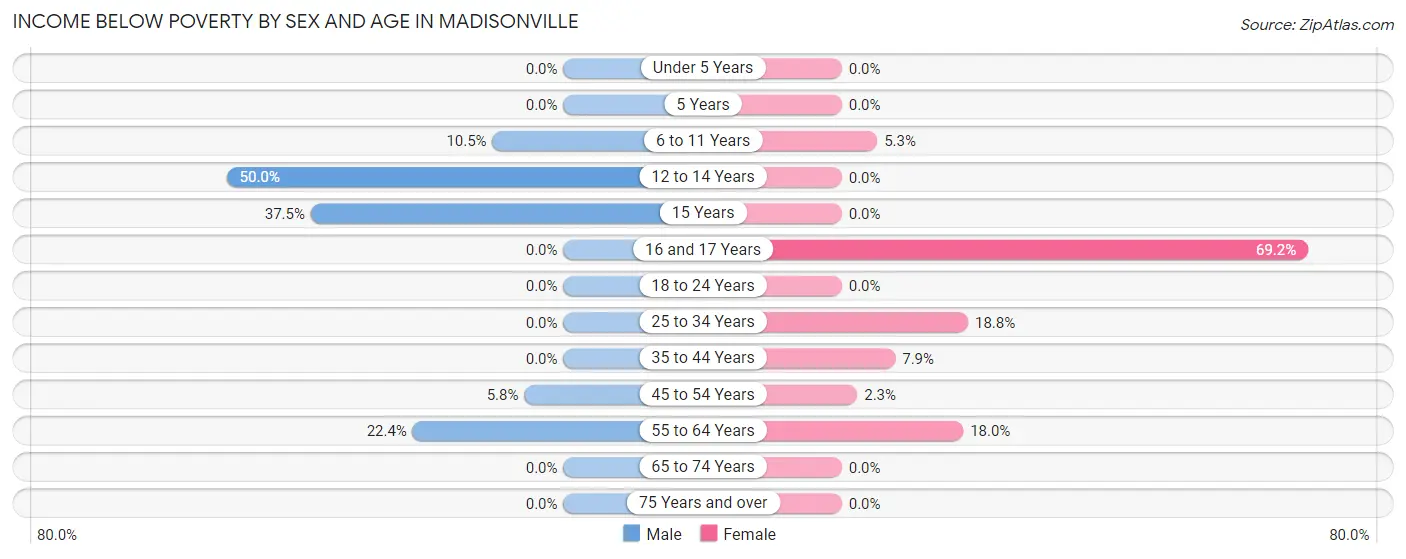
| Age Bracket | Male | Female |
| Under 5 Years | 0 (0.0%) | 0 (0.0%) |
| 5 Years | 0 (0.0%) | 0 (0.0%) |
| 6 to 11 Years | 2 (10.5%) | 2 (5.3%) |
| 12 to 14 Years | 5 (50.0%) | 0 (0.0%) |
| 15 Years | 3 (37.5%) | 0 (0.0%) |
| 16 and 17 Years | 0 (0.0%) | 9 (69.2%) |
| 18 to 24 Years | 0 (0.0%) | 0 (0.0%) |
| 25 to 34 Years | 0 (0.0%) | 6 (18.8%) |
| 35 to 44 Years | 0 (0.0%) | 5 (7.9%) |
| 45 to 54 Years | 8 (5.8%) | 2 (2.3%) |
| 55 to 64 Years | 17 (22.4%) | 11 (18.0%) |
| 65 to 74 Years | 0 (0.0%) | 0 (0.0%) |
| 75 Years and over | 0 (0.0%) | 0 (0.0%) |
| Total | 35 (7.1%) | 35 (7.2%) |
Income Above Poverty by Sex and Age in Madisonville
According to the poverty statistics in Madisonville, males aged under 5 years and females aged under 5 years are the age groups that are most secure financially, with 100.0% of males and 100.0% of females in these age groups living above the poverty line.
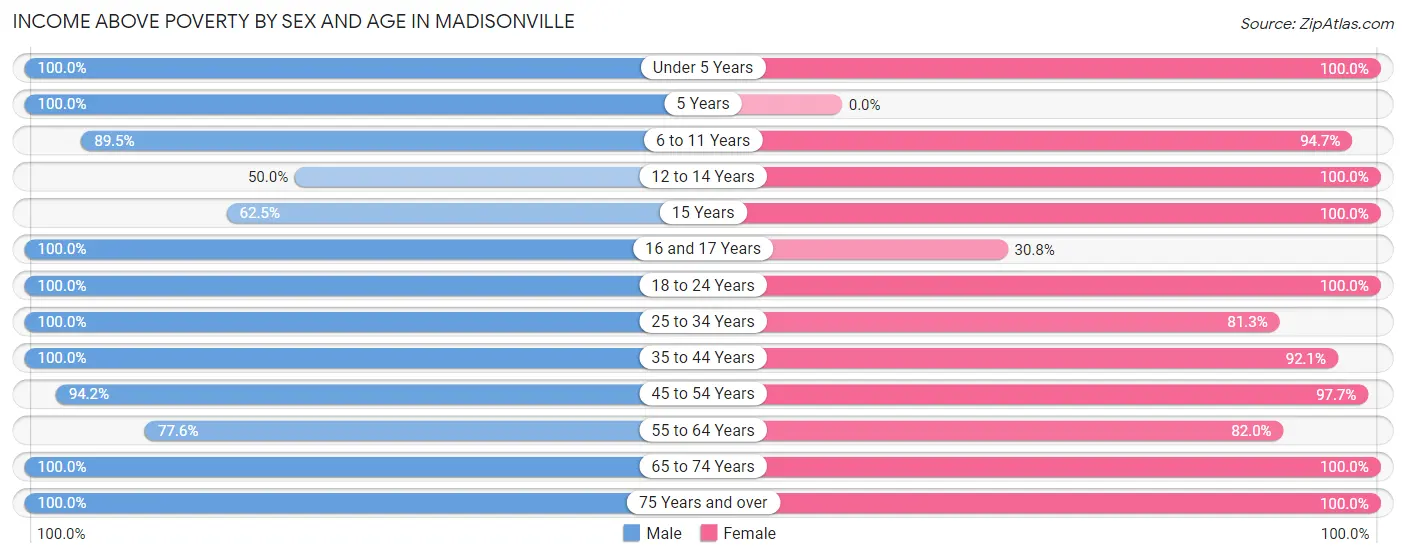
| Age Bracket | Male | Female |
| Under 5 Years | 17 (100.0%) | 15 (100.0%) |
| 5 Years | 17 (100.0%) | 0 (0.0%) |
| 6 to 11 Years | 17 (89.5%) | 36 (94.7%) |
| 12 to 14 Years | 5 (50.0%) | 25 (100.0%) |
| 15 Years | 5 (62.5%) | 14 (100.0%) |
| 16 and 17 Years | 8 (100.0%) | 4 (30.8%) |
| 18 to 24 Years | 37 (100.0%) | 65 (100.0%) |
| 25 to 34 Years | 42 (100.0%) | 26 (81.2%) |
| 35 to 44 Years | 54 (100.0%) | 58 (92.1%) |
| 45 to 54 Years | 130 (94.2%) | 85 (97.7%) |
| 55 to 64 Years | 59 (77.6%) | 50 (82.0%) |
| 65 to 74 Years | 47 (100.0%) | 48 (100.0%) |
| 75 Years and over | 17 (100.0%) | 23 (100.0%) |
| Total | 455 (92.9%) | 449 (92.8%) |
Income Below Poverty Among Married-Couple Families in Madisonville
The poverty statistics for married-couple families in Madisonville show that 7.0% or 14 of the total 200 families live below the poverty line. Families with 5 or more children have the highest poverty rate of 100.0%, comprising of 2 families. On the other hand, families with 1 or 2 children have the lowest poverty rate of 0.0%, which includes 0 families.
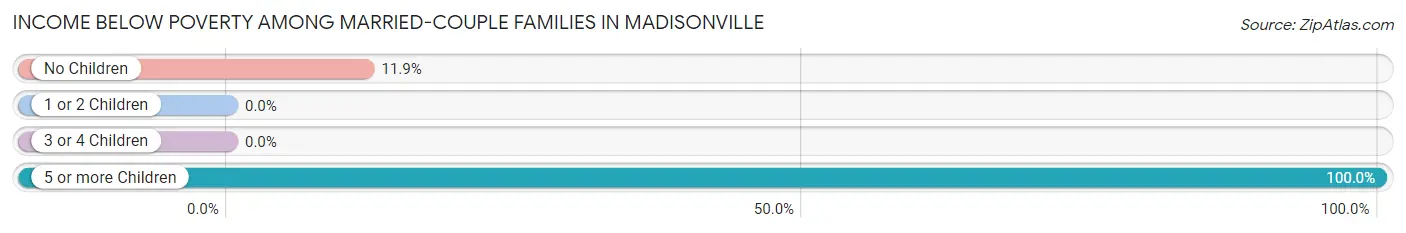
| Children | Above Poverty | Below Poverty |
| No Children | 89 (88.1%) | 12 (11.9%) |
| 1 or 2 Children | 77 (100.0%) | 0 (0.0%) |
| 3 or 4 Children | 20 (100.0%) | 0 (0.0%) |
| 5 or more Children | 0 (0.0%) | 2 (100.0%) |
| Total | 186 (93.0%) | 14 (7.0%) |
Income Below Poverty Among Single-Parent Households in Madisonville
| Children | Single Father | Single Mother |
| No Children | 0 (0.0%) | 0 (0.0%) |
| 1 or 2 Children | 0 (0.0%) | 0 (0.0%) |
| 3 or 4 Children | 0 (0.0%) | 0 (0.0%) |
| 5 or more Children | 0 (0.0%) | 0 (0.0%) |
| Total | 0 (0.0%) | 0 (0.0%) |
Income Below Poverty Among Married-Couple vs Single-Parent Households in Madisonville
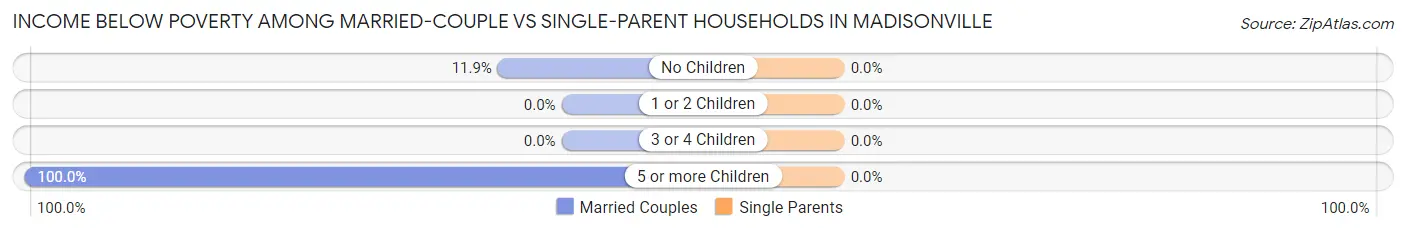
| Children | Married-Couple Families | Single-Parent Households |
| No Children | 12 (11.9%) | 0 (0.0%) |
| 1 or 2 Children | 0 (0.0%) | 0 (0.0%) |
| 3 or 4 Children | 0 (0.0%) | 0 (0.0%) |
| 5 or more Children | 2 (100.0%) | 0 (0.0%) |
| Total | 14 (7.0%) | 0 (0.0%) |
Race in Madisonville
The most populous races in Madisonville are White / Caucasian (898 | 91.5%), Black / African American (62 | 6.3%), and Hispanic or Latino (29 | 3.0%).
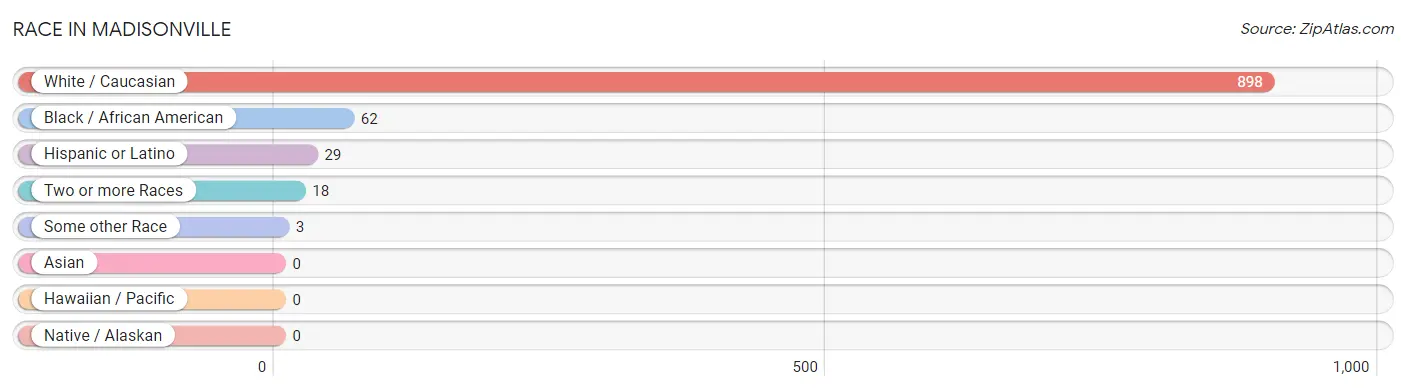
| Race | # Population | % Population |
| Asian | 0 | 0.0% |
| Black / African American | 62 | 6.3% |
| Hawaiian / Pacific | 0 | 0.0% |
| Hispanic or Latino | 29 | 3.0% |
| Native / Alaskan | 0 | 0.0% |
| White / Caucasian | 898 | 91.5% |
| Two or more Races | 18 | 1.8% |
| Some other Race | 3 | 0.3% |
| Total | 981 | 100.0% |
Ancestry in Madisonville
The most populous ancestries reported in Madisonville are English (194 | 19.8%), Italian (156 | 15.9%), Irish (152 | 15.5%), German (125 | 12.7%), and French (103 | 10.5%), together accounting for 74.4% of all Madisonville residents.
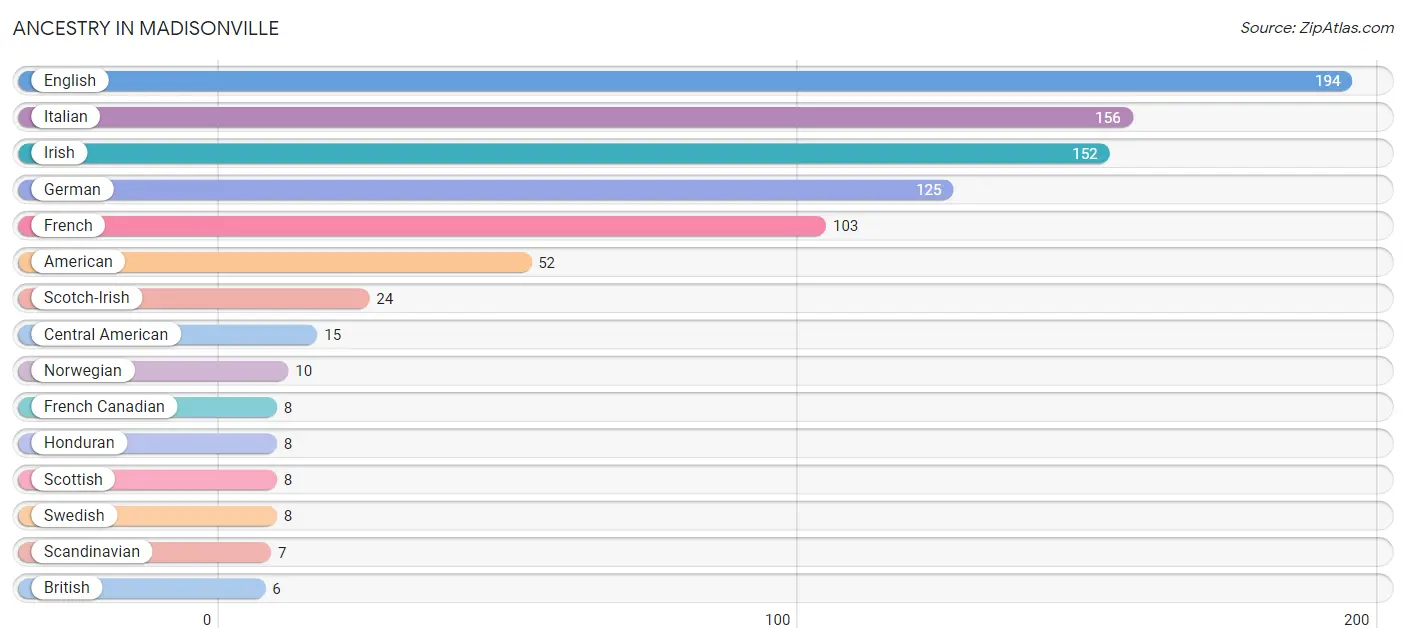
| Ancestry | # Population | % Population |
| American | 52 | 5.3% |
| Austrian | 2 | 0.2% |
| British | 6 | 0.6% |
| Bulgarian | 3 | 0.3% |
| Central American | 15 | 1.5% |
| Chilean | 4 | 0.4% |
| Costa Rican | 5 | 0.5% |
| Dutch | 5 | 0.5% |
| Eastern European | 6 | 0.6% |
| English | 194 | 19.8% |
| European | 6 | 0.6% |
| French | 103 | 10.5% |
| French Canadian | 8 | 0.8% |
| German | 125 | 12.7% |
| Honduran | 8 | 0.8% |
| Irish | 152 | 15.5% |
| Italian | 156 | 15.9% |
| Mexican | 6 | 0.6% |
| Norwegian | 10 | 1.0% |
| Polish | 5 | 0.5% |
| Portuguese | 4 | 0.4% |
| Scandinavian | 7 | 0.7% |
| Scotch-Irish | 24 | 2.5% |
| Scottish | 8 | 0.8% |
| South American | 4 | 0.4% |
| Spanish American | 4 | 0.4% |
| Swedish | 8 | 0.8% |
| Welsh | 4 | 0.4% | View All 28 Rows |
Immigrants in Madisonville
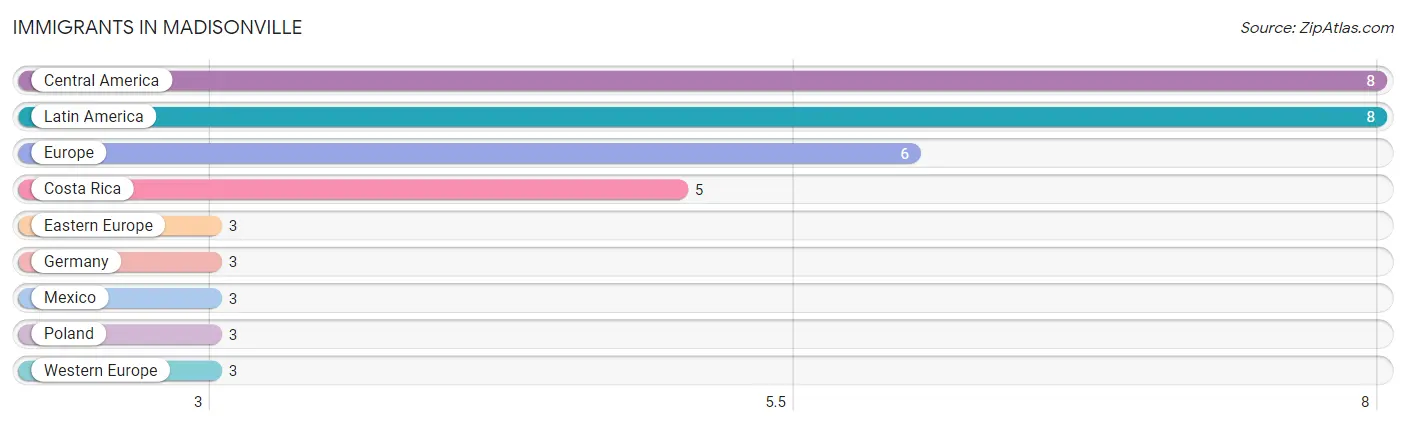
The most numerous immigrant groups reported in Madisonville came from Central America (8 | 0.8%), Latin America (8 | 0.8%), Europe (6 | 0.6%), Costa Rica (5 | 0.5%), and Eastern Europe (3 | 0.3%), together accounting for 3.1% of all Madisonville residents.
| Immigration Origin | # Population | % Population |
| Central America | 8 | 0.8% |
| Costa Rica | 5 | 0.5% |
| Eastern Europe | 3 | 0.3% |
| Europe | 6 | 0.6% |
| Germany | 3 | 0.3% |
| Latin America | 8 | 0.8% |
| Mexico | 3 | 0.3% |
| Poland | 3 | 0.3% |
| Western Europe | 3 | 0.3% | View All 9 Rows |
Sex and Age in Madisonville
Sex and Age in Madisonville
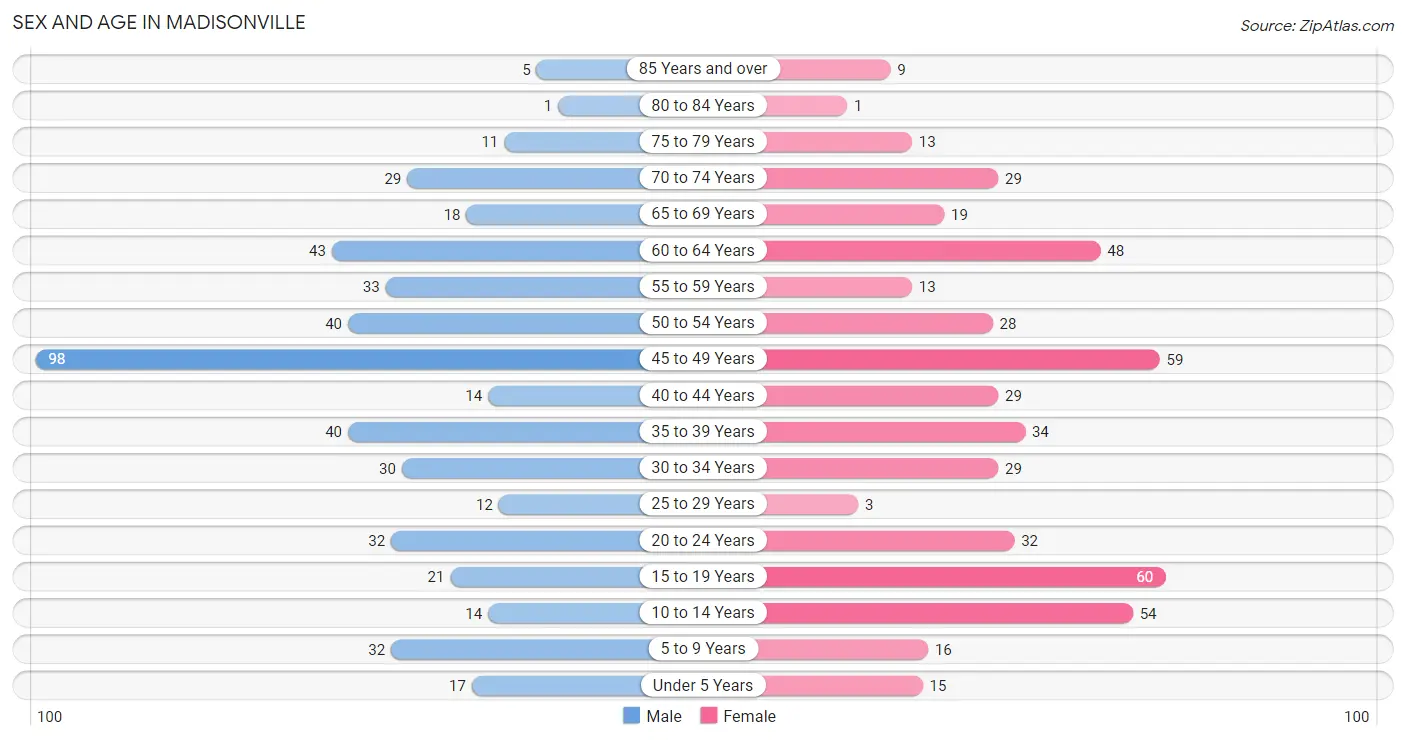
The most populous age groups in Madisonville are 45 to 49 Years (98 | 20.0%) for men and 15 to 19 Years (60 | 12.2%) for women.
| Age Bracket | Male | Female |
| Under 5 Years | 17 (3.5%) | 15 (3.0%) |
| 5 to 9 Years | 32 (6.5%) | 16 (3.3%) |
| 10 to 14 Years | 14 (2.9%) | 54 (11.0%) |
| 15 to 19 Years | 21 (4.3%) | 60 (12.2%) |
| 20 to 24 Years | 32 (6.5%) | 32 (6.5%) |
| 25 to 29 Years | 12 (2.5%) | 3 (0.6%) |
| 30 to 34 Years | 30 (6.1%) | 29 (5.9%) |
| 35 to 39 Years | 40 (8.2%) | 34 (6.9%) |
| 40 to 44 Years | 14 (2.9%) | 29 (5.9%) |
| 45 to 49 Years | 98 (20.0%) | 59 (12.0%) |
| 50 to 54 Years | 40 (8.2%) | 28 (5.7%) |
| 55 to 59 Years | 33 (6.7%) | 13 (2.6%) |
| 60 to 64 Years | 43 (8.8%) | 48 (9.8%) |
| 65 to 69 Years | 18 (3.7%) | 19 (3.9%) |
| 70 to 74 Years | 29 (5.9%) | 29 (5.9%) |
| 75 to 79 Years | 11 (2.2%) | 13 (2.6%) |
| 80 to 84 Years | 1 (0.2%) | 1 (0.2%) |
| 85 Years and over | 5 (1.0%) | 9 (1.8%) |
| Total | 490 (100.0%) | 491 (100.0%) |
Families and Households in Madisonville
Median Family Size in Madisonville
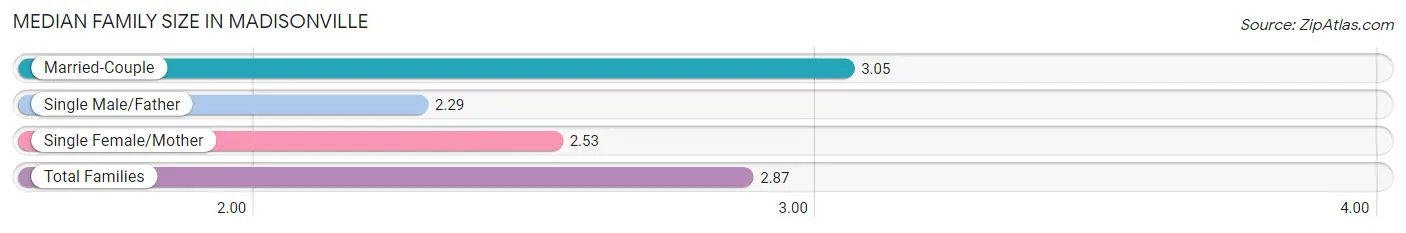
The median family size in Madisonville is 2.87 persons per family, with married-couple families (200 | 71.2%) accounting for the largest median family size of 3.05 persons per family. On the other hand, single male/father families (34 | 12.1%) represent the smallest median family size with 2.29 persons per family.
| Family Type | # Families | Family Size |
| Married-Couple | 200 (71.2%) | 3.05 |
| Single Male/Father | 34 (12.1%) | 2.29 |
| Single Female/Mother | 47 (16.7%) | 2.53 |
| Total Families | 281 (100.0%) | 2.87 |
Median Household Size in Madisonville
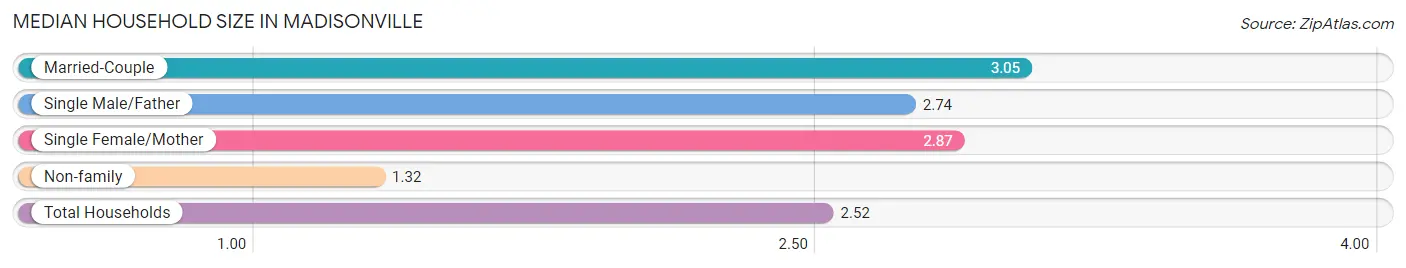
The median household size in Madisonville is 2.52 persons per household, with married-couple households (200 | 51.4%) accounting for the largest median household size of 3.05 persons per household. non-family households (108 | 27.8%) represent the smallest median household size with 1.32 persons per household.
| Household Type | # Households | Household Size |
| Married-Couple | 200 (51.4%) | 3.05 |
| Single Male/Father | 34 (8.7%) | 2.74 |
| Single Female/Mother | 47 (12.1%) | 2.87 |
| Non-family | 108 (27.8%) | 1.32 |
| Total Households | 389 (100.0%) | 2.52 |
Household Size by Marriage Status in Madisonville
Out of a total of 389 households in Madisonville, 281 (72.2%) are family households, while 108 (27.8%) are nonfamily households. The most numerous type of family households are 3-person households, comprising 121, and the most common type of nonfamily households are 1-person households, comprising 91.
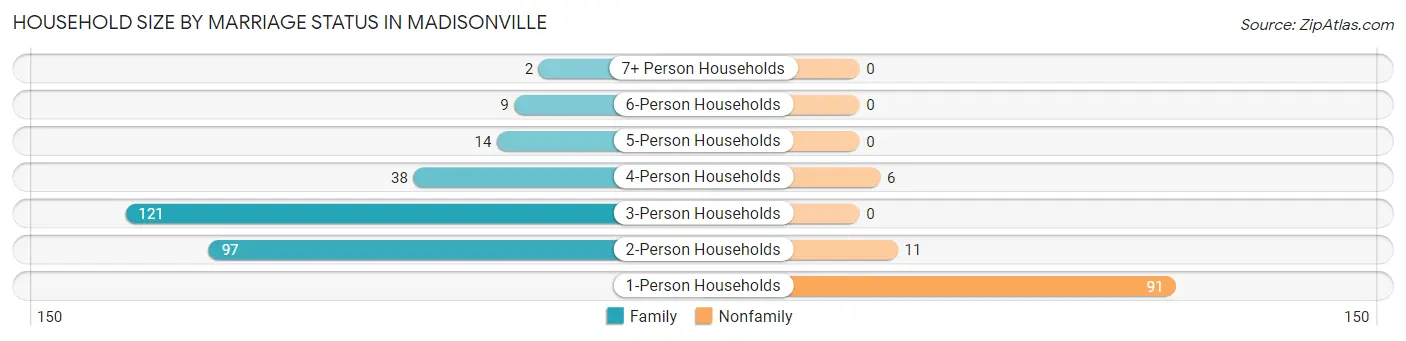
| Household Size | Family Households | Nonfamily Households |
| 1-Person Households | - | 91 (23.4%) |
| 2-Person Households | 97 (24.9%) | 11 (2.8%) |
| 3-Person Households | 121 (31.1%) | 0 (0.0%) |
| 4-Person Households | 38 (9.8%) | 6 (1.5%) |
| 5-Person Households | 14 (3.6%) | 0 (0.0%) |
| 6-Person Households | 9 (2.3%) | 0 (0.0%) |
| 7+ Person Households | 2 (0.5%) | 0 (0.0%) |
| Total | 281 (72.2%) | 108 (27.8%) |
Female Fertility in Madisonville
Fertility by Age in Madisonville
Average fertility rate in Madisonville is 73.0 births per 1,000 women. Women in the age bracket of 35 to 50 years have the highest fertility rate with 105.0 births per 1,000 women. Women in the age bracket of 35 to 50 years acount for 72.2% of all women with births.
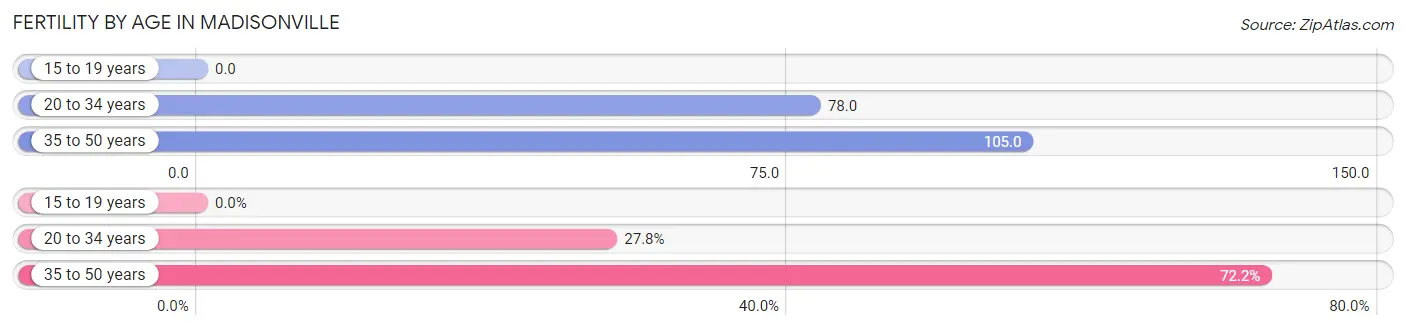
| Age Bracket | Women with Births | Births / 1,000 Women |
| 15 to 19 years | 0 (0.0%) | 0.0 |
| 20 to 34 years | 5 (27.8%) | 78.0 |
| 35 to 50 years | 13 (72.2%) | 105.0 |
| Total | 18 (100.0%) | 73.0 |
Fertility by Age by Marriage Status in Madisonville
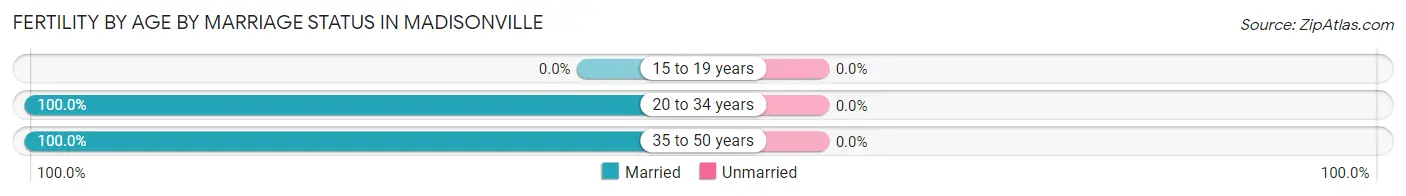
| Age Bracket | Married | Unmarried |
| 15 to 19 years | 0 (0.0%) | 0 (0.0%) |
| 20 to 34 years | 5 (100.0%) | 0 (0.0%) |
| 35 to 50 years | 13 (100.0%) | 0 (0.0%) |
| Total | 18 (100.0%) | 0 (0.0%) |
Fertility by Education in Madisonville
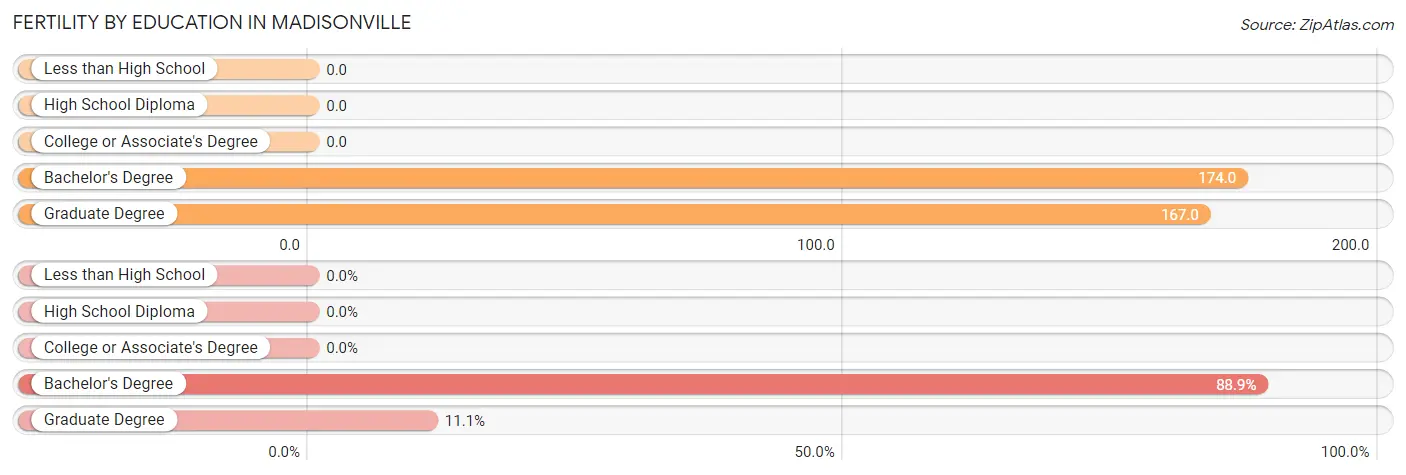
| Educational Attainment | Women with Births | Births / 1,000 Women |
| Less than High School | 0 (0.0%) | 0.0 |
| High School Diploma | 0 (0.0%) | 0.0 |
| College or Associate's Degree | 0 (0.0%) | 0.0 |
| Bachelor's Degree | 16 (88.9%) | 174.0 |
| Graduate Degree | 2 (11.1%) | 167.0 |
| Total | 18 (100.0%) | 73.0 |
Fertility by Education by Marriage Status in Madisonville
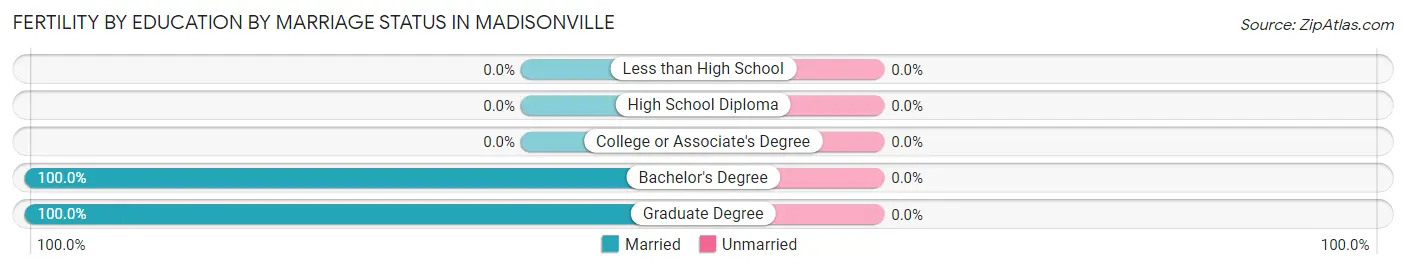
| Educational Attainment | Married | Unmarried |
| Less than High School | 0 (0.0%) | 0 (0.0%) |
| High School Diploma | 0 (0.0%) | 0 (0.0%) |
| College or Associate's Degree | 0 (0.0%) | 0 (0.0%) |
| Bachelor's Degree | 16 (100.0%) | 0 (0.0%) |
| Graduate Degree | 2 (100.0%) | 0 (0.0%) |
| Total | 18 (100.0%) | 0 (0.0%) |
Employment Characteristics in Madisonville
Employment by Class of Employer in Madisonville
Among the 468 employed individuals in Madisonville, private company employees (280 | 59.8%), self-employed (incorporated) (55 | 11.7%), and self-employed (not incorporated) (42 | 9.0%) make up the most common classes of employment.
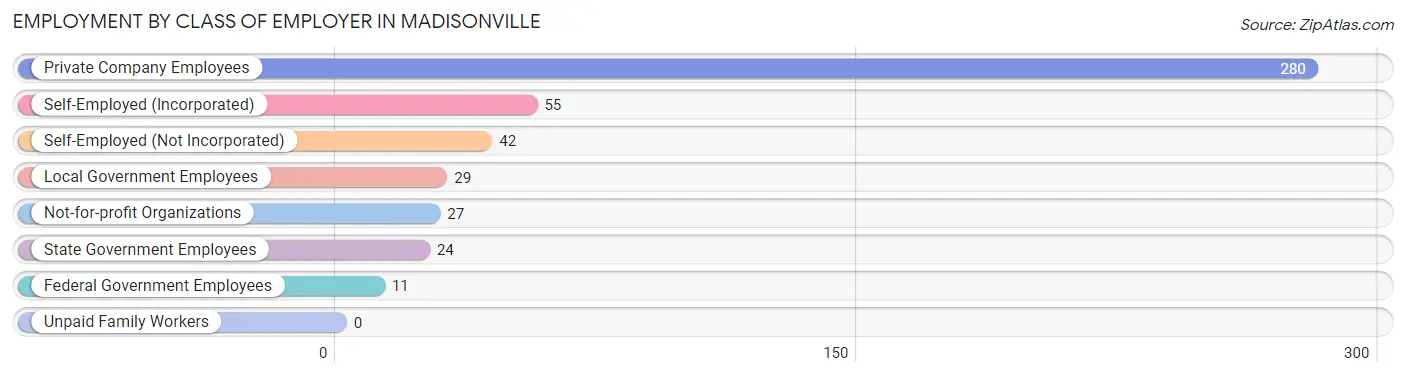
| Employer Class | # Employees | % Employees |
| Private Company Employees | 280 | 59.8% |
| Self-Employed (Incorporated) | 55 | 11.7% |
| Self-Employed (Not Incorporated) | 42 | 9.0% |
| Not-for-profit Organizations | 27 | 5.8% |
| Local Government Employees | 29 | 6.2% |
| State Government Employees | 24 | 5.1% |
| Federal Government Employees | 11 | 2.4% |
| Unpaid Family Workers | 0 | 0.0% |
| Total | 468 | 100.0% |
Employment Status by Age in Madisonville
According to the labor force statistics for Madisonville, out of the total population over 16 years of age (811), 63.1% or 512 individuals are in the labor force, with 5.5% or 28 of them unemployed. The age group with the highest labor force participation rate is 25 to 29 years, with 100.0% or 15 individuals in the labor force. Within the labor force, the 75 years and over age range has the highest percentage of unemployed individuals, with 100.0% or 1 of them being unemployed.
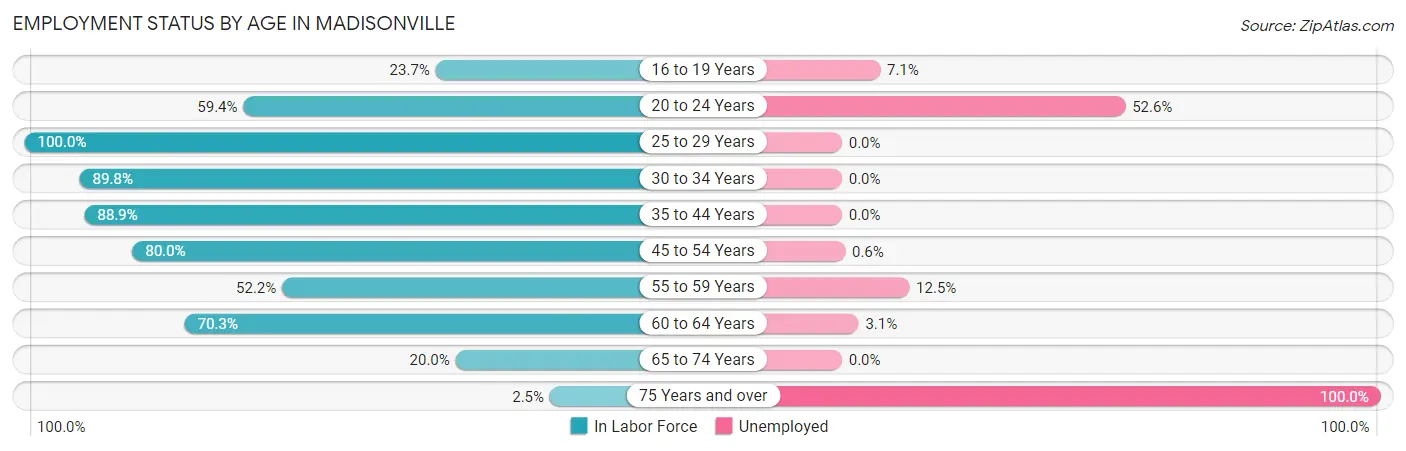
| Age Bracket | In Labor Force | Unemployed |
| 16 to 19 Years | 14 (23.7%) | 1 (7.1%) |
| 20 to 24 Years | 38 (59.4%) | 20 (52.6%) |
| 25 to 29 Years | 15 (100.0%) | 0 (0.0%) |
| 30 to 34 Years | 53 (89.8%) | 0 (0.0%) |
| 35 to 44 Years | 104 (88.9%) | 0 (0.0%) |
| 45 to 54 Years | 180 (80.0%) | 1 (0.6%) |
| 55 to 59 Years | 24 (52.2%) | 3 (12.5%) |
| 60 to 64 Years | 64 (70.3%) | 2 (3.1%) |
| 65 to 74 Years | 19 (20.0%) | 0 (0.0%) |
| 75 Years and over | 1 (2.5%) | 1 (100.0%) |
| Total | 512 (63.1%) | 28 (5.5%) |
Employment Status by Educational Attainment in Madisonville
According to labor force statistics for Madisonville, 79.6% of individuals (440) out of the total population between 25 and 64 years of age (553) are in the labor force, with 1.4% or 6 of them being unemployed. The group with the highest labor force participation rate are those with the educational attainment of less than high school, with 100.0% or 3 individuals in the labor force. Within the labor force, individuals with less than high school education have the highest percentage of unemployment, with 33.3% or 1 of them being unemployed.
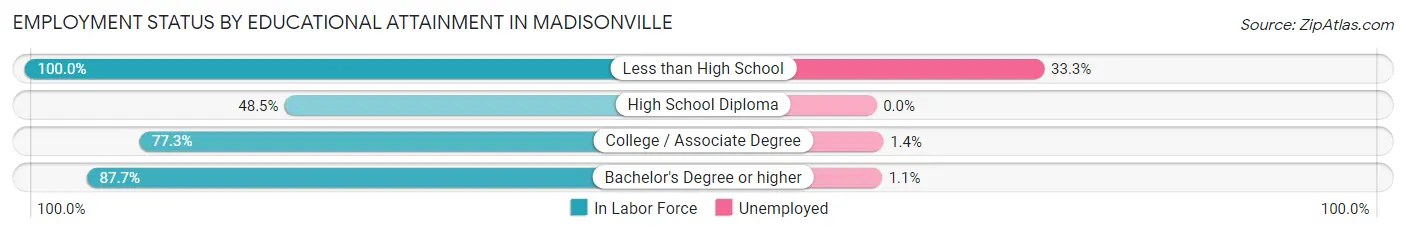
| Educational Attainment | In Labor Force | Unemployed |
| Less than High School | 3 (100.0%) | 1 (33.3%) |
| High School Diploma | 33 (48.5%) | 0 (0.0%) |
| College / Associate Degree | 140 (77.3%) | 3 (1.4%) |
| Bachelor's Degree or higher | 264 (87.7%) | 3 (1.1%) |
| Total | 440 (79.6%) | 8 (1.4%) |
Employment Occupations by Sex in Madisonville
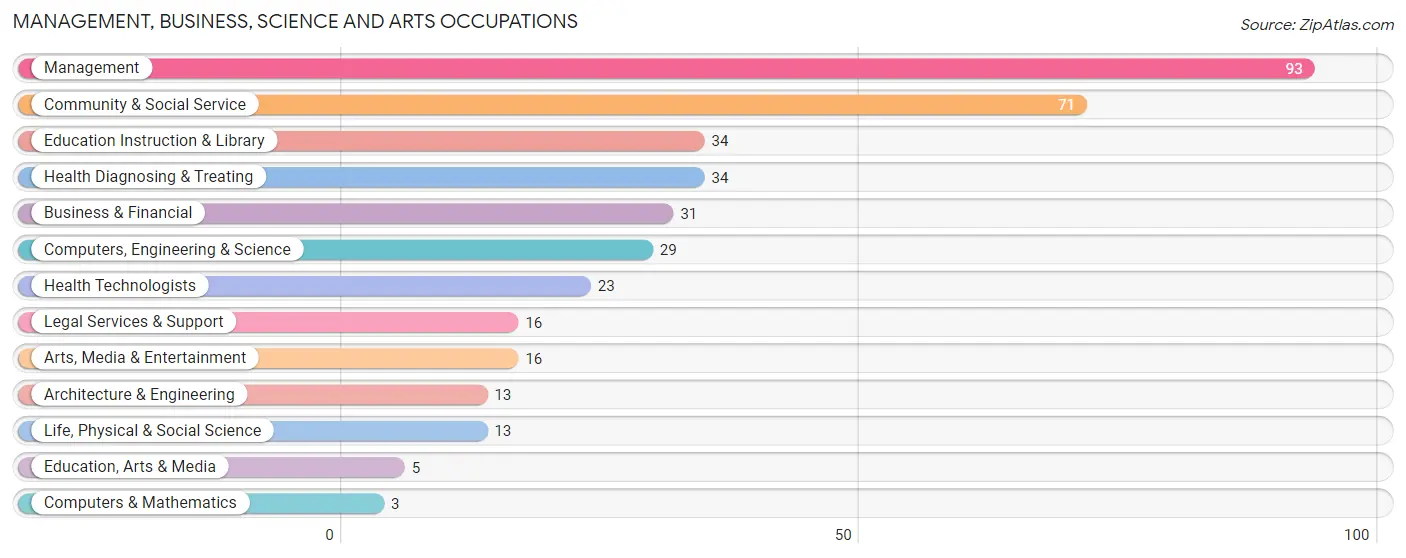
Management, Business, Science and Arts Occupations
The most common Management, Business, Science and Arts occupations in Madisonville are Management (93 | 19.2%), Community & Social Service (71 | 14.7%), Education Instruction & Library (34 | 7.0%), Health Diagnosing & Treating (34 | 7.0%), and Business & Financial (31 | 6.4%).
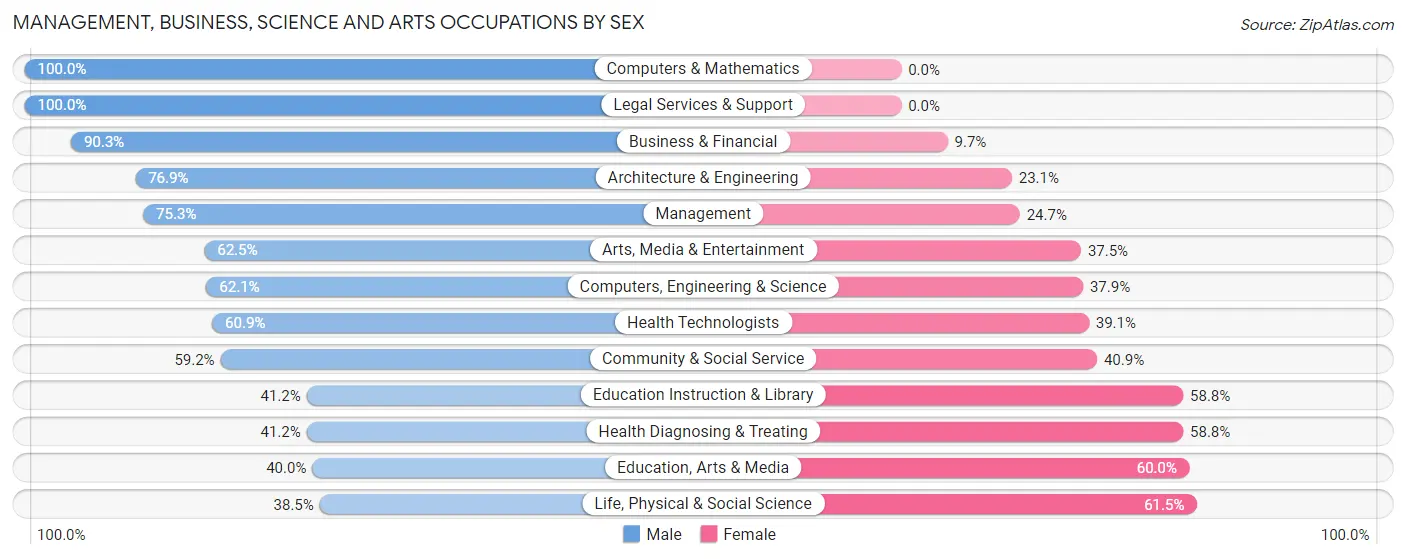
Management, Business, Science and Arts Occupations by Sex
Within the Management, Business, Science and Arts occupations in Madisonville, the most male-oriented occupations are Computers & Mathematics (100.0%), Legal Services & Support (100.0%), and Business & Financial (90.3%), while the most female-oriented occupations are Life, Physical & Social Science (61.5%), Education, Arts & Media (60.0%), and Education Instruction & Library (58.8%).
| Occupation | Male | Female |
| Management | 70 (75.3%) | 23 (24.7%) |
| Business & Financial | 28 (90.3%) | 3 (9.7%) |
| Computers, Engineering & Science | 18 (62.1%) | 11 (37.9%) |
| Computers & Mathematics | 3 (100.0%) | 0 (0.0%) |
| Architecture & Engineering | 10 (76.9%) | 3 (23.1%) |
| Life, Physical & Social Science | 5 (38.5%) | 8 (61.5%) |
| Community & Social Service | 42 (59.2%) | 29 (40.8%) |
| Education, Arts & Media | 2 (40.0%) | 3 (60.0%) |
| Legal Services & Support | 16 (100.0%) | 0 (0.0%) |
| Education Instruction & Library | 14 (41.2%) | 20 (58.8%) |
| Arts, Media & Entertainment | 10 (62.5%) | 6 (37.5%) |
| Health Diagnosing & Treating | 14 (41.2%) | 20 (58.8%) |
| Health Technologists | 14 (60.9%) | 9 (39.1%) |
| Total (Category) | 172 (66.7%) | 86 (33.3%) |
| Total (Overall) | 297 (61.4%) | 187 (38.6%) |
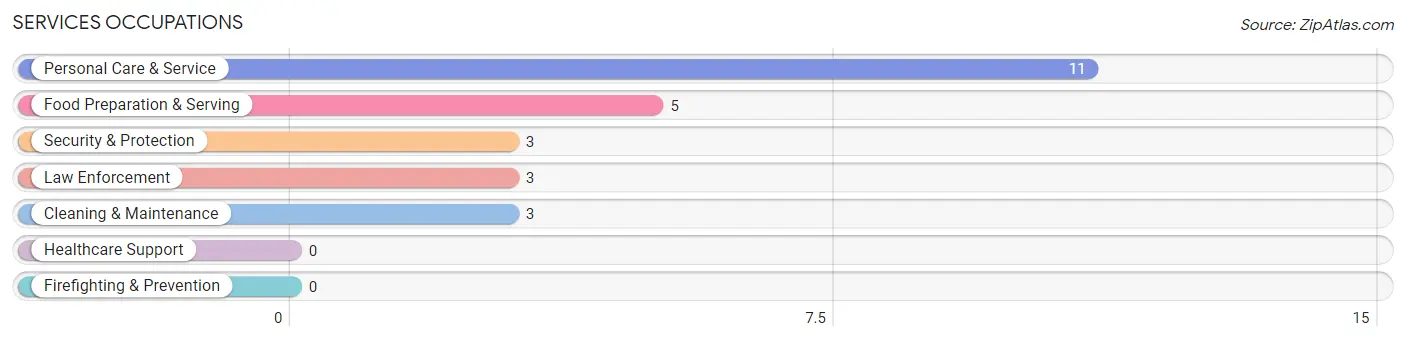
Services Occupations
The most common Services occupations in Madisonville are Personal Care & Service (11 | 2.3%), Food Preparation & Serving (5 | 1.0%), Security & Protection (3 | 0.6%), Law Enforcement (3 | 0.6%), and Cleaning & Maintenance (3 | 0.6%).
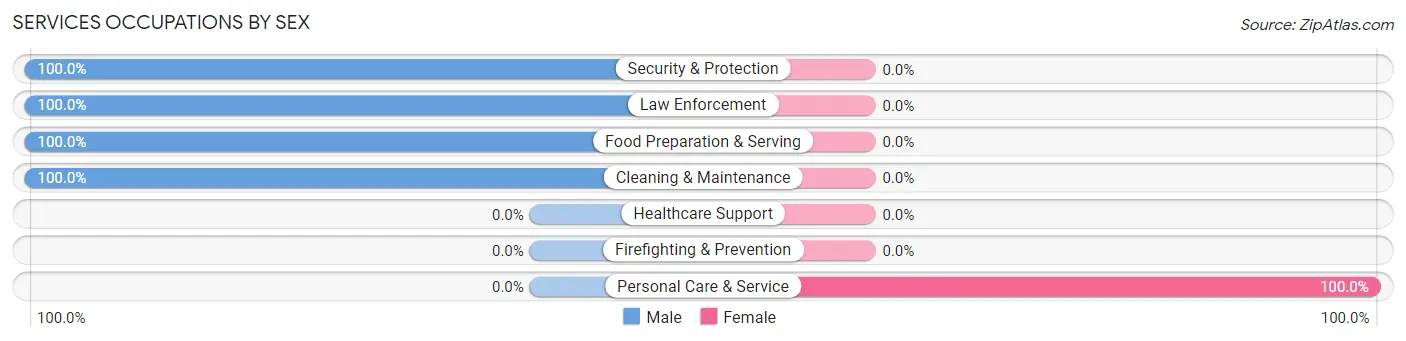
Services Occupations by Sex
| Occupation | Male | Female |
| Healthcare Support | 0 (0.0%) | 0 (0.0%) |
| Security & Protection | 3 (100.0%) | 0 (0.0%) |
| Firefighting & Prevention | 0 (0.0%) | 0 (0.0%) |
| Law Enforcement | 3 (100.0%) | 0 (0.0%) |
| Food Preparation & Serving | 5 (100.0%) | 0 (0.0%) |
| Cleaning & Maintenance | 3 (100.0%) | 0 (0.0%) |
| Personal Care & Service | 0 (0.0%) | 11 (100.0%) |
| Total (Category) | 11 (50.0%) | 11 (50.0%) |
| Total (Overall) | 297 (61.4%) | 187 (38.6%) |
Sales and Office Occupations
The most common Sales and Office occupations in Madisonville are Sales & Related (60 | 12.4%), and Office & Administration (48 | 9.9%).

Sales and Office Occupations by Sex

| Occupation | Male | Female |
| Sales & Related | 26 (43.3%) | 34 (56.7%) |
| Office & Administration | 6 (12.5%) | 42 (87.5%) |
| Total (Category) | 32 (29.6%) | 76 (70.4%) |
| Total (Overall) | 297 (61.4%) | 187 (38.6%) |
Natural Resources, Construction and Maintenance Occupations
The most common Natural Resources, Construction and Maintenance occupations in Madisonville are Construction & Extraction (51 | 10.5%), and Installation, Maintenance & Repair (19 | 3.9%).
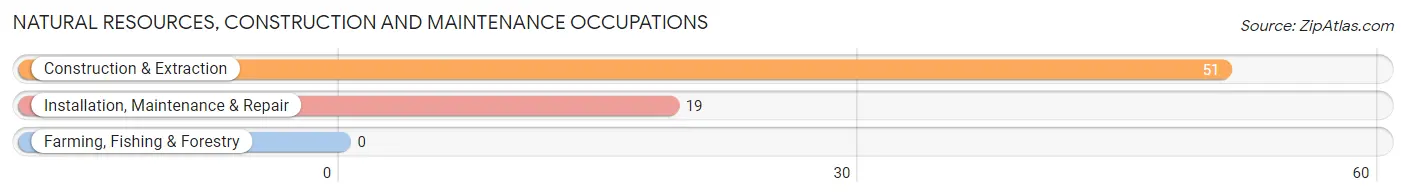
Natural Resources, Construction and Maintenance Occupations by Sex

| Occupation | Male | Female |
| Farming, Fishing & Forestry | 0 (0.0%) | 0 (0.0%) |
| Construction & Extraction | 46 (90.2%) | 5 (9.8%) |
| Installation, Maintenance & Repair | 19 (100.0%) | 0 (0.0%) |
| Total (Category) | 65 (92.9%) | 5 (7.1%) |
| Total (Overall) | 297 (61.4%) | 187 (38.6%) |
Production, Transportation and Moving Occupations
The most common Production, Transportation and Moving occupations in Madisonville are Transportation (17 | 3.5%), Production (6 | 1.2%), and Material Moving (3 | 0.6%).
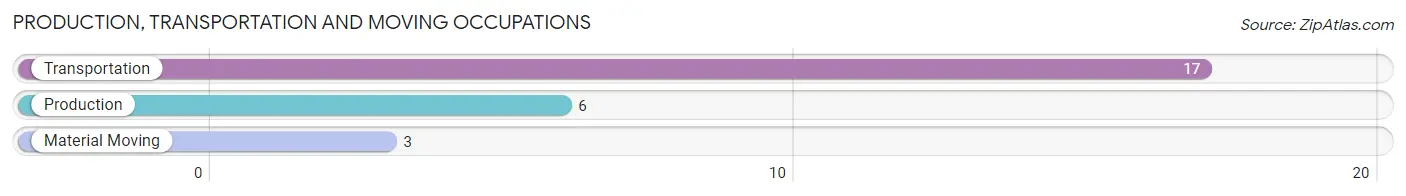
Production, Transportation and Moving Occupations by Sex
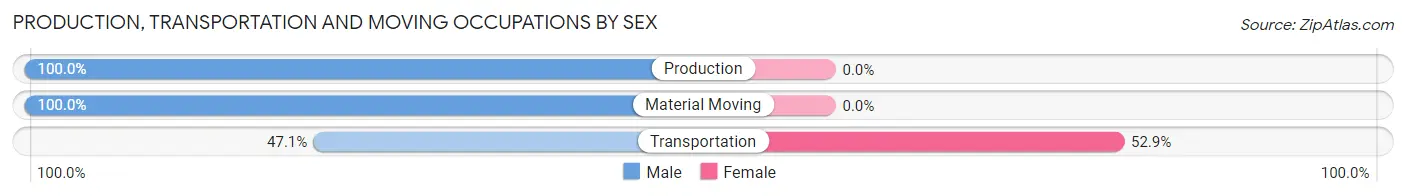
| Occupation | Male | Female |
| Production | 6 (100.0%) | 0 (0.0%) |
| Transportation | 8 (47.1%) | 9 (52.9%) |
| Material Moving | 3 (100.0%) | 0 (0.0%) |
| Total (Category) | 17 (65.4%) | 9 (34.6%) |
| Total (Overall) | 297 (61.4%) | 187 (38.6%) |
Employment Industries by Sex in Madisonville
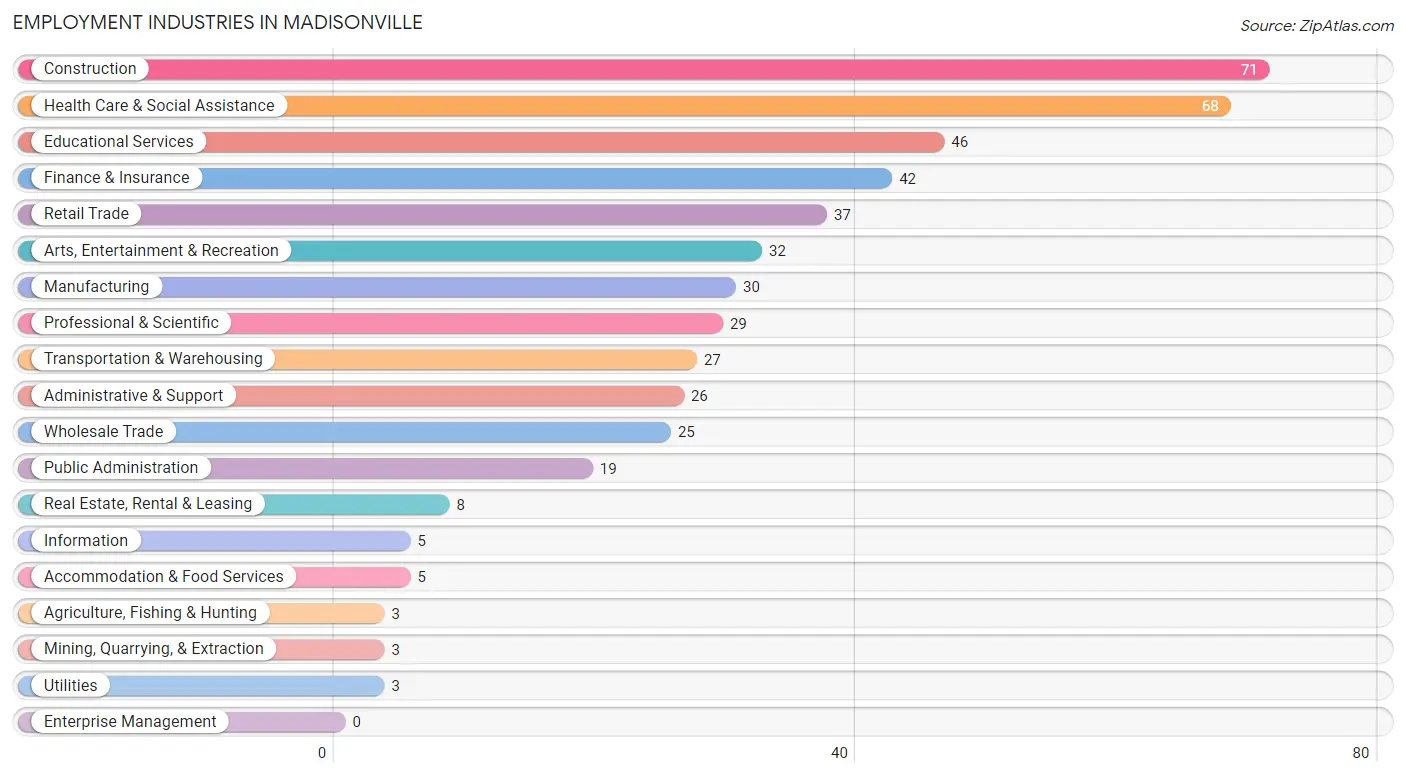
Employment Industries in Madisonville
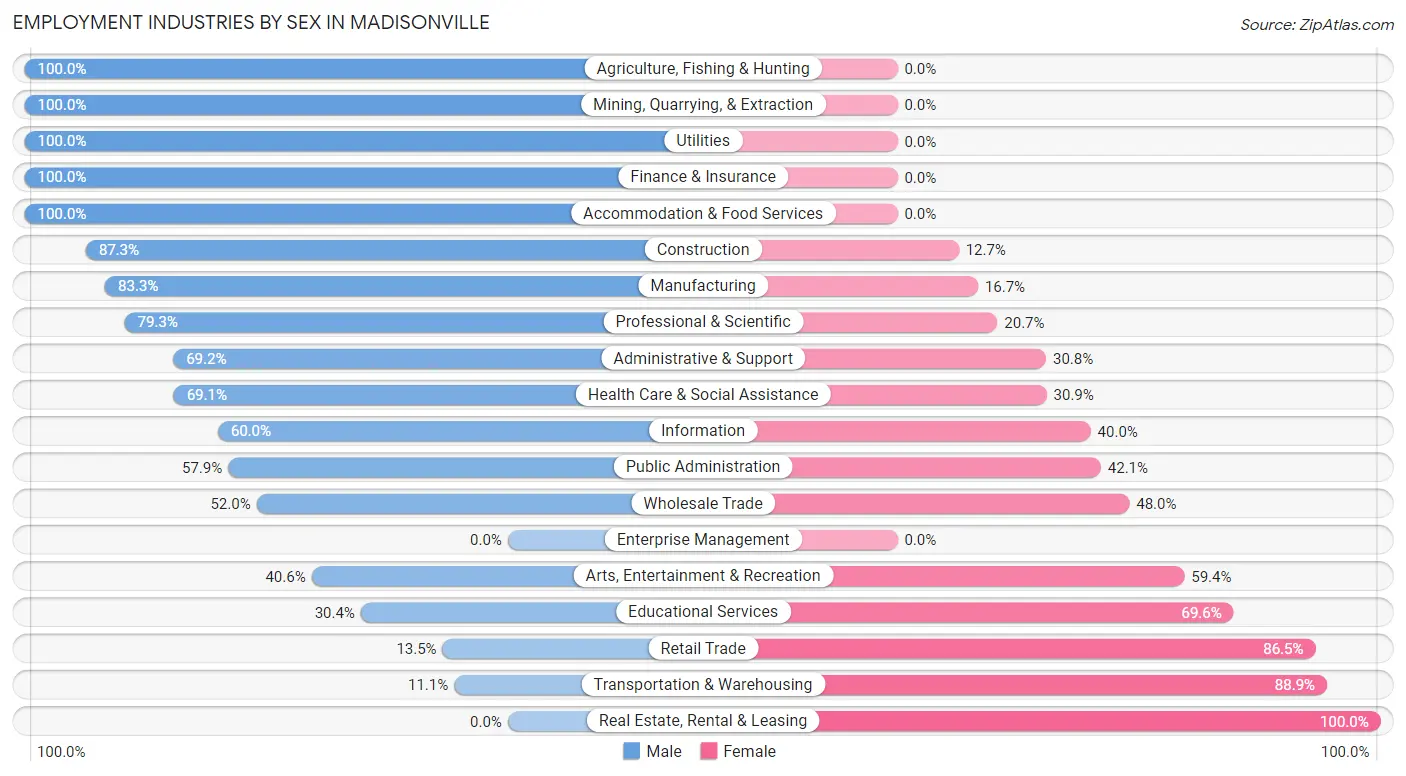
The major employment industries in Madisonville include Construction (71 | 14.7%), Health Care & Social Assistance (68 | 14.1%), Educational Services (46 | 9.5%), Finance & Insurance (42 | 8.7%), and Retail Trade (37 | 7.6%).
Employment Industries by Sex in Madisonville
The Madisonville industries that see more men than women are Agriculture, Fishing & Hunting (100.0%), Mining, Quarrying, & Extraction (100.0%), and Utilities (100.0%), whereas the industries that tend to have a higher number of women are Real Estate, Rental & Leasing (100.0%), Transportation & Warehousing (88.9%), and Retail Trade (86.5%).
| Industry | Male | Female |
| Agriculture, Fishing & Hunting | 3 (100.0%) | 0 (0.0%) |
| Mining, Quarrying, & Extraction | 3 (100.0%) | 0 (0.0%) |
| Construction | 62 (87.3%) | 9 (12.7%) |
| Manufacturing | 25 (83.3%) | 5 (16.7%) |
| Wholesale Trade | 13 (52.0%) | 12 (48.0%) |
| Retail Trade | 5 (13.5%) | 32 (86.5%) |
| Transportation & Warehousing | 3 (11.1%) | 24 (88.9%) |
| Utilities | 3 (100.0%) | 0 (0.0%) |
| Information | 3 (60.0%) | 2 (40.0%) |
| Finance & Insurance | 42 (100.0%) | 0 (0.0%) |
| Real Estate, Rental & Leasing | 0 (0.0%) | 8 (100.0%) |
| Professional & Scientific | 23 (79.3%) | 6 (20.7%) |
| Enterprise Management | 0 (0.0%) | 0 (0.0%) |
| Administrative & Support | 18 (69.2%) | 8 (30.8%) |
| Educational Services | 14 (30.4%) | 32 (69.6%) |
| Health Care & Social Assistance | 47 (69.1%) | 21 (30.9%) |
| Arts, Entertainment & Recreation | 13 (40.6%) | 19 (59.4%) |
| Accommodation & Food Services | 5 (100.0%) | 0 (0.0%) |
| Public Administration | 11 (57.9%) | 8 (42.1%) |
| Total | 297 (61.4%) | 187 (38.6%) |
Education in Madisonville
School Enrollment in Madisonville
The most common levels of schooling among the 244 students in Madisonville are college / undergraduate (66 | 27.1%), high school (65 | 26.6%), and middle school (45 | 18.4%).
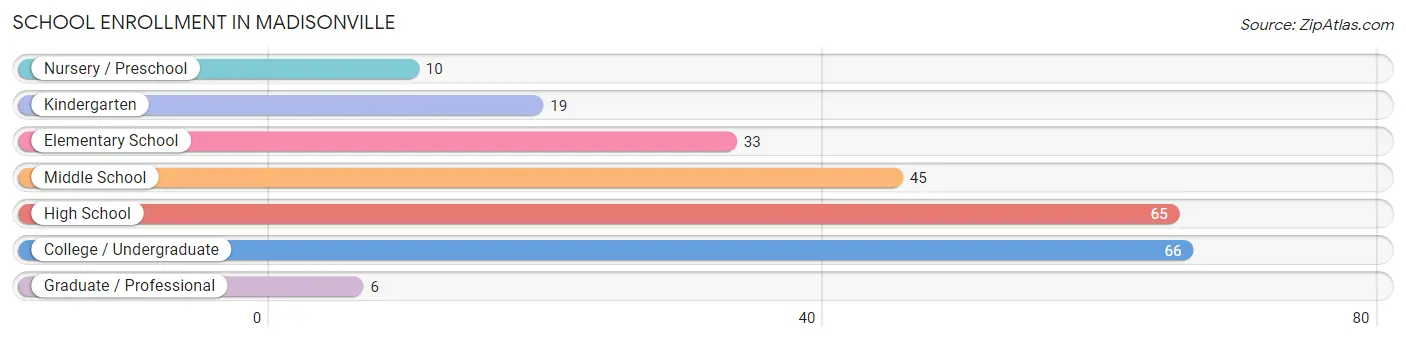
| School Level | # Students | % Students |
| Nursery / Preschool | 10 | 4.1% |
| Kindergarten | 19 | 7.8% |
| Elementary School | 33 | 13.5% |
| Middle School | 45 | 18.4% |
| High School | 65 | 26.6% |
| College / Undergraduate | 66 | 27.1% |
| Graduate / Professional | 6 | 2.5% |
| Total | 244 | 100.0% |
School Enrollment by Age by Funding Source in Madisonville
Out of a total of 244 students who are enrolled in schools in Madisonville, 101 (41.4%) attend a private institution, while the remaining 143 (58.6%) are enrolled in public schools. The age group of 3 to 4 year olds has the highest likelihood of being enrolled in private schools, with 7 (100.0% in the age bracket) enrolled. Conversely, the age group of 25 to 34 year olds has the lowest likelihood of being enrolled in a private school, with 6 (100.0% in the age bracket) attending a public institution.
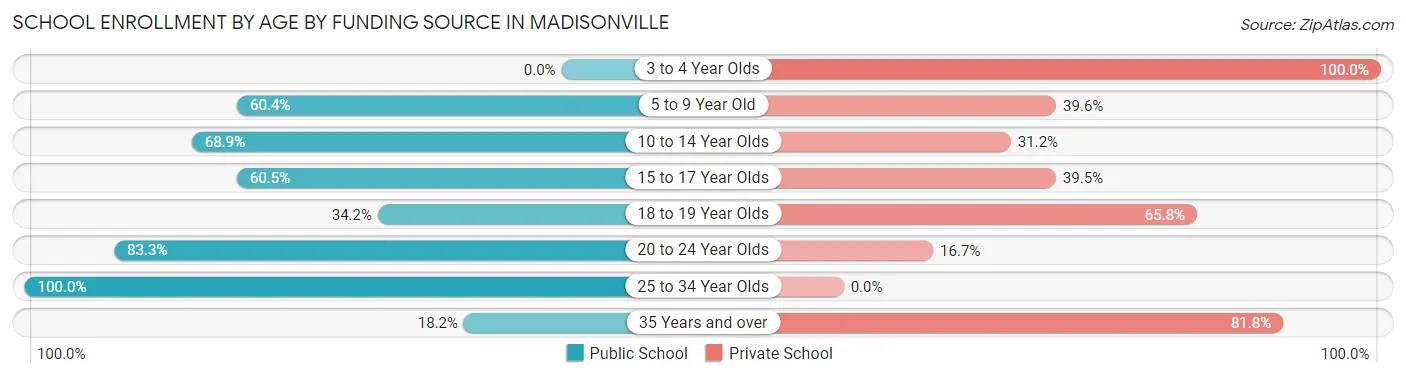
| Age Bracket | Public School | Private School |
| 3 to 4 Year Olds | 0 (0.0%) | 7 (100.0%) |
| 5 to 9 Year Old | 29 (60.4%) | 19 (39.6%) |
| 10 to 14 Year Olds | 42 (68.9%) | 19 (31.1%) |
| 15 to 17 Year Olds | 26 (60.5%) | 17 (39.5%) |
| 18 to 19 Year Olds | 13 (34.2%) | 25 (65.8%) |
| 20 to 24 Year Olds | 25 (83.3%) | 5 (16.7%) |
| 25 to 34 Year Olds | 6 (100.0%) | 0 (0.0%) |
| 35 Years and over | 2 (18.2%) | 9 (81.8%) |
| Total | 143 (58.6%) | 101 (41.4%) |
Educational Attainment by Field of Study in Madisonville
Business (109 | 26.2%), education (63 | 15.1%), bio, nature & agricultural (46 | 11.1%), science & technology (37 | 8.9%), and engineering (31 | 7.4%) are the most common fields of study among 416 individuals in Madisonville who have obtained a bachelor's degree or higher.
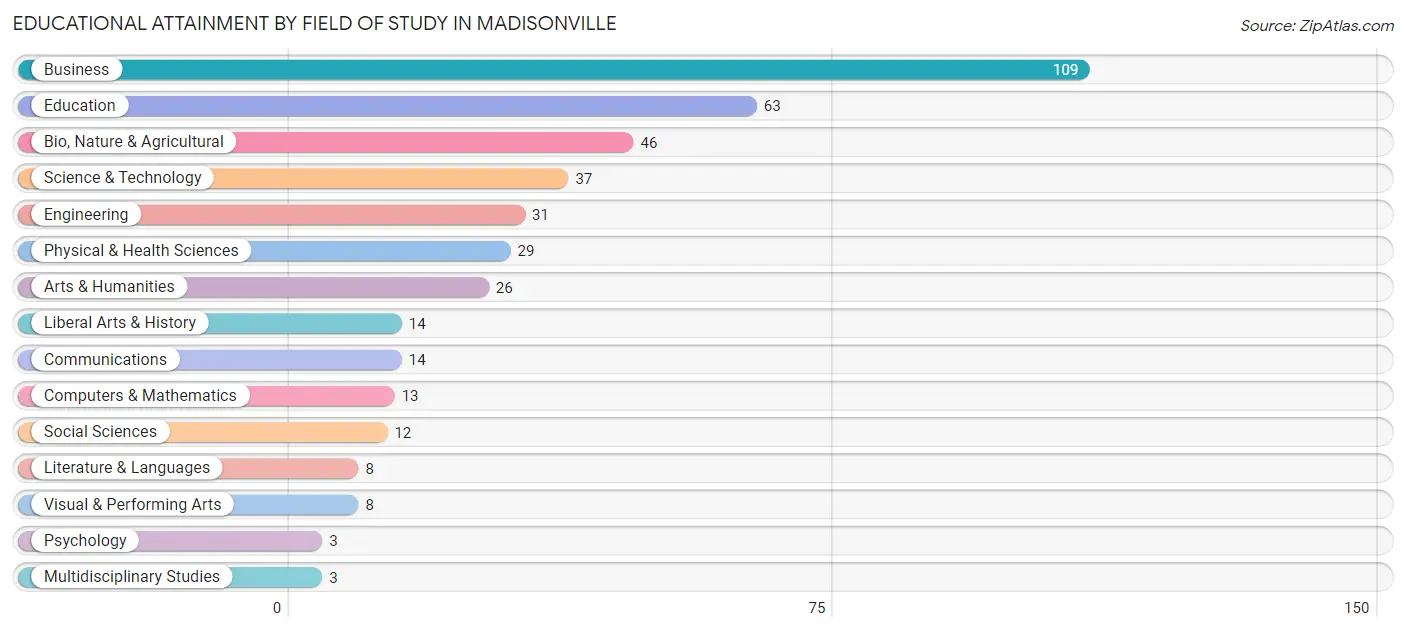
| Field of Study | # Graduates | % Graduates |
| Computers & Mathematics | 13 | 3.1% |
| Bio, Nature & Agricultural | 46 | 11.1% |
| Physical & Health Sciences | 29 | 7.0% |
| Psychology | 3 | 0.7% |
| Social Sciences | 12 | 2.9% |
| Engineering | 31 | 7.4% |
| Multidisciplinary Studies | 3 | 0.7% |
| Science & Technology | 37 | 8.9% |
| Business | 109 | 26.2% |
| Education | 63 | 15.1% |
| Literature & Languages | 8 | 1.9% |
| Liberal Arts & History | 14 | 3.4% |
| Visual & Performing Arts | 8 | 1.9% |
| Communications | 14 | 3.4% |
| Arts & Humanities | 26 | 6.2% |
| Total | 416 | 100.0% |
Transportation & Commute in Madisonville
Vehicle Availability by Sex in Madisonville
The most prevalent vehicle ownership categories in Madisonville are males with 2 vehicles (140, accounting for 47.9%) and females with 2 vehicles (116, making up 79.5%).
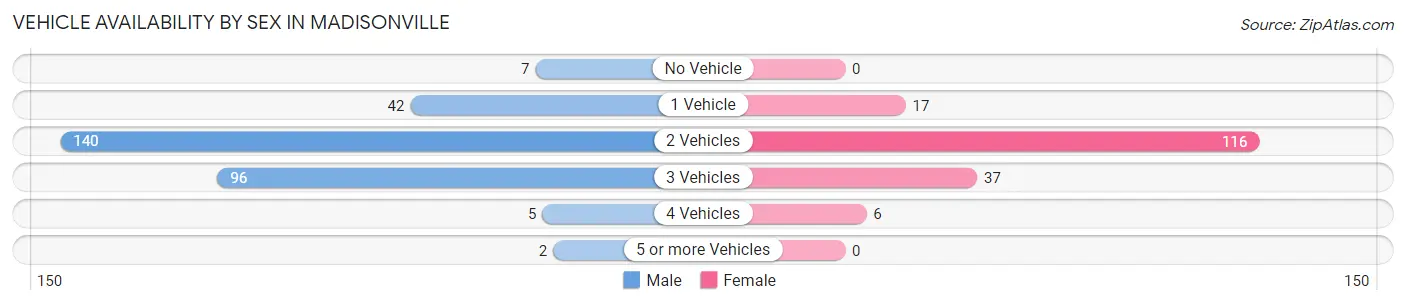
| Vehicles Available | Male | Female |
| No Vehicle | 7 (2.4%) | 0 (0.0%) |
| 1 Vehicle | 42 (14.4%) | 17 (9.7%) |
| 2 Vehicles | 140 (47.9%) | 116 (65.9%) |
| 3 Vehicles | 96 (32.9%) | 37 (21.0%) |
| 4 Vehicles | 5 (1.7%) | 6 (3.4%) |
| 5 or more Vehicles | 2 (0.7%) | 0 (0.0%) |
| Total | 292 (100.0%) | 176 (100.0%) |
Commute Time in Madisonville
The most frequently occuring commute durations in Madisonville are 10 to 14 minutes (65 commuters, 14.6%), 45 to 59 minutes (65 commuters, 14.6%), and 30 to 34 minutes (62 commuters, 14.0%).
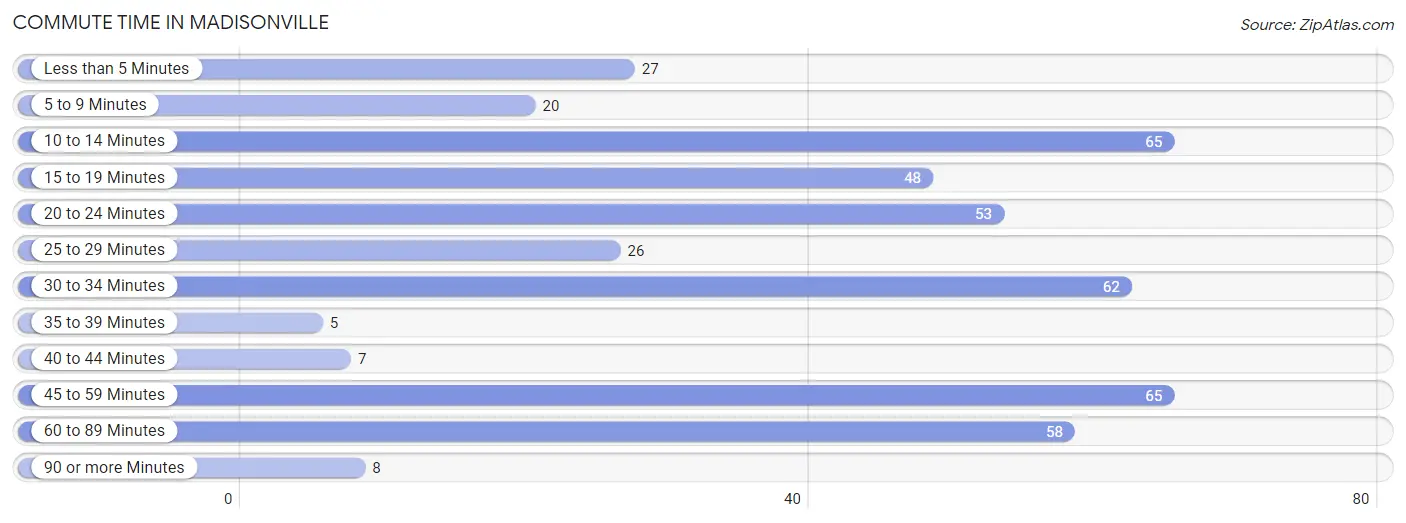
| Commute Time | # Commuters | % Commuters |
| Less than 5 Minutes | 27 | 6.1% |
| 5 to 9 Minutes | 20 | 4.5% |
| 10 to 14 Minutes | 65 | 14.6% |
| 15 to 19 Minutes | 48 | 10.8% |
| 20 to 24 Minutes | 53 | 11.9% |
| 25 to 29 Minutes | 26 | 5.9% |
| 30 to 34 Minutes | 62 | 14.0% |
| 35 to 39 Minutes | 5 | 1.1% |
| 40 to 44 Minutes | 7 | 1.6% |
| 45 to 59 Minutes | 65 | 14.6% |
| 60 to 89 Minutes | 58 | 13.1% |
| 90 or more Minutes | 8 | 1.8% |
Commute Time by Sex in Madisonville
The most common commute times in Madisonville are 60 to 89 minutes (58 commuters, 20.7%) for males and 10 to 14 minutes (37 commuters, 22.6%) for females.
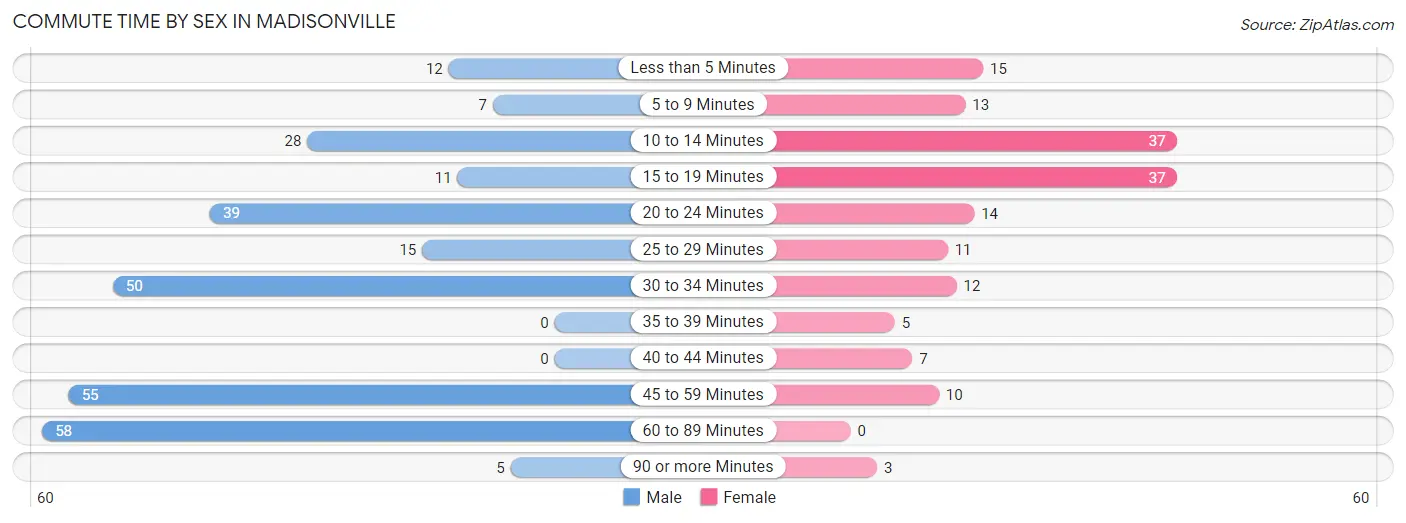
| Commute Time | Male | Female |
| Less than 5 Minutes | 12 (4.3%) | 15 (9.1%) |
| 5 to 9 Minutes | 7 (2.5%) | 13 (7.9%) |
| 10 to 14 Minutes | 28 (10.0%) | 37 (22.6%) |
| 15 to 19 Minutes | 11 (3.9%) | 37 (22.6%) |
| 20 to 24 Minutes | 39 (13.9%) | 14 (8.5%) |
| 25 to 29 Minutes | 15 (5.4%) | 11 (6.7%) |
| 30 to 34 Minutes | 50 (17.9%) | 12 (7.3%) |
| 35 to 39 Minutes | 0 (0.0%) | 5 (3.0%) |
| 40 to 44 Minutes | 0 (0.0%) | 7 (4.3%) |
| 45 to 59 Minutes | 55 (19.6%) | 10 (6.1%) |
| 60 to 89 Minutes | 58 (20.7%) | 0 (0.0%) |
| 90 or more Minutes | 5 (1.8%) | 3 (1.8%) |
Time of Departure to Work by Sex in Madisonville
The most frequent times of departure to work in Madisonville are 8:00 AM to 8:29 AM (48, 17.1%) for males and 7:30 AM to 7:59 AM (44, 26.8%) for females.
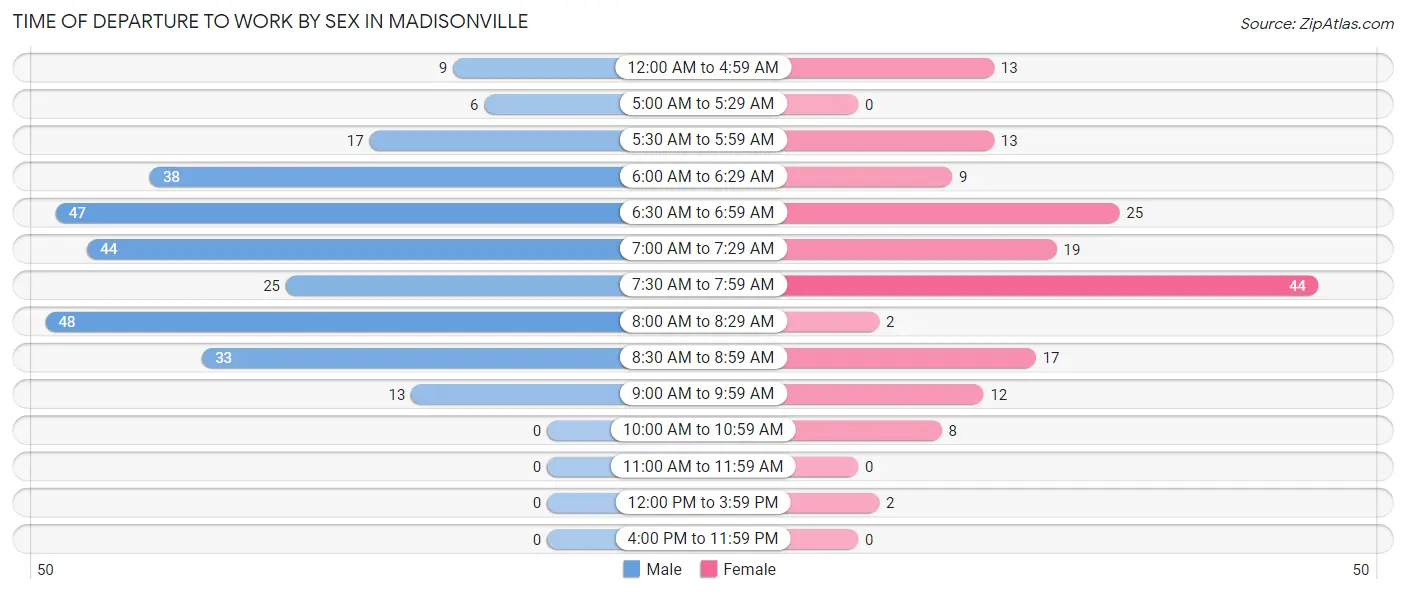
| Time of Departure | Male | Female |
| 12:00 AM to 4:59 AM | 9 (3.2%) | 13 (7.9%) |
| 5:00 AM to 5:29 AM | 6 (2.1%) | 0 (0.0%) |
| 5:30 AM to 5:59 AM | 17 (6.1%) | 13 (7.9%) |
| 6:00 AM to 6:29 AM | 38 (13.6%) | 9 (5.5%) |
| 6:30 AM to 6:59 AM | 47 (16.8%) | 25 (15.2%) |
| 7:00 AM to 7:29 AM | 44 (15.7%) | 19 (11.6%) |
| 7:30 AM to 7:59 AM | 25 (8.9%) | 44 (26.8%) |
| 8:00 AM to 8:29 AM | 48 (17.1%) | 2 (1.2%) |
| 8:30 AM to 8:59 AM | 33 (11.8%) | 17 (10.4%) |
| 9:00 AM to 9:59 AM | 13 (4.6%) | 12 (7.3%) |
| 10:00 AM to 10:59 AM | 0 (0.0%) | 8 (4.9%) |
| 11:00 AM to 11:59 AM | 0 (0.0%) | 0 (0.0%) |
| 12:00 PM to 3:59 PM | 0 (0.0%) | 2 (1.2%) |
| 4:00 PM to 11:59 PM | 0 (0.0%) | 0 (0.0%) |
| Total | 280 (100.0%) | 164 (100.0%) |
Housing Occupancy in Madisonville
Occupancy by Ownership in Madisonville
Of the total 389 dwellings in Madisonville, owner-occupied units account for 349 (89.7%), while renter-occupied units make up 40 (10.3%).
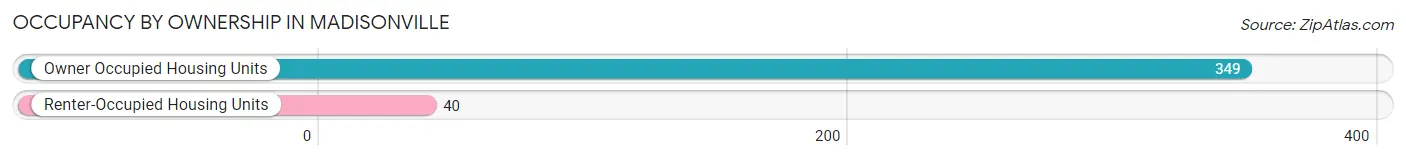
| Occupancy | # Housing Units | % Housing Units |
| Owner Occupied Housing Units | 349 | 89.7% |
| Renter-Occupied Housing Units | 40 | 10.3% |
| Total Occupied Housing Units | 389 | 100.0% |
Occupancy by Household Size in Madisonville
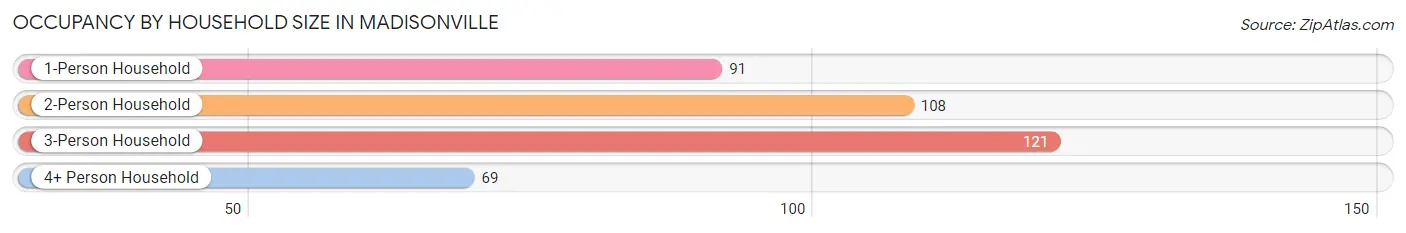
| Household Size | # Housing Units | % Housing Units |
| 1-Person Household | 91 | 23.4% |
| 2-Person Household | 108 | 27.8% |
| 3-Person Household | 121 | 31.1% |
| 4+ Person Household | 69 | 17.7% |
| Total Housing Units | 389 | 100.0% |
Occupancy by Ownership by Household Size in Madisonville
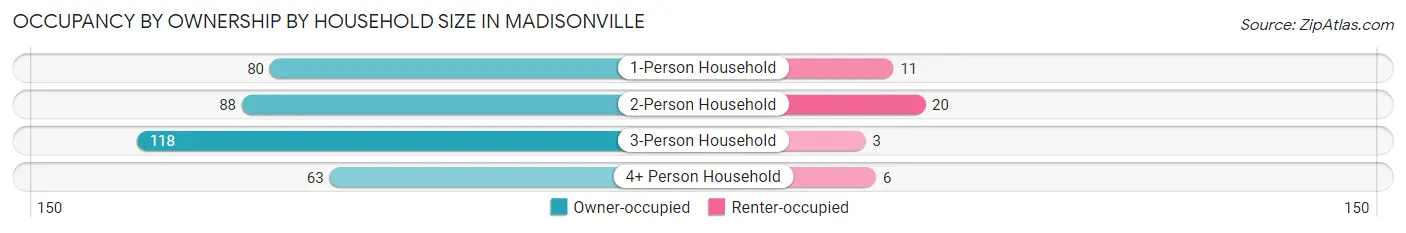
| Household Size | Owner-occupied | Renter-occupied |
| 1-Person Household | 80 (87.9%) | 11 (12.1%) |
| 2-Person Household | 88 (81.5%) | 20 (18.5%) |
| 3-Person Household | 118 (97.5%) | 3 (2.5%) |
| 4+ Person Household | 63 (91.3%) | 6 (8.7%) |
| Total Housing Units | 349 (89.7%) | 40 (10.3%) |
Occupancy by Educational Attainment in Madisonville
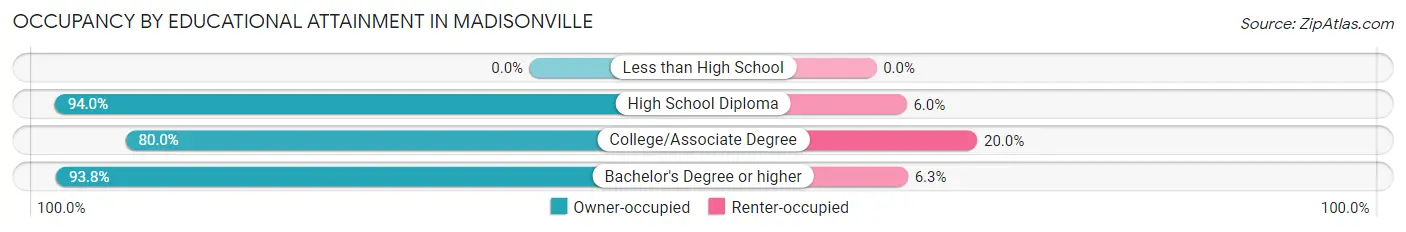
| Household Size | Owner-occupied | Renter-occupied |
| Less than High School | 0 (0.0%) | 0 (0.0%) |
| High School Diploma | 47 (94.0%) | 3 (6.0%) |
| College/Associate Degree | 92 (80.0%) | 23 (20.0%) |
| Bachelor's Degree or higher | 210 (93.8%) | 14 (6.2%) |
Occupancy by Age of Householder in Madisonville
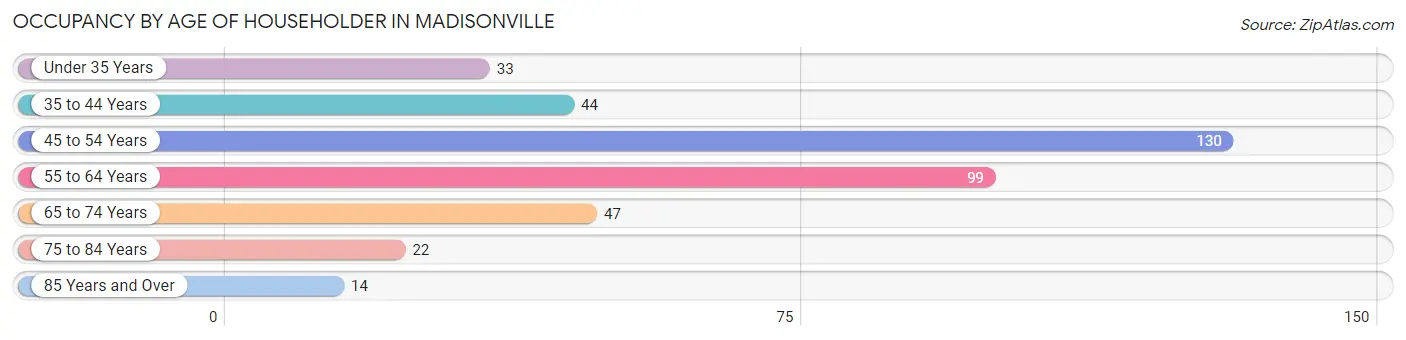
| Age Bracket | # Households | % Households |
| Under 35 Years | 33 | 8.5% |
| 35 to 44 Years | 44 | 11.3% |
| 45 to 54 Years | 130 | 33.4% |
| 55 to 64 Years | 99 | 25.5% |
| 65 to 74 Years | 47 | 12.1% |
| 75 to 84 Years | 22 | 5.7% |
| 85 Years and Over | 14 | 3.6% |
| Total | 389 | 100.0% |
Housing Finances in Madisonville
Median Income by Occupancy in Madisonville
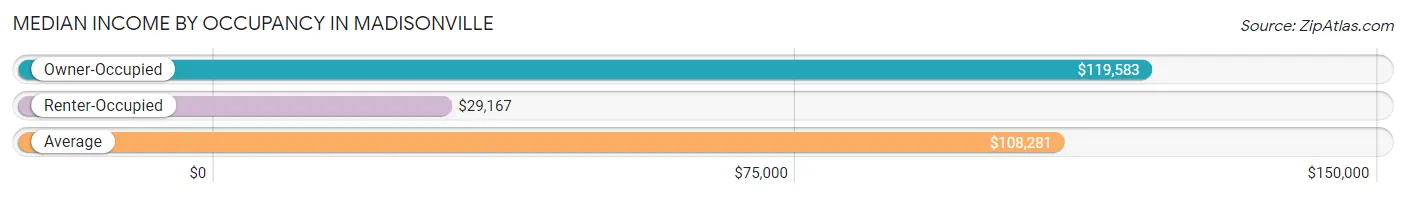
| Occupancy Type | # Households | Median Income |
| Owner-Occupied | 349 (89.7%) | $119,583 |
| Renter-Occupied | 40 (10.3%) | $29,167 |
| Average | 389 (100.0%) | $108,281 |
Occupancy by Householder Income Bracket in Madisonville
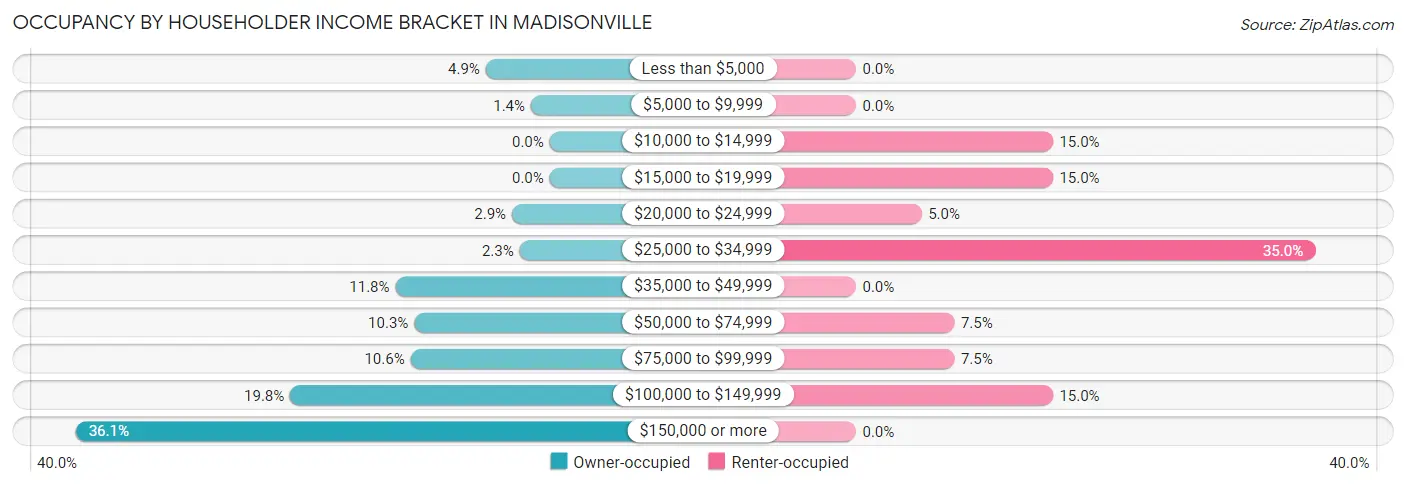
| Income Bracket | Owner-occupied | Renter-occupied |
| Less than $5,000 | 17 (4.9%) | 0 (0.0%) |
| $5,000 to $9,999 | 5 (1.4%) | 0 (0.0%) |
| $10,000 to $14,999 | 0 (0.0%) | 6 (15.0%) |
| $15,000 to $19,999 | 0 (0.0%) | 6 (15.0%) |
| $20,000 to $24,999 | 10 (2.9%) | 2 (5.0%) |
| $25,000 to $34,999 | 8 (2.3%) | 14 (35.0%) |
| $35,000 to $49,999 | 41 (11.7%) | 0 (0.0%) |
| $50,000 to $74,999 | 36 (10.3%) | 3 (7.5%) |
| $75,000 to $99,999 | 37 (10.6%) | 3 (7.5%) |
| $100,000 to $149,999 | 69 (19.8%) | 6 (15.0%) |
| $150,000 or more | 126 (36.1%) | 0 (0.0%) |
| Total | 349 (100.0%) | 40 (100.0%) |
Monthly Housing Cost Tiers in Madisonville
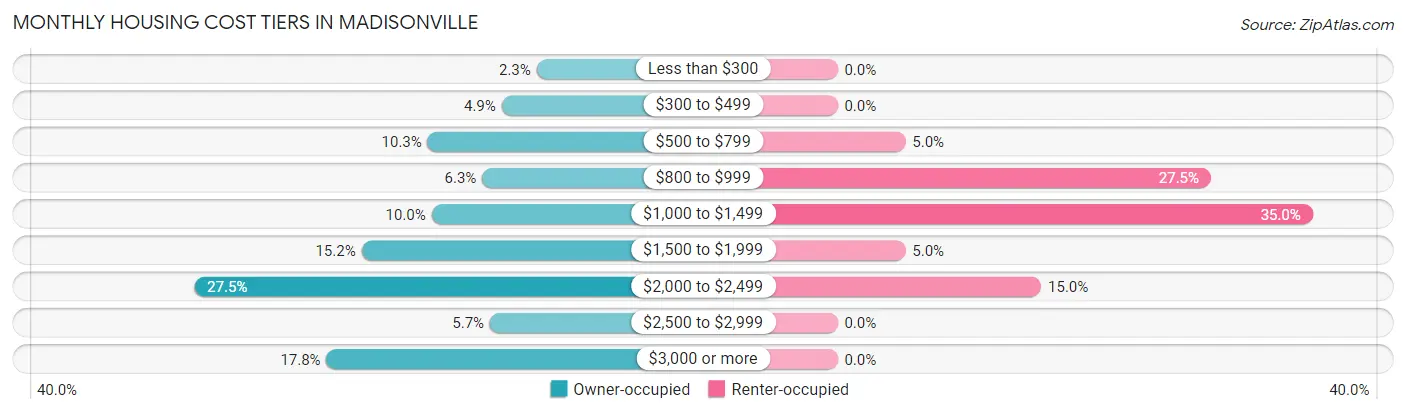
| Monthly Cost | Owner-occupied | Renter-occupied |
| Less than $300 | 8 (2.3%) | 0 (0.0%) |
| $300 to $499 | 17 (4.9%) | 0 (0.0%) |
| $500 to $799 | 36 (10.3%) | 2 (5.0%) |
| $800 to $999 | 22 (6.3%) | 11 (27.5%) |
| $1,000 to $1,499 | 35 (10.0%) | 14 (35.0%) |
| $1,500 to $1,999 | 53 (15.2%) | 2 (5.0%) |
| $2,000 to $2,499 | 96 (27.5%) | 6 (15.0%) |
| $2,500 to $2,999 | 20 (5.7%) | 0 (0.0%) |
| $3,000 or more | 62 (17.8%) | 0 (0.0%) |
| Total | 349 (100.0%) | 40 (100.0%) |
Physical Housing Characteristics in Madisonville
Housing Structures in Madisonville
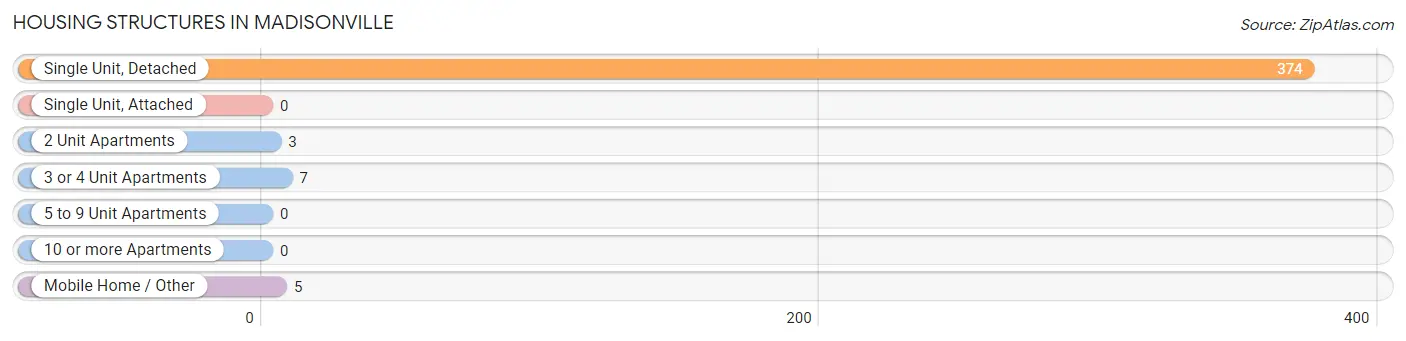
| Structure Type | # Housing Units | % Housing Units |
| Single Unit, Detached | 374 | 96.1% |
| Single Unit, Attached | 0 | 0.0% |
| 2 Unit Apartments | 3 | 0.8% |
| 3 or 4 Unit Apartments | 7 | 1.8% |
| 5 to 9 Unit Apartments | 0 | 0.0% |
| 10 or more Apartments | 0 | 0.0% |
| Mobile Home / Other | 5 | 1.3% |
| Total | 389 | 100.0% |
Housing Structures by Occupancy in Madisonville
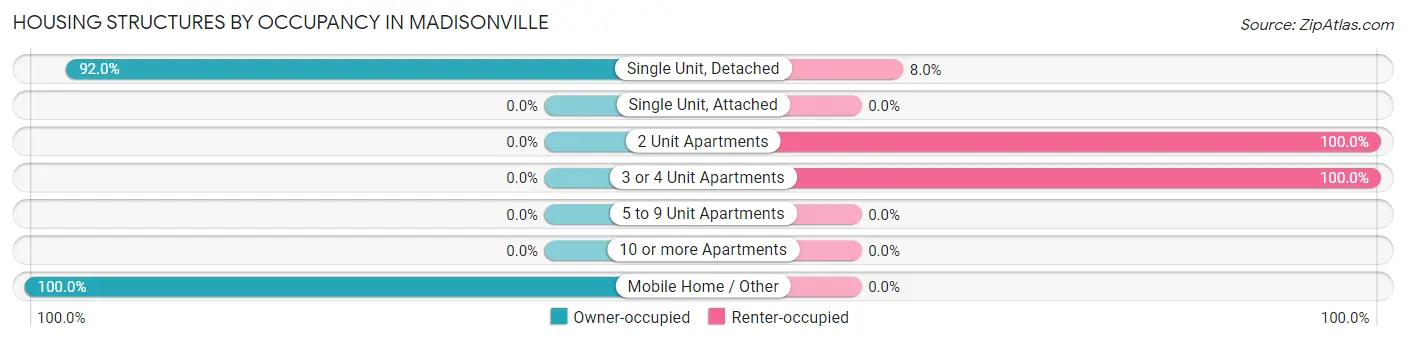
| Structure Type | Owner-occupied | Renter-occupied |
| Single Unit, Detached | 344 (92.0%) | 30 (8.0%) |
| Single Unit, Attached | 0 (0.0%) | 0 (0.0%) |
| 2 Unit Apartments | 0 (0.0%) | 3 (100.0%) |
| 3 or 4 Unit Apartments | 0 (0.0%) | 7 (100.0%) |
| 5 to 9 Unit Apartments | 0 (0.0%) | 0 (0.0%) |
| 10 or more Apartments | 0 (0.0%) | 0 (0.0%) |
| Mobile Home / Other | 5 (100.0%) | 0 (0.0%) |
| Total | 349 (89.7%) | 40 (10.3%) |
Housing Structures by Number of Rooms in Madisonville
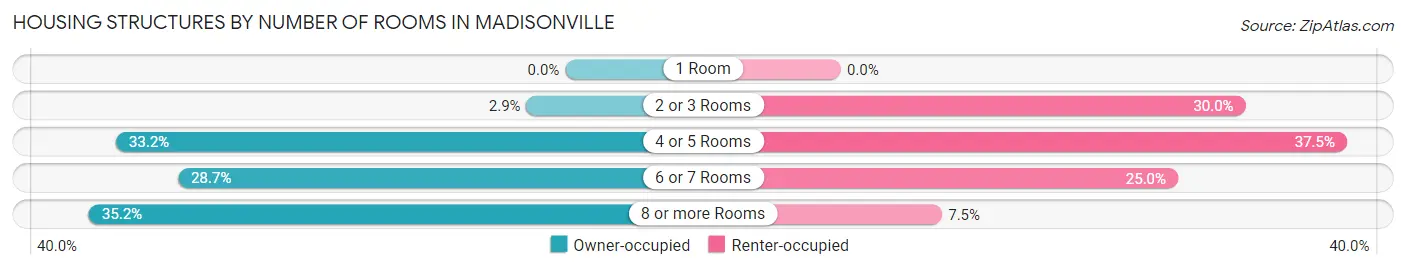
| Number of Rooms | Owner-occupied | Renter-occupied |
| 1 Room | 0 (0.0%) | 0 (0.0%) |
| 2 or 3 Rooms | 10 (2.9%) | 12 (30.0%) |
| 4 or 5 Rooms | 116 (33.2%) | 15 (37.5%) |
| 6 or 7 Rooms | 100 (28.6%) | 10 (25.0%) |
| 8 or more Rooms | 123 (35.2%) | 3 (7.5%) |
| Total | 349 (100.0%) | 40 (100.0%) |
Housing Structure by Heating Type in Madisonville
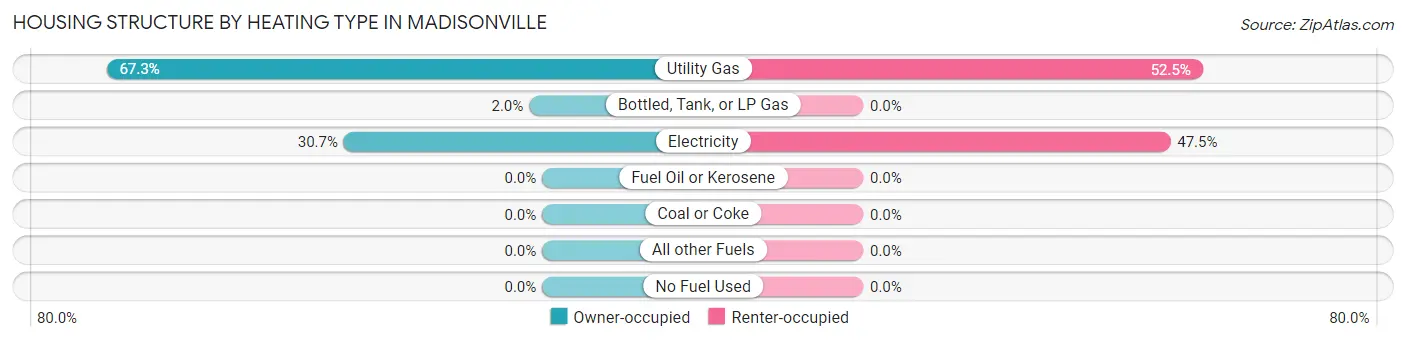
| Heating Type | Owner-occupied | Renter-occupied |
| Utility Gas | 235 (67.3%) | 21 (52.5%) |
| Bottled, Tank, or LP Gas | 7 (2.0%) | 0 (0.0%) |
| Electricity | 107 (30.7%) | 19 (47.5%) |
| Fuel Oil or Kerosene | 0 (0.0%) | 0 (0.0%) |
| Coal or Coke | 0 (0.0%) | 0 (0.0%) |
| All other Fuels | 0 (0.0%) | 0 (0.0%) |
| No Fuel Used | 0 (0.0%) | 0 (0.0%) |
| Total | 349 (100.0%) | 40 (100.0%) |
Household Vehicle Usage in Madisonville
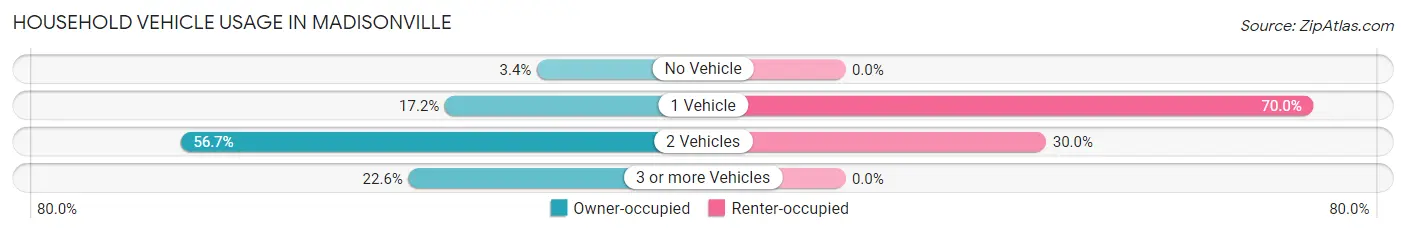
| Vehicles per Household | Owner-occupied | Renter-occupied |
| No Vehicle | 12 (3.4%) | 0 (0.0%) |
| 1 Vehicle | 60 (17.2%) | 28 (70.0%) |
| 2 Vehicles | 198 (56.7%) | 12 (30.0%) |
| 3 or more Vehicles | 79 (22.6%) | 0 (0.0%) |
| Total | 349 (100.0%) | 40 (100.0%) |
Real Estate & Mortgages in Madisonville
Real Estate and Mortgage Overview in Madisonville
| Characteristic | Without Mortgage | With Mortgage |
| Housing Units | 101 | 248 |
| Median Property Value | $370,500 | $385,800 |
| Median Household Income | $93,125 | $94 |
| Monthly Housing Costs | $669 | $62 |
| Real Estate Taxes | $2,771 | $4 |
Property Value by Mortgage Status in Madisonville
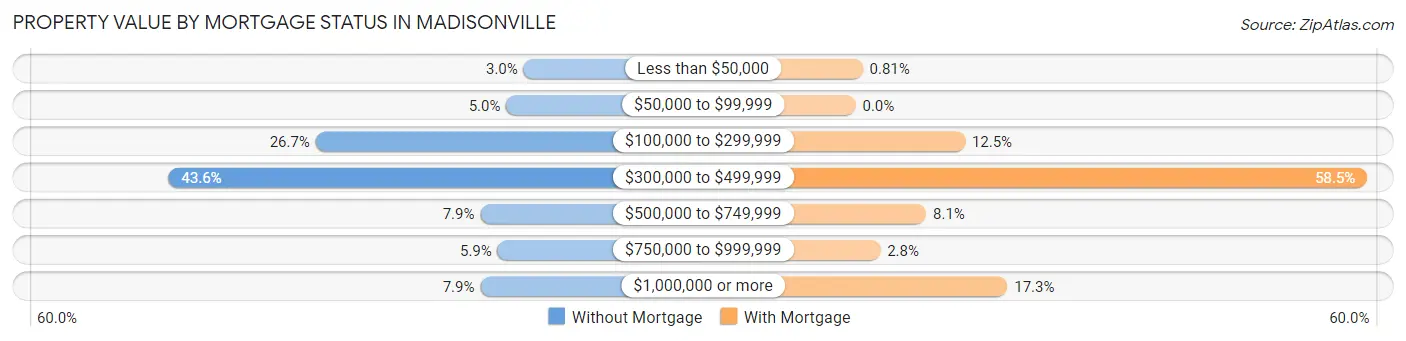
| Property Value | Without Mortgage | With Mortgage |
| Less than $50,000 | 3 (3.0%) | 2 (0.8%) |
| $50,000 to $99,999 | 5 (5.0%) | 0 (0.0%) |
| $100,000 to $299,999 | 27 (26.7%) | 31 (12.5%) |
| $300,000 to $499,999 | 44 (43.6%) | 145 (58.5%) |
| $500,000 to $749,999 | 8 (7.9%) | 20 (8.1%) |
| $750,000 to $999,999 | 6 (5.9%) | 7 (2.8%) |
| $1,000,000 or more | 8 (7.9%) | 43 (17.3%) |
| Total | 101 (100.0%) | 248 (100.0%) |
Household Income by Mortgage Status in Madisonville
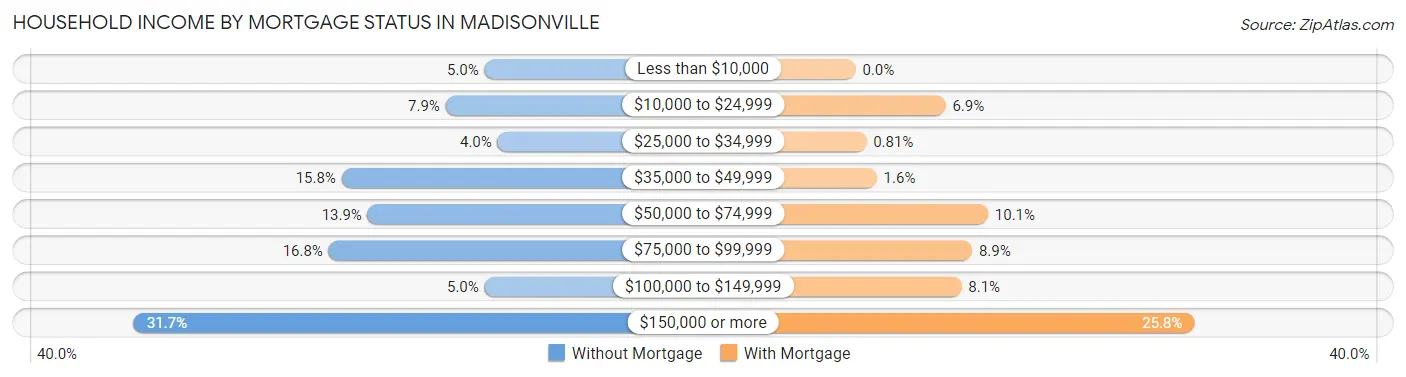
| Household Income | Without Mortgage | With Mortgage |
| Less than $10,000 | 5 (5.0%) | 0 (0.0%) |
| $10,000 to $24,999 | 8 (7.9%) | 17 (6.9%) |
| $25,000 to $34,999 | 4 (4.0%) | 2 (0.8%) |
| $35,000 to $49,999 | 16 (15.8%) | 4 (1.6%) |
| $50,000 to $74,999 | 14 (13.9%) | 25 (10.1%) |
| $75,000 to $99,999 | 17 (16.8%) | 22 (8.9%) |
| $100,000 to $149,999 | 5 (5.0%) | 20 (8.1%) |
| $150,000 or more | 32 (31.7%) | 64 (25.8%) |
| Total | 101 (100.0%) | 248 (100.0%) |
Property Value to Household Income Ratio in Madisonville
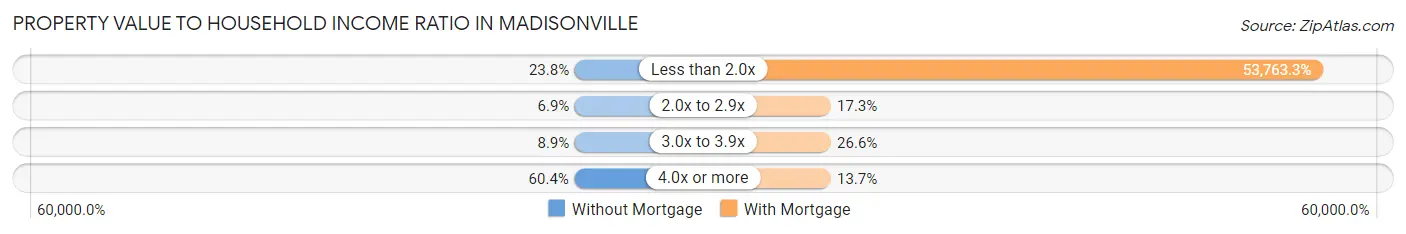
| Value-to-Income Ratio | Without Mortgage | With Mortgage |
| Less than 2.0x | 24 (23.8%) | 133,333 (53,763.3%) |
| 2.0x to 2.9x | 7 (6.9%) | 43 (17.3%) |
| 3.0x to 3.9x | 9 (8.9%) | 66 (26.6%) |
| 4.0x or more | 61 (60.4%) | 34 (13.7%) |
| Total | 101 (100.0%) | 248 (100.0%) |
Real Estate Taxes by Mortgage Status in Madisonville
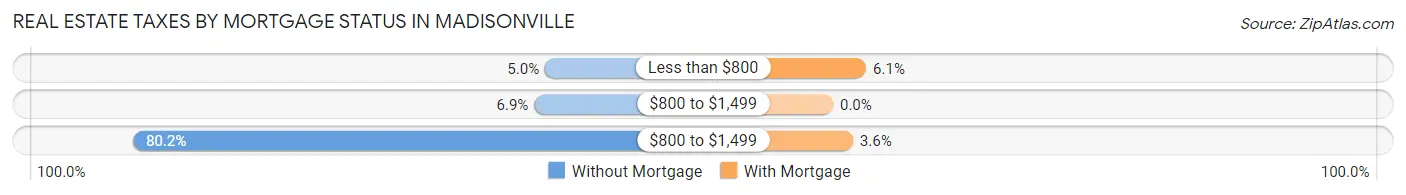
| Property Taxes | Without Mortgage | With Mortgage |
| Less than $800 | 5 (5.0%) | 15 (6.0%) |
| $800 to $1,499 | 7 (6.9%) | 0 (0.0%) |
| $800 to $1,499 | 81 (80.2%) | 9 (3.6%) |
| Total | 101 (100.0%) | 248 (100.0%) |
Health & Disability in Madisonville
Health Insurance Coverage by Age in Madisonville
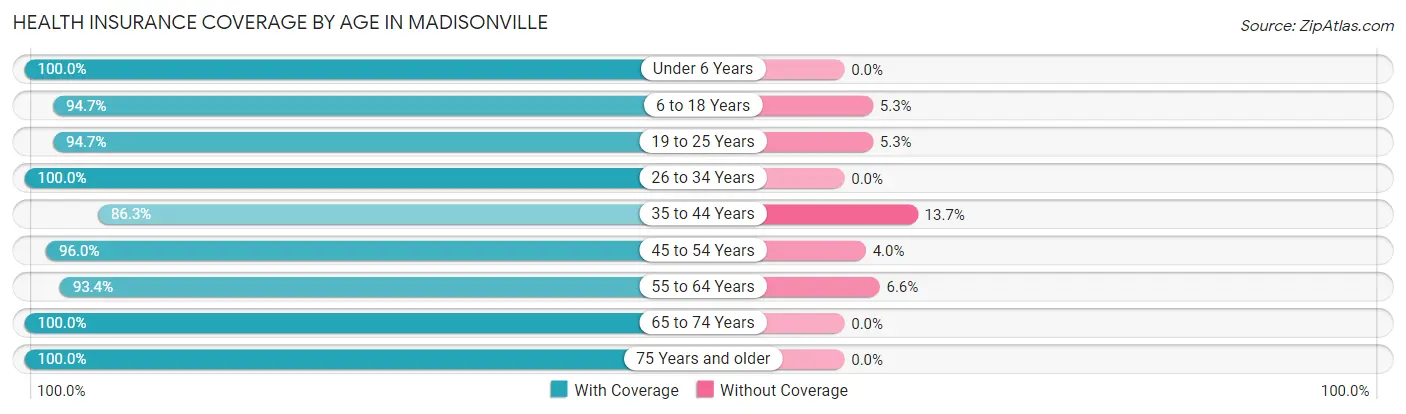
| Age Bracket | With Coverage | Without Coverage |
| Under 6 Years | 49 (100.0%) | 0 (0.0%) |
| 6 to 18 Years | 142 (94.7%) | 8 (5.3%) |
| 19 to 25 Years | 89 (94.7%) | 5 (5.3%) |
| 26 to 34 Years | 74 (100.0%) | 0 (0.0%) |
| 35 to 44 Years | 101 (86.3%) | 16 (13.7%) |
| 45 to 54 Years | 216 (96.0%) | 9 (4.0%) |
| 55 to 64 Years | 128 (93.4%) | 9 (6.6%) |
| 65 to 74 Years | 95 (100.0%) | 0 (0.0%) |
| 75 Years and older | 40 (100.0%) | 0 (0.0%) |
| Total | 934 (95.2%) | 47 (4.8%) |
Health Insurance Coverage by Citizenship Status in Madisonville
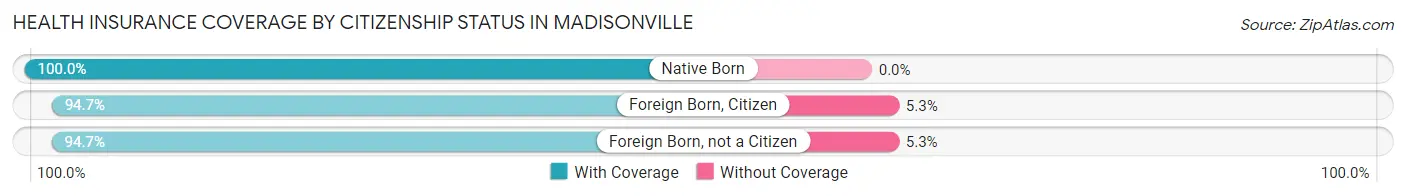
| Citizenship Status | With Coverage | Without Coverage |
| Native Born | 49 (100.0%) | 0 (0.0%) |
| Foreign Born, Citizen | 142 (94.7%) | 8 (5.3%) |
| Foreign Born, not a Citizen | 89 (94.7%) | 5 (5.3%) |
Health Insurance Coverage by Household Income in Madisonville
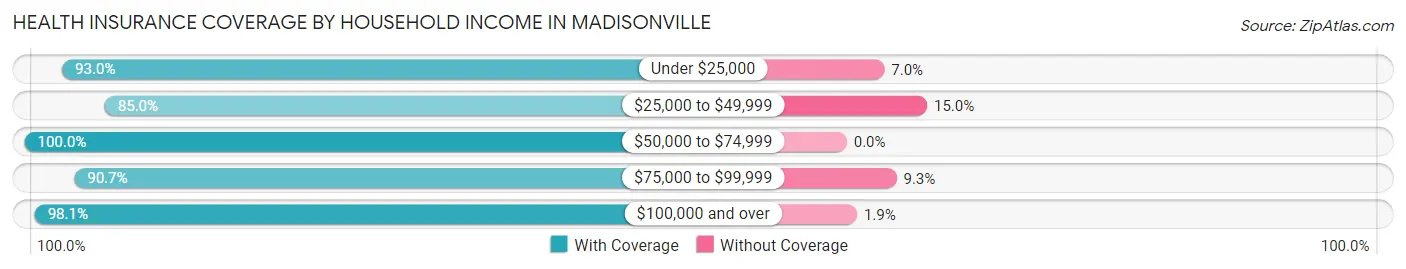
| Household Income | With Coverage | Without Coverage |
| Under $25,000 | 66 (93.0%) | 5 (7.0%) |
| $25,000 to $49,999 | 113 (85.0%) | 20 (15.0%) |
| $50,000 to $74,999 | 84 (100.0%) | 0 (0.0%) |
| $75,000 to $99,999 | 107 (90.7%) | 11 (9.3%) |
| $100,000 and over | 564 (98.1%) | 11 (1.9%) |
Public vs Private Health Insurance Coverage by Age in Madisonville
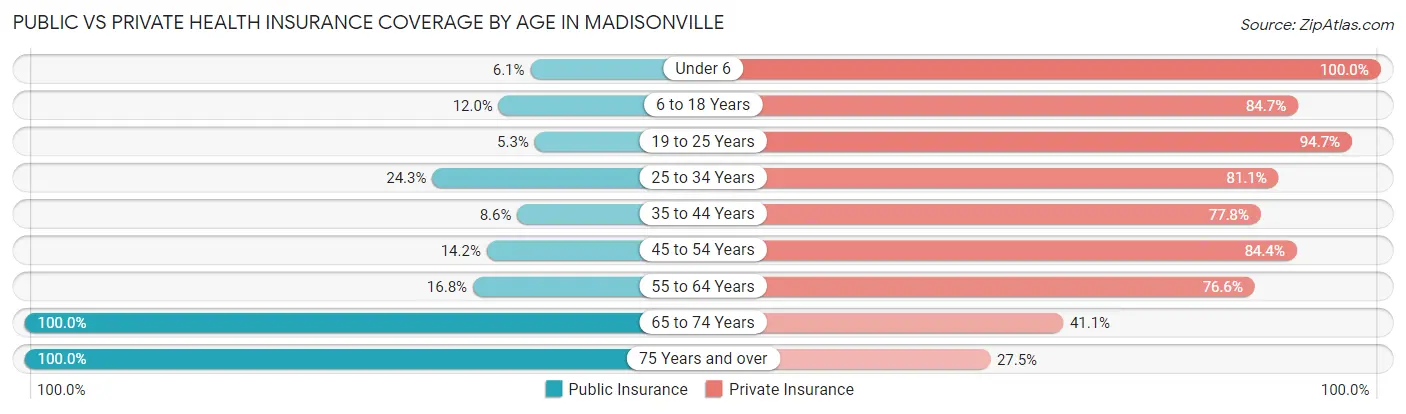
| Age Bracket | Public Insurance | Private Insurance |
| Under 6 | 3 (6.1%) | 49 (100.0%) |
| 6 to 18 Years | 18 (12.0%) | 127 (84.7%) |
| 19 to 25 Years | 5 (5.3%) | 89 (94.7%) |
| 25 to 34 Years | 18 (24.3%) | 60 (81.1%) |
| 35 to 44 Years | 10 (8.6%) | 91 (77.8%) |
| 45 to 54 Years | 32 (14.2%) | 190 (84.4%) |
| 55 to 64 Years | 23 (16.8%) | 105 (76.6%) |
| 65 to 74 Years | 95 (100.0%) | 39 (41.0%) |
| 75 Years and over | 40 (100.0%) | 11 (27.5%) |
| Total | 244 (24.9%) | 761 (77.6%) |
Disability Status by Sex by Age in Madisonville
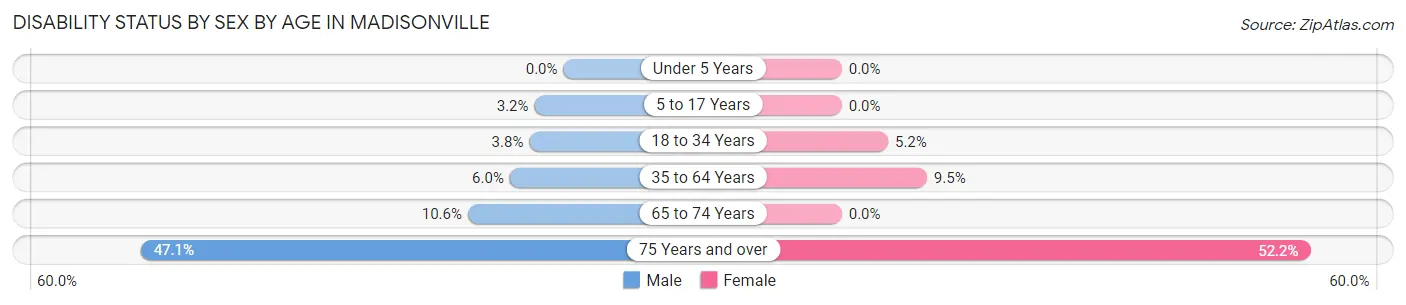
| Age Bracket | Male | Female |
| Under 5 Years | 0 (0.0%) | 0 (0.0%) |
| 5 to 17 Years | 2 (3.2%) | 0 (0.0%) |
| 18 to 34 Years | 3 (3.8%) | 5 (5.1%) |
| 35 to 64 Years | 16 (6.0%) | 20 (9.5%) |
| 65 to 74 Years | 5 (10.6%) | 0 (0.0%) |
| 75 Years and over | 8 (47.1%) | 12 (52.2%) |
Disability Class by Sex by Age in Madisonville
Disability Class: Hearing Difficulty
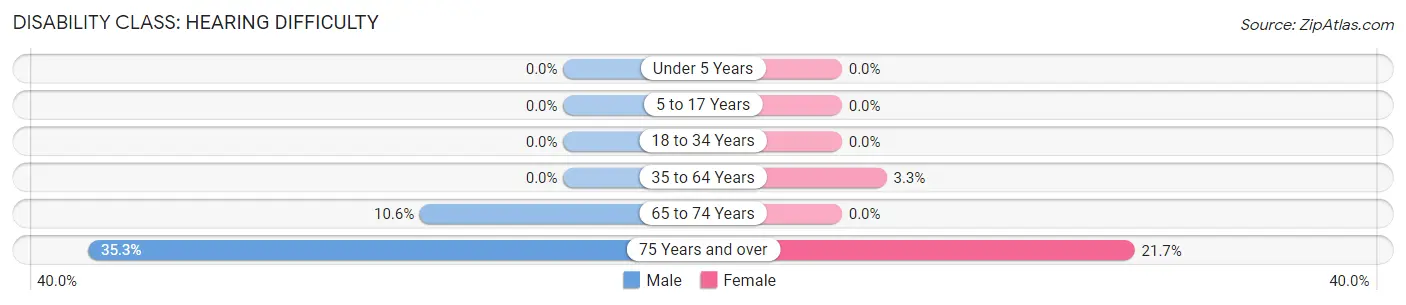
| Age Bracket | Male | Female |
| Under 5 Years | 0 (0.0%) | 0 (0.0%) |
| 5 to 17 Years | 0 (0.0%) | 0 (0.0%) |
| 18 to 34 Years | 0 (0.0%) | 0 (0.0%) |
| 35 to 64 Years | 0 (0.0%) | 7 (3.3%) |
| 65 to 74 Years | 5 (10.6%) | 0 (0.0%) |
| 75 Years and over | 6 (35.3%) | 5 (21.7%) |
Disability Class: Vision Difficulty
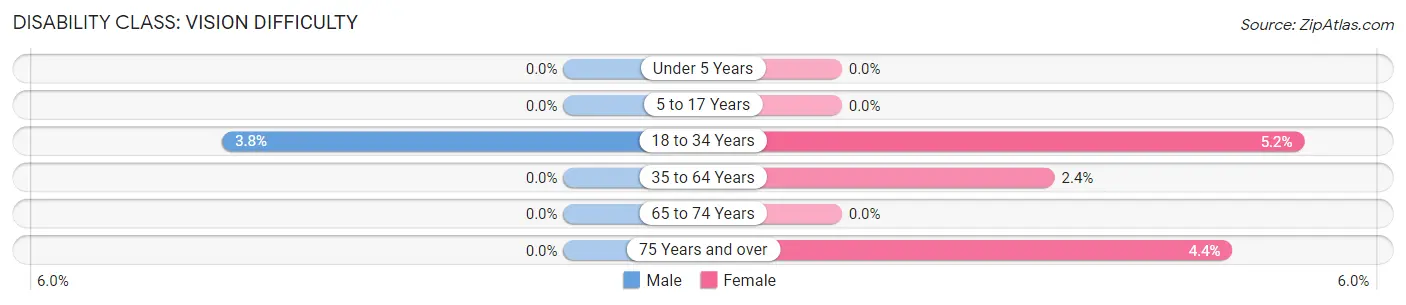
| Age Bracket | Male | Female |
| Under 5 Years | 0 (0.0%) | 0 (0.0%) |
| 5 to 17 Years | 0 (0.0%) | 0 (0.0%) |
| 18 to 34 Years | 3 (3.8%) | 5 (5.1%) |
| 35 to 64 Years | 0 (0.0%) | 5 (2.4%) |
| 65 to 74 Years | 0 (0.0%) | 0 (0.0%) |
| 75 Years and over | 0 (0.0%) | 1 (4.3%) |
Disability Class: Cognitive Difficulty
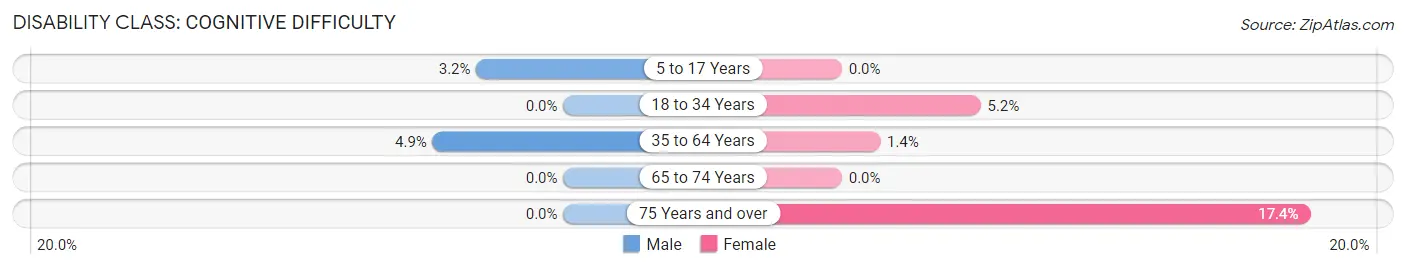
| Age Bracket | Male | Female |
| 5 to 17 Years | 2 (3.2%) | 0 (0.0%) |
| 18 to 34 Years | 0 (0.0%) | 5 (5.1%) |
| 35 to 64 Years | 13 (4.9%) | 3 (1.4%) |
| 65 to 74 Years | 0 (0.0%) | 0 (0.0%) |
| 75 Years and over | 0 (0.0%) | 4 (17.4%) |
Disability Class: Ambulatory Difficulty
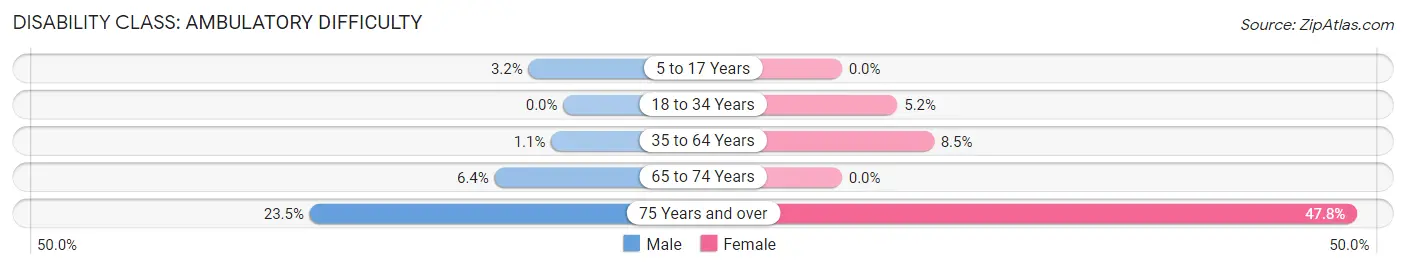
| Age Bracket | Male | Female |
| 5 to 17 Years | 2 (3.2%) | 0 (0.0%) |
| 18 to 34 Years | 0 (0.0%) | 5 (5.1%) |
| 35 to 64 Years | 3 (1.1%) | 18 (8.5%) |
| 65 to 74 Years | 3 (6.4%) | 0 (0.0%) |
| 75 Years and over | 4 (23.5%) | 11 (47.8%) |
Disability Class: Self-Care Difficulty
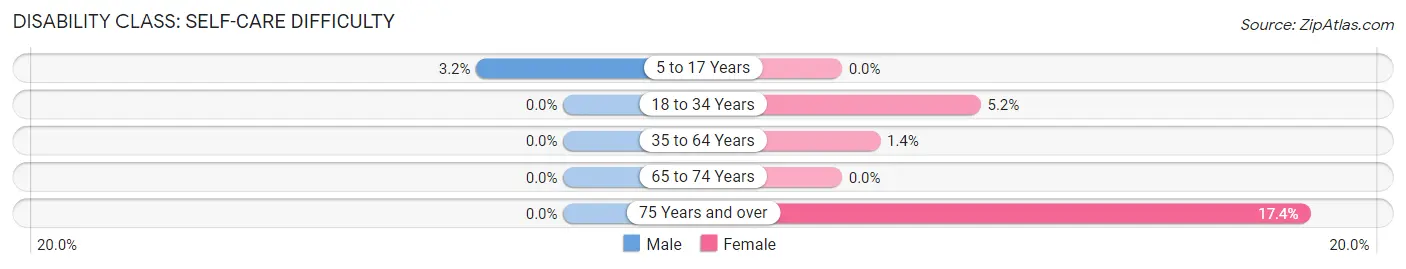
| Age Bracket | Male | Female |
| 5 to 17 Years | 2 (3.2%) | 0 (0.0%) |
| 18 to 34 Years | 0 (0.0%) | 5 (5.1%) |
| 35 to 64 Years | 0 (0.0%) | 3 (1.4%) |
| 65 to 74 Years | 0 (0.0%) | 0 (0.0%) |
| 75 Years and over | 0 (0.0%) | 4 (17.4%) |
Technology Access in Madisonville
Computing Device Access in Madisonville
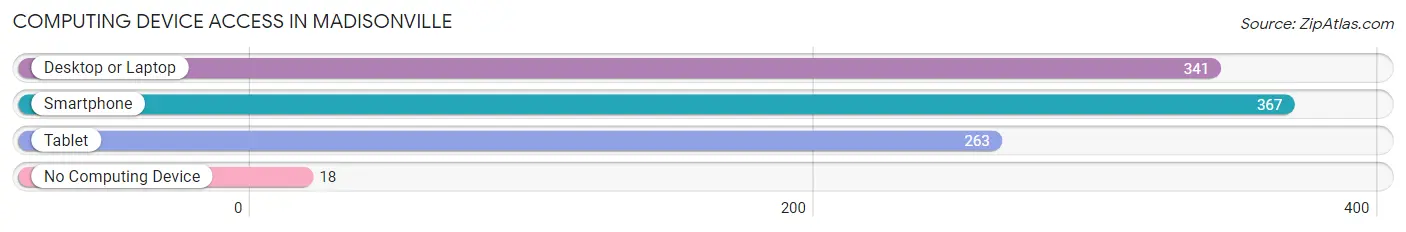
| Device Type | # Households | % Households |
| Desktop or Laptop | 341 | 87.7% |
| Smartphone | 367 | 94.3% |
| Tablet | 263 | 67.6% |
| No Computing Device | 18 | 4.6% |
| Total | 389 | 100.0% |
Internet Access in Madisonville
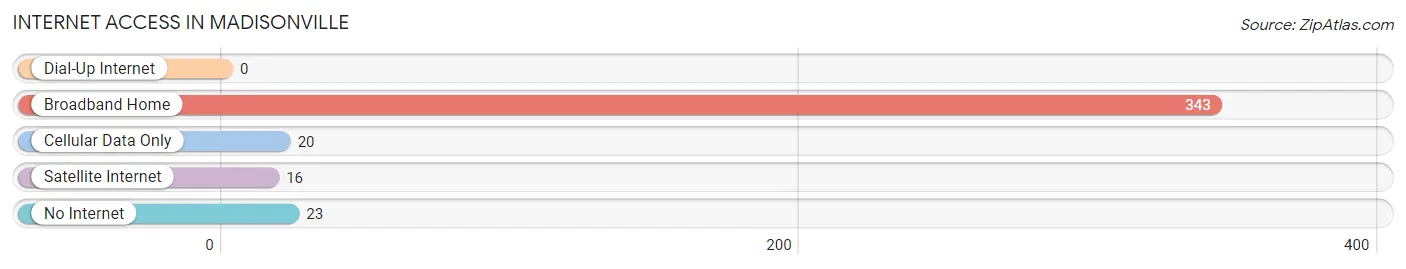
| Internet Type | # Households | % Households |
| Dial-Up Internet | 0 | 0.0% |
| Broadband Home | 343 | 88.2% |
| Cellular Data Only | 20 | 5.1% |
| Satellite Internet | 16 | 4.1% |
| No Internet | 23 | 5.9% |
| Total | 389 | 100.0% |
Madisonville Summary
History
The city of Madisonville, Louisiana is located in St. Tammany Parish, approximately 40 miles north of New Orleans. The city was founded in 1810 by James Madison, the fourth President of the United States. Madisonville was originally known as Madisonville Landing, and was a port of entry for goods and services. The city was incorporated in 1818 and was named after President Madison.
The city of Madisonville has a rich history that dates back to the early 1800s. During the Civil War, Madisonville was a major port for the Confederate Navy. The city was also the site of the Battle of Madisonville, which was fought between Union and Confederate forces in 1862.
In the late 1800s, Madisonville was a popular tourist destination for people from all over the country. The city was known for its beautiful scenery, fishing, and hunting. Madisonville was also home to several resorts, including the Madisonville Hotel, which was built in 1885.
Geography
Madisonville is located in St. Tammany Parish, Louisiana, approximately 40 miles north of New Orleans. The city is situated on the banks of the Tchefuncte River, which is a tributary of Lake Pontchartrain. The city is bordered by the towns of Mandeville, Covington, and Slidell.
The city of Madisonville has a total area of 4.2 square miles, all of which is land. The city has a humid subtropical climate, with hot, humid summers and mild winters. The average temperature in Madisonville is 68 degrees Fahrenheit.
Economy
The economy of Madisonville is largely based on tourism and the service industry. The city is home to several resorts, restaurants, and other tourist attractions. Madisonville is also home to several manufacturing companies, including a paper mill and a boat manufacturing plant.
The city is also home to several educational institutions, including the University of Louisiana at Monroe, Southeastern Louisiana University, and the Northshore Technical Community College.
Demographics
As of the 2010 census, the population of Madisonville was 5,959. The racial makeup of the city was 79.3% White, 15.2% African American, 0.3% Native American, 0.7% Asian, 0.1% Pacific Islander, and 4.4% from other races. The median household income in Madisonville was $45,945, and the median family income was $54,945.
The city of Madisonville is served by the St. Tammany Parish Public School System. The city is also home to several private schools, including St. Joseph's Academy and St. Mary's Academy.
Conclusion
Madisonville, Louisiana is a small city located in St. Tammany Parish, approximately 40 miles north of New Orleans. The city has a rich history that dates back to the early 1800s, and was a major port for the Confederate Navy during the Civil War. The economy of Madisonville is largely based on tourism and the service industry, and the city is home to several educational institutions. As of the 2010 census, the population of Madisonville was 5,959, and the median household income was $45,945.
Common Questions
What is Per Capita Income in Madisonville?
Per Capita income in Madisonville is $49,551.
What is the Median Family Income in Madisonville?
Median Family Income in Madisonville is $109,844.
What is the Median Household income in Madisonville?
Median Household Income in Madisonville is $108,281.
What is Income or Wage Gap in Madisonville?
Income or Wage Gap in Madisonville is 47.7%.
Women in Madisonville earn 52.3 cents for every dollar earned by a man.
What is Family Income Deficit in Madisonville?
Family Income Deficit in Madisonville is $12,221.
Families that are below poverty line in Madisonville earn $12,221 less on average than the poverty threshold level.
What is Inequality or Gini Index in Madisonville?
Inequality or Gini Index in Madisonville is 0.41.
What is the Total Population of Madisonville?
Total Population of Madisonville is 981.
What is the Total Male Population of Madisonville?
Total Male Population of Madisonville is 490.
What is the Total Female Population of Madisonville?
Total Female Population of Madisonville is 491.
What is the Ratio of Males per 100 Females in Madisonville?
There are 99.80 Males per 100 Females in Madisonville.
What is the Ratio of Females per 100 Males in Madisonville?
There are 100.20 Females per 100 Males in Madisonville.
What is the Median Population Age in Madisonville?
Median Population Age in Madisonville is 45.3 Years.
What is the Average Family Size in Madisonville
Average Family Size in Madisonville is 2.9 People.
What is the Average Household Size in Madisonville
Average Household Size in Madisonville is 2.5 People.
How Large is the Labor Force in Madisonville?
There are 512 People in the Labor Forcein in Madisonville.
What is the Percentage of People in the Labor Force in Madisonville?
63.1% of People are in the Labor Force in Madisonville.
What is the Unemployment Rate in Madisonville?
Unemployment Rate in Madisonville is 5.5%.