Luling, LA Map & Demographics
Luling Map
Luling Overview
$36,414
PER CAPITA INCOME
$99,049
AVG FAMILY INCOME
$83,031
AVG HOUSEHOLD INCOME
23.6%
WAGE / INCOME GAP [ % ]
76.4¢/ $1
WAGE / INCOME GAP [ $ ]
$7,113
FAMILY INCOME DEFICIT
0.40
INEQUALITY / GINI INDEX
14,207
TOTAL POPULATION
6,822
MALE POPULATION
7,385
FEMALE POPULATION
92.38
MALES / 100 FEMALES
108.25
FEMALES / 100 MALES
37.6
MEDIAN AGE
3.3
AVG FAMILY SIZE
2.8
AVG HOUSEHOLD SIZE
7,242
LABOR FORCE [ PEOPLE ]
66.8%
PERCENT IN LABOR FORCE
4.8%
UNEMPLOYMENT RATE
Luling Zip Codes
Luling Area Codes
Income in Luling
Income Overview in Luling
Per Capita Income in Luling is $36,414, while median incomes of families and households are $99,049 and $83,031 respectively.
| Characteristic | Number | Measure |
| Per Capita Income | 14,207 | $36,414 |
| Median Family Income | 3,715 | $99,049 |
| Mean Family Income | 3,715 | $111,167 |
| Median Household Income | 5,009 | $83,031 |
| Mean Household Income | 5,009 | $100,604 |
| Income Deficit | 3,715 | $7,113 |
| Wage / Income Gap (%) | 14,207 | 23.63% |
| Wage / Income Gap ($) | 14,207 | 76.37¢ per $1 |
| Gini / Inequality Index | 14,207 | 0.40 |
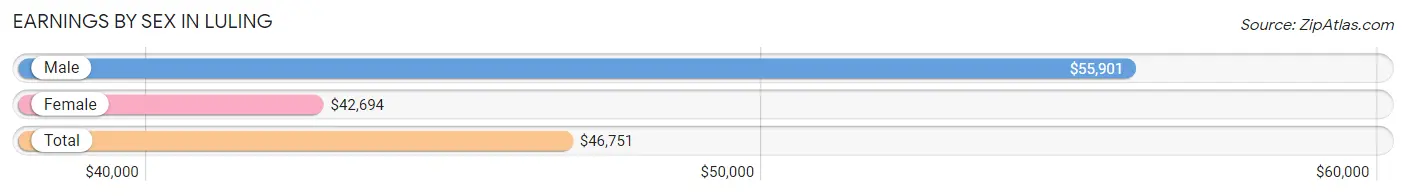
Earnings by Sex in Luling
Average Earnings in Luling are $46,751, $55,901 for men and $42,694 for women, a difference of 23.6%.
| Sex | Number | Average Earnings |
| Male | 3,888 (52.8%) | $55,901 |
| Female | 3,473 (47.2%) | $42,694 |
| Total | 7,361 (100.0%) | $46,751 |
Earnings by Sex by Income Bracket in Luling
The most common earnings brackets in Luling are $100,000+ for men (923 | 23.7%) and $55,000 to $64,999 for women (491 | 14.1%).
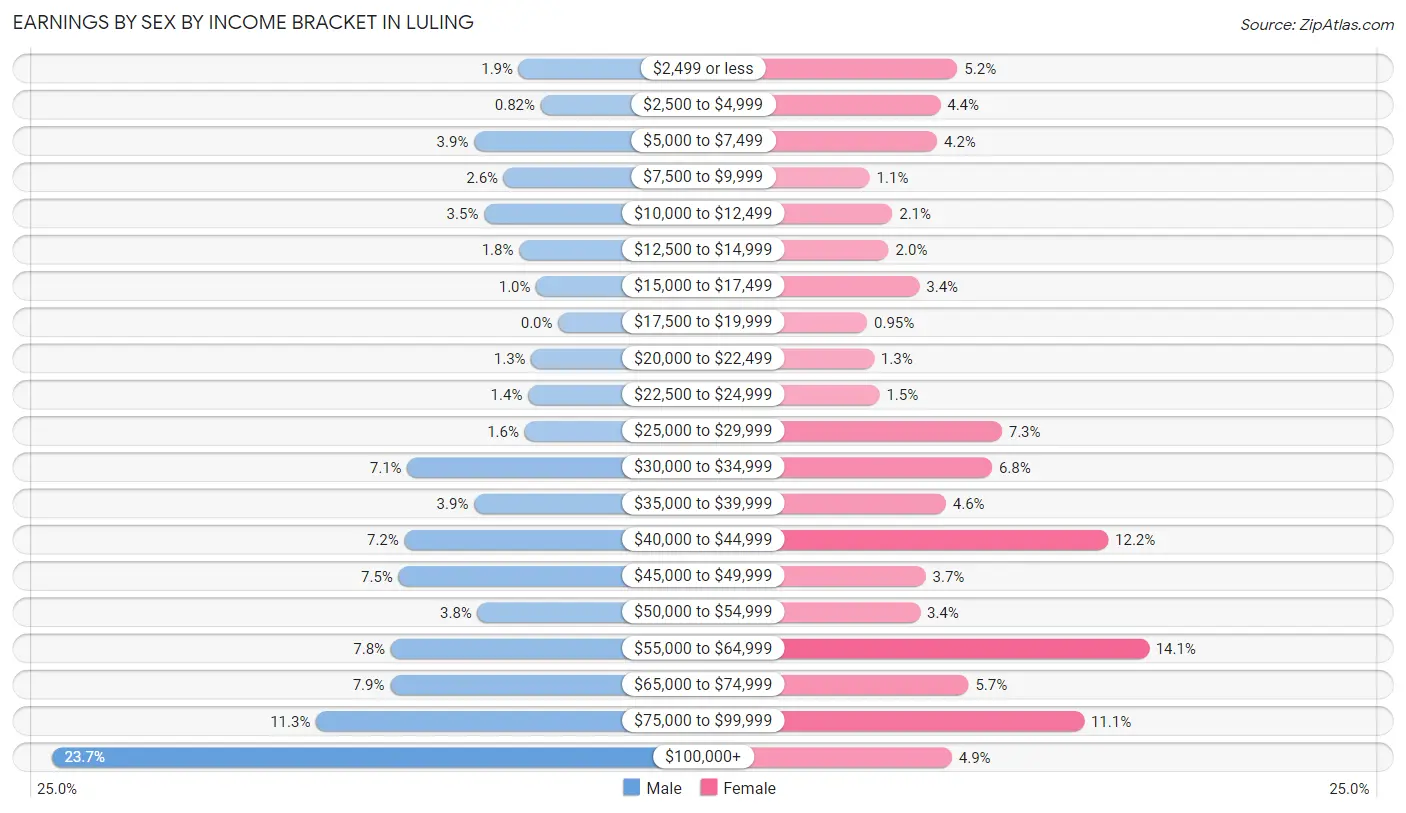
| Income | Male | Female |
| $2,499 or less | 72 (1.8%) | 180 (5.2%) |
| $2,500 to $4,999 | 32 (0.8%) | 152 (4.4%) |
| $5,000 to $7,499 | 153 (3.9%) | 147 (4.2%) |
| $7,500 to $9,999 | 99 (2.5%) | 37 (1.1%) |
| $10,000 to $12,499 | 135 (3.5%) | 74 (2.1%) |
| $12,500 to $14,999 | 71 (1.8%) | 68 (2.0%) |
| $15,000 to $17,499 | 40 (1.0%) | 118 (3.4%) |
| $17,500 to $19,999 | 0 (0.0%) | 33 (0.9%) |
| $20,000 to $22,499 | 49 (1.3%) | 44 (1.3%) |
| $22,500 to $24,999 | 55 (1.4%) | 53 (1.5%) |
| $25,000 to $29,999 | 61 (1.6%) | 252 (7.3%) |
| $30,000 to $34,999 | 275 (7.1%) | 236 (6.8%) |
| $35,000 to $39,999 | 153 (3.9%) | 161 (4.6%) |
| $40,000 to $44,999 | 280 (7.2%) | 425 (12.2%) |
| $45,000 to $49,999 | 291 (7.5%) | 128 (3.7%) |
| $50,000 to $54,999 | 147 (3.8%) | 119 (3.4%) |
| $55,000 to $64,999 | 305 (7.8%) | 491 (14.1%) |
| $65,000 to $74,999 | 306 (7.9%) | 198 (5.7%) |
| $75,000 to $99,999 | 441 (11.3%) | 386 (11.1%) |
| $100,000+ | 923 (23.7%) | 171 (4.9%) |
| Total | 3,888 (100.0%) | 3,473 (100.0%) |
Earnings by Sex by Educational Attainment in Luling
Average earnings in Luling are $61,694 for men and $44,219 for women, a difference of 28.3%. Men with an educational attainment of graduate degree enjoy the highest average annual earnings of $98,906, while those with less than high school education earn the least with $41,895. Women with an educational attainment of graduate degree earn the most with the average annual earnings of $57,088, while those with less than high school education have the smallest earnings of $30,200.
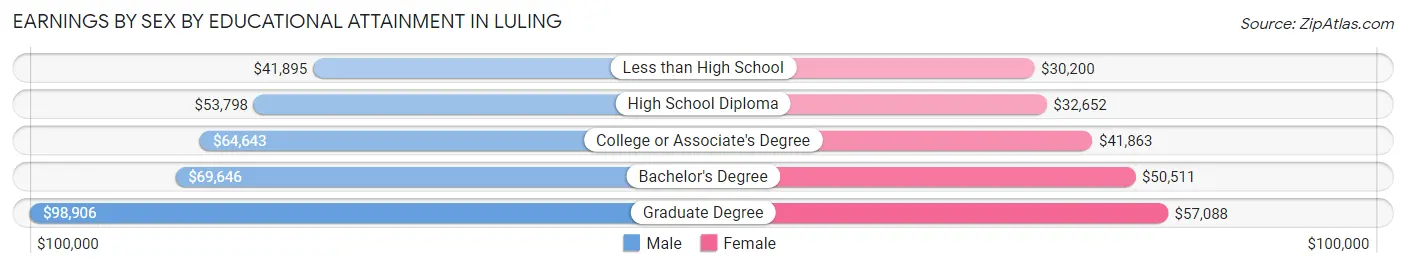
| Educational Attainment | Male Income | Female Income |
| Less than High School | $41,895 | $30,200 |
| High School Diploma | $53,798 | $32,652 |
| College or Associate's Degree | $64,643 | $41,863 |
| Bachelor's Degree | $69,646 | $50,511 |
| Graduate Degree | $98,906 | $57,088 |
| Total | $61,694 | $44,219 |
Family Income in Luling
Family Income Brackets in Luling
According to the Luling family income data, there are 713 families falling into the $100,000 to $149,999 income range, which is the most common income bracket and makes up 19.2% of all families. Conversely, the less than $10,000 income bracket is the least frequent group with only 67 families (1.8%) belonging to this category.
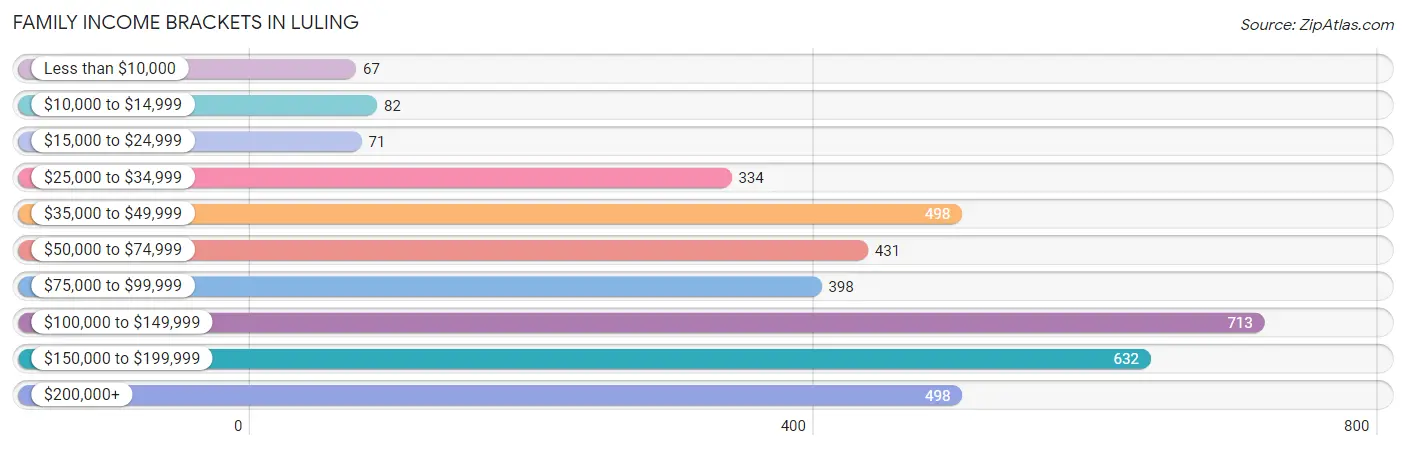
| Income Bracket | # Families | % Families |
| Less than $10,000 | 67 | 1.8% |
| $10,000 to $14,999 | 82 | 2.2% |
| $15,000 to $24,999 | 71 | 1.9% |
| $25,000 to $34,999 | 334 | 9.0% |
| $35,000 to $49,999 | 498 | 13.4% |
| $50,000 to $74,999 | 431 | 11.6% |
| $75,000 to $99,999 | 398 | 10.7% |
| $100,000 to $149,999 | 713 | 19.2% |
| $150,000 to $199,999 | 632 | 17.0% |
| $200,000+ | 498 | 13.4% |
Family Income by Famaliy Size in Luling
4-person families (943 | 25.4%) account for the highest median family income in Luling with $155,950 per family, while 4-person families (943 | 25.4%) have the highest median income of $38,988 per family member.
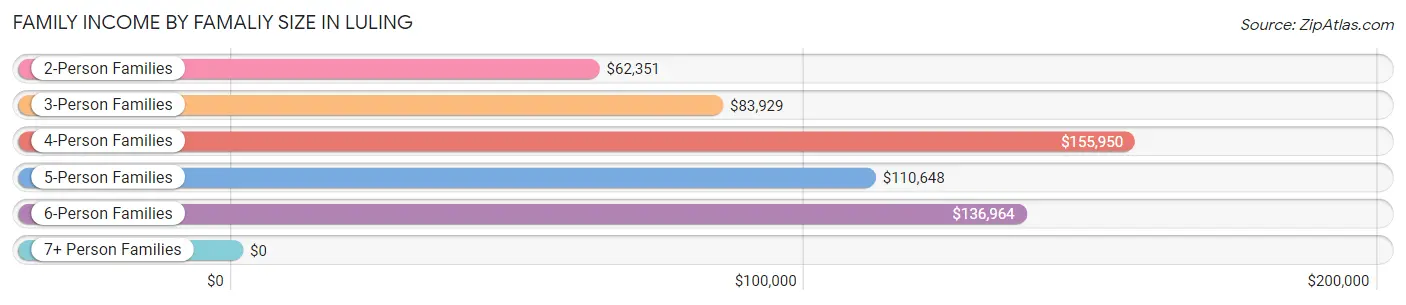
| Income Bracket | # Families | Median Income |
| 2-Person Families | 1,225 (33.0%) | $62,351 |
| 3-Person Families | 1,156 (31.1%) | $83,929 |
| 4-Person Families | 943 (25.4%) | $155,950 |
| 5-Person Families | 336 (9.0%) | $110,648 |
| 6-Person Families | 27 (0.7%) | $136,964 |
| 7+ Person Families | 28 (0.7%) | $0 |
| Total | 3,715 (100.0%) | $99,049 |
Family Income by Number of Earners in Luling
The median family income in Luling is $99,049, with families comprising 3+ earners (435) having the highest median family income of $160,234, while families with no earners (484) have the lowest median family income of $33,173, accounting for 11.7% and 13.0% of families, respectively.
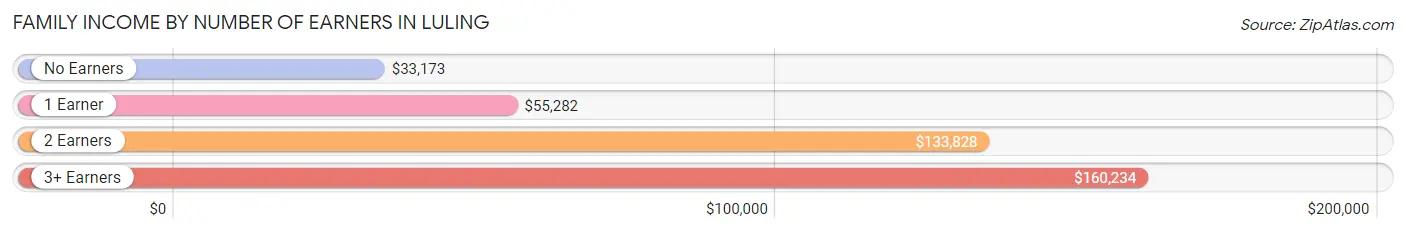
| Number of Earners | # Families | Median Income |
| No Earners | 484 (13.0%) | $33,173 |
| 1 Earner | 1,065 (28.7%) | $55,282 |
| 2 Earners | 1,731 (46.6%) | $133,828 |
| 3+ Earners | 435 (11.7%) | $160,234 |
| Total | 3,715 (100.0%) | $99,049 |
Household Income in Luling
Household Income Brackets in Luling
With 862 households falling in the category, the $100,000 to $149,999 income range is the most frequent in Luling, accounting for 17.2% of all households. In contrast, only 120 households (2.4%) fall into the $10,000 to $14,999 income bracket, making it the least populous group.
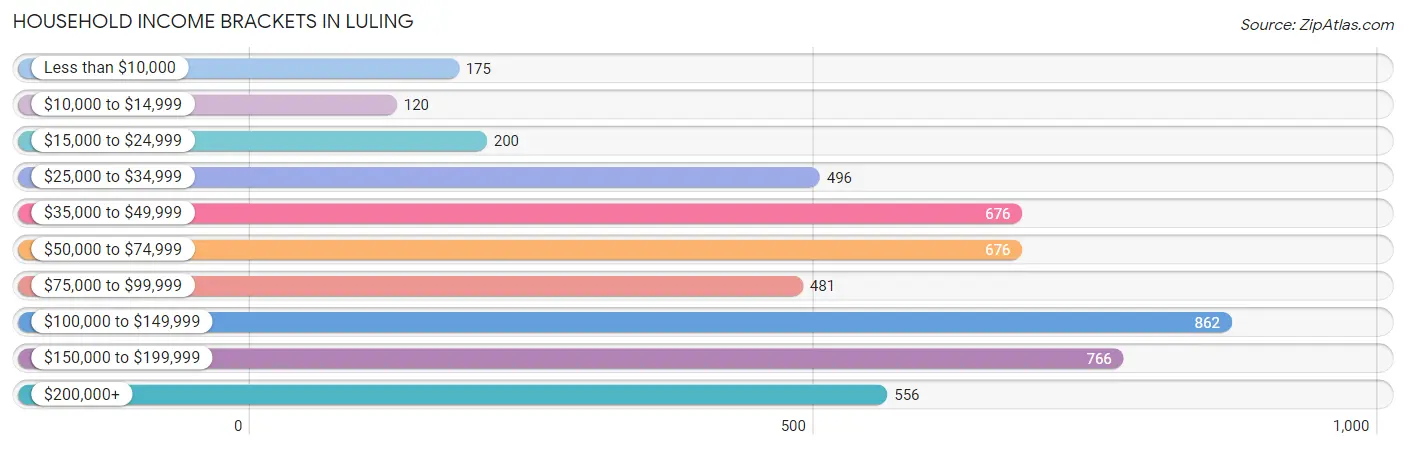
| Income Bracket | # Households | % Households |
| Less than $10,000 | 175 | 3.5% |
| $10,000 to $14,999 | 120 | 2.4% |
| $15,000 to $24,999 | 200 | 4.0% |
| $25,000 to $34,999 | 496 | 9.9% |
| $35,000 to $49,999 | 676 | 13.5% |
| $50,000 to $74,999 | 676 | 13.5% |
| $75,000 to $99,999 | 481 | 9.6% |
| $100,000 to $149,999 | 862 | 17.2% |
| $150,000 to $199,999 | 766 | 15.3% |
| $200,000+ | 556 | 11.1% |
Household Income by Householder Age in Luling
The median household income in Luling is $83,031, with the highest median household income of $97,726 found in the 25 to 44 years age bracket for the primary householder. A total of 1,791 households (35.8%) fall into this category. Meanwhile, the 15 to 24 years age bracket for the primary householder has the lowest median household income of $0, with 52 households (1.0%) in this group.
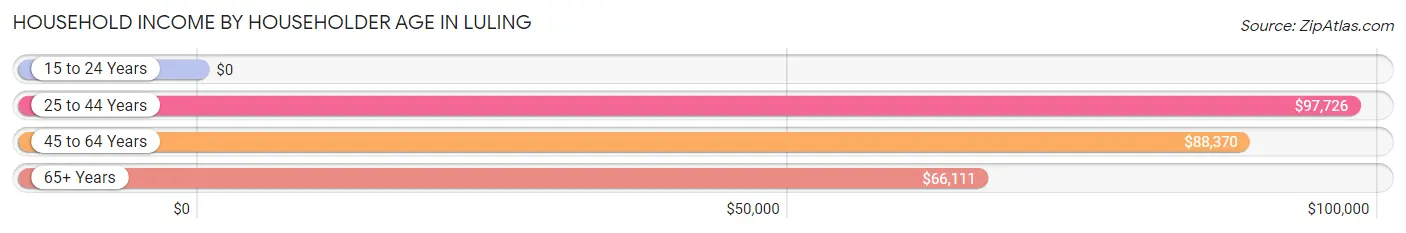
| Income Bracket | # Households | Median Income |
| 15 to 24 Years | 52 (1.0%) | $0 |
| 25 to 44 Years | 1,791 (35.8%) | $97,726 |
| 45 to 64 Years | 2,116 (42.2%) | $88,370 |
| 65+ Years | 1,050 (21.0%) | $66,111 |
| Total | 5,009 (100.0%) | $83,031 |
Poverty in Luling
Income Below Poverty by Sex and Age in Luling
With 9.5% poverty level for males and 12.6% for females among the residents of Luling, under 5 year old males and 25 to 34 year old females are the most vulnerable to poverty, with 137 males (41.9%) and 262 females (29.1%) in their respective age groups living below the poverty level.
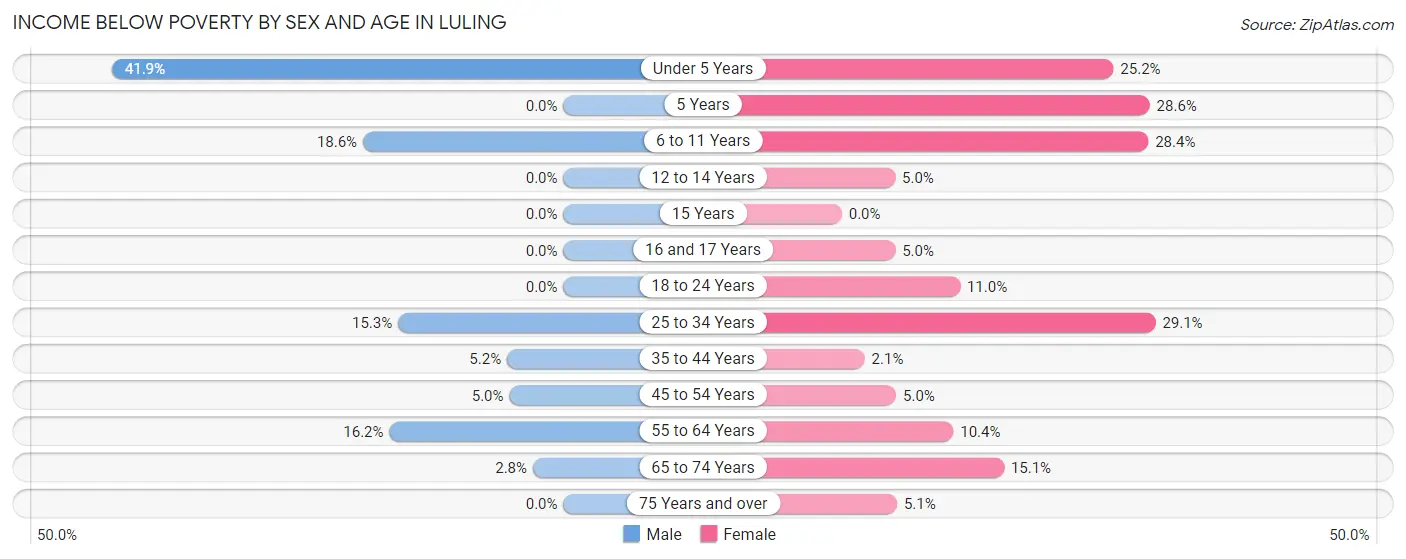
| Age Bracket | Male | Female |
| Under 5 Years | 137 (41.9%) | 120 (25.2%) |
| 5 Years | 0 (0.0%) | 6 (28.6%) |
| 6 to 11 Years | 130 (18.6%) | 180 (28.4%) |
| 12 to 14 Years | 0 (0.0%) | 30 (5.0%) |
| 15 Years | 0 (0.0%) | 0 (0.0%) |
| 16 and 17 Years | 0 (0.0%) | 14 (5.0%) |
| 18 to 24 Years | 0 (0.0%) | 51 (11.0%) |
| 25 to 34 Years | 125 (15.3%) | 262 (29.1%) |
| 35 to 44 Years | 63 (5.2%) | 23 (2.1%) |
| 45 to 54 Years | 39 (5.0%) | 64 (5.0%) |
| 55 to 64 Years | 135 (16.2%) | 68 (10.3%) |
| 65 to 74 Years | 16 (2.8%) | 90 (15.0%) |
| 75 Years and over | 0 (0.0%) | 17 (5.1%) |
| Total | 645 (9.5%) | 925 (12.6%) |
Income Above Poverty by Sex and Age in Luling
According to the poverty statistics in Luling, males aged 5 years and females aged 15 years are the age groups that are most secure financially, with 100.0% of males and 100.0% of females in these age groups living above the poverty line.
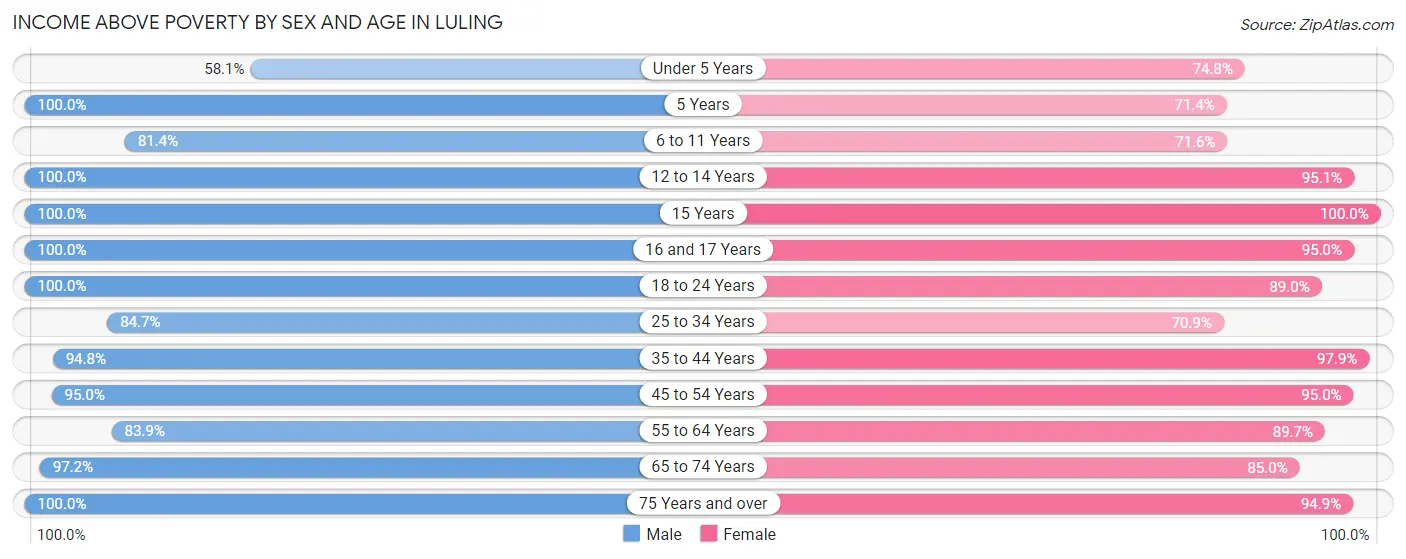
| Age Bracket | Male | Female |
| Under 5 Years | 190 (58.1%) | 356 (74.8%) |
| 5 Years | 90 (100.0%) | 15 (71.4%) |
| 6 to 11 Years | 569 (81.4%) | 453 (71.6%) |
| 12 to 14 Years | 396 (100.0%) | 576 (95.1%) |
| 15 Years | 115 (100.0%) | 3 (100.0%) |
| 16 and 17 Years | 244 (100.0%) | 268 (95.0%) |
| 18 to 24 Years | 568 (100.0%) | 414 (89.0%) |
| 25 to 34 Years | 690 (84.7%) | 638 (70.9%) |
| 35 to 44 Years | 1,142 (94.8%) | 1,060 (97.9%) |
| 45 to 54 Years | 739 (95.0%) | 1,207 (95.0%) |
| 55 to 64 Years | 701 (83.9%) | 589 (89.6%) |
| 65 to 74 Years | 549 (97.2%) | 508 (85.0%) |
| 75 Years and over | 161 (100.0%) | 315 (94.9%) |
| Total | 6,154 (90.5%) | 6,402 (87.4%) |
Income Below Poverty Among Married-Couple Families in Luling
The poverty statistics for married-couple families in Luling show that 3.0% or 80 of the total 2,638 families live below the poverty line. Families with 3 or 4 children have the highest poverty rate of 6.5%, comprising of 14 families. On the other hand, families with 1 or 2 children have the lowest poverty rate of 0.0%, which includes 0 families.
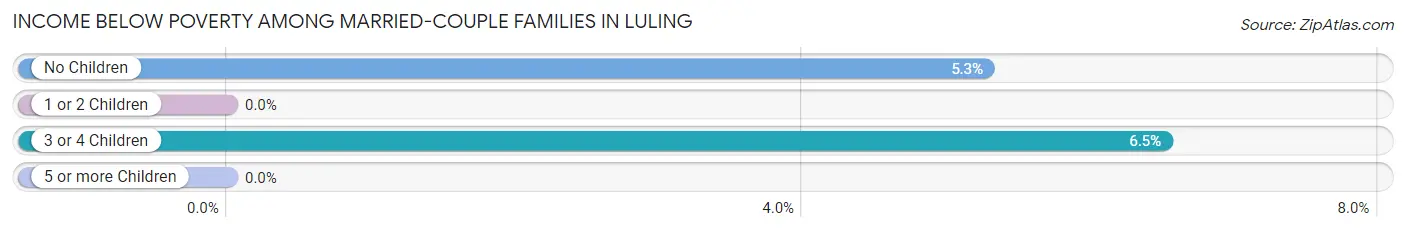
| Children | Above Poverty | Below Poverty |
| No Children | 1,187 (94.7%) | 66 (5.3%) |
| 1 or 2 Children | 1,154 (100.0%) | 0 (0.0%) |
| 3 or 4 Children | 201 (93.5%) | 14 (6.5%) |
| 5 or more Children | 16 (100.0%) | 0 (0.0%) |
| Total | 2,558 (97.0%) | 80 (3.0%) |
Income Below Poverty Among Single-Parent Households in Luling
According to the poverty data in Luling, 49.6% or 59 single-father households and 17.6% or 169 single-mother households are living below the poverty line. Among single-father households, those with no children have the highest poverty rate, with 35 households (76.1%) experiencing poverty. Likewise, among single-mother households, those with 3 or 4 children have the highest poverty rate, with 114 households (85.7%) falling below the poverty line.
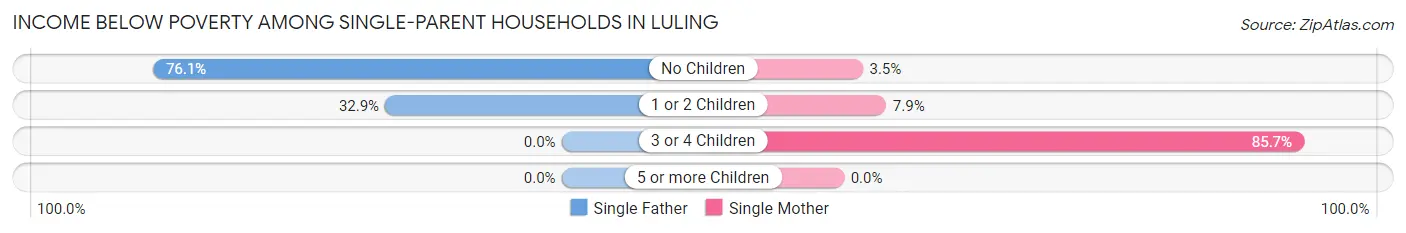
| Children | Single Father | Single Mother |
| No Children | 35 (76.1%) | 8 (3.5%) |
| 1 or 2 Children | 24 (32.9%) | 47 (7.9%) |
| 3 or 4 Children | 0 (0.0%) | 114 (85.7%) |
| 5 or more Children | 0 (0.0%) | 0 (0.0%) |
| Total | 59 (49.6%) | 169 (17.6%) |
Income Below Poverty Among Married-Couple vs Single-Parent Households in Luling
The poverty data for Luling shows that 80 of the married-couple family households (3.0%) and 228 of the single-parent households (21.2%) are living below the poverty level. Within the married-couple family households, those with 3 or 4 children have the highest poverty rate, with 14 households (6.5%) falling below the poverty line. Among the single-parent households, those with 3 or 4 children have the highest poverty rate, with 114 household (85.7%) living below poverty.
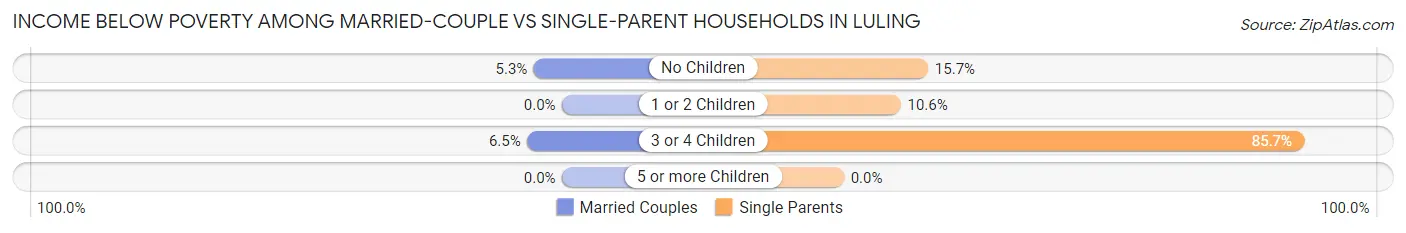
| Children | Married-Couple Families | Single-Parent Households |
| No Children | 66 (5.3%) | 43 (15.7%) |
| 1 or 2 Children | 0 (0.0%) | 71 (10.6%) |
| 3 or 4 Children | 14 (6.5%) | 114 (85.7%) |
| 5 or more Children | 0 (0.0%) | 0 (0.0%) |
| Total | 80 (3.0%) | 228 (21.2%) |
Race in Luling
The most populous races in Luling are White / Caucasian (9,833 | 69.2%), Black / African American (2,411 | 17.0%), and Two or more Races (1,036 | 7.3%).
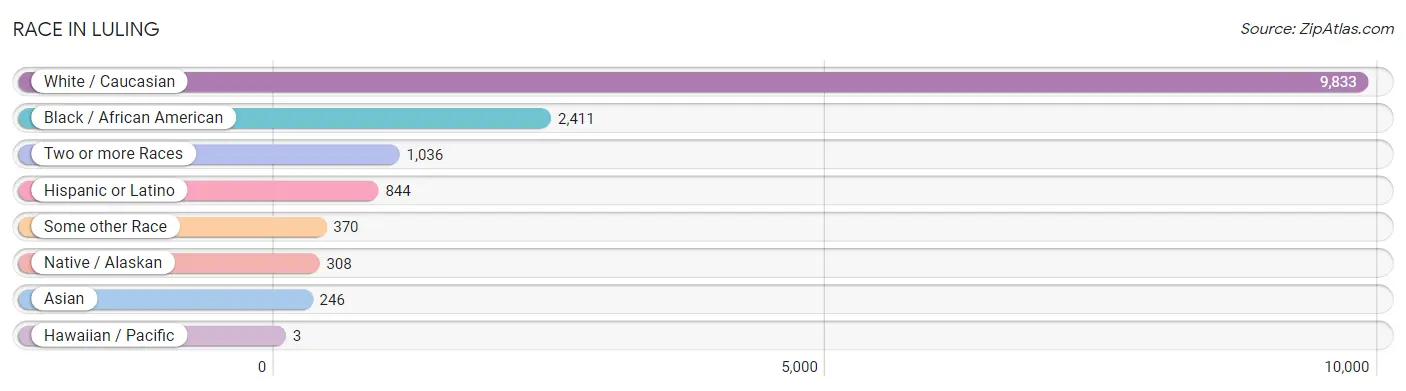
| Race | # Population | % Population |
| Asian | 246 | 1.7% |
| Black / African American | 2,411 | 17.0% |
| Hawaiian / Pacific | 3 | 0.0% |
| Hispanic or Latino | 844 | 5.9% |
| Native / Alaskan | 308 | 2.2% |
| White / Caucasian | 9,833 | 69.2% |
| Two or more Races | 1,036 | 7.3% |
| Some other Race | 370 | 2.6% |
| Total | 14,207 | 100.0% |
Ancestry in Luling
The most populous ancestries reported in Luling are French (2,213 | 15.6%), German (1,526 | 10.7%), American (1,161 | 8.2%), Irish (1,055 | 7.4%), and Italian (1,031 | 7.3%), together accounting for 49.2% of all Luling residents.
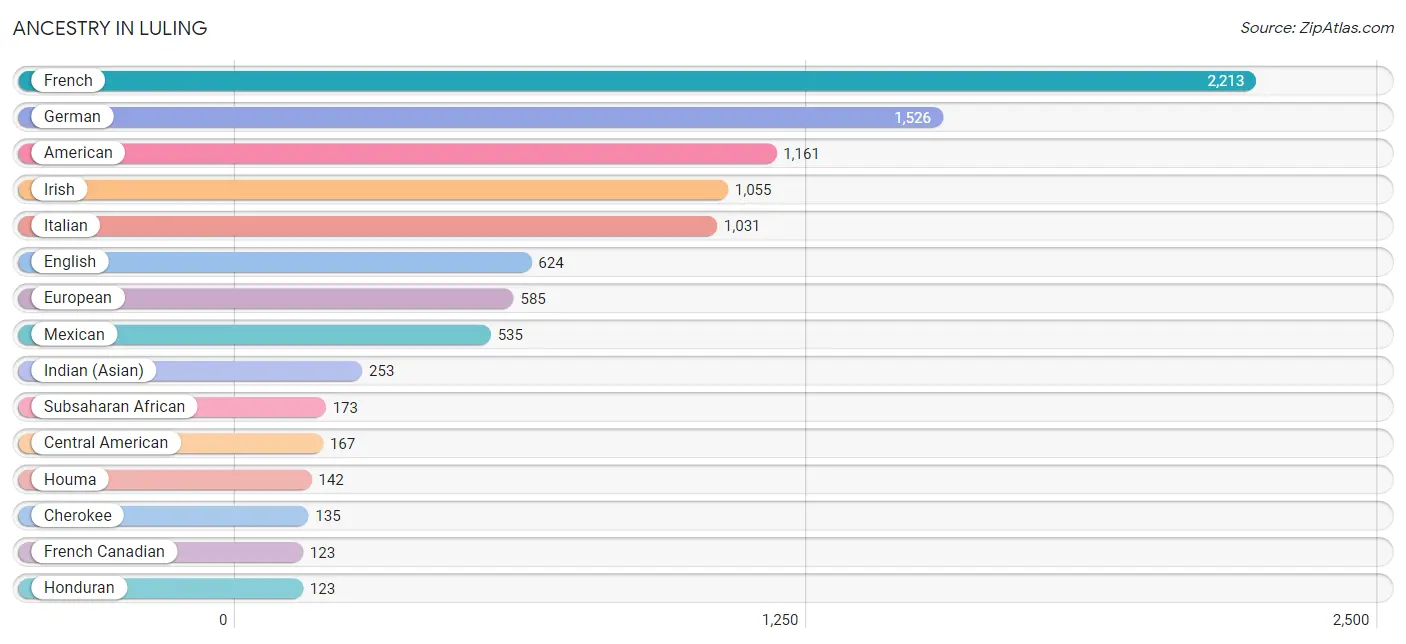
| Ancestry | # Population | % Population |
| African | 101 | 0.7% |
| American | 1,161 | 8.2% |
| Arab | 26 | 0.2% |
| Basque | 5 | 0.0% |
| Bhutanese | 21 | 0.2% |
| Brazilian | 14 | 0.1% |
| British | 9 | 0.1% |
| Burmese | 22 | 0.2% |
| Cajun | 62 | 0.4% |
| Central American | 167 | 1.2% |
| Cherokee | 135 | 0.9% |
| Choctaw | 8 | 0.1% |
| Dominican | 19 | 0.1% |
| English | 624 | 4.4% |
| European | 585 | 4.1% |
| French | 2,213 | 15.6% |
| French American Indian | 7 | 0.1% |
| French Canadian | 123 | 0.9% |
| German | 1,526 | 10.7% |
| Guatemalan | 27 | 0.2% |
| Haitian | 43 | 0.3% |
| Honduran | 123 | 0.9% |
| Houma | 142 | 1.0% |
| Hungarian | 15 | 0.1% |
| Indian (Asian) | 253 | 1.8% |
| Irish | 1,055 | 7.4% |
| Italian | 1,031 | 7.3% |
| Korean | 17 | 0.1% |
| Lumbee | 73 | 0.5% |
| Mexican | 535 | 3.8% |
| Native Hawaiian | 25 | 0.2% |
| Northern European | 4 | 0.0% |
| Norwegian | 45 | 0.3% |
| Polish | 71 | 0.5% |
| Portuguese | 18 | 0.1% |
| Puerto Rican | 53 | 0.4% |
| Russian | 19 | 0.1% |
| Salvadoran | 17 | 0.1% |
| Samoan | 22 | 0.2% |
| Scandinavian | 54 | 0.4% |
| Scotch-Irish | 93 | 0.6% |
| Scottish | 93 | 0.6% |
| Seminole | 85 | 0.6% |
| South African | 72 | 0.5% |
| South American | 11 | 0.1% |
| Spanish | 59 | 0.4% |
| Sri Lankan | 66 | 0.5% |
| Subsaharan African | 173 | 1.2% |
| Swedish | 33 | 0.2% |
| Swiss | 12 | 0.1% |
| Thai | 15 | 0.1% |
| Venezuelan | 11 | 0.1% | View All 52 Rows |
Immigrants in Luling
The most numerous immigrant groups reported in Luling came from Latin America (256 | 1.8%), Central America (211 | 1.5%), Asia (181 | 1.3%), Eastern Asia (155 | 1.1%), and China (147 | 1.0%), together accounting for 6.7% of all Luling residents.
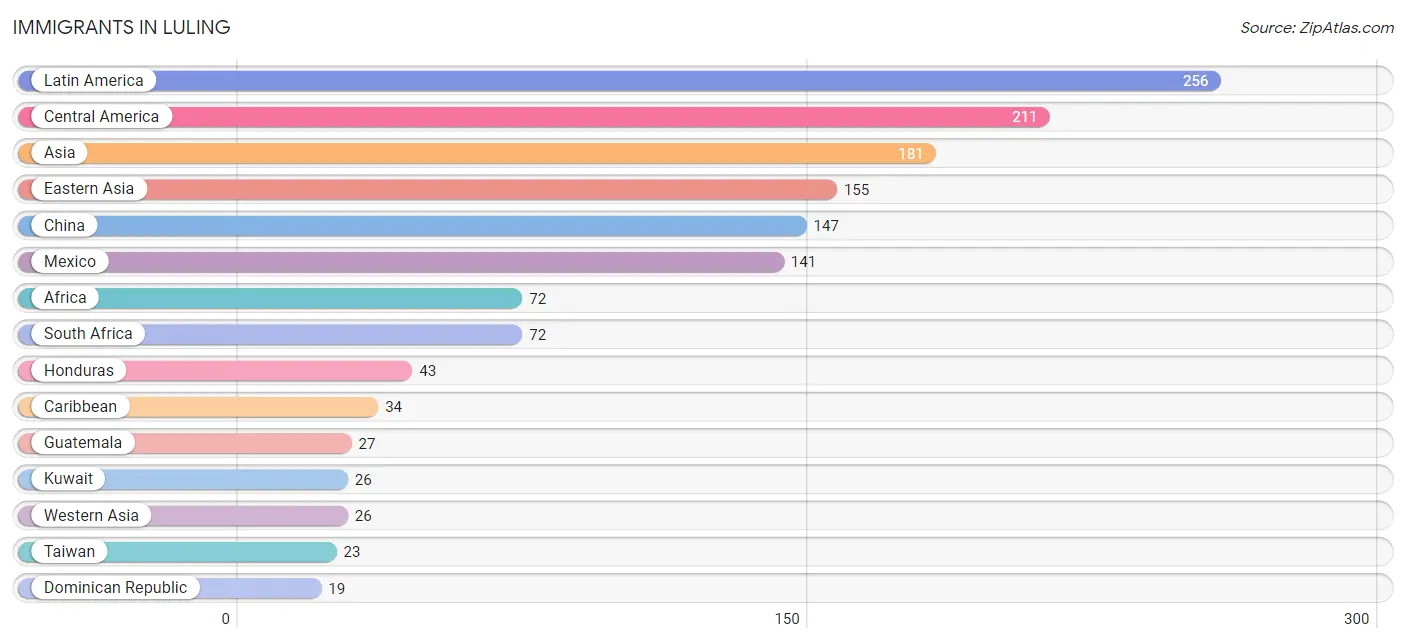
| Immigration Origin | # Population | % Population |
| Africa | 72 | 0.5% |
| Asia | 181 | 1.3% |
| Caribbean | 34 | 0.2% |
| Central America | 211 | 1.5% |
| China | 147 | 1.0% |
| Dominican Republic | 19 | 0.1% |
| Eastern Asia | 155 | 1.1% |
| Guatemala | 27 | 0.2% |
| Honduras | 43 | 0.3% |
| Japan | 8 | 0.1% |
| Kuwait | 26 | 0.2% |
| Latin America | 256 | 1.8% |
| Mexico | 141 | 1.0% |
| South Africa | 72 | 0.5% |
| South America | 11 | 0.1% |
| Taiwan | 23 | 0.2% |
| Trinidad and Tobago | 15 | 0.1% |
| Venezuela | 11 | 0.1% |
| Western Asia | 26 | 0.2% | View All 19 Rows |
Sex and Age in Luling
Sex and Age in Luling
The most populous age groups in Luling are 40 to 44 Years (655 | 9.6%) for men and 10 to 14 Years (842 | 11.4%) for women.
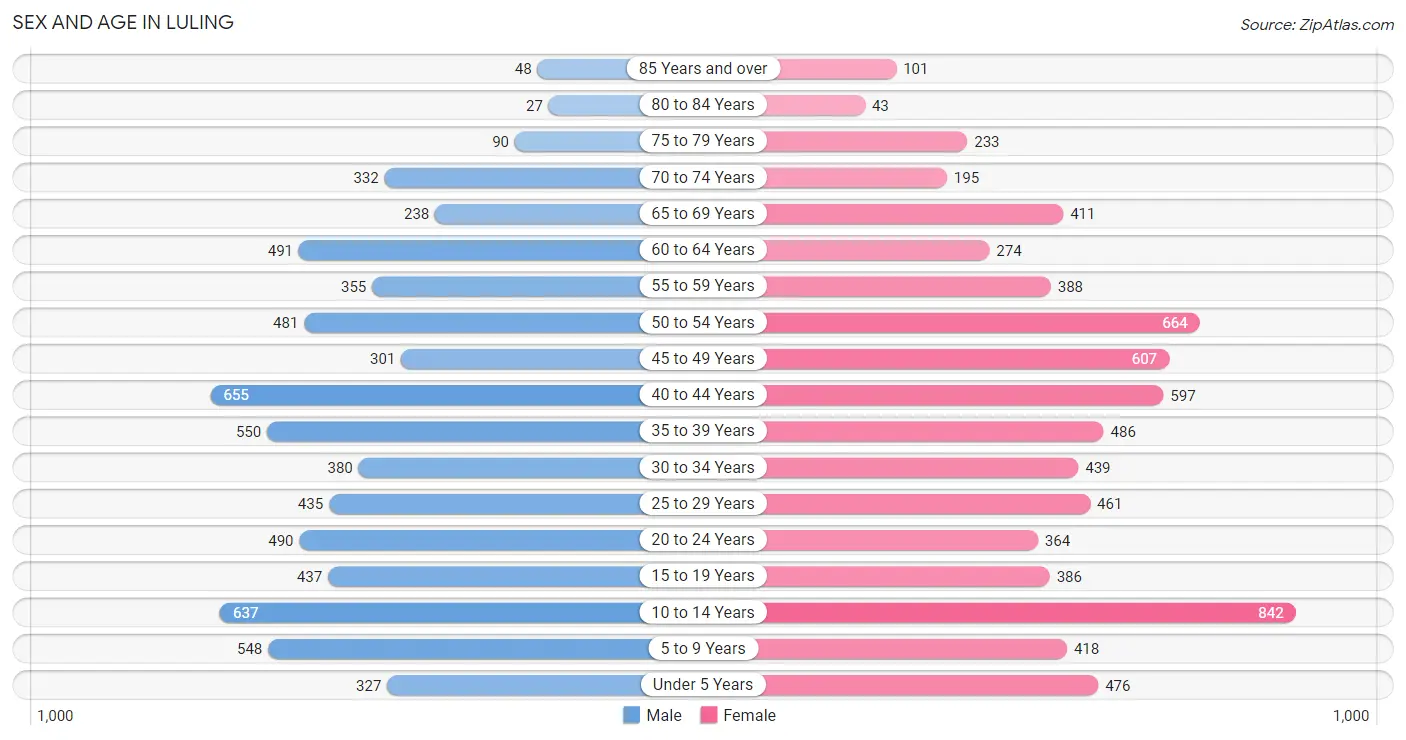
| Age Bracket | Male | Female |
| Under 5 Years | 327 (4.8%) | 476 (6.5%) |
| 5 to 9 Years | 548 (8.0%) | 418 (5.7%) |
| 10 to 14 Years | 637 (9.3%) | 842 (11.4%) |
| 15 to 19 Years | 437 (6.4%) | 386 (5.2%) |
| 20 to 24 Years | 490 (7.2%) | 364 (4.9%) |
| 25 to 29 Years | 435 (6.4%) | 461 (6.2%) |
| 30 to 34 Years | 380 (5.6%) | 439 (5.9%) |
| 35 to 39 Years | 550 (8.1%) | 486 (6.6%) |
| 40 to 44 Years | 655 (9.6%) | 597 (8.1%) |
| 45 to 49 Years | 301 (4.4%) | 607 (8.2%) |
| 50 to 54 Years | 481 (7.0%) | 664 (9.0%) |
| 55 to 59 Years | 355 (5.2%) | 388 (5.2%) |
| 60 to 64 Years | 491 (7.2%) | 274 (3.7%) |
| 65 to 69 Years | 238 (3.5%) | 411 (5.6%) |
| 70 to 74 Years | 332 (4.9%) | 195 (2.6%) |
| 75 to 79 Years | 90 (1.3%) | 233 (3.2%) |
| 80 to 84 Years | 27 (0.4%) | 43 (0.6%) |
| 85 Years and over | 48 (0.7%) | 101 (1.4%) |
| Total | 6,822 (100.0%) | 7,385 (100.0%) |
Families and Households in Luling
Median Family Size in Luling
The median family size in Luling is 3.31 persons per family, with married-couple families (2,638 | 71.0%) accounting for the largest median family size of 3.47 persons per family. On the other hand, single female/mother families (958 | 25.8%) represent the smallest median family size with 2.90 persons per family.
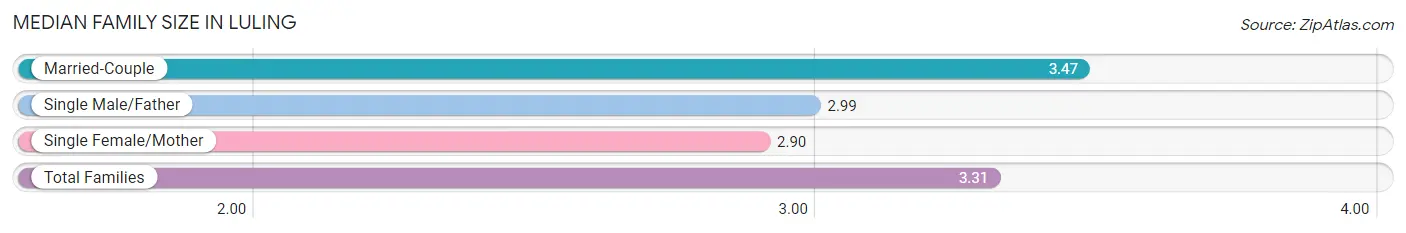
| Family Type | # Families | Family Size |
| Married-Couple | 2,638 (71.0%) | 3.47 |
| Single Male/Father | 119 (3.2%) | 2.99 |
| Single Female/Mother | 958 (25.8%) | 2.90 |
| Total Families | 3,715 (100.0%) | 3.31 |
Median Household Size in Luling
The median household size in Luling is 2.82 persons per household, with married-couple households (2,638 | 52.7%) accounting for the largest median household size of 3.48 persons per household. non-family households (1,294 | 25.8%) represent the smallest median household size with 1.35 persons per household.
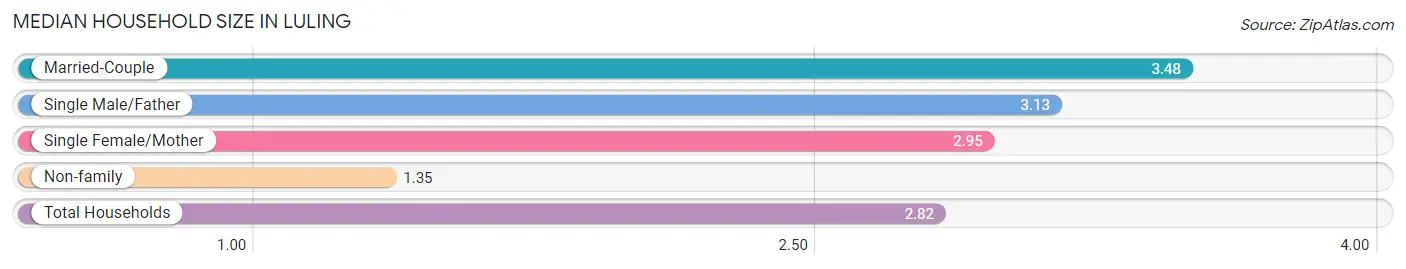
| Household Type | # Households | Household Size |
| Married-Couple | 2,638 (52.7%) | 3.48 |
| Single Male/Father | 119 (2.4%) | 3.13 |
| Single Female/Mother | 958 (19.1%) | 2.95 |
| Non-family | 1,294 (25.8%) | 1.35 |
| Total Households | 5,009 (100.0%) | 2.82 |
Household Size by Marriage Status in Luling
Out of a total of 5,009 households in Luling, 3,715 (74.2%) are family households, while 1,294 (25.8%) are nonfamily households. The most numerous type of family households are 2-person households, comprising 1,221, and the most common type of nonfamily households are 1-person households, comprising 970.
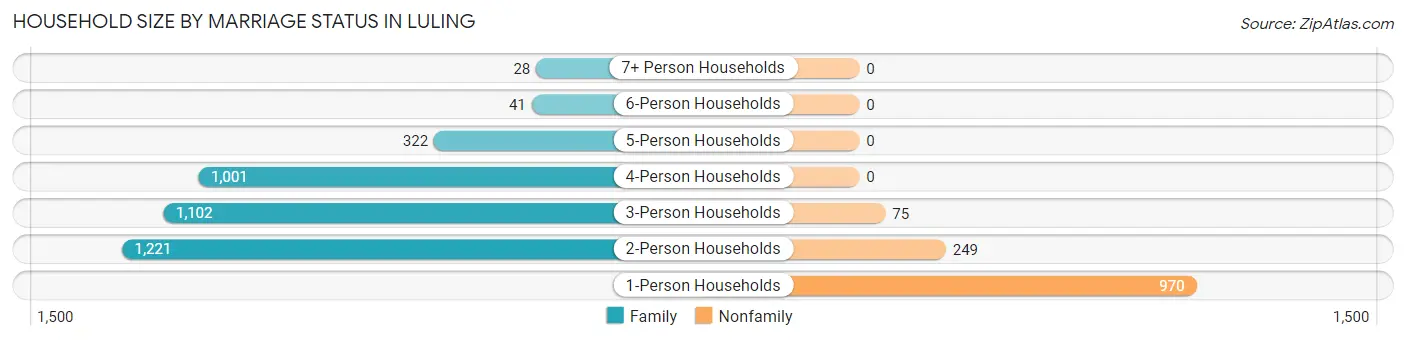
| Household Size | Family Households | Nonfamily Households |
| 1-Person Households | - | 970 (19.4%) |
| 2-Person Households | 1,221 (24.4%) | 249 (5.0%) |
| 3-Person Households | 1,102 (22.0%) | 75 (1.5%) |
| 4-Person Households | 1,001 (20.0%) | 0 (0.0%) |
| 5-Person Households | 322 (6.4%) | 0 (0.0%) |
| 6-Person Households | 41 (0.8%) | 0 (0.0%) |
| 7+ Person Households | 28 (0.6%) | 0 (0.0%) |
| Total | 3,715 (74.2%) | 1,294 (25.8%) |
Female Fertility in Luling
Fertility by Age in Luling
Average fertility rate in Luling is 41.0 births per 1,000 women. Women in the age bracket of 20 to 34 years have the highest fertility rate with 116.0 births per 1,000 women. Women in the age bracket of 20 to 34 years acount for 96.7% of all women with births.
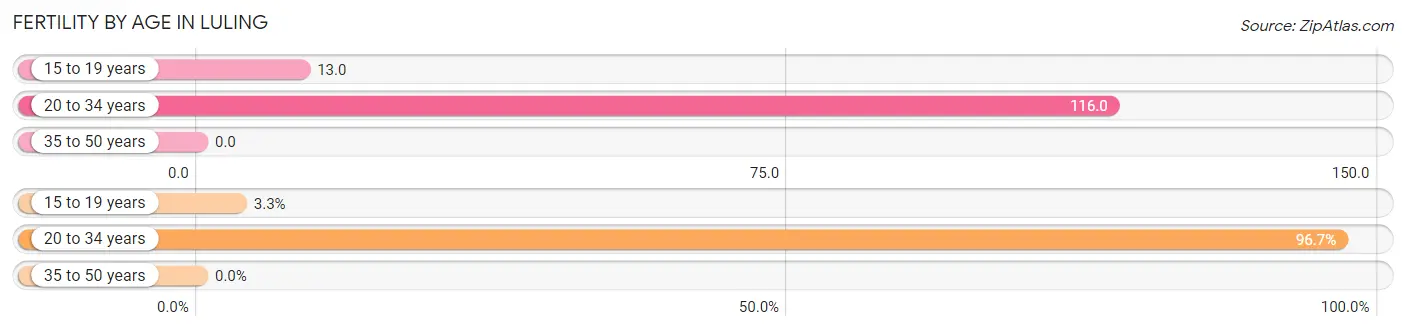
| Age Bracket | Women with Births | Births / 1,000 Women |
| 15 to 19 years | 5 (3.3%) | 13.0 |
| 20 to 34 years | 147 (96.7%) | 116.0 |
| 35 to 50 years | 0 (0.0%) | 0.0 |
| Total | 152 (100.0%) | 41.0 |
Fertility by Age by Marriage Status in Luling
79.6% of women with births (152) in Luling are married. The highest percentage of unmarried women with births falls into 20 to 34 years age bracket with 21.1% of them unmarried at the time of birth, while the lowest percentage of unmarried women with births belong to 15 to 19 years age bracket with 0.0% of them unmarried.
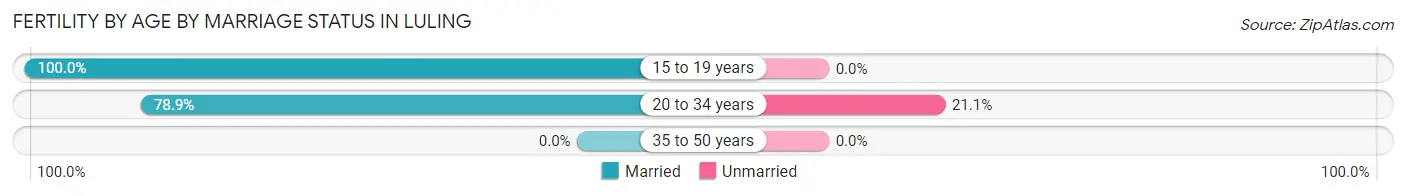
| Age Bracket | Married | Unmarried |
| 15 to 19 years | 5 (100.0%) | 0 (0.0%) |
| 20 to 34 years | 116 (78.9%) | 31 (21.1%) |
| 35 to 50 years | 0 (0.0%) | 0 (0.0%) |
| Total | 121 (79.6%) | 31 (20.4%) |
Fertility by Education in Luling
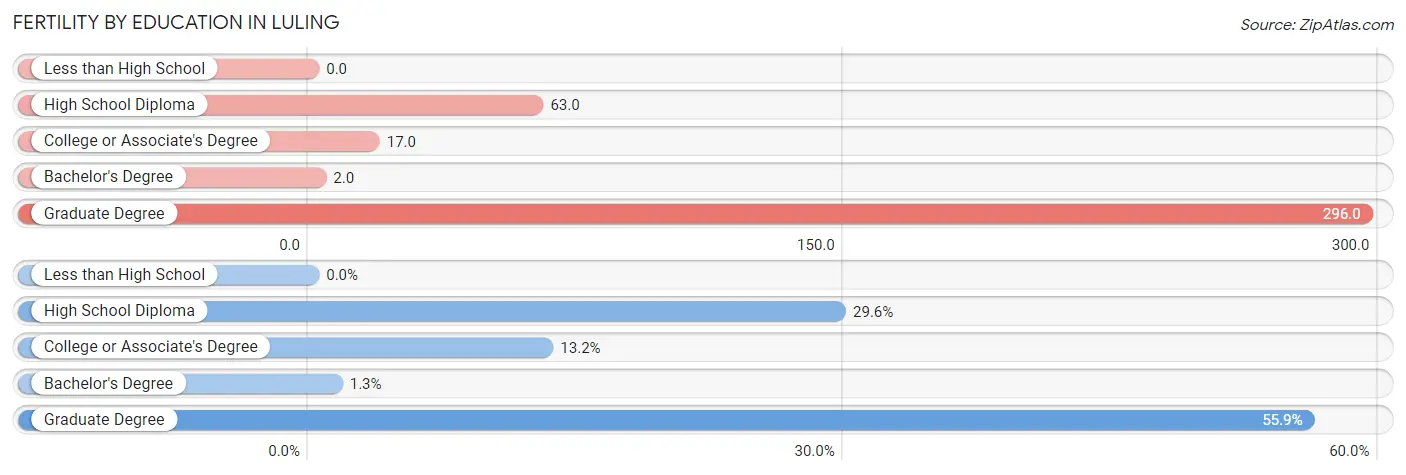
| Educational Attainment | Women with Births | Births / 1,000 Women |
| Less than High School | 0 (0.0%) | 0.0 |
| High School Diploma | 45 (29.6%) | 63.0 |
| College or Associate's Degree | 20 (13.2%) | 17.0 |
| Bachelor's Degree | 2 (1.3%) | 2.0 |
| Graduate Degree | 85 (55.9%) | 296.0 |
| Total | 152 (100.0%) | 41.0 |
Fertility by Education by Marriage Status in Luling
20.4% of women with births in Luling are unmarried. Women with the educational attainment of college or associate's degree are most likely to be married with 100.0% of them married at childbirth, while women with the educational attainment of high school diploma are least likely to be married with 68.9% of them unmarried at childbirth.
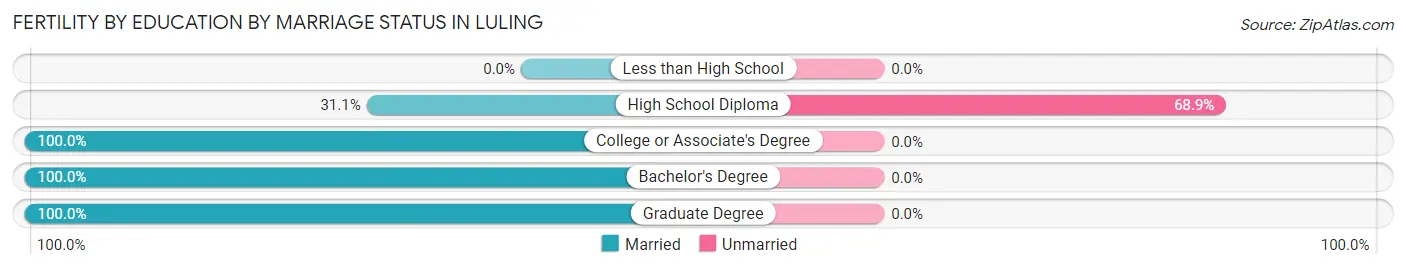
| Educational Attainment | Married | Unmarried |
| Less than High School | 0 (0.0%) | 0 (0.0%) |
| High School Diploma | 14 (31.1%) | 31 (68.9%) |
| College or Associate's Degree | 20 (100.0%) | 0 (0.0%) |
| Bachelor's Degree | 2 (100.0%) | 0 (0.0%) |
| Graduate Degree | 85 (100.0%) | 0 (0.0%) |
| Total | 121 (79.6%) | 31 (20.4%) |
Employment Characteristics in Luling
Employment by Class of Employer in Luling
Among the 6,771 employed individuals in Luling, private company employees (4,719 | 69.7%), local government employees (1,017 | 15.0%), and self-employed (incorporated) (314 | 4.6%) make up the most common classes of employment.
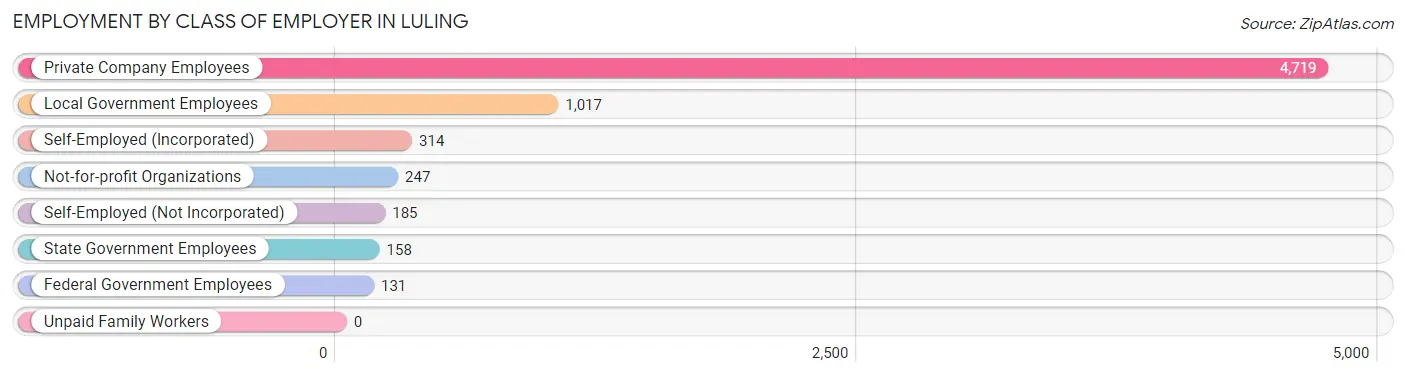
| Employer Class | # Employees | % Employees |
| Private Company Employees | 4,719 | 69.7% |
| Self-Employed (Incorporated) | 314 | 4.6% |
| Self-Employed (Not Incorporated) | 185 | 2.7% |
| Not-for-profit Organizations | 247 | 3.6% |
| Local Government Employees | 1,017 | 15.0% |
| State Government Employees | 158 | 2.3% |
| Federal Government Employees | 131 | 1.9% |
| Unpaid Family Workers | 0 | 0.0% |
| Total | 6,771 | 100.0% |
Employment Status by Age in Luling
According to the labor force statistics for Luling, out of the total population over 16 years of age (10,841), 66.8% or 7,242 individuals are in the labor force, with 4.8% or 348 of them unemployed. The age group with the highest labor force participation rate is 30 to 34 years, with 90.0% or 737 individuals in the labor force. Within the labor force, the 20 to 24 years age range has the highest percentage of unemployed individuals, with 16.1% or 118 of them being unemployed.
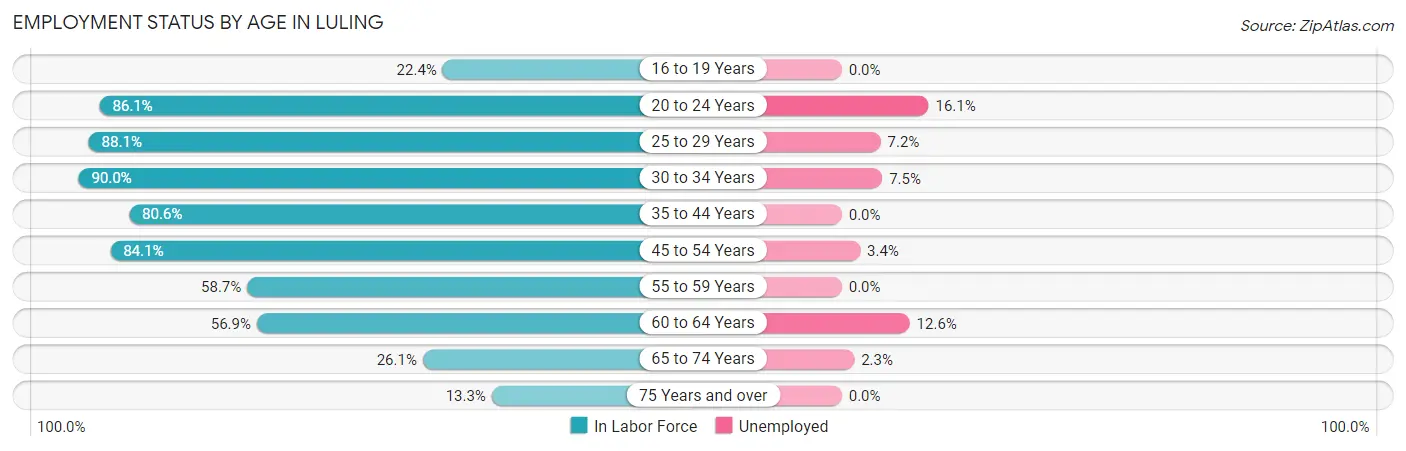
| Age Bracket | In Labor Force | Unemployed |
| 16 to 19 Years | 158 (22.4%) | 0 (0.0%) |
| 20 to 24 Years | 735 (86.1%) | 118 (16.1%) |
| 25 to 29 Years | 789 (88.1%) | 57 (7.2%) |
| 30 to 34 Years | 737 (90.0%) | 55 (7.5%) |
| 35 to 44 Years | 1,844 (80.6%) | 0 (0.0%) |
| 45 to 54 Years | 1,727 (84.1%) | 59 (3.4%) |
| 55 to 59 Years | 436 (58.7%) | 0 (0.0%) |
| 60 to 64 Years | 435 (56.9%) | 55 (12.6%) |
| 65 to 74 Years | 307 (26.1%) | 7 (2.3%) |
| 75 Years and over | 72 (13.3%) | 0 (0.0%) |
| Total | 7,242 (66.8%) | 348 (4.8%) |
Employment Status by Educational Attainment in Luling
According to labor force statistics for Luling, 78.9% of individuals (5,968) out of the total population between 25 and 64 years of age (7,564) are in the labor force, with 3.8% or 227 of them being unemployed. The group with the highest labor force participation rate are those with the educational attainment of bachelor's degree or higher, with 94.4% or 2,275 individuals in the labor force. Within the labor force, individuals with less than high school education have the highest percentage of unemployment, with 18.8% or 63 of them being unemployed.
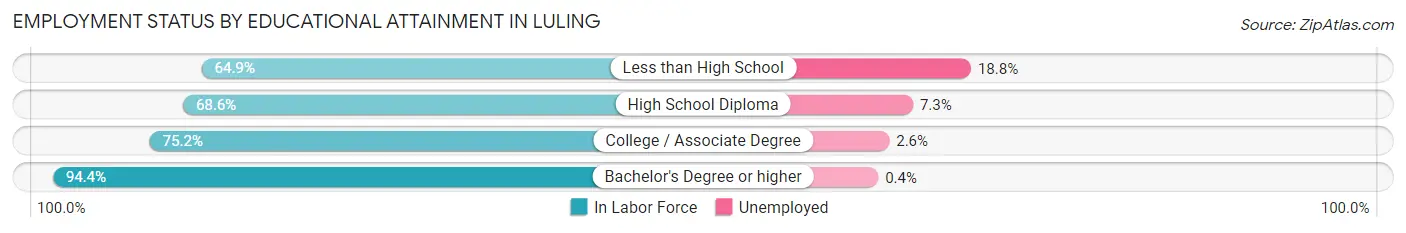
| Educational Attainment | In Labor Force | Unemployed |
| Less than High School | 335 (64.9%) | 97 (18.8%) |
| High School Diploma | 1,376 (68.6%) | 146 (7.3%) |
| College / Associate Degree | 1,979 (75.2%) | 68 (2.6%) |
| Bachelor's Degree or higher | 2,275 (94.4%) | 10 (0.4%) |
| Total | 5,968 (78.9%) | 287 (3.8%) |
Employment Occupations by Sex in Luling
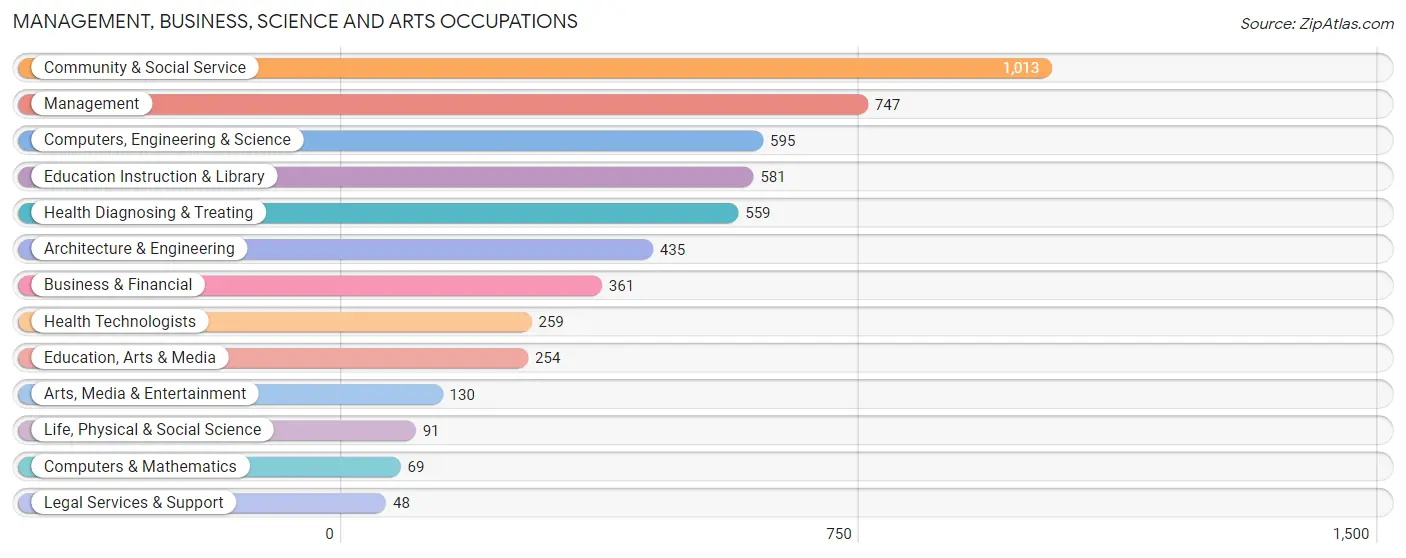
Management, Business, Science and Arts Occupations
The most common Management, Business, Science and Arts occupations in Luling are Community & Social Service (1,013 | 14.7%), Management (747 | 10.9%), Computers, Engineering & Science (595 | 8.6%), Education Instruction & Library (581 | 8.5%), and Health Diagnosing & Treating (559 | 8.1%).
Management, Business, Science and Arts Occupations by Sex
Within the Management, Business, Science and Arts occupations in Luling, the most male-oriented occupations are Computers & Mathematics (100.0%), Architecture & Engineering (93.8%), and Computers, Engineering & Science (88.7%), while the most female-oriented occupations are Education Instruction & Library (93.8%), Health Technologists (89.6%), and Education, Arts & Media (85.4%).
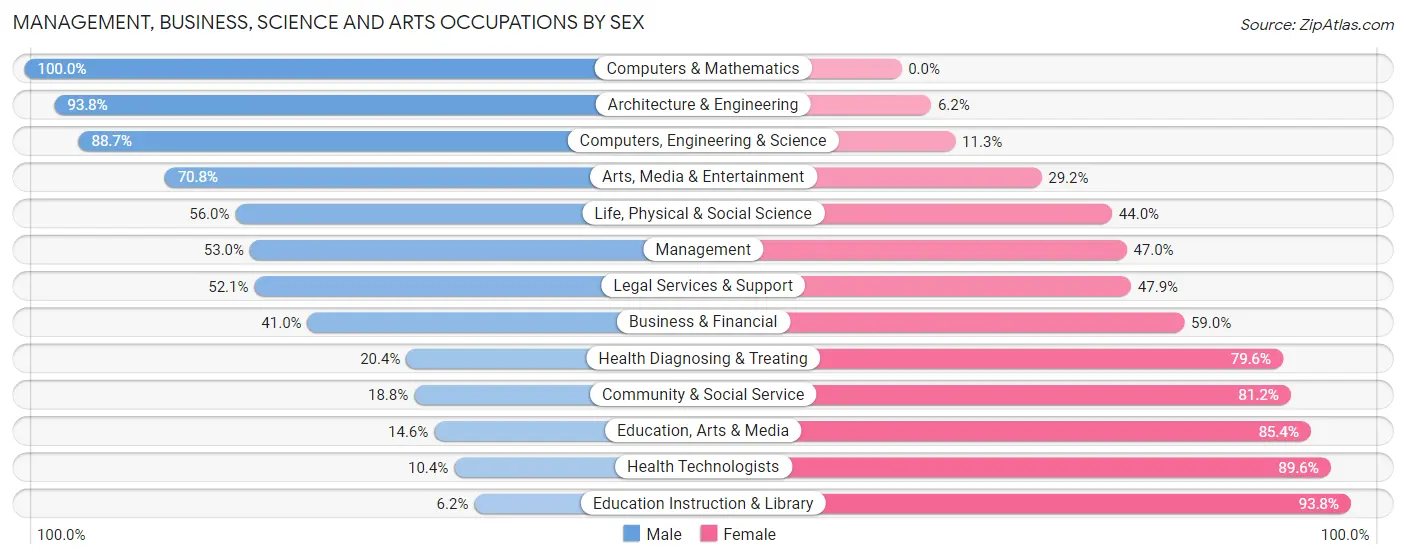
| Occupation | Male | Female |
| Management | 396 (53.0%) | 351 (47.0%) |
| Business & Financial | 148 (41.0%) | 213 (59.0%) |
| Computers, Engineering & Science | 528 (88.7%) | 67 (11.3%) |
| Computers & Mathematics | 69 (100.0%) | 0 (0.0%) |
| Architecture & Engineering | 408 (93.8%) | 27 (6.2%) |
| Life, Physical & Social Science | 51 (56.0%) | 40 (44.0%) |
| Community & Social Service | 190 (18.8%) | 823 (81.2%) |
| Education, Arts & Media | 37 (14.6%) | 217 (85.4%) |
| Legal Services & Support | 25 (52.1%) | 23 (47.9%) |
| Education Instruction & Library | 36 (6.2%) | 545 (93.8%) |
| Arts, Media & Entertainment | 92 (70.8%) | 38 (29.2%) |
| Health Diagnosing & Treating | 114 (20.4%) | 445 (79.6%) |
| Health Technologists | 27 (10.4%) | 232 (89.6%) |
| Total (Category) | 1,376 (42.0%) | 1,899 (58.0%) |
| Total (Overall) | 3,657 (53.2%) | 3,219 (46.8%) |
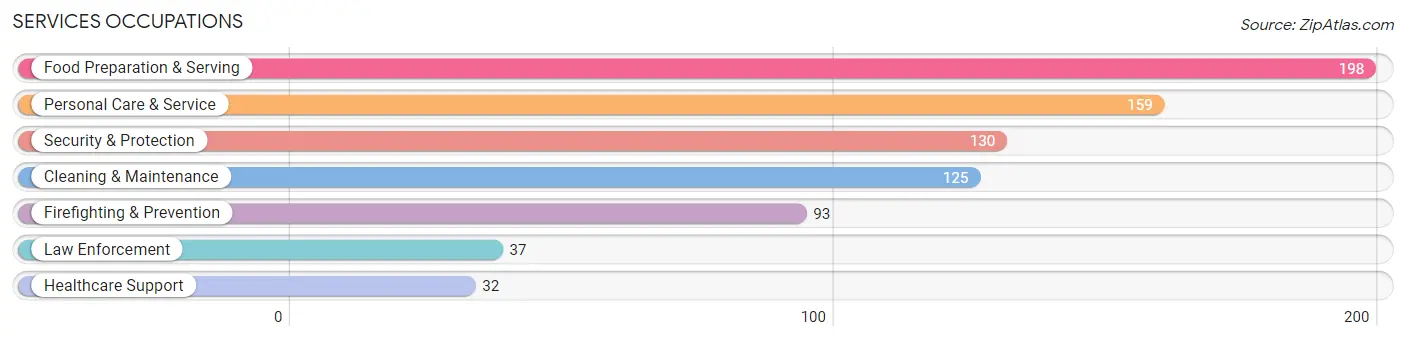
Services Occupations
The most common Services occupations in Luling are Food Preparation & Serving (198 | 2.9%), Personal Care & Service (159 | 2.3%), Security & Protection (130 | 1.9%), Cleaning & Maintenance (125 | 1.8%), and Firefighting & Prevention (93 | 1.3%).
Services Occupations by Sex
Within the Services occupations in Luling, the most male-oriented occupations are Law Enforcement (100.0%), Cleaning & Maintenance (87.2%), and Security & Protection (76.1%), while the most female-oriented occupations are Healthcare Support (87.5%), Food Preparation & Serving (66.7%), and Personal Care & Service (56.6%).
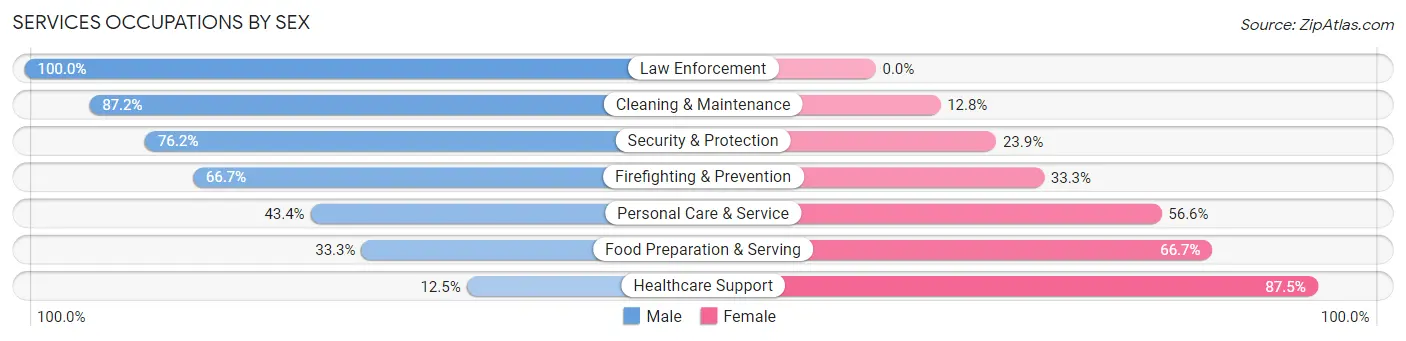
| Occupation | Male | Female |
| Healthcare Support | 4 (12.5%) | 28 (87.5%) |
| Security & Protection | 99 (76.1%) | 31 (23.8%) |
| Firefighting & Prevention | 62 (66.7%) | 31 (33.3%) |
| Law Enforcement | 37 (100.0%) | 0 (0.0%) |
| Food Preparation & Serving | 66 (33.3%) | 132 (66.7%) |
| Cleaning & Maintenance | 109 (87.2%) | 16 (12.8%) |
| Personal Care & Service | 69 (43.4%) | 90 (56.6%) |
| Total (Category) | 347 (53.9%) | 297 (46.1%) |
| Total (Overall) | 3,657 (53.2%) | 3,219 (46.8%) |
Sales and Office Occupations
The most common Sales and Office occupations in Luling are Office & Administration (731 | 10.6%), and Sales & Related (570 | 8.3%).
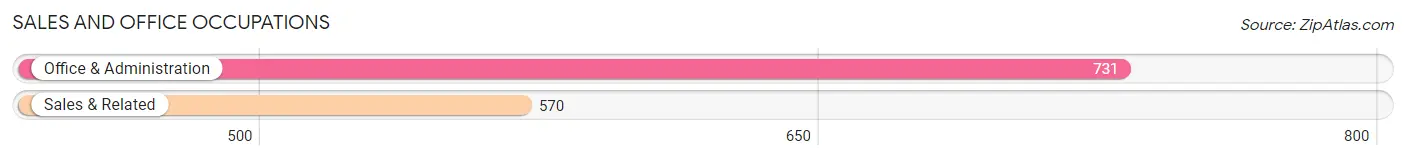
Sales and Office Occupations by Sex
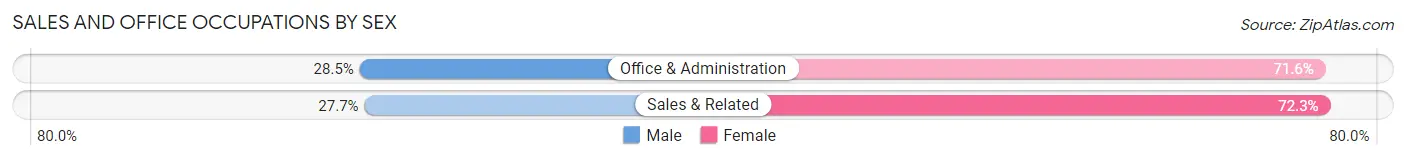
| Occupation | Male | Female |
| Sales & Related | 158 (27.7%) | 412 (72.3%) |
| Office & Administration | 208 (28.4%) | 523 (71.6%) |
| Total (Category) | 366 (28.1%) | 935 (71.9%) |
| Total (Overall) | 3,657 (53.2%) | 3,219 (46.8%) |
Natural Resources, Construction and Maintenance Occupations
The most common Natural Resources, Construction and Maintenance occupations in Luling are Installation, Maintenance & Repair (384 | 5.6%), and Construction & Extraction (330 | 4.8%).
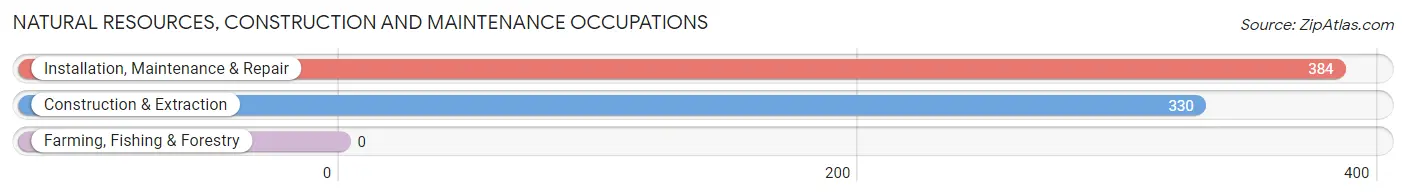
Natural Resources, Construction and Maintenance Occupations by Sex
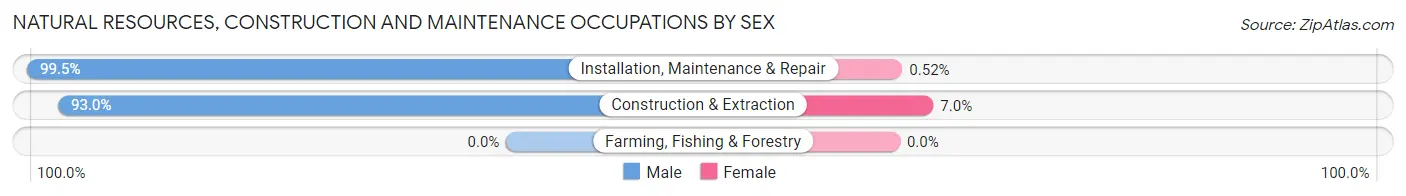
| Occupation | Male | Female |
| Farming, Fishing & Forestry | 0 (0.0%) | 0 (0.0%) |
| Construction & Extraction | 307 (93.0%) | 23 (7.0%) |
| Installation, Maintenance & Repair | 382 (99.5%) | 2 (0.5%) |
| Total (Category) | 689 (96.5%) | 25 (3.5%) |
| Total (Overall) | 3,657 (53.2%) | 3,219 (46.8%) |
Production, Transportation and Moving Occupations
The most common Production, Transportation and Moving occupations in Luling are Production (430 | 6.2%), Material Moving (300 | 4.4%), and Transportation (212 | 3.1%).
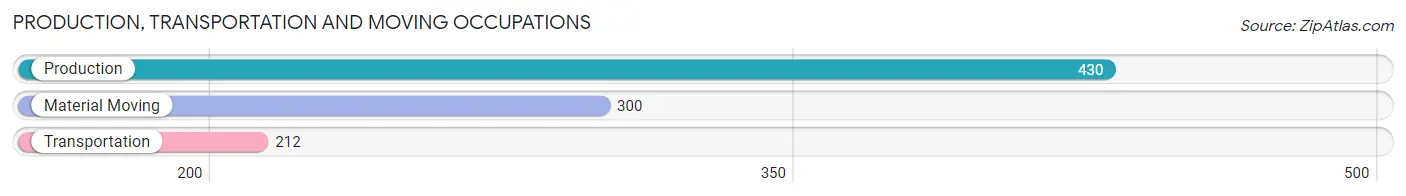
Production, Transportation and Moving Occupations by Sex
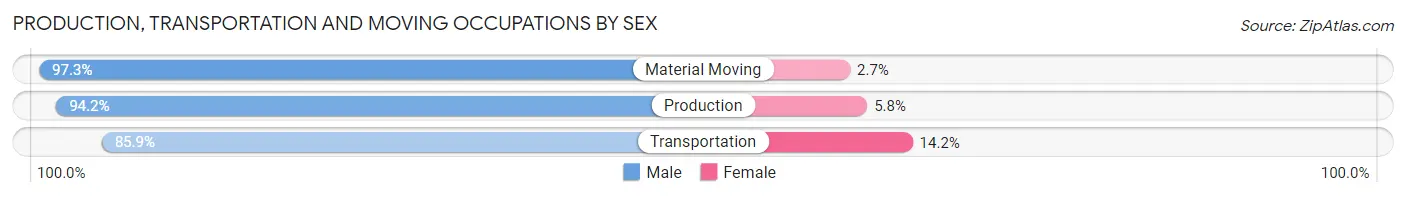
| Occupation | Male | Female |
| Production | 405 (94.2%) | 25 (5.8%) |
| Transportation | 182 (85.9%) | 30 (14.1%) |
| Material Moving | 292 (97.3%) | 8 (2.7%) |
| Total (Category) | 879 (93.3%) | 63 (6.7%) |
| Total (Overall) | 3,657 (53.2%) | 3,219 (46.8%) |
Employment Industries by Sex in Luling
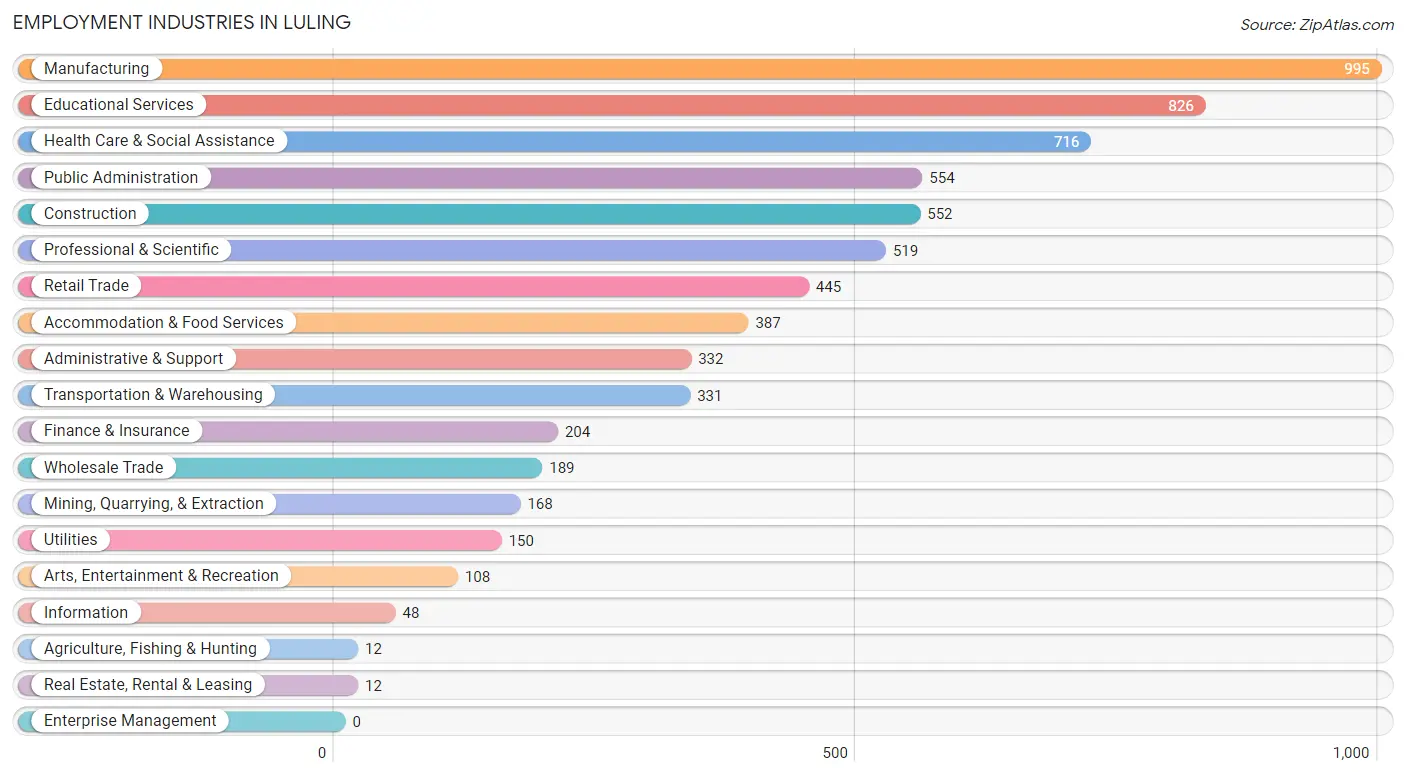
Employment Industries in Luling
The major employment industries in Luling include Manufacturing (995 | 14.5%), Educational Services (826 | 12.0%), Health Care & Social Assistance (716 | 10.4%), Public Administration (554 | 8.1%), and Construction (552 | 8.0%).
Employment Industries by Sex in Luling
The Luling industries that see more men than women are Agriculture, Fishing & Hunting (100.0%), Real Estate, Rental & Leasing (100.0%), and Transportation & Warehousing (94.3%), whereas the industries that tend to have a higher number of women are Educational Services (91.8%), Retail Trade (84.9%), and Health Care & Social Assistance (80.9%).
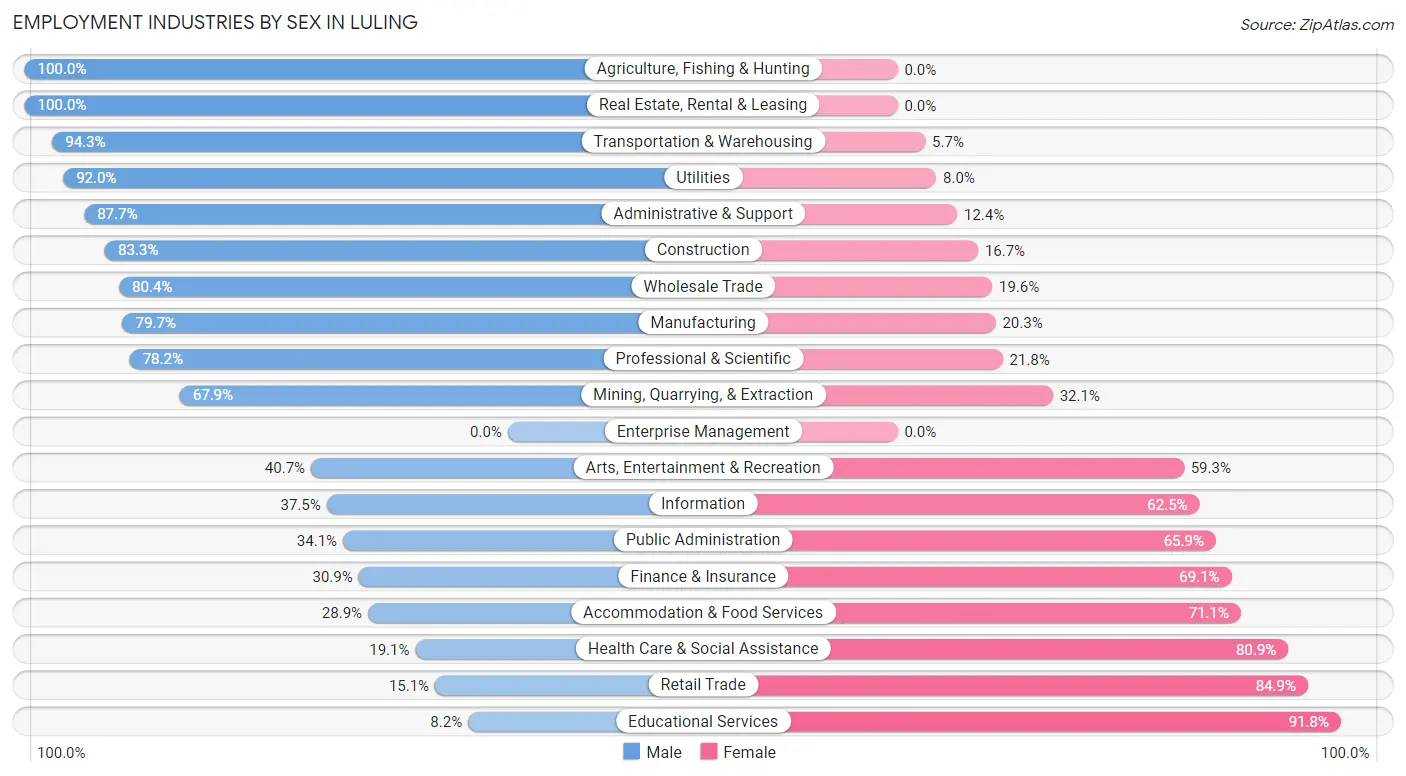
| Industry | Male | Female |
| Agriculture, Fishing & Hunting | 12 (100.0%) | 0 (0.0%) |
| Mining, Quarrying, & Extraction | 114 (67.9%) | 54 (32.1%) |
| Construction | 460 (83.3%) | 92 (16.7%) |
| Manufacturing | 793 (79.7%) | 202 (20.3%) |
| Wholesale Trade | 152 (80.4%) | 37 (19.6%) |
| Retail Trade | 67 (15.1%) | 378 (84.9%) |
| Transportation & Warehousing | 312 (94.3%) | 19 (5.7%) |
| Utilities | 138 (92.0%) | 12 (8.0%) |
| Information | 18 (37.5%) | 30 (62.5%) |
| Finance & Insurance | 63 (30.9%) | 141 (69.1%) |
| Real Estate, Rental & Leasing | 12 (100.0%) | 0 (0.0%) |
| Professional & Scientific | 406 (78.2%) | 113 (21.8%) |
| Enterprise Management | 0 (0.0%) | 0 (0.0%) |
| Administrative & Support | 291 (87.6%) | 41 (12.3%) |
| Educational Services | 68 (8.2%) | 758 (91.8%) |
| Health Care & Social Assistance | 137 (19.1%) | 579 (80.9%) |
| Arts, Entertainment & Recreation | 44 (40.7%) | 64 (59.3%) |
| Accommodation & Food Services | 112 (28.9%) | 275 (71.1%) |
| Public Administration | 189 (34.1%) | 365 (65.9%) |
| Total | 3,657 (53.2%) | 3,219 (46.8%) |
Education in Luling
School Enrollment in Luling
The most common levels of schooling among the 4,197 students in Luling are middle school (1,107 | 26.4%), elementary school (978 | 23.3%), and high school (969 | 23.1%).
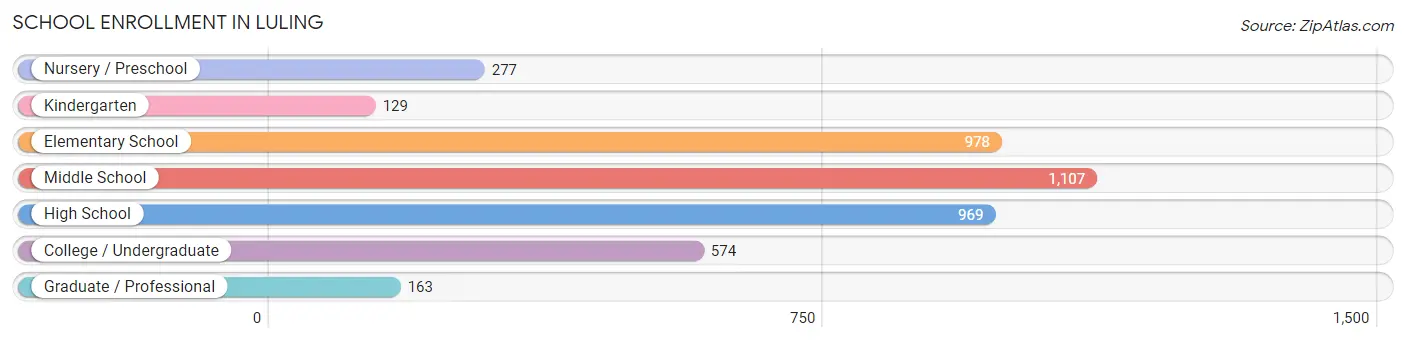
| School Level | # Students | % Students |
| Nursery / Preschool | 277 | 6.6% |
| Kindergarten | 129 | 3.1% |
| Elementary School | 978 | 23.3% |
| Middle School | 1,107 | 26.4% |
| High School | 969 | 23.1% |
| College / Undergraduate | 574 | 13.7% |
| Graduate / Professional | 163 | 3.9% |
| Total | 4,197 | 100.0% |
School Enrollment by Age by Funding Source in Luling
Out of a total of 4,197 students who are enrolled in schools in Luling, 512 (12.2%) attend a private institution, while the remaining 3,685 (87.8%) are enrolled in public schools. The age group of 25 to 34 year olds has the highest likelihood of being enrolled in private schools, with 72 (48.0% in the age bracket) enrolled. Conversely, the age group of 18 to 19 year olds has the lowest likelihood of being enrolled in a private school, with 160 (95.8% in the age bracket) attending a public institution.
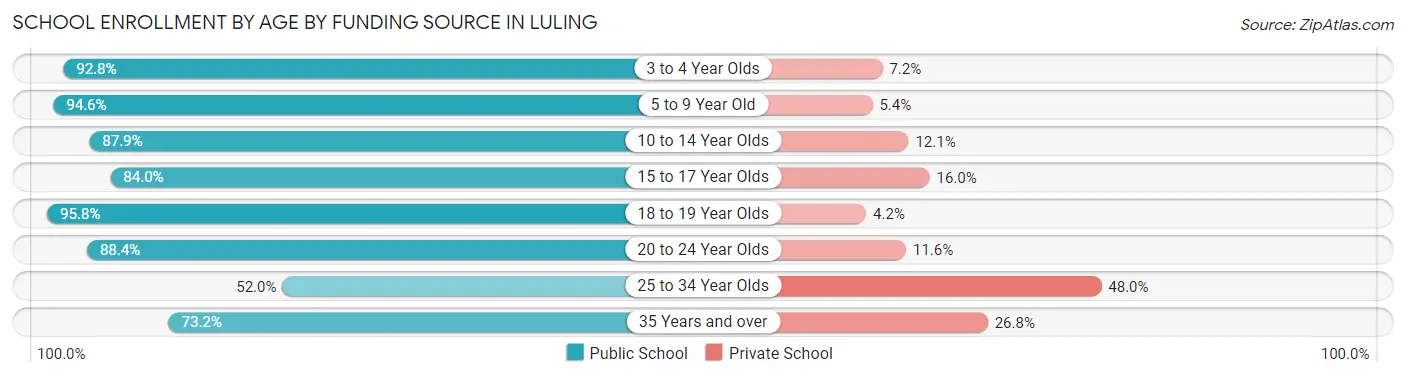
| Age Bracket | Public School | Private School |
| 3 to 4 Year Olds | 270 (92.8%) | 21 (7.2%) |
| 5 to 9 Year Old | 883 (94.6%) | 50 (5.4%) |
| 10 to 14 Year Olds | 1,275 (87.9%) | 175 (12.1%) |
| 15 to 17 Year Olds | 541 (84.0%) | 103 (16.0%) |
| 18 to 19 Year Olds | 160 (95.8%) | 7 (4.2%) |
| 20 to 24 Year Olds | 388 (88.4%) | 51 (11.6%) |
| 25 to 34 Year Olds | 78 (52.0%) | 72 (48.0%) |
| 35 Years and over | 90 (73.2%) | 33 (26.8%) |
| Total | 3,685 (87.8%) | 512 (12.2%) |
Educational Attainment by Field of Study in Luling
Business (732 | 24.0%), education (695 | 22.8%), science & technology (522 | 17.1%), engineering (243 | 8.0%), and psychology (204 | 6.7%) are the most common fields of study among 3,054 individuals in Luling who have obtained a bachelor's degree or higher.
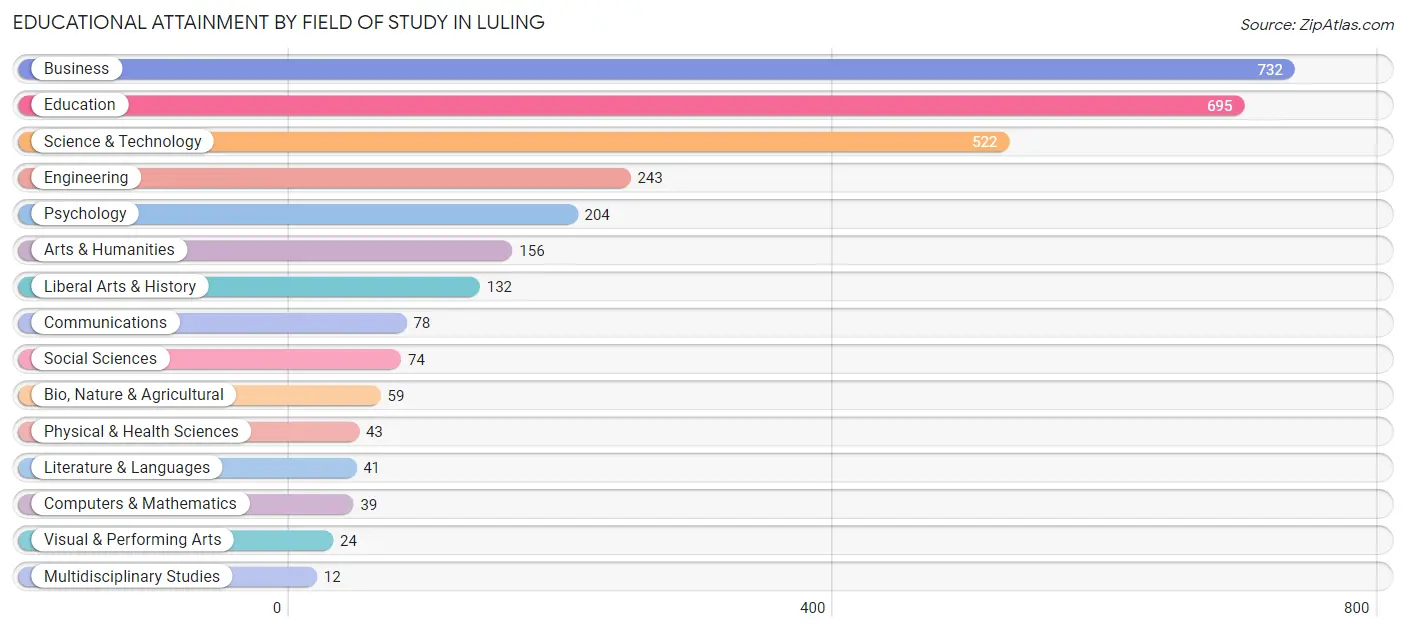
| Field of Study | # Graduates | % Graduates |
| Computers & Mathematics | 39 | 1.3% |
| Bio, Nature & Agricultural | 59 | 1.9% |
| Physical & Health Sciences | 43 | 1.4% |
| Psychology | 204 | 6.7% |
| Social Sciences | 74 | 2.4% |
| Engineering | 243 | 8.0% |
| Multidisciplinary Studies | 12 | 0.4% |
| Science & Technology | 522 | 17.1% |
| Business | 732 | 24.0% |
| Education | 695 | 22.8% |
| Literature & Languages | 41 | 1.3% |
| Liberal Arts & History | 132 | 4.3% |
| Visual & Performing Arts | 24 | 0.8% |
| Communications | 78 | 2.5% |
| Arts & Humanities | 156 | 5.1% |
| Total | 3,054 | 100.0% |
Transportation & Commute in Luling
Vehicle Availability by Sex in Luling
The most prevalent vehicle ownership categories in Luling are males with 2 vehicles (1,540, accounting for 42.5%) and females with 2 vehicles (1,341, making up 48.9%).
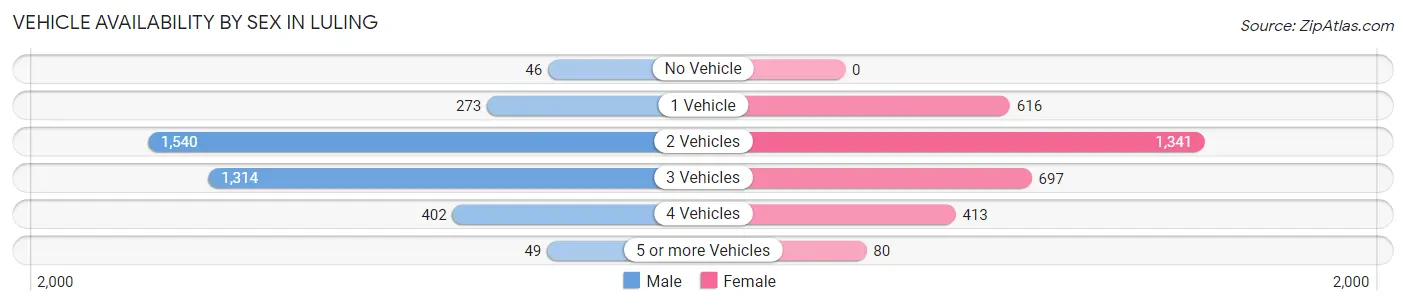
| Vehicles Available | Male | Female |
| No Vehicle | 46 (1.3%) | 0 (0.0%) |
| 1 Vehicle | 273 (7.5%) | 616 (19.6%) |
| 2 Vehicles | 1,540 (42.5%) | 1,341 (42.6%) |
| 3 Vehicles | 1,314 (36.3%) | 697 (22.2%) |
| 4 Vehicles | 402 (11.1%) | 413 (13.1%) |
| 5 or more Vehicles | 49 (1.3%) | 80 (2.5%) |
| Total | 3,624 (100.0%) | 3,147 (100.0%) |
Commute Time in Luling
The most frequently occuring commute durations in Luling are 15 to 19 minutes (1,025 commuters, 16.6%), 30 to 34 minutes (758 commuters, 12.3%), and 10 to 14 minutes (739 commuters, 11.9%).
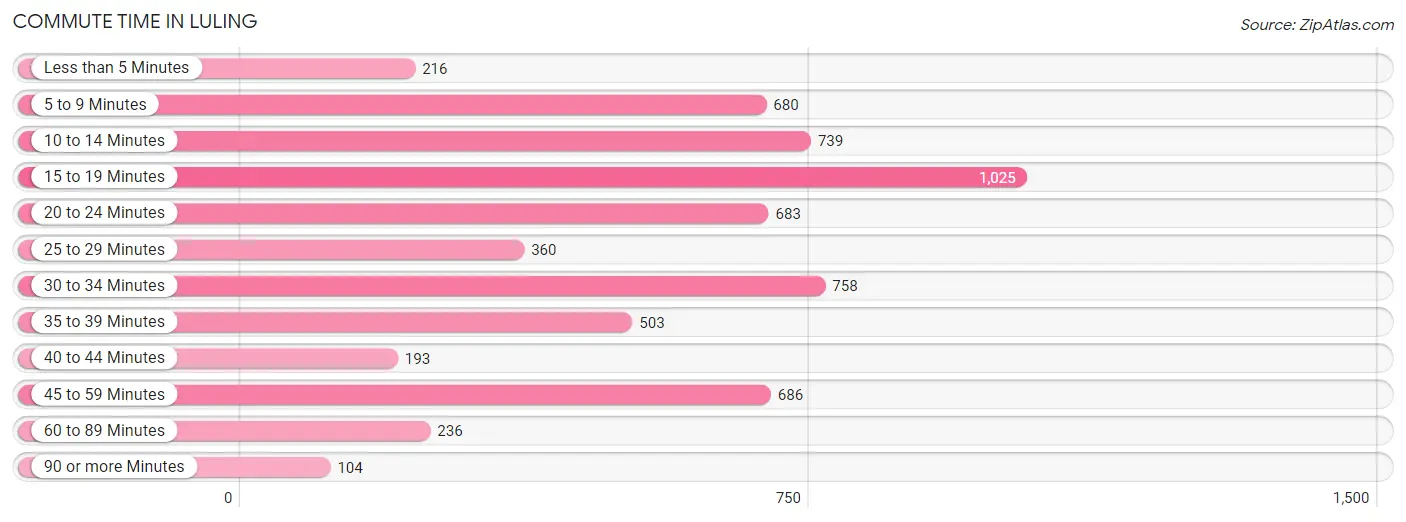
| Commute Time | # Commuters | % Commuters |
| Less than 5 Minutes | 216 | 3.5% |
| 5 to 9 Minutes | 680 | 11.0% |
| 10 to 14 Minutes | 739 | 11.9% |
| 15 to 19 Minutes | 1,025 | 16.6% |
| 20 to 24 Minutes | 683 | 11.1% |
| 25 to 29 Minutes | 360 | 5.8% |
| 30 to 34 Minutes | 758 | 12.3% |
| 35 to 39 Minutes | 503 | 8.1% |
| 40 to 44 Minutes | 193 | 3.1% |
| 45 to 59 Minutes | 686 | 11.1% |
| 60 to 89 Minutes | 236 | 3.8% |
| 90 or more Minutes | 104 | 1.7% |
Commute Time by Sex in Luling
The most common commute times in Luling are 15 to 19 minutes (629 commuters, 18.3%) for males and 15 to 19 minutes (396 commuters, 14.4%) for females.
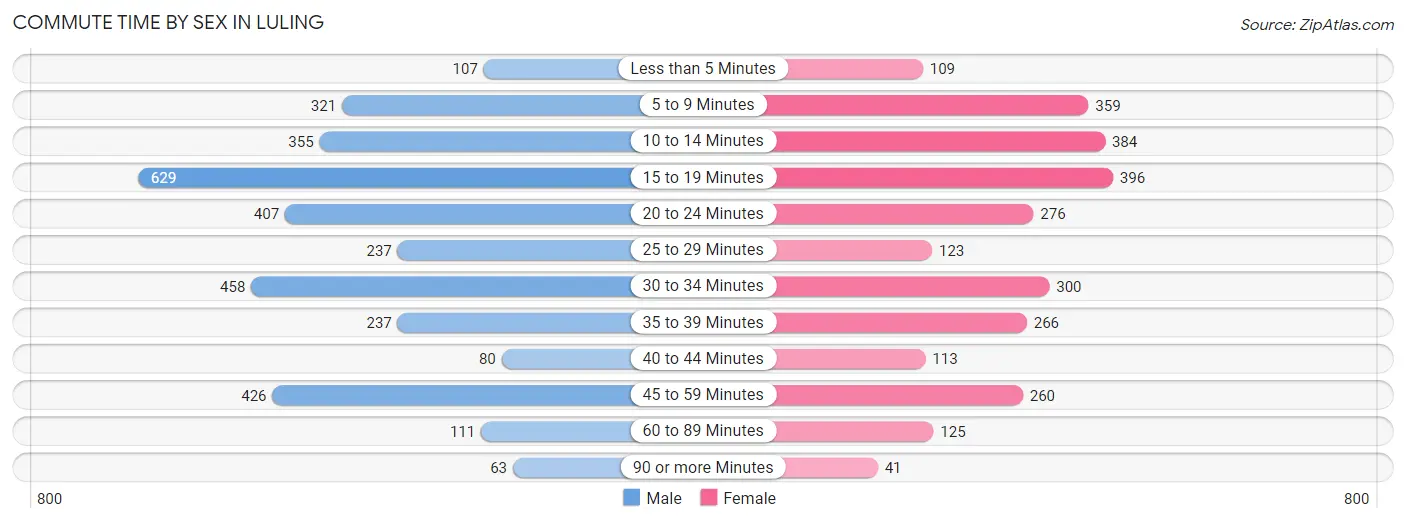
| Commute Time | Male | Female |
| Less than 5 Minutes | 107 (3.1%) | 109 (4.0%) |
| 5 to 9 Minutes | 321 (9.4%) | 359 (13.1%) |
| 10 to 14 Minutes | 355 (10.3%) | 384 (14.0%) |
| 15 to 19 Minutes | 629 (18.3%) | 396 (14.4%) |
| 20 to 24 Minutes | 407 (11.9%) | 276 (10.0%) |
| 25 to 29 Minutes | 237 (6.9%) | 123 (4.5%) |
| 30 to 34 Minutes | 458 (13.4%) | 300 (10.9%) |
| 35 to 39 Minutes | 237 (6.9%) | 266 (9.7%) |
| 40 to 44 Minutes | 80 (2.3%) | 113 (4.1%) |
| 45 to 59 Minutes | 426 (12.4%) | 260 (9.5%) |
| 60 to 89 Minutes | 111 (3.2%) | 125 (4.5%) |
| 90 or more Minutes | 63 (1.8%) | 41 (1.5%) |
Time of Departure to Work by Sex in Luling
The most frequent times of departure to work in Luling are 12:00 AM to 4:59 AM (498, 14.5%) for males and 7:30 AM to 7:59 AM (460, 16.7%) for females.
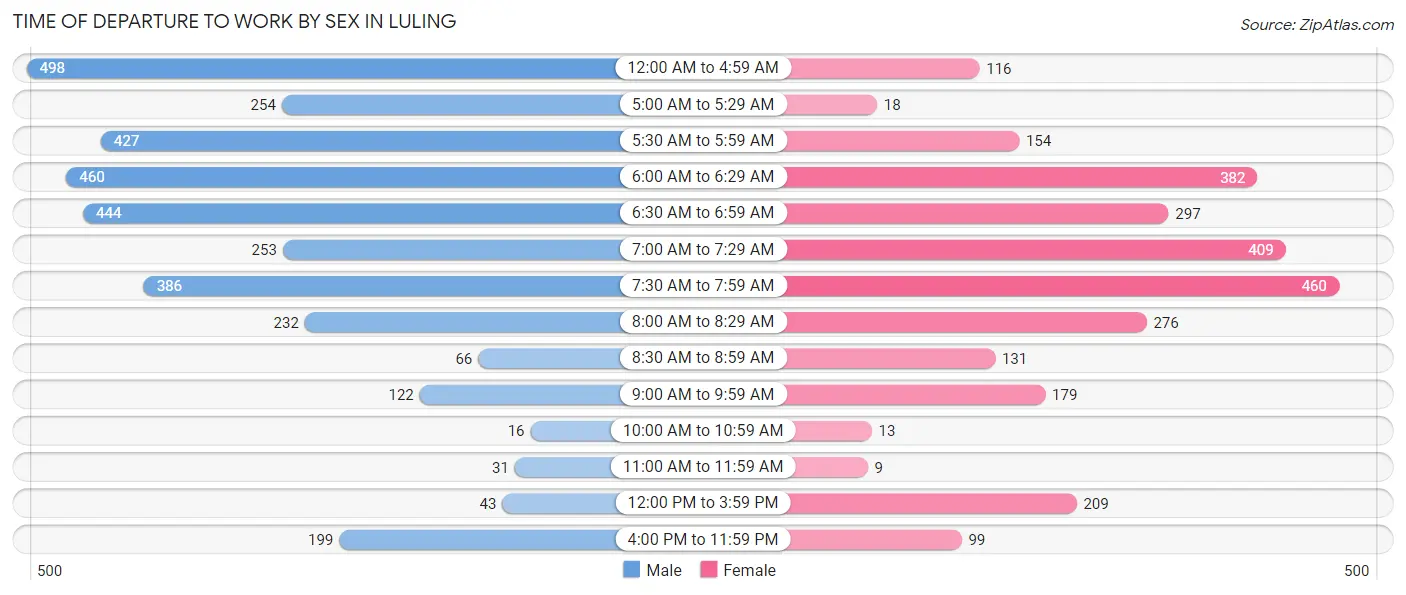
| Time of Departure | Male | Female |
| 12:00 AM to 4:59 AM | 498 (14.5%) | 116 (4.2%) |
| 5:00 AM to 5:29 AM | 254 (7.4%) | 18 (0.6%) |
| 5:30 AM to 5:59 AM | 427 (12.4%) | 154 (5.6%) |
| 6:00 AM to 6:29 AM | 460 (13.4%) | 382 (13.9%) |
| 6:30 AM to 6:59 AM | 444 (12.9%) | 297 (10.8%) |
| 7:00 AM to 7:29 AM | 253 (7.4%) | 409 (14.9%) |
| 7:30 AM to 7:59 AM | 386 (11.3%) | 460 (16.7%) |
| 8:00 AM to 8:29 AM | 232 (6.8%) | 276 (10.0%) |
| 8:30 AM to 8:59 AM | 66 (1.9%) | 131 (4.8%) |
| 9:00 AM to 9:59 AM | 122 (3.6%) | 179 (6.5%) |
| 10:00 AM to 10:59 AM | 16 (0.5%) | 13 (0.5%) |
| 11:00 AM to 11:59 AM | 31 (0.9%) | 9 (0.3%) |
| 12:00 PM to 3:59 PM | 43 (1.3%) | 209 (7.6%) |
| 4:00 PM to 11:59 PM | 199 (5.8%) | 99 (3.6%) |
| Total | 3,431 (100.0%) | 2,752 (100.0%) |
Housing Occupancy in Luling
Occupancy by Ownership in Luling
Of the total 5,009 dwellings in Luling, owner-occupied units account for 4,246 (84.8%), while renter-occupied units make up 763 (15.2%).
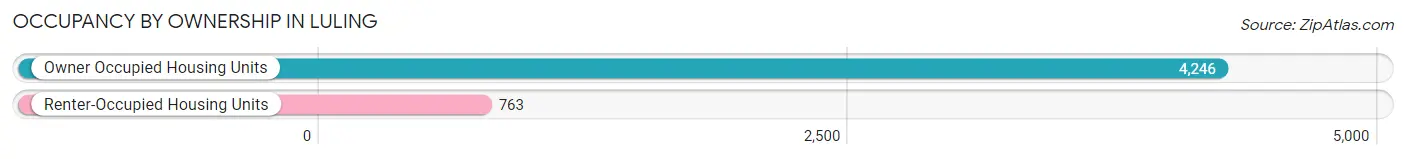
| Occupancy | # Housing Units | % Housing Units |
| Owner Occupied Housing Units | 4,246 | 84.8% |
| Renter-Occupied Housing Units | 763 | 15.2% |
| Total Occupied Housing Units | 5,009 | 100.0% |
Occupancy by Household Size in Luling
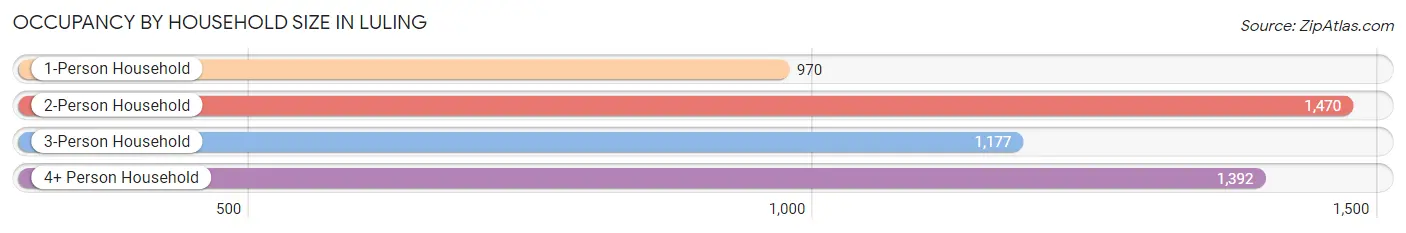
| Household Size | # Housing Units | % Housing Units |
| 1-Person Household | 970 | 19.4% |
| 2-Person Household | 1,470 | 29.3% |
| 3-Person Household | 1,177 | 23.5% |
| 4+ Person Household | 1,392 | 27.8% |
| Total Housing Units | 5,009 | 100.0% |
Occupancy by Ownership by Household Size in Luling
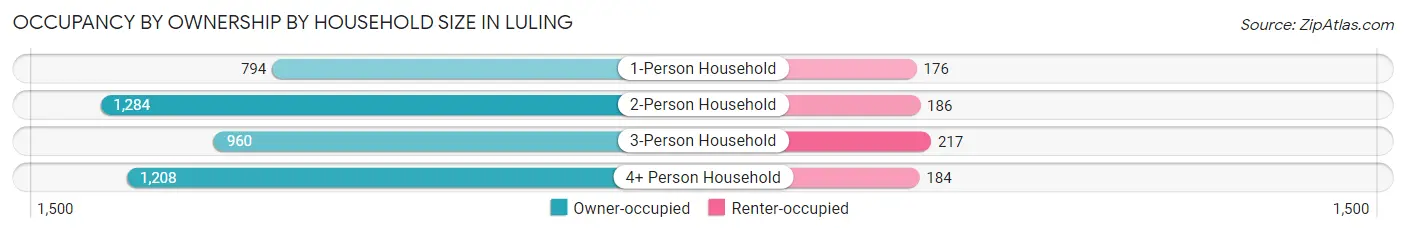
| Household Size | Owner-occupied | Renter-occupied |
| 1-Person Household | 794 (81.9%) | 176 (18.1%) |
| 2-Person Household | 1,284 (87.4%) | 186 (12.7%) |
| 3-Person Household | 960 (81.6%) | 217 (18.4%) |
| 4+ Person Household | 1,208 (86.8%) | 184 (13.2%) |
| Total Housing Units | 4,246 (84.8%) | 763 (15.2%) |
Occupancy by Educational Attainment in Luling
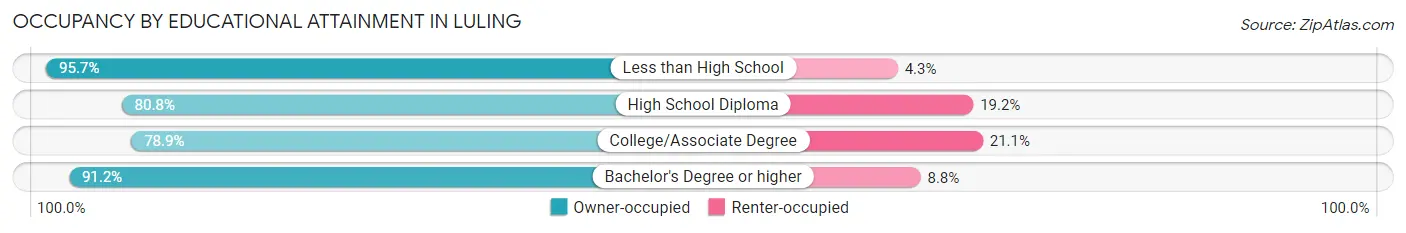
| Household Size | Owner-occupied | Renter-occupied |
| Less than High School | 314 (95.7%) | 14 (4.3%) |
| High School Diploma | 936 (80.8%) | 223 (19.2%) |
| College/Associate Degree | 1,380 (78.9%) | 370 (21.1%) |
| Bachelor's Degree or higher | 1,616 (91.2%) | 156 (8.8%) |
Occupancy by Age of Householder in Luling
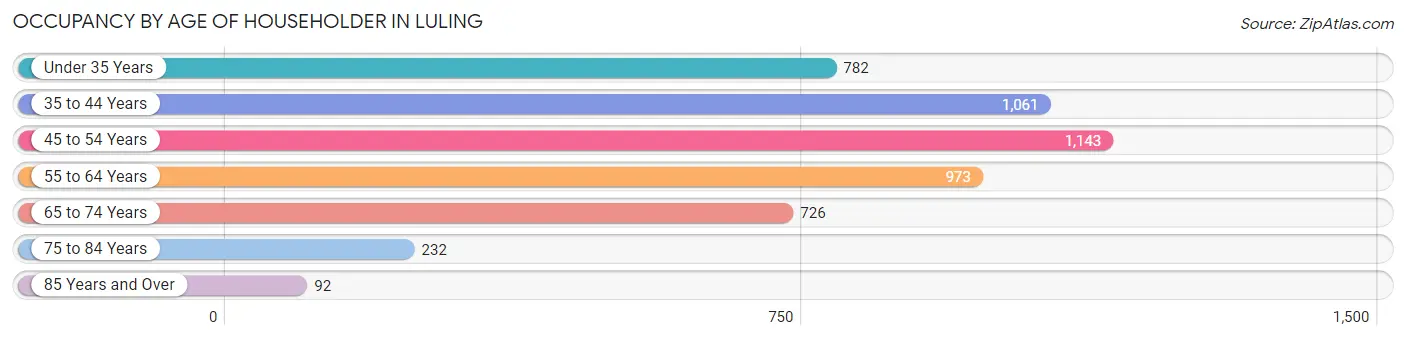
| Age Bracket | # Households | % Households |
| Under 35 Years | 782 | 15.6% |
| 35 to 44 Years | 1,061 | 21.2% |
| 45 to 54 Years | 1,143 | 22.8% |
| 55 to 64 Years | 973 | 19.4% |
| 65 to 74 Years | 726 | 14.5% |
| 75 to 84 Years | 232 | 4.6% |
| 85 Years and Over | 92 | 1.8% |
| Total | 5,009 | 100.0% |
Housing Finances in Luling
Median Income by Occupancy in Luling
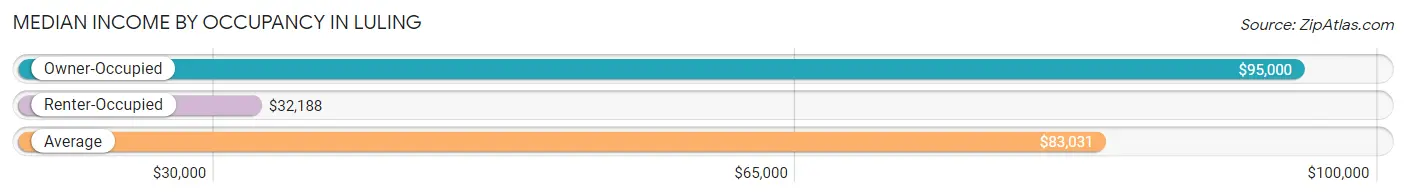
| Occupancy Type | # Households | Median Income |
| Owner-Occupied | 4,246 (84.8%) | $95,000 |
| Renter-Occupied | 763 (15.2%) | $32,188 |
| Average | 5,009 (100.0%) | $83,031 |
Occupancy by Householder Income Bracket in Luling
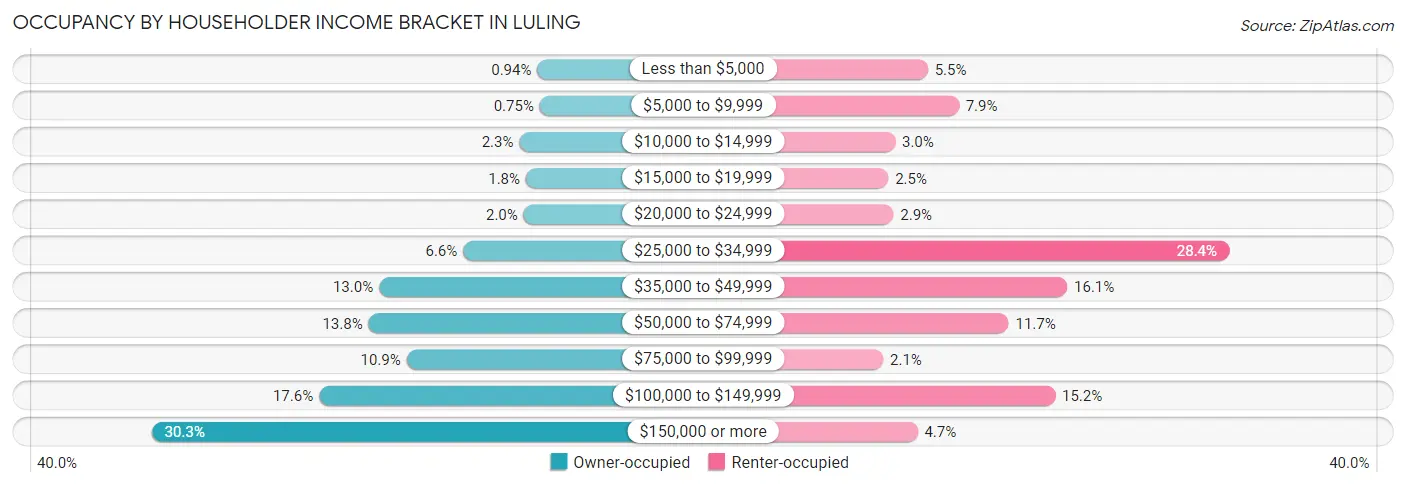
| Income Bracket | Owner-occupied | Renter-occupied |
| Less than $5,000 | 40 (0.9%) | 42 (5.5%) |
| $5,000 to $9,999 | 32 (0.7%) | 60 (7.9%) |
| $10,000 to $14,999 | 98 (2.3%) | 23 (3.0%) |
| $15,000 to $19,999 | 77 (1.8%) | 19 (2.5%) |
| $20,000 to $24,999 | 84 (2.0%) | 22 (2.9%) |
| $25,000 to $34,999 | 280 (6.6%) | 217 (28.4%) |
| $35,000 to $49,999 | 552 (13.0%) | 123 (16.1%) |
| $50,000 to $74,999 | 586 (13.8%) | 89 (11.7%) |
| $75,000 to $99,999 | 463 (10.9%) | 16 (2.1%) |
| $100,000 to $149,999 | 746 (17.6%) | 116 (15.2%) |
| $150,000 or more | 1,288 (30.3%) | 36 (4.7%) |
| Total | 4,246 (100.0%) | 763 (100.0%) |
Monthly Housing Cost Tiers in Luling
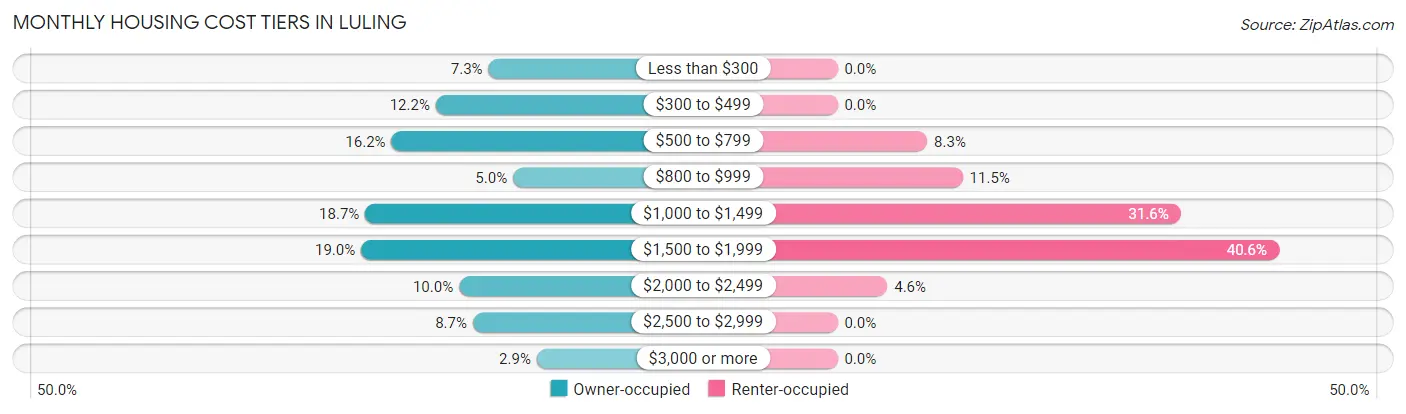
| Monthly Cost | Owner-occupied | Renter-occupied |
| Less than $300 | 310 (7.3%) | 0 (0.0%) |
| $300 to $499 | 516 (12.1%) | 0 (0.0%) |
| $500 to $799 | 689 (16.2%) | 63 (8.3%) |
| $800 to $999 | 214 (5.0%) | 88 (11.5%) |
| $1,000 to $1,499 | 792 (18.6%) | 241 (31.6%) |
| $1,500 to $1,999 | 808 (19.0%) | 310 (40.6%) |
| $2,000 to $2,499 | 425 (10.0%) | 35 (4.6%) |
| $2,500 to $2,999 | 371 (8.7%) | 0 (0.0%) |
| $3,000 or more | 121 (2.9%) | 0 (0.0%) |
| Total | 4,246 (100.0%) | 763 (100.0%) |
Physical Housing Characteristics in Luling
Housing Structures in Luling
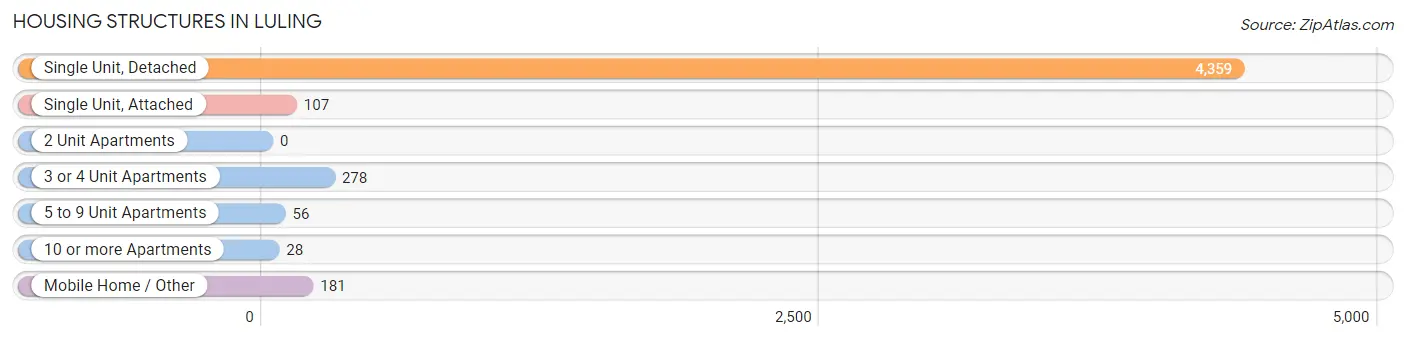
| Structure Type | # Housing Units | % Housing Units |
| Single Unit, Detached | 4,359 | 87.0% |
| Single Unit, Attached | 107 | 2.1% |
| 2 Unit Apartments | 0 | 0.0% |
| 3 or 4 Unit Apartments | 278 | 5.6% |
| 5 to 9 Unit Apartments | 56 | 1.1% |
| 10 or more Apartments | 28 | 0.6% |
| Mobile Home / Other | 181 | 3.6% |
| Total | 5,009 | 100.0% |
Housing Structures by Occupancy in Luling
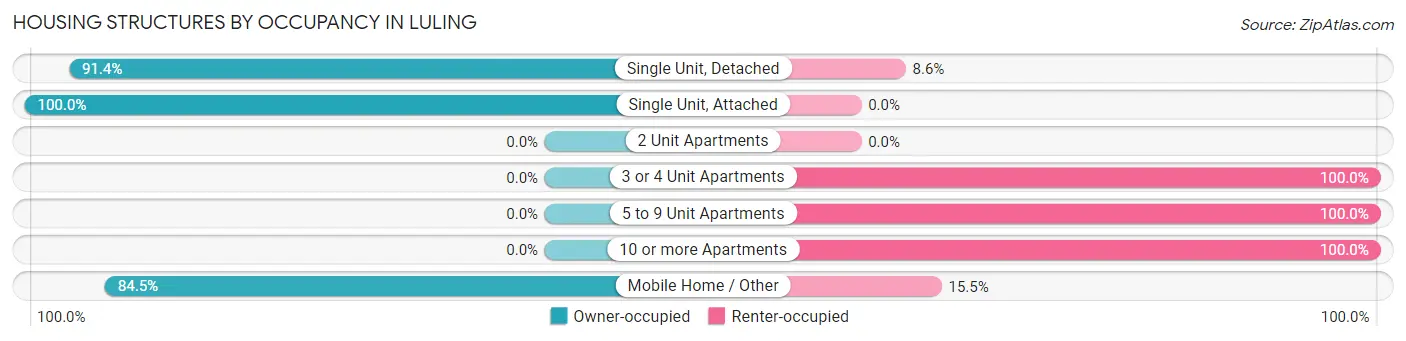
| Structure Type | Owner-occupied | Renter-occupied |
| Single Unit, Detached | 3,986 (91.4%) | 373 (8.6%) |
| Single Unit, Attached | 107 (100.0%) | 0 (0.0%) |
| 2 Unit Apartments | 0 (0.0%) | 0 (0.0%) |
| 3 or 4 Unit Apartments | 0 (0.0%) | 278 (100.0%) |
| 5 to 9 Unit Apartments | 0 (0.0%) | 56 (100.0%) |
| 10 or more Apartments | 0 (0.0%) | 28 (100.0%) |
| Mobile Home / Other | 153 (84.5%) | 28 (15.5%) |
| Total | 4,246 (84.8%) | 763 (15.2%) |
Housing Structures by Number of Rooms in Luling
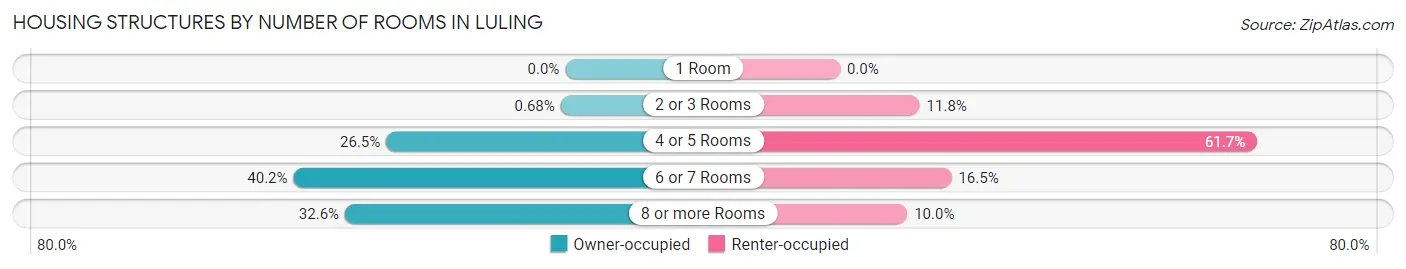
| Number of Rooms | Owner-occupied | Renter-occupied |
| 1 Room | 0 (0.0%) | 0 (0.0%) |
| 2 or 3 Rooms | 29 (0.7%) | 90 (11.8%) |
| 4 or 5 Rooms | 1,125 (26.5%) | 471 (61.7%) |
| 6 or 7 Rooms | 1,708 (40.2%) | 126 (16.5%) |
| 8 or more Rooms | 1,384 (32.6%) | 76 (10.0%) |
| Total | 4,246 (100.0%) | 763 (100.0%) |
Housing Structure by Heating Type in Luling
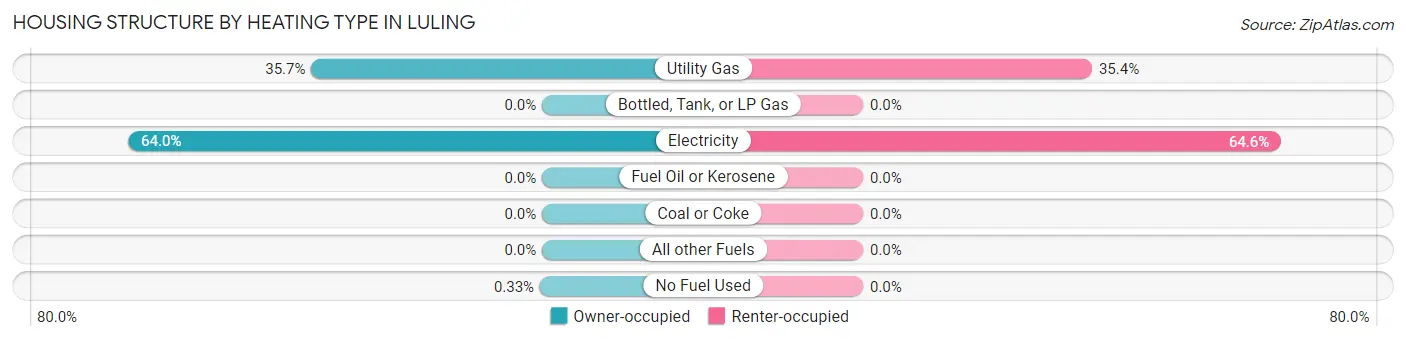
| Heating Type | Owner-occupied | Renter-occupied |
| Utility Gas | 1,515 (35.7%) | 270 (35.4%) |
| Bottled, Tank, or LP Gas | 0 (0.0%) | 0 (0.0%) |
| Electricity | 2,717 (64.0%) | 493 (64.6%) |
| Fuel Oil or Kerosene | 0 (0.0%) | 0 (0.0%) |
| Coal or Coke | 0 (0.0%) | 0 (0.0%) |
| All other Fuels | 0 (0.0%) | 0 (0.0%) |
| No Fuel Used | 14 (0.3%) | 0 (0.0%) |
| Total | 4,246 (100.0%) | 763 (100.0%) |
Household Vehicle Usage in Luling
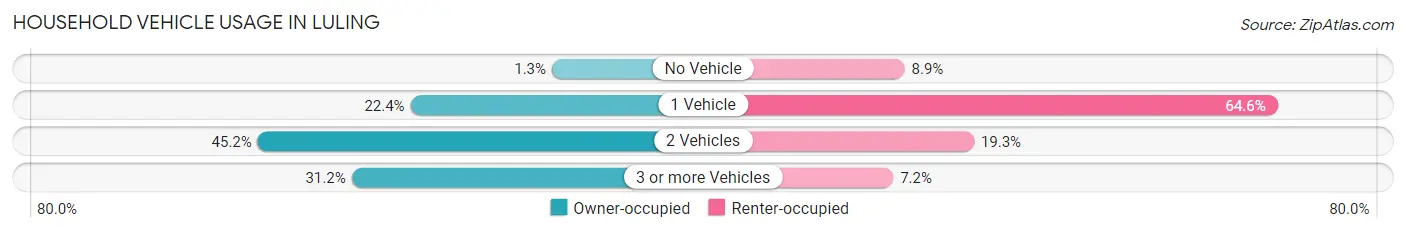
| Vehicles per Household | Owner-occupied | Renter-occupied |
| No Vehicle | 53 (1.3%) | 68 (8.9%) |
| 1 Vehicle | 950 (22.4%) | 493 (64.6%) |
| 2 Vehicles | 1,919 (45.2%) | 147 (19.3%) |
| 3 or more Vehicles | 1,324 (31.2%) | 55 (7.2%) |
| Total | 4,246 (100.0%) | 763 (100.0%) |
Real Estate & Mortgages in Luling
Real Estate and Mortgage Overview in Luling
| Characteristic | Without Mortgage | With Mortgage |
| Housing Units | 1,582 | 2,664 |
| Median Property Value | $249,400 | $266,900 |
| Median Household Income | $61,351 | $1,059 |
| Monthly Housing Costs | $486 | $121 |
| Real Estate Taxes | $1,162 | $361 |
Property Value by Mortgage Status in Luling
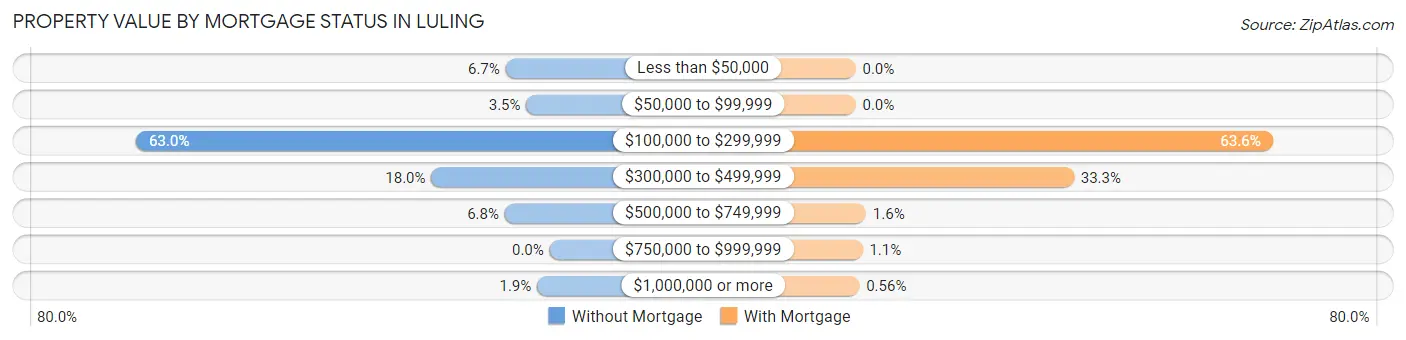
| Property Value | Without Mortgage | With Mortgage |
| Less than $50,000 | 106 (6.7%) | 0 (0.0%) |
| $50,000 to $99,999 | 56 (3.5%) | 0 (0.0%) |
| $100,000 to $299,999 | 997 (63.0%) | 1,693 (63.5%) |
| $300,000 to $499,999 | 285 (18.0%) | 886 (33.3%) |
| $500,000 to $749,999 | 108 (6.8%) | 42 (1.6%) |
| $750,000 to $999,999 | 0 (0.0%) | 28 (1.1%) |
| $1,000,000 or more | 30 (1.9%) | 15 (0.6%) |
| Total | 1,582 (100.0%) | 2,664 (100.0%) |
Household Income by Mortgage Status in Luling
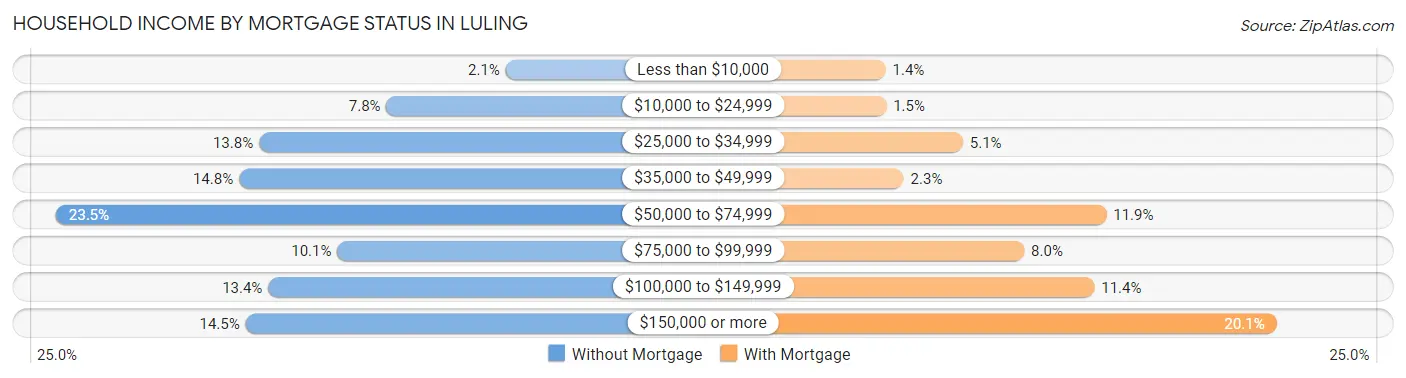
| Household Income | Without Mortgage | With Mortgage |
| Less than $10,000 | 33 (2.1%) | 38 (1.4%) |
| $10,000 to $24,999 | 123 (7.8%) | 39 (1.5%) |
| $25,000 to $34,999 | 219 (13.8%) | 136 (5.1%) |
| $35,000 to $49,999 | 234 (14.8%) | 61 (2.3%) |
| $50,000 to $74,999 | 372 (23.5%) | 318 (11.9%) |
| $75,000 to $99,999 | 160 (10.1%) | 214 (8.0%) |
| $100,000 to $149,999 | 212 (13.4%) | 303 (11.4%) |
| $150,000 or more | 229 (14.5%) | 534 (20.1%) |
| Total | 1,582 (100.0%) | 2,664 (100.0%) |
Property Value to Household Income Ratio in Luling
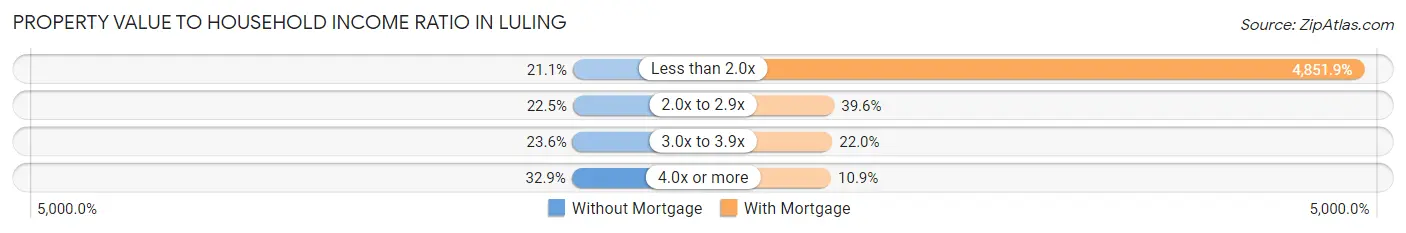
| Value-to-Income Ratio | Without Mortgage | With Mortgage |
| Less than 2.0x | 333 (21.0%) | 129,254 (4,851.9%) |
| 2.0x to 2.9x | 356 (22.5%) | 1,056 (39.6%) |
| 3.0x to 3.9x | 373 (23.6%) | 587 (22.0%) |
| 4.0x or more | 520 (32.9%) | 291 (10.9%) |
| Total | 1,582 (100.0%) | 2,664 (100.0%) |
Real Estate Taxes by Mortgage Status in Luling
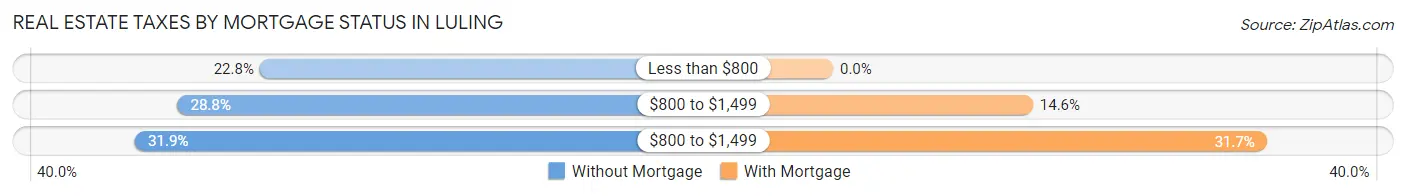
| Property Taxes | Without Mortgage | With Mortgage |
| Less than $800 | 361 (22.8%) | 0 (0.0%) |
| $800 to $1,499 | 456 (28.8%) | 389 (14.6%) |
| $800 to $1,499 | 505 (31.9%) | 844 (31.7%) |
| Total | 1,582 (100.0%) | 2,664 (100.0%) |
Health & Disability in Luling
Health Insurance Coverage by Age in Luling
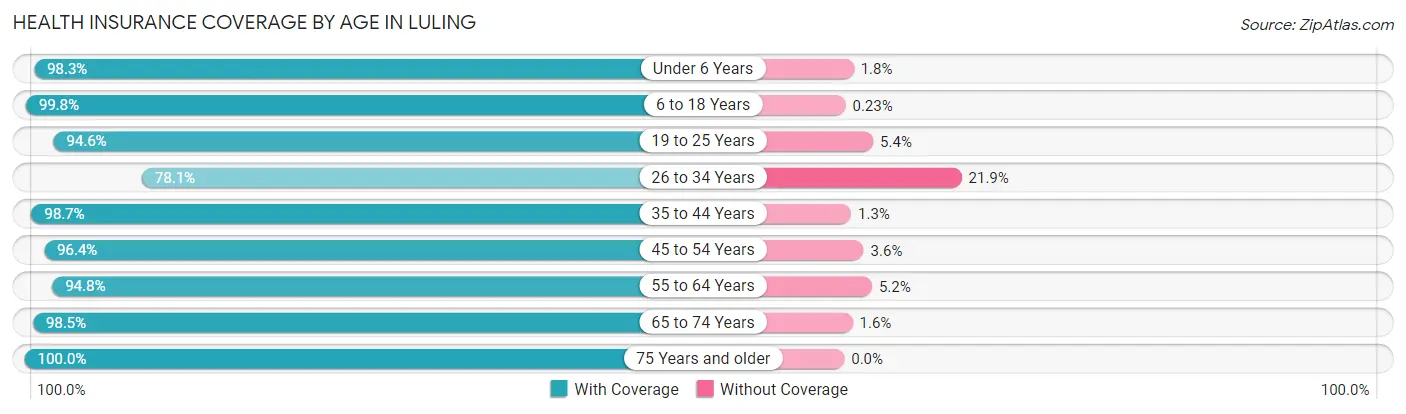
| Age Bracket | With Coverage | Without Coverage |
| Under 6 Years | 898 (98.3%) | 16 (1.8%) |
| 6 to 18 Years | 3,095 (99.8%) | 7 (0.2%) |
| 19 to 25 Years | 985 (94.6%) | 56 (5.4%) |
| 26 to 34 Years | 1,232 (78.1%) | 345 (21.9%) |
| 35 to 44 Years | 2,252 (98.7%) | 29 (1.3%) |
| 45 to 54 Years | 1,975 (96.4%) | 74 (3.6%) |
| 55 to 64 Years | 1,416 (94.8%) | 77 (5.2%) |
| 65 to 74 Years | 1,145 (98.5%) | 18 (1.5%) |
| 75 Years and older | 493 (100.0%) | 0 (0.0%) |
| Total | 13,491 (95.6%) | 622 (4.4%) |
Health Insurance Coverage by Citizenship Status in Luling
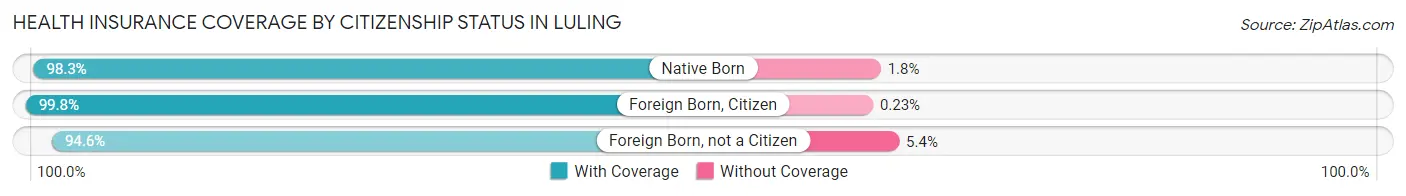
| Citizenship Status | With Coverage | Without Coverage |
| Native Born | 898 (98.3%) | 16 (1.8%) |
| Foreign Born, Citizen | 3,095 (99.8%) | 7 (0.2%) |
| Foreign Born, not a Citizen | 985 (94.6%) | 56 (5.4%) |
Health Insurance Coverage by Household Income in Luling
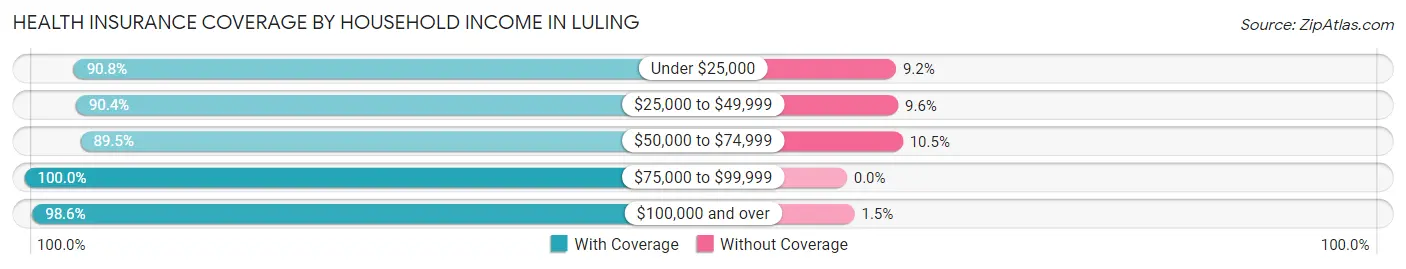
| Household Income | With Coverage | Without Coverage |
| Under $25,000 | 1,094 (90.8%) | 111 (9.2%) |
| $25,000 to $49,999 | 2,330 (90.4%) | 248 (9.6%) |
| $50,000 to $74,999 | 1,333 (89.5%) | 156 (10.5%) |
| $75,000 to $99,999 | 1,445 (100.0%) | 0 (0.0%) |
| $100,000 and over | 7,280 (98.6%) | 107 (1.5%) |
Public vs Private Health Insurance Coverage by Age in Luling
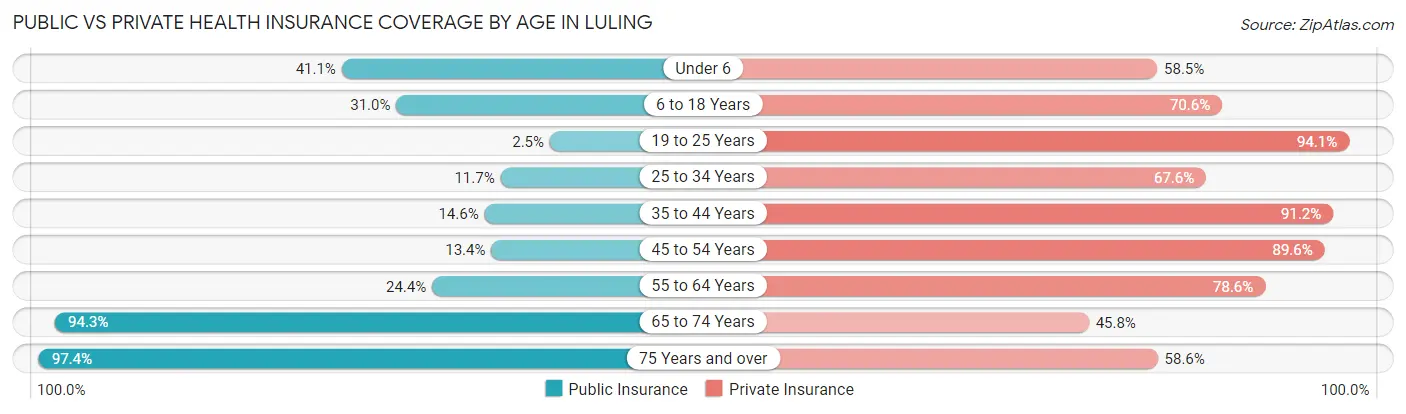
| Age Bracket | Public Insurance | Private Insurance |
| Under 6 | 376 (41.1%) | 535 (58.5%) |
| 6 to 18 Years | 962 (31.0%) | 2,189 (70.6%) |
| 19 to 25 Years | 26 (2.5%) | 980 (94.1%) |
| 25 to 34 Years | 184 (11.7%) | 1,066 (67.6%) |
| 35 to 44 Years | 334 (14.6%) | 2,080 (91.2%) |
| 45 to 54 Years | 274 (13.4%) | 1,836 (89.6%) |
| 55 to 64 Years | 364 (24.4%) | 1,173 (78.6%) |
| 65 to 74 Years | 1,097 (94.3%) | 533 (45.8%) |
| 75 Years and over | 480 (97.4%) | 289 (58.6%) |
| Total | 4,097 (29.0%) | 10,681 (75.7%) |
Disability Status by Sex by Age in Luling
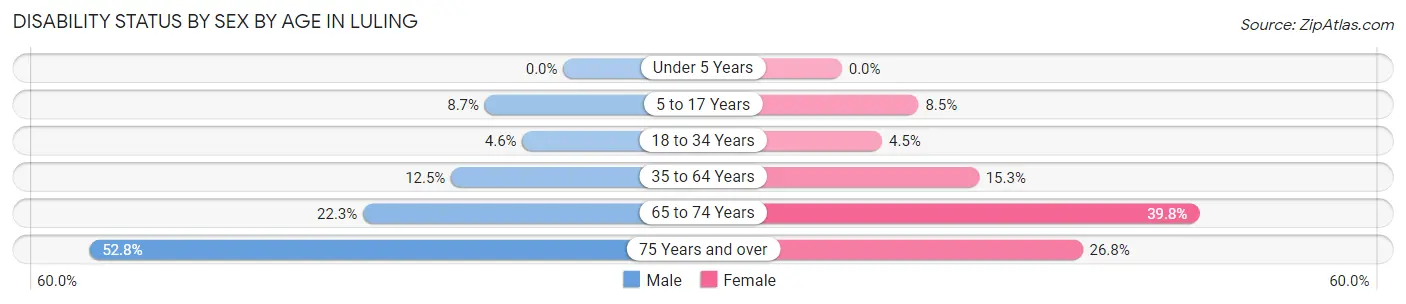
| Age Bracket | Male | Female |
| Under 5 Years | 0 (0.0%) | 0 (0.0%) |
| 5 to 17 Years | 135 (8.7%) | 132 (8.5%) |
| 18 to 34 Years | 63 (4.6%) | 61 (4.5%) |
| 35 to 64 Years | 352 (12.5%) | 458 (15.2%) |
| 65 to 74 Years | 126 (22.3%) | 238 (39.8%) |
| 75 Years and over | 85 (52.8%) | 89 (26.8%) |
Disability Class by Sex by Age in Luling
Disability Class: Hearing Difficulty
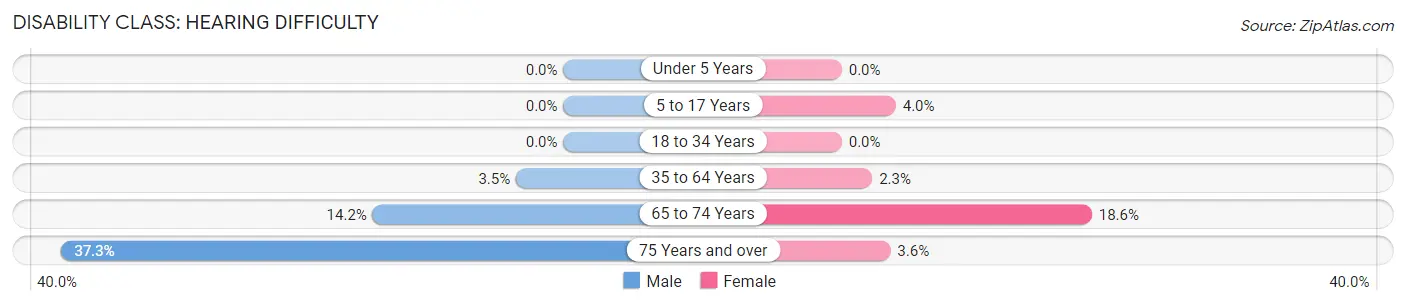
| Age Bracket | Male | Female |
| Under 5 Years | 0 (0.0%) | 0 (0.0%) |
| 5 to 17 Years | 0 (0.0%) | 62 (4.0%) |
| 18 to 34 Years | 0 (0.0%) | 0 (0.0%) |
| 35 to 64 Years | 99 (3.5%) | 68 (2.3%) |
| 65 to 74 Years | 80 (14.2%) | 111 (18.6%) |
| 75 Years and over | 60 (37.3%) | 12 (3.6%) |
Disability Class: Vision Difficulty
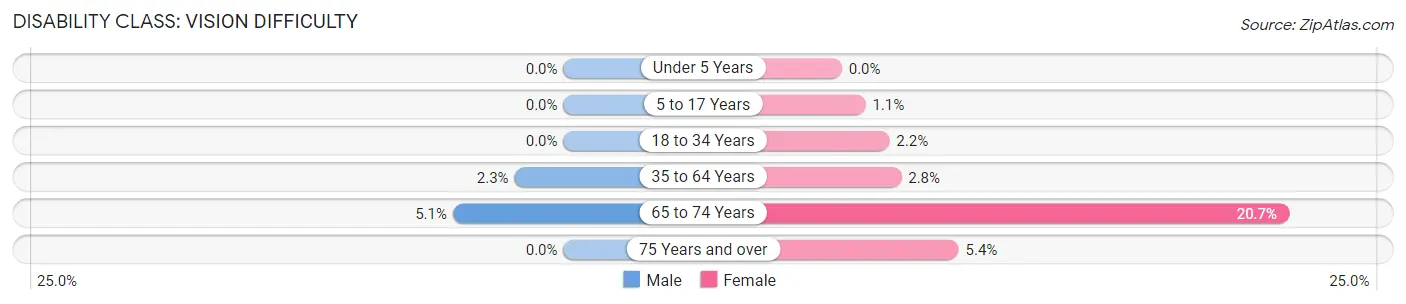
| Age Bracket | Male | Female |
| Under 5 Years | 0 (0.0%) | 0 (0.0%) |
| 5 to 17 Years | 0 (0.0%) | 17 (1.1%) |
| 18 to 34 Years | 0 (0.0%) | 30 (2.2%) |
| 35 to 64 Years | 64 (2.3%) | 83 (2.8%) |
| 65 to 74 Years | 29 (5.1%) | 124 (20.7%) |
| 75 Years and over | 0 (0.0%) | 18 (5.4%) |
Disability Class: Cognitive Difficulty
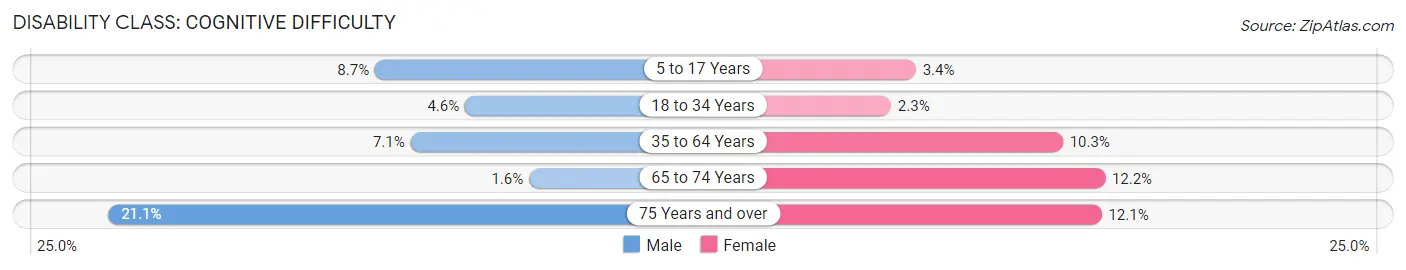
| Age Bracket | Male | Female |
| 5 to 17 Years | 135 (8.7%) | 53 (3.4%) |
| 18 to 34 Years | 63 (4.6%) | 31 (2.3%) |
| 35 to 64 Years | 200 (7.1%) | 308 (10.2%) |
| 65 to 74 Years | 9 (1.6%) | 73 (12.2%) |
| 75 Years and over | 34 (21.1%) | 40 (12.0%) |
Disability Class: Ambulatory Difficulty
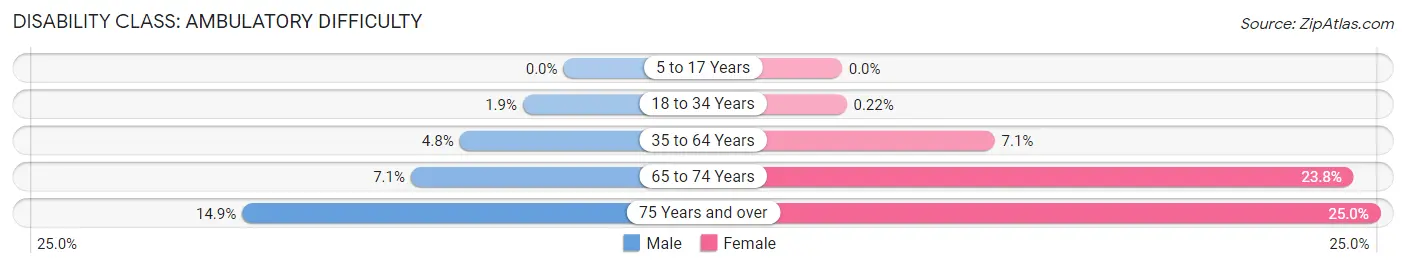
| Age Bracket | Male | Female |
| 5 to 17 Years | 0 (0.0%) | 0 (0.0%) |
| 18 to 34 Years | 26 (1.9%) | 3 (0.2%) |
| 35 to 64 Years | 136 (4.8%) | 213 (7.1%) |
| 65 to 74 Years | 40 (7.1%) | 142 (23.7%) |
| 75 Years and over | 24 (14.9%) | 83 (25.0%) |
Disability Class: Self-Care Difficulty
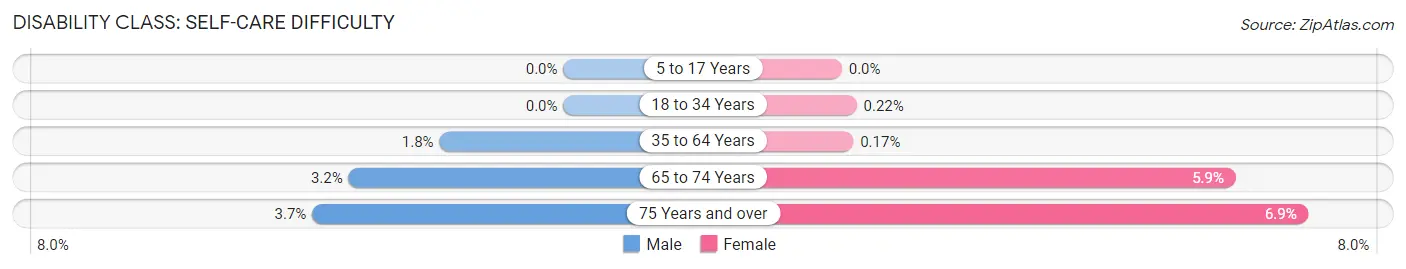
| Age Bracket | Male | Female |
| 5 to 17 Years | 0 (0.0%) | 0 (0.0%) |
| 18 to 34 Years | 0 (0.0%) | 3 (0.2%) |
| 35 to 64 Years | 52 (1.8%) | 5 (0.2%) |
| 65 to 74 Years | 18 (3.2%) | 35 (5.9%) |
| 75 Years and over | 6 (3.7%) | 23 (6.9%) |
Technology Access in Luling
Computing Device Access in Luling
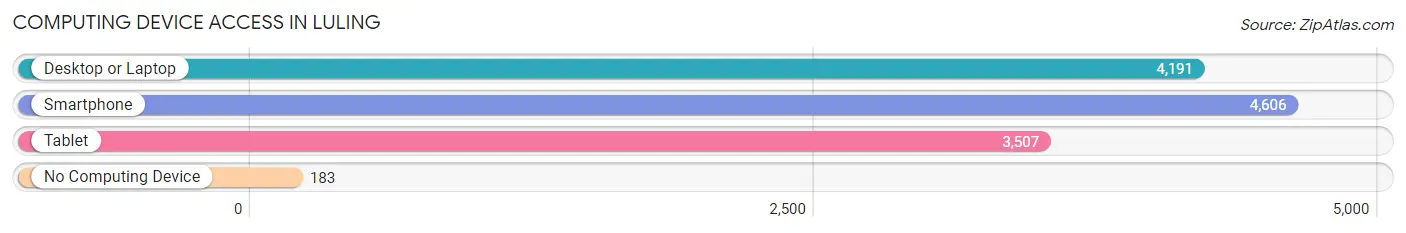
| Device Type | # Households | % Households |
| Desktop or Laptop | 4,191 | 83.7% |
| Smartphone | 4,606 | 91.9% |
| Tablet | 3,507 | 70.0% |
| No Computing Device | 183 | 3.6% |
| Total | 5,009 | 100.0% |
Internet Access in Luling
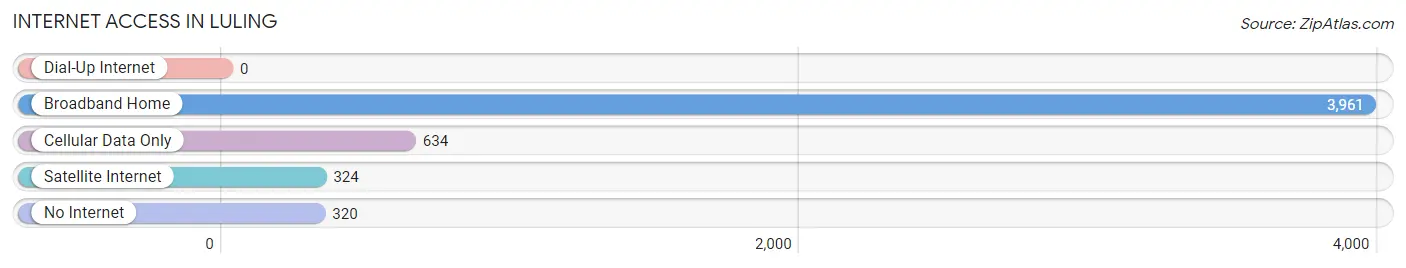
| Internet Type | # Households | % Households |
| Dial-Up Internet | 0 | 0.0% |
| Broadband Home | 3,961 | 79.1% |
| Cellular Data Only | 634 | 12.7% |
| Satellite Internet | 324 | 6.5% |
| No Internet | 320 | 6.4% |
| Total | 5,009 | 100.0% |
Luling Summary
Luling is a small city located in St. Charles Parish, Louisiana, United States. It is situated on the banks of the Mississippi River, about 25 miles west of New Orleans. The population was estimated to be 7,556 in 2019.
History
Luling was founded in 1874 by the Luling family, who had moved to the area from Mississippi. The town was named after the family, and the first post office was established in 1876. The town was incorporated in 1883.
In the early 1900s, Luling was a thriving agricultural community, with cotton, sugar cane, and corn being the main crops. The town was also home to several sawmills and lumberyards.
In the 1920s, the oil industry began to take off in the area, and Luling became a major center for oil production. The town was home to several oil refineries, and the population grew rapidly.
In the 1950s, the oil industry began to decline, and the population of Luling began to decline as well. However, the town remained an important center for the agricultural industry, and the population began to stabilize in the late 1970s.
Geography
Luling is located in St. Charles Parish, Louisiana, on the banks of the Mississippi River. The city is situated about 25 miles west of New Orleans. The terrain is mostly flat, with some rolling hills in the area. The climate is humid subtropical, with hot, humid summers and mild winters.
Economy
Luling’s economy is largely based on agriculture and oil production. The town is home to several oil refineries, and the agricultural industry is still important to the local economy. The town is also home to several manufacturing plants, including a paper mill and a chemical plant.
Demographics
As of the 2019 census, the population of Luling was estimated to be 7,556. The racial makeup of the city was 79.2% White, 17.2% African American, 0.7% Native American, 0.4% Asian, 0.1% Pacific Islander, and 2.4% from other races. Hispanic or Latino of any race were 4.2% of the population.
The median household income in Luling was $45,945, and the median family income was $54,945. The per capita income was $21,945. About 15.2% of the population was below the poverty line.
Conclusion
Luling is a small city located in St. Charles Parish, Louisiana, United States. It is situated on the banks of the Mississippi River, about 25 miles west of New Orleans. The population was estimated to be 7,556 in 2019. The economy of Luling is largely based on agriculture and oil production, and the town is home to several oil refineries and manufacturing plants. The racial makeup of the city was 79.2% White, 17.2% African American, 0.7% Native American, 0.4% Asian, 0.1% Pacific Islander, and 2.4% from other races. The median household income in Luling was $45,945, and the median family income was $54,945. About 15.2% of the population was below the poverty line.
Common Questions
What is Per Capita Income in Luling?
Per Capita income in Luling is $36,414.
What is the Median Family Income in Luling?
Median Family Income in Luling is $99,049.
What is the Median Household income in Luling?
Median Household Income in Luling is $83,031.
What is Income or Wage Gap in Luling?
Income or Wage Gap in Luling is 23.6%.
Women in Luling earn 76.4 cents for every dollar earned by a man.
What is Family Income Deficit in Luling?
Family Income Deficit in Luling is $7,113.
Families that are below poverty line in Luling earn $7,113 less on average than the poverty threshold level.
What is Inequality or Gini Index in Luling?
Inequality or Gini Index in Luling is 0.40.
What is the Total Population of Luling?
Total Population of Luling is 14,207.
What is the Total Male Population of Luling?
Total Male Population of Luling is 6,822.
What is the Total Female Population of Luling?
Total Female Population of Luling is 7,385.
What is the Ratio of Males per 100 Females in Luling?
There are 92.38 Males per 100 Females in Luling.
What is the Ratio of Females per 100 Males in Luling?
There are 108.25 Females per 100 Males in Luling.
What is the Median Population Age in Luling?
Median Population Age in Luling is 37.6 Years.
What is the Average Family Size in Luling
Average Family Size in Luling is 3.3 People.
What is the Average Household Size in Luling
Average Household Size in Luling is 2.8 People.
How Large is the Labor Force in Luling?
There are 7,242 People in the Labor Forcein in Luling.
What is the Percentage of People in the Labor Force in Luling?
66.8% of People are in the Labor Force in Luling.
What is the Unemployment Rate in Luling?
Unemployment Rate in Luling is 4.8%.