Lockport, LA Map & Demographics
Lockport Map
Lockport Overview
$24,553
PER CAPITA INCOME
$61,875
AVG FAMILY INCOME
$50,221
AVG HOUSEHOLD INCOME
52.3%
WAGE / INCOME GAP [ % ]
47.7¢/ $1
WAGE / INCOME GAP [ $ ]
0.40
INEQUALITY / GINI INDEX
2,761
TOTAL POPULATION
1,329
MALE POPULATION
1,432
FEMALE POPULATION
92.81
MALES / 100 FEMALES
107.75
FEMALES / 100 MALES
40.1
MEDIAN AGE
3.4
AVG FAMILY SIZE
2.8
AVG HOUSEHOLD SIZE
1,051
LABOR FORCE [ PEOPLE ]
50.2%
PERCENT IN LABOR FORCE
7.5%
UNEMPLOYMENT RATE
Lockport Zip Codes
Lockport Area Codes
Income in Lockport
Income Overview in Lockport
Per Capita Income in Lockport is $24,553, while median incomes of families and households are $61,875 and $50,221 respectively.
| Characteristic | Number | Measure |
| Per Capita Income | 2,761 | $24,553 |
| Median Family Income | 678 | $61,875 |
| Mean Family Income | 678 | $75,289 |
| Median Household Income | 977 | $50,221 |
| Mean Household Income | 977 | $64,581 |
| Income Deficit | 678 | $0 |
| Wage / Income Gap (%) | 2,761 | 52.29% |
| Wage / Income Gap ($) | 2,761 | 47.71¢ per $1 |
| Gini / Inequality Index | 2,761 | 0.40 |
Earnings by Sex in Lockport
Average Earnings in Lockport are $37,604, $58,021 for men and $27,679 for women, a difference of 52.3%.
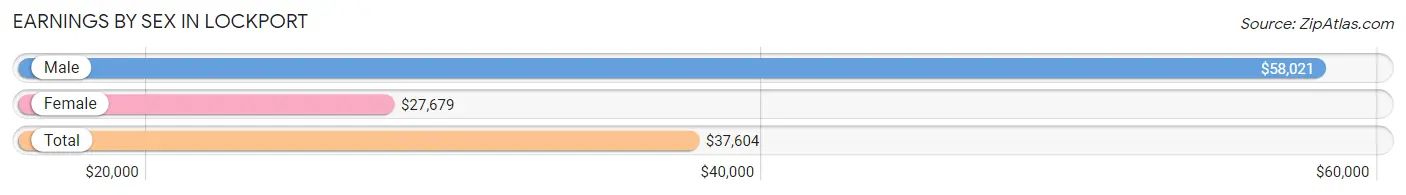
| Sex | Number | Average Earnings |
| Male | 605 (56.5%) | $58,021 |
| Female | 466 (43.5%) | $27,679 |
| Total | 1,071 (100.0%) | $37,604 |
Earnings by Sex by Income Bracket in Lockport
The most common earnings brackets in Lockport are $55,000 to $64,999 for men (105 | 17.4%) and $25,000 to $29,999 for women (105 | 22.5%).
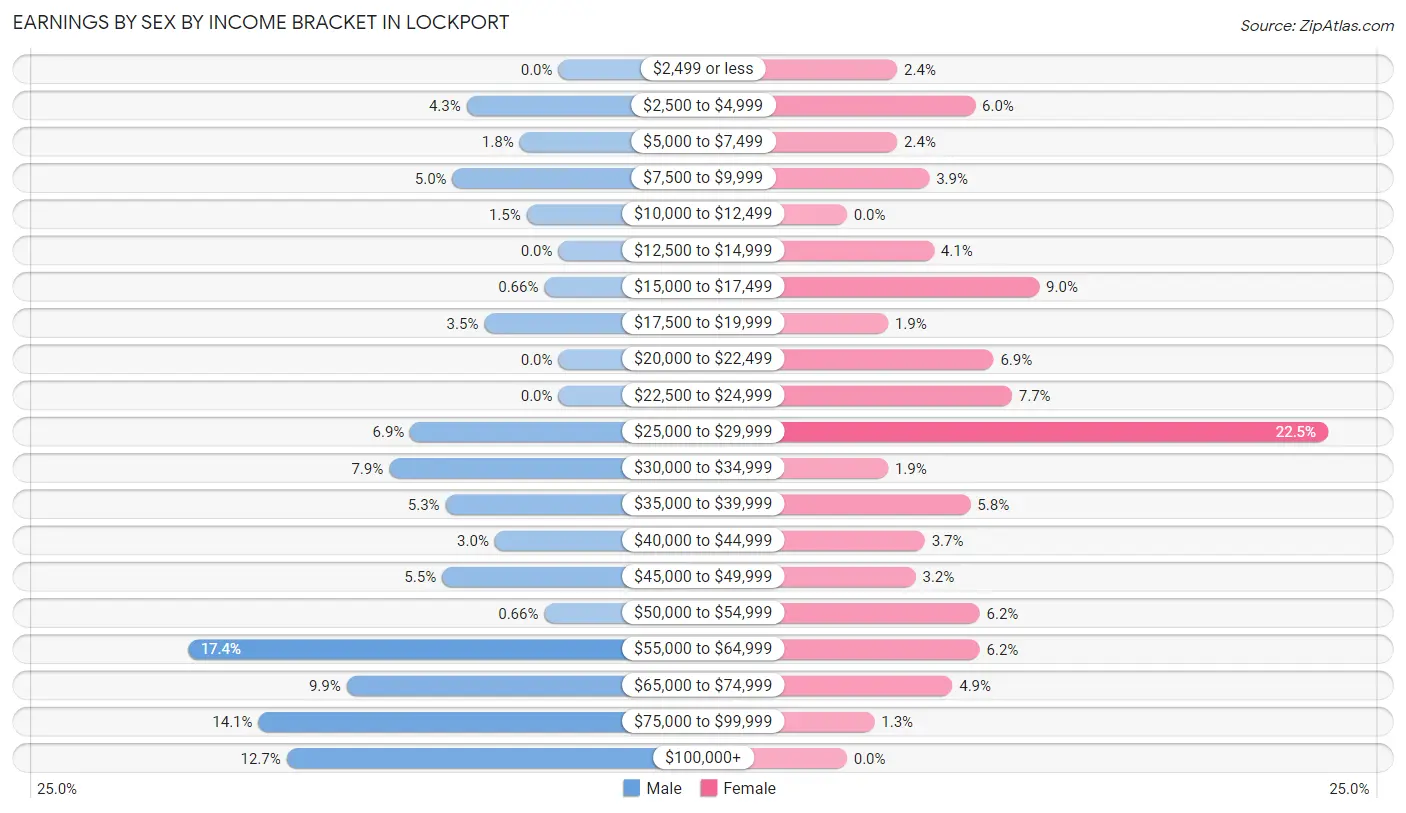
| Income | Male | Female |
| $2,499 or less | 0 (0.0%) | 11 (2.4%) |
| $2,500 to $4,999 | 26 (4.3%) | 28 (6.0%) |
| $5,000 to $7,499 | 11 (1.8%) | 11 (2.4%) |
| $7,500 to $9,999 | 30 (5.0%) | 18 (3.9%) |
| $10,000 to $12,499 | 9 (1.5%) | 0 (0.0%) |
| $12,500 to $14,999 | 0 (0.0%) | 19 (4.1%) |
| $15,000 to $17,499 | 4 (0.7%) | 42 (9.0%) |
| $17,500 to $19,999 | 21 (3.5%) | 9 (1.9%) |
| $20,000 to $22,499 | 0 (0.0%) | 32 (6.9%) |
| $22,500 to $24,999 | 0 (0.0%) | 36 (7.7%) |
| $25,000 to $29,999 | 42 (6.9%) | 105 (22.5%) |
| $30,000 to $34,999 | 48 (7.9%) | 9 (1.9%) |
| $35,000 to $39,999 | 32 (5.3%) | 27 (5.8%) |
| $40,000 to $44,999 | 18 (3.0%) | 17 (3.6%) |
| $45,000 to $49,999 | 33 (5.4%) | 15 (3.2%) |
| $50,000 to $54,999 | 4 (0.7%) | 29 (6.2%) |
| $55,000 to $64,999 | 105 (17.4%) | 29 (6.2%) |
| $65,000 to $74,999 | 60 (9.9%) | 23 (4.9%) |
| $75,000 to $99,999 | 85 (14.1%) | 6 (1.3%) |
| $100,000+ | 77 (12.7%) | 0 (0.0%) |
| Total | 605 (100.0%) | 466 (100.0%) |
Earnings by Sex by Educational Attainment in Lockport
Average earnings in Lockport are $59,839 for men and $27,738 for women, a difference of 53.6%. Men with an educational attainment of high school diploma enjoy the highest average annual earnings of $69,091, while those with college or associate's degree education earn the least with $59,688. Women with an educational attainment of bachelor's degree earn the most with the average annual earnings of $52,586, while those with less than high school education have the smallest earnings of $23,000.
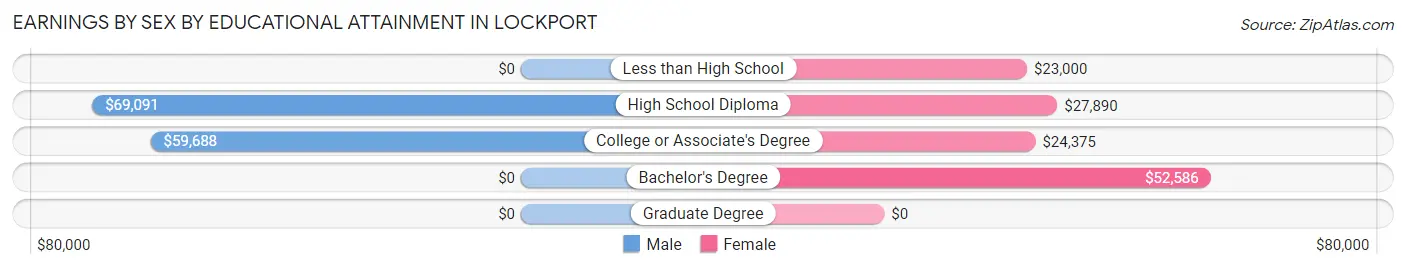
| Educational Attainment | Male Income | Female Income |
| Less than High School | - | - |
| High School Diploma | $69,091 | $27,890 |
| College or Associate's Degree | $59,688 | $24,375 |
| Bachelor's Degree | - | - |
| Graduate Degree | - | - |
| Total | $59,839 | $27,738 |
Family Income in Lockport
Family Income Brackets in Lockport
According to the Lockport family income data, there are 150 families falling into the $100,000 to $149,999 income range, which is the most common income bracket and makes up 22.1% of all families.
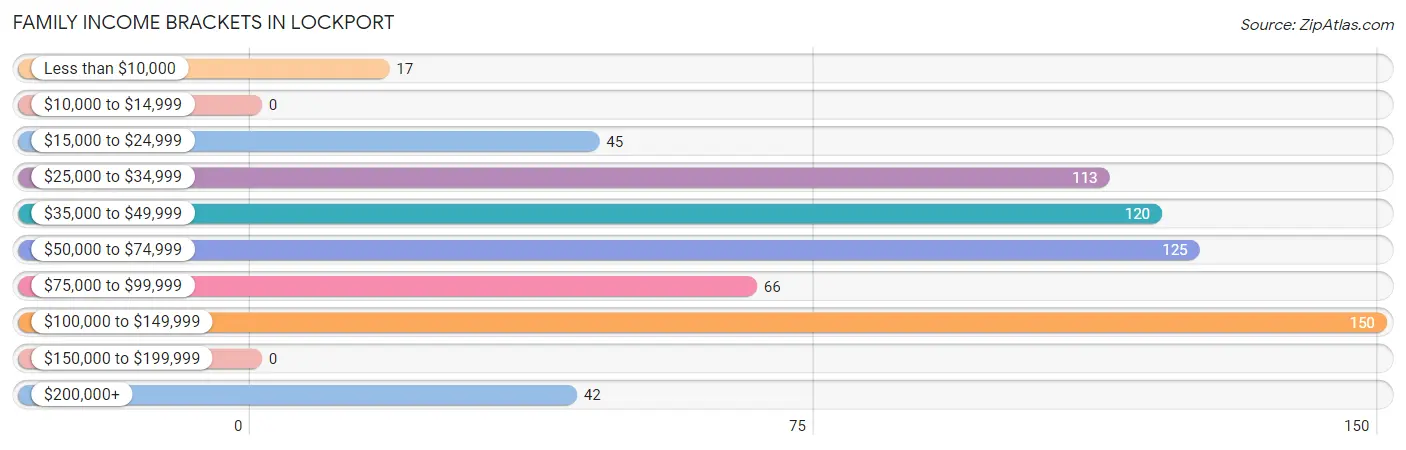
| Income Bracket | # Families | % Families |
| Less than $10,000 | 17 | 2.5% |
| $10,000 to $14,999 | 0 | 0.0% |
| $15,000 to $24,999 | 45 | 6.6% |
| $25,000 to $34,999 | 113 | 16.7% |
| $35,000 to $49,999 | 120 | 17.7% |
| $50,000 to $74,999 | 125 | 18.4% |
| $75,000 to $99,999 | 66 | 9.7% |
| $100,000 to $149,999 | 150 | 22.1% |
| $150,000 to $199,999 | 0 | 0.0% |
| $200,000+ | 42 | 6.2% |
Family Income by Famaliy Size in Lockport
3-person families (167 | 24.6%) account for the highest median family income in Lockport with $76,375 per family, while 2-person families (265 | 39.1%) have the highest median income of $26,062 per family member.
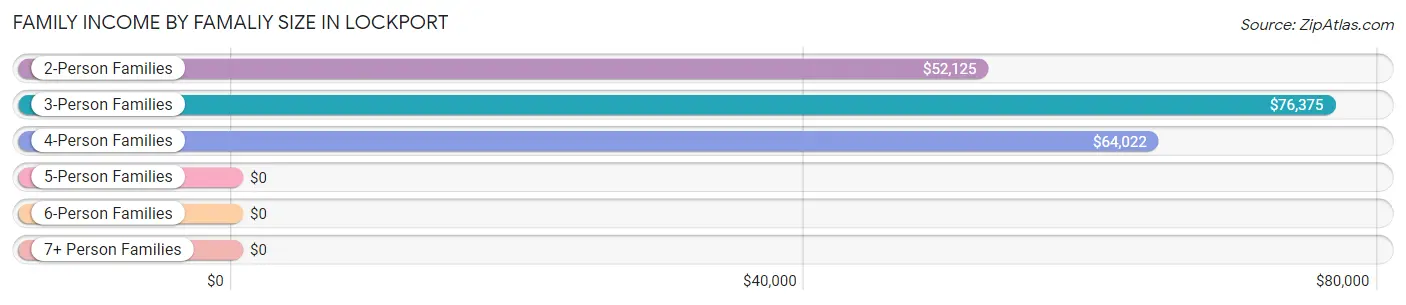
| Income Bracket | # Families | Median Income |
| 2-Person Families | 265 (39.1%) | $52,125 |
| 3-Person Families | 167 (24.6%) | $76,375 |
| 4-Person Families | 182 (26.8%) | $64,022 |
| 5-Person Families | 16 (2.4%) | $0 |
| 6-Person Families | 32 (4.7%) | $0 |
| 7+ Person Families | 16 (2.4%) | $0 |
| Total | 678 (100.0%) | $61,875 |
Family Income by Number of Earners in Lockport
The median family income in Lockport is $61,875, with families comprising 3+ earners (56) having the highest median family income of $145,156, while families with no earners (137) have the lowest median family income of $40,104, accounting for 8.3% and 20.2% of families, respectively.
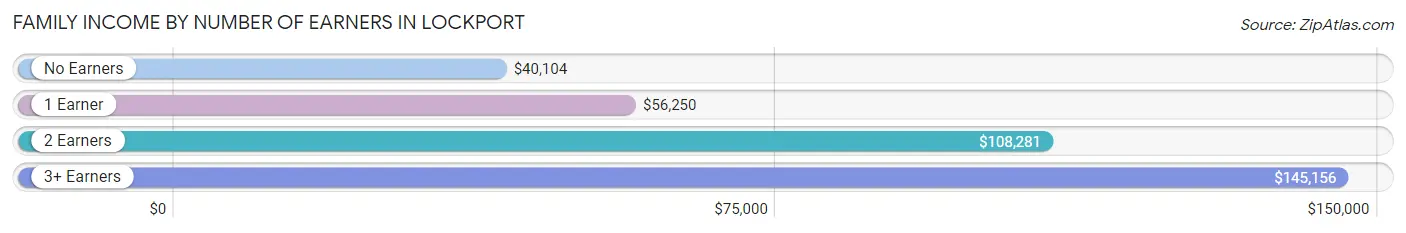
| Number of Earners | # Families | Median Income |
| No Earners | 137 (20.2%) | $40,104 |
| 1 Earner | 355 (52.4%) | $56,250 |
| 2 Earners | 130 (19.2%) | $108,281 |
| 3+ Earners | 56 (8.3%) | $145,156 |
| Total | 678 (100.0%) | $61,875 |
Household Income in Lockport
Household Income Brackets in Lockport
With 186 households falling in the category, the $50,000 to $74,999 income range is the most frequent in Lockport, accounting for 19.0% of all households.
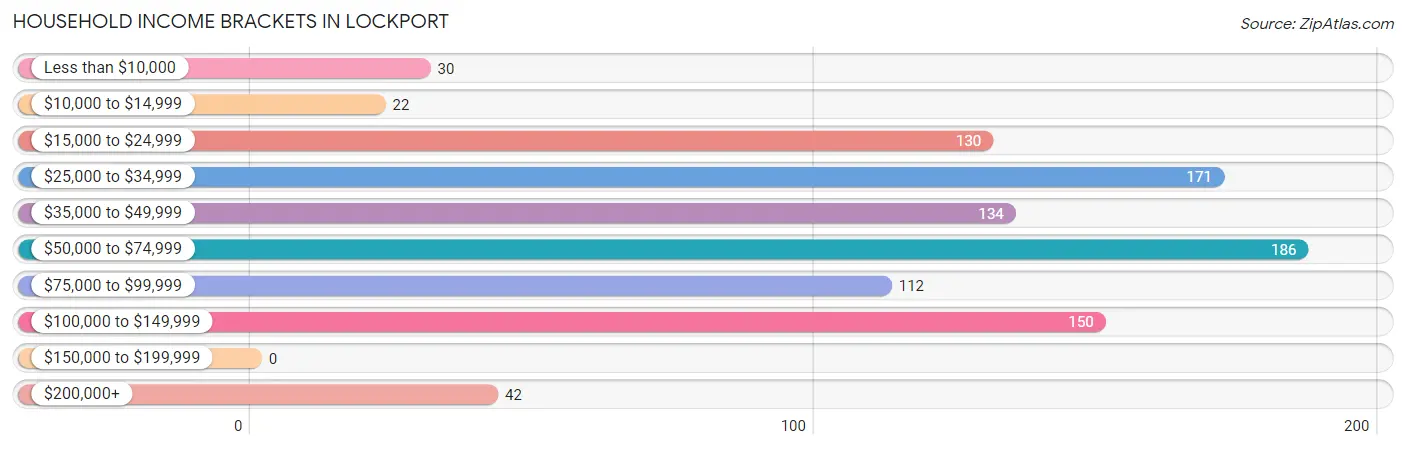
| Income Bracket | # Households | % Households |
| Less than $10,000 | 30 | 3.1% |
| $10,000 to $14,999 | 22 | 2.3% |
| $15,000 to $24,999 | 130 | 13.3% |
| $25,000 to $34,999 | 171 | 17.5% |
| $35,000 to $49,999 | 134 | 13.7% |
| $50,000 to $74,999 | 186 | 19.0% |
| $75,000 to $99,999 | 112 | 11.5% |
| $100,000 to $149,999 | 150 | 15.4% |
| $150,000 to $199,999 | 0 | 0.0% |
| $200,000+ | 42 | 4.3% |
Household Income by Householder Age in Lockport
The median household income in Lockport is $50,221, with the highest median household income of $61,638 found in the 25 to 44 years age bracket for the primary householder. A total of 360 households (36.8%) fall into this category. Meanwhile, the 15 to 24 years age bracket for the primary householder has the lowest median household income of $0, with 5 households (0.5%) in this group.
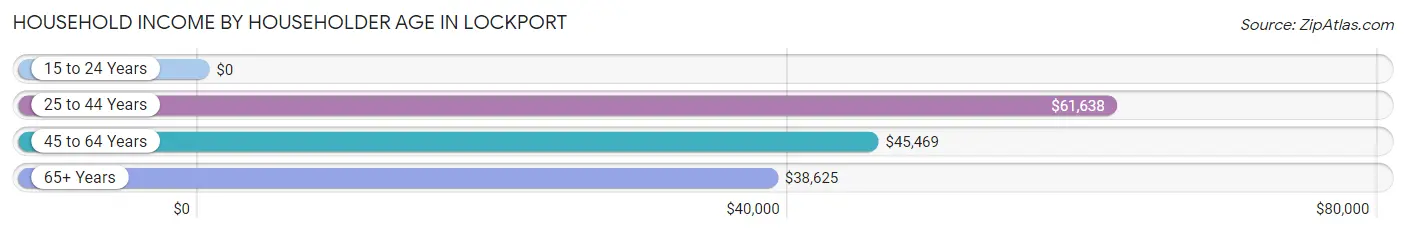
| Income Bracket | # Households | Median Income |
| 15 to 24 Years | 5 (0.5%) | $0 |
| 25 to 44 Years | 360 (36.8%) | $61,638 |
| 45 to 64 Years | 263 (26.9%) | $45,469 |
| 65+ Years | 349 (35.7%) | $38,625 |
| Total | 977 (100.0%) | $50,221 |
Poverty in Lockport
Income Below Poverty by Sex and Age in Lockport
With 10.5% poverty level for males and 15.3% for females among the residents of Lockport, 6 to 11 year old males and 65 to 74 year old females are the most vulnerable to poverty, with 77 males (50.0%) and 46 females (38.7%) in their respective age groups living below the poverty level.
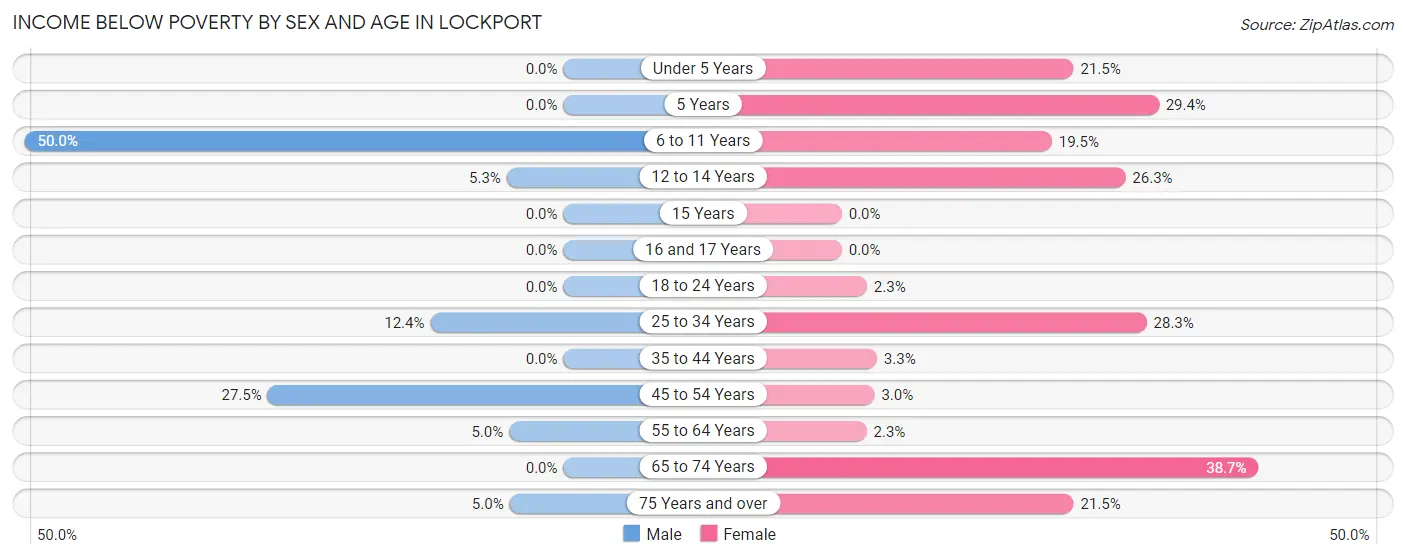
| Age Bracket | Male | Female |
| Under 5 Years | 0 (0.0%) | 20 (21.5%) |
| 5 Years | 0 (0.0%) | 5 (29.4%) |
| 6 to 11 Years | 77 (50.0%) | 23 (19.5%) |
| 12 to 14 Years | 4 (5.3%) | 25 (26.3%) |
| 15 Years | 0 (0.0%) | 0 (0.0%) |
| 16 and 17 Years | 0 (0.0%) | 0 (0.0%) |
| 18 to 24 Years | 0 (0.0%) | 1 (2.3%) |
| 25 to 34 Years | 20 (12.3%) | 43 (28.3%) |
| 35 to 44 Years | 0 (0.0%) | 6 (3.3%) |
| 45 to 54 Years | 28 (27.5%) | 5 (3.0%) |
| 55 to 64 Years | 6 (5.0%) | 5 (2.3%) |
| 65 to 74 Years | 0 (0.0%) | 46 (38.7%) |
| 75 Years and over | 5 (5.0%) | 40 (21.5%) |
| Total | 140 (10.5%) | 219 (15.3%) |
Income Above Poverty by Sex and Age in Lockport
According to the poverty statistics in Lockport, males aged under 5 years and females aged 15 years are the age groups that are most secure financially, with 100.0% of males and 100.0% of females in these age groups living above the poverty line.
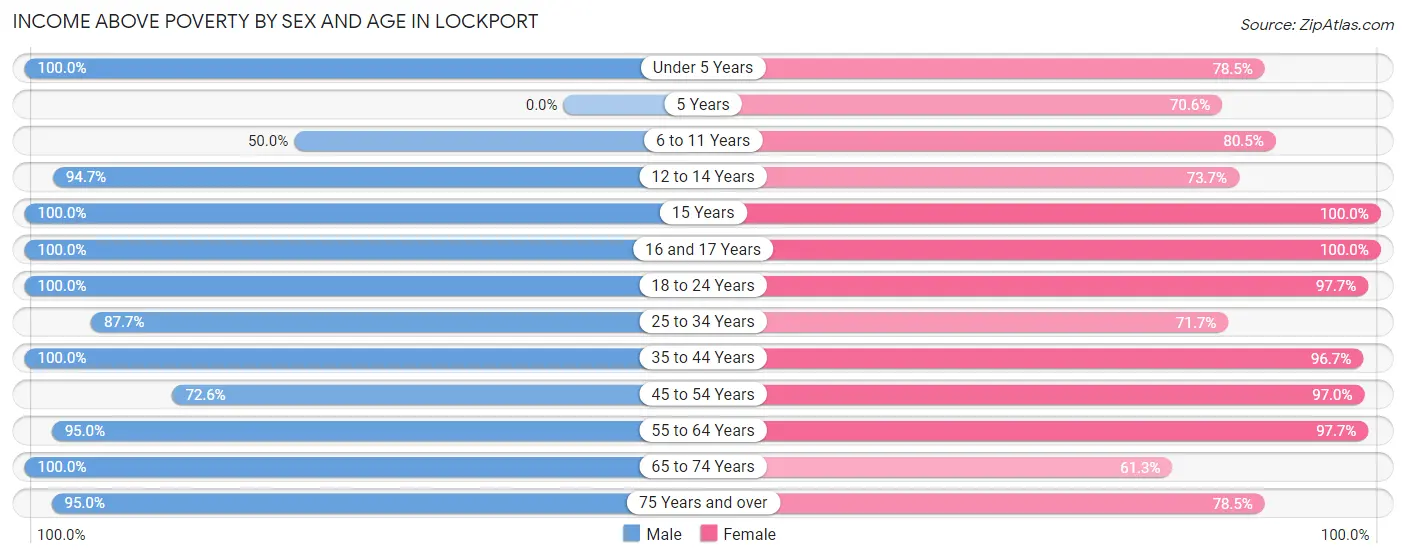
| Age Bracket | Male | Female |
| Under 5 Years | 83 (100.0%) | 73 (78.5%) |
| 5 Years | 0 (0.0%) | 12 (70.6%) |
| 6 to 11 Years | 77 (50.0%) | 95 (80.5%) |
| 12 to 14 Years | 72 (94.7%) | 70 (73.7%) |
| 15 Years | 8 (100.0%) | 23 (100.0%) |
| 16 and 17 Years | 40 (100.0%) | 20 (100.0%) |
| 18 to 24 Years | 69 (100.0%) | 42 (97.7%) |
| 25 to 34 Years | 142 (87.6%) | 109 (71.7%) |
| 35 to 44 Years | 162 (100.0%) | 178 (96.7%) |
| 45 to 54 Years | 74 (72.6%) | 160 (97.0%) |
| 55 to 64 Years | 113 (95.0%) | 212 (97.7%) |
| 65 to 74 Years | 254 (100.0%) | 73 (61.3%) |
| 75 Years and over | 95 (95.0%) | 146 (78.5%) |
| Total | 1,189 (89.5%) | 1,213 (84.7%) |
Income Below Poverty Among Married-Couple Families in Lockport
The poverty statistics for married-couple families in Lockport show that 4.6% or 18 of the total 394 families live below the poverty line. Families with 3 or 4 children have the highest poverty rate of 37.5%, comprising of 18 families. On the other hand, families with no children have the lowest poverty rate of 0.0%, which includes 0 families.
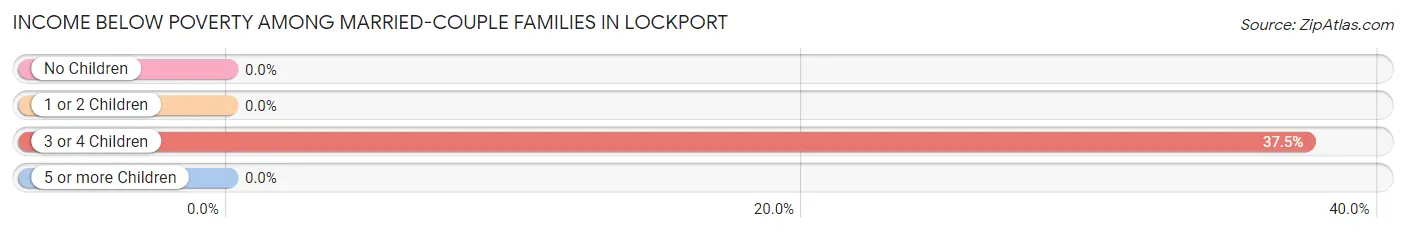
| Children | Above Poverty | Below Poverty |
| No Children | 247 (100.0%) | 0 (0.0%) |
| 1 or 2 Children | 99 (100.0%) | 0 (0.0%) |
| 3 or 4 Children | 30 (62.5%) | 18 (37.5%) |
| 5 or more Children | 0 (0.0%) | 0 (0.0%) |
| Total | 376 (95.4%) | 18 (4.6%) |
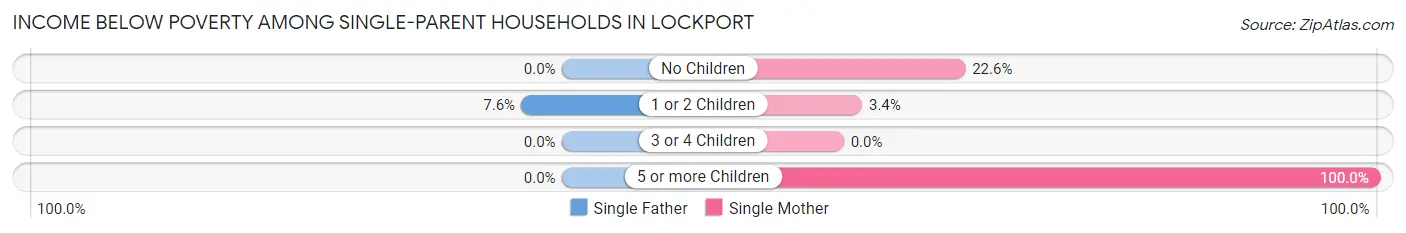
Income Below Poverty Among Single-Parent Households in Lockport
According to the poverty data in Lockport, 6.5% or 4 single-father households and 10.4% or 23 single-mother households are living below the poverty line. Among single-father households, those with 1 or 2 children have the highest poverty rate, with 4 households (7.5%) experiencing poverty. Likewise, among single-mother households, those with 5 or more children have the highest poverty rate, with 6 households (100.0%) falling below the poverty line.
| Children | Single Father | Single Mother |
| No Children | 0 (0.0%) | 12 (22.6%) |
| 1 or 2 Children | 4 (7.5%) | 5 (3.4%) |
| 3 or 4 Children | 0 (0.0%) | 0 (0.0%) |
| 5 or more Children | 0 (0.0%) | 6 (100.0%) |
| Total | 4 (6.5%) | 23 (10.4%) |
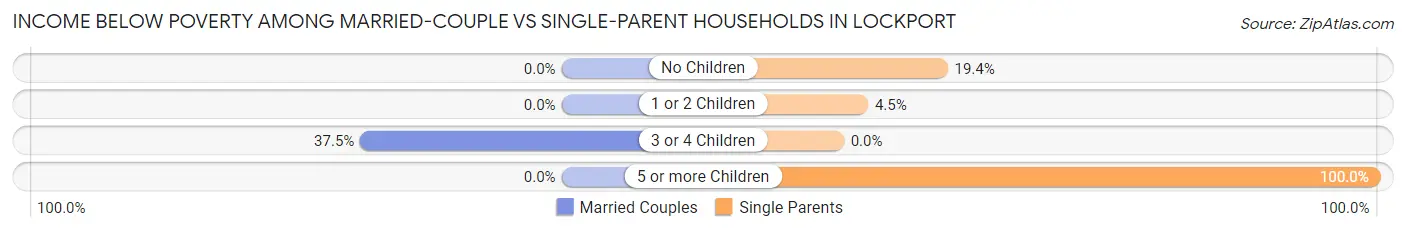
Income Below Poverty Among Married-Couple vs Single-Parent Households in Lockport
The poverty data for Lockport shows that 18 of the married-couple family households (4.6%) and 27 of the single-parent households (9.5%) are living below the poverty level. Within the married-couple family households, those with 3 or 4 children have the highest poverty rate, with 18 households (37.5%) falling below the poverty line. Among the single-parent households, those with 5 or more children have the highest poverty rate, with 6 household (100.0%) living below poverty.
| Children | Married-Couple Families | Single-Parent Households |
| No Children | 0 (0.0%) | 12 (19.4%) |
| 1 or 2 Children | 0 (0.0%) | 9 (4.5%) |
| 3 or 4 Children | 18 (37.5%) | 0 (0.0%) |
| 5 or more Children | 0 (0.0%) | 6 (100.0%) |
| Total | 18 (4.6%) | 27 (9.5%) |
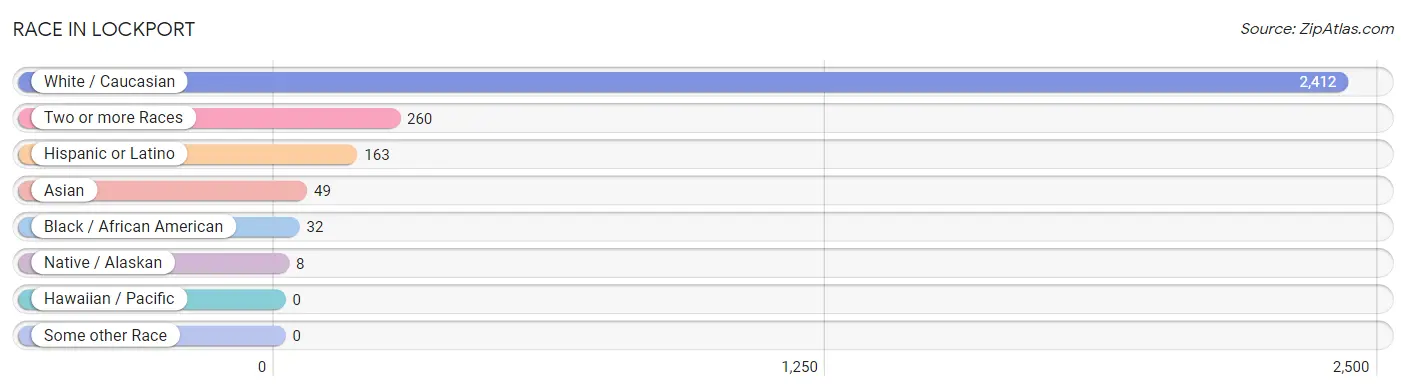
Race in Lockport
The most populous races in Lockport are White / Caucasian (2,412 | 87.4%), Two or more Races (260 | 9.4%), and Hispanic or Latino (163 | 5.9%).
| Race | # Population | % Population |
| Asian | 49 | 1.8% |
| Black / African American | 32 | 1.2% |
| Hawaiian / Pacific | 0 | 0.0% |
| Hispanic or Latino | 163 | 5.9% |
| Native / Alaskan | 8 | 0.3% |
| White / Caucasian | 2,412 | 87.4% |
| Two or more Races | 260 | 9.4% |
| Some other Race | 0 | 0.0% |
| Total | 2,761 | 100.0% |
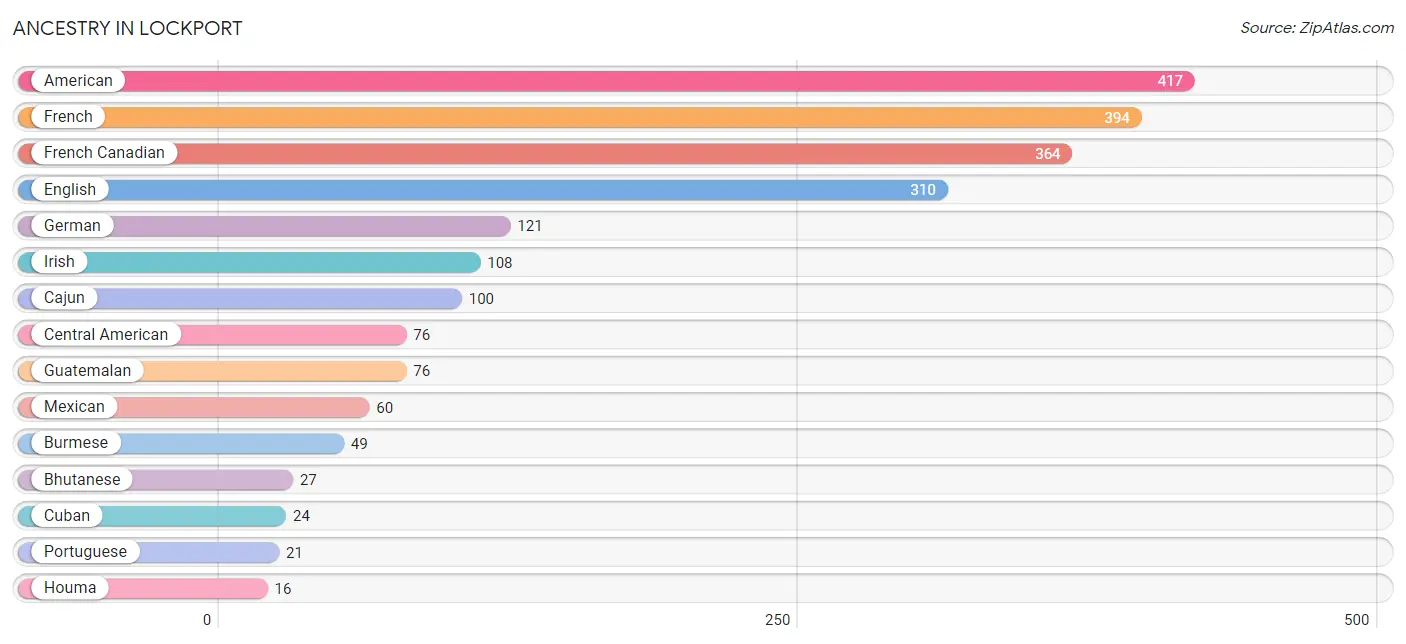
Ancestry in Lockport
The most populous ancestries reported in Lockport are American (417 | 15.1%), French (394 | 14.3%), French Canadian (364 | 13.2%), English (310 | 11.2%), and German (121 | 4.4%), together accounting for 58.2% of all Lockport residents.
| Ancestry | # Population | % Population |
| American | 417 | 15.1% |
| Bhutanese | 27 | 1.0% |
| Burmese | 49 | 1.8% |
| Cajun | 100 | 3.6% |
| Central American | 76 | 2.8% |
| Cuban | 24 | 0.9% |
| Dutch | 10 | 0.4% |
| English | 310 | 11.2% |
| European | 5 | 0.2% |
| French | 394 | 14.3% |
| French Canadian | 364 | 13.2% |
| German | 121 | 4.4% |
| Greek | 6 | 0.2% |
| Guatemalan | 76 | 2.8% |
| Houma | 16 | 0.6% |
| Irish | 108 | 3.9% |
| Italian | 9 | 0.3% |
| Mexican | 60 | 2.2% |
| Polish | 4 | 0.1% |
| Portuguese | 21 | 0.8% |
| Scottish | 5 | 0.2% |
| Spanish | 3 | 0.1% |
| Swedish | 7 | 0.3% | View All 23 Rows |
Immigrants in Lockport
The most numerous immigrant groups reported in Lockport came from Central America (53 | 1.9%), Latin America (53 | 1.9%), Mexico (28 | 1.0%), Guatemala (25 | 0.9%), and Asia (24 | 0.9%), together accounting for 6.6% of all Lockport residents.
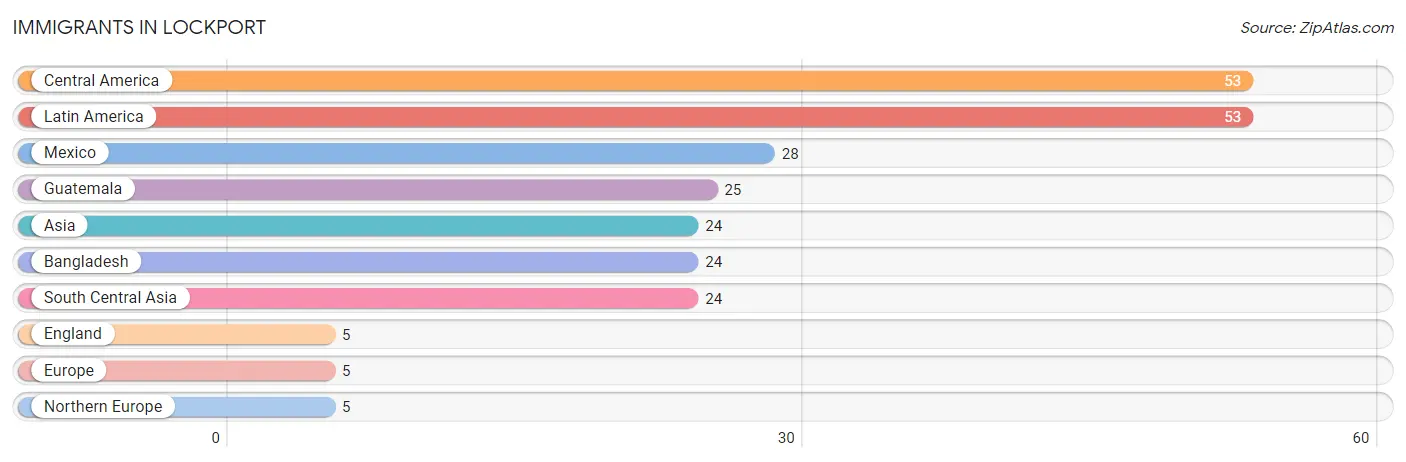
| Immigration Origin | # Population | % Population |
| Asia | 24 | 0.9% |
| Bangladesh | 24 | 0.9% |
| Central America | 53 | 1.9% |
| England | 5 | 0.2% |
| Europe | 5 | 0.2% |
| Guatemala | 25 | 0.9% |
| Latin America | 53 | 1.9% |
| Mexico | 28 | 1.0% |
| Northern Europe | 5 | 0.2% |
| South Central Asia | 24 | 0.9% | View All 10 Rows |
Sex and Age in Lockport
Sex and Age in Lockport
The most populous age groups in Lockport are 10 to 14 Years (198 | 14.9%) for men and 55 to 59 Years (157 | 11.0%) for women.
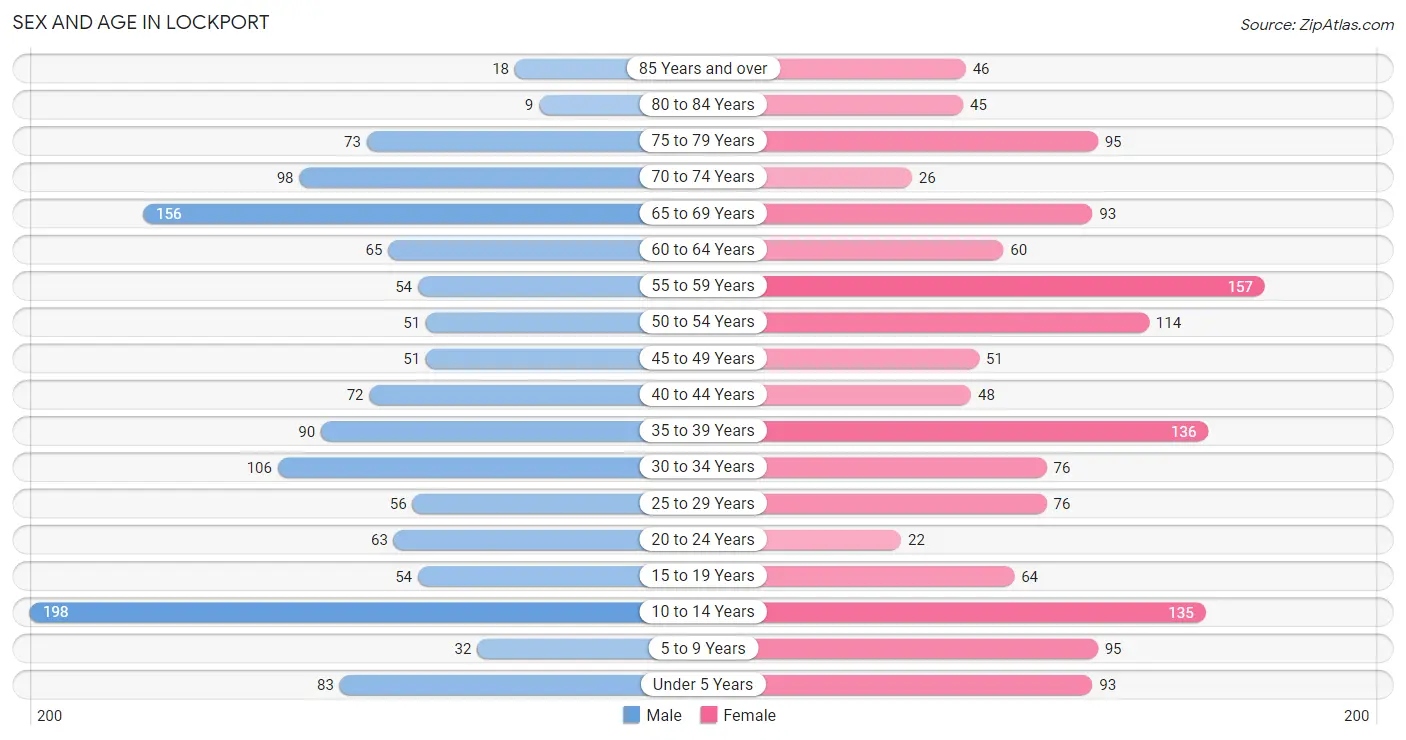
| Age Bracket | Male | Female |
| Under 5 Years | 83 (6.2%) | 93 (6.5%) |
| 5 to 9 Years | 32 (2.4%) | 95 (6.6%) |
| 10 to 14 Years | 198 (14.9%) | 135 (9.4%) |
| 15 to 19 Years | 54 (4.1%) | 64 (4.5%) |
| 20 to 24 Years | 63 (4.7%) | 22 (1.5%) |
| 25 to 29 Years | 56 (4.2%) | 76 (5.3%) |
| 30 to 34 Years | 106 (8.0%) | 76 (5.3%) |
| 35 to 39 Years | 90 (6.8%) | 136 (9.5%) |
| 40 to 44 Years | 72 (5.4%) | 48 (3.4%) |
| 45 to 49 Years | 51 (3.8%) | 51 (3.6%) |
| 50 to 54 Years | 51 (3.8%) | 114 (8.0%) |
| 55 to 59 Years | 54 (4.1%) | 157 (11.0%) |
| 60 to 64 Years | 65 (4.9%) | 60 (4.2%) |
| 65 to 69 Years | 156 (11.7%) | 93 (6.5%) |
| 70 to 74 Years | 98 (7.4%) | 26 (1.8%) |
| 75 to 79 Years | 73 (5.5%) | 95 (6.6%) |
| 80 to 84 Years | 9 (0.7%) | 45 (3.1%) |
| 85 Years and over | 18 (1.3%) | 46 (3.2%) |
| Total | 1,329 (100.0%) | 1,432 (100.0%) |
Families and Households in Lockport
Median Family Size in Lockport
The median family size in Lockport is 3.44 persons per family, with single female/mother families (222 | 32.7%) accounting for the largest median family size of 4.08 persons per family. On the other hand, single male/father families (62 | 9.1%) represent the smallest median family size with 2.74 persons per family.
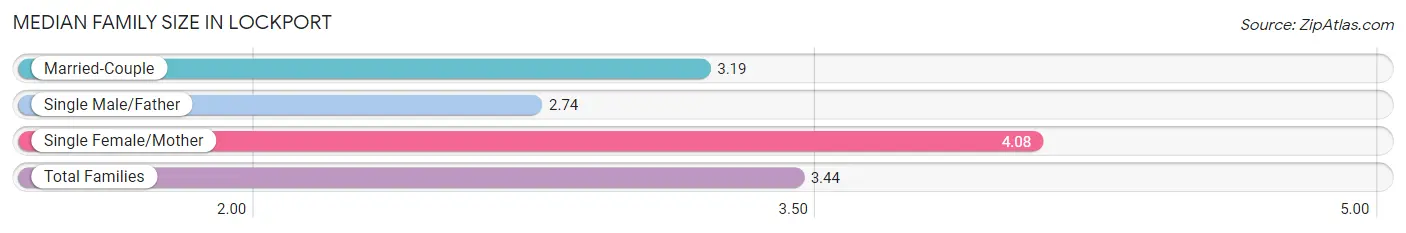
| Family Type | # Families | Family Size |
| Married-Couple | 394 (58.1%) | 3.19 |
| Single Male/Father | 62 (9.1%) | 2.74 |
| Single Female/Mother | 222 (32.7%) | 4.08 |
| Total Families | 678 (100.0%) | 3.44 |
Median Household Size in Lockport
The median household size in Lockport is 2.82 persons per household, with single female/mother households (222 | 22.7%) accounting for the largest median household size of 4.3 persons per household. non-family households (299 | 30.6%) represent the smallest median household size with 1.22 persons per household.
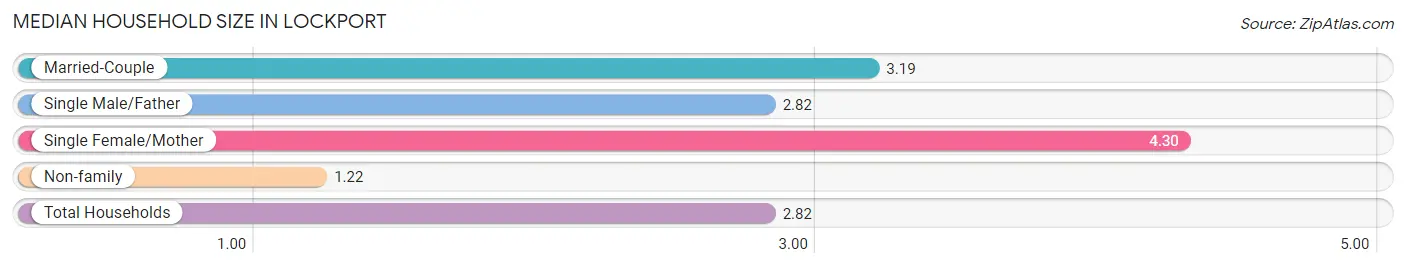
| Household Type | # Households | Household Size |
| Married-Couple | 394 (40.3%) | 3.19 |
| Single Male/Father | 62 (6.4%) | 2.82 |
| Single Female/Mother | 222 (22.7%) | 4.30 |
| Non-family | 299 (30.6%) | 1.22 |
| Total Households | 977 (100.0%) | 2.82 |
Household Size by Marriage Status in Lockport
Out of a total of 977 households in Lockport, 678 (69.4%) are family households, while 299 (30.6%) are nonfamily households. The most numerous type of family households are 2-person households, comprising 258, and the most common type of nonfamily households are 1-person households, comprising 246.
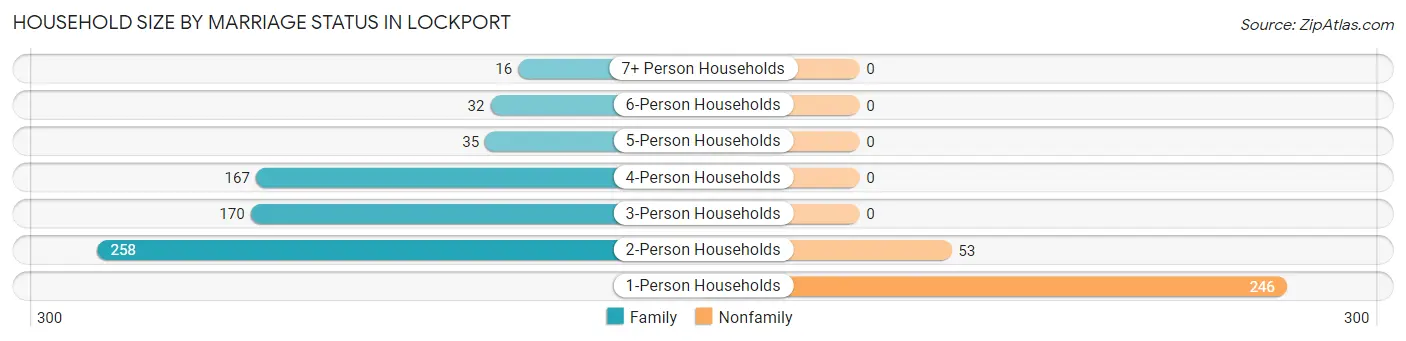
| Household Size | Family Households | Nonfamily Households |
| 1-Person Households | - | 246 (25.2%) |
| 2-Person Households | 258 (26.4%) | 53 (5.4%) |
| 3-Person Households | 170 (17.4%) | 0 (0.0%) |
| 4-Person Households | 167 (17.1%) | 0 (0.0%) |
| 5-Person Households | 35 (3.6%) | 0 (0.0%) |
| 6-Person Households | 32 (3.3%) | 0 (0.0%) |
| 7+ Person Households | 16 (1.6%) | 0 (0.0%) |
| Total | 678 (69.4%) | 299 (30.6%) |
Female Fertility in Lockport
Fertility by Age in Lockport
Average fertility rate in Lockport is 38.0 births per 1,000 women. Women in the age bracket of 20 to 34 years have the highest fertility rate with 109.0 births per 1,000 women. Women in the age bracket of 20 to 34 years acount for 100.0% of all women with births.
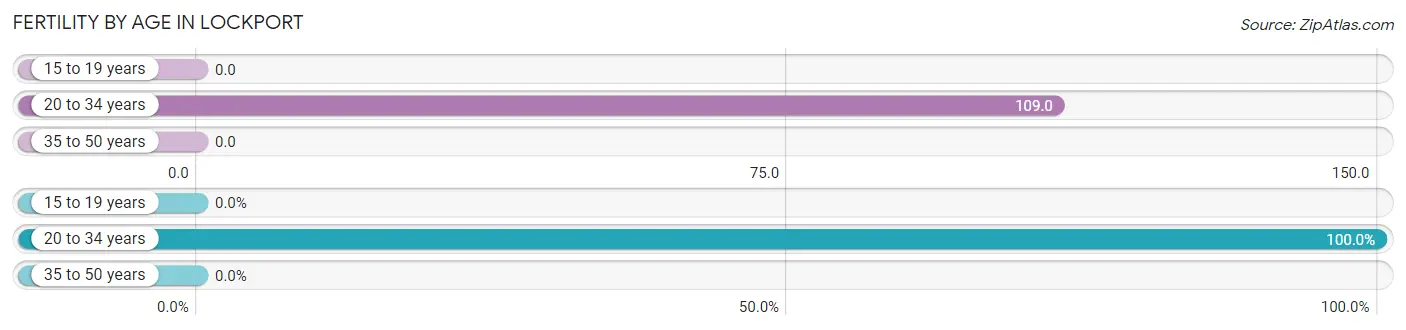
| Age Bracket | Women with Births | Births / 1,000 Women |
| 15 to 19 years | 0 (0.0%) | 0.0 |
| 20 to 34 years | 19 (100.0%) | 109.0 |
| 35 to 50 years | 0 (0.0%) | 0.0 |
| Total | 19 (100.0%) | 38.0 |
Fertility by Age by Marriage Status in Lockport
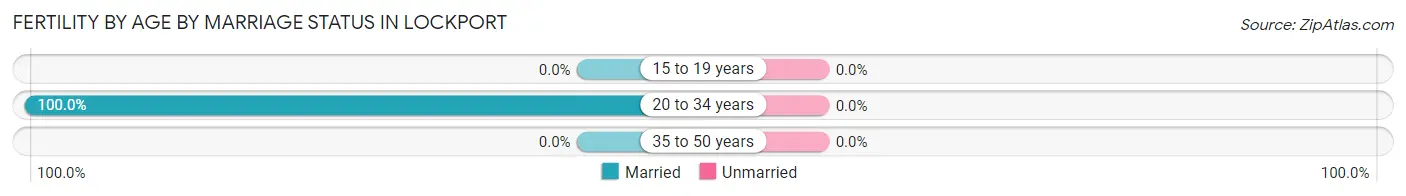
| Age Bracket | Married | Unmarried |
| 15 to 19 years | 0 (0.0%) | 0 (0.0%) |
| 20 to 34 years | 19 (100.0%) | 0 (0.0%) |
| 35 to 50 years | 0 (0.0%) | 0 (0.0%) |
| Total | 19 (100.0%) | 0 (0.0%) |
Fertility by Education in Lockport
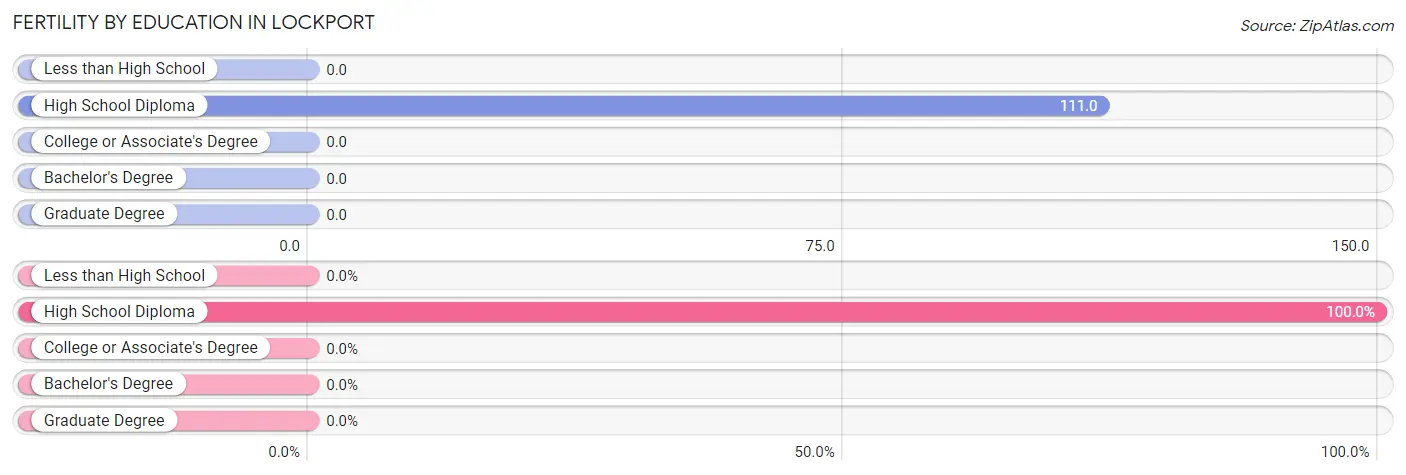
| Educational Attainment | Women with Births | Births / 1,000 Women |
| Less than High School | 0 (0.0%) | 0.0 |
| High School Diploma | 19 (100.0%) | 111.0 |
| College or Associate's Degree | 0 (0.0%) | 0.0 |
| Bachelor's Degree | 0 (0.0%) | 0.0 |
| Graduate Degree | 0 (0.0%) | 0.0 |
| Total | 19 (100.0%) | 38.0 |
Fertility by Education by Marriage Status in Lockport
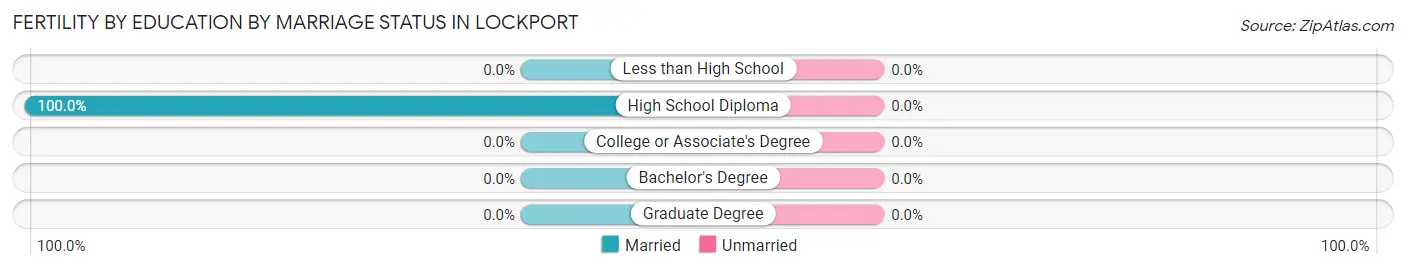
| Educational Attainment | Married | Unmarried |
| Less than High School | 0 (0.0%) | 0 (0.0%) |
| High School Diploma | 19 (100.0%) | 0 (0.0%) |
| College or Associate's Degree | 0 (0.0%) | 0 (0.0%) |
| Bachelor's Degree | 0 (0.0%) | 0 (0.0%) |
| Graduate Degree | 0 (0.0%) | 0 (0.0%) |
| Total | 19 (100.0%) | 0 (0.0%) |
Employment Characteristics in Lockport
Employment by Class of Employer in Lockport
Among the 968 employed individuals in Lockport, private company employees (775 | 80.1%), local government employees (76 | 7.9%), and state government employees (53 | 5.5%) make up the most common classes of employment.
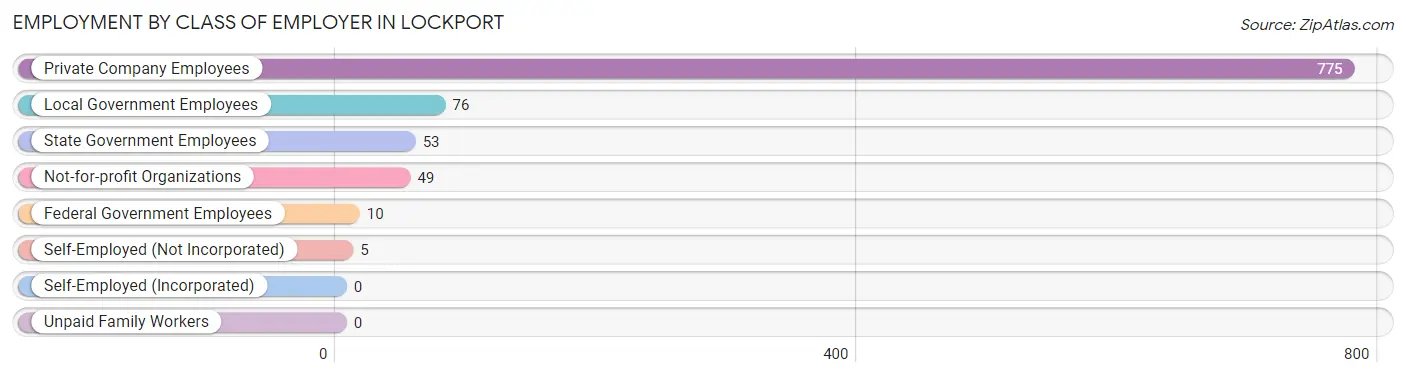
| Employer Class | # Employees | % Employees |
| Private Company Employees | 775 | 80.1% |
| Self-Employed (Incorporated) | 0 | 0.0% |
| Self-Employed (Not Incorporated) | 5 | 0.5% |
| Not-for-profit Organizations | 49 | 5.1% |
| Local Government Employees | 76 | 7.9% |
| State Government Employees | 53 | 5.5% |
| Federal Government Employees | 10 | 1.0% |
| Unpaid Family Workers | 0 | 0.0% |
| Total | 968 | 100.0% |
Employment Status by Age in Lockport
According to the labor force statistics for Lockport, out of the total population over 16 years of age (2,094), 50.2% or 1,051 individuals are in the labor force, with 7.5% or 79 of them unemployed. The age group with the highest labor force participation rate is 20 to 24 years, with 98.8% or 84 individuals in the labor force. Within the labor force, the 20 to 24 years age range has the highest percentage of unemployed individuals, with 21.4% or 18 of them being unemployed.
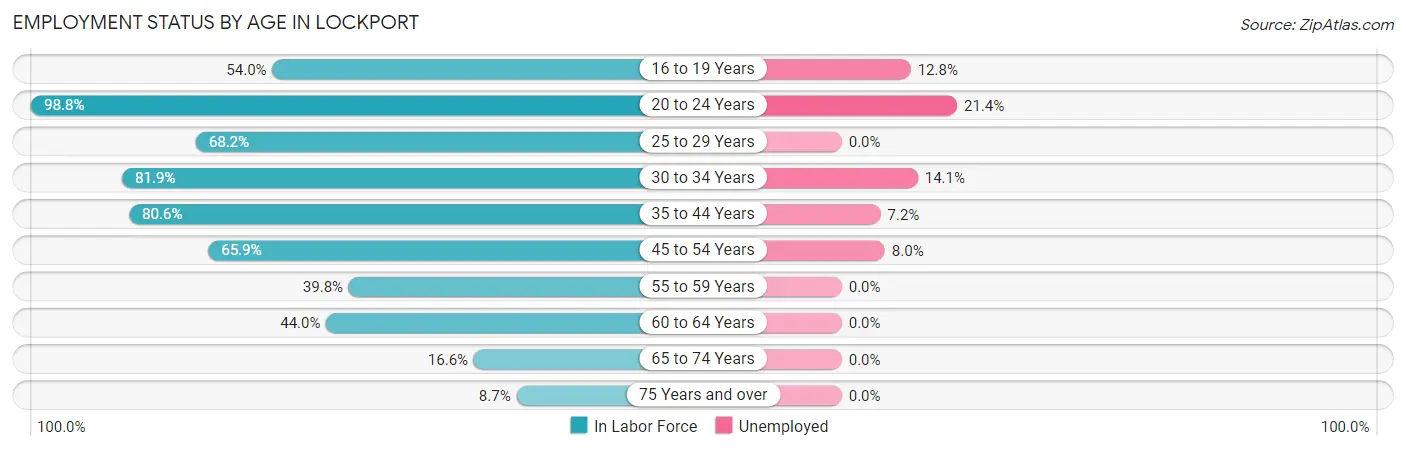
| Age Bracket | In Labor Force | Unemployed |
| 16 to 19 Years | 47 (54.0%) | 6 (12.8%) |
| 20 to 24 Years | 84 (98.8%) | 18 (21.4%) |
| 25 to 29 Years | 90 (68.2%) | 0 (0.0%) |
| 30 to 34 Years | 149 (81.9%) | 21 (14.1%) |
| 35 to 44 Years | 279 (80.6%) | 20 (7.2%) |
| 45 to 54 Years | 176 (65.9%) | 14 (8.0%) |
| 55 to 59 Years | 84 (39.8%) | 0 (0.0%) |
| 60 to 64 Years | 55 (44.0%) | 0 (0.0%) |
| 65 to 74 Years | 62 (16.6%) | 0 (0.0%) |
| 75 Years and over | 25 (8.7%) | 0 (0.0%) |
| Total | 1,051 (50.2%) | 79 (7.5%) |
Employment Status by Educational Attainment in Lockport
According to labor force statistics for Lockport, 66.0% of individuals (834) out of the total population between 25 and 64 years of age (1,263) are in the labor force, with 6.6% or 55 of them being unemployed. The group with the highest labor force participation rate are those with the educational attainment of bachelor's degree or higher, with 95.1% or 97 individuals in the labor force. Within the labor force, individuals with less than high school education have the highest percentage of unemployment, with 15.3% or 25 of them being unemployed.
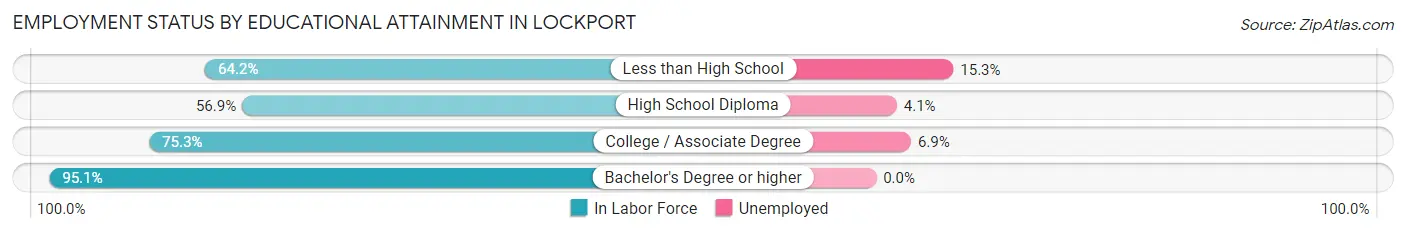
| Educational Attainment | In Labor Force | Unemployed |
| Less than High School | 163 (64.2%) | 39 (15.3%) |
| High School Diploma | 341 (56.9%) | 25 (4.1%) |
| College / Associate Degree | 232 (75.3%) | 21 (6.9%) |
| Bachelor's Degree or higher | 97 (95.1%) | 0 (0.0%) |
| Total | 834 (66.0%) | 83 (6.6%) |
Employment Occupations by Sex in Lockport
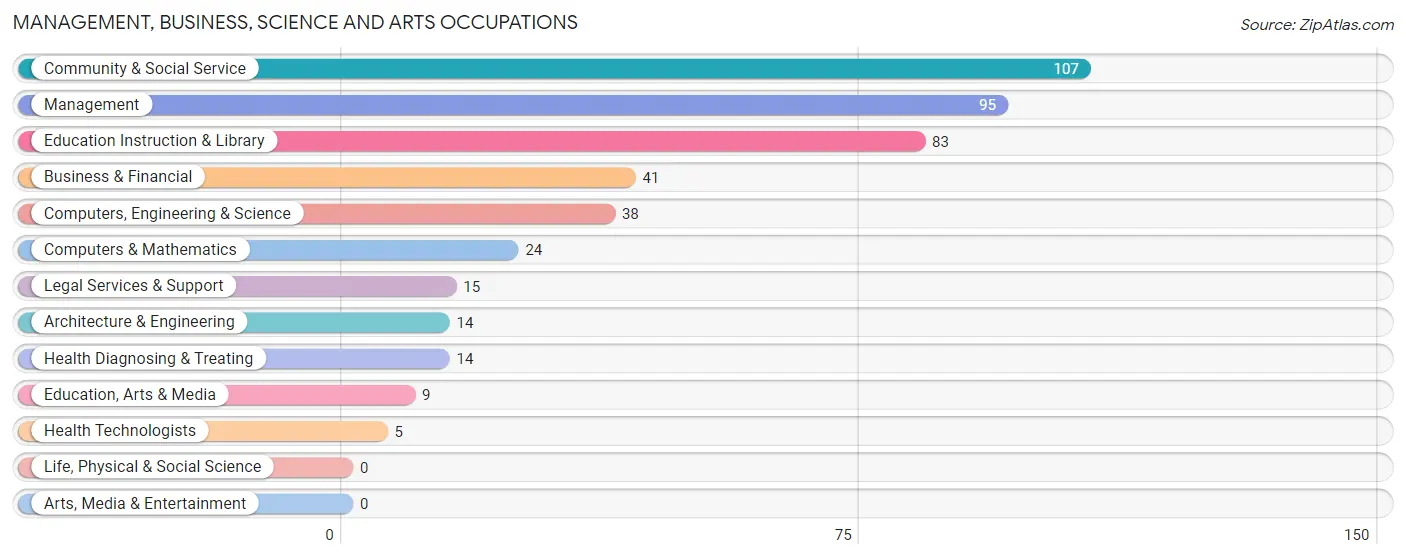
Management, Business, Science and Arts Occupations
The most common Management, Business, Science and Arts occupations in Lockport are Community & Social Service (107 | 11.0%), Management (95 | 9.8%), Education Instruction & Library (83 | 8.5%), Business & Financial (41 | 4.2%), and Computers, Engineering & Science (38 | 3.9%).
Management, Business, Science and Arts Occupations by Sex
Within the Management, Business, Science and Arts occupations in Lockport, the most male-oriented occupations are Computers, Engineering & Science (100.0%), Computers & Mathematics (100.0%), and Architecture & Engineering (100.0%), while the most female-oriented occupations are Education, Arts & Media (100.0%), Legal Services & Support (100.0%), and Health Diagnosing & Treating (100.0%).
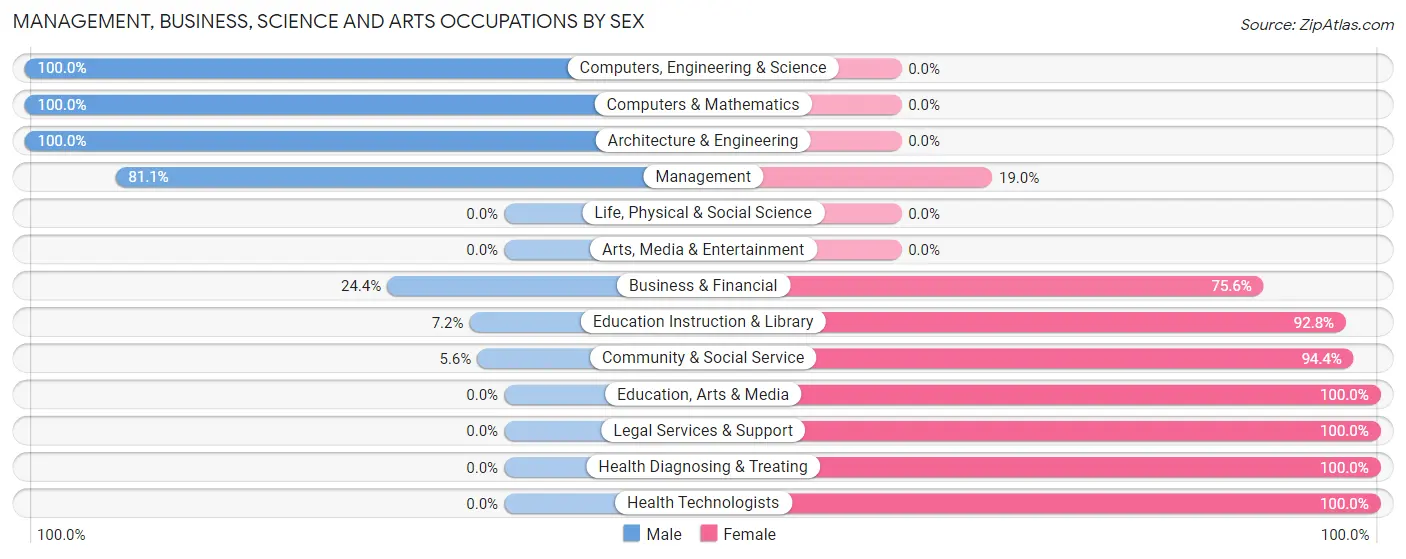
| Occupation | Male | Female |
| Management | 77 (81.0%) | 18 (19.0%) |
| Business & Financial | 10 (24.4%) | 31 (75.6%) |
| Computers, Engineering & Science | 38 (100.0%) | 0 (0.0%) |
| Computers & Mathematics | 24 (100.0%) | 0 (0.0%) |
| Architecture & Engineering | 14 (100.0%) | 0 (0.0%) |
| Life, Physical & Social Science | 0 (0.0%) | 0 (0.0%) |
| Community & Social Service | 6 (5.6%) | 101 (94.4%) |
| Education, Arts & Media | 0 (0.0%) | 9 (100.0%) |
| Legal Services & Support | 0 (0.0%) | 15 (100.0%) |
| Education Instruction & Library | 6 (7.2%) | 77 (92.8%) |
| Arts, Media & Entertainment | 0 (0.0%) | 0 (0.0%) |
| Health Diagnosing & Treating | 0 (0.0%) | 14 (100.0%) |
| Health Technologists | 0 (0.0%) | 5 (100.0%) |
| Total (Category) | 131 (44.4%) | 164 (55.6%) |
| Total (Overall) | 546 (56.2%) | 426 (43.8%) |
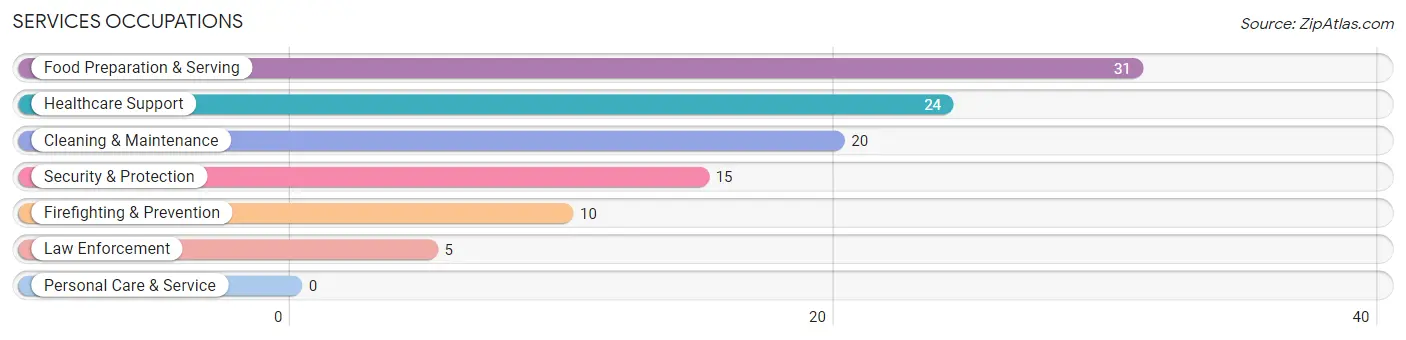
Services Occupations
The most common Services occupations in Lockport are Food Preparation & Serving (31 | 3.2%), Healthcare Support (24 | 2.5%), Cleaning & Maintenance (20 | 2.1%), Security & Protection (15 | 1.5%), and Firefighting & Prevention (10 | 1.0%).
Services Occupations by Sex
Within the Services occupations in Lockport, the most male-oriented occupations are Law Enforcement (100.0%), Security & Protection (33.3%), and Cleaning & Maintenance (30.0%), while the most female-oriented occupations are Healthcare Support (100.0%), Firefighting & Prevention (100.0%), and Food Preparation & Serving (100.0%).
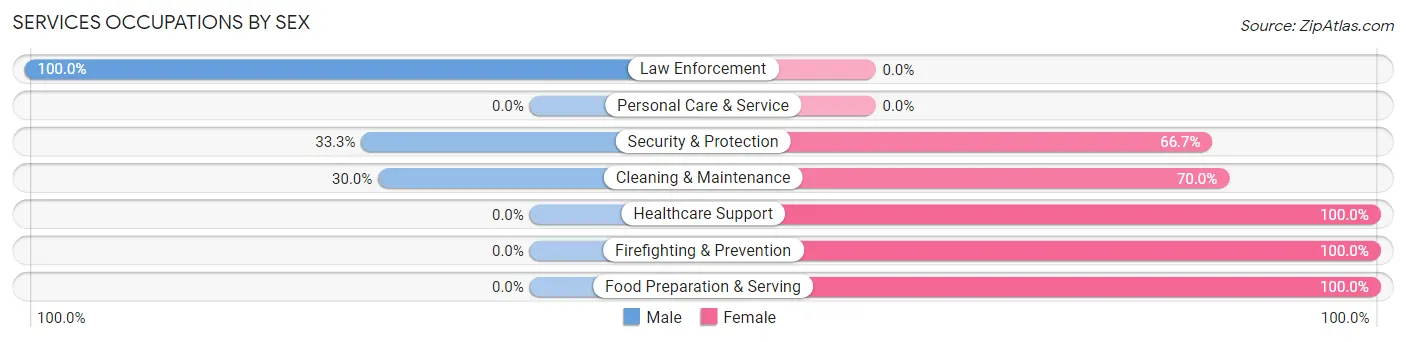
| Occupation | Male | Female |
| Healthcare Support | 0 (0.0%) | 24 (100.0%) |
| Security & Protection | 5 (33.3%) | 10 (66.7%) |
| Firefighting & Prevention | 0 (0.0%) | 10 (100.0%) |
| Law Enforcement | 5 (100.0%) | 0 (0.0%) |
| Food Preparation & Serving | 0 (0.0%) | 31 (100.0%) |
| Cleaning & Maintenance | 6 (30.0%) | 14 (70.0%) |
| Personal Care & Service | 0 (0.0%) | 0 (0.0%) |
| Total (Category) | 11 (12.2%) | 79 (87.8%) |
| Total (Overall) | 546 (56.2%) | 426 (43.8%) |
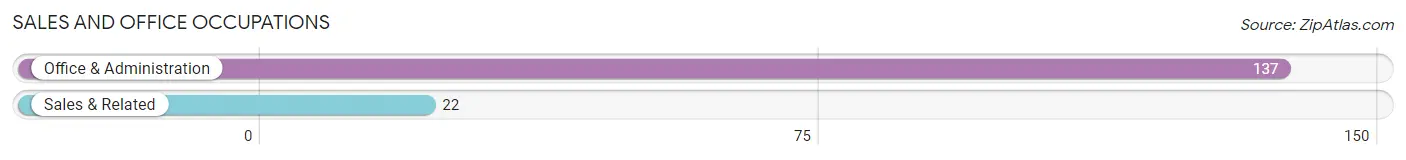
Sales and Office Occupations
The most common Sales and Office occupations in Lockport are Office & Administration (137 | 14.1%), and Sales & Related (22 | 2.3%).
Sales and Office Occupations by Sex
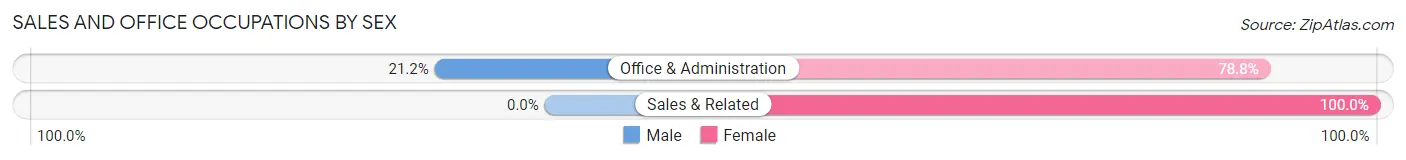
| Occupation | Male | Female |
| Sales & Related | 0 (0.0%) | 22 (100.0%) |
| Office & Administration | 29 (21.2%) | 108 (78.8%) |
| Total (Category) | 29 (18.2%) | 130 (81.8%) |
| Total (Overall) | 546 (56.2%) | 426 (43.8%) |
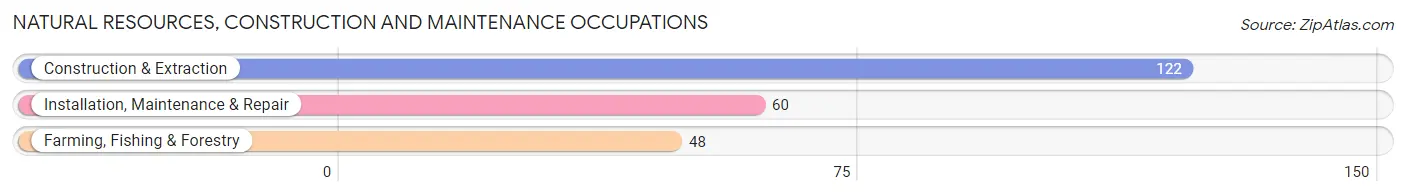
Natural Resources, Construction and Maintenance Occupations
The most common Natural Resources, Construction and Maintenance occupations in Lockport are Construction & Extraction (122 | 12.6%), Installation, Maintenance & Repair (60 | 6.2%), and Farming, Fishing & Forestry (48 | 4.9%).
Natural Resources, Construction and Maintenance Occupations by Sex
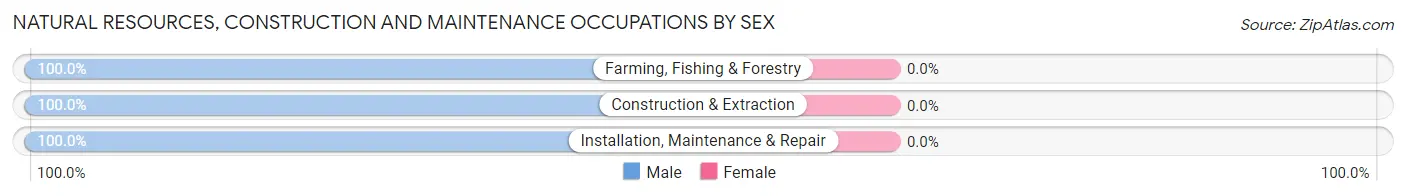
| Occupation | Male | Female |
| Farming, Fishing & Forestry | 48 (100.0%) | 0 (0.0%) |
| Construction & Extraction | 122 (100.0%) | 0 (0.0%) |
| Installation, Maintenance & Repair | 60 (100.0%) | 0 (0.0%) |
| Total (Category) | 230 (100.0%) | 0 (0.0%) |
| Total (Overall) | 546 (56.2%) | 426 (43.8%) |
Production, Transportation and Moving Occupations
The most common Production, Transportation and Moving occupations in Lockport are Material Moving (86 | 8.8%), Transportation (72 | 7.4%), and Production (40 | 4.1%).
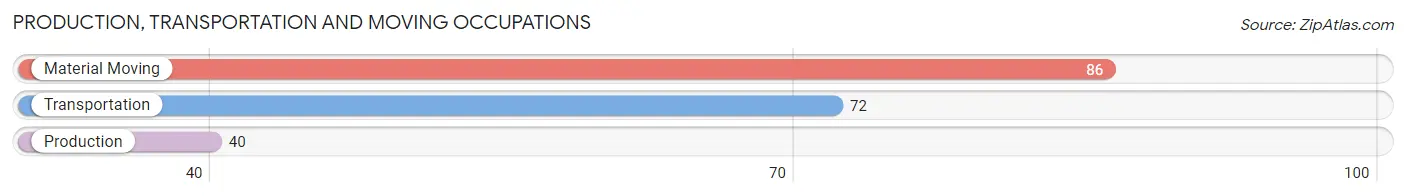
Production, Transportation and Moving Occupations by Sex
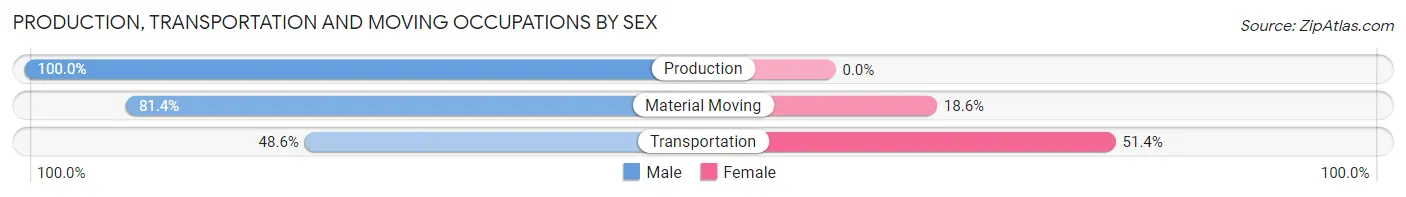
| Occupation | Male | Female |
| Production | 40 (100.0%) | 0 (0.0%) |
| Transportation | 35 (48.6%) | 37 (51.4%) |
| Material Moving | 70 (81.4%) | 16 (18.6%) |
| Total (Category) | 145 (73.2%) | 53 (26.8%) |
| Total (Overall) | 546 (56.2%) | 426 (43.8%) |
Employment Industries by Sex in Lockport
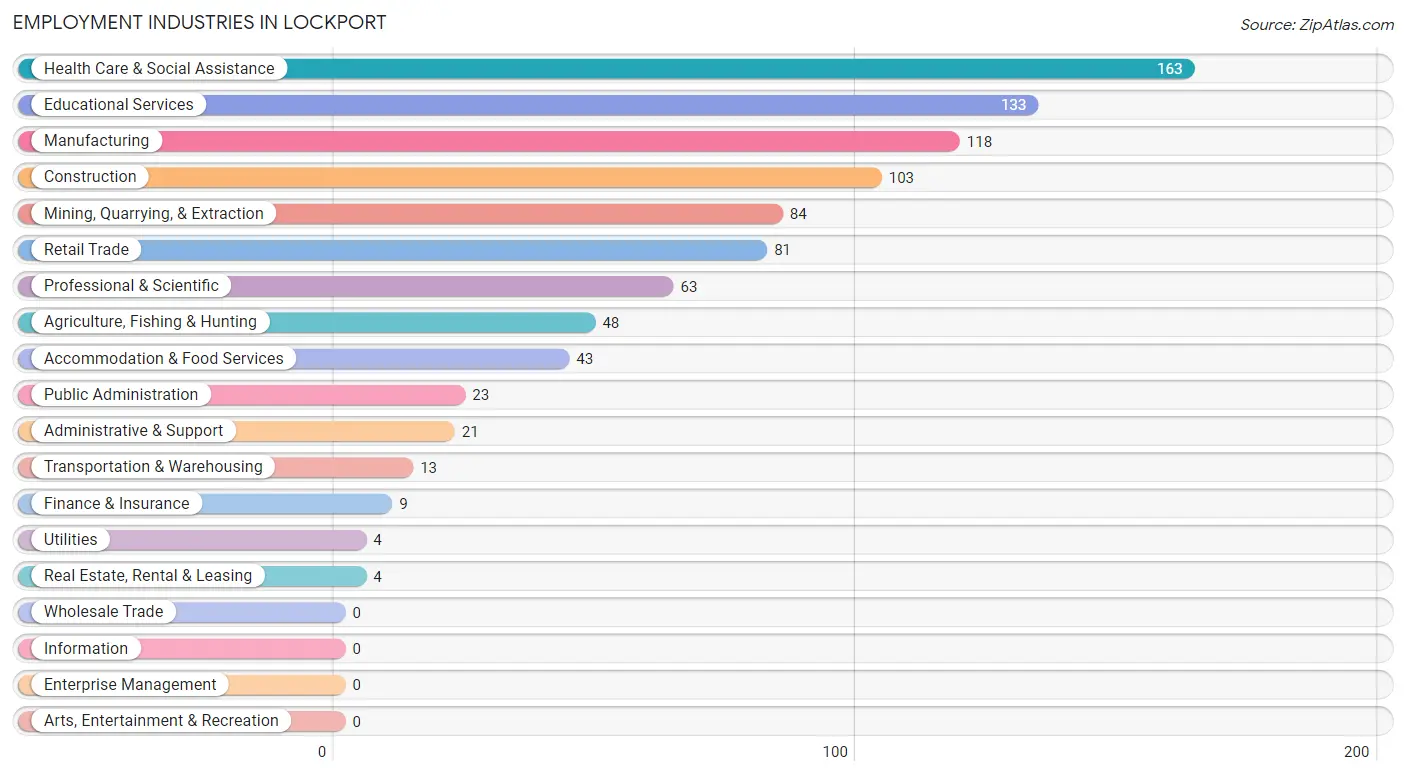
Employment Industries in Lockport
The major employment industries in Lockport include Health Care & Social Assistance (163 | 16.8%), Educational Services (133 | 13.7%), Manufacturing (118 | 12.1%), Construction (103 | 10.6%), and Mining, Quarrying, & Extraction (84 | 8.6%).
Employment Industries by Sex in Lockport
The Lockport industries that see more men than women are Agriculture, Fishing & Hunting (100.0%), Construction (100.0%), and Transportation & Warehousing (100.0%), whereas the industries that tend to have a higher number of women are Accommodation & Food Services (100.0%), Educational Services (91.0%), and Health Care & Social Assistance (81.6%).
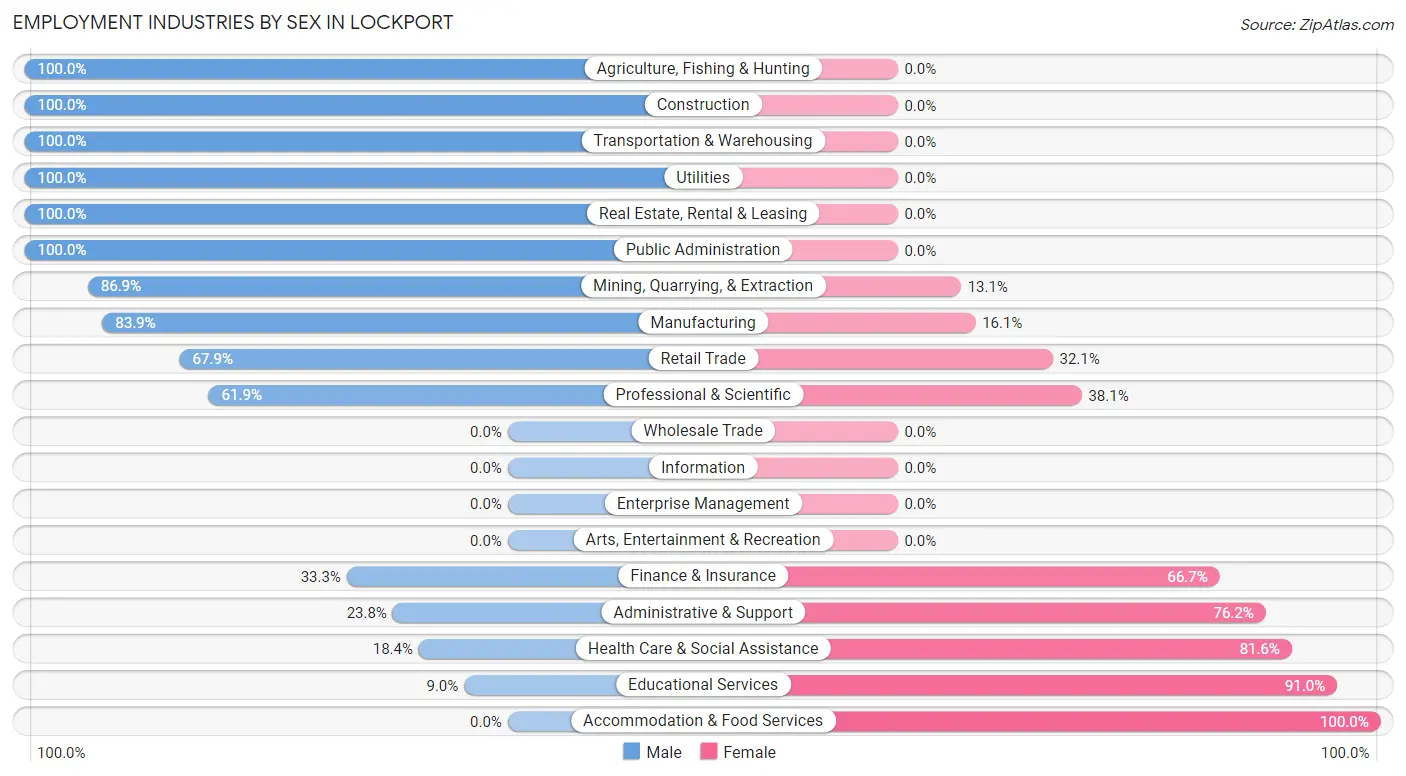
| Industry | Male | Female |
| Agriculture, Fishing & Hunting | 48 (100.0%) | 0 (0.0%) |
| Mining, Quarrying, & Extraction | 73 (86.9%) | 11 (13.1%) |
| Construction | 103 (100.0%) | 0 (0.0%) |
| Manufacturing | 99 (83.9%) | 19 (16.1%) |
| Wholesale Trade | 0 (0.0%) | 0 (0.0%) |
| Retail Trade | 55 (67.9%) | 26 (32.1%) |
| Transportation & Warehousing | 13 (100.0%) | 0 (0.0%) |
| Utilities | 4 (100.0%) | 0 (0.0%) |
| Information | 0 (0.0%) | 0 (0.0%) |
| Finance & Insurance | 3 (33.3%) | 6 (66.7%) |
| Real Estate, Rental & Leasing | 4 (100.0%) | 0 (0.0%) |
| Professional & Scientific | 39 (61.9%) | 24 (38.1%) |
| Enterprise Management | 0 (0.0%) | 0 (0.0%) |
| Administrative & Support | 5 (23.8%) | 16 (76.2%) |
| Educational Services | 12 (9.0%) | 121 (91.0%) |
| Health Care & Social Assistance | 30 (18.4%) | 133 (81.6%) |
| Arts, Entertainment & Recreation | 0 (0.0%) | 0 (0.0%) |
| Accommodation & Food Services | 0 (0.0%) | 43 (100.0%) |
| Public Administration | 23 (100.0%) | 0 (0.0%) |
| Total | 546 (56.2%) | 426 (43.8%) |
Education in Lockport
School Enrollment in Lockport
The most common levels of schooling among the 524 students in Lockport are middle school (198 | 37.8%), elementary school (112 | 21.4%), and high school (97 | 18.5%).
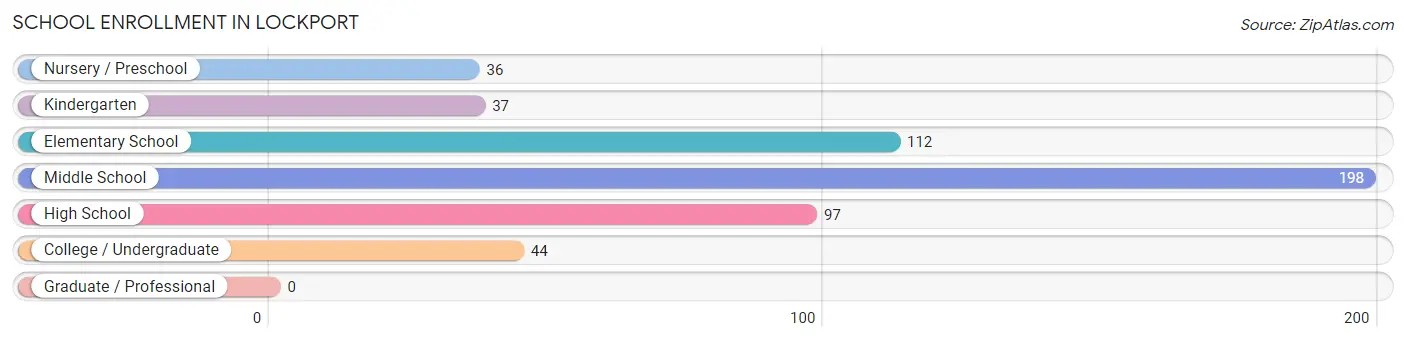
| School Level | # Students | % Students |
| Nursery / Preschool | 36 | 6.9% |
| Kindergarten | 37 | 7.1% |
| Elementary School | 112 | 21.4% |
| Middle School | 198 | 37.8% |
| High School | 97 | 18.5% |
| College / Undergraduate | 44 | 8.4% |
| Graduate / Professional | 0 | 0.0% |
| Total | 524 | 100.0% |
School Enrollment by Age by Funding Source in Lockport
Out of a total of 524 students who are enrolled in schools in Lockport, 73 (13.9%) attend a private institution, while the remaining 451 (86.1%) are enrolled in public schools. The age group of 35 years and over has the highest likelihood of being enrolled in private schools, with 7 (100.0% in the age bracket) enrolled. Conversely, the age group of 10 to 14 year olds has the lowest likelihood of being enrolled in a private school, with 249 (100.0% in the age bracket) attending a public institution.
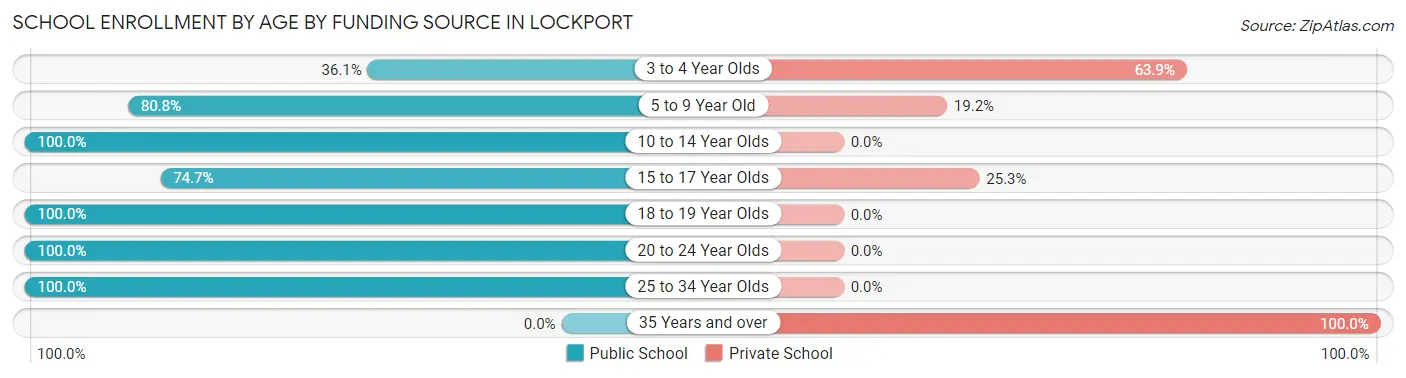
| Age Bracket | Public School | Private School |
| 3 to 4 Year Olds | 13 (36.1%) | 23 (63.9%) |
| 5 to 9 Year Old | 84 (80.8%) | 20 (19.2%) |
| 10 to 14 Year Olds | 249 (100.0%) | 0 (0.0%) |
| 15 to 17 Year Olds | 68 (74.7%) | 23 (25.3%) |
| 18 to 19 Year Olds | 21 (100.0%) | 0 (0.0%) |
| 20 to 24 Year Olds | 9 (100.0%) | 0 (0.0%) |
| 25 to 34 Year Olds | 7 (100.0%) | 0 (0.0%) |
| 35 Years and over | 0 (0.0%) | 7 (100.0%) |
| Total | 451 (86.1%) | 73 (13.9%) |
Educational Attainment by Field of Study in Lockport
Education (91 | 52.3%), visual & performing arts (20 | 11.5%), social sciences (15 | 8.6%), engineering (14 | 8.1%), and bio, nature & agricultural (9 | 5.2%) are the most common fields of study among 174 individuals in Lockport who have obtained a bachelor's degree or higher.
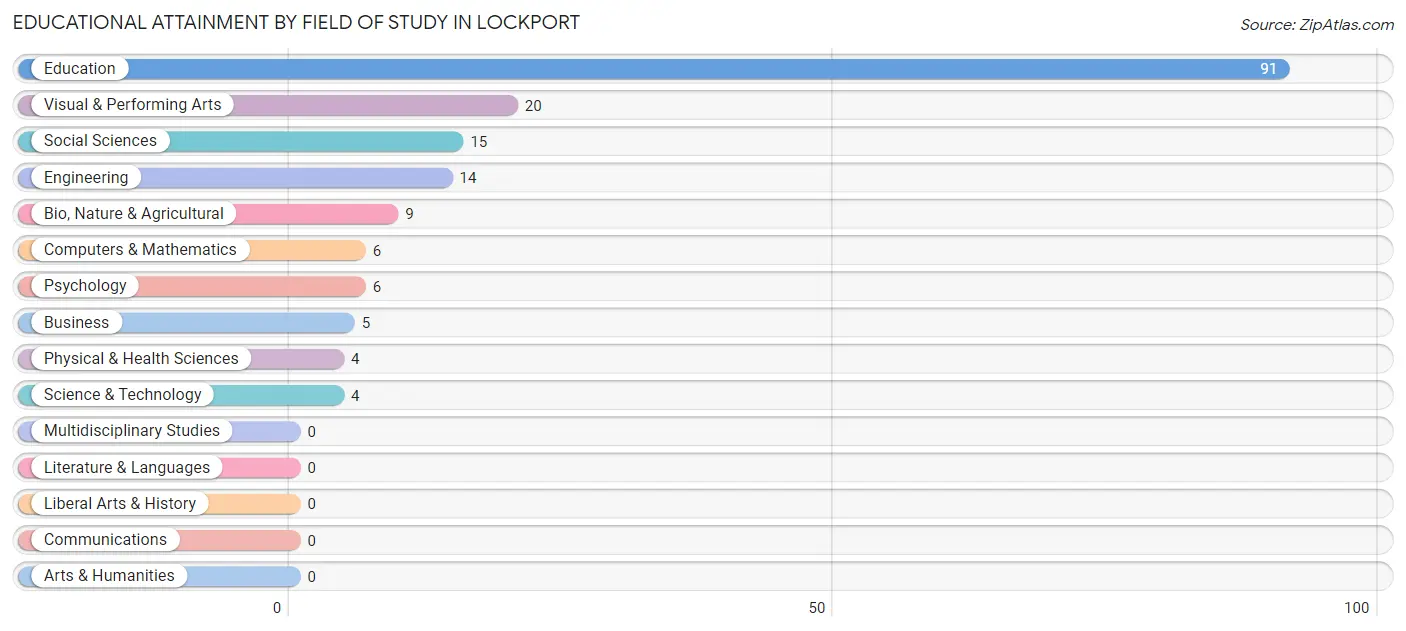
| Field of Study | # Graduates | % Graduates |
| Computers & Mathematics | 6 | 3.5% |
| Bio, Nature & Agricultural | 9 | 5.2% |
| Physical & Health Sciences | 4 | 2.3% |
| Psychology | 6 | 3.5% |
| Social Sciences | 15 | 8.6% |
| Engineering | 14 | 8.1% |
| Multidisciplinary Studies | 0 | 0.0% |
| Science & Technology | 4 | 2.3% |
| Business | 5 | 2.9% |
| Education | 91 | 52.3% |
| Literature & Languages | 0 | 0.0% |
| Liberal Arts & History | 0 | 0.0% |
| Visual & Performing Arts | 20 | 11.5% |
| Communications | 0 | 0.0% |
| Arts & Humanities | 0 | 0.0% |
| Total | 174 | 100.0% |
Transportation & Commute in Lockport
Vehicle Availability by Sex in Lockport
The most prevalent vehicle ownership categories in Lockport are males with 2 vehicles (249, accounting for 45.6%) and females with 2 vehicles (189, making up 59.0%).
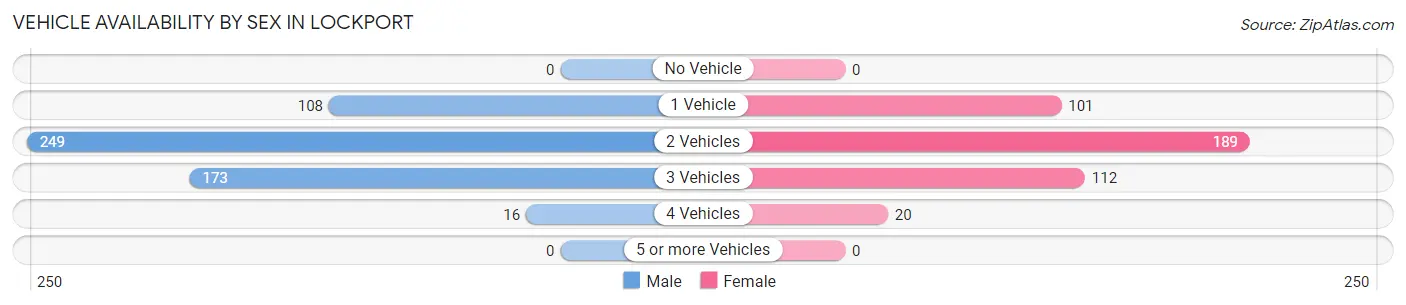
| Vehicles Available | Male | Female |
| No Vehicle | 0 (0.0%) | 0 (0.0%) |
| 1 Vehicle | 108 (19.8%) | 101 (23.9%) |
| 2 Vehicles | 249 (45.6%) | 189 (44.8%) |
| 3 Vehicles | 173 (31.7%) | 112 (26.5%) |
| 4 Vehicles | 16 (2.9%) | 20 (4.7%) |
| 5 or more Vehicles | 0 (0.0%) | 0 (0.0%) |
| Total | 546 (100.0%) | 422 (100.0%) |
Commute Time in Lockport
The most frequently occuring commute durations in Lockport are 30 to 34 minutes (175 commuters, 18.1%), 35 to 39 minutes (130 commuters, 13.4%), and 5 to 9 minutes (124 commuters, 12.8%).
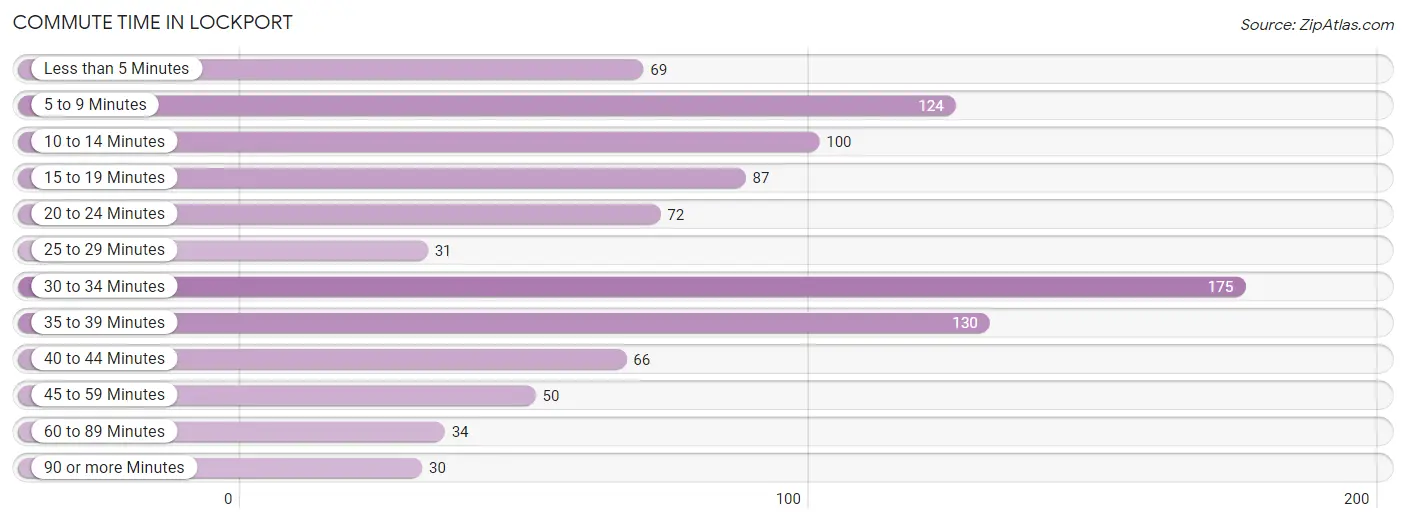
| Commute Time | # Commuters | % Commuters |
| Less than 5 Minutes | 69 | 7.1% |
| 5 to 9 Minutes | 124 | 12.8% |
| 10 to 14 Minutes | 100 | 10.3% |
| 15 to 19 Minutes | 87 | 9.0% |
| 20 to 24 Minutes | 72 | 7.4% |
| 25 to 29 Minutes | 31 | 3.2% |
| 30 to 34 Minutes | 175 | 18.1% |
| 35 to 39 Minutes | 130 | 13.4% |
| 40 to 44 Minutes | 66 | 6.8% |
| 45 to 59 Minutes | 50 | 5.2% |
| 60 to 89 Minutes | 34 | 3.5% |
| 90 or more Minutes | 30 | 3.1% |
Commute Time by Sex in Lockport
The most common commute times in Lockport are 35 to 39 minutes (105 commuters, 19.2%) for males and 30 to 34 minutes (111 commuters, 26.3%) for females.
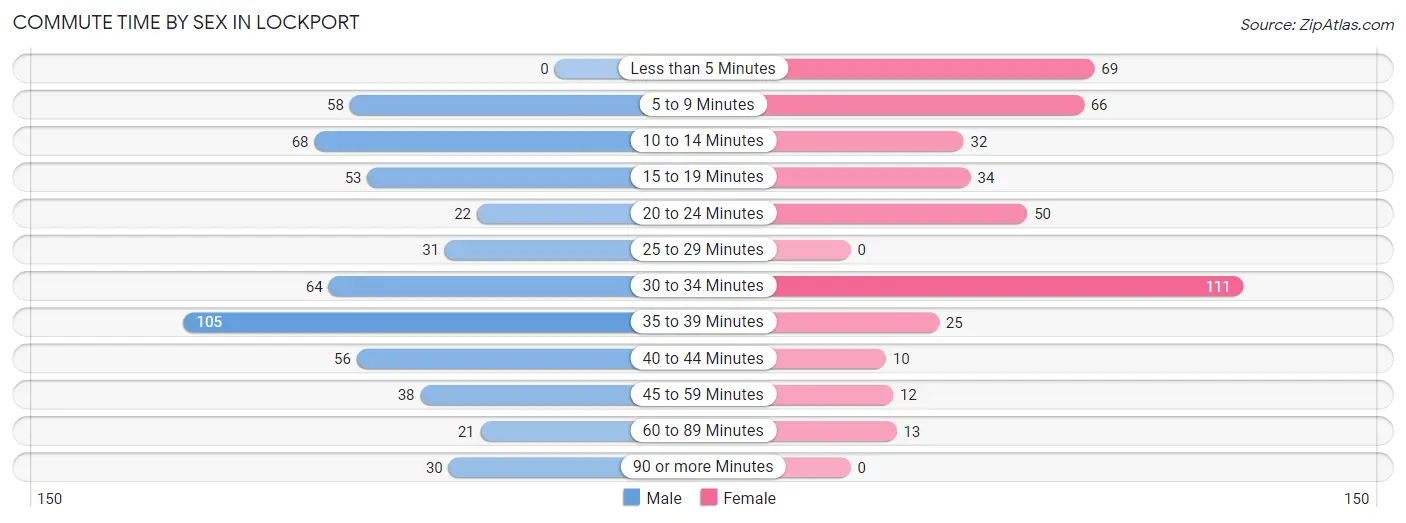
| Commute Time | Male | Female |
| Less than 5 Minutes | 0 (0.0%) | 69 (16.4%) |
| 5 to 9 Minutes | 58 (10.6%) | 66 (15.6%) |
| 10 to 14 Minutes | 68 (12.4%) | 32 (7.6%) |
| 15 to 19 Minutes | 53 (9.7%) | 34 (8.1%) |
| 20 to 24 Minutes | 22 (4.0%) | 50 (11.8%) |
| 25 to 29 Minutes | 31 (5.7%) | 0 (0.0%) |
| 30 to 34 Minutes | 64 (11.7%) | 111 (26.3%) |
| 35 to 39 Minutes | 105 (19.2%) | 25 (5.9%) |
| 40 to 44 Minutes | 56 (10.3%) | 10 (2.4%) |
| 45 to 59 Minutes | 38 (7.0%) | 12 (2.8%) |
| 60 to 89 Minutes | 21 (3.8%) | 13 (3.1%) |
| 90 or more Minutes | 30 (5.5%) | 0 (0.0%) |
Time of Departure to Work by Sex in Lockport
The most frequent times of departure to work in Lockport are 6:00 AM to 6:29 AM (137, 25.1%) for males and 7:00 AM to 7:29 AM (82, 19.4%) for females.
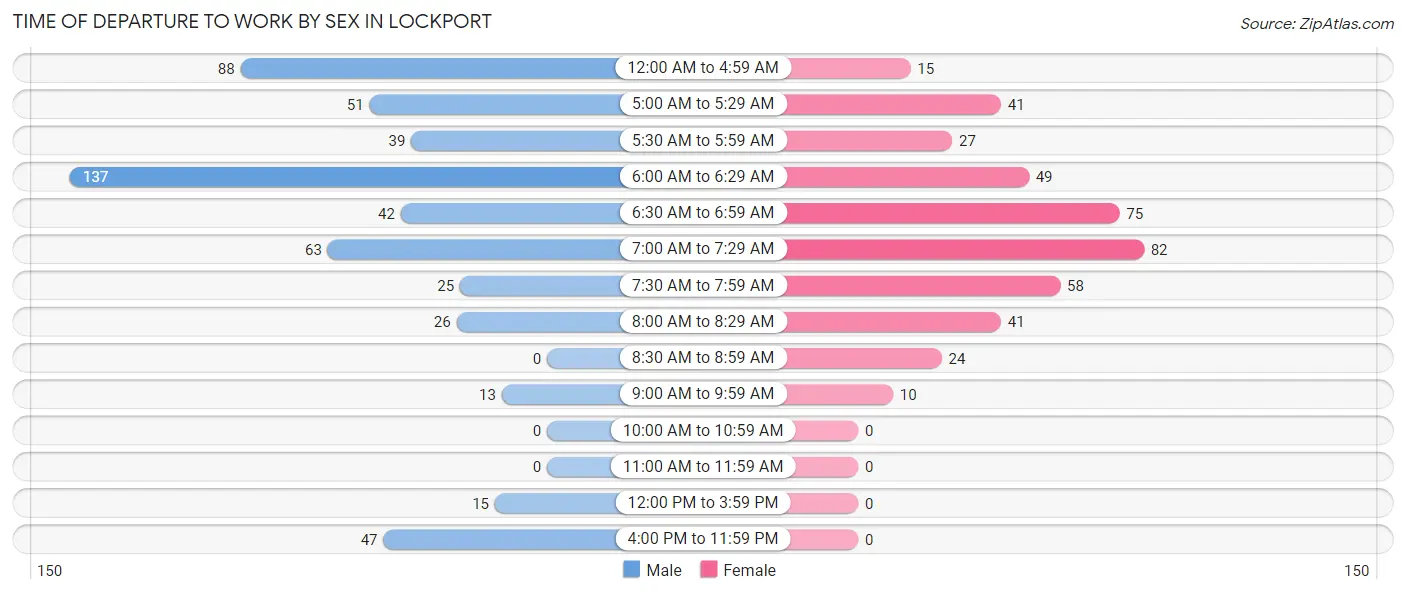
| Time of Departure | Male | Female |
| 12:00 AM to 4:59 AM | 88 (16.1%) | 15 (3.5%) |
| 5:00 AM to 5:29 AM | 51 (9.3%) | 41 (9.7%) |
| 5:30 AM to 5:59 AM | 39 (7.1%) | 27 (6.4%) |
| 6:00 AM to 6:29 AM | 137 (25.1%) | 49 (11.6%) |
| 6:30 AM to 6:59 AM | 42 (7.7%) | 75 (17.8%) |
| 7:00 AM to 7:29 AM | 63 (11.5%) | 82 (19.4%) |
| 7:30 AM to 7:59 AM | 25 (4.6%) | 58 (13.7%) |
| 8:00 AM to 8:29 AM | 26 (4.8%) | 41 (9.7%) |
| 8:30 AM to 8:59 AM | 0 (0.0%) | 24 (5.7%) |
| 9:00 AM to 9:59 AM | 13 (2.4%) | 10 (2.4%) |
| 10:00 AM to 10:59 AM | 0 (0.0%) | 0 (0.0%) |
| 11:00 AM to 11:59 AM | 0 (0.0%) | 0 (0.0%) |
| 12:00 PM to 3:59 PM | 15 (2.8%) | 0 (0.0%) |
| 4:00 PM to 11:59 PM | 47 (8.6%) | 0 (0.0%) |
| Total | 546 (100.0%) | 422 (100.0%) |
Housing Occupancy in Lockport
Occupancy by Ownership in Lockport
Of the total 977 dwellings in Lockport, owner-occupied units account for 682 (69.8%), while renter-occupied units make up 295 (30.2%).
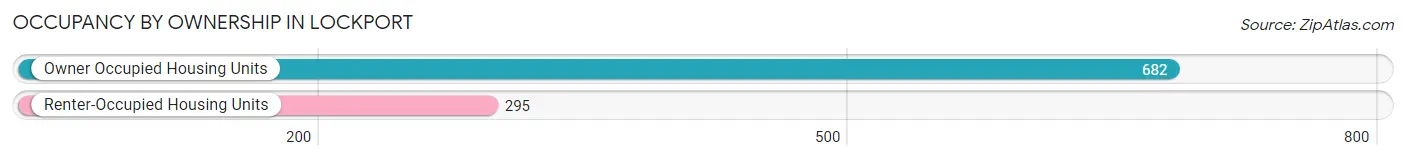
| Occupancy | # Housing Units | % Housing Units |
| Owner Occupied Housing Units | 682 | 69.8% |
| Renter-Occupied Housing Units | 295 | 30.2% |
| Total Occupied Housing Units | 977 | 100.0% |
Occupancy by Household Size in Lockport
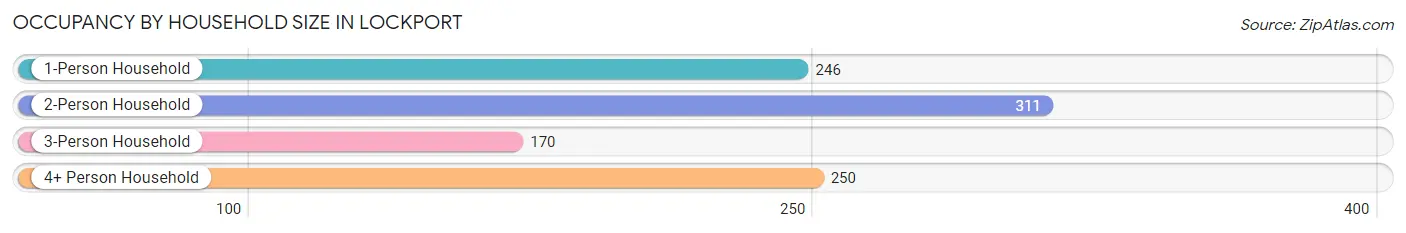
| Household Size | # Housing Units | % Housing Units |
| 1-Person Household | 246 | 25.2% |
| 2-Person Household | 311 | 31.8% |
| 3-Person Household | 170 | 17.4% |
| 4+ Person Household | 250 | 25.6% |
| Total Housing Units | 977 | 100.0% |
Occupancy by Ownership by Household Size in Lockport
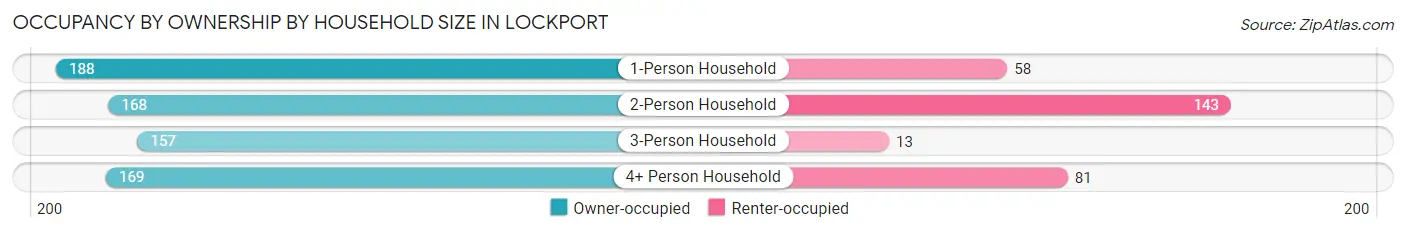
| Household Size | Owner-occupied | Renter-occupied |
| 1-Person Household | 188 (76.4%) | 58 (23.6%) |
| 2-Person Household | 168 (54.0%) | 143 (46.0%) |
| 3-Person Household | 157 (92.3%) | 13 (7.6%) |
| 4+ Person Household | 169 (67.6%) | 81 (32.4%) |
| Total Housing Units | 682 (69.8%) | 295 (30.2%) |
Occupancy by Educational Attainment in Lockport
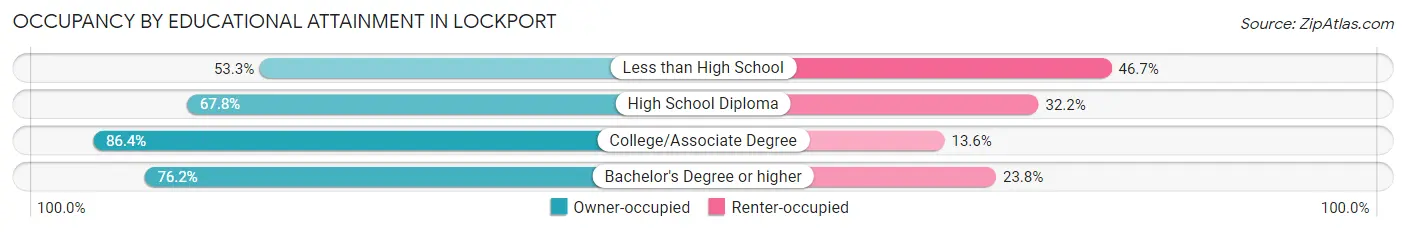
| Household Size | Owner-occupied | Renter-occupied |
| Less than High School | 128 (53.3%) | 112 (46.7%) |
| High School Diploma | 257 (67.8%) | 122 (32.2%) |
| College/Associate Degree | 204 (86.4%) | 32 (13.6%) |
| Bachelor's Degree or higher | 93 (76.2%) | 29 (23.8%) |
Occupancy by Age of Householder in Lockport
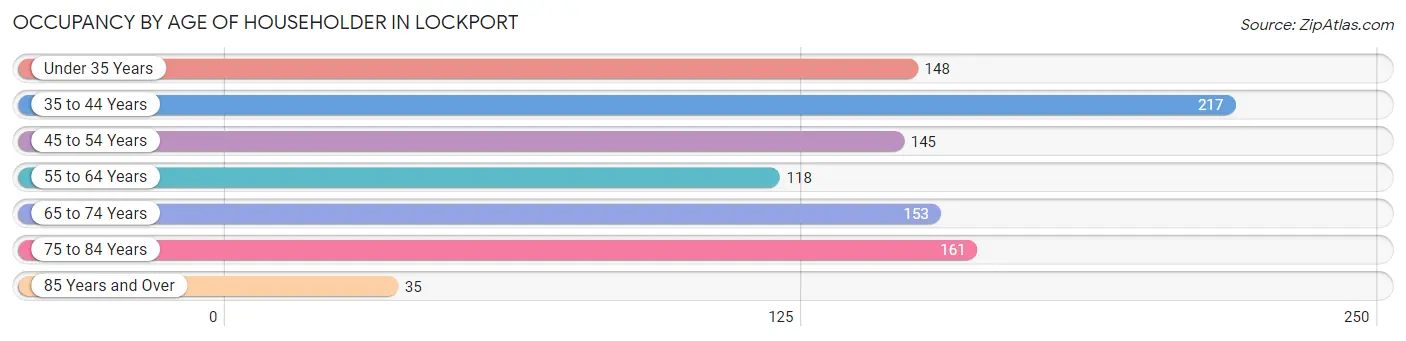
| Age Bracket | # Households | % Households |
| Under 35 Years | 148 | 15.1% |
| 35 to 44 Years | 217 | 22.2% |
| 45 to 54 Years | 145 | 14.8% |
| 55 to 64 Years | 118 | 12.1% |
| 65 to 74 Years | 153 | 15.7% |
| 75 to 84 Years | 161 | 16.5% |
| 85 Years and Over | 35 | 3.6% |
| Total | 977 | 100.0% |
Housing Finances in Lockport
Median Income by Occupancy in Lockport
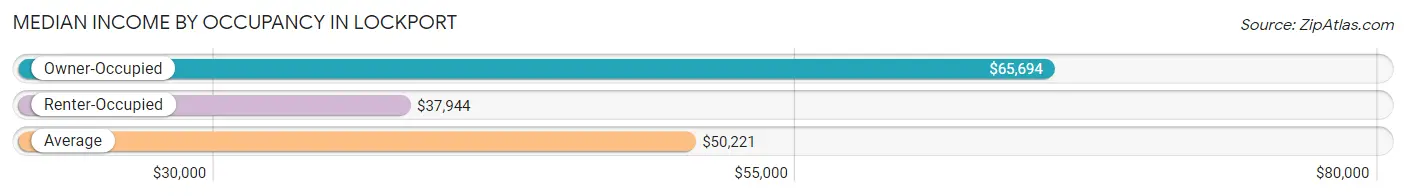
| Occupancy Type | # Households | Median Income |
| Owner-Occupied | 682 (69.8%) | $65,694 |
| Renter-Occupied | 295 (30.2%) | $37,944 |
| Average | 977 (100.0%) | $50,221 |
Occupancy by Householder Income Bracket in Lockport
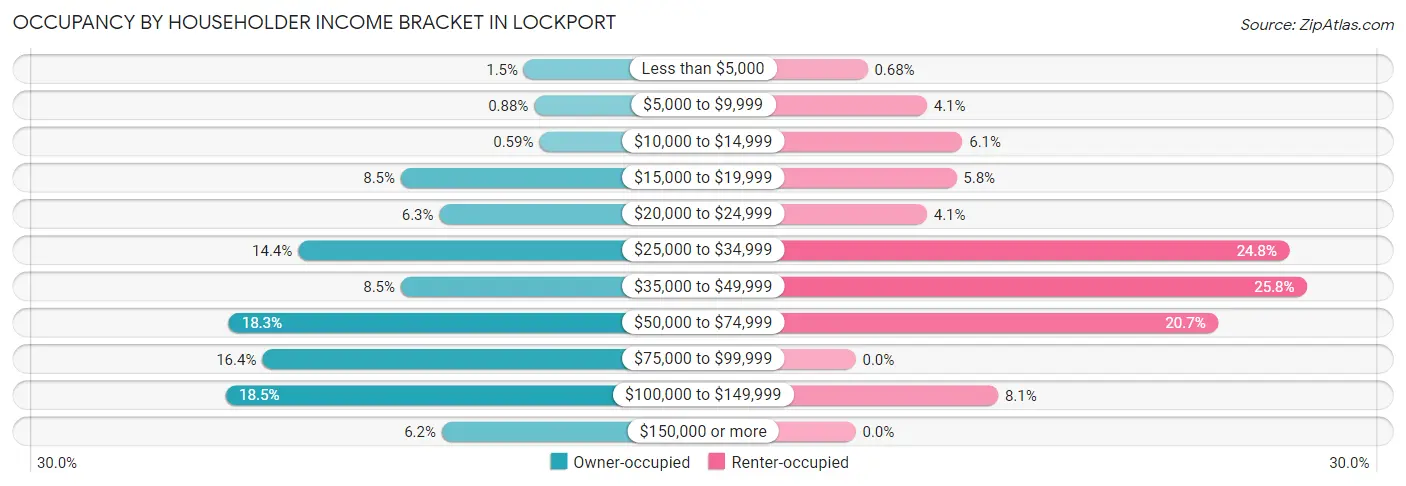
| Income Bracket | Owner-occupied | Renter-occupied |
| Less than $5,000 | 10 (1.5%) | 2 (0.7%) |
| $5,000 to $9,999 | 6 (0.9%) | 12 (4.1%) |
| $10,000 to $14,999 | 4 (0.6%) | 18 (6.1%) |
| $15,000 to $19,999 | 58 (8.5%) | 17 (5.8%) |
| $20,000 to $24,999 | 43 (6.3%) | 12 (4.1%) |
| $25,000 to $34,999 | 98 (14.4%) | 73 (24.7%) |
| $35,000 to $49,999 | 58 (8.5%) | 76 (25.8%) |
| $50,000 to $74,999 | 125 (18.3%) | 61 (20.7%) |
| $75,000 to $99,999 | 112 (16.4%) | 0 (0.0%) |
| $100,000 to $149,999 | 126 (18.5%) | 24 (8.1%) |
| $150,000 or more | 42 (6.2%) | 0 (0.0%) |
| Total | 682 (100.0%) | 295 (100.0%) |
Monthly Housing Cost Tiers in Lockport
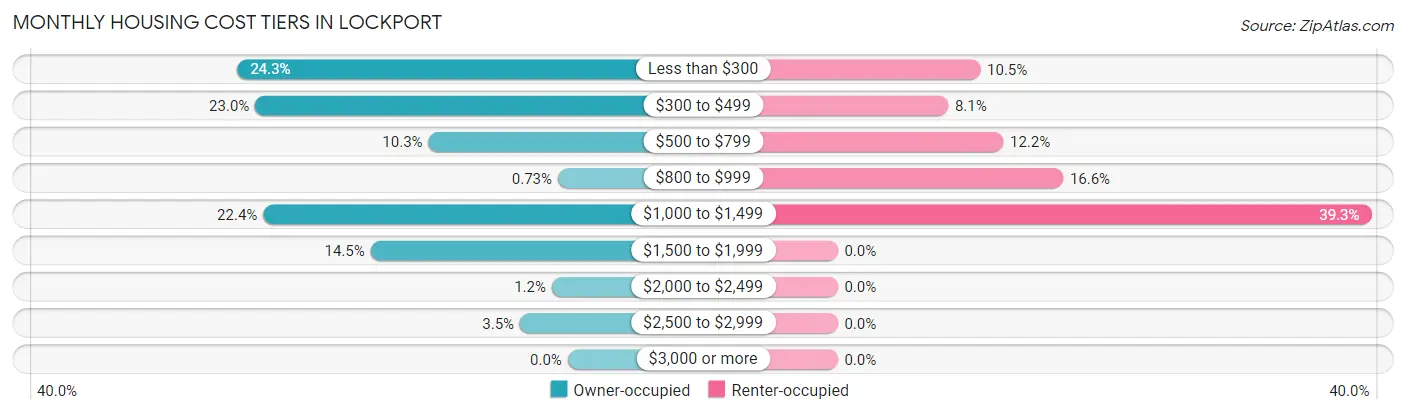
| Monthly Cost | Owner-occupied | Renter-occupied |
| Less than $300 | 166 (24.3%) | 31 (10.5%) |
| $300 to $499 | 157 (23.0%) | 24 (8.1%) |
| $500 to $799 | 70 (10.3%) | 36 (12.2%) |
| $800 to $999 | 5 (0.7%) | 49 (16.6%) |
| $1,000 to $1,499 | 153 (22.4%) | 116 (39.3%) |
| $1,500 to $1,999 | 99 (14.5%) | 0 (0.0%) |
| $2,000 to $2,499 | 8 (1.2%) | 0 (0.0%) |
| $2,500 to $2,999 | 24 (3.5%) | 0 (0.0%) |
| $3,000 or more | 0 (0.0%) | 0 (0.0%) |
| Total | 682 (100.0%) | 295 (100.0%) |
Physical Housing Characteristics in Lockport
Housing Structures in Lockport
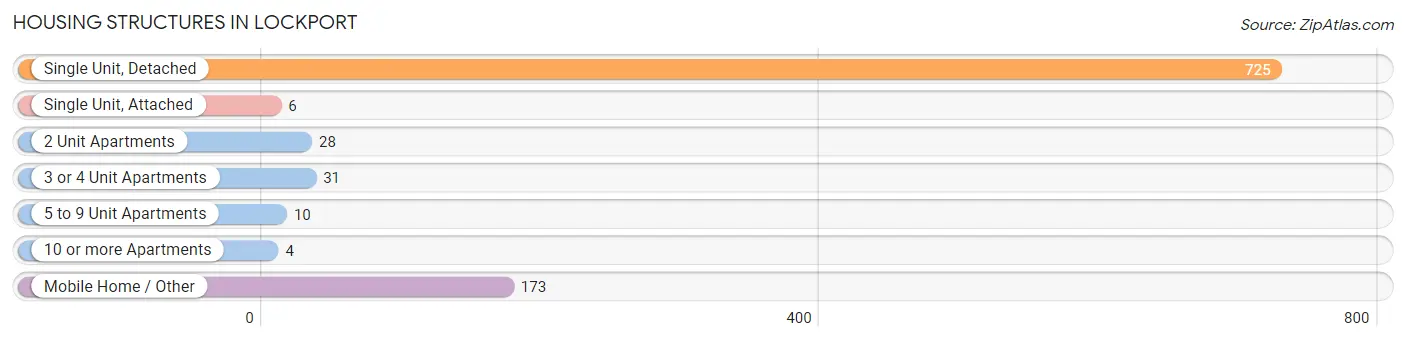
| Structure Type | # Housing Units | % Housing Units |
| Single Unit, Detached | 725 | 74.2% |
| Single Unit, Attached | 6 | 0.6% |
| 2 Unit Apartments | 28 | 2.9% |
| 3 or 4 Unit Apartments | 31 | 3.2% |
| 5 to 9 Unit Apartments | 10 | 1.0% |
| 10 or more Apartments | 4 | 0.4% |
| Mobile Home / Other | 173 | 17.7% |
| Total | 977 | 100.0% |
Housing Structures by Occupancy in Lockport
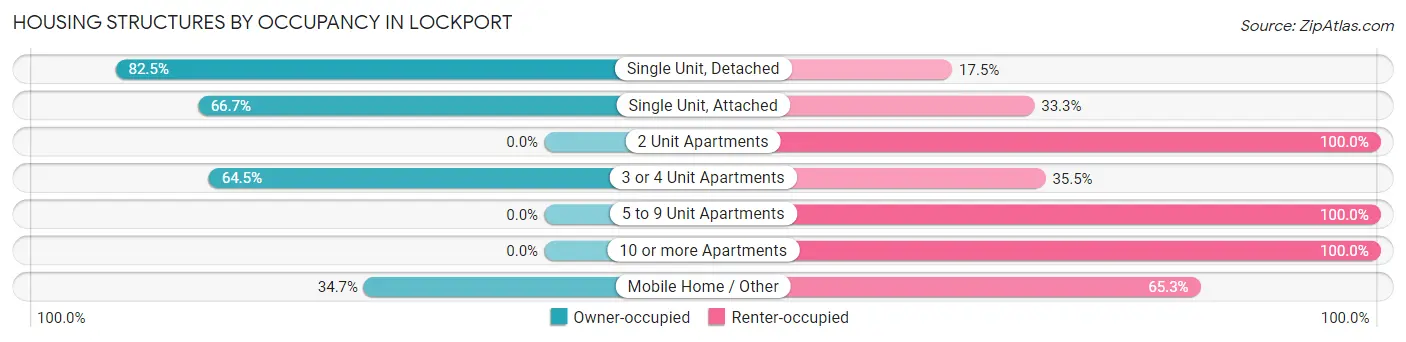
| Structure Type | Owner-occupied | Renter-occupied |
| Single Unit, Detached | 598 (82.5%) | 127 (17.5%) |
| Single Unit, Attached | 4 (66.7%) | 2 (33.3%) |
| 2 Unit Apartments | 0 (0.0%) | 28 (100.0%) |
| 3 or 4 Unit Apartments | 20 (64.5%) | 11 (35.5%) |
| 5 to 9 Unit Apartments | 0 (0.0%) | 10 (100.0%) |
| 10 or more Apartments | 0 (0.0%) | 4 (100.0%) |
| Mobile Home / Other | 60 (34.7%) | 113 (65.3%) |
| Total | 682 (69.8%) | 295 (30.2%) |
Housing Structures by Number of Rooms in Lockport
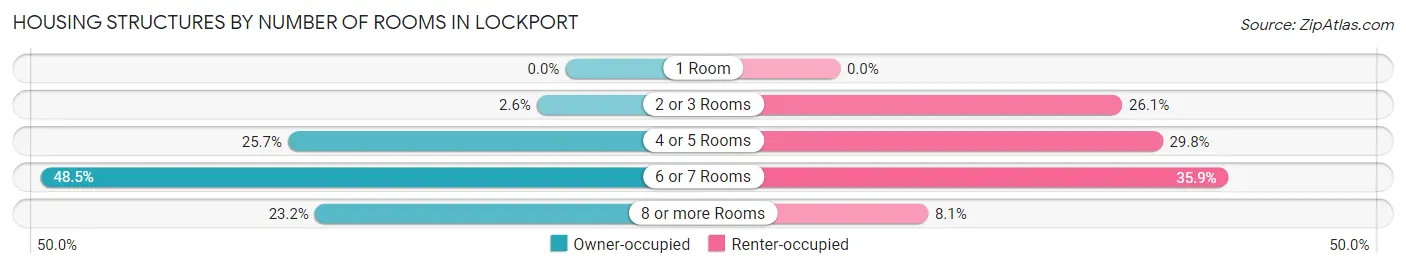
| Number of Rooms | Owner-occupied | Renter-occupied |
| 1 Room | 0 (0.0%) | 0 (0.0%) |
| 2 or 3 Rooms | 18 (2.6%) | 77 (26.1%) |
| 4 or 5 Rooms | 175 (25.7%) | 88 (29.8%) |
| 6 or 7 Rooms | 331 (48.5%) | 106 (35.9%) |
| 8 or more Rooms | 158 (23.2%) | 24 (8.1%) |
| Total | 682 (100.0%) | 295 (100.0%) |
Housing Structure by Heating Type in Lockport
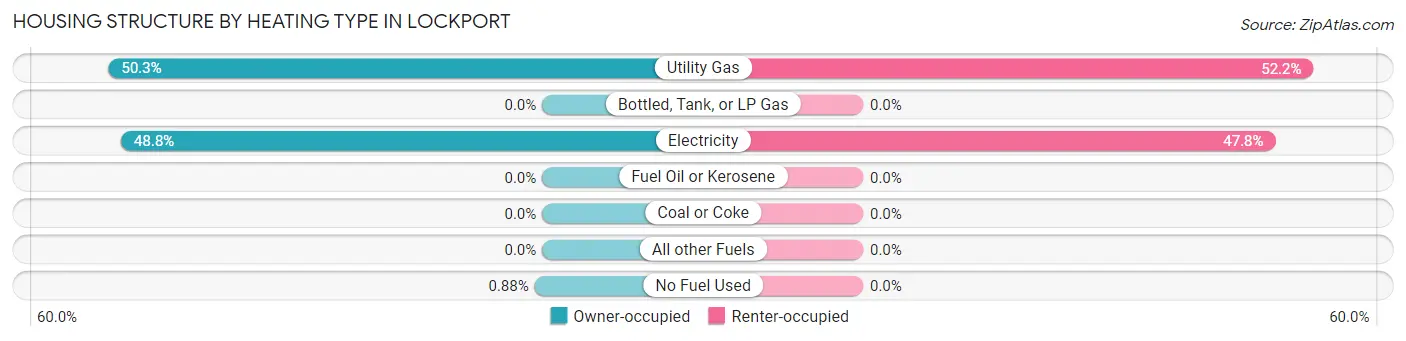
| Heating Type | Owner-occupied | Renter-occupied |
| Utility Gas | 343 (50.3%) | 154 (52.2%) |
| Bottled, Tank, or LP Gas | 0 (0.0%) | 0 (0.0%) |
| Electricity | 333 (48.8%) | 141 (47.8%) |
| Fuel Oil or Kerosene | 0 (0.0%) | 0 (0.0%) |
| Coal or Coke | 0 (0.0%) | 0 (0.0%) |
| All other Fuels | 0 (0.0%) | 0 (0.0%) |
| No Fuel Used | 6 (0.9%) | 0 (0.0%) |
| Total | 682 (100.0%) | 295 (100.0%) |
Household Vehicle Usage in Lockport
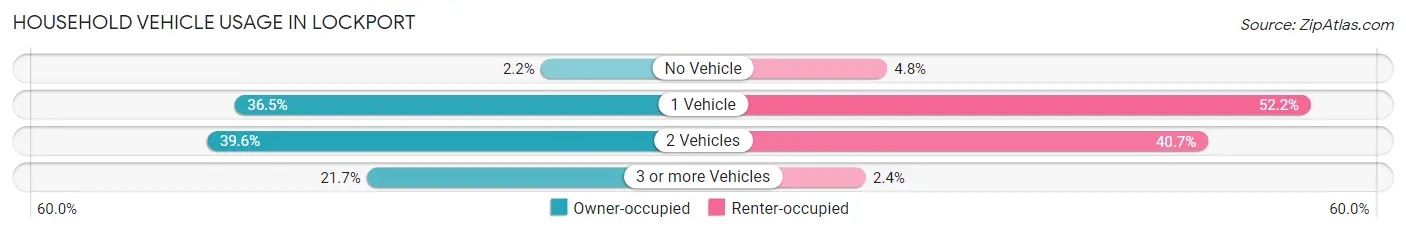
| Vehicles per Household | Owner-occupied | Renter-occupied |
| No Vehicle | 15 (2.2%) | 14 (4.8%) |
| 1 Vehicle | 249 (36.5%) | 154 (52.2%) |
| 2 Vehicles | 270 (39.6%) | 120 (40.7%) |
| 3 or more Vehicles | 148 (21.7%) | 7 (2.4%) |
| Total | 682 (100.0%) | 295 (100.0%) |
Real Estate & Mortgages in Lockport
Real Estate and Mortgage Overview in Lockport
| Characteristic | Without Mortgage | With Mortgage |
| Housing Units | 388 | 294 |
| Median Property Value | $113,100 | $178,400 |
| Median Household Income | $46,563 | $29 |
| Monthly Housing Costs | $358 | $0 |
| Real Estate Taxes | $199 | $18 |
Property Value by Mortgage Status in Lockport
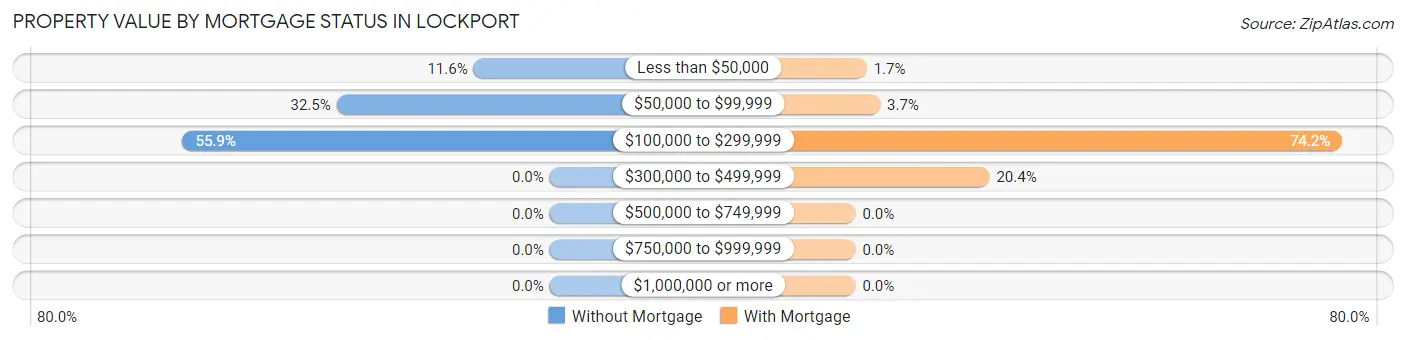
| Property Value | Without Mortgage | With Mortgage |
| Less than $50,000 | 45 (11.6%) | 5 (1.7%) |
| $50,000 to $99,999 | 126 (32.5%) | 11 (3.7%) |
| $100,000 to $299,999 | 217 (55.9%) | 218 (74.2%) |
| $300,000 to $499,999 | 0 (0.0%) | 60 (20.4%) |
| $500,000 to $749,999 | 0 (0.0%) | 0 (0.0%) |
| $750,000 to $999,999 | 0 (0.0%) | 0 (0.0%) |
| $1,000,000 or more | 0 (0.0%) | 0 (0.0%) |
| Total | 388 (100.0%) | 294 (100.0%) |
Household Income by Mortgage Status in Lockport
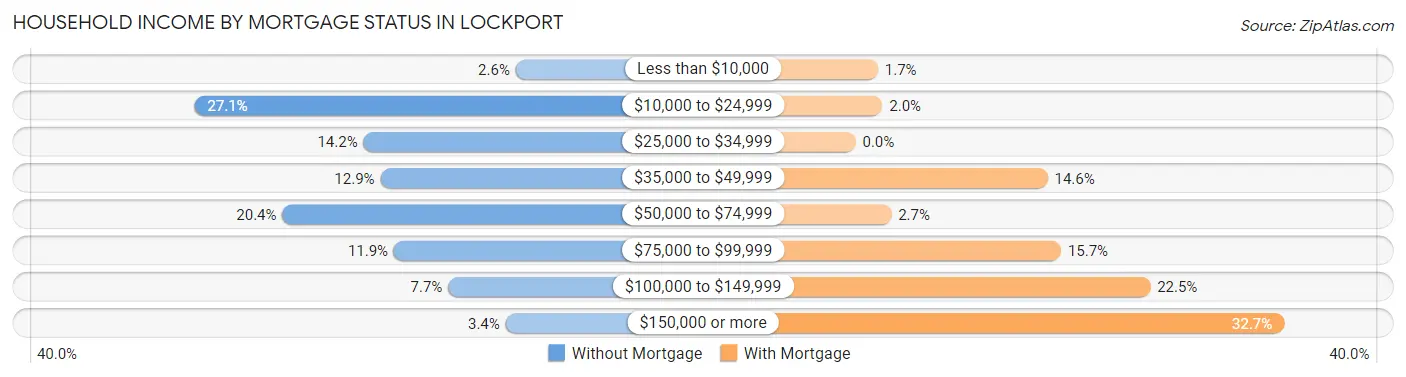
| Household Income | Without Mortgage | With Mortgage |
| Less than $10,000 | 10 (2.6%) | 5 (1.7%) |
| $10,000 to $24,999 | 105 (27.1%) | 6 (2.0%) |
| $25,000 to $34,999 | 55 (14.2%) | 0 (0.0%) |
| $35,000 to $49,999 | 50 (12.9%) | 43 (14.6%) |
| $50,000 to $74,999 | 79 (20.4%) | 8 (2.7%) |
| $75,000 to $99,999 | 46 (11.9%) | 46 (15.7%) |
| $100,000 to $149,999 | 30 (7.7%) | 66 (22.5%) |
| $150,000 or more | 13 (3.4%) | 96 (32.7%) |
| Total | 388 (100.0%) | 294 (100.0%) |
Property Value to Household Income Ratio in Lockport
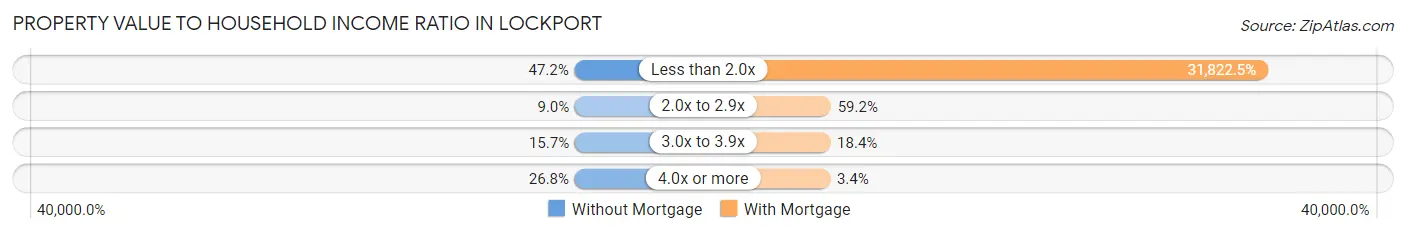
| Value-to-Income Ratio | Without Mortgage | With Mortgage |
| Less than 2.0x | 183 (47.2%) | 93,558 (31,822.4%) |
| 2.0x to 2.9x | 35 (9.0%) | 174 (59.2%) |
| 3.0x to 3.9x | 61 (15.7%) | 54 (18.4%) |
| 4.0x or more | 104 (26.8%) | 10 (3.4%) |
| Total | 388 (100.0%) | 294 (100.0%) |
Real Estate Taxes by Mortgage Status in Lockport
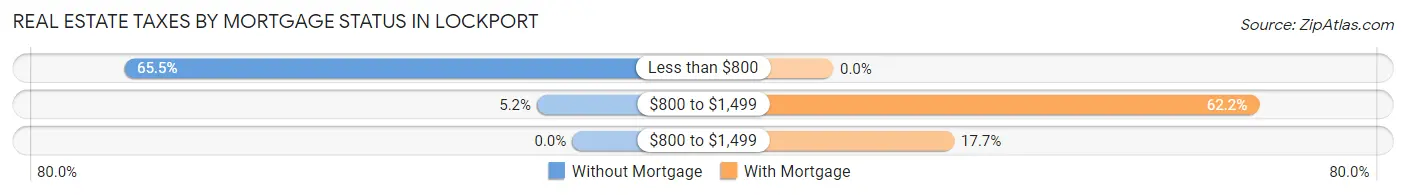
| Property Taxes | Without Mortgage | With Mortgage |
| Less than $800 | 254 (65.5%) | 0 (0.0%) |
| $800 to $1,499 | 20 (5.1%) | 183 (62.2%) |
| $800 to $1,499 | 0 (0.0%) | 52 (17.7%) |
| Total | 388 (100.0%) | 294 (100.0%) |
Health & Disability in Lockport
Health Insurance Coverage by Age in Lockport
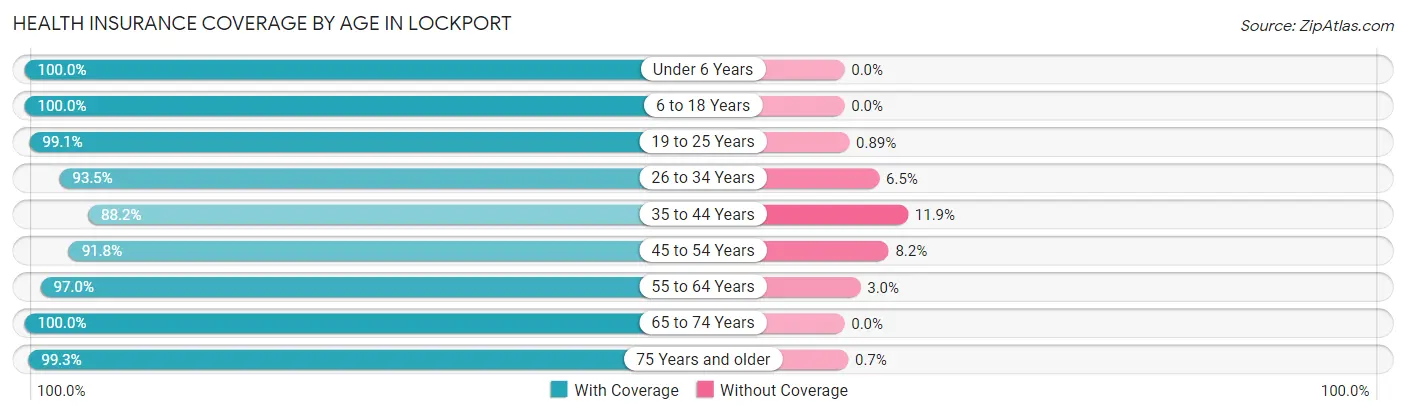
| Age Bracket | With Coverage | Without Coverage |
| Under 6 Years | 193 (100.0%) | 0 (0.0%) |
| 6 to 18 Years | 540 (100.0%) | 0 (0.0%) |
| 19 to 25 Years | 111 (99.1%) | 1 (0.9%) |
| 26 to 34 Years | 288 (93.5%) | 20 (6.5%) |
| 35 to 44 Years | 305 (88.1%) | 41 (11.8%) |
| 45 to 54 Years | 245 (91.8%) | 22 (8.2%) |
| 55 to 64 Years | 326 (97.0%) | 10 (3.0%) |
| 65 to 74 Years | 373 (100.0%) | 0 (0.0%) |
| 75 Years and older | 284 (99.3%) | 2 (0.7%) |
| Total | 2,665 (96.5%) | 96 (3.5%) |
Health Insurance Coverage by Citizenship Status in Lockport
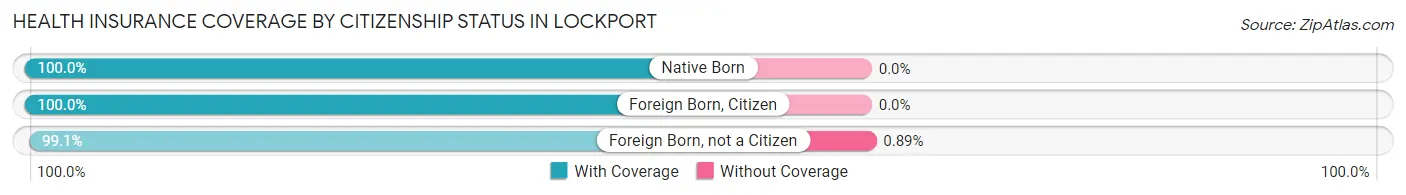
| Citizenship Status | With Coverage | Without Coverage |
| Native Born | 193 (100.0%) | 0 (0.0%) |
| Foreign Born, Citizen | 540 (100.0%) | 0 (0.0%) |
| Foreign Born, not a Citizen | 111 (99.1%) | 1 (0.9%) |
Health Insurance Coverage by Household Income in Lockport
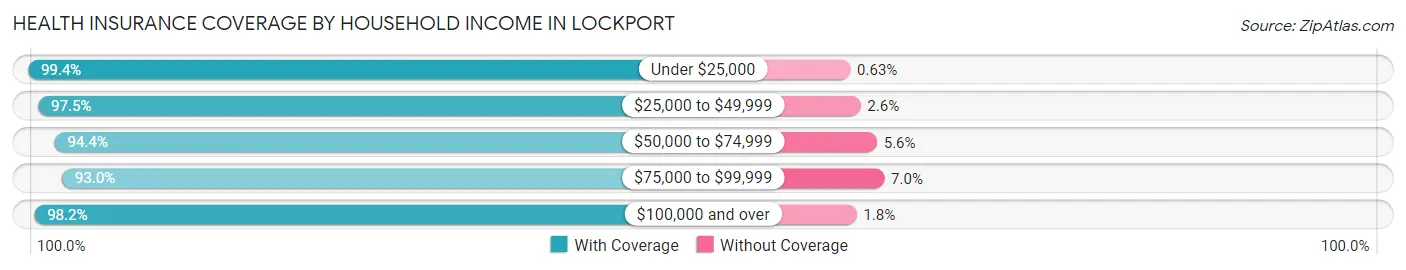
| Household Income | With Coverage | Without Coverage |
| Under $25,000 | 313 (99.4%) | 2 (0.6%) |
| $25,000 to $49,999 | 726 (97.5%) | 19 (2.5%) |
| $50,000 to $74,999 | 487 (94.4%) | 29 (5.6%) |
| $75,000 to $99,999 | 425 (93.0%) | 32 (7.0%) |
| $100,000 and over | 705 (98.2%) | 13 (1.8%) |
Public vs Private Health Insurance Coverage by Age in Lockport
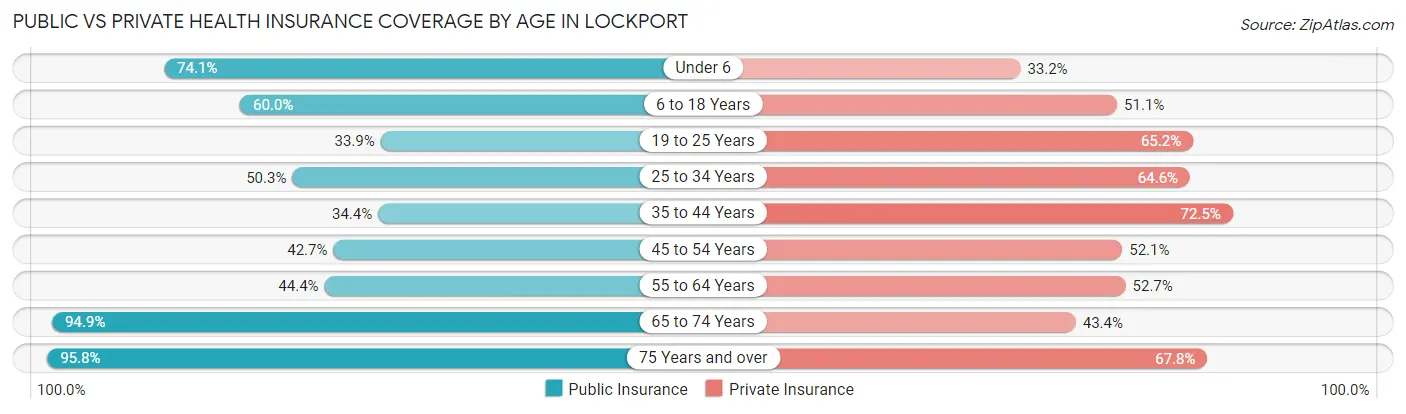
| Age Bracket | Public Insurance | Private Insurance |
| Under 6 | 143 (74.1%) | 64 (33.2%) |
| 6 to 18 Years | 324 (60.0%) | 276 (51.1%) |
| 19 to 25 Years | 38 (33.9%) | 73 (65.2%) |
| 25 to 34 Years | 155 (50.3%) | 199 (64.6%) |
| 35 to 44 Years | 119 (34.4%) | 251 (72.5%) |
| 45 to 54 Years | 114 (42.7%) | 139 (52.1%) |
| 55 to 64 Years | 149 (44.4%) | 177 (52.7%) |
| 65 to 74 Years | 354 (94.9%) | 162 (43.4%) |
| 75 Years and over | 274 (95.8%) | 194 (67.8%) |
| Total | 1,670 (60.5%) | 1,535 (55.6%) |
Disability Status by Sex by Age in Lockport
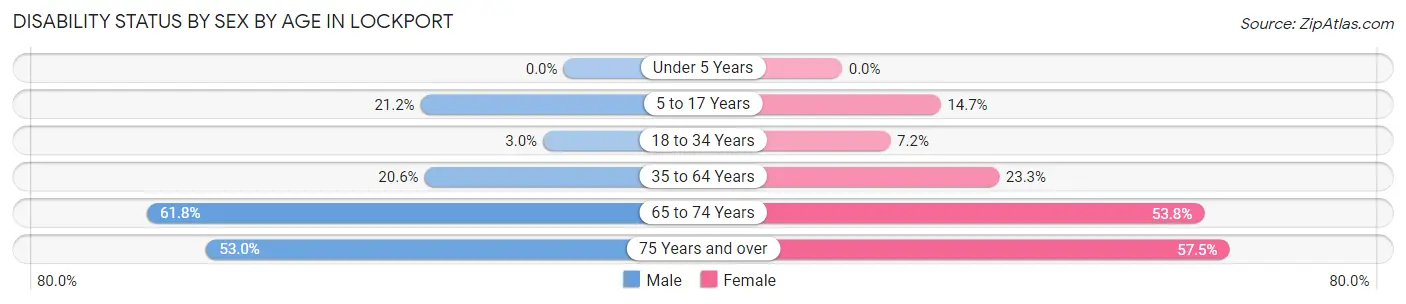
| Age Bracket | Male | Female |
| Under 5 Years | 0 (0.0%) | 0 (0.0%) |
| 5 to 17 Years | 59 (21.2%) | 40 (14.6%) |
| 18 to 34 Years | 7 (3.0%) | 14 (7.2%) |
| 35 to 64 Years | 79 (20.6%) | 132 (23.3%) |
| 65 to 74 Years | 157 (61.8%) | 64 (53.8%) |
| 75 Years and over | 53 (53.0%) | 107 (57.5%) |
Disability Class by Sex by Age in Lockport
Disability Class: Hearing Difficulty
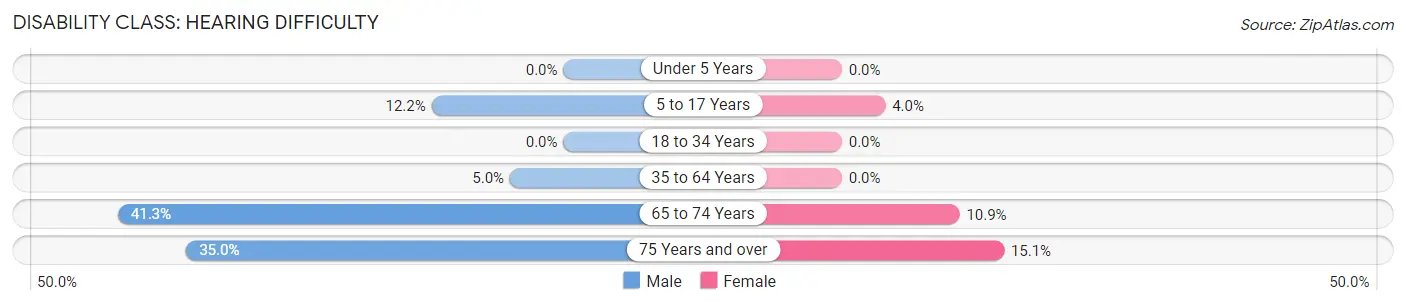
| Age Bracket | Male | Female |
| Under 5 Years | 0 (0.0%) | 0 (0.0%) |
| 5 to 17 Years | 34 (12.2%) | 11 (4.0%) |
| 18 to 34 Years | 0 (0.0%) | 0 (0.0%) |
| 35 to 64 Years | 19 (5.0%) | 0 (0.0%) |
| 65 to 74 Years | 105 (41.3%) | 13 (10.9%) |
| 75 Years and over | 35 (35.0%) | 28 (15.0%) |
Disability Class: Vision Difficulty
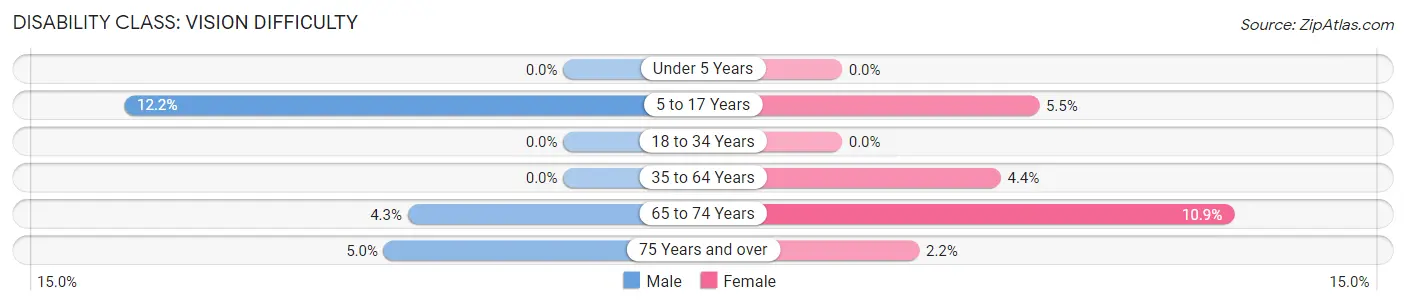
| Age Bracket | Male | Female |
| Under 5 Years | 0 (0.0%) | 0 (0.0%) |
| 5 to 17 Years | 34 (12.2%) | 15 (5.5%) |
| 18 to 34 Years | 0 (0.0%) | 0 (0.0%) |
| 35 to 64 Years | 0 (0.0%) | 25 (4.4%) |
| 65 to 74 Years | 11 (4.3%) | 13 (10.9%) |
| 75 Years and over | 5 (5.0%) | 4 (2.1%) |
Disability Class: Cognitive Difficulty
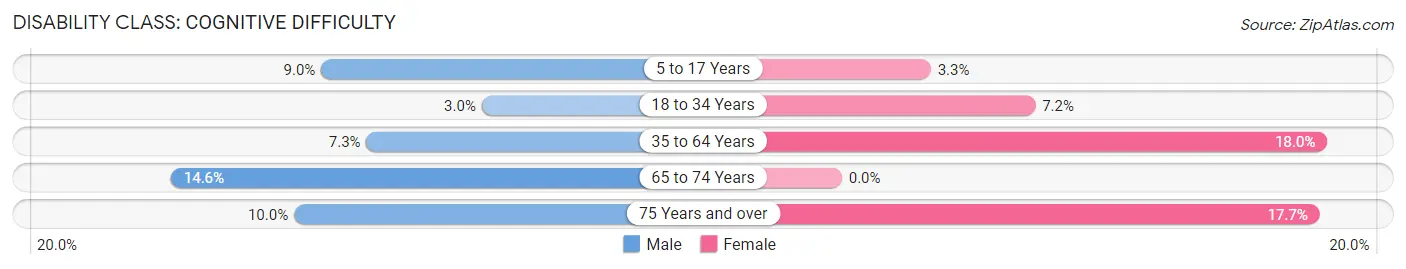
| Age Bracket | Male | Female |
| 5 to 17 Years | 25 (9.0%) | 9 (3.3%) |
| 18 to 34 Years | 7 (3.0%) | 14 (7.2%) |
| 35 to 64 Years | 28 (7.3%) | 102 (18.0%) |
| 65 to 74 Years | 37 (14.6%) | 0 (0.0%) |
| 75 Years and over | 10 (10.0%) | 33 (17.7%) |
Disability Class: Ambulatory Difficulty
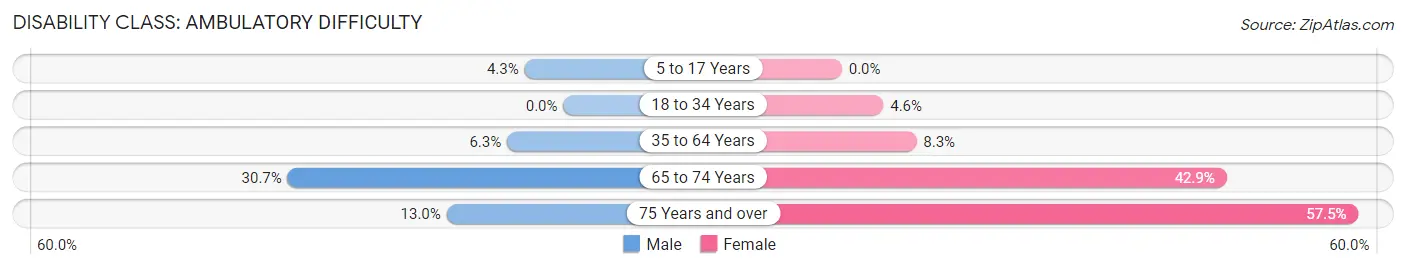
| Age Bracket | Male | Female |
| 5 to 17 Years | 12 (4.3%) | 0 (0.0%) |
| 18 to 34 Years | 0 (0.0%) | 9 (4.6%) |
| 35 to 64 Years | 24 (6.3%) | 47 (8.3%) |
| 65 to 74 Years | 78 (30.7%) | 51 (42.9%) |
| 75 Years and over | 13 (13.0%) | 107 (57.5%) |
Disability Class: Self-Care Difficulty
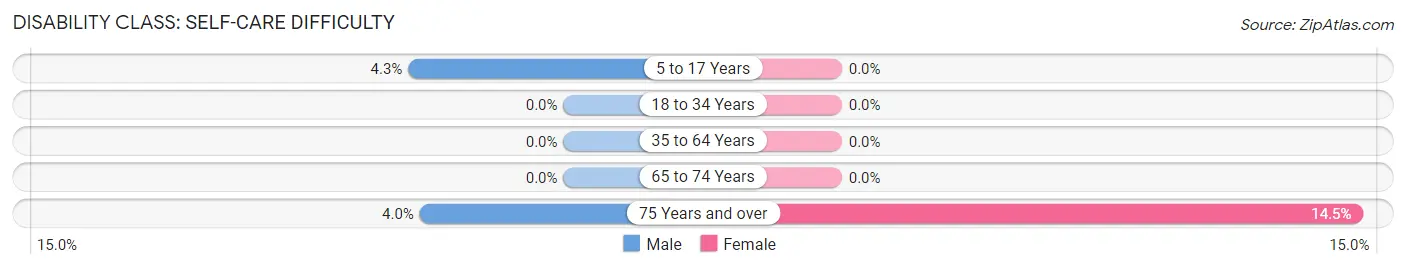
| Age Bracket | Male | Female |
| 5 to 17 Years | 12 (4.3%) | 0 (0.0%) |
| 18 to 34 Years | 0 (0.0%) | 0 (0.0%) |
| 35 to 64 Years | 0 (0.0%) | 0 (0.0%) |
| 65 to 74 Years | 0 (0.0%) | 0 (0.0%) |
| 75 Years and over | 4 (4.0%) | 27 (14.5%) |
Technology Access in Lockport
Computing Device Access in Lockport
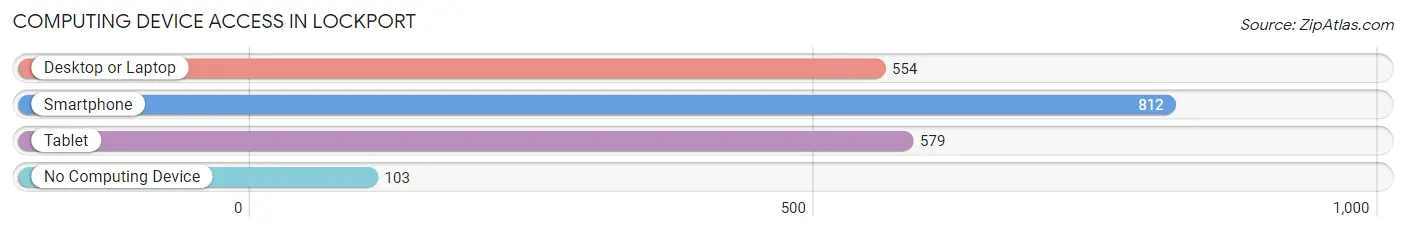
| Device Type | # Households | % Households |
| Desktop or Laptop | 554 | 56.7% |
| Smartphone | 812 | 83.1% |
| Tablet | 579 | 59.3% |
| No Computing Device | 103 | 10.5% |
| Total | 977 | 100.0% |
Internet Access in Lockport
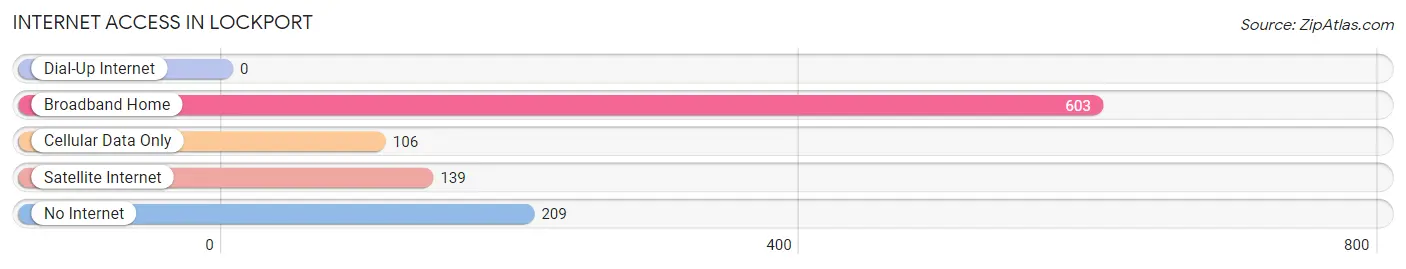
| Internet Type | # Households | % Households |
| Dial-Up Internet | 0 | 0.0% |
| Broadband Home | 603 | 61.7% |
| Cellular Data Only | 106 | 10.8% |
| Satellite Internet | 139 | 14.2% |
| No Internet | 209 | 21.4% |
| Total | 977 | 100.0% |
Lockport Summary
Lockport is a small town located in Lafourche Parish, Louisiana. It is situated on the banks of Bayou Lafourche, approximately 25 miles south of Thibodaux and 50 miles southwest of New Orleans. The town has a population of approximately 2,500 people and is part of the Houma-Thibodaux Metropolitan Statistical Area.
History
The area that is now Lockport was originally inhabited by the Chitimacha Indians. The first European settlers arrived in the area in the late 1700s and established a small fishing village. The village was named Lockport after the locks that were built on the bayou to control the water level. The locks were built by the Lafourche Canal Company in 1838 and were used to transport goods and people up and down the bayou.
In 1845, the town was incorporated and the first mayor was elected. The town grew slowly over the next few decades, but the population began to increase in the late 1800s when the railroad was built. The railroad allowed for the transportation of goods and people to and from Lockport, which helped to spur economic growth.
In the early 1900s, the town began to experience a period of rapid growth. The population increased from 1,000 in 1910 to 2,500 in 1920. This growth was due to the development of the oil and gas industry in the area. The oil and gas industry provided jobs and economic opportunities for the people of Lockport.
Geography
Lockport is located in Lafourche Parish, Louisiana. It is situated on the banks of Bayou Lafourche, approximately 25 miles south of Thibodaux and 50 miles southwest of New Orleans. The town has a total area of 2.2 square miles, all of which is land. The terrain is mostly flat and the town is surrounded by marshland and swamps.
The climate in Lockport is humid subtropical, with hot, humid summers and mild winters. The average temperature in the summer is around 90 degrees Fahrenheit and the average temperature in the winter is around 50 degrees Fahrenheit. The town receives an average of 60 inches of rain per year.
Economy
The economy of Lockport is largely based on the oil and gas industry. The town is home to several oil and gas companies, including Chevron, Shell, and ExxonMobil. These companies provide jobs and economic opportunities for the people of Lockport.
In addition to the oil and gas industry, Lockport is also home to several other businesses. These include a grocery store, a hardware store, a pharmacy, and several restaurants. The town also has a small marina, which provides access to the bayou for fishing and recreational boating.
Demographics
As of the 2010 census, the population of Lockport was 2,521. The racial makeup of the town was 79.3% White, 17.2% African American, 0.7% Native American, 0.3% Asian, 0.1% Pacific Islander, and 2.4% from other races. Hispanic or Latino of any race were 3.2% of the population.
The median household income in Lockport was $37,917, and the median family income was $45,938. The per capita income was $18,945. About 17.2% of the population was below the poverty line.
Lockport is a small town with a rich history and a diverse population. The town is home to several businesses and industries, providing economic opportunities for its residents. The town is also situated on the banks of Bayou Lafourche, providing access to recreational activities such as fishing and boating. Lockport is a great place to live and work, and is a great example of the unique culture and history of Louisiana.
Common Questions
What is Per Capita Income in Lockport?
Per Capita income in Lockport is $24,553.
What is the Median Family Income in Lockport?
Median Family Income in Lockport is $61,875.
What is the Median Household income in Lockport?
Median Household Income in Lockport is $50,221.
What is Income or Wage Gap in Lockport?
Income or Wage Gap in Lockport is 52.3%.
Women in Lockport earn 47.7 cents for every dollar earned by a man.
What is Inequality or Gini Index in Lockport?
Inequality or Gini Index in Lockport is 0.40.
What is the Total Population of Lockport?
Total Population of Lockport is 2,761.
What is the Total Male Population of Lockport?
Total Male Population of Lockport is 1,329.
What is the Total Female Population of Lockport?
Total Female Population of Lockport is 1,432.
What is the Ratio of Males per 100 Females in Lockport?
There are 92.81 Males per 100 Females in Lockport.
What is the Ratio of Females per 100 Males in Lockport?
There are 107.75 Females per 100 Males in Lockport.
What is the Median Population Age in Lockport?
Median Population Age in Lockport is 40.1 Years.
What is the Average Family Size in Lockport
Average Family Size in Lockport is 3.4 People.
What is the Average Household Size in Lockport
Average Household Size in Lockport is 2.8 People.
How Large is the Labor Force in Lockport?
There are 1,051 People in the Labor Forcein in Lockport.
What is the Percentage of People in the Labor Force in Lockport?
50.2% of People are in the Labor Force in Lockport.
What is the Unemployment Rate in Lockport?
Unemployment Rate in Lockport is 7.5%.