Leesville, LA Map & Demographics
Leesville Map
Leesville Overview
$25,386
PER CAPITA INCOME
$53,531
AVG FAMILY INCOME
$35,652
AVG HOUSEHOLD INCOME
25.3%
WAGE / INCOME GAP [ % ]
74.7¢/ $1
WAGE / INCOME GAP [ $ ]
0.53
INEQUALITY / GINI INDEX
5,681
TOTAL POPULATION
2,768
MALE POPULATION
2,913
FEMALE POPULATION
95.02
MALES / 100 FEMALES
105.24
FEMALES / 100 MALES
35.0
MEDIAN AGE
3.2
AVG FAMILY SIZE
2.3
AVG HOUSEHOLD SIZE
2,494
LABOR FORCE [ PEOPLE ]
54.6%
PERCENT IN LABOR FORCE
9.5%
UNEMPLOYMENT RATE
Leesville Zip Codes
Leesville Area Codes
Income in Leesville
Income Overview in Leesville
Per Capita Income in Leesville is $25,386, while median incomes of families and households are $53,531 and $35,652 respectively.
| Characteristic | Number | Measure |
| Per Capita Income | 5,681 | $25,386 |
| Median Family Income | 1,217 | $53,531 |
| Mean Family Income | 1,217 | $61,238 |
| Median Household Income | 2,416 | $35,652 |
| Mean Household Income | 2,416 | $55,169 |
| Income Deficit | 1,217 | $0 |
| Wage / Income Gap (%) | 5,681 | 25.33% |
| Wage / Income Gap ($) | 5,681 | 74.67¢ per $1 |
| Gini / Inequality Index | 5,681 | 0.53 |
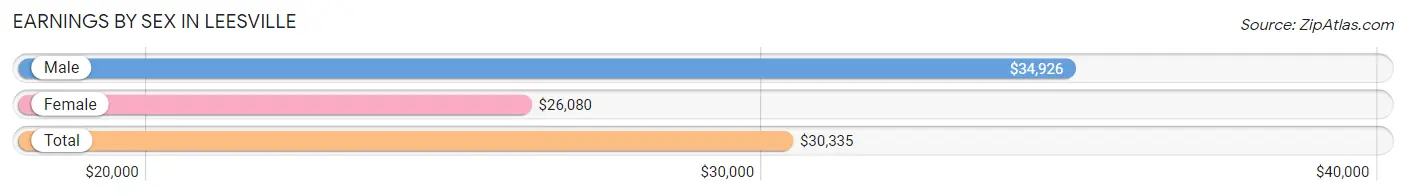
Earnings by Sex in Leesville
Average Earnings in Leesville are $30,335, $34,926 for men and $26,080 for women, a difference of 25.3%.
| Sex | Number | Average Earnings |
| Male | 1,338 (52.8%) | $34,926 |
| Female | 1,196 (47.2%) | $26,080 |
| Total | 2,534 (100.0%) | $30,335 |
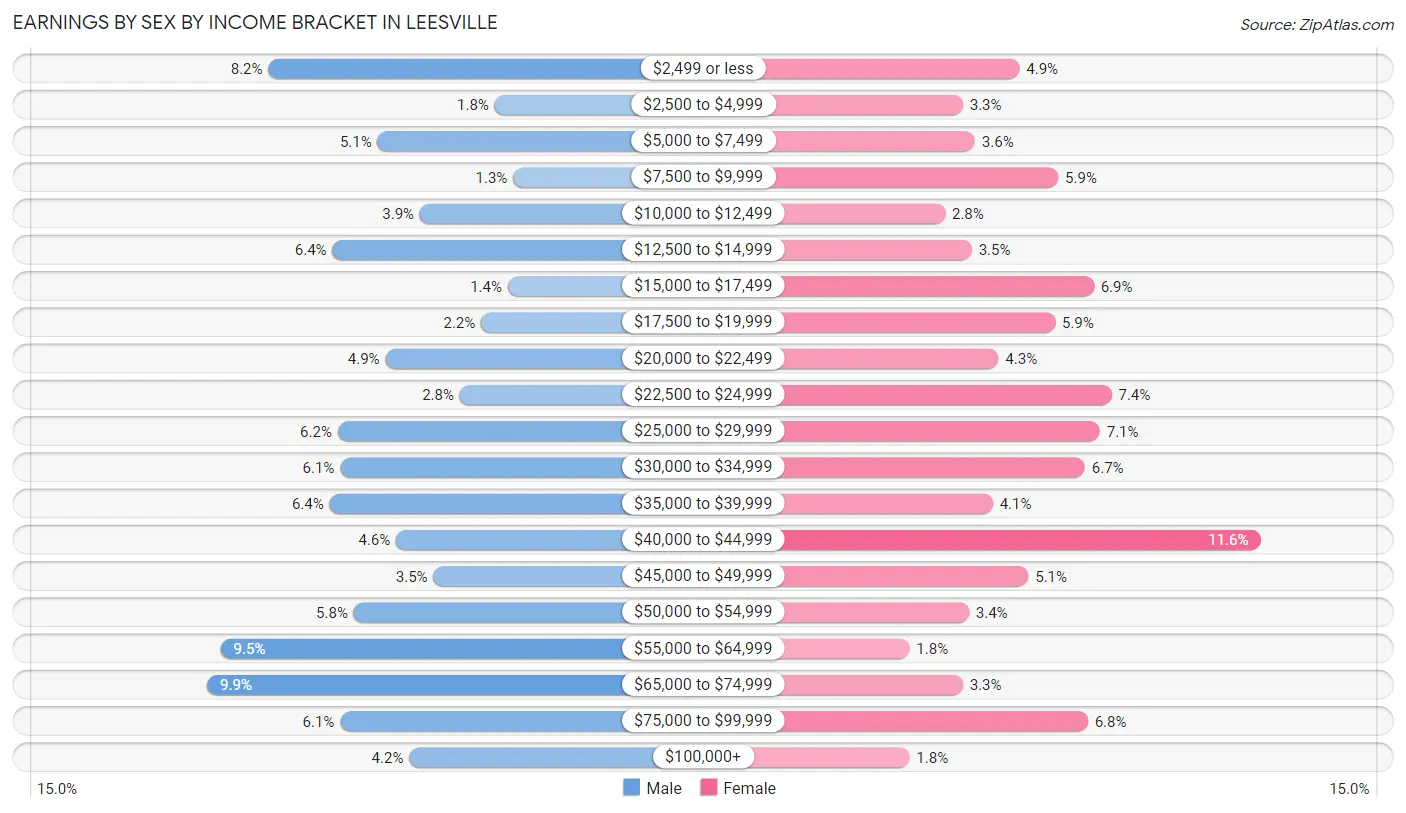
Earnings by Sex by Income Bracket in Leesville
The most common earnings brackets in Leesville are $65,000 to $74,999 for men (132 | 9.9%) and $40,000 to $44,999 for women (139 | 11.6%).
| Income | Male | Female |
| $2,499 or less | 109 (8.2%) | 58 (4.9%) |
| $2,500 to $4,999 | 24 (1.8%) | 39 (3.3%) |
| $5,000 to $7,499 | 68 (5.1%) | 43 (3.6%) |
| $7,500 to $9,999 | 17 (1.3%) | 71 (5.9%) |
| $10,000 to $12,499 | 52 (3.9%) | 33 (2.8%) |
| $12,500 to $14,999 | 85 (6.4%) | 42 (3.5%) |
| $15,000 to $17,499 | 19 (1.4%) | 83 (6.9%) |
| $17,500 to $19,999 | 29 (2.2%) | 70 (5.9%) |
| $20,000 to $22,499 | 65 (4.9%) | 51 (4.3%) |
| $22,500 to $24,999 | 37 (2.8%) | 89 (7.4%) |
| $25,000 to $29,999 | 83 (6.2%) | 85 (7.1%) |
| $30,000 to $34,999 | 82 (6.1%) | 80 (6.7%) |
| $35,000 to $39,999 | 86 (6.4%) | 49 (4.1%) |
| $40,000 to $44,999 | 61 (4.6%) | 139 (11.6%) |
| $45,000 to $49,999 | 47 (3.5%) | 61 (5.1%) |
| $50,000 to $54,999 | 77 (5.8%) | 41 (3.4%) |
| $55,000 to $64,999 | 127 (9.5%) | 21 (1.8%) |
| $65,000 to $74,999 | 132 (9.9%) | 39 (3.3%) |
| $75,000 to $99,999 | 82 (6.1%) | 81 (6.8%) |
| $100,000+ | 56 (4.2%) | 21 (1.8%) |
| Total | 1,338 (100.0%) | 1,196 (100.0%) |
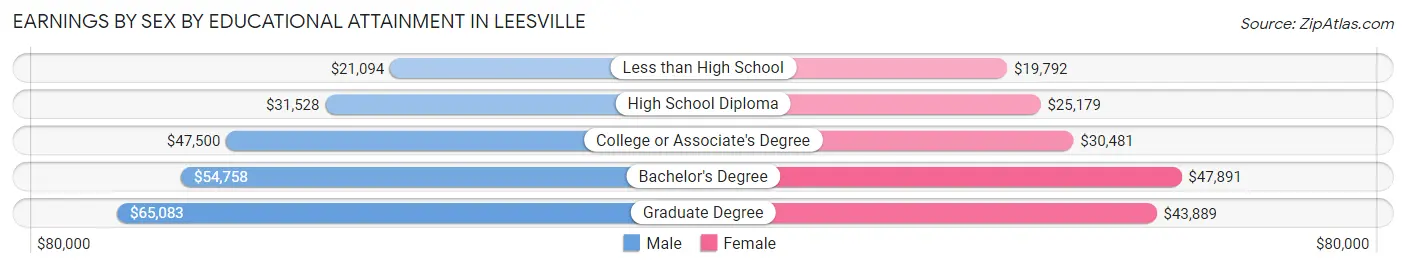
Earnings by Sex by Educational Attainment in Leesville
Average earnings in Leesville are $39,133 for men and $29,512 for women, a difference of 24.6%. Men with an educational attainment of graduate degree enjoy the highest average annual earnings of $65,083, while those with less than high school education earn the least with $21,094. Women with an educational attainment of bachelor's degree earn the most with the average annual earnings of $47,891, while those with less than high school education have the smallest earnings of $19,792.
| Educational Attainment | Male Income | Female Income |
| Less than High School | $21,094 | $19,792 |
| High School Diploma | $31,528 | $25,179 |
| College or Associate's Degree | $47,500 | $30,481 |
| Bachelor's Degree | $54,758 | $47,891 |
| Graduate Degree | $65,083 | $43,889 |
| Total | $39,133 | $29,512 |
Family Income in Leesville
Family Income Brackets in Leesville
According to the Leesville family income data, there are 226 families falling into the $50,000 to $74,999 income range, which is the most common income bracket and makes up 18.6% of all families. Conversely, the $200,000+ income bracket is the least frequent group with only 19 families (1.6%) belonging to this category.
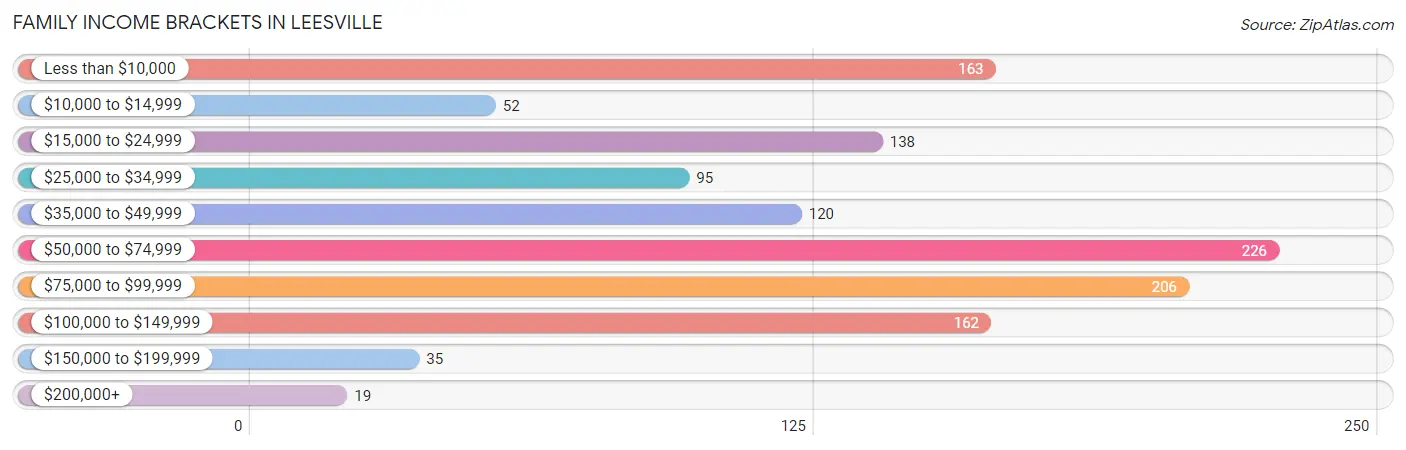
| Income Bracket | # Families | % Families |
| Less than $10,000 | 163 | 13.4% |
| $10,000 to $14,999 | 52 | 4.3% |
| $15,000 to $24,999 | 138 | 11.3% |
| $25,000 to $34,999 | 95 | 7.8% |
| $35,000 to $49,999 | 120 | 9.9% |
| $50,000 to $74,999 | 226 | 18.6% |
| $75,000 to $99,999 | 206 | 16.9% |
| $100,000 to $149,999 | 162 | 13.3% |
| $150,000 to $199,999 | 35 | 2.9% |
| $200,000+ | 19 | 1.6% |
Family Income by Famaliy Size in Leesville
6-person families (39 | 3.2%) account for the highest median family income in Leesville with $80,913 per family, while 2-person families (654 | 53.7%) have the highest median income of $26,638 per family member.
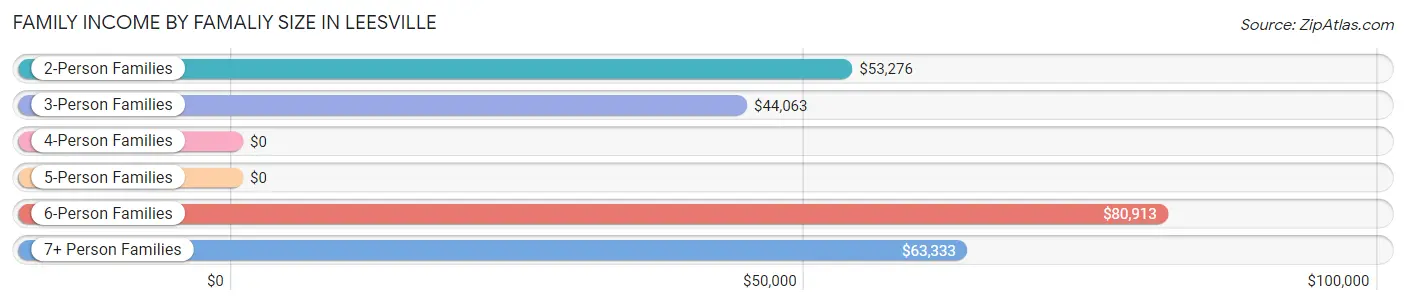
| Income Bracket | # Families | Median Income |
| 2-Person Families | 654 (53.7%) | $53,276 |
| 3-Person Families | 245 (20.1%) | $44,063 |
| 4-Person Families | 159 (13.1%) | $0 |
| 5-Person Families | 74 (6.1%) | $0 |
| 6-Person Families | 39 (3.2%) | $80,913 |
| 7+ Person Families | 46 (3.8%) | $63,333 |
| Total | 1,217 (100.0%) | $53,531 |
Family Income by Number of Earners in Leesville
The median family income in Leesville is $53,531, with families comprising 3+ earners (53) having the highest median family income of $81,587, while families with no earners (324) have the lowest median family income of $15,726, accounting for 4.3% and 26.6% of families, respectively.
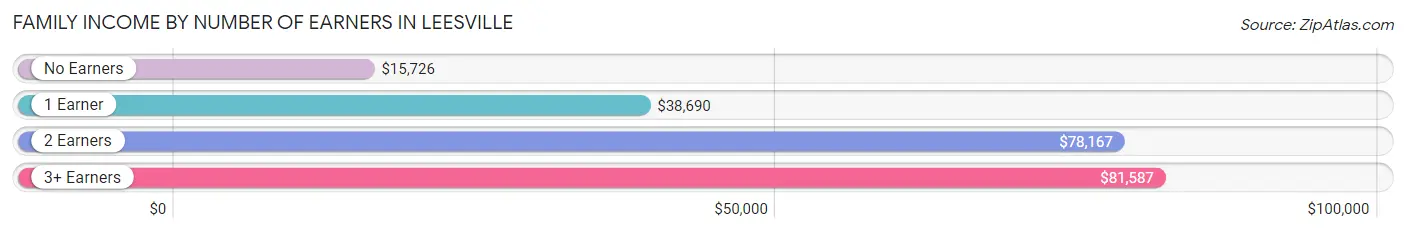
| Number of Earners | # Families | Median Income |
| No Earners | 324 (26.6%) | $15,726 |
| 1 Earner | 482 (39.6%) | $38,690 |
| 2 Earners | 358 (29.4%) | $78,167 |
| 3+ Earners | 53 (4.3%) | $81,587 |
| Total | 1,217 (100.0%) | $53,531 |
Household Income in Leesville
Household Income Brackets in Leesville
With 360 households falling in the category, the less than $10,000 income range is the most frequent in Leesville, accounting for 14.9% of all households. In contrast, only 43 households (1.8%) fall into the $150,000 to $199,999 income bracket, making it the least populous group.
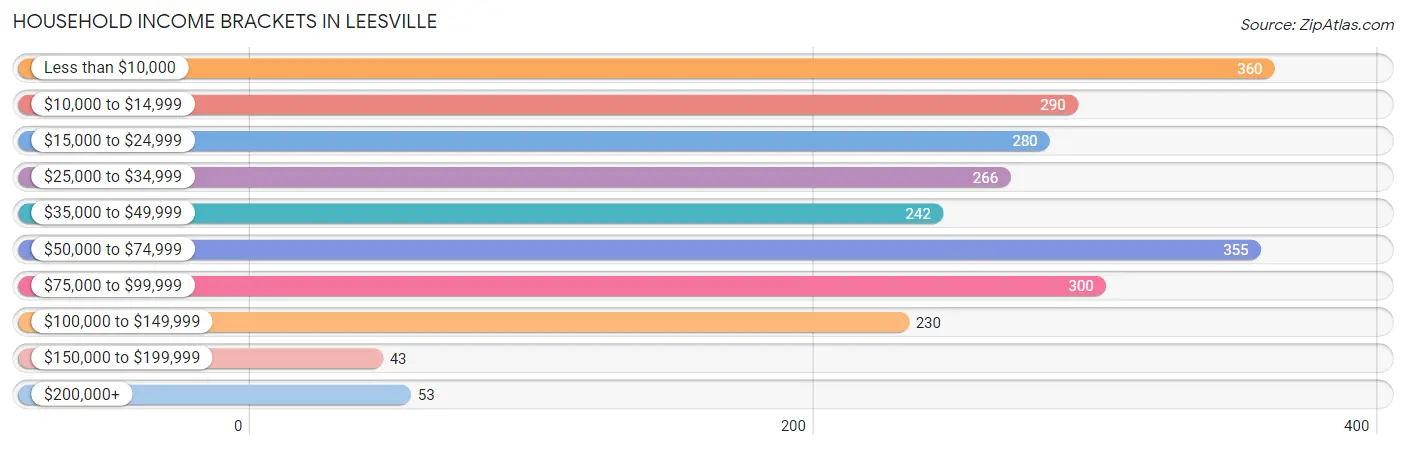
| Income Bracket | # Households | % Households |
| Less than $10,000 | 360 | 14.9% |
| $10,000 to $14,999 | 290 | 12.0% |
| $15,000 to $24,999 | 280 | 11.6% |
| $25,000 to $34,999 | 266 | 11.0% |
| $35,000 to $49,999 | 242 | 10.0% |
| $50,000 to $74,999 | 355 | 14.7% |
| $75,000 to $99,999 | 300 | 12.4% |
| $100,000 to $149,999 | 230 | 9.5% |
| $150,000 to $199,999 | 43 | 1.8% |
| $200,000+ | 53 | 2.2% |
Household Income by Householder Age in Leesville
The median household income in Leesville is $35,652, with the highest median household income of $40,208 found in the 25 to 44 years age bracket for the primary householder. A total of 824 households (34.1%) fall into this category. Meanwhile, the 15 to 24 years age bracket for the primary householder has the lowest median household income of $30,481, with 151 households (6.2%) in this group.
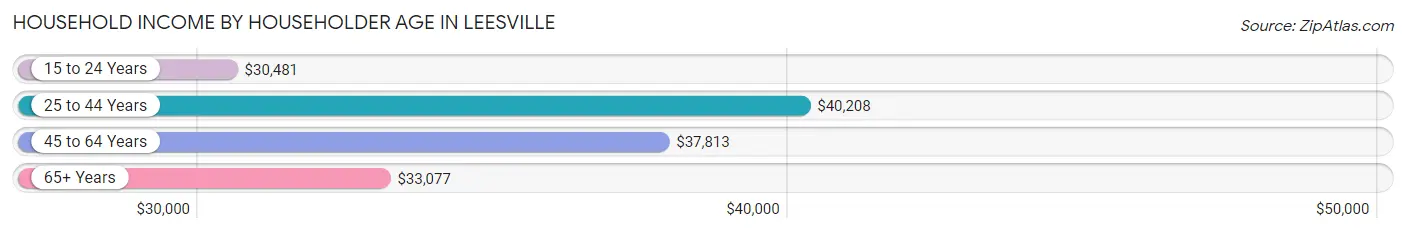
| Income Bracket | # Households | Median Income |
| 15 to 24 Years | 151 (6.2%) | $30,481 |
| 25 to 44 Years | 824 (34.1%) | $40,208 |
| 45 to 64 Years | 847 (35.1%) | $37,813 |
| 65+ Years | 594 (24.6%) | $33,077 |
| Total | 2,416 (100.0%) | $35,652 |
Poverty in Leesville
Income Below Poverty by Sex and Age in Leesville
With 28.1% poverty level for males and 36.8% for females among the residents of Leesville, 12 to 14 year old males and under 5 year old females are the most vulnerable to poverty, with 40 males (55.6%) and 138 females (57.5%) in their respective age groups living below the poverty level.
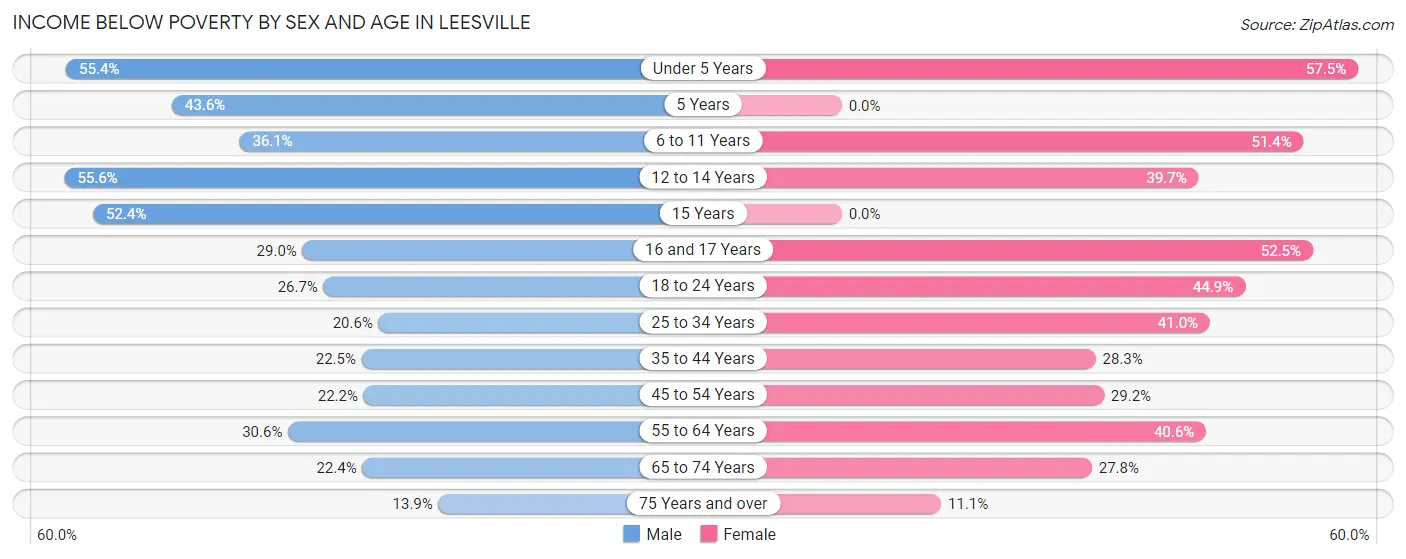
| Age Bracket | Male | Female |
| Under 5 Years | 98 (55.4%) | 138 (57.5%) |
| 5 Years | 17 (43.6%) | 0 (0.0%) |
| 6 to 11 Years | 79 (36.1%) | 109 (51.4%) |
| 12 to 14 Years | 40 (55.6%) | 29 (39.7%) |
| 15 Years | 11 (52.4%) | 0 (0.0%) |
| 16 and 17 Years | 9 (29.0%) | 32 (52.5%) |
| 18 to 24 Years | 91 (26.7%) | 119 (44.9%) |
| 25 to 34 Years | 95 (20.6%) | 216 (41.0%) |
| 35 to 44 Years | 66 (22.5%) | 78 (28.3%) |
| 45 to 54 Years | 78 (22.2%) | 108 (29.2%) |
| 55 to 64 Years | 110 (30.6%) | 125 (40.6%) |
| 65 to 74 Years | 51 (22.4%) | 81 (27.8%) |
| 75 Years and over | 15 (13.9%) | 24 (11.1%) |
| Total | 760 (28.1%) | 1,059 (36.8%) |
Income Above Poverty by Sex and Age in Leesville
According to the poverty statistics in Leesville, males aged 75 years and over and females aged 5 years are the age groups that are most secure financially, with 86.1% of males and 100.0% of females in these age groups living above the poverty line.
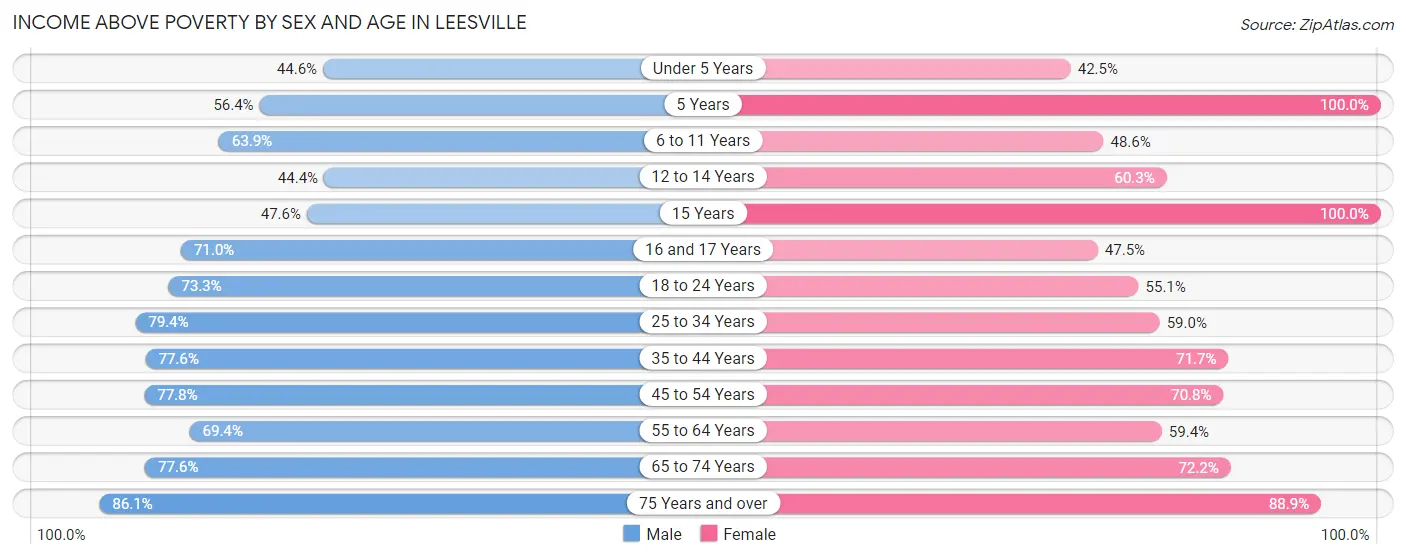
| Age Bracket | Male | Female |
| Under 5 Years | 79 (44.6%) | 102 (42.5%) |
| 5 Years | 22 (56.4%) | 8 (100.0%) |
| 6 to 11 Years | 140 (63.9%) | 103 (48.6%) |
| 12 to 14 Years | 32 (44.4%) | 44 (60.3%) |
| 15 Years | 10 (47.6%) | 31 (100.0%) |
| 16 and 17 Years | 22 (71.0%) | 29 (47.5%) |
| 18 to 24 Years | 250 (73.3%) | 146 (55.1%) |
| 25 to 34 Years | 367 (79.4%) | 311 (59.0%) |
| 35 to 44 Years | 228 (77.5%) | 198 (71.7%) |
| 45 to 54 Years | 273 (77.8%) | 262 (70.8%) |
| 55 to 64 Years | 249 (69.4%) | 183 (59.4%) |
| 65 to 74 Years | 177 (77.6%) | 210 (72.2%) |
| 75 Years and over | 93 (86.1%) | 193 (88.9%) |
| Total | 1,942 (71.9%) | 1,820 (63.2%) |
Income Below Poverty Among Married-Couple Families in Leesville
The poverty statistics for married-couple families in Leesville show that 11.0% or 76 of the total 692 families live below the poverty line. Families with 5 or more children have the highest poverty rate of 40.0%, comprising of 12 families. On the other hand, families with no children have the lowest poverty rate of 6.6%, which includes 31 families.
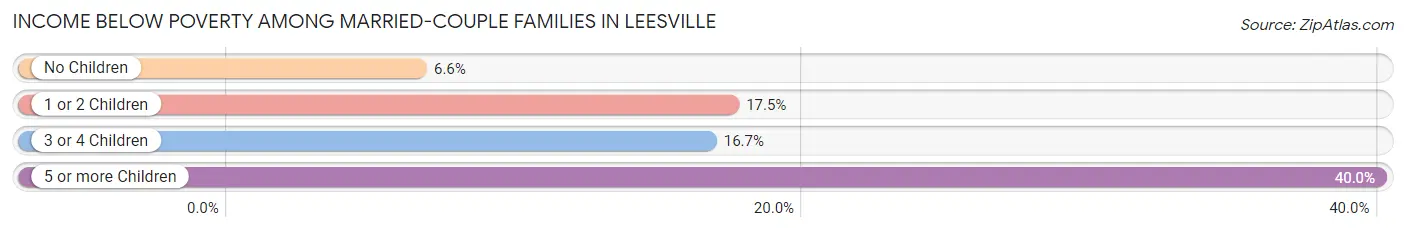
| Children | Above Poverty | Below Poverty |
| No Children | 440 (93.4%) | 31 (6.6%) |
| 1 or 2 Children | 123 (82.6%) | 26 (17.4%) |
| 3 or 4 Children | 35 (83.3%) | 7 (16.7%) |
| 5 or more Children | 18 (60.0%) | 12 (40.0%) |
| Total | 616 (89.0%) | 76 (11.0%) |
Income Below Poverty Among Single-Parent Households in Leesville
According to the poverty data in Leesville, 14.0% or 13 single-father households and 53.5% or 231 single-mother households are living below the poverty line. Among single-father households, those with 1 or 2 children have the highest poverty rate, with 13 households (19.7%) experiencing poverty. Likewise, among single-mother households, those with 5 or more children have the highest poverty rate, with 2 households (100.0%) falling below the poverty line.
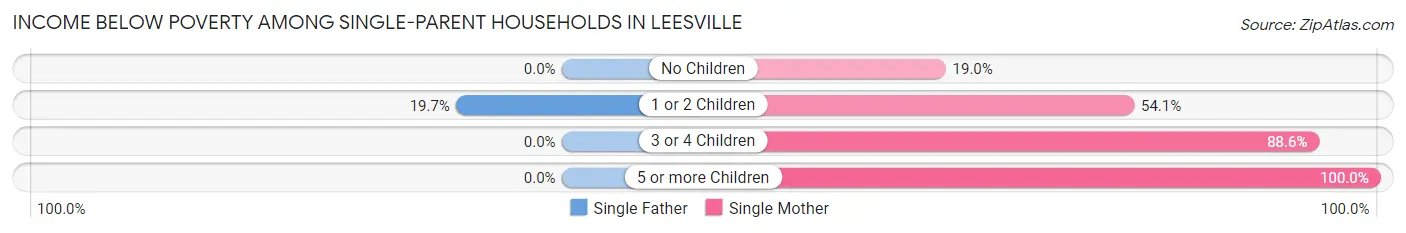
| Children | Single Father | Single Mother |
| No Children | 0 (0.0%) | 15 (19.0%) |
| 1 or 2 Children | 13 (19.7%) | 152 (54.1%) |
| 3 or 4 Children | 0 (0.0%) | 62 (88.6%) |
| 5 or more Children | 0 (0.0%) | 2 (100.0%) |
| Total | 13 (14.0%) | 231 (53.5%) |
Income Below Poverty Among Married-Couple vs Single-Parent Households in Leesville
The poverty data for Leesville shows that 76 of the married-couple family households (11.0%) and 244 of the single-parent households (46.5%) are living below the poverty level. Within the married-couple family households, those with 5 or more children have the highest poverty rate, with 12 households (40.0%) falling below the poverty line. Among the single-parent households, those with 5 or more children have the highest poverty rate, with 2 household (100.0%) living below poverty.
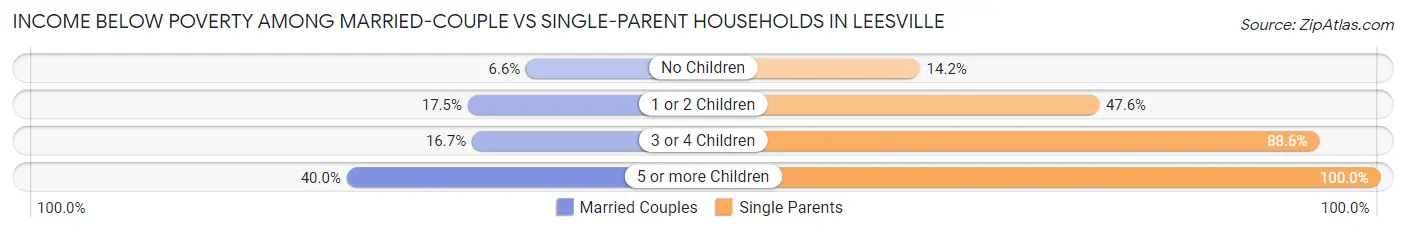
| Children | Married-Couple Families | Single-Parent Households |
| No Children | 31 (6.6%) | 15 (14.1%) |
| 1 or 2 Children | 26 (17.4%) | 165 (47.5%) |
| 3 or 4 Children | 7 (16.7%) | 62 (88.6%) |
| 5 or more Children | 12 (40.0%) | 2 (100.0%) |
| Total | 76 (11.0%) | 244 (46.5%) |
Race in Leesville
The most populous races in Leesville are White / Caucasian (2,988 | 52.6%), Black / African American (2,075 | 36.5%), and Hispanic or Latino (572 | 10.1%).
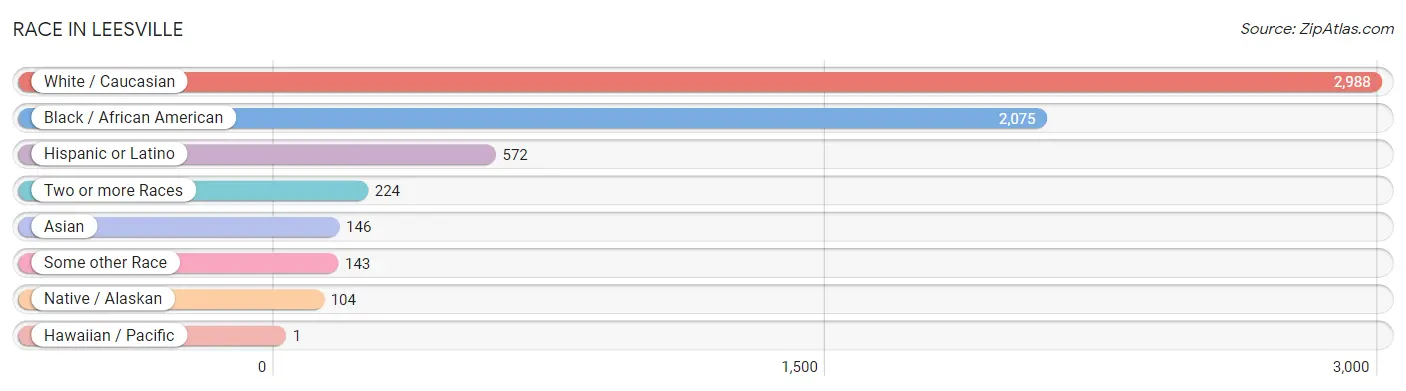
| Race | # Population | % Population |
| Asian | 146 | 2.6% |
| Black / African American | 2,075 | 36.5% |
| Hawaiian / Pacific | 1 | 0.0% |
| Hispanic or Latino | 572 | 10.1% |
| Native / Alaskan | 104 | 1.8% |
| White / Caucasian | 2,988 | 52.6% |
| Two or more Races | 224 | 3.9% |
| Some other Race | 143 | 2.5% |
| Total | 5,681 | 100.0% |
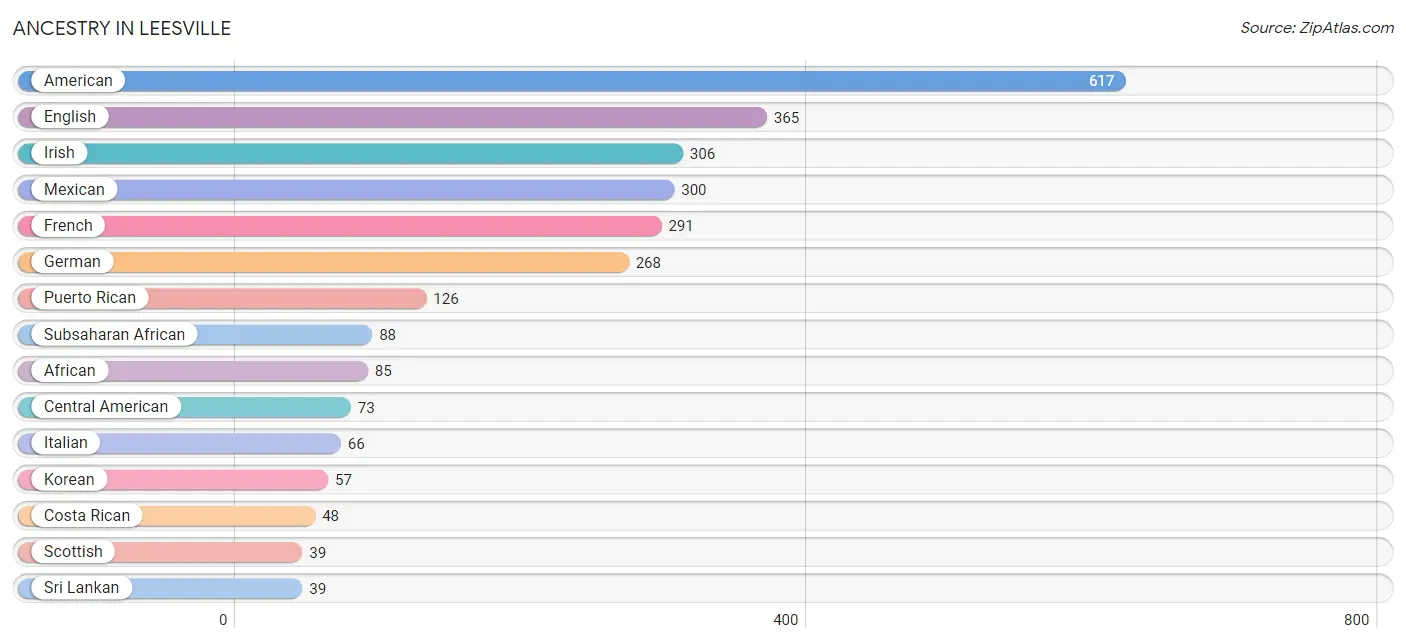
Ancestry in Leesville
The most populous ancestries reported in Leesville are American (617 | 10.9%), English (365 | 6.4%), Irish (306 | 5.4%), Mexican (300 | 5.3%), and French (291 | 5.1%), together accounting for 33.1% of all Leesville residents.
| Ancestry | # Population | % Population |
| African | 85 | 1.5% |
| American | 617 | 10.9% |
| Arab | 17 | 0.3% |
| Assyrian / Chaldean / Syriac | 6 | 0.1% |
| Belgian | 25 | 0.4% |
| Bhutanese | 13 | 0.2% |
| Blackfeet | 2 | 0.0% |
| Brazilian | 7 | 0.1% |
| British | 7 | 0.1% |
| Bulgarian | 7 | 0.1% |
| Burmese | 28 | 0.5% |
| Cajun | 8 | 0.1% |
| Canadian | 1 | 0.0% |
| Central American | 73 | 1.3% |
| Cherokee | 9 | 0.2% |
| Chilean | 12 | 0.2% |
| Choctaw | 22 | 0.4% |
| Colombian | 8 | 0.1% |
| Costa Rican | 48 | 0.8% |
| Crow | 2 | 0.0% |
| Cuban | 10 | 0.2% |
| Dutch | 21 | 0.4% |
| Dutch West Indian | 4 | 0.1% |
| Eastern European | 2 | 0.0% |
| Ecuadorian | 3 | 0.1% |
| English | 365 | 6.4% |
| European | 30 | 0.5% |
| Finnish | 7 | 0.1% |
| French | 291 | 5.1% |
| French Canadian | 19 | 0.3% |
| German | 268 | 4.7% |
| Greek | 6 | 0.1% |
| Guamanian / Chamorro | 1 | 0.0% |
| Haitian | 12 | 0.2% |
| Honduran | 13 | 0.2% |
| Houma | 3 | 0.1% |
| Indian (Asian) | 18 | 0.3% |
| Iranian | 6 | 0.1% |
| Irish | 306 | 5.4% |
| Italian | 66 | 1.2% |
| Jamaican | 5 | 0.1% |
| Korean | 57 | 1.0% |
| Mexican | 300 | 5.3% |
| Moroccan | 10 | 0.2% |
| Native Hawaiian | 9 | 0.2% |
| Navajo | 9 | 0.2% |
| Norwegian | 19 | 0.3% |
| Pakistani | 4 | 0.1% |
| Panamanian | 12 | 0.2% |
| Pennsylvania German | 3 | 0.1% |
| Polish | 30 | 0.5% |
| Portuguese | 2 | 0.0% |
| Puerto Rican | 126 | 2.2% |
| Russian | 8 | 0.1% |
| Scandinavian | 3 | 0.1% |
| Scotch-Irish | 35 | 0.6% |
| Scottish | 39 | 0.7% |
| Sioux | 13 | 0.2% |
| South American | 23 | 0.4% |
| Spaniard | 8 | 0.1% |
| Spanish | 18 | 0.3% |
| Spanish American | 3 | 0.1% |
| Sri Lankan | 39 | 0.7% |
| Subsaharan African | 88 | 1.5% |
| Swedish | 5 | 0.1% |
| Thai | 2 | 0.0% |
| Ukrainian | 4 | 0.1% |
| Welsh | 18 | 0.3% | View All 68 Rows |
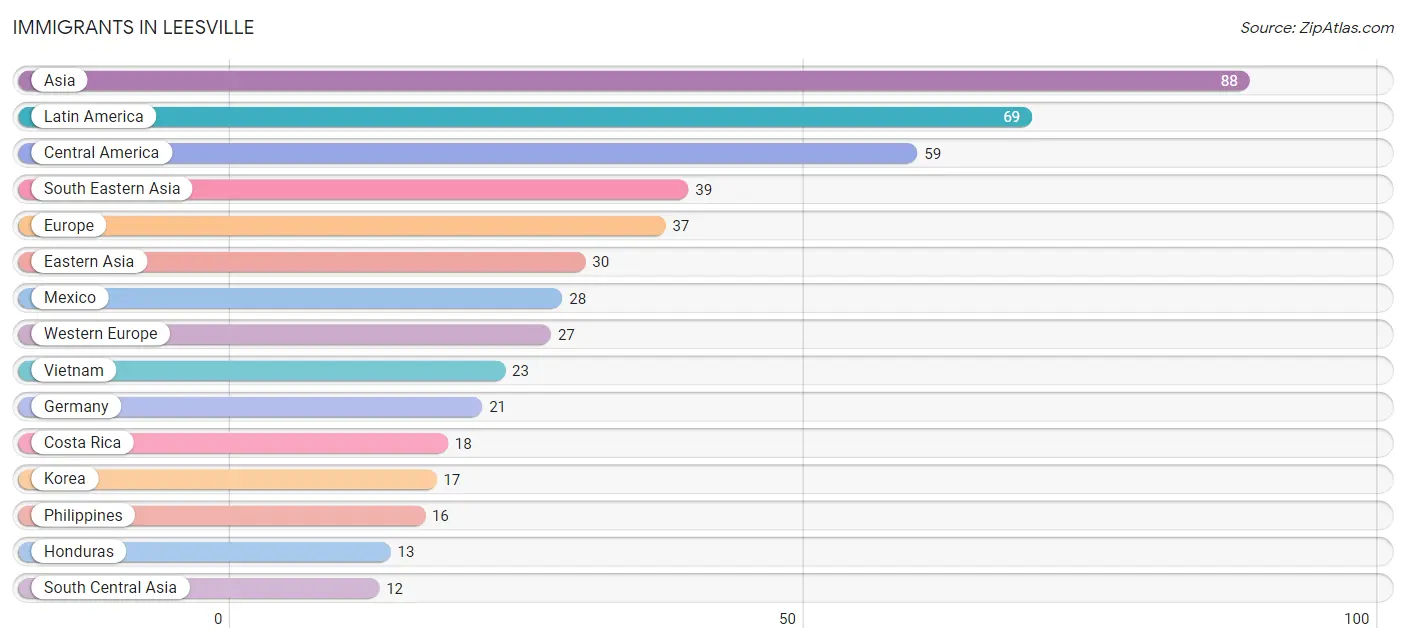
Immigrants in Leesville
The most numerous immigrant groups reported in Leesville came from Asia (88 | 1.5%), Latin America (69 | 1.2%), Central America (59 | 1.0%), South Eastern Asia (39 | 0.7%), and Europe (37 | 0.6%), together accounting for 5.1% of all Leesville residents.
| Immigration Origin | # Population | % Population |
| Africa | 5 | 0.1% |
| Asia | 88 | 1.5% |
| Belgium | 1 | 0.0% |
| Brazil | 7 | 0.1% |
| Bulgaria | 3 | 0.1% |
| Central America | 59 | 1.0% |
| China | 7 | 0.1% |
| Colombia | 3 | 0.1% |
| Costa Rica | 18 | 0.3% |
| Eastern Asia | 30 | 0.5% |
| Eastern Europe | 7 | 0.1% |
| Europe | 37 | 0.6% |
| France | 5 | 0.1% |
| Germany | 21 | 0.4% |
| Honduras | 13 | 0.2% |
| Iran | 3 | 0.1% |
| Iraq | 7 | 0.1% |
| Japan | 6 | 0.1% |
| Korea | 17 | 0.3% |
| Latin America | 69 | 1.2% |
| Mexico | 28 | 0.5% |
| Nepal | 9 | 0.2% |
| Northern Europe | 2 | 0.0% |
| Philippines | 16 | 0.3% |
| Russia | 4 | 0.1% |
| South America | 10 | 0.2% |
| South Central Asia | 12 | 0.2% |
| South Eastern Asia | 39 | 0.7% |
| Southern Europe | 1 | 0.0% |
| Spain | 1 | 0.0% |
| Vietnam | 23 | 0.4% |
| Western Africa | 1 | 0.0% |
| Western Asia | 7 | 0.1% |
| Western Europe | 27 | 0.5% | View All 34 Rows |
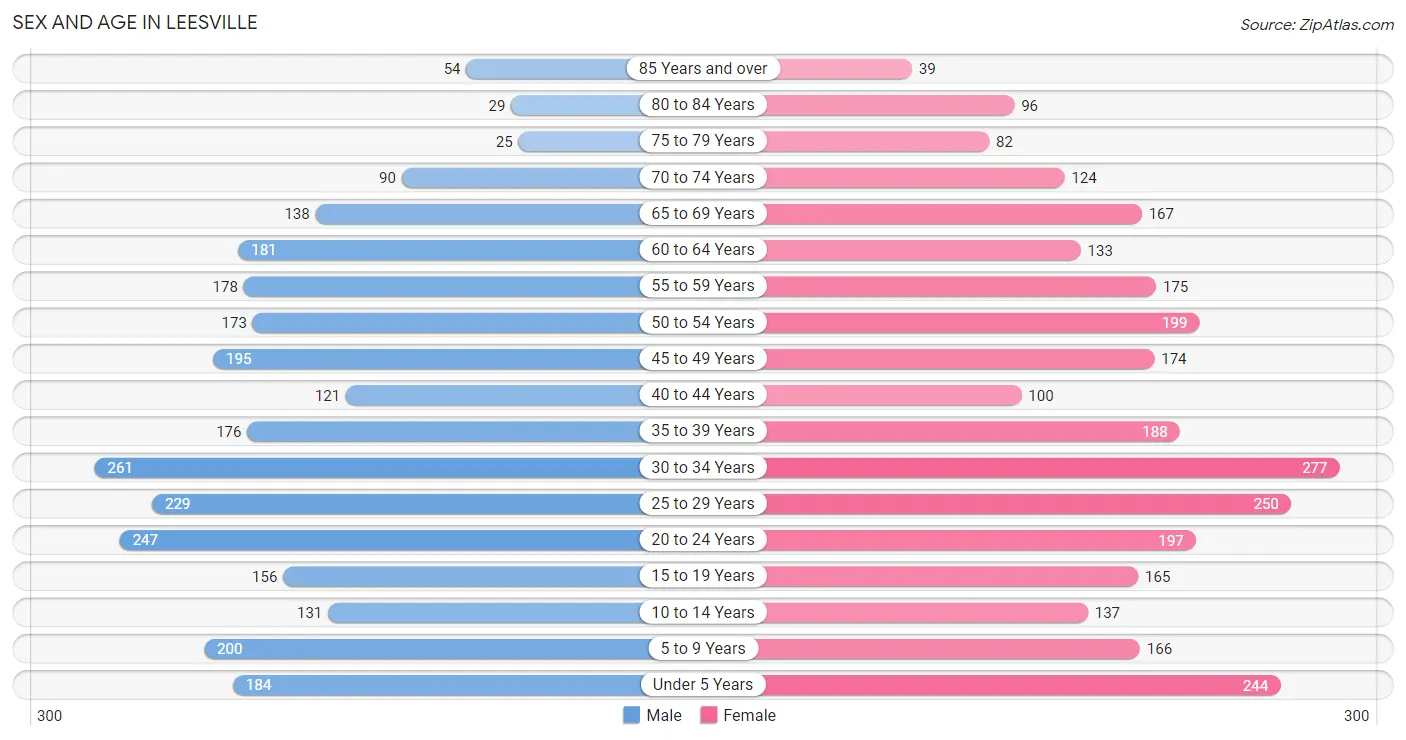
Sex and Age in Leesville
Sex and Age in Leesville
The most populous age groups in Leesville are 30 to 34 Years (261 | 9.4%) for men and 30 to 34 Years (277 | 9.5%) for women.
| Age Bracket | Male | Female |
| Under 5 Years | 184 (6.7%) | 244 (8.4%) |
| 5 to 9 Years | 200 (7.2%) | 166 (5.7%) |
| 10 to 14 Years | 131 (4.7%) | 137 (4.7%) |
| 15 to 19 Years | 156 (5.6%) | 165 (5.7%) |
| 20 to 24 Years | 247 (8.9%) | 197 (6.8%) |
| 25 to 29 Years | 229 (8.3%) | 250 (8.6%) |
| 30 to 34 Years | 261 (9.4%) | 277 (9.5%) |
| 35 to 39 Years | 176 (6.4%) | 188 (6.5%) |
| 40 to 44 Years | 121 (4.4%) | 100 (3.4%) |
| 45 to 49 Years | 195 (7.0%) | 174 (6.0%) |
| 50 to 54 Years | 173 (6.2%) | 199 (6.8%) |
| 55 to 59 Years | 178 (6.4%) | 175 (6.0%) |
| 60 to 64 Years | 181 (6.5%) | 133 (4.6%) |
| 65 to 69 Years | 138 (5.0%) | 167 (5.7%) |
| 70 to 74 Years | 90 (3.3%) | 124 (4.3%) |
| 75 to 79 Years | 25 (0.9%) | 82 (2.8%) |
| 80 to 84 Years | 29 (1.1%) | 96 (3.3%) |
| 85 Years and over | 54 (1.9%) | 39 (1.3%) |
| Total | 2,768 (100.0%) | 2,913 (100.0%) |
Families and Households in Leesville
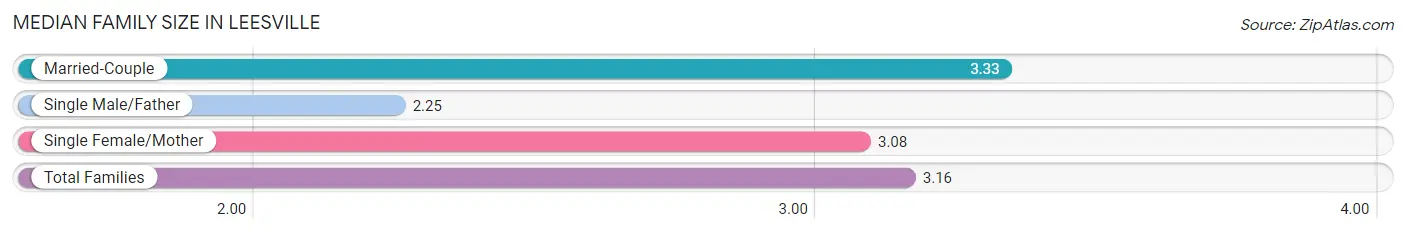
Median Family Size in Leesville
The median family size in Leesville is 3.16 persons per family, with married-couple families (692 | 56.9%) accounting for the largest median family size of 3.33 persons per family. On the other hand, single male/father families (93 | 7.6%) represent the smallest median family size with 2.25 persons per family.
| Family Type | # Families | Family Size |
| Married-Couple | 692 (56.9%) | 3.33 |
| Single Male/Father | 93 (7.6%) | 2.25 |
| Single Female/Mother | 432 (35.5%) | 3.08 |
| Total Families | 1,217 (100.0%) | 3.16 |
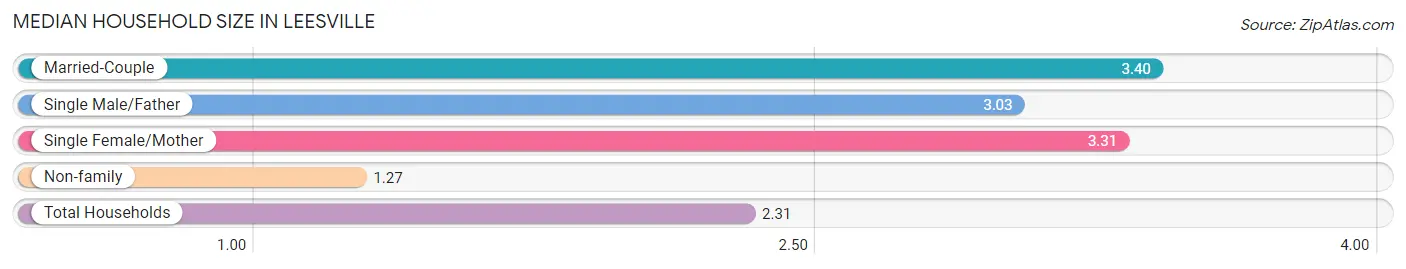
Median Household Size in Leesville
The median household size in Leesville is 2.31 persons per household, with married-couple households (692 | 28.6%) accounting for the largest median household size of 3.4 persons per household. non-family households (1,199 | 49.6%) represent the smallest median household size with 1.27 persons per household.
| Household Type | # Households | Household Size |
| Married-Couple | 692 (28.6%) | 3.40 |
| Single Male/Father | 93 (3.8%) | 3.03 |
| Single Female/Mother | 432 (17.9%) | 3.31 |
| Non-family | 1,199 (49.6%) | 1.27 |
| Total Households | 2,416 (100.0%) | 2.31 |
Household Size by Marriage Status in Leesville
Out of a total of 2,416 households in Leesville, 1,217 (50.4%) are family households, while 1,199 (49.6%) are nonfamily households. The most numerous type of family households are 2-person households, comprising 588, and the most common type of nonfamily households are 1-person households, comprising 1,044.
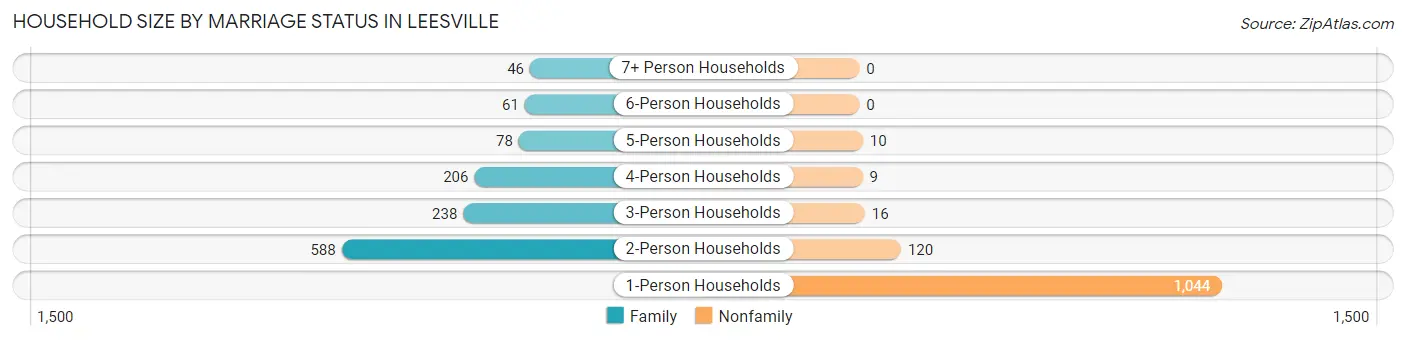
| Household Size | Family Households | Nonfamily Households |
| 1-Person Households | - | 1,044 (43.2%) |
| 2-Person Households | 588 (24.3%) | 120 (5.0%) |
| 3-Person Households | 238 (9.9%) | 16 (0.7%) |
| 4-Person Households | 206 (8.5%) | 9 (0.4%) |
| 5-Person Households | 78 (3.2%) | 10 (0.4%) |
| 6-Person Households | 61 (2.5%) | 0 (0.0%) |
| 7+ Person Households | 46 (1.9%) | 0 (0.0%) |
| Total | 1,217 (50.4%) | 1,199 (49.6%) |
Female Fertility in Leesville
Fertility by Age in Leesville
Average fertility rate in Leesville is 51.0 births per 1,000 women. Women in the age bracket of 20 to 34 years have the highest fertility rate with 76.0 births per 1,000 women. Women in the age bracket of 20 to 34 years acount for 77.5% of all women with births.
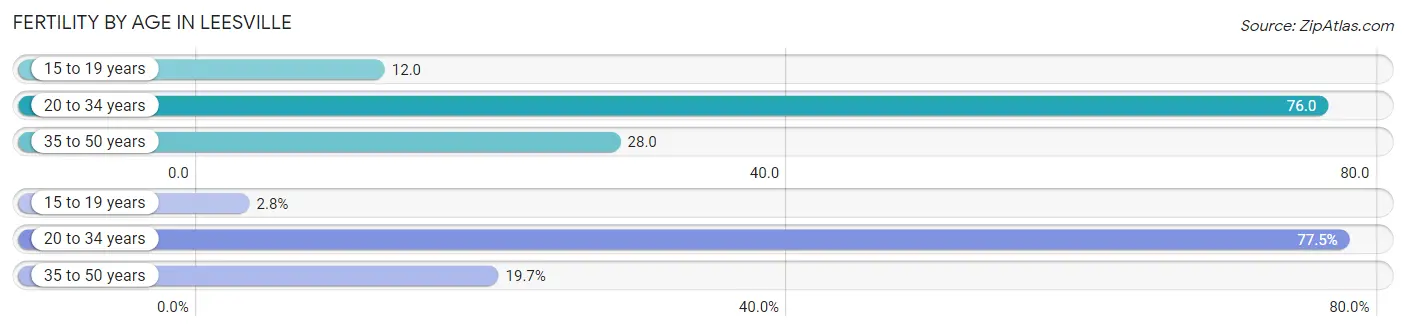
| Age Bracket | Women with Births | Births / 1,000 Women |
| 15 to 19 years | 2 (2.8%) | 12.0 |
| 20 to 34 years | 55 (77.5%) | 76.0 |
| 35 to 50 years | 14 (19.7%) | 28.0 |
| Total | 71 (100.0%) | 51.0 |
Fertility by Age by Marriage Status in Leesville
40.8% of women with births (71) in Leesville are married. The highest percentage of unmarried women with births falls into 20 to 34 years age bracket with 72.7% of them unmarried at the time of birth, while the lowest percentage of unmarried women with births belong to 15 to 19 years age bracket with 0.0% of them unmarried.
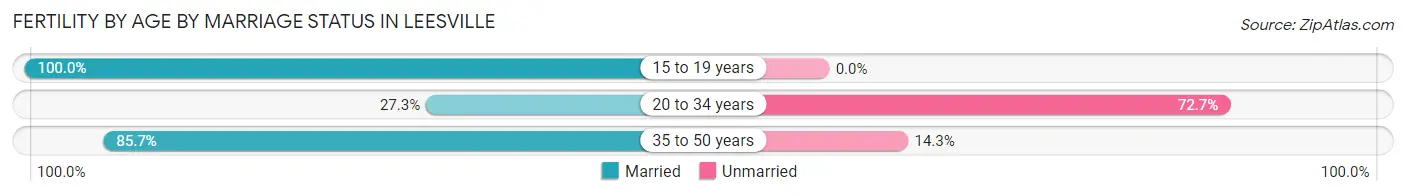
| Age Bracket | Married | Unmarried |
| 15 to 19 years | 2 (100.0%) | 0 (0.0%) |
| 20 to 34 years | 15 (27.3%) | 40 (72.7%) |
| 35 to 50 years | 12 (85.7%) | 2 (14.3%) |
| Total | 29 (40.8%) | 42 (59.2%) |
Fertility by Education in Leesville
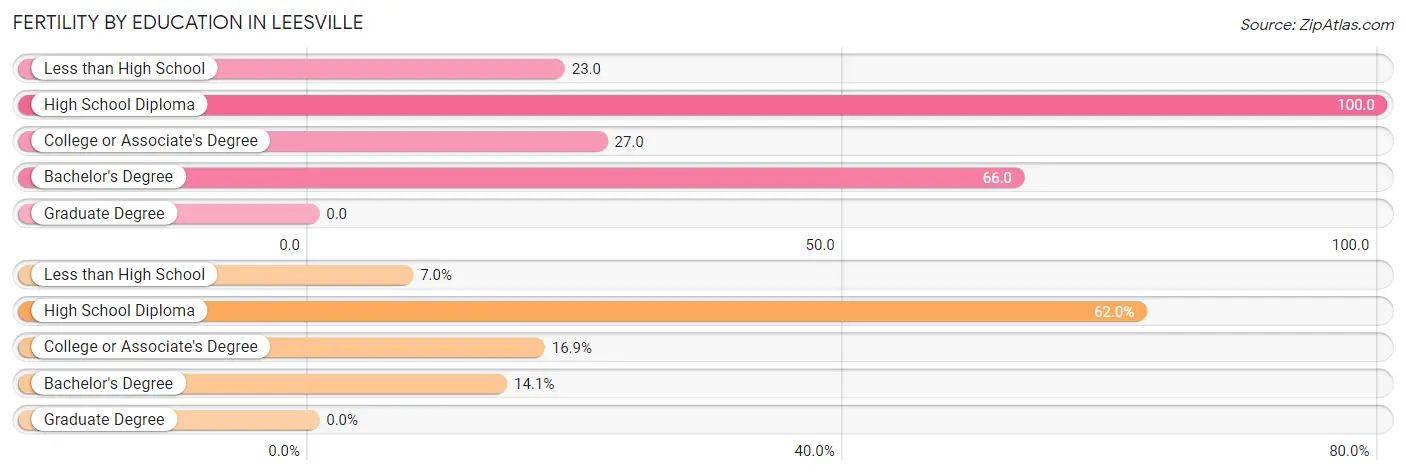
| Educational Attainment | Women with Births | Births / 1,000 Women |
| Less than High School | 5 (7.0%) | 23.0 |
| High School Diploma | 44 (62.0%) | 100.0 |
| College or Associate's Degree | 12 (16.9%) | 27.0 |
| Bachelor's Degree | 10 (14.1%) | 66.0 |
| Graduate Degree | 0 (0.0%) | 0.0 |
| Total | 71 (100.0%) | 51.0 |
Fertility by Education by Marriage Status in Leesville
59.2% of women with births in Leesville are unmarried. Women with the educational attainment of bachelor's degree are most likely to be married with 100.0% of them married at childbirth, while women with the educational attainment of less than high school are least likely to be married with 100.0% of them unmarried at childbirth.
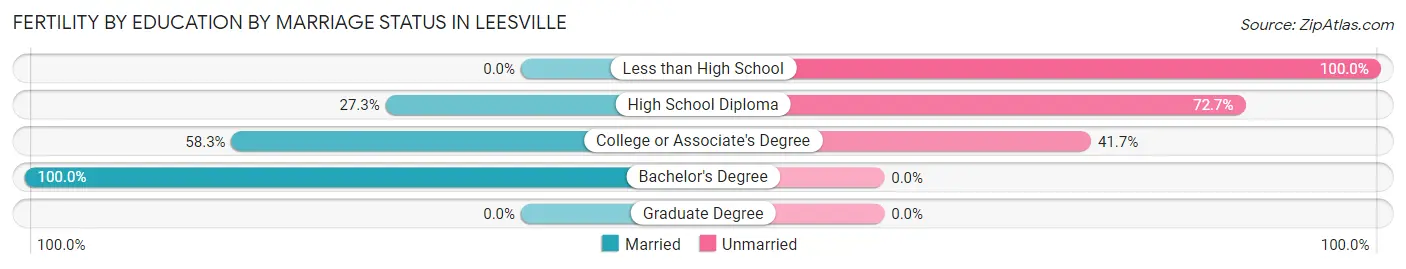
| Educational Attainment | Married | Unmarried |
| Less than High School | 0 (0.0%) | 5 (100.0%) |
| High School Diploma | 12 (27.3%) | 32 (72.7%) |
| College or Associate's Degree | 7 (58.3%) | 5 (41.7%) |
| Bachelor's Degree | 10 (100.0%) | 0 (0.0%) |
| Graduate Degree | 0 (0.0%) | 0 (0.0%) |
| Total | 29 (40.8%) | 42 (59.2%) |
Employment Characteristics in Leesville
Employment by Class of Employer in Leesville
Among the 2,227 employed individuals in Leesville, private company employees (1,239 | 55.6%), federal government employees (465 | 20.9%), and local government employees (237 | 10.6%) make up the most common classes of employment.
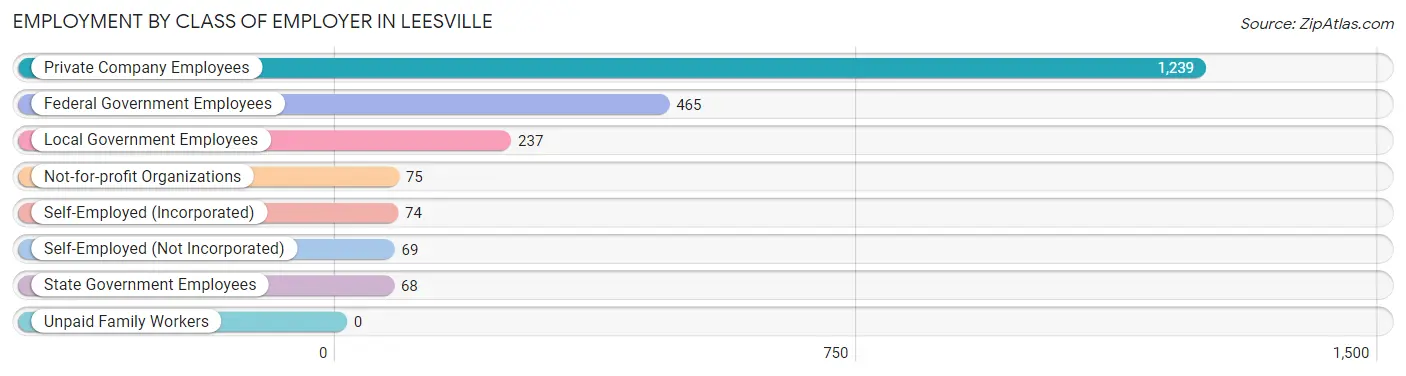
| Employer Class | # Employees | % Employees |
| Private Company Employees | 1,239 | 55.6% |
| Self-Employed (Incorporated) | 74 | 3.3% |
| Self-Employed (Not Incorporated) | 69 | 3.1% |
| Not-for-profit Organizations | 75 | 3.4% |
| Local Government Employees | 237 | 10.6% |
| State Government Employees | 68 | 3.0% |
| Federal Government Employees | 465 | 20.9% |
| Unpaid Family Workers | 0 | 0.0% |
| Total | 2,227 | 100.0% |
Employment Status by Age in Leesville
According to the labor force statistics for Leesville, out of the total population over 16 years of age (4,567), 54.6% or 2,494 individuals are in the labor force, with 9.5% or 237 of them unemployed. The age group with the highest labor force participation rate is 30 to 34 years, with 80.1% or 431 individuals in the labor force. Within the labor force, the 30 to 34 years age range has the highest percentage of unemployed individuals, with 22.4% or 97 of them being unemployed.
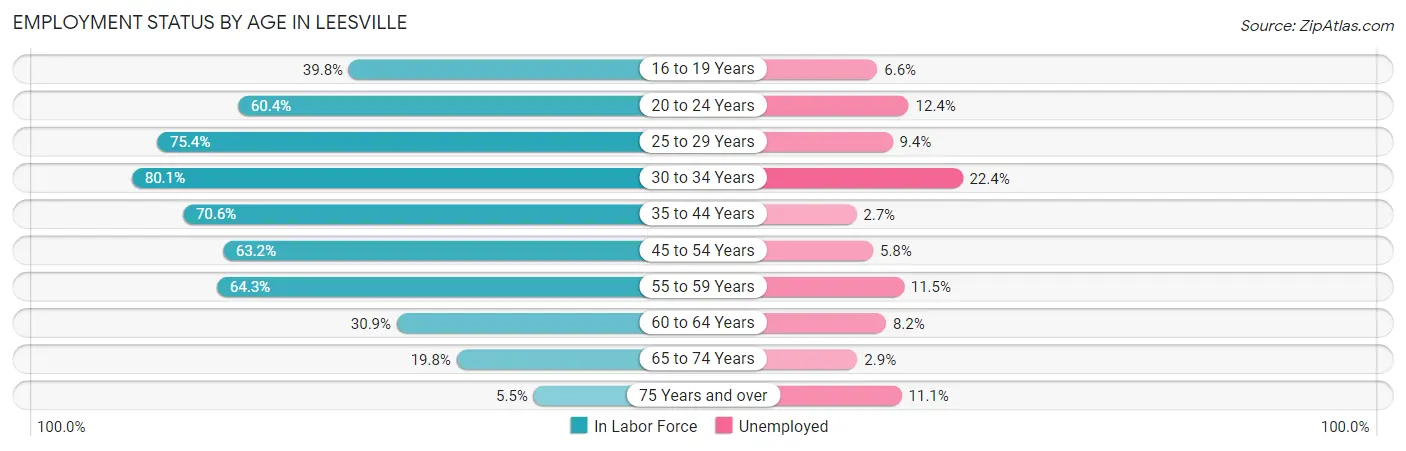
| Age Bracket | In Labor Force | Unemployed |
| 16 to 19 Years | 107 (39.8%) | 7 (6.6%) |
| 20 to 24 Years | 268 (60.4%) | 33 (12.4%) |
| 25 to 29 Years | 361 (75.4%) | 34 (9.4%) |
| 30 to 34 Years | 431 (80.1%) | 97 (22.4%) |
| 35 to 44 Years | 413 (70.6%) | 11 (2.7%) |
| 45 to 54 Years | 468 (63.2%) | 27 (5.8%) |
| 55 to 59 Years | 227 (64.3%) | 26 (11.5%) |
| 60 to 64 Years | 97 (30.9%) | 8 (8.2%) |
| 65 to 74 Years | 103 (19.8%) | 3 (2.9%) |
| 75 Years and over | 18 (5.5%) | 2 (11.1%) |
| Total | 2,494 (54.6%) | 237 (9.5%) |
Employment Status by Educational Attainment in Leesville
According to labor force statistics for Leesville, 66.3% of individuals (1,996) out of the total population between 25 and 64 years of age (3,010) are in the labor force, with 9.6% or 192 of them being unemployed. The group with the highest labor force participation rate are those with the educational attainment of bachelor's degree or higher, with 84.8% or 512 individuals in the labor force. Within the labor force, individuals with less than high school education have the highest percentage of unemployment, with 14.6% or 33 of them being unemployed.
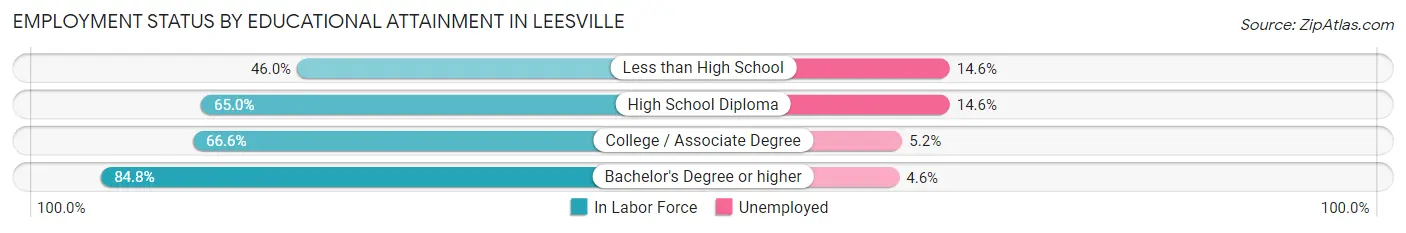
| Educational Attainment | In Labor Force | Unemployed |
| Less than High School | 226 (46.0%) | 72 (14.6%) |
| High School Diploma | 665 (65.0%) | 149 (14.6%) |
| College / Associate Degree | 594 (66.6%) | 46 (5.2%) |
| Bachelor's Degree or higher | 512 (84.8%) | 28 (4.6%) |
| Total | 1,996 (66.3%) | 289 (9.6%) |
Employment Occupations by Sex in Leesville
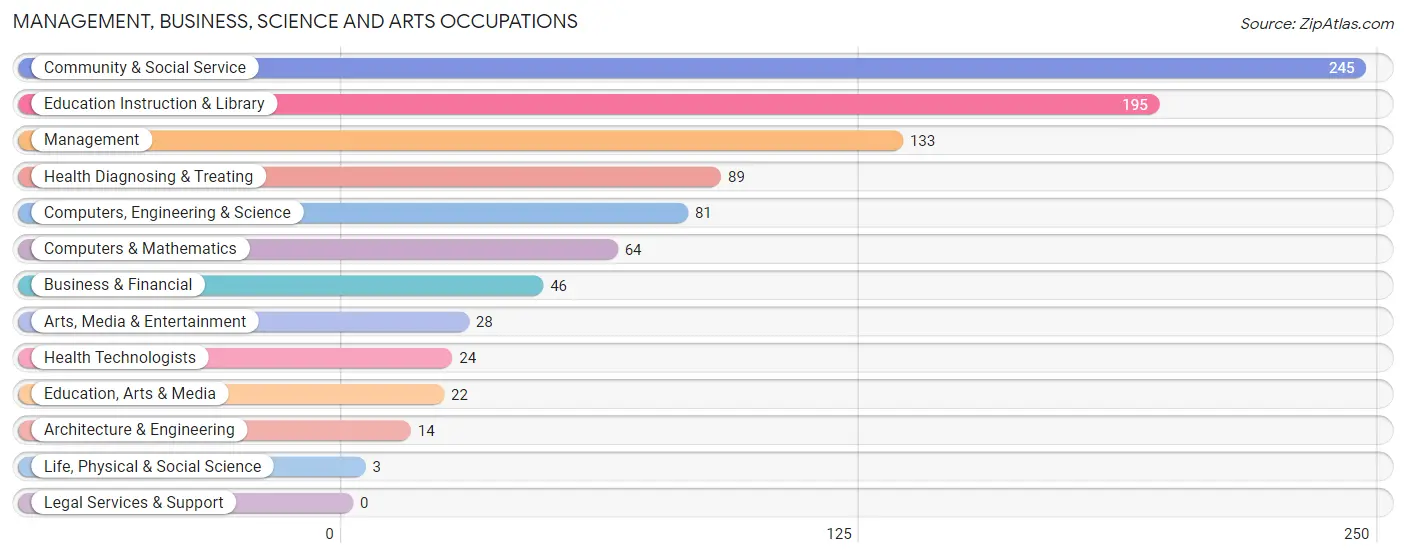
Management, Business, Science and Arts Occupations
The most common Management, Business, Science and Arts occupations in Leesville are Community & Social Service (245 | 12.0%), Education Instruction & Library (195 | 9.6%), Management (133 | 6.5%), Health Diagnosing & Treating (89 | 4.4%), and Computers, Engineering & Science (81 | 4.0%).
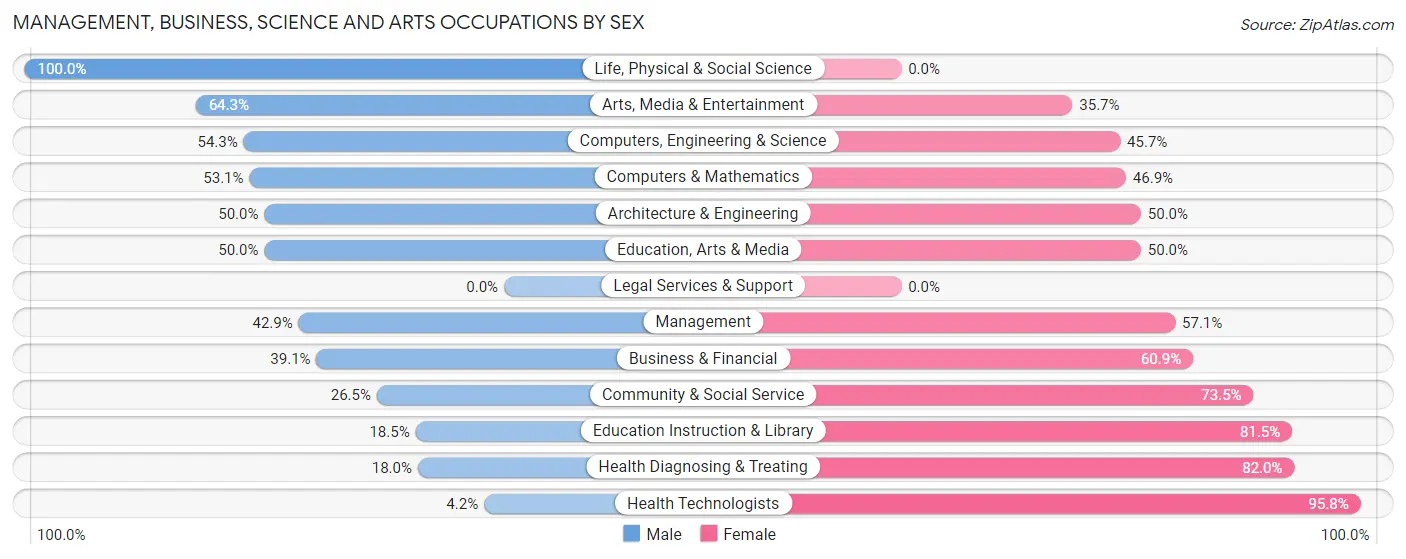
Management, Business, Science and Arts Occupations by Sex
Within the Management, Business, Science and Arts occupations in Leesville, the most male-oriented occupations are Life, Physical & Social Science (100.0%), Arts, Media & Entertainment (64.3%), and Computers, Engineering & Science (54.3%), while the most female-oriented occupations are Health Technologists (95.8%), Health Diagnosing & Treating (82.0%), and Education Instruction & Library (81.5%).
| Occupation | Male | Female |
| Management | 57 (42.9%) | 76 (57.1%) |
| Business & Financial | 18 (39.1%) | 28 (60.9%) |
| Computers, Engineering & Science | 44 (54.3%) | 37 (45.7%) |
| Computers & Mathematics | 34 (53.1%) | 30 (46.9%) |
| Architecture & Engineering | 7 (50.0%) | 7 (50.0%) |
| Life, Physical & Social Science | 3 (100.0%) | 0 (0.0%) |
| Community & Social Service | 65 (26.5%) | 180 (73.5%) |
| Education, Arts & Media | 11 (50.0%) | 11 (50.0%) |
| Legal Services & Support | 0 (0.0%) | 0 (0.0%) |
| Education Instruction & Library | 36 (18.5%) | 159 (81.5%) |
| Arts, Media & Entertainment | 18 (64.3%) | 10 (35.7%) |
| Health Diagnosing & Treating | 16 (18.0%) | 73 (82.0%) |
| Health Technologists | 1 (4.2%) | 23 (95.8%) |
| Total (Category) | 200 (33.7%) | 394 (66.3%) |
| Total (Overall) | 1,014 (49.8%) | 1,023 (50.2%) |
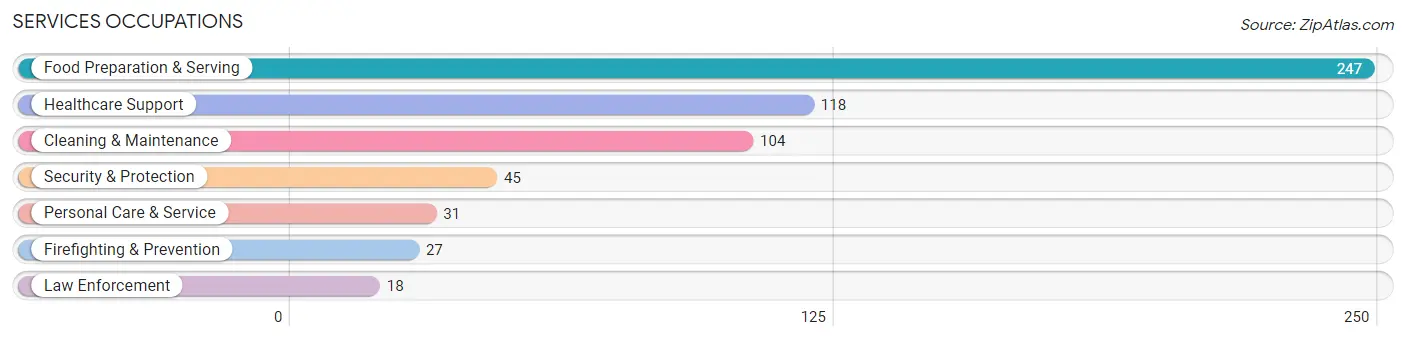
Services Occupations
The most common Services occupations in Leesville are Food Preparation & Serving (247 | 12.1%), Healthcare Support (118 | 5.8%), Cleaning & Maintenance (104 | 5.1%), Security & Protection (45 | 2.2%), and Personal Care & Service (31 | 1.5%).
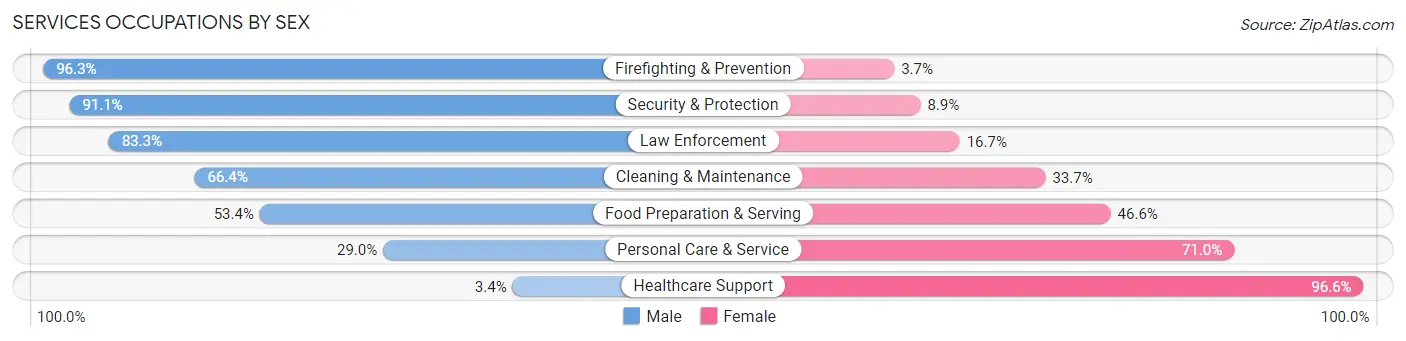
Services Occupations by Sex
Within the Services occupations in Leesville, the most male-oriented occupations are Firefighting & Prevention (96.3%), Security & Protection (91.1%), and Law Enforcement (83.3%), while the most female-oriented occupations are Healthcare Support (96.6%), Personal Care & Service (71.0%), and Food Preparation & Serving (46.6%).
| Occupation | Male | Female |
| Healthcare Support | 4 (3.4%) | 114 (96.6%) |
| Security & Protection | 41 (91.1%) | 4 (8.9%) |
| Firefighting & Prevention | 26 (96.3%) | 1 (3.7%) |
| Law Enforcement | 15 (83.3%) | 3 (16.7%) |
| Food Preparation & Serving | 132 (53.4%) | 115 (46.6%) |
| Cleaning & Maintenance | 69 (66.3%) | 35 (33.7%) |
| Personal Care & Service | 9 (29.0%) | 22 (71.0%) |
| Total (Category) | 255 (46.8%) | 290 (53.2%) |
| Total (Overall) | 1,014 (49.8%) | 1,023 (50.2%) |
Sales and Office Occupations
The most common Sales and Office occupations in Leesville are Office & Administration (263 | 12.9%), and Sales & Related (196 | 9.6%).

Sales and Office Occupations by Sex

| Occupation | Male | Female |
| Sales & Related | 76 (38.8%) | 120 (61.2%) |
| Office & Administration | 90 (34.2%) | 173 (65.8%) |
| Total (Category) | 166 (36.2%) | 293 (63.8%) |
| Total (Overall) | 1,014 (49.8%) | 1,023 (50.2%) |
Natural Resources, Construction and Maintenance Occupations
The most common Natural Resources, Construction and Maintenance occupations in Leesville are Construction & Extraction (103 | 5.1%), Installation, Maintenance & Repair (71 | 3.5%), and Farming, Fishing & Forestry (4 | 0.2%).

Natural Resources, Construction and Maintenance Occupations by Sex

| Occupation | Male | Female |
| Farming, Fishing & Forestry | 4 (100.0%) | 0 (0.0%) |
| Construction & Extraction | 103 (100.0%) | 0 (0.0%) |
| Installation, Maintenance & Repair | 59 (83.1%) | 12 (16.9%) |
| Total (Category) | 166 (93.3%) | 12 (6.7%) |
| Total (Overall) | 1,014 (49.8%) | 1,023 (50.2%) |
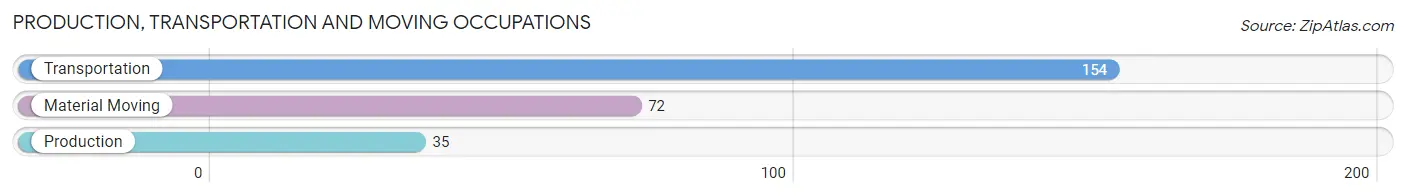
Production, Transportation and Moving Occupations
The most common Production, Transportation and Moving occupations in Leesville are Transportation (154 | 7.6%), Material Moving (72 | 3.5%), and Production (35 | 1.7%).
Production, Transportation and Moving Occupations by Sex
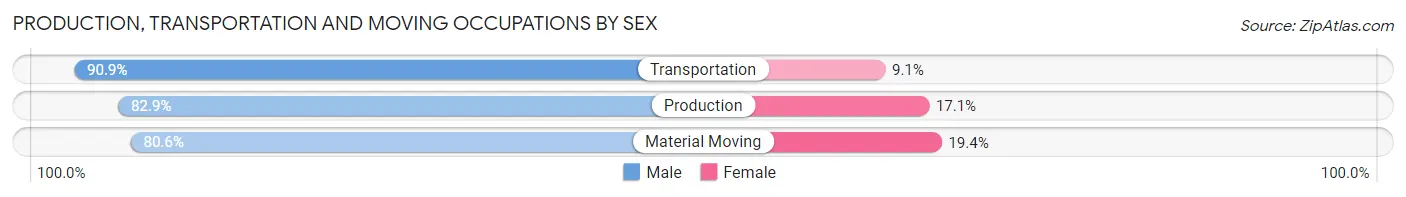
| Occupation | Male | Female |
| Production | 29 (82.9%) | 6 (17.1%) |
| Transportation | 140 (90.9%) | 14 (9.1%) |
| Material Moving | 58 (80.6%) | 14 (19.4%) |
| Total (Category) | 227 (87.0%) | 34 (13.0%) |
| Total (Overall) | 1,014 (49.8%) | 1,023 (50.2%) |
Employment Industries by Sex in Leesville
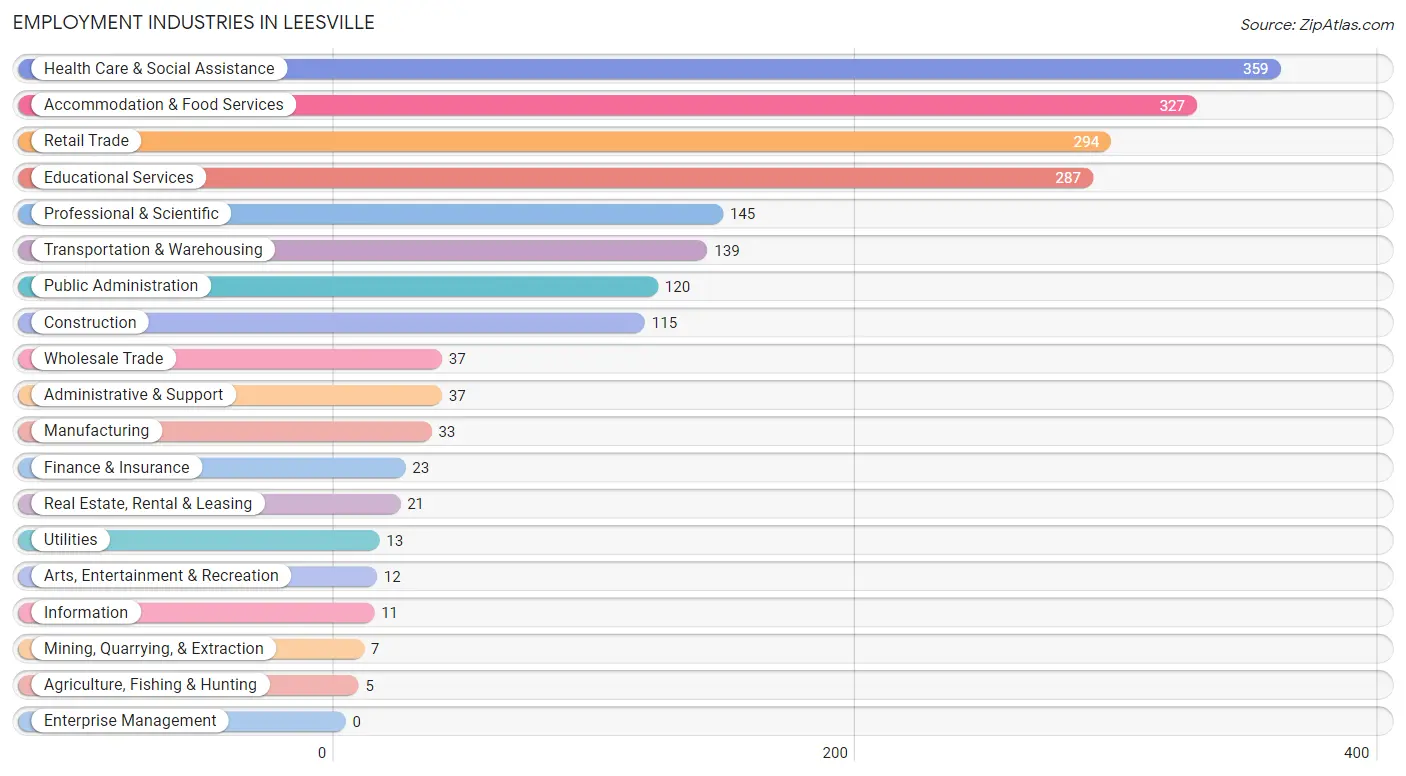
Employment Industries in Leesville
The major employment industries in Leesville include Health Care & Social Assistance (359 | 17.6%), Accommodation & Food Services (327 | 16.1%), Retail Trade (294 | 14.4%), Educational Services (287 | 14.1%), and Professional & Scientific (145 | 7.1%).
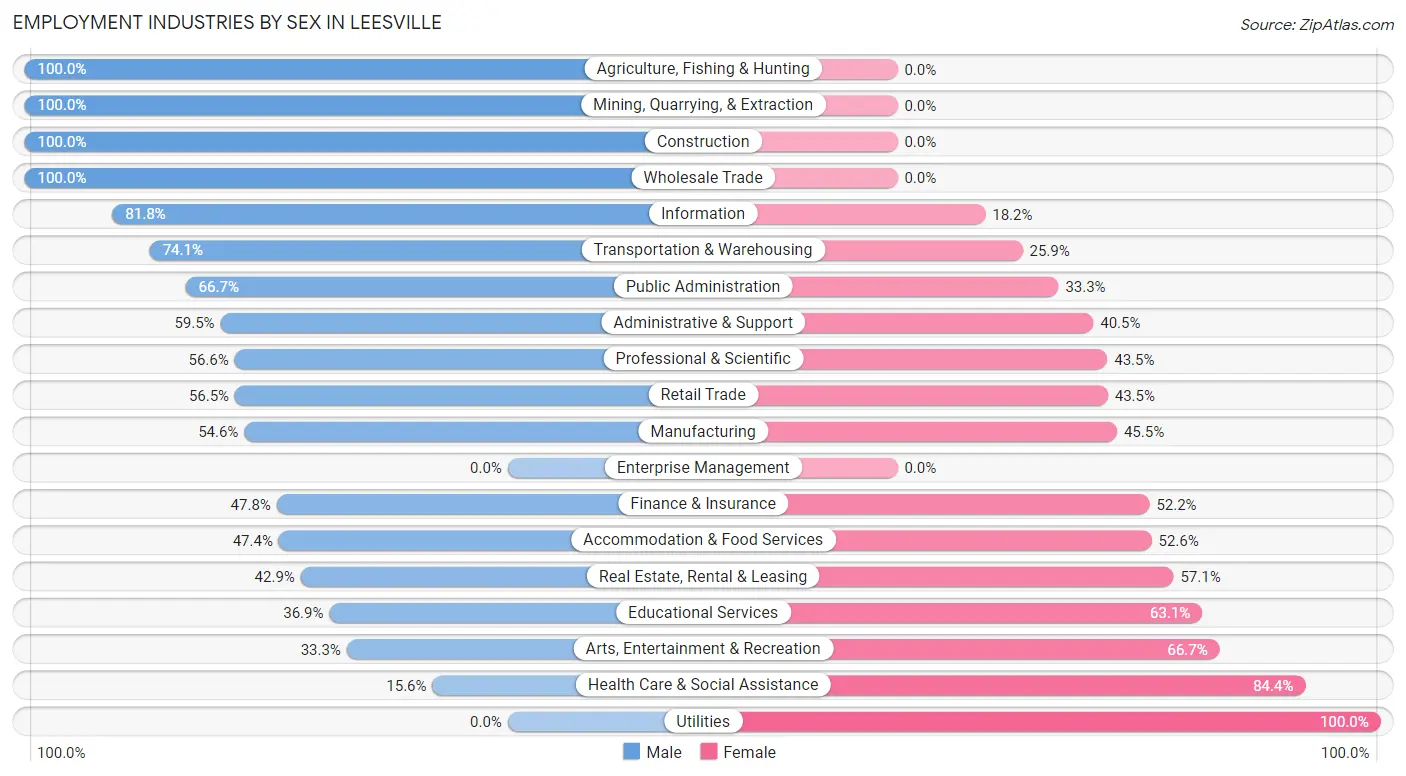
Employment Industries by Sex in Leesville
The Leesville industries that see more men than women are Agriculture, Fishing & Hunting (100.0%), Mining, Quarrying, & Extraction (100.0%), and Construction (100.0%), whereas the industries that tend to have a higher number of women are Utilities (100.0%), Health Care & Social Assistance (84.4%), and Arts, Entertainment & Recreation (66.7%).
| Industry | Male | Female |
| Agriculture, Fishing & Hunting | 5 (100.0%) | 0 (0.0%) |
| Mining, Quarrying, & Extraction | 7 (100.0%) | 0 (0.0%) |
| Construction | 115 (100.0%) | 0 (0.0%) |
| Manufacturing | 18 (54.5%) | 15 (45.5%) |
| Wholesale Trade | 37 (100.0%) | 0 (0.0%) |
| Retail Trade | 166 (56.5%) | 128 (43.5%) |
| Transportation & Warehousing | 103 (74.1%) | 36 (25.9%) |
| Utilities | 0 (0.0%) | 13 (100.0%) |
| Information | 9 (81.8%) | 2 (18.2%) |
| Finance & Insurance | 11 (47.8%) | 12 (52.2%) |
| Real Estate, Rental & Leasing | 9 (42.9%) | 12 (57.1%) |
| Professional & Scientific | 82 (56.6%) | 63 (43.4%) |
| Enterprise Management | 0 (0.0%) | 0 (0.0%) |
| Administrative & Support | 22 (59.5%) | 15 (40.5%) |
| Educational Services | 106 (36.9%) | 181 (63.1%) |
| Health Care & Social Assistance | 56 (15.6%) | 303 (84.4%) |
| Arts, Entertainment & Recreation | 4 (33.3%) | 8 (66.7%) |
| Accommodation & Food Services | 155 (47.4%) | 172 (52.6%) |
| Public Administration | 80 (66.7%) | 40 (33.3%) |
| Total | 1,014 (49.8%) | 1,023 (50.2%) |
Education in Leesville
School Enrollment in Leesville
The most common levels of schooling among the 1,109 students in Leesville are high school (275 | 24.8%), elementary school (269 | 24.3%), and college / undergraduate (210 | 18.9%).
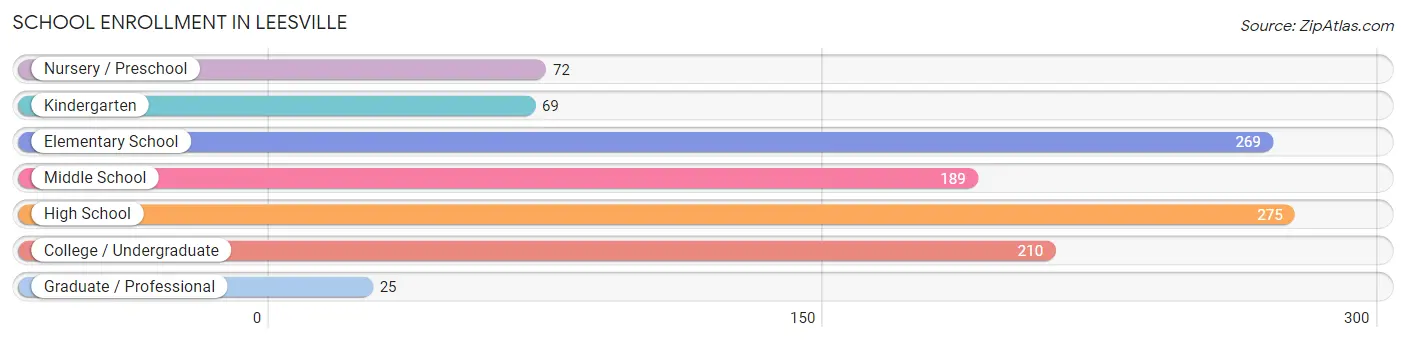
| School Level | # Students | % Students |
| Nursery / Preschool | 72 | 6.5% |
| Kindergarten | 69 | 6.2% |
| Elementary School | 269 | 24.3% |
| Middle School | 189 | 17.0% |
| High School | 275 | 24.8% |
| College / Undergraduate | 210 | 18.9% |
| Graduate / Professional | 25 | 2.2% |
| Total | 1,109 | 100.0% |
School Enrollment by Age by Funding Source in Leesville
Out of a total of 1,109 students who are enrolled in schools in Leesville, 150 (13.5%) attend a private institution, while the remaining 959 (86.5%) are enrolled in public schools. The age group of 25 to 34 year olds has the highest likelihood of being enrolled in private schools, with 28 (23.5% in the age bracket) enrolled. Conversely, the age group of 3 to 4 year olds has the lowest likelihood of being enrolled in a private school, with 56 (96.6% in the age bracket) attending a public institution.
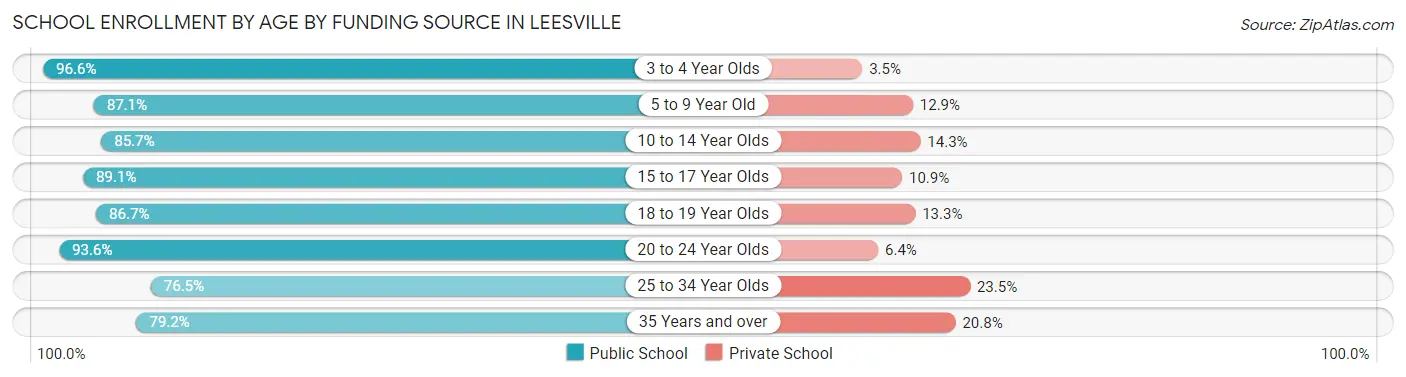
| Age Bracket | Public School | Private School |
| 3 to 4 Year Olds | 56 (96.6%) | 2 (3.5%) |
| 5 to 9 Year Old | 277 (87.1%) | 41 (12.9%) |
| 10 to 14 Year Olds | 228 (85.7%) | 38 (14.3%) |
| 15 to 17 Year Olds | 131 (89.1%) | 16 (10.9%) |
| 18 to 19 Year Olds | 65 (86.7%) | 10 (13.3%) |
| 20 to 24 Year Olds | 73 (93.6%) | 5 (6.4%) |
| 25 to 34 Year Olds | 91 (76.5%) | 28 (23.5%) |
| 35 Years and over | 38 (79.2%) | 10 (20.8%) |
| Total | 959 (86.5%) | 150 (13.5%) |
Educational Attainment by Field of Study in Leesville
Education (206 | 23.1%), arts & humanities (148 | 16.6%), business (138 | 15.5%), liberal arts & history (76 | 8.5%), and computers & mathematics (68 | 7.6%) are the most common fields of study among 891 individuals in Leesville who have obtained a bachelor's degree or higher.
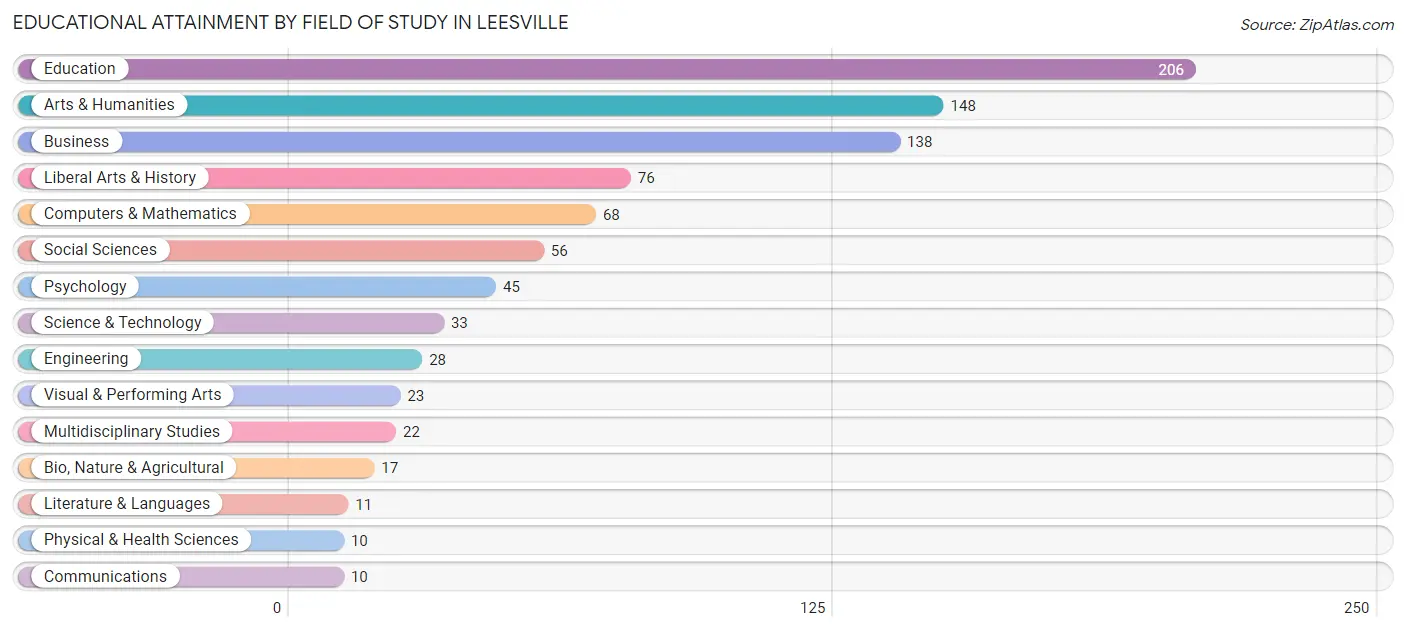
| Field of Study | # Graduates | % Graduates |
| Computers & Mathematics | 68 | 7.6% |
| Bio, Nature & Agricultural | 17 | 1.9% |
| Physical & Health Sciences | 10 | 1.1% |
| Psychology | 45 | 5.1% |
| Social Sciences | 56 | 6.3% |
| Engineering | 28 | 3.1% |
| Multidisciplinary Studies | 22 | 2.5% |
| Science & Technology | 33 | 3.7% |
| Business | 138 | 15.5% |
| Education | 206 | 23.1% |
| Literature & Languages | 11 | 1.2% |
| Liberal Arts & History | 76 | 8.5% |
| Visual & Performing Arts | 23 | 2.6% |
| Communications | 10 | 1.1% |
| Arts & Humanities | 148 | 16.6% |
| Total | 891 | 100.0% |
Transportation & Commute in Leesville
Vehicle Availability by Sex in Leesville
The most prevalent vehicle ownership categories in Leesville are males with 2 vehicles (463, accounting for 39.3%) and females with 2 vehicles (208, making up 44.2%).
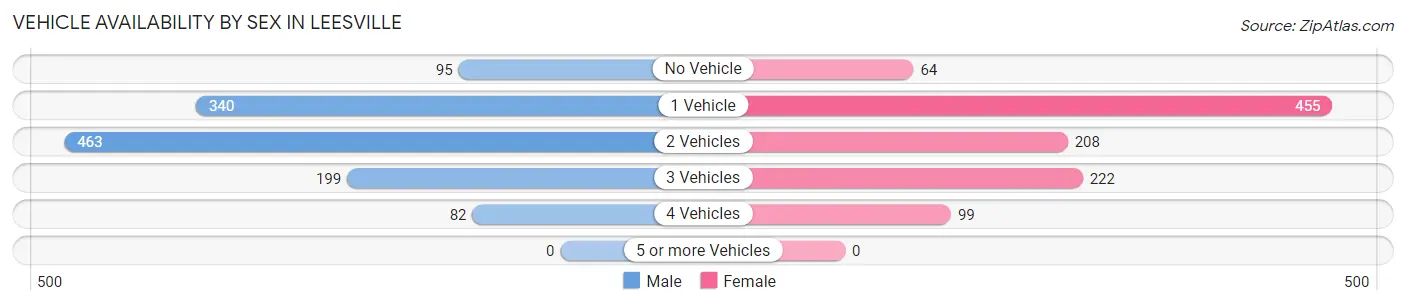
| Vehicles Available | Male | Female |
| No Vehicle | 95 (8.1%) | 64 (6.1%) |
| 1 Vehicle | 340 (28.8%) | 455 (43.4%) |
| 2 Vehicles | 463 (39.3%) | 208 (19.9%) |
| 3 Vehicles | 199 (16.9%) | 222 (21.2%) |
| 4 Vehicles | 82 (7.0%) | 99 (9.5%) |
| 5 or more Vehicles | 0 (0.0%) | 0 (0.0%) |
| Total | 1,179 (100.0%) | 1,048 (100.0%) |
Commute Time in Leesville
The most frequently occuring commute durations in Leesville are 15 to 19 minutes (649 commuters, 29.8%), 5 to 9 minutes (364 commuters, 16.7%), and 10 to 14 minutes (284 commuters, 13.1%).
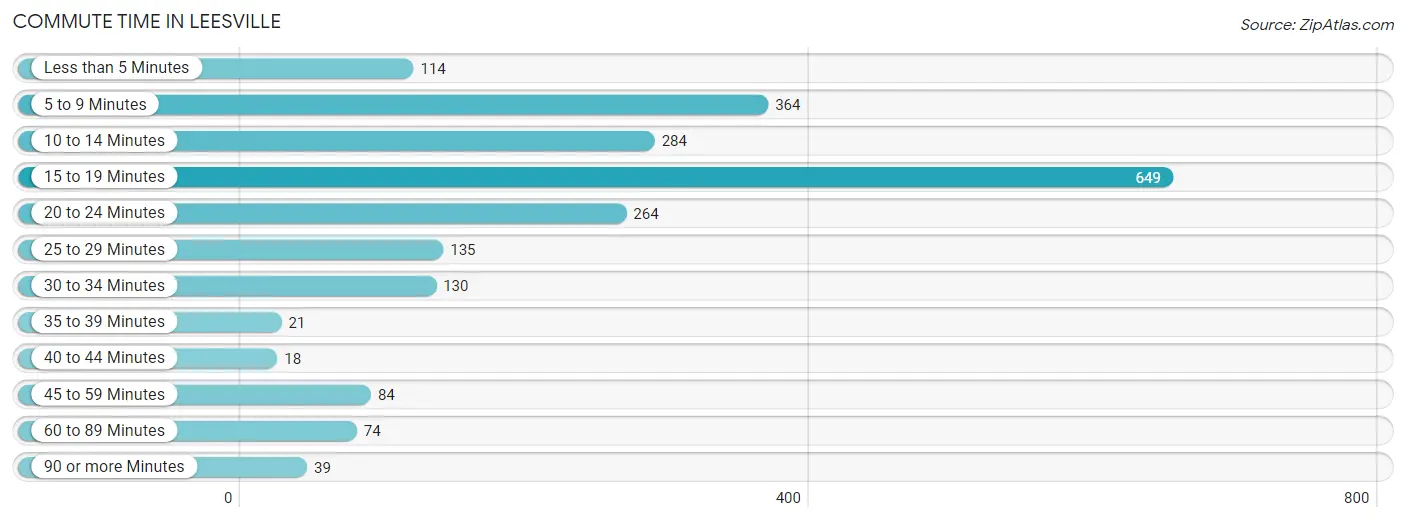
| Commute Time | # Commuters | % Commuters |
| Less than 5 Minutes | 114 | 5.2% |
| 5 to 9 Minutes | 364 | 16.7% |
| 10 to 14 Minutes | 284 | 13.1% |
| 15 to 19 Minutes | 649 | 29.8% |
| 20 to 24 Minutes | 264 | 12.1% |
| 25 to 29 Minutes | 135 | 6.2% |
| 30 to 34 Minutes | 130 | 6.0% |
| 35 to 39 Minutes | 21 | 1.0% |
| 40 to 44 Minutes | 18 | 0.8% |
| 45 to 59 Minutes | 84 | 3.9% |
| 60 to 89 Minutes | 74 | 3.4% |
| 90 or more Minutes | 39 | 1.8% |
Commute Time by Sex in Leesville
The most common commute times in Leesville are 15 to 19 minutes (357 commuters, 30.9%) for males and 15 to 19 minutes (292 commuters, 28.7%) for females.
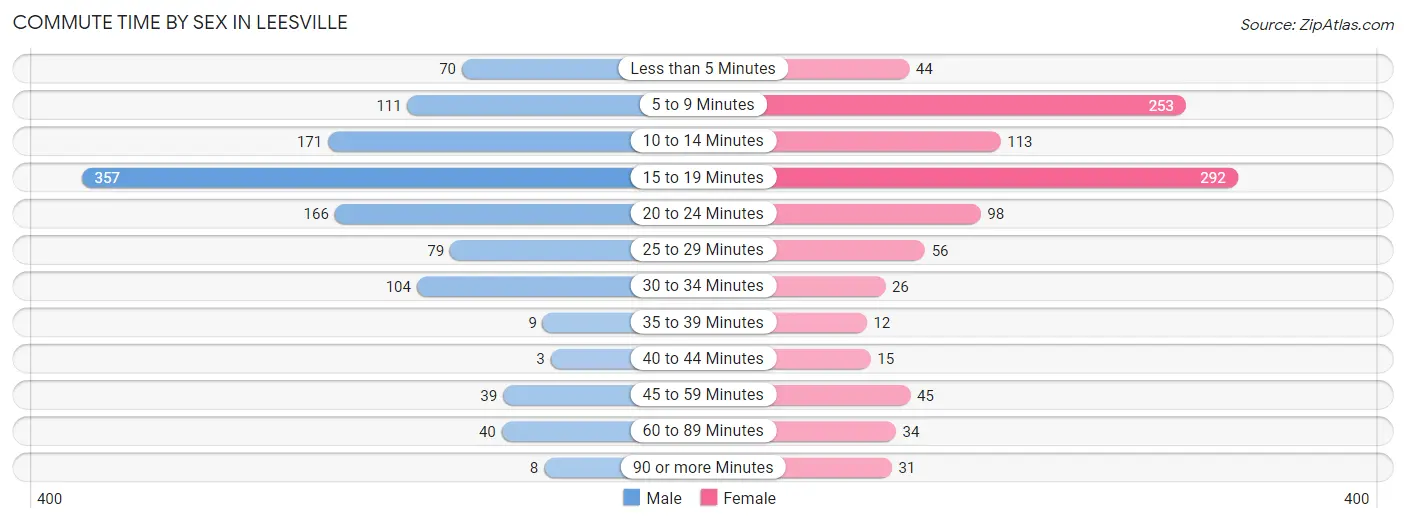
| Commute Time | Male | Female |
| Less than 5 Minutes | 70 (6.0%) | 44 (4.3%) |
| 5 to 9 Minutes | 111 (9.6%) | 253 (24.8%) |
| 10 to 14 Minutes | 171 (14.8%) | 113 (11.1%) |
| 15 to 19 Minutes | 357 (30.9%) | 292 (28.7%) |
| 20 to 24 Minutes | 166 (14.3%) | 98 (9.6%) |
| 25 to 29 Minutes | 79 (6.8%) | 56 (5.5%) |
| 30 to 34 Minutes | 104 (9.0%) | 26 (2.5%) |
| 35 to 39 Minutes | 9 (0.8%) | 12 (1.2%) |
| 40 to 44 Minutes | 3 (0.3%) | 15 (1.5%) |
| 45 to 59 Minutes | 39 (3.4%) | 45 (4.4%) |
| 60 to 89 Minutes | 40 (3.5%) | 34 (3.3%) |
| 90 or more Minutes | 8 (0.7%) | 31 (3.0%) |
Time of Departure to Work by Sex in Leesville
The most frequent times of departure to work in Leesville are 6:00 AM to 6:29 AM (246, 21.3%) for males and 7:00 AM to 7:29 AM (182, 17.9%) for females.
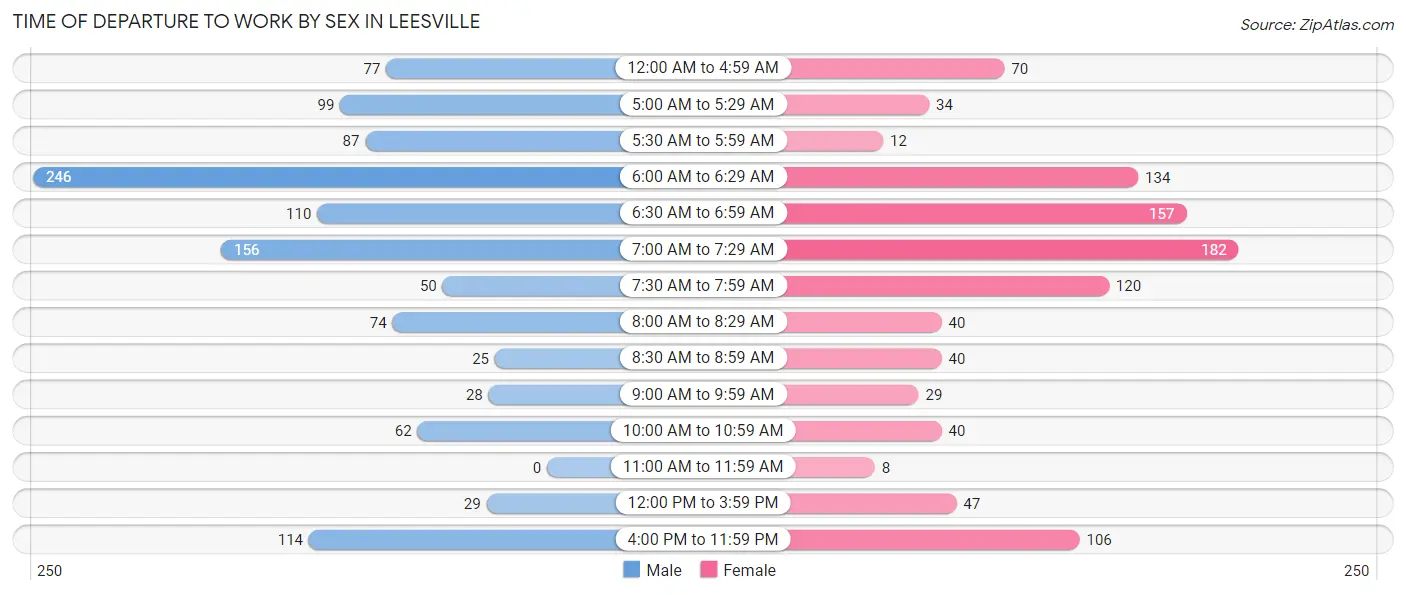
| Time of Departure | Male | Female |
| 12:00 AM to 4:59 AM | 77 (6.7%) | 70 (6.9%) |
| 5:00 AM to 5:29 AM | 99 (8.6%) | 34 (3.3%) |
| 5:30 AM to 5:59 AM | 87 (7.5%) | 12 (1.2%) |
| 6:00 AM to 6:29 AM | 246 (21.3%) | 134 (13.2%) |
| 6:30 AM to 6:59 AM | 110 (9.5%) | 157 (15.4%) |
| 7:00 AM to 7:29 AM | 156 (13.5%) | 182 (17.9%) |
| 7:30 AM to 7:59 AM | 50 (4.3%) | 120 (11.8%) |
| 8:00 AM to 8:29 AM | 74 (6.4%) | 40 (3.9%) |
| 8:30 AM to 8:59 AM | 25 (2.2%) | 40 (3.9%) |
| 9:00 AM to 9:59 AM | 28 (2.4%) | 29 (2.9%) |
| 10:00 AM to 10:59 AM | 62 (5.4%) | 40 (3.9%) |
| 11:00 AM to 11:59 AM | 0 (0.0%) | 8 (0.8%) |
| 12:00 PM to 3:59 PM | 29 (2.5%) | 47 (4.6%) |
| 4:00 PM to 11:59 PM | 114 (9.9%) | 106 (10.4%) |
| Total | 1,157 (100.0%) | 1,019 (100.0%) |
Housing Occupancy in Leesville
Occupancy by Ownership in Leesville
Of the total 2,416 dwellings in Leesville, owner-occupied units account for 1,032 (42.7%), while renter-occupied units make up 1,384 (57.3%).
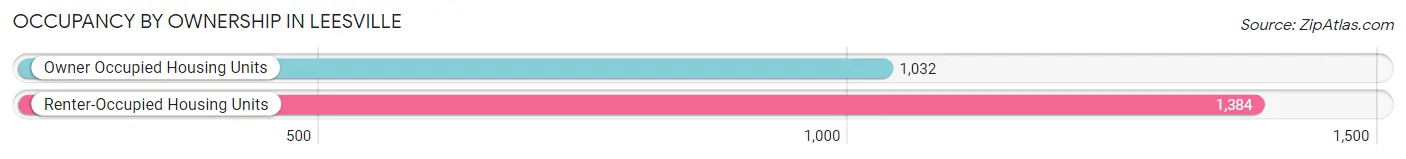
| Occupancy | # Housing Units | % Housing Units |
| Owner Occupied Housing Units | 1,032 | 42.7% |
| Renter-Occupied Housing Units | 1,384 | 57.3% |
| Total Occupied Housing Units | 2,416 | 100.0% |
Occupancy by Household Size in Leesville
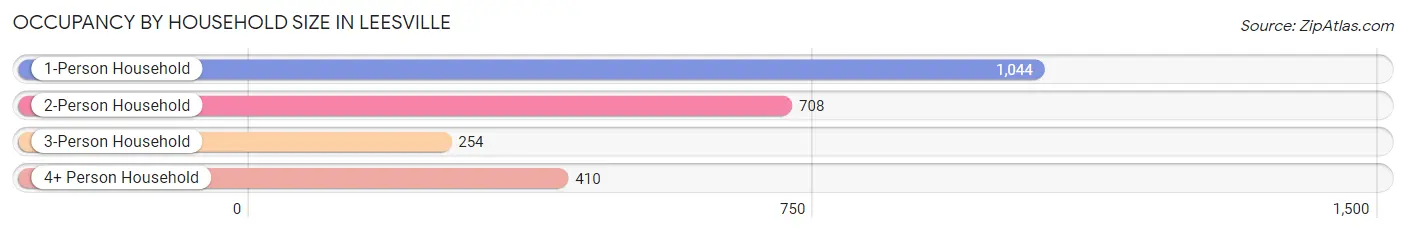
| Household Size | # Housing Units | % Housing Units |
| 1-Person Household | 1,044 | 43.2% |
| 2-Person Household | 708 | 29.3% |
| 3-Person Household | 254 | 10.5% |
| 4+ Person Household | 410 | 17.0% |
| Total Housing Units | 2,416 | 100.0% |
Occupancy by Ownership by Household Size in Leesville
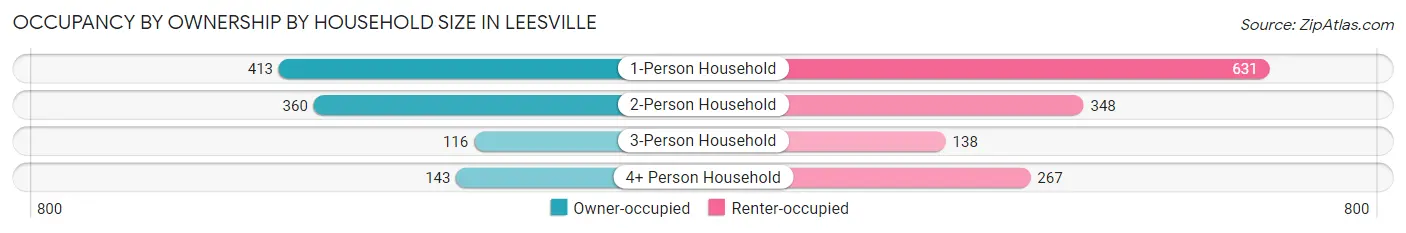
| Household Size | Owner-occupied | Renter-occupied |
| 1-Person Household | 413 (39.6%) | 631 (60.4%) |
| 2-Person Household | 360 (50.8%) | 348 (49.1%) |
| 3-Person Household | 116 (45.7%) | 138 (54.3%) |
| 4+ Person Household | 143 (34.9%) | 267 (65.1%) |
| Total Housing Units | 1,032 (42.7%) | 1,384 (57.3%) |
Occupancy by Educational Attainment in Leesville
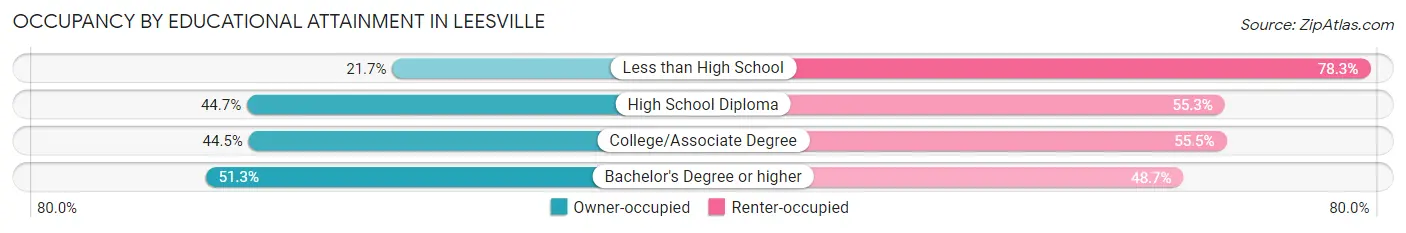
| Household Size | Owner-occupied | Renter-occupied |
| Less than High School | 75 (21.7%) | 271 (78.3%) |
| High School Diploma | 365 (44.7%) | 451 (55.3%) |
| College/Associate Degree | 333 (44.5%) | 416 (55.5%) |
| Bachelor's Degree or higher | 259 (51.3%) | 246 (48.7%) |
Occupancy by Age of Householder in Leesville
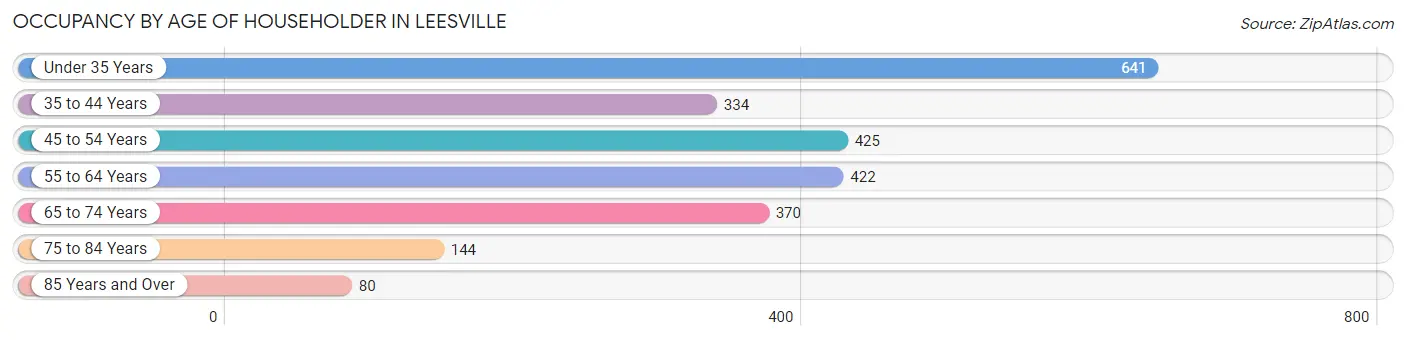
| Age Bracket | # Households | % Households |
| Under 35 Years | 641 | 26.5% |
| 35 to 44 Years | 334 | 13.8% |
| 45 to 54 Years | 425 | 17.6% |
| 55 to 64 Years | 422 | 17.5% |
| 65 to 74 Years | 370 | 15.3% |
| 75 to 84 Years | 144 | 6.0% |
| 85 Years and Over | 80 | 3.3% |
| Total | 2,416 | 100.0% |
Housing Finances in Leesville
Median Income by Occupancy in Leesville
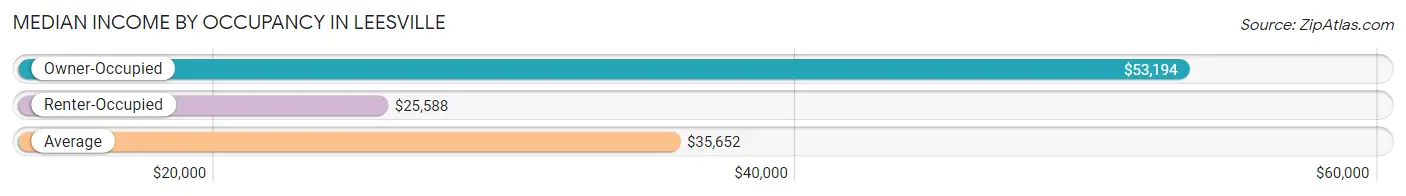
| Occupancy Type | # Households | Median Income |
| Owner-Occupied | 1,032 (42.7%) | $53,194 |
| Renter-Occupied | 1,384 (57.3%) | $25,588 |
| Average | 2,416 (100.0%) | $35,652 |
Occupancy by Householder Income Bracket in Leesville
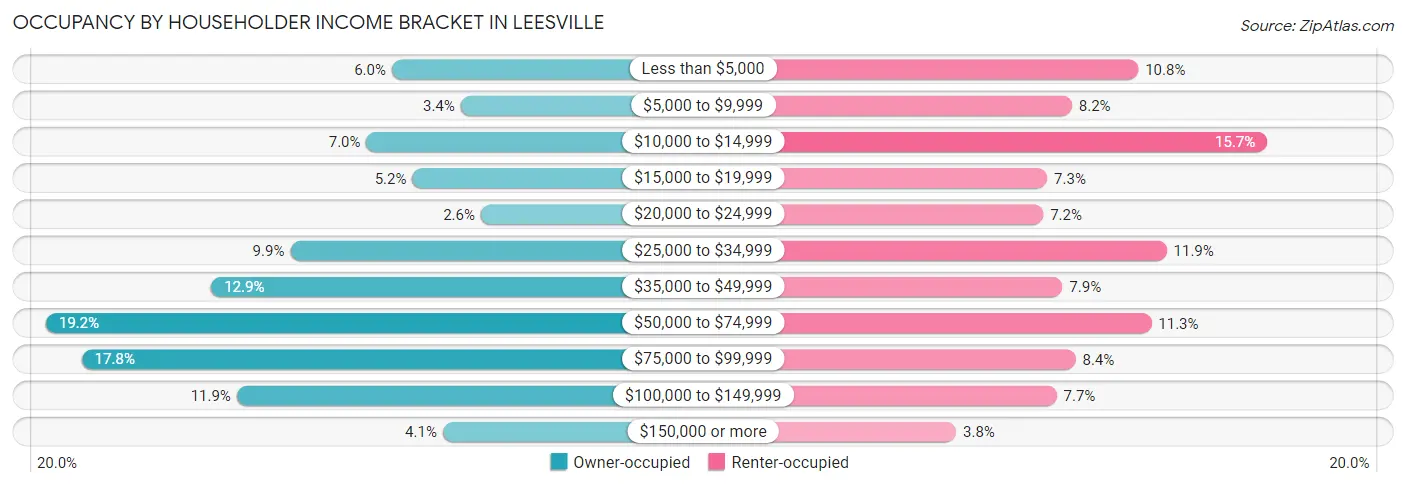
| Income Bracket | Owner-occupied | Renter-occupied |
| Less than $5,000 | 62 (6.0%) | 149 (10.8%) |
| $5,000 to $9,999 | 35 (3.4%) | 114 (8.2%) |
| $10,000 to $14,999 | 72 (7.0%) | 217 (15.7%) |
| $15,000 to $19,999 | 54 (5.2%) | 101 (7.3%) |
| $20,000 to $24,999 | 27 (2.6%) | 99 (7.1%) |
| $25,000 to $34,999 | 102 (9.9%) | 164 (11.8%) |
| $35,000 to $49,999 | 133 (12.9%) | 109 (7.9%) |
| $50,000 to $74,999 | 198 (19.2%) | 156 (11.3%) |
| $75,000 to $99,999 | 184 (17.8%) | 116 (8.4%) |
| $100,000 to $149,999 | 123 (11.9%) | 106 (7.7%) |
| $150,000 or more | 42 (4.1%) | 53 (3.8%) |
| Total | 1,032 (100.0%) | 1,384 (100.0%) |
Monthly Housing Cost Tiers in Leesville
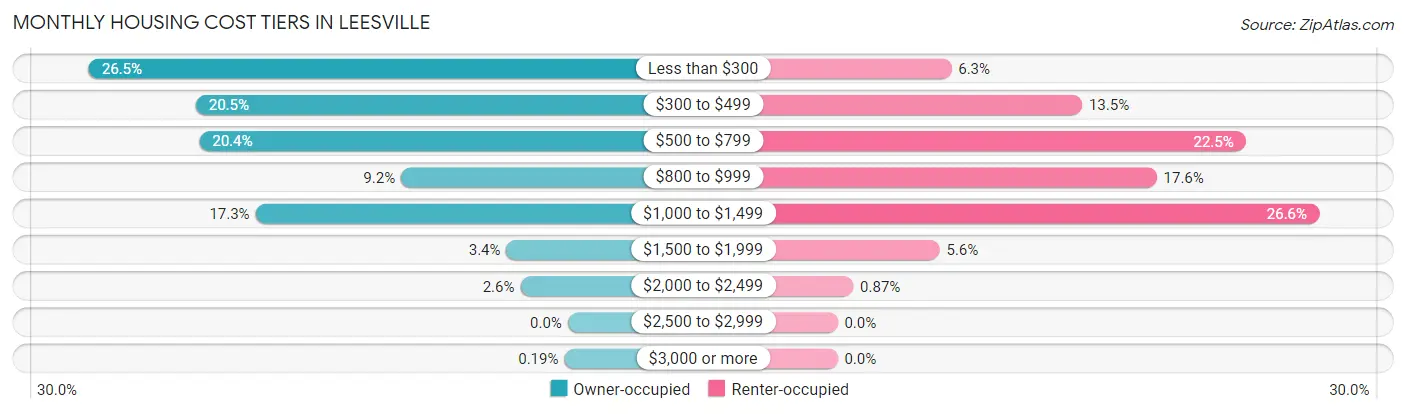
| Monthly Cost | Owner-occupied | Renter-occupied |
| Less than $300 | 273 (26.5%) | 87 (6.3%) |
| $300 to $499 | 212 (20.5%) | 187 (13.5%) |
| $500 to $799 | 210 (20.3%) | 312 (22.5%) |
| $800 to $999 | 95 (9.2%) | 244 (17.6%) |
| $1,000 to $1,499 | 178 (17.2%) | 368 (26.6%) |
| $1,500 to $1,999 | 35 (3.4%) | 78 (5.6%) |
| $2,000 to $2,499 | 27 (2.6%) | 12 (0.9%) |
| $2,500 to $2,999 | 0 (0.0%) | 0 (0.0%) |
| $3,000 or more | 2 (0.2%) | 0 (0.0%) |
| Total | 1,032 (100.0%) | 1,384 (100.0%) |
Physical Housing Characteristics in Leesville
Housing Structures in Leesville
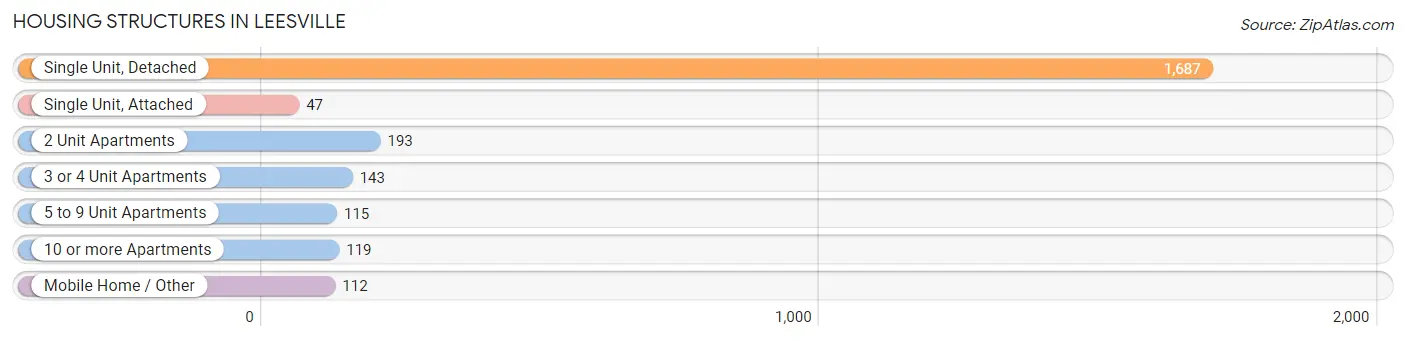
| Structure Type | # Housing Units | % Housing Units |
| Single Unit, Detached | 1,687 | 69.8% |
| Single Unit, Attached | 47 | 1.9% |
| 2 Unit Apartments | 193 | 8.0% |
| 3 or 4 Unit Apartments | 143 | 5.9% |
| 5 to 9 Unit Apartments | 115 | 4.8% |
| 10 or more Apartments | 119 | 4.9% |
| Mobile Home / Other | 112 | 4.6% |
| Total | 2,416 | 100.0% |
Housing Structures by Occupancy in Leesville
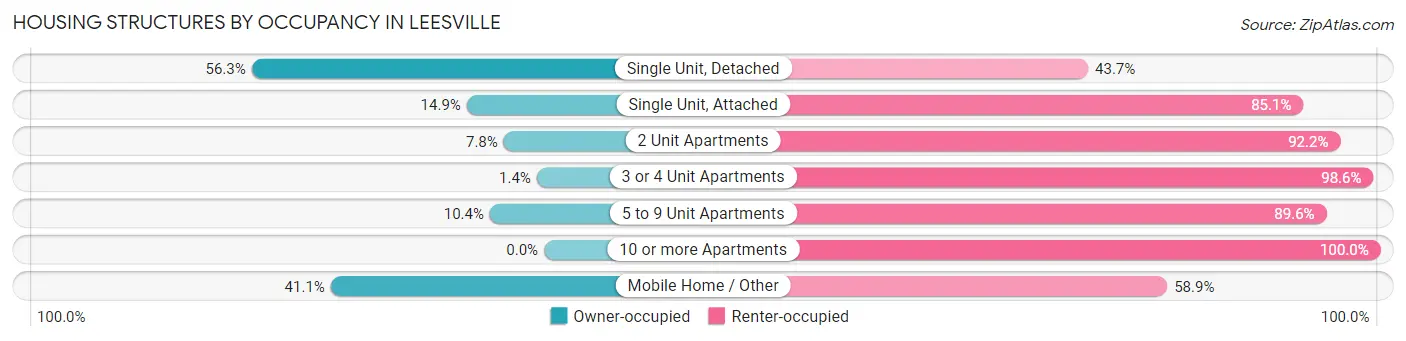
| Structure Type | Owner-occupied | Renter-occupied |
| Single Unit, Detached | 950 (56.3%) | 737 (43.7%) |
| Single Unit, Attached | 7 (14.9%) | 40 (85.1%) |
| 2 Unit Apartments | 15 (7.8%) | 178 (92.2%) |
| 3 or 4 Unit Apartments | 2 (1.4%) | 141 (98.6%) |
| 5 to 9 Unit Apartments | 12 (10.4%) | 103 (89.6%) |
| 10 or more Apartments | 0 (0.0%) | 119 (100.0%) |
| Mobile Home / Other | 46 (41.1%) | 66 (58.9%) |
| Total | 1,032 (42.7%) | 1,384 (57.3%) |
Housing Structures by Number of Rooms in Leesville
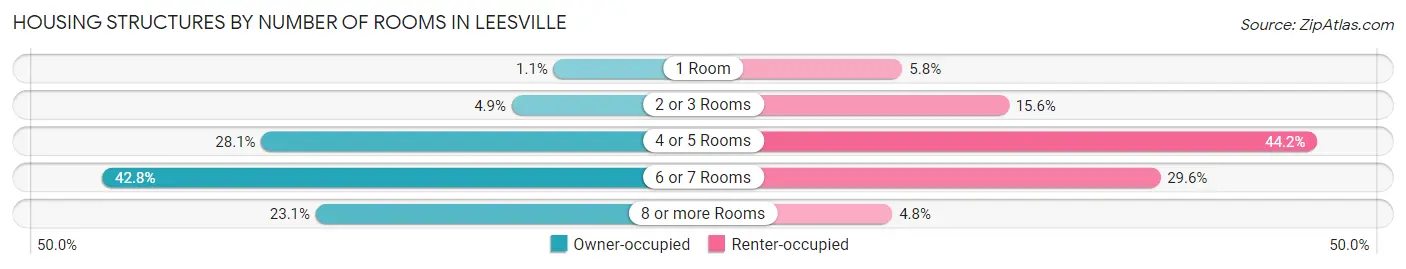
| Number of Rooms | Owner-occupied | Renter-occupied |
| 1 Room | 11 (1.1%) | 80 (5.8%) |
| 2 or 3 Rooms | 51 (4.9%) | 216 (15.6%) |
| 4 or 5 Rooms | 290 (28.1%) | 611 (44.2%) |
| 6 or 7 Rooms | 442 (42.8%) | 410 (29.6%) |
| 8 or more Rooms | 238 (23.1%) | 67 (4.8%) |
| Total | 1,032 (100.0%) | 1,384 (100.0%) |
Housing Structure by Heating Type in Leesville
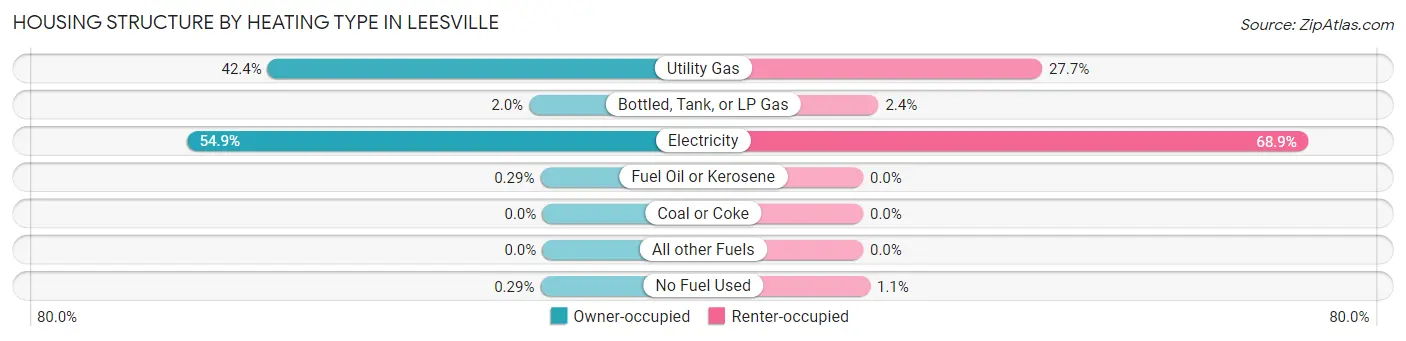
| Heating Type | Owner-occupied | Renter-occupied |
| Utility Gas | 438 (42.4%) | 383 (27.7%) |
| Bottled, Tank, or LP Gas | 21 (2.0%) | 33 (2.4%) |
| Electricity | 567 (54.9%) | 953 (68.9%) |
| Fuel Oil or Kerosene | 3 (0.3%) | 0 (0.0%) |
| Coal or Coke | 0 (0.0%) | 0 (0.0%) |
| All other Fuels | 0 (0.0%) | 0 (0.0%) |
| No Fuel Used | 3 (0.3%) | 15 (1.1%) |
| Total | 1,032 (100.0%) | 1,384 (100.0%) |
Household Vehicle Usage in Leesville
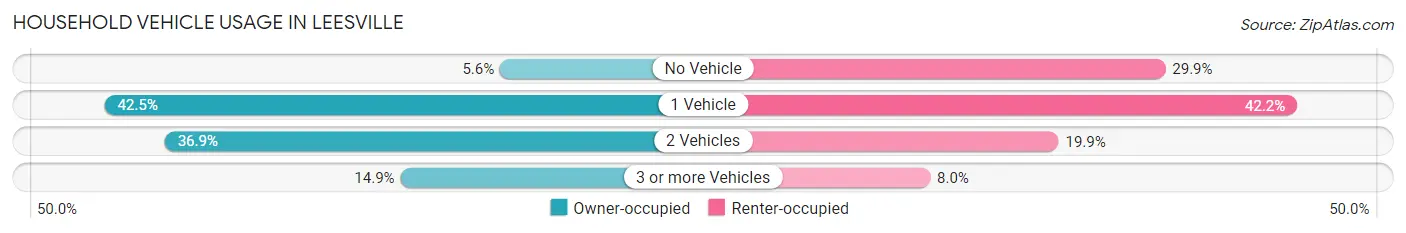
| Vehicles per Household | Owner-occupied | Renter-occupied |
| No Vehicle | 58 (5.6%) | 414 (29.9%) |
| 1 Vehicle | 439 (42.5%) | 584 (42.2%) |
| 2 Vehicles | 381 (36.9%) | 276 (19.9%) |
| 3 or more Vehicles | 154 (14.9%) | 110 (8.0%) |
| Total | 1,032 (100.0%) | 1,384 (100.0%) |
Real Estate & Mortgages in Leesville
Real Estate and Mortgage Overview in Leesville
| Characteristic | Without Mortgage | With Mortgage |
| Housing Units | 578 | 454 |
| Median Property Value | $95,500 | $117,800 |
| Median Household Income | $43,625 | $11 |
| Monthly Housing Costs | $315 | $0 |
| Real Estate Taxes | $199 | $136 |
Property Value by Mortgage Status in Leesville
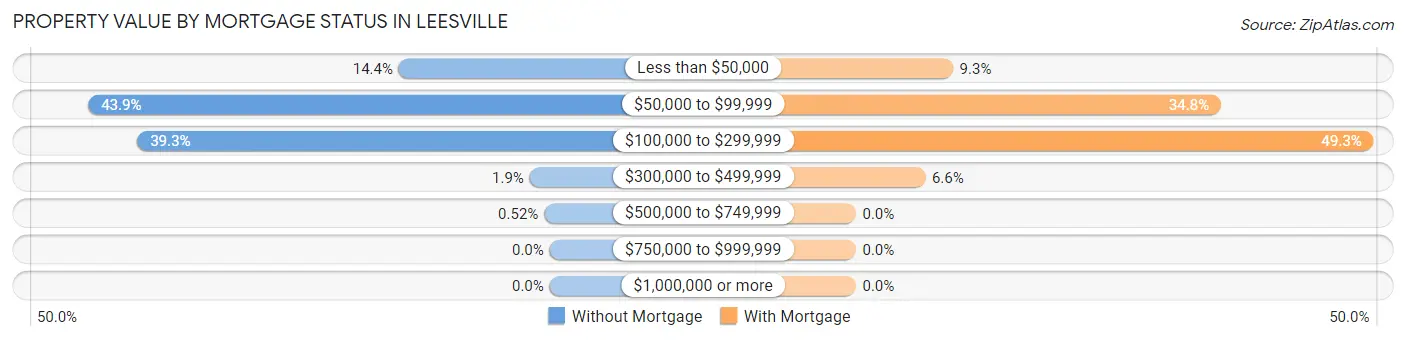
| Property Value | Without Mortgage | With Mortgage |
| Less than $50,000 | 83 (14.4%) | 42 (9.2%) |
| $50,000 to $99,999 | 254 (43.9%) | 158 (34.8%) |
| $100,000 to $299,999 | 227 (39.3%) | 224 (49.3%) |
| $300,000 to $499,999 | 11 (1.9%) | 30 (6.6%) |
| $500,000 to $749,999 | 3 (0.5%) | 0 (0.0%) |
| $750,000 to $999,999 | 0 (0.0%) | 0 (0.0%) |
| $1,000,000 or more | 0 (0.0%) | 0 (0.0%) |
| Total | 578 (100.0%) | 454 (100.0%) |
Household Income by Mortgage Status in Leesville
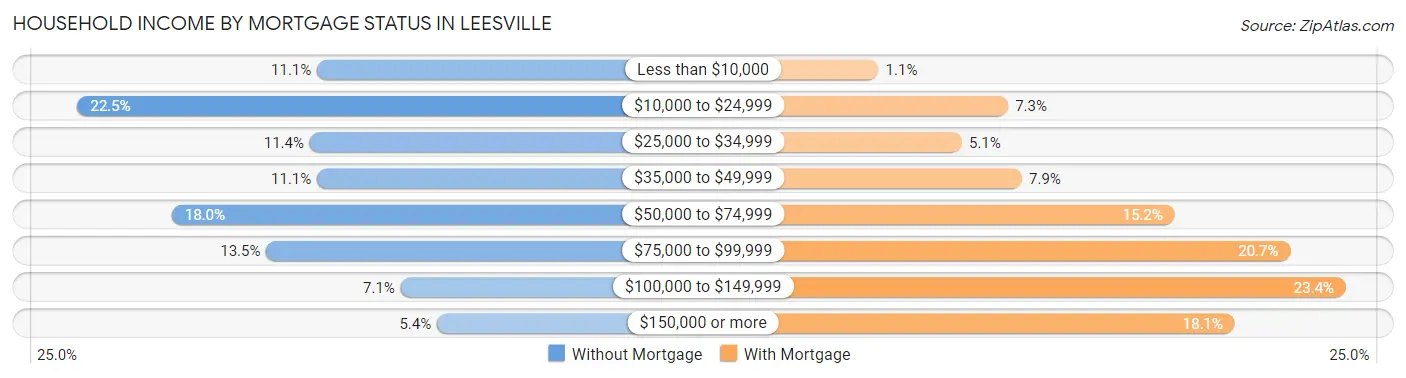
| Household Income | Without Mortgage | With Mortgage |
| Less than $10,000 | 64 (11.1%) | 5 (1.1%) |
| $10,000 to $24,999 | 130 (22.5%) | 33 (7.3%) |
| $25,000 to $34,999 | 66 (11.4%) | 23 (5.1%) |
| $35,000 to $49,999 | 64 (11.1%) | 36 (7.9%) |
| $50,000 to $74,999 | 104 (18.0%) | 69 (15.2%) |
| $75,000 to $99,999 | 78 (13.5%) | 94 (20.7%) |
| $100,000 to $149,999 | 41 (7.1%) | 106 (23.4%) |
| $150,000 or more | 31 (5.4%) | 82 (18.1%) |
| Total | 578 (100.0%) | 454 (100.0%) |
Property Value to Household Income Ratio in Leesville
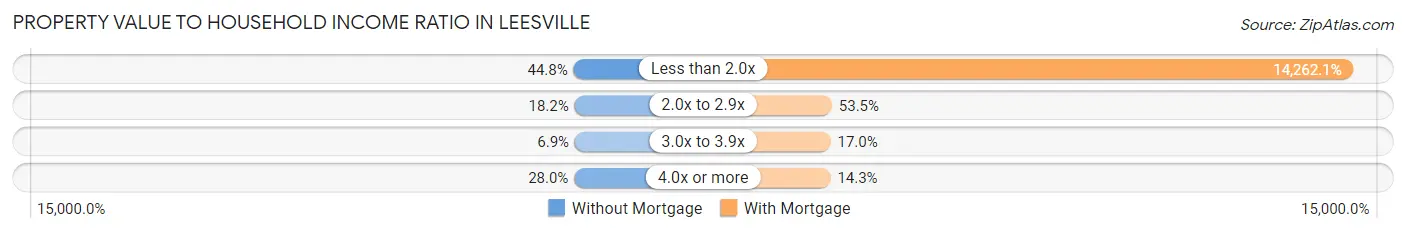
| Value-to-Income Ratio | Without Mortgage | With Mortgage |
| Less than 2.0x | 259 (44.8%) | 64,750 (14,262.1%) |
| 2.0x to 2.9x | 105 (18.2%) | 243 (53.5%) |
| 3.0x to 3.9x | 40 (6.9%) | 77 (17.0%) |
| 4.0x or more | 162 (28.0%) | 65 (14.3%) |
| Total | 578 (100.0%) | 454 (100.0%) |
Real Estate Taxes by Mortgage Status in Leesville
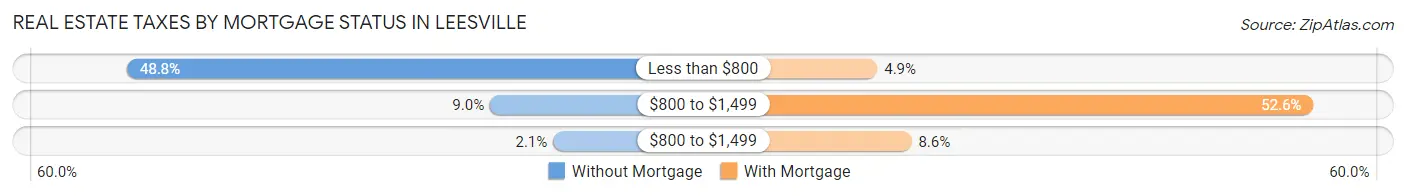
| Property Taxes | Without Mortgage | With Mortgage |
| Less than $800 | 282 (48.8%) | 22 (4.9%) |
| $800 to $1,499 | 52 (9.0%) | 239 (52.6%) |
| $800 to $1,499 | 12 (2.1%) | 39 (8.6%) |
| Total | 578 (100.0%) | 454 (100.0%) |
Health & Disability in Leesville
Health Insurance Coverage by Age in Leesville
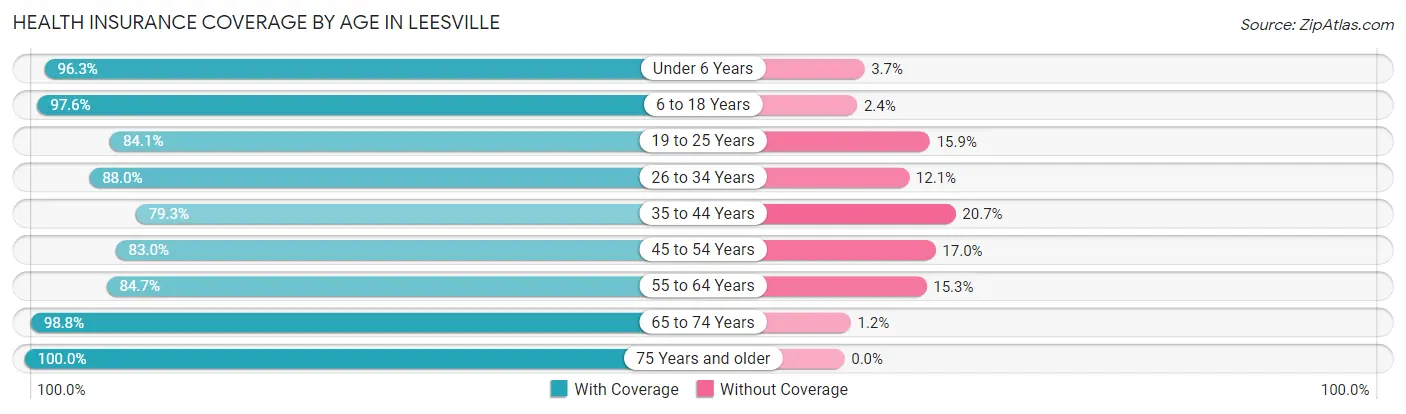
| Age Bracket | With Coverage | Without Coverage |
| Under 6 Years | 467 (96.3%) | 18 (3.7%) |
| 6 to 18 Years | 784 (97.6%) | 19 (2.4%) |
| 19 to 25 Years | 454 (84.1%) | 86 (15.9%) |
| 26 to 34 Years | 679 (87.9%) | 93 (12.0%) |
| 35 to 44 Years | 421 (79.3%) | 110 (20.7%) |
| 45 to 54 Years | 596 (83.0%) | 122 (17.0%) |
| 55 to 64 Years | 565 (84.7%) | 102 (15.3%) |
| 65 to 74 Years | 513 (98.8%) | 6 (1.2%) |
| 75 Years and older | 325 (100.0%) | 0 (0.0%) |
| Total | 4,804 (89.6%) | 556 (10.4%) |
Health Insurance Coverage by Citizenship Status in Leesville
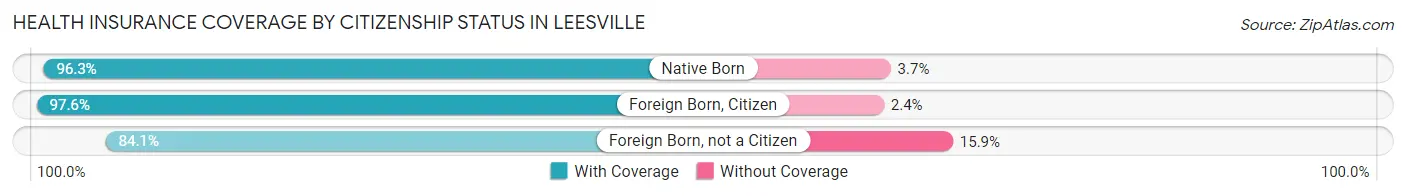
| Citizenship Status | With Coverage | Without Coverage |
| Native Born | 467 (96.3%) | 18 (3.7%) |
| Foreign Born, Citizen | 784 (97.6%) | 19 (2.4%) |
| Foreign Born, not a Citizen | 454 (84.1%) | 86 (15.9%) |
Health Insurance Coverage by Household Income in Leesville
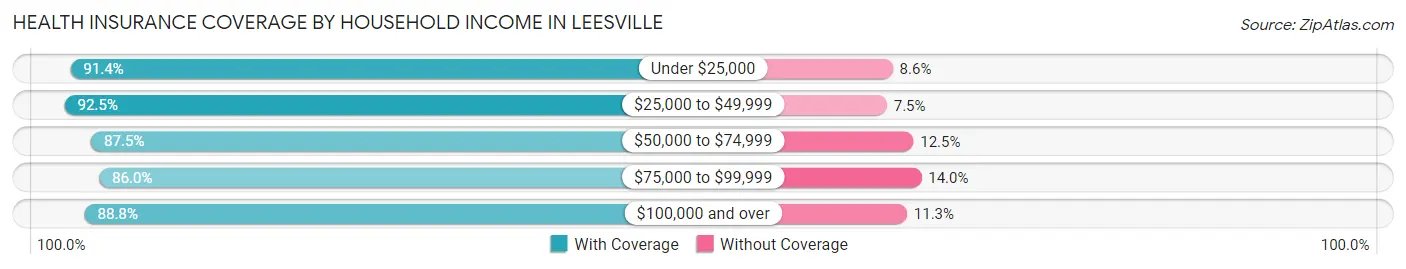
| Household Income | With Coverage | Without Coverage |
| Under $25,000 | 1,468 (91.4%) | 138 (8.6%) |
| $25,000 to $49,999 | 1,001 (92.5%) | 81 (7.5%) |
| $50,000 to $74,999 | 738 (87.5%) | 105 (12.5%) |
| $75,000 to $99,999 | 783 (86.0%) | 127 (14.0%) |
| $100,000 and over | 797 (88.7%) | 101 (11.3%) |
Public vs Private Health Insurance Coverage by Age in Leesville
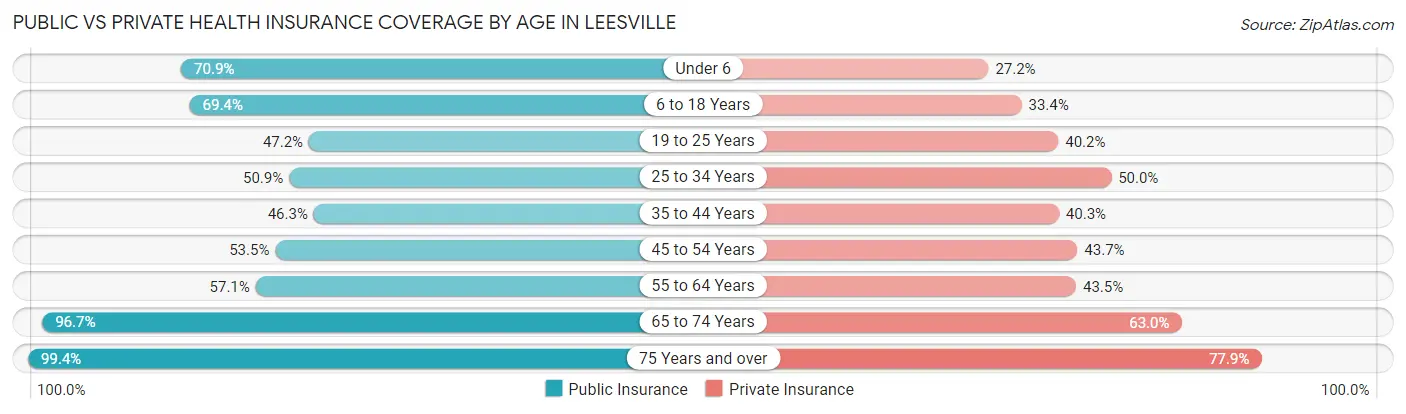
| Age Bracket | Public Insurance | Private Insurance |
| Under 6 | 344 (70.9%) | 132 (27.2%) |
| 6 to 18 Years | 557 (69.4%) | 268 (33.4%) |
| 19 to 25 Years | 255 (47.2%) | 217 (40.2%) |
| 25 to 34 Years | 393 (50.9%) | 386 (50.0%) |
| 35 to 44 Years | 246 (46.3%) | 214 (40.3%) |
| 45 to 54 Years | 384 (53.5%) | 314 (43.7%) |
| 55 to 64 Years | 381 (57.1%) | 290 (43.5%) |
| 65 to 74 Years | 502 (96.7%) | 327 (63.0%) |
| 75 Years and over | 323 (99.4%) | 253 (77.8%) |
| Total | 3,385 (63.1%) | 2,401 (44.8%) |
Disability Status by Sex by Age in Leesville
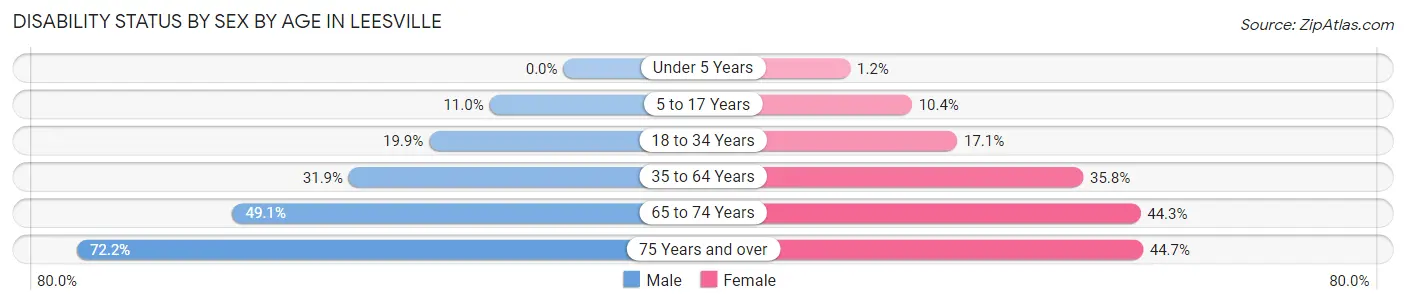
| Age Bracket | Male | Female |
| Under 5 Years | 0 (0.0%) | 3 (1.2%) |
| 5 to 17 Years | 42 (11.0%) | 41 (10.4%) |
| 18 to 34 Years | 123 (19.9%) | 133 (17.1%) |
| 35 to 64 Years | 316 (31.9%) | 331 (35.8%) |
| 65 to 74 Years | 112 (49.1%) | 129 (44.3%) |
| 75 Years and over | 78 (72.2%) | 97 (44.7%) |
Disability Class by Sex by Age in Leesville
Disability Class: Hearing Difficulty
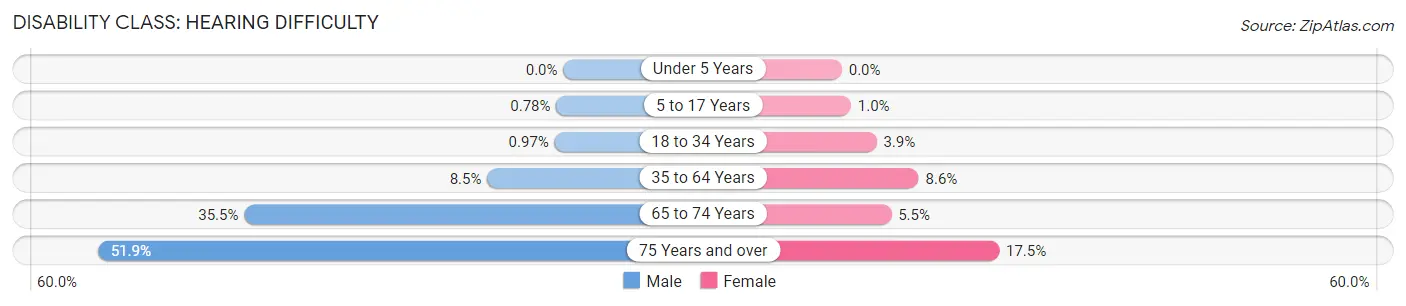
| Age Bracket | Male | Female |
| Under 5 Years | 0 (0.0%) | 0 (0.0%) |
| 5 to 17 Years | 3 (0.8%) | 4 (1.0%) |
| 18 to 34 Years | 6 (1.0%) | 30 (3.9%) |
| 35 to 64 Years | 84 (8.5%) | 79 (8.6%) |
| 65 to 74 Years | 81 (35.5%) | 16 (5.5%) |
| 75 Years and over | 56 (51.8%) | 38 (17.5%) |
Disability Class: Vision Difficulty
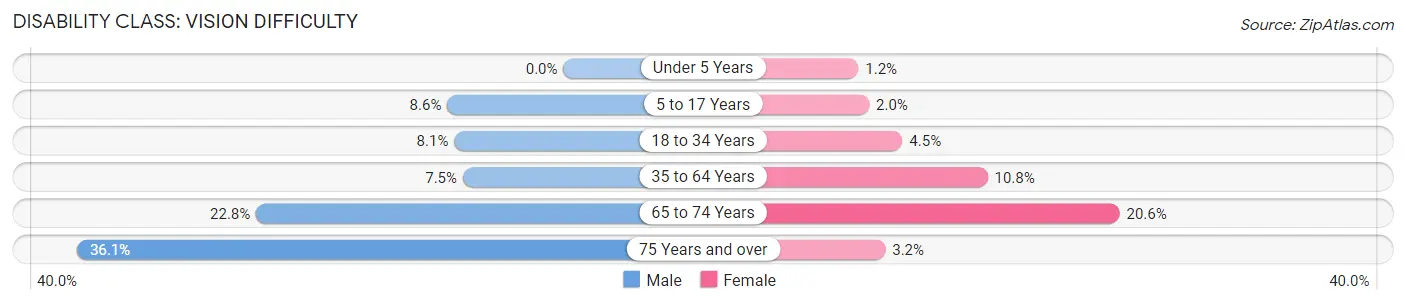
| Age Bracket | Male | Female |
| Under 5 Years | 0 (0.0%) | 3 (1.2%) |
| 5 to 17 Years | 33 (8.6%) | 8 (2.0%) |
| 18 to 34 Years | 50 (8.1%) | 35 (4.5%) |
| 35 to 64 Years | 74 (7.5%) | 100 (10.8%) |
| 65 to 74 Years | 52 (22.8%) | 60 (20.6%) |
| 75 Years and over | 39 (36.1%) | 7 (3.2%) |
Disability Class: Cognitive Difficulty
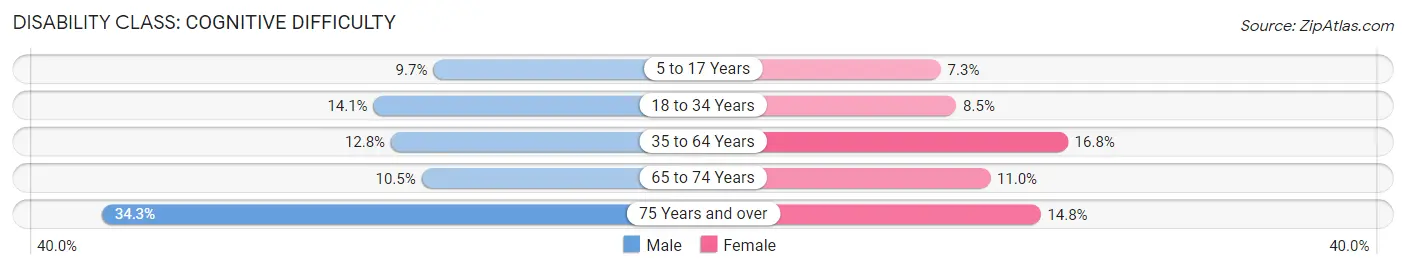
| Age Bracket | Male | Female |
| 5 to 17 Years | 37 (9.7%) | 29 (7.3%) |
| 18 to 34 Years | 87 (14.1%) | 66 (8.5%) |
| 35 to 64 Years | 127 (12.8%) | 155 (16.8%) |
| 65 to 74 Years | 24 (10.5%) | 32 (11.0%) |
| 75 Years and over | 37 (34.3%) | 32 (14.7%) |
Disability Class: Ambulatory Difficulty
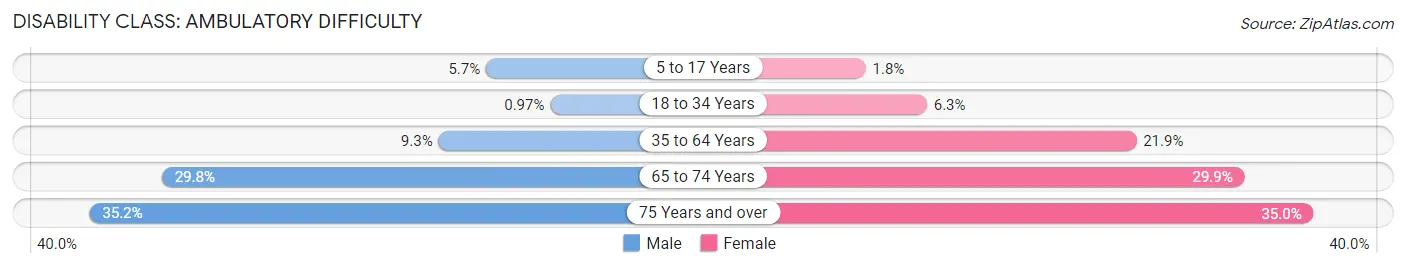
| Age Bracket | Male | Female |
| 5 to 17 Years | 22 (5.7%) | 7 (1.8%) |
| 18 to 34 Years | 6 (1.0%) | 49 (6.3%) |
| 35 to 64 Years | 92 (9.3%) | 202 (21.9%) |
| 65 to 74 Years | 68 (29.8%) | 87 (29.9%) |
| 75 Years and over | 38 (35.2%) | 76 (35.0%) |
Disability Class: Self-Care Difficulty
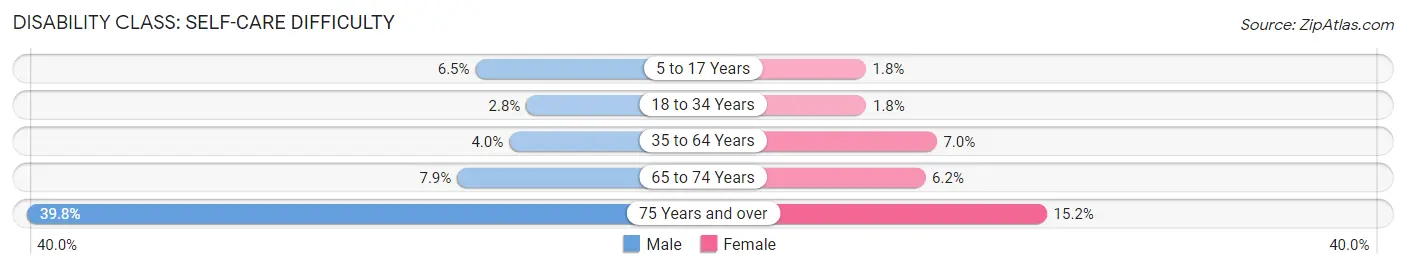
| Age Bracket | Male | Female |
| 5 to 17 Years | 25 (6.5%) | 7 (1.8%) |
| 18 to 34 Years | 17 (2.8%) | 14 (1.8%) |
| 35 to 64 Years | 40 (4.0%) | 65 (7.0%) |
| 65 to 74 Years | 18 (7.9%) | 18 (6.2%) |
| 75 Years and over | 43 (39.8%) | 33 (15.2%) |
Technology Access in Leesville
Computing Device Access in Leesville
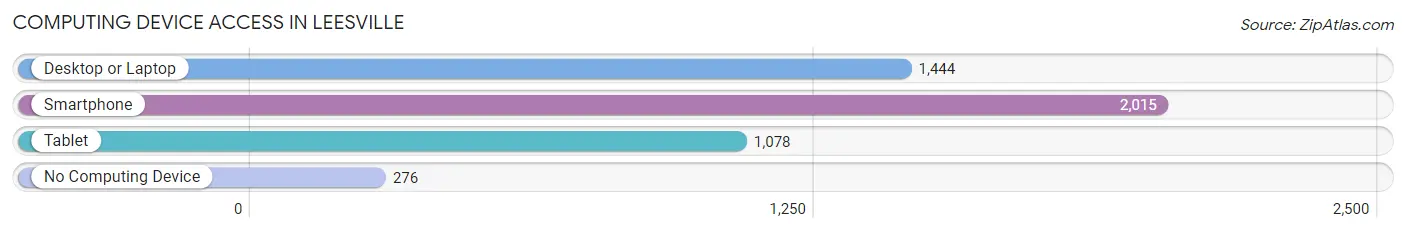
| Device Type | # Households | % Households |
| Desktop or Laptop | 1,444 | 59.8% |
| Smartphone | 2,015 | 83.4% |
| Tablet | 1,078 | 44.6% |
| No Computing Device | 276 | 11.4% |
| Total | 2,416 | 100.0% |
Internet Access in Leesville
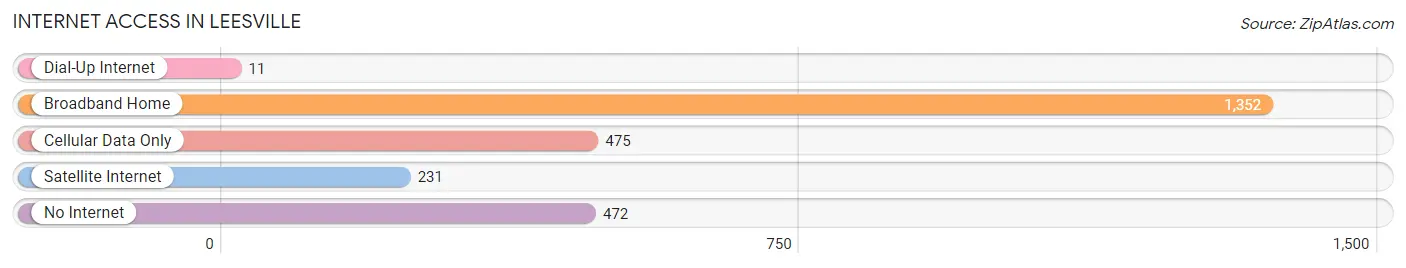
| Internet Type | # Households | % Households |
| Dial-Up Internet | 11 | 0.5% |
| Broadband Home | 1,352 | 56.0% |
| Cellular Data Only | 475 | 19.7% |
| Satellite Internet | 231 | 9.6% |
| No Internet | 472 | 19.5% |
| Total | 2,416 | 100.0% |
Leesville Summary
Leesville is a city located in Vernon Parish, Louisiana, United States. It is the parish seat of Vernon Parish. The population was 6,753 at the 2010 census. It is part of the Fort Polk South Micropolitan Statistical Area.
History
Leesville was founded in 1883 by the Leesville Land and Improvement Company. The company was formed by a group of investors from New Orleans who purchased the land from the federal government. The town was named after the company's president, William Lea. The town was incorporated in 1887.
The town grew rapidly in the late 19th and early 20th centuries, becoming a center for the timber and railroad industries. The town was also home to a number of sawmills and lumber companies.
Geography
Leesville is located at the intersection of U.S. Route 171 and Louisiana Highway 10. It is approximately 30 miles south of Alexandria and 60 miles north of Lake Charles.
The city is located in the Kisatchie National Forest and is surrounded by rolling hills and pine forests. The city is located on the banks of the Sabine River.
Economy
Leesville is the economic center of Vernon Parish. The city is home to a number of businesses, including manufacturing, retail, and service industries. The city is also home to a number of government offices, including the Vernon Parish Courthouse.
The city is also home to Fort Polk, a major U.S. Army installation. The base is home to the Joint Readiness Training Center and the Joint Readiness Exercise Center. The base is also home to the U.S. Army's Airborne and Special Operations Forces.
Demographics
As of the 2010 census, there were 6,753 people, 2,541 households, and 1,717 families residing in the city. The population density was 1,093.3 people per square mile (422.2/km2). There were 2,845 housing units at an average density of 454.3 per square mile (175.6/km2). The racial makeup of the city was 70.2% White, 24.2% African American, 0.5% Native American, 0.7% Asian, 0.1% Pacific Islander, 2.2% from other races, and 2.1% from two or more races. Hispanic or Latino of any race were 4.7% of the population.
There were 2,541 households, out of which 33.2% had children under the age of 18 living with them, 44.2% were married couples living together, 17.7% had a female householder with no husband present, and 33.2% were non-families. 28.2% of all households were made up of individuals, and 11.2% had someone living alone who was 65 years of age or older. The average household size was 2.54 and the average family size was 3.11.
In the city, the population was spread out, with 26.7% under the age of 18, 8.7% from 18 to 24, 28.2% from 25 to 44, 22.2% from 45 to 64, and 14.2% who were 65 years of age or older. The median age was 36 years. For every 100 females, there were 95.2 males. For every 100 females age 18 and over, there were 91.2 males.
The median income for a household in the city was $30,917, and the median income for a family was $37,813. Males had a median income of $30,917 versus $20,972 for females. The per capita income for the city was $15,945. About 14.2% of families and 17.3% of the population were below the poverty line, including 22.2% of those under age 18 and 16.2% of those age 65 or over.
Common Questions
What is Per Capita Income in Leesville?
Per Capita income in Leesville is $25,386.
What is the Median Family Income in Leesville?
Median Family Income in Leesville is $53,531.
What is the Median Household income in Leesville?
Median Household Income in Leesville is $35,652.
What is Income or Wage Gap in Leesville?
Income or Wage Gap in Leesville is 25.3%.
Women in Leesville earn 74.7 cents for every dollar earned by a man.
What is Inequality or Gini Index in Leesville?
Inequality or Gini Index in Leesville is 0.53.
What is the Total Population of Leesville?
Total Population of Leesville is 5,681.
What is the Total Male Population of Leesville?
Total Male Population of Leesville is 2,768.
What is the Total Female Population of Leesville?
Total Female Population of Leesville is 2,913.
What is the Ratio of Males per 100 Females in Leesville?
There are 95.02 Males per 100 Females in Leesville.
What is the Ratio of Females per 100 Males in Leesville?
There are 105.24 Females per 100 Males in Leesville.
What is the Median Population Age in Leesville?
Median Population Age in Leesville is 35.0 Years.
What is the Average Family Size in Leesville
Average Family Size in Leesville is 3.2 People.
What is the Average Household Size in Leesville
Average Household Size in Leesville is 2.3 People.
How Large is the Labor Force in Leesville?
There are 2,494 People in the Labor Forcein in Leesville.
What is the Percentage of People in the Labor Force in Leesville?
54.6% of People are in the Labor Force in Leesville.
What is the Unemployment Rate in Leesville?
Unemployment Rate in Leesville is 9.5%.