Lawtell, LA Map & Demographics
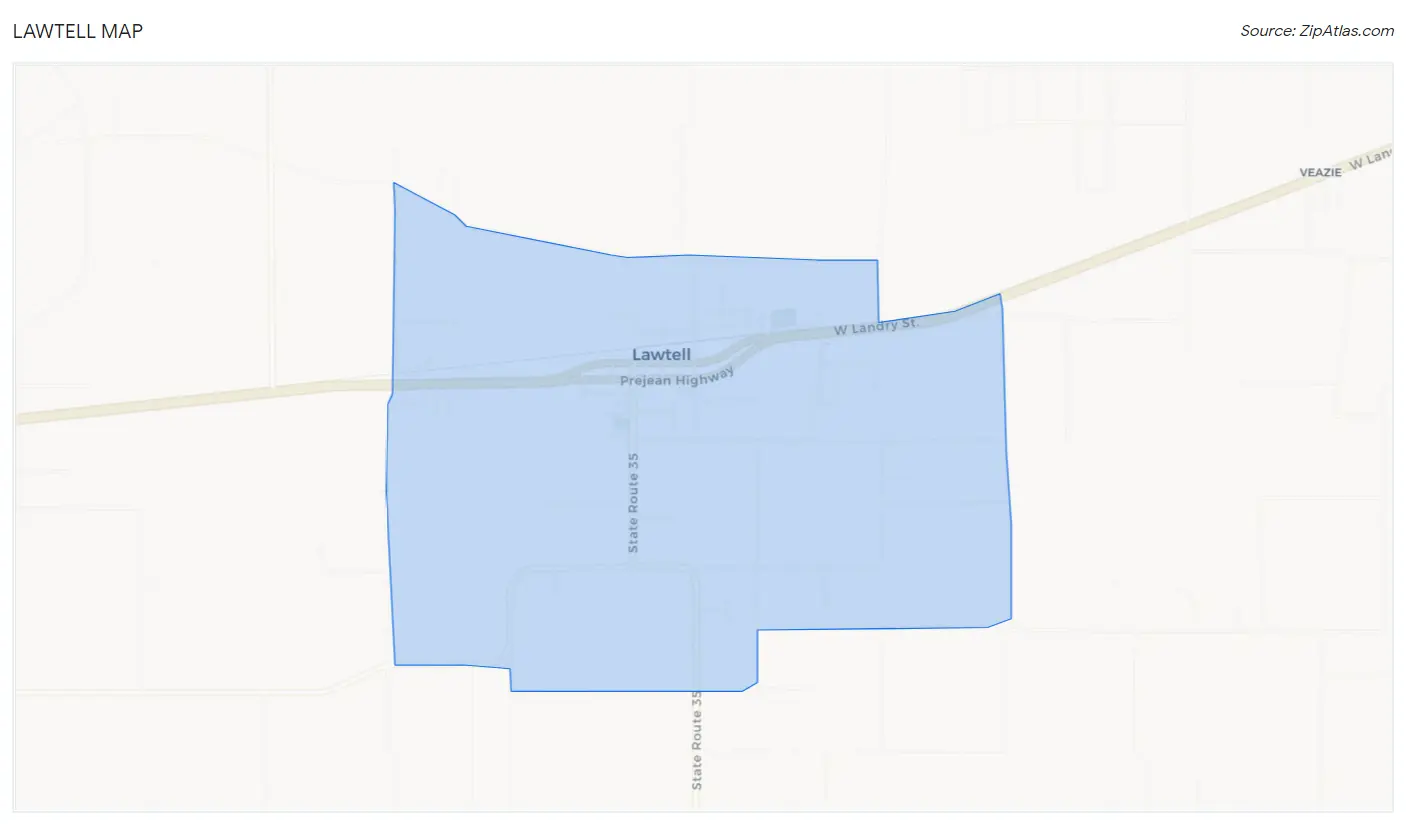
Lawtell Map
Lawtell Overview
$31,607
PER CAPITA INCOME
$59,135
AVG FAMILY INCOME
$45,855
AVG HOUSEHOLD INCOME
29.3%
WAGE / INCOME GAP [ % ]
70.7¢/ $1
WAGE / INCOME GAP [ $ ]
0.40
INEQUALITY / GINI INDEX
997
TOTAL POPULATION
628
MALE POPULATION
369
FEMALE POPULATION
170.19
MALES / 100 FEMALES
58.76
FEMALES / 100 MALES
56.5
MEDIAN AGE
2.9
AVG FAMILY SIZE
2.0
AVG HOUSEHOLD SIZE
390
LABOR FORCE [ PEOPLE ]
44.1%
PERCENT IN LABOR FORCE
12.6%
UNEMPLOYMENT RATE
Lawtell Zip Codes
Income in Lawtell
Income Overview in Lawtell
Per Capita Income in Lawtell is $31,607, while median incomes of families and households are $59,135 and $45,855 respectively.
| Characteristic | Number | Measure |
| Per Capita Income | 997 | $31,607 |
| Median Family Income | 229 | $59,135 |
| Mean Family Income | 229 | $74,143 |
| Median Household Income | 500 | $45,855 |
| Mean Household Income | 500 | $51,483 |
| Income Deficit | 229 | $0 |
| Wage / Income Gap (%) | 997 | 29.27% |
| Wage / Income Gap ($) | 997 | 70.73¢ per $1 |
| Gini / Inequality Index | 997 | 0.40 |
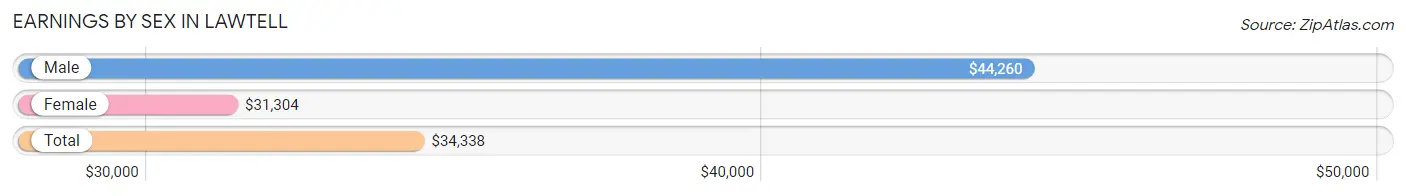
Earnings by Sex in Lawtell
Average Earnings in Lawtell are $34,338, $44,260 for men and $31,304 for women, a difference of 29.3%.
| Sex | Number | Average Earnings |
| Male | 183 (44.1%) | $44,260 |
| Female | 232 (55.9%) | $31,304 |
| Total | 415 (100.0%) | $34,338 |
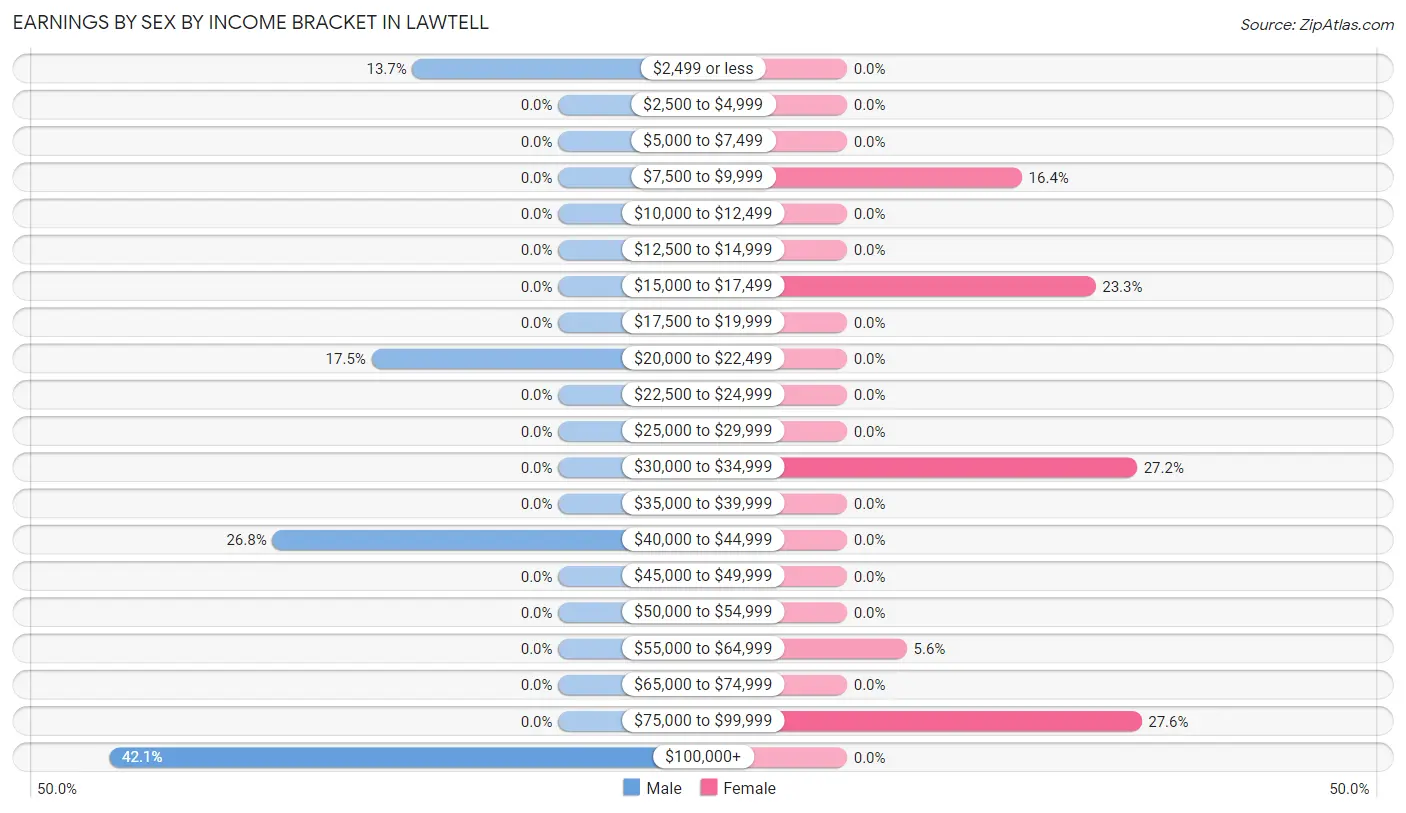
Earnings by Sex by Income Bracket in Lawtell
The most common earnings brackets in Lawtell are $100,000+ for men (77 | 42.1%) and $75,000 to $99,999 for women (64 | 27.6%).
| Income | Male | Female |
| $2,499 or less | 25 (13.7%) | 0 (0.0%) |
| $2,500 to $4,999 | 0 (0.0%) | 0 (0.0%) |
| $5,000 to $7,499 | 0 (0.0%) | 0 (0.0%) |
| $7,500 to $9,999 | 0 (0.0%) | 38 (16.4%) |
| $10,000 to $12,499 | 0 (0.0%) | 0 (0.0%) |
| $12,500 to $14,999 | 0 (0.0%) | 0 (0.0%) |
| $15,000 to $17,499 | 0 (0.0%) | 54 (23.3%) |
| $17,500 to $19,999 | 0 (0.0%) | 0 (0.0%) |
| $20,000 to $22,499 | 32 (17.5%) | 0 (0.0%) |
| $22,500 to $24,999 | 0 (0.0%) | 0 (0.0%) |
| $25,000 to $29,999 | 0 (0.0%) | 0 (0.0%) |
| $30,000 to $34,999 | 0 (0.0%) | 63 (27.2%) |
| $35,000 to $39,999 | 0 (0.0%) | 0 (0.0%) |
| $40,000 to $44,999 | 49 (26.8%) | 0 (0.0%) |
| $45,000 to $49,999 | 0 (0.0%) | 0 (0.0%) |
| $50,000 to $54,999 | 0 (0.0%) | 0 (0.0%) |
| $55,000 to $64,999 | 0 (0.0%) | 13 (5.6%) |
| $65,000 to $74,999 | 0 (0.0%) | 0 (0.0%) |
| $75,000 to $99,999 | 0 (0.0%) | 64 (27.6%) |
| $100,000+ | 77 (42.1%) | 0 (0.0%) |
| Total | 183 (100.0%) | 232 (100.0%) |
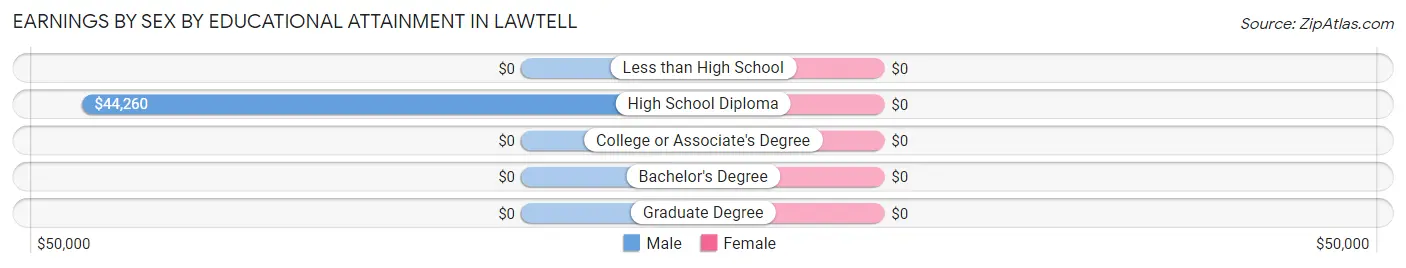
Earnings by Sex by Educational Attainment in Lawtell
| Educational Attainment | Male Income | Female Income |
| Less than High School | - | - |
| High School Diploma | $44,260 | $0 |
| College or Associate's Degree | - | - |
| Bachelor's Degree | - | - |
| Graduate Degree | - | - |
| Total | $44,260 | $31,304 |
Family Income in Lawtell
Family Income Brackets in Lawtell
According to the Lawtell family income data, there are 84 families falling into the $50,000 to $74,999 income range, which is the most common income bracket and makes up 36.7% of all families.
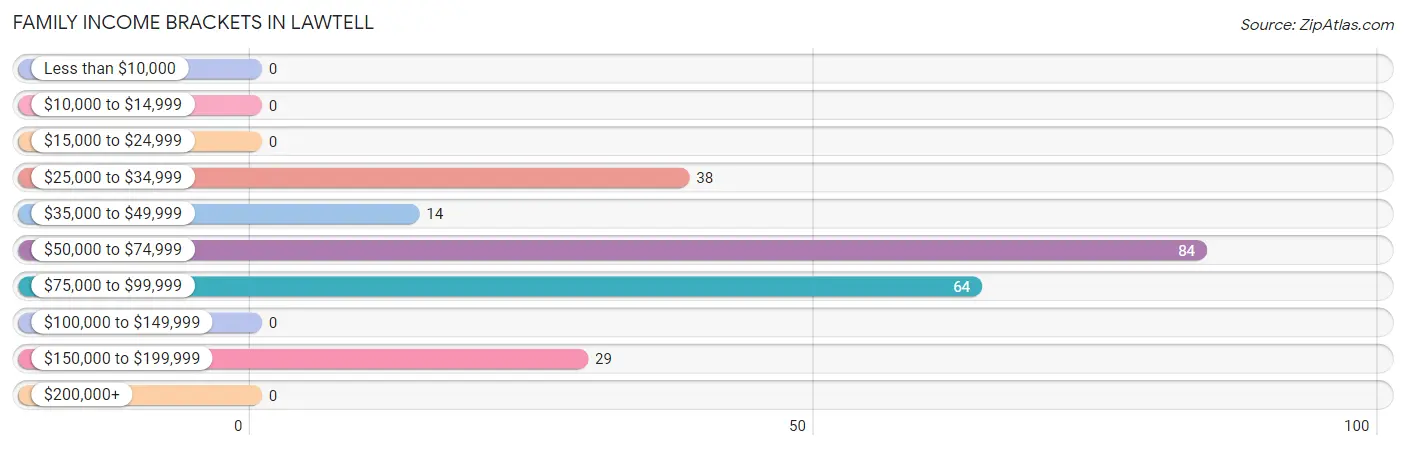
| Income Bracket | # Families | % Families |
| Less than $10,000 | 0 | 0.0% |
| $10,000 to $14,999 | 0 | 0.0% |
| $15,000 to $24,999 | 0 | 0.0% |
| $25,000 to $34,999 | 38 | 16.6% |
| $35,000 to $49,999 | 14 | 6.1% |
| $50,000 to $74,999 | 84 | 36.7% |
| $75,000 to $99,999 | 64 | 27.9% |
| $100,000 to $149,999 | 0 | 0.0% |
| $150,000 to $199,999 | 29 | 12.7% |
| $200,000+ | 0 | 0.0% |
Family Income by Famaliy Size in Lawtell
2-person families (162 | 70.7%) account for the highest median family income in Lawtell with $62,500 per family, while 2-person families (162 | 70.7%) have the highest median income of $31,250 per family member.
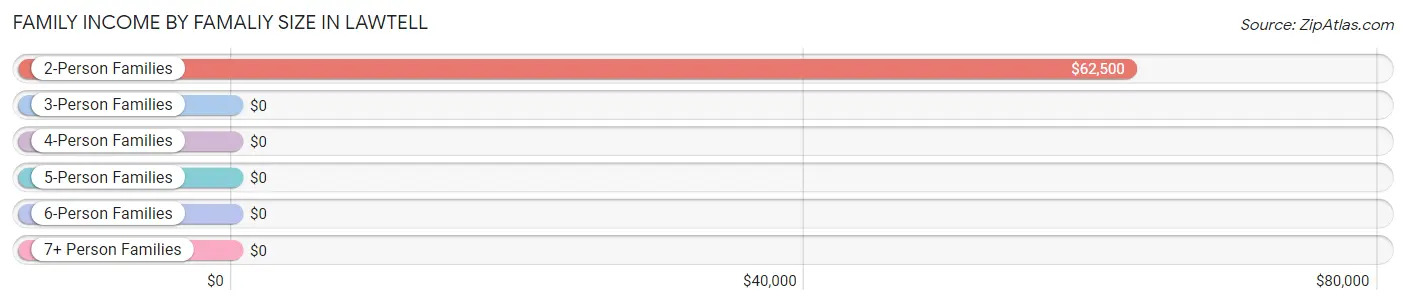
| Income Bracket | # Families | Median Income |
| 2-Person Families | 162 (70.7%) | $62,500 |
| 3-Person Families | 29 (12.7%) | $0 |
| 4-Person Families | 0 (0.0%) | $0 |
| 5-Person Families | 38 (16.6%) | $0 |
| 6-Person Families | 0 (0.0%) | $0 |
| 7+ Person Families | 0 (0.0%) | $0 |
| Total | 229 (100.0%) | $59,135 |
Family Income by Number of Earners in Lawtell
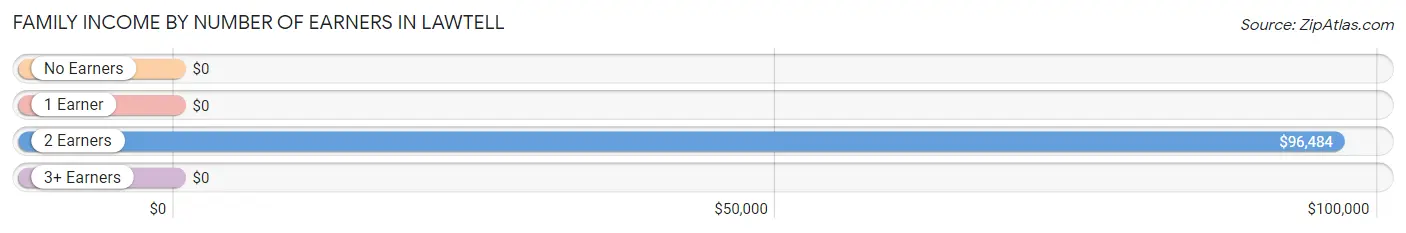
| Number of Earners | # Families | Median Income |
| No Earners | 68 (29.7%) | $0 |
| 1 Earner | 51 (22.3%) | $0 |
| 2 Earners | 110 (48.0%) | $96,484 |
| 3+ Earners | 0 (0.0%) | $0 |
| Total | 229 (100.0%) | $59,135 |
Household Income in Lawtell
Household Income Brackets in Lawtell
With 151 households falling in the category, the $15,000 to $24,999 income range is the most frequent in Lawtell, accounting for 30.2% of all households.
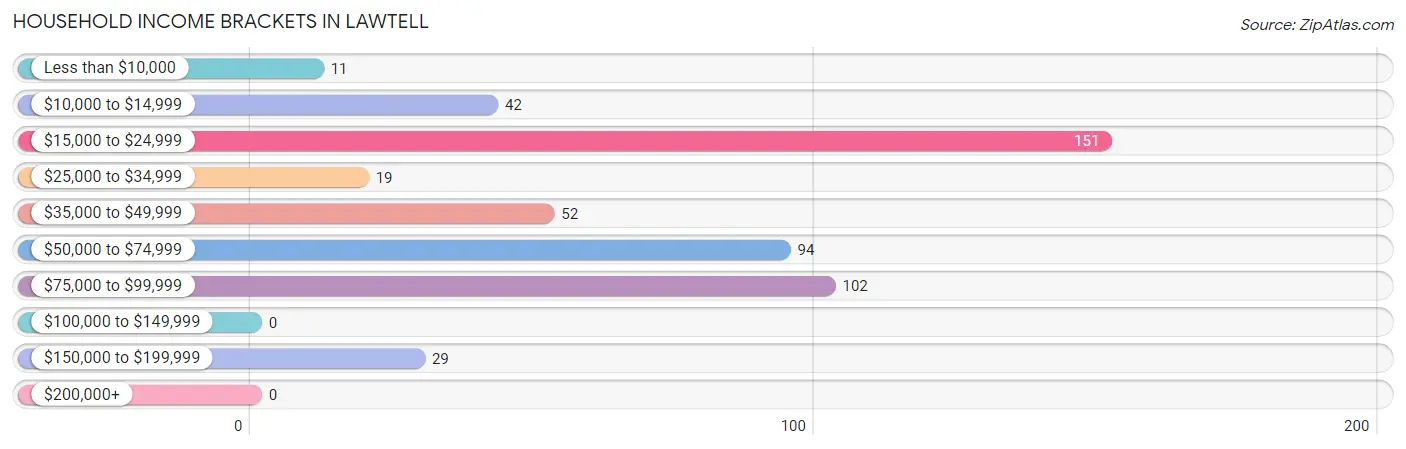
| Income Bracket | # Households | % Households |
| Less than $10,000 | 11 | 2.2% |
| $10,000 to $14,999 | 42 | 8.4% |
| $15,000 to $24,999 | 151 | 30.2% |
| $25,000 to $34,999 | 19 | 3.8% |
| $35,000 to $49,999 | 52 | 10.4% |
| $50,000 to $74,999 | 94 | 18.8% |
| $75,000 to $99,999 | 102 | 20.4% |
| $100,000 to $149,999 | 0 | 0.0% |
| $150,000 to $199,999 | 29 | 5.8% |
| $200,000+ | 0 | 0.0% |
Household Income by Householder Age in Lawtell
The median household income in Lawtell is $45,855, with the highest median household income of $95,508 found in the 45 to 64 years age bracket for the primary householder. A total of 160 households (32.0%) fall into this category.
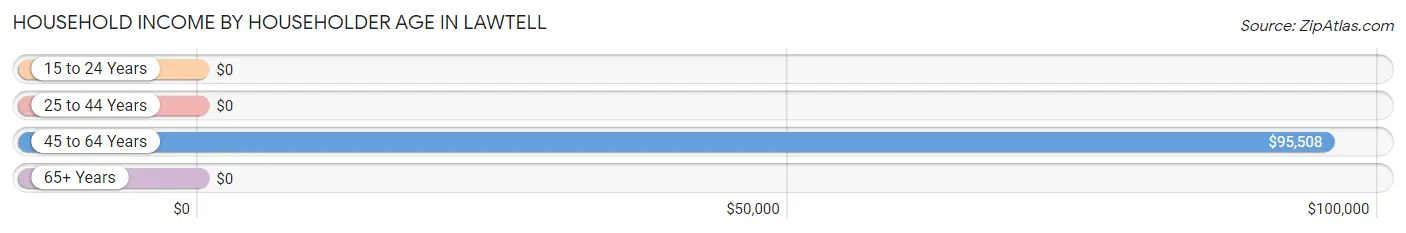
| Income Bracket | # Households | Median Income |
| 15 to 24 Years | 0 (0.0%) | $0 |
| 25 to 44 Years | 38 (7.6%) | $0 |
| 45 to 64 Years | 160 (32.0%) | $95,508 |
| 65+ Years | 302 (60.4%) | $0 |
| Total | 500 (100.0%) | $45,855 |
Poverty in Lawtell
Income Below Poverty by Sex and Age in Lawtell
With 30.2% poverty level for males and 13.3% for females among the residents of Lawtell, under 5 year old males and 35 to 44 year old females are the most vulnerable to poverty, with 35 males (100.0%) and 38 females (100.0%) in their respective age groups living below the poverty level.
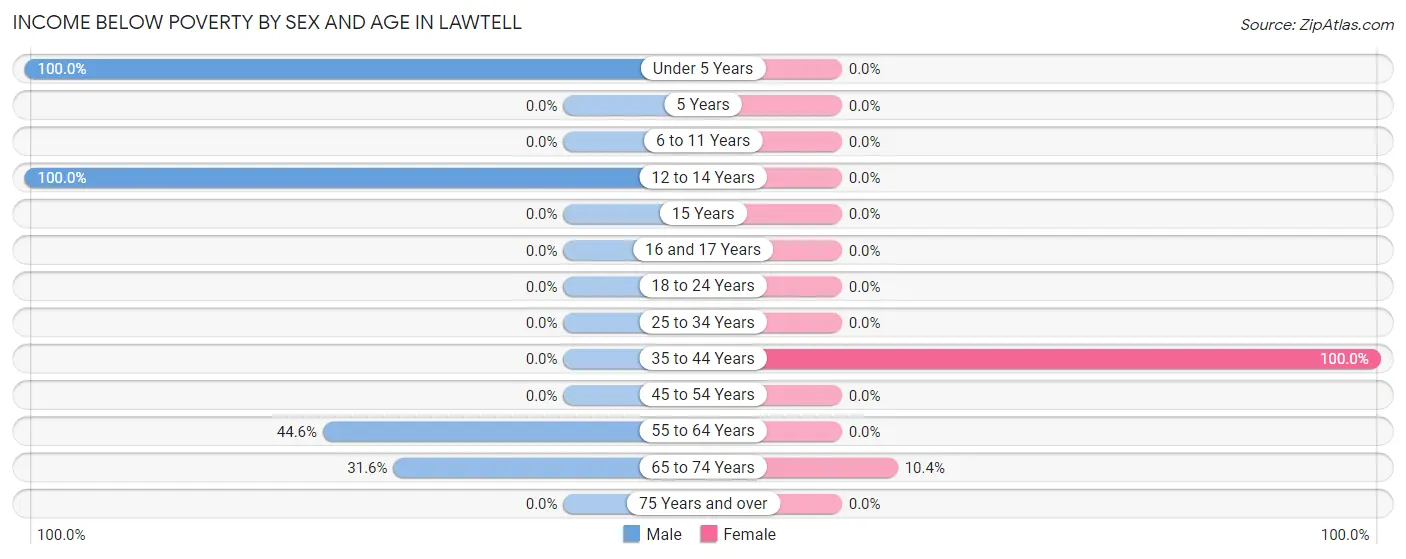
| Age Bracket | Male | Female |
| Under 5 Years | 35 (100.0%) | 0 (0.0%) |
| 5 Years | 0 (0.0%) | 0 (0.0%) |
| 6 to 11 Years | 0 (0.0%) | 0 (0.0%) |
| 12 to 14 Years | 77 (100.0%) | 0 (0.0%) |
| 15 Years | 0 (0.0%) | 0 (0.0%) |
| 16 and 17 Years | 0 (0.0%) | 0 (0.0%) |
| 18 to 24 Years | 0 (0.0%) | 0 (0.0%) |
| 25 to 34 Years | 0 (0.0%) | 0 (0.0%) |
| 35 to 44 Years | 0 (0.0%) | 38 (100.0%) |
| 45 to 54 Years | 0 (0.0%) | 0 (0.0%) |
| 55 to 64 Years | 25 (44.6%) | 0 (0.0%) |
| 65 to 74 Years | 53 (31.6%) | 11 (10.4%) |
| 75 Years and over | 0 (0.0%) | 0 (0.0%) |
| Total | 190 (30.2%) | 49 (13.3%) |
Income Above Poverty by Sex and Age in Lawtell
According to the poverty statistics in Lawtell, males aged 25 to 34 years and females aged 25 to 34 years are the age groups that are most secure financially, with 100.0% of males and 100.0% of females in these age groups living above the poverty line.
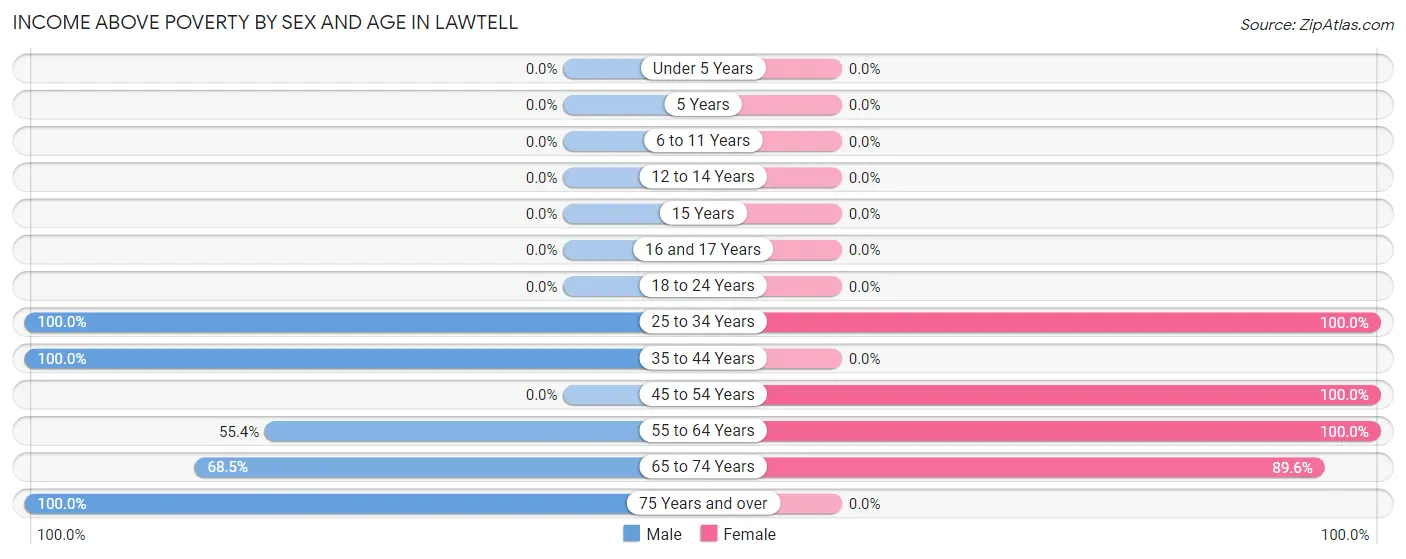
| Age Bracket | Male | Female |
| Under 5 Years | 0 (0.0%) | 0 (0.0%) |
| 5 Years | 0 (0.0%) | 0 (0.0%) |
| 6 to 11 Years | 0 (0.0%) | 0 (0.0%) |
| 12 to 14 Years | 0 (0.0%) | 0 (0.0%) |
| 15 Years | 0 (0.0%) | 0 (0.0%) |
| 16 and 17 Years | 0 (0.0%) | 0 (0.0%) |
| 18 to 24 Years | 0 (0.0%) | 0 (0.0%) |
| 25 to 34 Years | 126 (100.0%) | 81 (100.0%) |
| 35 to 44 Years | 32 (100.0%) | 0 (0.0%) |
| 45 to 54 Years | 0 (0.0%) | 17 (100.0%) |
| 55 to 64 Years | 31 (55.4%) | 127 (100.0%) |
| 65 to 74 Years | 115 (68.4%) | 95 (89.6%) |
| 75 Years and over | 134 (100.0%) | 0 (0.0%) |
| Total | 438 (69.8%) | 320 (86.7%) |
Income Below Poverty Among Married-Couple Families in Lawtell
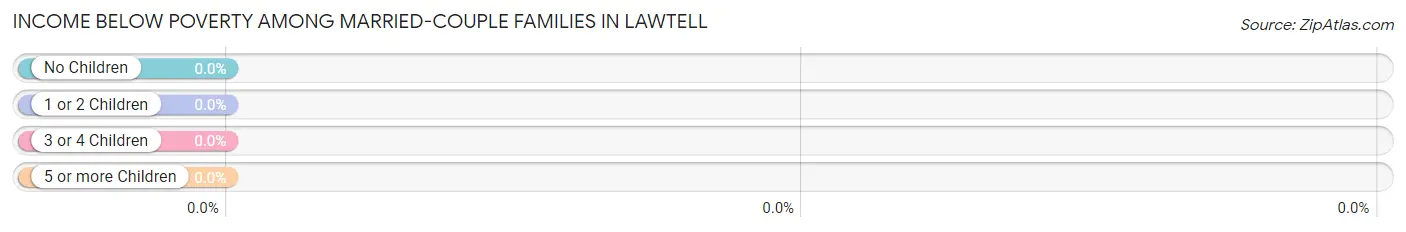
| Children | Above Poverty | Below Poverty |
| No Children | 81 (100.0%) | 0 (0.0%) |
| 1 or 2 Children | 0 (0.0%) | 0 (0.0%) |
| 3 or 4 Children | 0 (0.0%) | 0 (0.0%) |
| 5 or more Children | 0 (0.0%) | 0 (0.0%) |
| Total | 81 (100.0%) | 0 (0.0%) |
Income Below Poverty Among Single-Parent Households in Lawtell
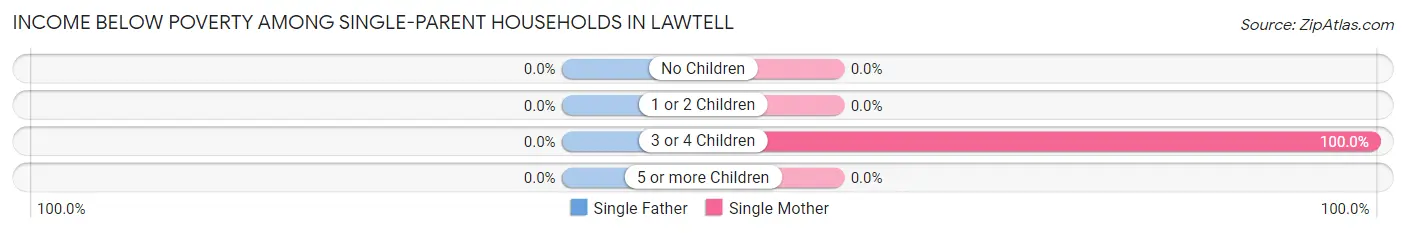
| Children | Single Father | Single Mother |
| No Children | 0 (0.0%) | 0 (0.0%) |
| 1 or 2 Children | 0 (0.0%) | 0 (0.0%) |
| 3 or 4 Children | 0 (0.0%) | 38 (100.0%) |
| 5 or more Children | 0 (0.0%) | 0 (0.0%) |
| Total | 0 (0.0%) | 38 (25.7%) |
Income Below Poverty Among Married-Couple vs Single-Parent Households in Lawtell
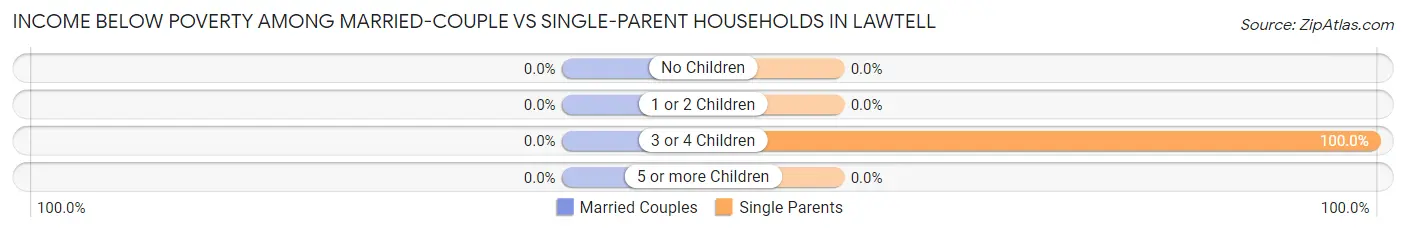
| Children | Married-Couple Families | Single-Parent Households |
| No Children | 0 (0.0%) | 0 (0.0%) |
| 1 or 2 Children | 0 (0.0%) | 0 (0.0%) |
| 3 or 4 Children | 0 (0.0%) | 38 (100.0%) |
| 5 or more Children | 0 (0.0%) | 0 (0.0%) |
| Total | 0 (0.0%) | 38 (25.7%) |
Race in Lawtell
The most populous races in Lawtell are White / Caucasian (561 | 56.3%), and Black / African American (436 | 43.7%).
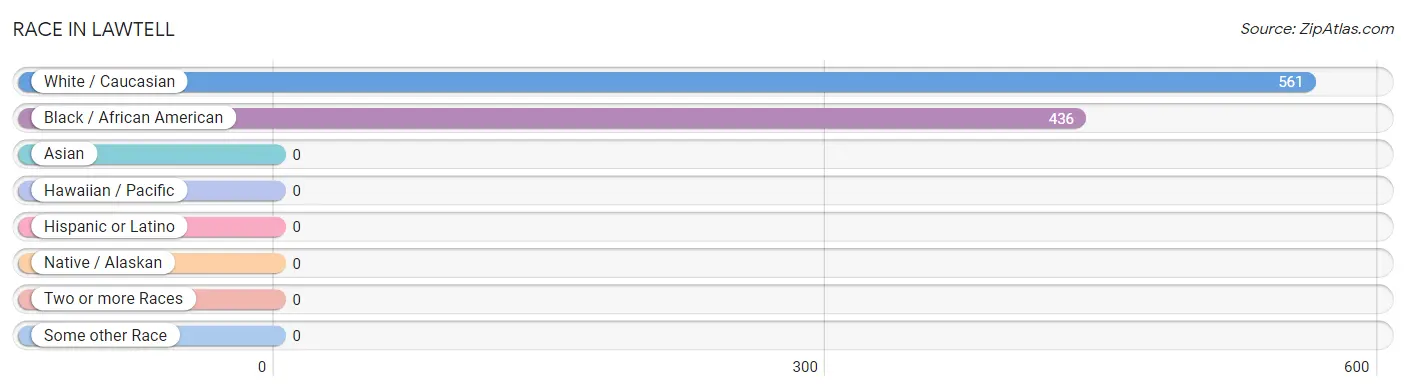
| Race | # Population | % Population |
| Asian | 0 | 0.0% |
| Black / African American | 436 | 43.7% |
| Hawaiian / Pacific | 0 | 0.0% |
| Hispanic or Latino | 0 | 0.0% |
| Native / Alaskan | 0 | 0.0% |
| White / Caucasian | 561 | 56.3% |
| Two or more Races | 0 | 0.0% |
| Some other Race | 0 | 0.0% |
| Total | 997 | 100.0% |
Ancestry in Lawtell
The most populous ancestries reported in Lawtell are French Canadian (375 | 37.6%), French (38 | 3.8%), Italian (19 | 1.9%), Scottish (10 | 1.0%), and Welsh (10 | 1.0%), together accounting for 45.3% of all Lawtell residents.
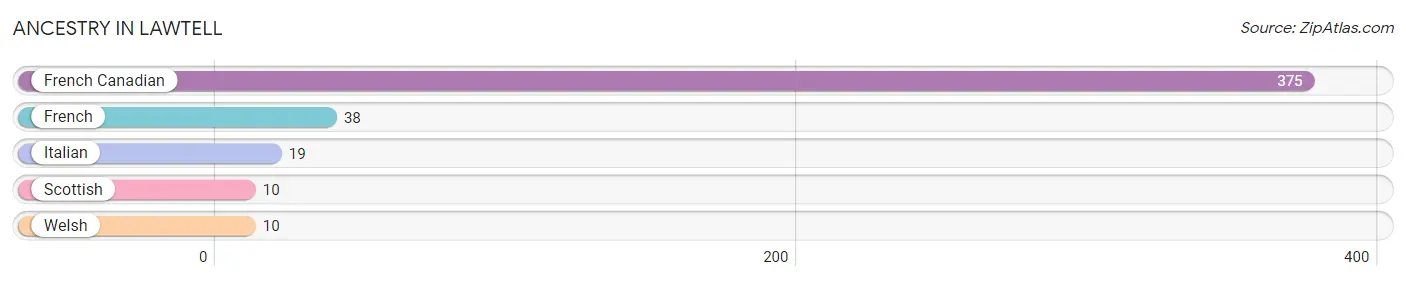
| Ancestry | # Population | % Population |
| French | 38 | 3.8% |
| French Canadian | 375 | 37.6% |
| Italian | 19 | 1.9% |
| Scottish | 10 | 1.0% |
| Welsh | 10 | 1.0% | View All 5 Rows |
Immigrants in Lawtell

| Immigration Origin | # Population | % Population | View All 0 Rows |
Sex and Age in Lawtell
Sex and Age in Lawtell
The most populous age groups in Lawtell are 65 to 69 Years (139 | 22.1%) for men and 55 to 59 Years (108 | 29.3%) for women.
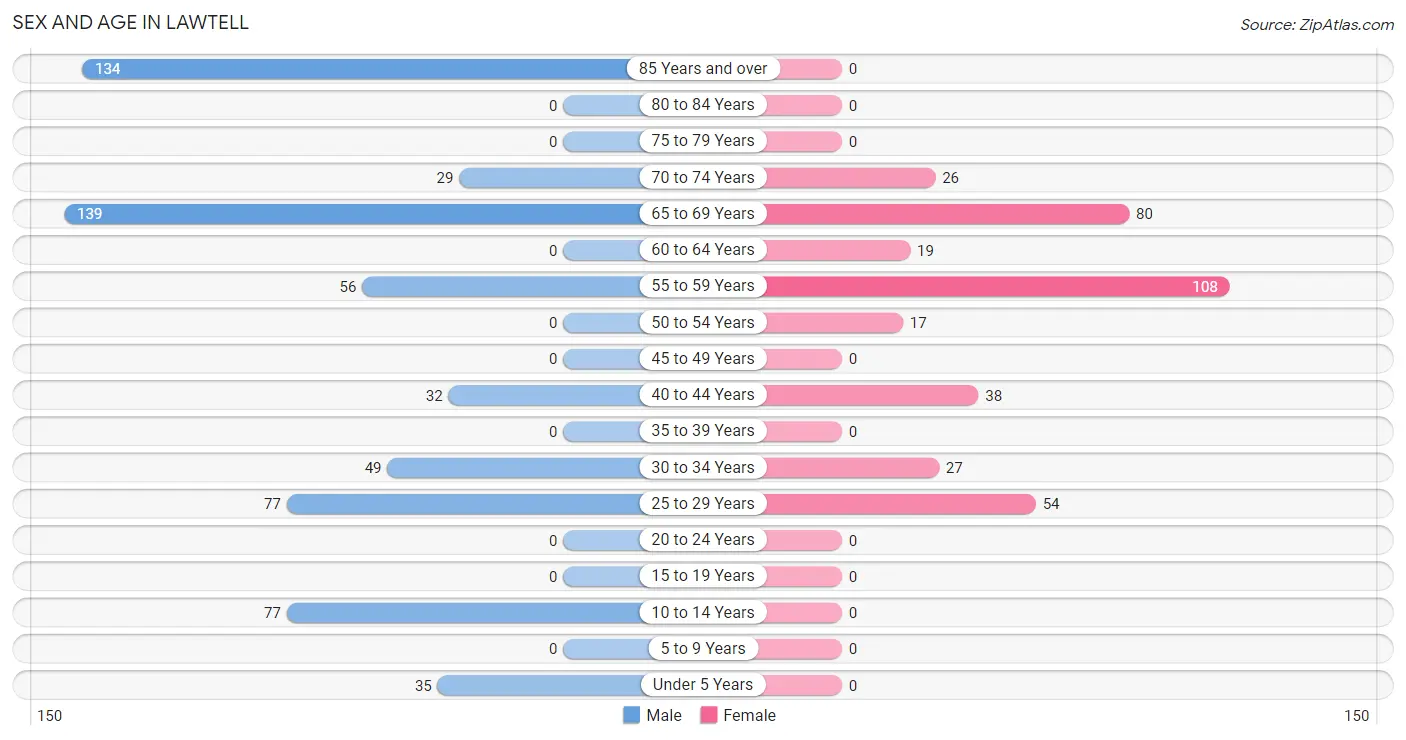
| Age Bracket | Male | Female |
| Under 5 Years | 35 (5.6%) | 0 (0.0%) |
| 5 to 9 Years | 0 (0.0%) | 0 (0.0%) |
| 10 to 14 Years | 77 (12.3%) | 0 (0.0%) |
| 15 to 19 Years | 0 (0.0%) | 0 (0.0%) |
| 20 to 24 Years | 0 (0.0%) | 0 (0.0%) |
| 25 to 29 Years | 77 (12.3%) | 54 (14.6%) |
| 30 to 34 Years | 49 (7.8%) | 27 (7.3%) |
| 35 to 39 Years | 0 (0.0%) | 0 (0.0%) |
| 40 to 44 Years | 32 (5.1%) | 38 (10.3%) |
| 45 to 49 Years | 0 (0.0%) | 0 (0.0%) |
| 50 to 54 Years | 0 (0.0%) | 17 (4.6%) |
| 55 to 59 Years | 56 (8.9%) | 108 (29.3%) |
| 60 to 64 Years | 0 (0.0%) | 19 (5.1%) |
| 65 to 69 Years | 139 (22.1%) | 80 (21.7%) |
| 70 to 74 Years | 29 (4.6%) | 26 (7.0%) |
| 75 to 79 Years | 0 (0.0%) | 0 (0.0%) |
| 80 to 84 Years | 0 (0.0%) | 0 (0.0%) |
| 85 Years and over | 134 (21.3%) | 0 (0.0%) |
| Total | 628 (100.0%) | 369 (100.0%) |
Families and Households in Lawtell
Median Family Size in Lawtell
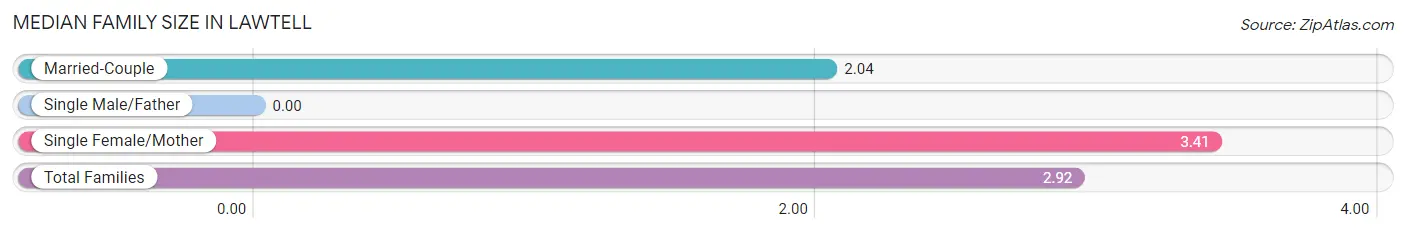
| Family Type | # Families | Family Size |
| Married-Couple | 81 (35.4%) | 2.04 |
| Single Male/Father | 0 (0.0%) | - |
| Single Female/Mother | 148 (64.6%) | 3.41 |
| Total Families | 229 (100.0%) | 2.92 |
Median Household Size in Lawtell
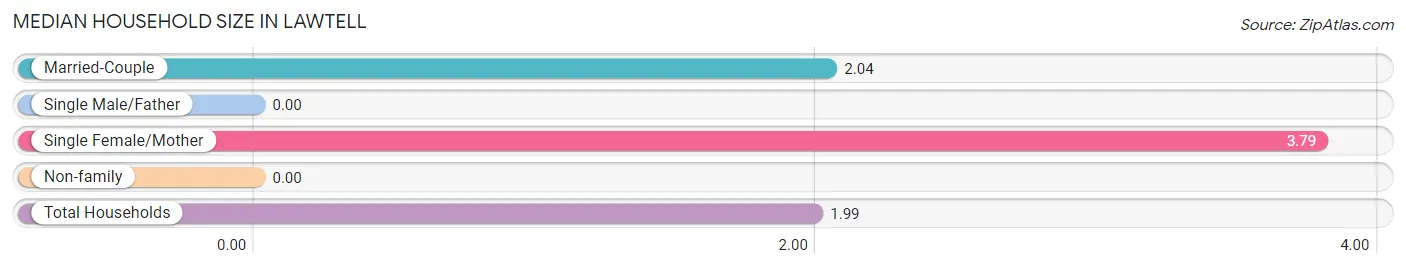
| Household Type | # Households | Household Size |
| Married-Couple | 81 (16.2%) | 2.04 |
| Single Male/Father | 0 (0.0%) | - |
| Single Female/Mother | 148 (29.6%) | 3.79 |
| Non-family | 271 (54.2%) | - |
| Total Households | 500 (100.0%) | 1.99 |
Household Size by Marriage Status in Lawtell
Out of a total of 500 households in Lawtell, 229 (45.8%) are family households, while 271 (54.2%) are nonfamily households. The most numerous type of family households are 2-person households, comprising 162, and the most common type of nonfamily households are 1-person households, comprising 271.
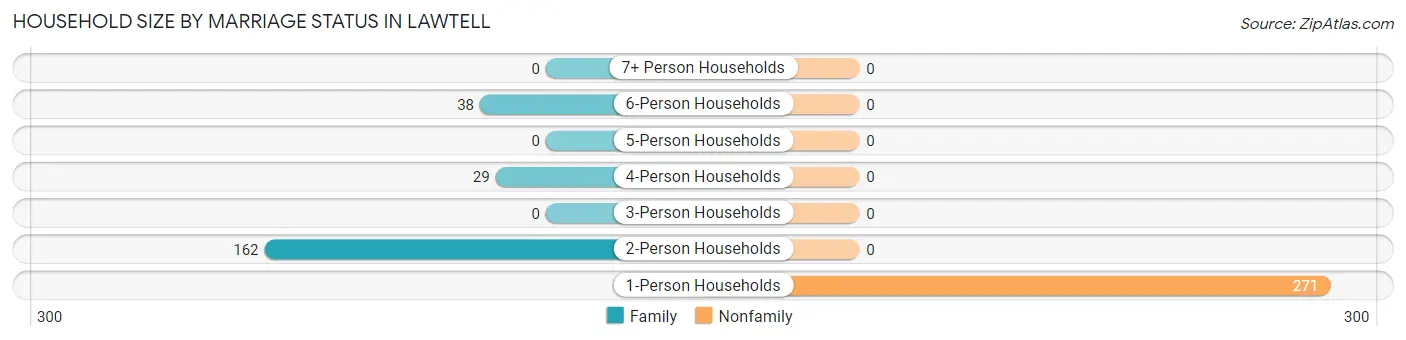
| Household Size | Family Households | Nonfamily Households |
| 1-Person Households | - | 271 (54.2%) |
| 2-Person Households | 162 (32.4%) | 0 (0.0%) |
| 3-Person Households | 0 (0.0%) | 0 (0.0%) |
| 4-Person Households | 29 (5.8%) | 0 (0.0%) |
| 5-Person Households | 0 (0.0%) | 0 (0.0%) |
| 6-Person Households | 38 (7.6%) | 0 (0.0%) |
| 7+ Person Households | 0 (0.0%) | 0 (0.0%) |
| Total | 229 (45.8%) | 271 (54.2%) |
Female Fertility in Lawtell
Fertility by Age in Lawtell
| Age Bracket | Women with Births | Births / 1,000 Women |
| 15 to 19 years | 0 (0.0%) | 0.0 |
| 20 to 34 years | 0 (0.0%) | 0.0 |
| 35 to 50 years | 0 (0.0%) | 0.0 |
| Total | 0 (0.0%) | 0.0 |
Fertility by Age by Marriage Status in Lawtell
| Age Bracket | Married | Unmarried |
| 15 to 19 years | 0 (0.0%) | 0 (0.0%) |
| 20 to 34 years | 0 (0.0%) | 0 (0.0%) |
| 35 to 50 years | 0 (0.0%) | 0 (0.0%) |
| Total | 0 (0.0%) | 0 (0.0%) |
Fertility by Education in Lawtell
| Educational Attainment | Women with Births | Births / 1,000 Women |
| Less than High School | 0 (0.0%) | 0.0 |
| High School Diploma | 0 (0.0%) | 0.0 |
| College or Associate's Degree | 0 (0.0%) | 0.0 |
| Bachelor's Degree | 0 (0.0%) | 0.0 |
| Graduate Degree | 0 (0.0%) | 0.0 |
| Total | 0 (0.0%) | 0.0 |
Fertility by Education by Marriage Status in Lawtell
| Educational Attainment | Married | Unmarried |
| Less than High School | 0 (0.0%) | 0 (0.0%) |
| High School Diploma | 0 (0.0%) | 0 (0.0%) |
| College or Associate's Degree | 0 (0.0%) | 0 (0.0%) |
| Bachelor's Degree | 0 (0.0%) | 0 (0.0%) |
| Graduate Degree | 0 (0.0%) | 0 (0.0%) |
| Total | 0 (0.0%) | 0 (0.0%) |
Employment Characteristics in Lawtell
Employment by Class of Employer in Lawtell
Among the 341 employed individuals in Lawtell, private company employees (305 | 89.4%), local government employees (19 | 5.6%), and state government employees (17 | 5.0%) make up the most common classes of employment.
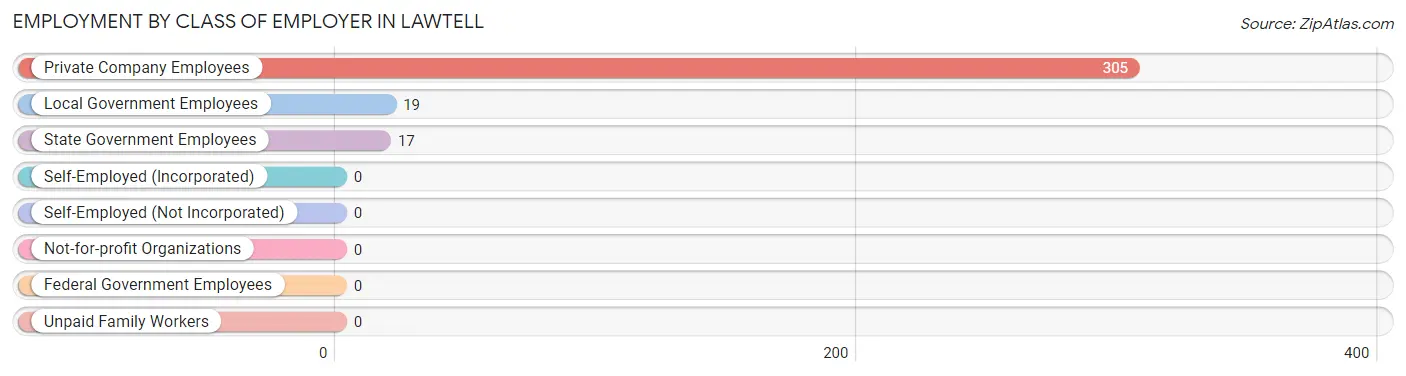
| Employer Class | # Employees | % Employees |
| Private Company Employees | 305 | 89.4% |
| Self-Employed (Incorporated) | 0 | 0.0% |
| Self-Employed (Not Incorporated) | 0 | 0.0% |
| Not-for-profit Organizations | 0 | 0.0% |
| Local Government Employees | 19 | 5.6% |
| State Government Employees | 17 | 5.0% |
| Federal Government Employees | 0 | 0.0% |
| Unpaid Family Workers | 0 | 0.0% |
| Total | 341 | 100.0% |
Employment Status by Age in Lawtell
According to the labor force statistics for Lawtell, out of the total population over 16 years of age (885), 44.1% or 390 individuals are in the labor force, with 12.6% or 49 of them unemployed. The age group with the highest labor force participation rate is 25 to 29 years, with 100.0% or 131 individuals in the labor force. Within the labor force, the 30 to 34 years age range has the highest percentage of unemployed individuals, with 64.5% or 49 of them being unemployed.
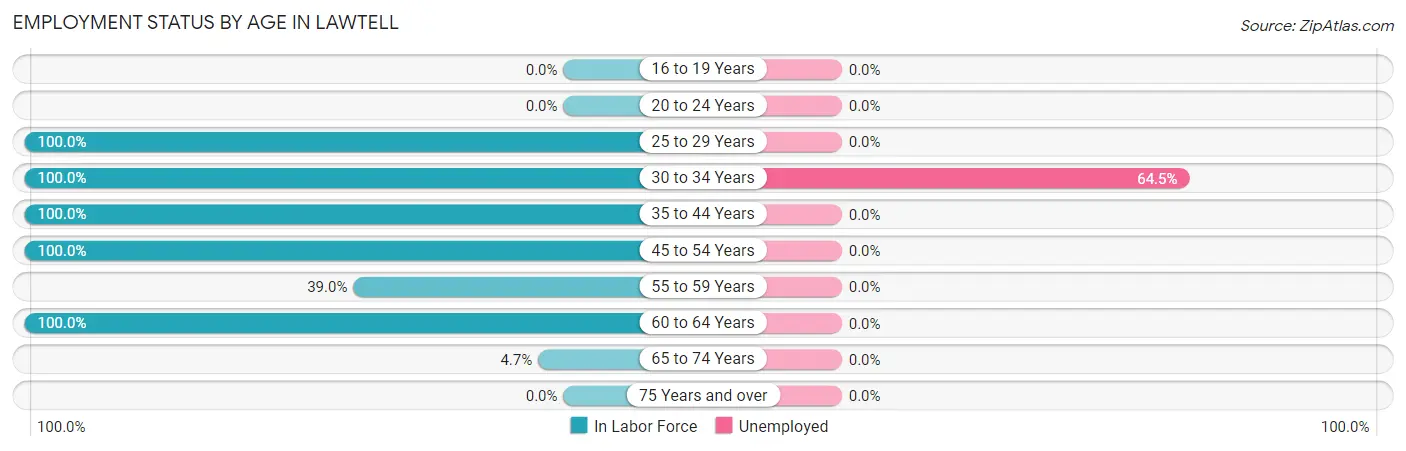
| Age Bracket | In Labor Force | Unemployed |
| 16 to 19 Years | 0 (0.0%) | 0 (0.0%) |
| 20 to 24 Years | 0 (0.0%) | 0 (0.0%) |
| 25 to 29 Years | 131 (100.0%) | 0 (0.0%) |
| 30 to 34 Years | 76 (100.0%) | 49 (64.5%) |
| 35 to 44 Years | 70 (100.0%) | 0 (0.0%) |
| 45 to 54 Years | 17 (100.0%) | 0 (0.0%) |
| 55 to 59 Years | 64 (39.0%) | 0 (0.0%) |
| 60 to 64 Years | 19 (100.0%) | 0 (0.0%) |
| 65 to 74 Years | 13 (4.7%) | 0 (0.0%) |
| 75 Years and over | 0 (0.0%) | 0 (0.0%) |
| Total | 390 (44.1%) | 49 (12.6%) |
Employment Status by Educational Attainment in Lawtell
According to labor force statistics for Lawtell, 79.0% of individuals (377) out of the total population between 25 and 64 years of age (477) are in the labor force, with 13.0% or 49 of them being unemployed. The group with the highest labor force participation rate are those with the educational attainment of high school diploma, with 84.6% or 313 individuals in the labor force. Within the labor force, individuals with high school diploma education have the highest percentage of unemployment, with 15.7% or 49 of them being unemployed.
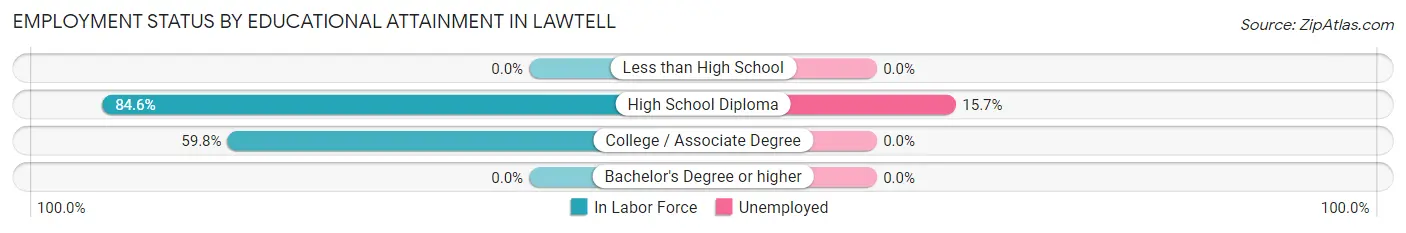
| Educational Attainment | In Labor Force | Unemployed |
| Less than High School | 0 (0.0%) | 0 (0.0%) |
| High School Diploma | 313 (84.6%) | 58 (15.7%) |
| College / Associate Degree | 64 (59.8%) | 0 (0.0%) |
| Bachelor's Degree or higher | 0 (0.0%) | 0 (0.0%) |
| Total | 377 (79.0%) | 62 (13.0%) |
Employment Occupations by Sex in Lawtell
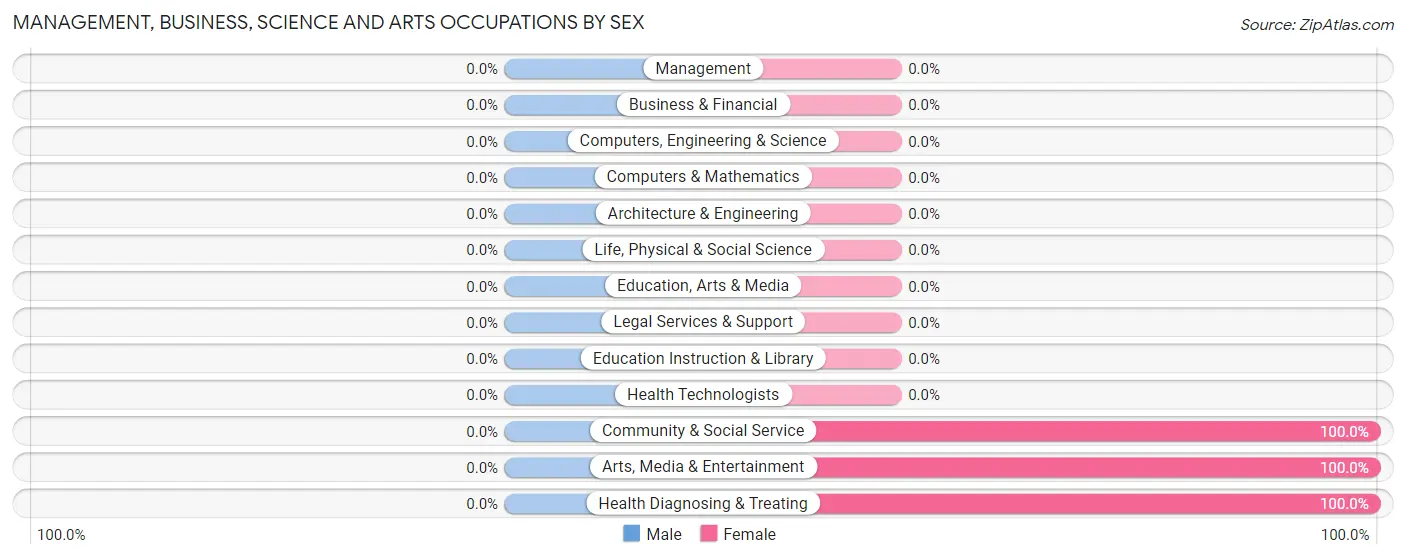
Management, Business, Science and Arts Occupations
The most common Management, Business, Science and Arts occupations in Lawtell are Health Diagnosing & Treating (77 | 22.6%), Community & Social Service (19 | 5.6%), and Arts, Media & Entertainment (19 | 5.6%).
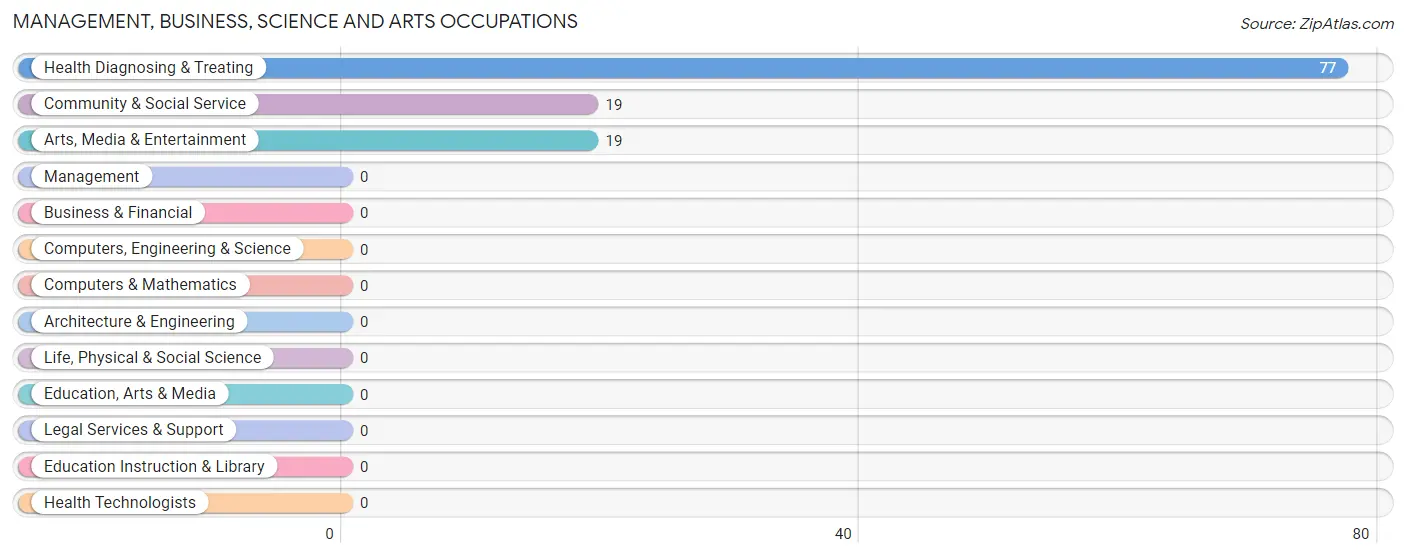
Management, Business, Science and Arts Occupations by Sex
| Occupation | Male | Female |
| Management | 0 (0.0%) | 0 (0.0%) |
| Business & Financial | 0 (0.0%) | 0 (0.0%) |
| Computers, Engineering & Science | 0 (0.0%) | 0 (0.0%) |
| Computers & Mathematics | 0 (0.0%) | 0 (0.0%) |
| Architecture & Engineering | 0 (0.0%) | 0 (0.0%) |
| Life, Physical & Social Science | 0 (0.0%) | 0 (0.0%) |
| Community & Social Service | 0 (0.0%) | 19 (100.0%) |
| Education, Arts & Media | 0 (0.0%) | 0 (0.0%) |
| Legal Services & Support | 0 (0.0%) | 0 (0.0%) |
| Education Instruction & Library | 0 (0.0%) | 0 (0.0%) |
| Arts, Media & Entertainment | 0 (0.0%) | 19 (100.0%) |
| Health Diagnosing & Treating | 0 (0.0%) | 77 (100.0%) |
| Health Technologists | 0 (0.0%) | 0 (0.0%) |
| Total (Category) | 0 (0.0%) | 96 (100.0%) |
| Total (Overall) | 109 (32.0%) | 232 (68.0%) |
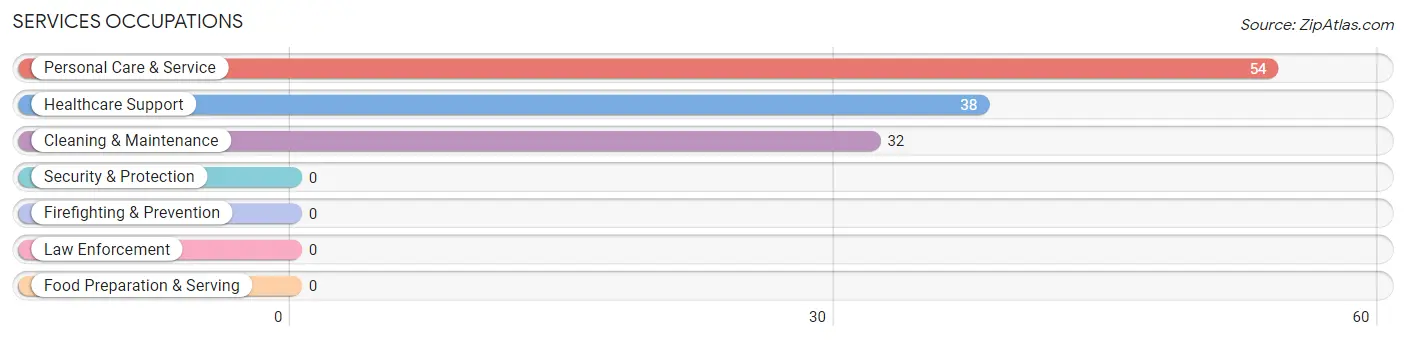
Services Occupations
The most common Services occupations in Lawtell are Personal Care & Service (54 | 15.8%), Healthcare Support (38 | 11.1%), and Cleaning & Maintenance (32 | 9.4%).
Services Occupations by Sex
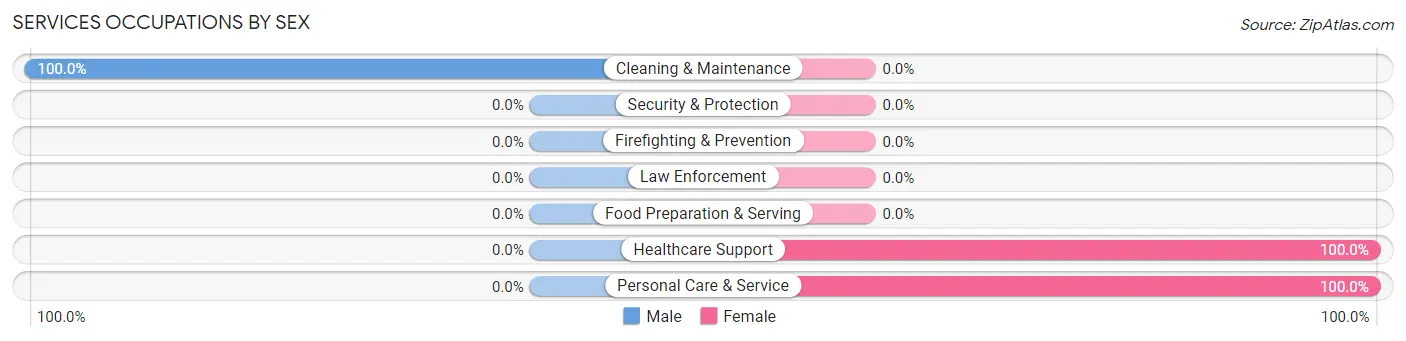
| Occupation | Male | Female |
| Healthcare Support | 0 (0.0%) | 38 (100.0%) |
| Security & Protection | 0 (0.0%) | 0 (0.0%) |
| Firefighting & Prevention | 0 (0.0%) | 0 (0.0%) |
| Law Enforcement | 0 (0.0%) | 0 (0.0%) |
| Food Preparation & Serving | 0 (0.0%) | 0 (0.0%) |
| Cleaning & Maintenance | 32 (100.0%) | 0 (0.0%) |
| Personal Care & Service | 0 (0.0%) | 54 (100.0%) |
| Total (Category) | 32 (25.8%) | 92 (74.2%) |
| Total (Overall) | 109 (32.0%) | 232 (68.0%) |
Sales and Office Occupations
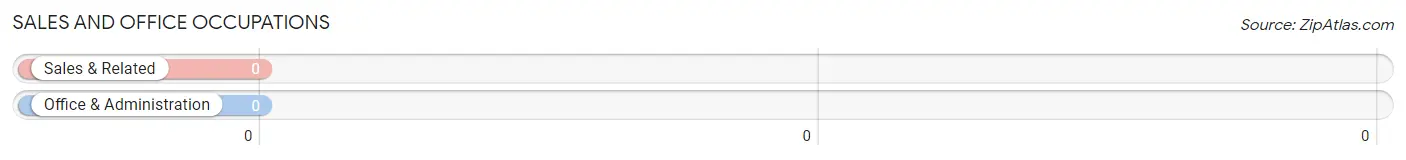
Sales and Office Occupations by Sex
| Occupation | Male | Female |
| Sales & Related | 0 (0.0%) | 0 (0.0%) |
| Office & Administration | 0 (0.0%) | 0 (0.0%) |
| Total (Category) | 0 (0.0%) | 0 (0.0%) |
| Total (Overall) | 109 (32.0%) | 232 (68.0%) |
Natural Resources, Construction and Maintenance Occupations
The most common Natural Resources, Construction and Maintenance occupations in Lawtell are , and Installation, Maintenance & Repair (77 | 22.6%).
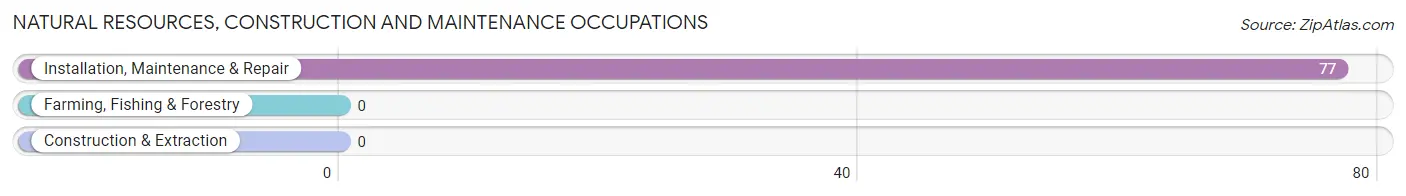
Natural Resources, Construction and Maintenance Occupations by Sex
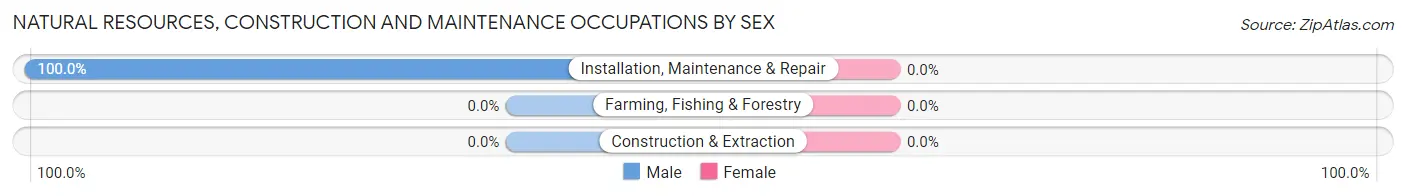
| Occupation | Male | Female |
| Farming, Fishing & Forestry | 0 (0.0%) | 0 (0.0%) |
| Construction & Extraction | 0 (0.0%) | 0 (0.0%) |
| Installation, Maintenance & Repair | 77 (100.0%) | 0 (0.0%) |
| Total (Category) | 77 (100.0%) | 0 (0.0%) |
| Total (Overall) | 109 (32.0%) | 232 (68.0%) |
Production, Transportation and Moving Occupations
The most common Production, Transportation and Moving occupations in Lawtell are Material Moving (27 | 7.9%), and Transportation (17 | 5.0%).
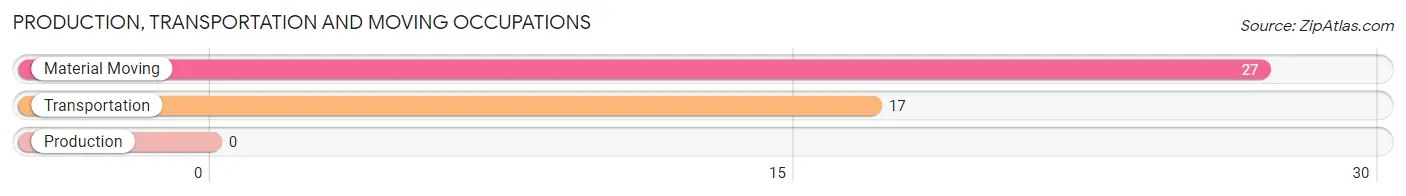
Production, Transportation and Moving Occupations by Sex
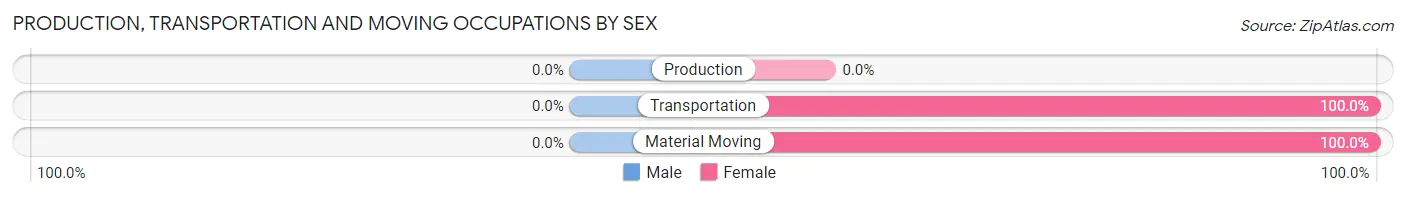
| Occupation | Male | Female |
| Production | 0 (0.0%) | 0 (0.0%) |
| Transportation | 0 (0.0%) | 17 (100.0%) |
| Material Moving | 0 (0.0%) | 27 (100.0%) |
| Total (Category) | 0 (0.0%) | 44 (100.0%) |
| Total (Overall) | 109 (32.0%) | 232 (68.0%) |
Employment Industries by Sex in Lawtell
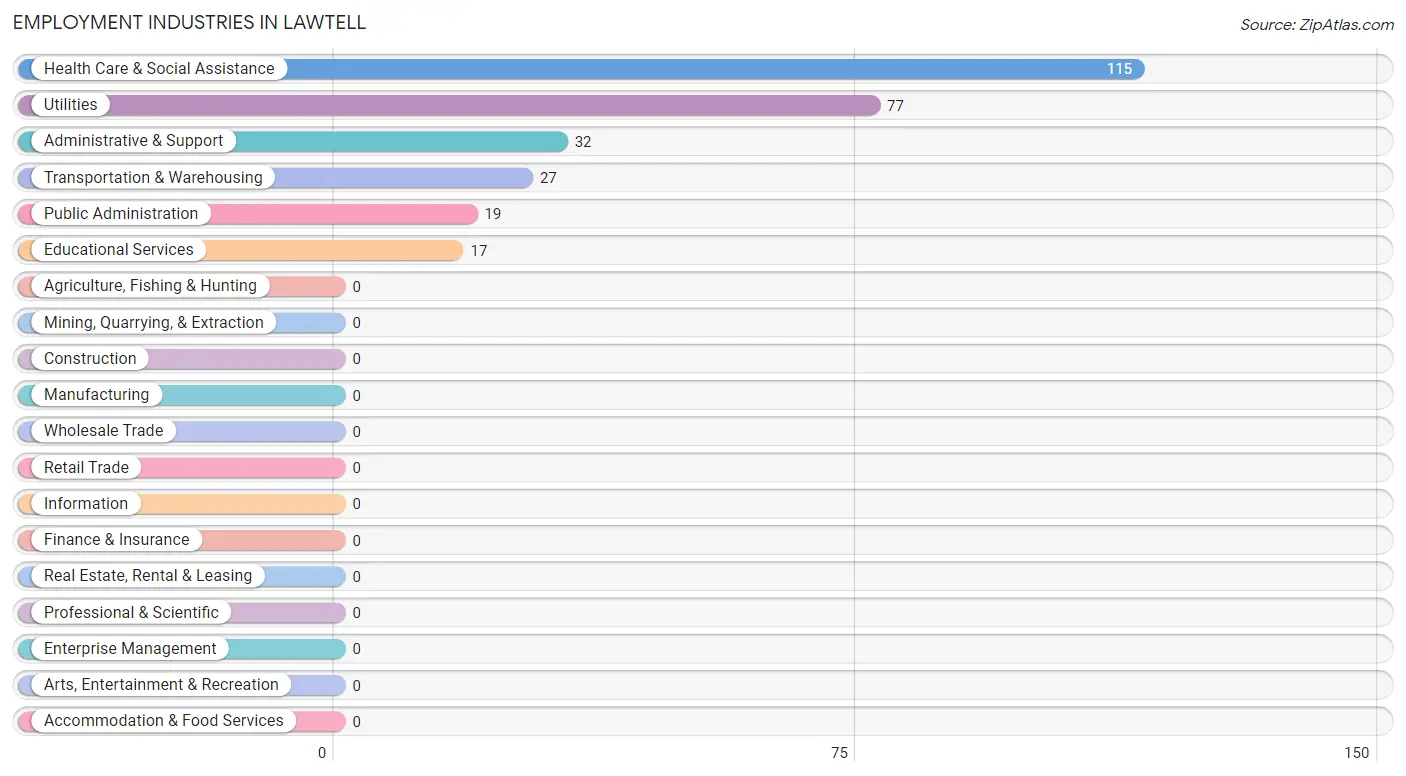
Employment Industries in Lawtell
The major employment industries in Lawtell include Health Care & Social Assistance (115 | 33.7%), Utilities (77 | 22.6%), Administrative & Support (32 | 9.4%), Transportation & Warehousing (27 | 7.9%), and Public Administration (19 | 5.6%).
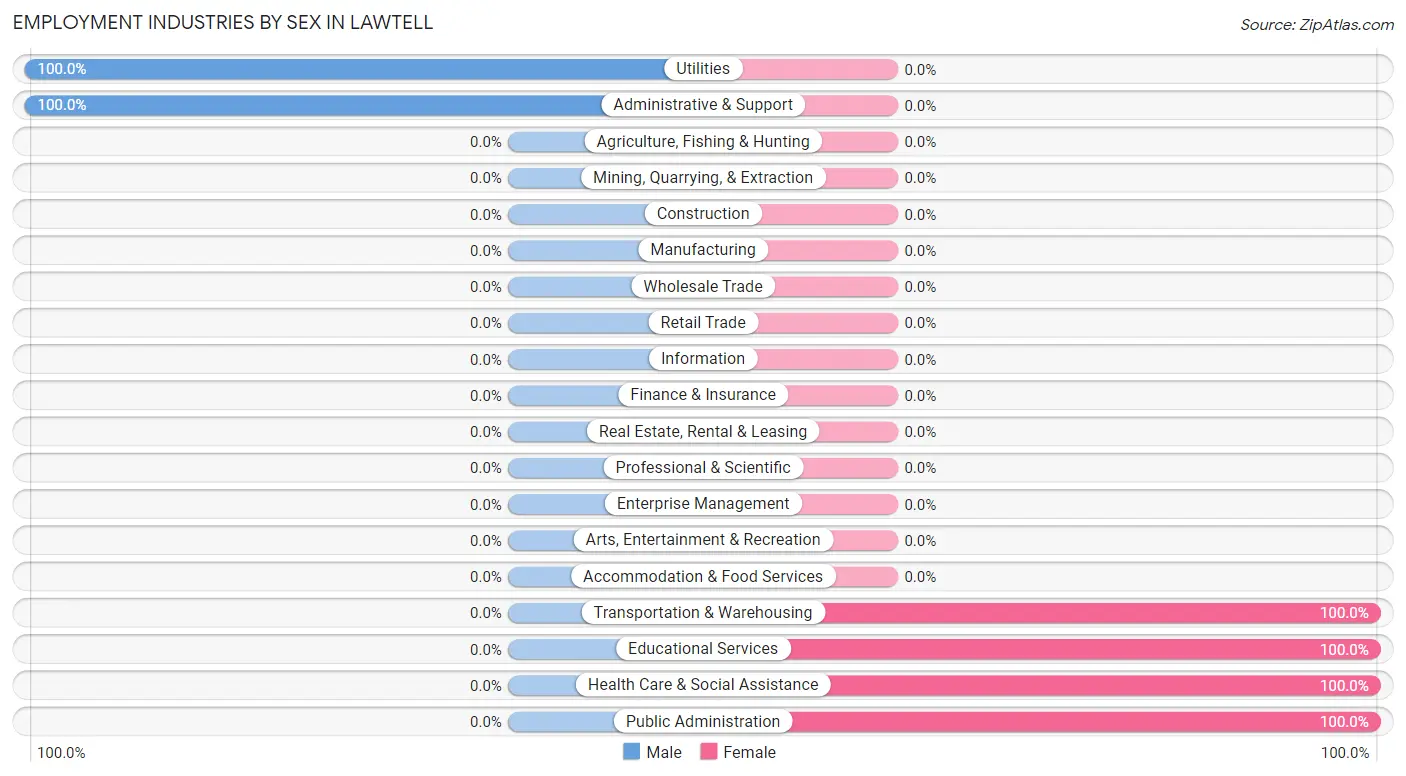
Employment Industries by Sex in Lawtell
The Lawtell industries that see more men than women are Utilities (100.0%), and Administrative & Support (100.0%), whereas the industries that tend to have a higher number of women are Transportation & Warehousing (100.0%), Educational Services (100.0%), and Health Care & Social Assistance (100.0%).
| Industry | Male | Female |
| Agriculture, Fishing & Hunting | 0 (0.0%) | 0 (0.0%) |
| Mining, Quarrying, & Extraction | 0 (0.0%) | 0 (0.0%) |
| Construction | 0 (0.0%) | 0 (0.0%) |
| Manufacturing | 0 (0.0%) | 0 (0.0%) |
| Wholesale Trade | 0 (0.0%) | 0 (0.0%) |
| Retail Trade | 0 (0.0%) | 0 (0.0%) |
| Transportation & Warehousing | 0 (0.0%) | 27 (100.0%) |
| Utilities | 77 (100.0%) | 0 (0.0%) |
| Information | 0 (0.0%) | 0 (0.0%) |
| Finance & Insurance | 0 (0.0%) | 0 (0.0%) |
| Real Estate, Rental & Leasing | 0 (0.0%) | 0 (0.0%) |
| Professional & Scientific | 0 (0.0%) | 0 (0.0%) |
| Enterprise Management | 0 (0.0%) | 0 (0.0%) |
| Administrative & Support | 32 (100.0%) | 0 (0.0%) |
| Educational Services | 0 (0.0%) | 17 (100.0%) |
| Health Care & Social Assistance | 0 (0.0%) | 115 (100.0%) |
| Arts, Entertainment & Recreation | 0 (0.0%) | 0 (0.0%) |
| Accommodation & Food Services | 0 (0.0%) | 0 (0.0%) |
| Public Administration | 0 (0.0%) | 19 (100.0%) |
| Total | 109 (32.0%) | 232 (68.0%) |
Education in Lawtell
School Enrollment in Lawtell
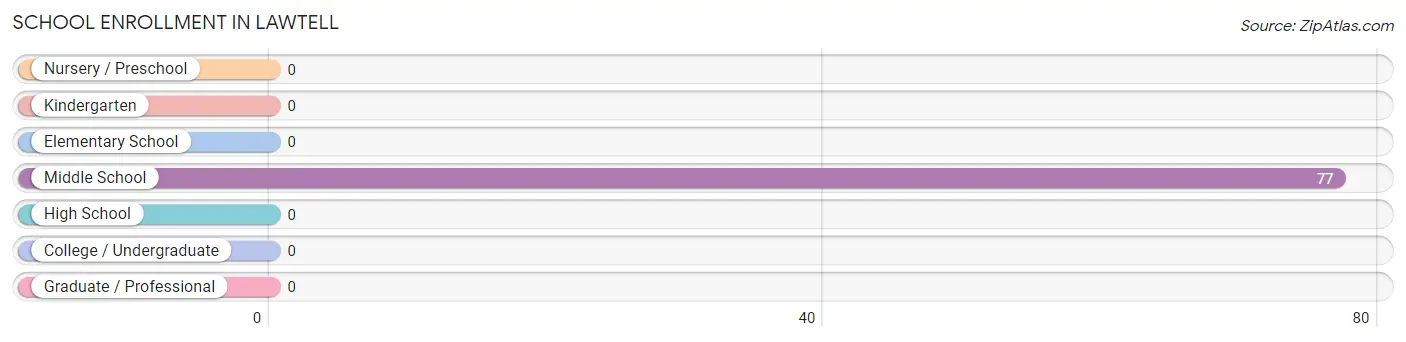
| School Level | # Students | % Students |
| Nursery / Preschool | 0 | 0.0% |
| Kindergarten | 0 | 0.0% |
| Elementary School | 0 | 0.0% |
| Middle School | 77 | 100.0% |
| High School | 0 | 0.0% |
| College / Undergraduate | 0 | 0.0% |
| Graduate / Professional | 0 | 0.0% |
| Total | 77 | 100.0% |
School Enrollment by Age by Funding Source in Lawtell
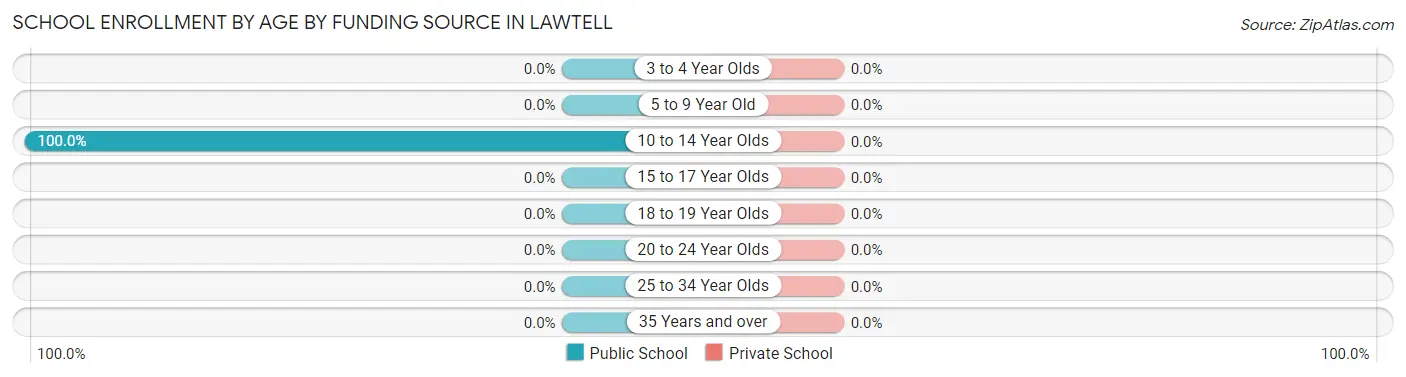
| Age Bracket | Public School | Private School |
| 3 to 4 Year Olds | 0 (0.0%) | 0 (0.0%) |
| 5 to 9 Year Old | 0 (0.0%) | 0 (0.0%) |
| 10 to 14 Year Olds | 77 (100.0%) | 0 (0.0%) |
| 15 to 17 Year Olds | 0 (0.0%) | 0 (0.0%) |
| 18 to 19 Year Olds | 0 (0.0%) | 0 (0.0%) |
| 20 to 24 Year Olds | 0 (0.0%) | 0 (0.0%) |
| 25 to 34 Year Olds | 0 (0.0%) | 0 (0.0%) |
| 35 Years and over | 0 (0.0%) | 0 (0.0%) |
| Total | 77 (100.0%) | 0 (0.0%) |
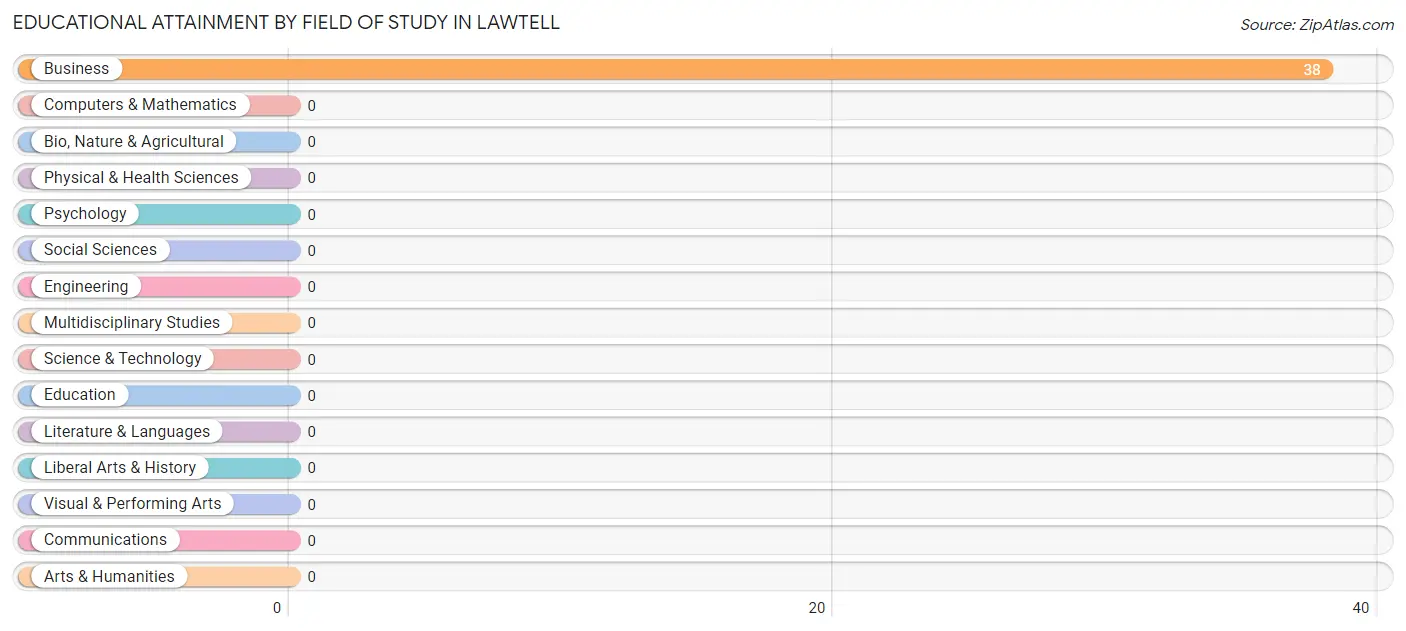
Educational Attainment by Field of Study in Lawtell
, and business (38 | 100.0%) are the most common fields of study among 38 individuals in Lawtell who have obtained a bachelor's degree or higher.
| Field of Study | # Graduates | % Graduates |
| Computers & Mathematics | 0 | 0.0% |
| Bio, Nature & Agricultural | 0 | 0.0% |
| Physical & Health Sciences | 0 | 0.0% |
| Psychology | 0 | 0.0% |
| Social Sciences | 0 | 0.0% |
| Engineering | 0 | 0.0% |
| Multidisciplinary Studies | 0 | 0.0% |
| Science & Technology | 0 | 0.0% |
| Business | 38 | 100.0% |
| Education | 0 | 0.0% |
| Literature & Languages | 0 | 0.0% |
| Liberal Arts & History | 0 | 0.0% |
| Visual & Performing Arts | 0 | 0.0% |
| Communications | 0 | 0.0% |
| Arts & Humanities | 0 | 0.0% |
| Total | 38 | 100.0% |
Transportation & Commute in Lawtell
Vehicle Availability by Sex in Lawtell
The most prevalent vehicle ownership categories in Lawtell are males with 1 vehicle (109, accounting for 100.0%) and females with 1 vehicle (232, making up 47.0%).
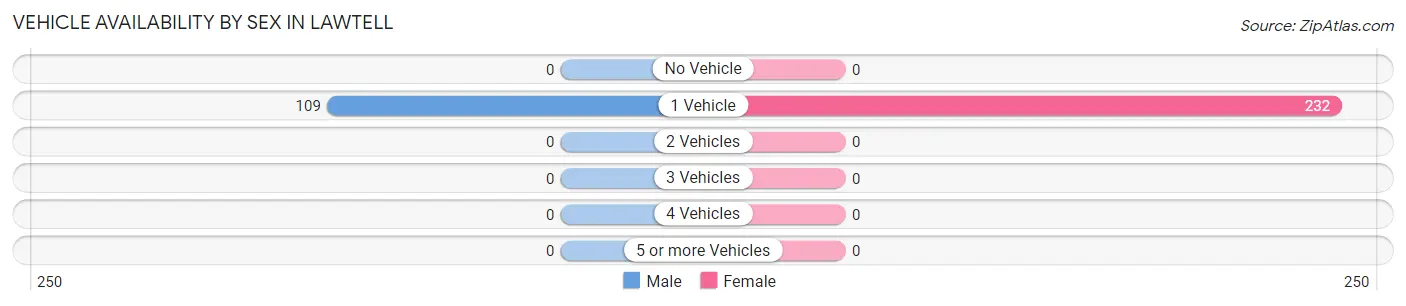
| Vehicles Available | Male | Female |
| No Vehicle | 0 (0.0%) | 0 (0.0%) |
| 1 Vehicle | 109 (100.0%) | 232 (100.0%) |
| 2 Vehicles | 0 (0.0%) | 0 (0.0%) |
| 3 Vehicles | 0 (0.0%) | 0 (0.0%) |
| 4 Vehicles | 0 (0.0%) | 0 (0.0%) |
| 5 or more Vehicles | 0 (0.0%) | 0 (0.0%) |
| Total | 109 (100.0%) | 232 (100.0%) |
Commute Time in Lawtell
The most frequently occuring commute durations in Lawtell are 10 to 14 minutes (118 commuters, 34.6%), 60 to 89 minutes (94 commuters, 27.6%), and 25 to 29 minutes (59 commuters, 17.3%).
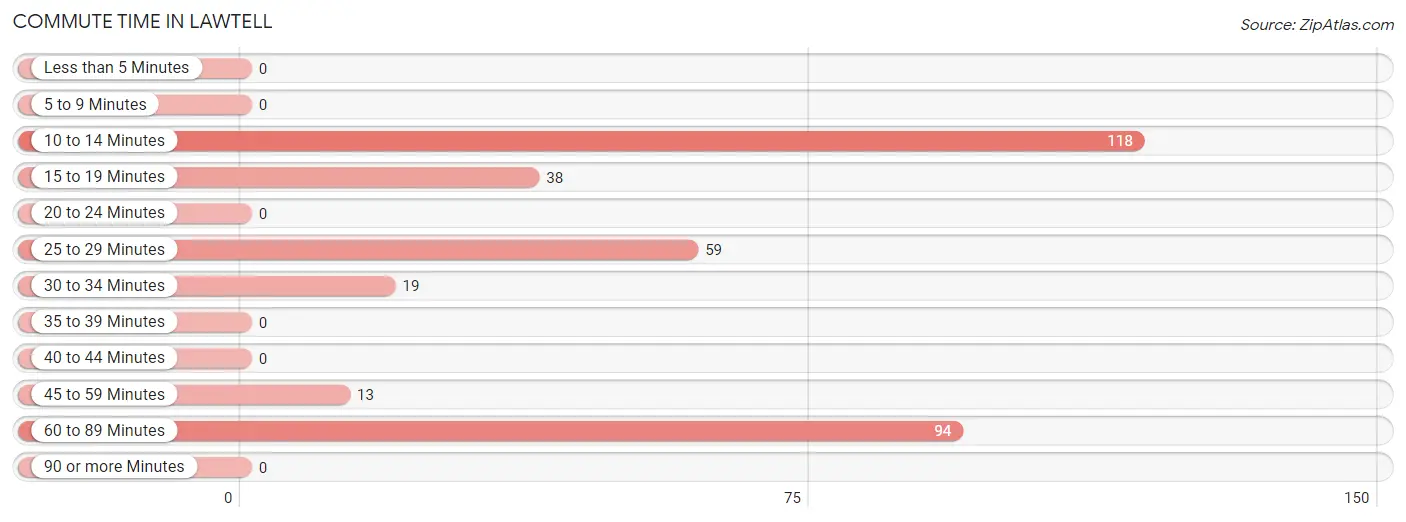
| Commute Time | # Commuters | % Commuters |
| Less than 5 Minutes | 0 | 0.0% |
| 5 to 9 Minutes | 0 | 0.0% |
| 10 to 14 Minutes | 118 | 34.6% |
| 15 to 19 Minutes | 38 | 11.1% |
| 20 to 24 Minutes | 0 | 0.0% |
| 25 to 29 Minutes | 59 | 17.3% |
| 30 to 34 Minutes | 19 | 5.6% |
| 35 to 39 Minutes | 0 | 0.0% |
| 40 to 44 Minutes | 0 | 0.0% |
| 45 to 59 Minutes | 13 | 3.8% |
| 60 to 89 Minutes | 94 | 27.6% |
| 90 or more Minutes | 0 | 0.0% |
Commute Time by Sex in Lawtell
The most common commute times in Lawtell are 60 to 89 minutes (77 commuters, 70.6%) for males and 10 to 14 minutes (118 commuters, 50.9%) for females.
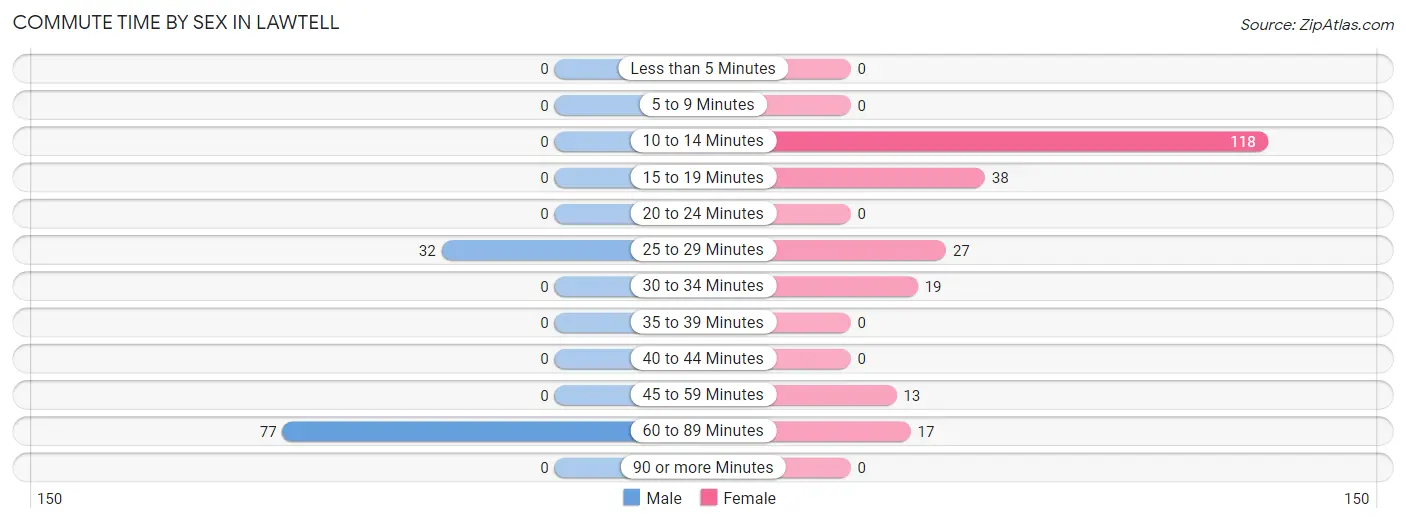
| Commute Time | Male | Female |
| Less than 5 Minutes | 0 (0.0%) | 0 (0.0%) |
| 5 to 9 Minutes | 0 (0.0%) | 0 (0.0%) |
| 10 to 14 Minutes | 0 (0.0%) | 118 (50.9%) |
| 15 to 19 Minutes | 0 (0.0%) | 38 (16.4%) |
| 20 to 24 Minutes | 0 (0.0%) | 0 (0.0%) |
| 25 to 29 Minutes | 32 (29.4%) | 27 (11.6%) |
| 30 to 34 Minutes | 0 (0.0%) | 19 (8.2%) |
| 35 to 39 Minutes | 0 (0.0%) | 0 (0.0%) |
| 40 to 44 Minutes | 0 (0.0%) | 0 (0.0%) |
| 45 to 59 Minutes | 0 (0.0%) | 13 (5.6%) |
| 60 to 89 Minutes | 77 (70.6%) | 17 (7.3%) |
| 90 or more Minutes | 0 (0.0%) | 0 (0.0%) |
Time of Departure to Work by Sex in Lawtell
The most frequent times of departure to work in Lawtell are 7:00 AM to 7:29 AM (77, 70.6%) for males and 7:00 AM to 7:29 AM (131, 56.5%) for females.
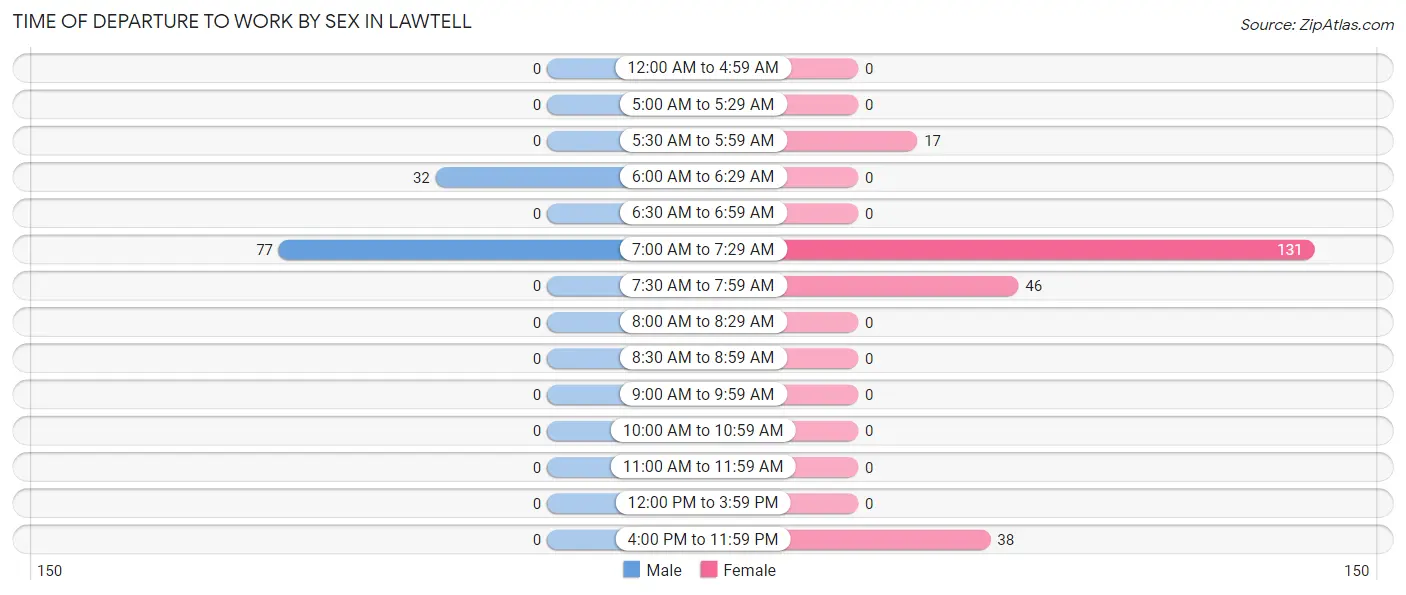
| Time of Departure | Male | Female |
| 12:00 AM to 4:59 AM | 0 (0.0%) | 0 (0.0%) |
| 5:00 AM to 5:29 AM | 0 (0.0%) | 0 (0.0%) |
| 5:30 AM to 5:59 AM | 0 (0.0%) | 17 (7.3%) |
| 6:00 AM to 6:29 AM | 32 (29.4%) | 0 (0.0%) |
| 6:30 AM to 6:59 AM | 0 (0.0%) | 0 (0.0%) |
| 7:00 AM to 7:29 AM | 77 (70.6%) | 131 (56.5%) |
| 7:30 AM to 7:59 AM | 0 (0.0%) | 46 (19.8%) |
| 8:00 AM to 8:29 AM | 0 (0.0%) | 0 (0.0%) |
| 8:30 AM to 8:59 AM | 0 (0.0%) | 0 (0.0%) |
| 9:00 AM to 9:59 AM | 0 (0.0%) | 0 (0.0%) |
| 10:00 AM to 10:59 AM | 0 (0.0%) | 0 (0.0%) |
| 11:00 AM to 11:59 AM | 0 (0.0%) | 0 (0.0%) |
| 12:00 PM to 3:59 PM | 0 (0.0%) | 0 (0.0%) |
| 4:00 PM to 11:59 PM | 0 (0.0%) | 38 (16.4%) |
| Total | 109 (100.0%) | 232 (100.0%) |
Housing Occupancy in Lawtell
Occupancy by Ownership in Lawtell
Of the total 500 dwellings in Lawtell, owner-occupied units account for 433 (86.6%), while renter-occupied units make up 67 (13.4%).
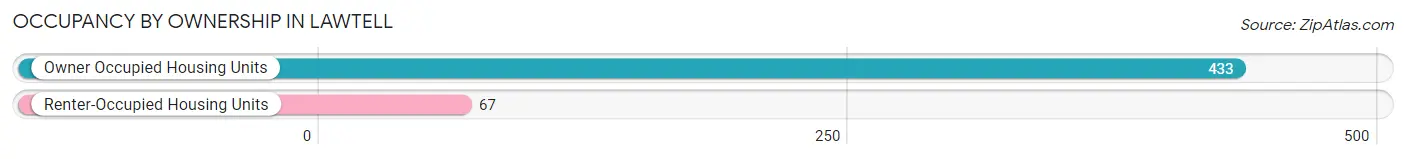
| Occupancy | # Housing Units | % Housing Units |
| Owner Occupied Housing Units | 433 | 86.6% |
| Renter-Occupied Housing Units | 67 | 13.4% |
| Total Occupied Housing Units | 500 | 100.0% |
Occupancy by Household Size in Lawtell
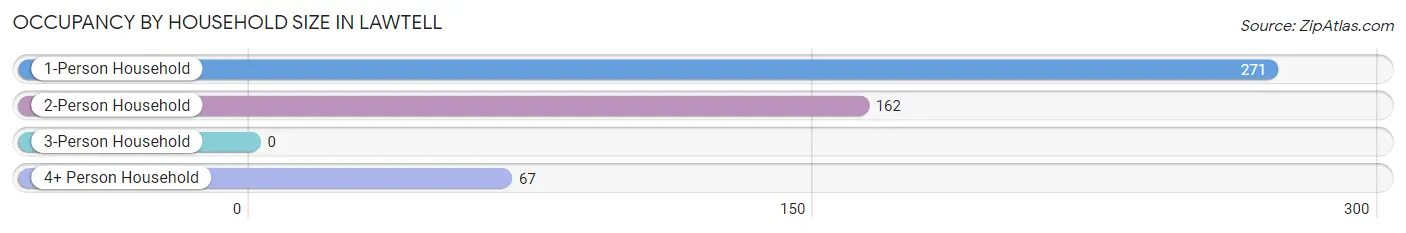
| Household Size | # Housing Units | % Housing Units |
| 1-Person Household | 271 | 54.2% |
| 2-Person Household | 162 | 32.4% |
| 3-Person Household | 0 | 0.0% |
| 4+ Person Household | 67 | 13.4% |
| Total Housing Units | 500 | 100.0% |
Occupancy by Ownership by Household Size in Lawtell
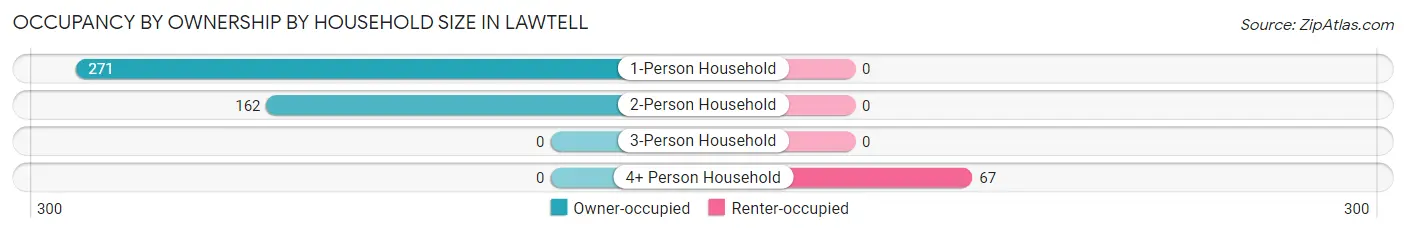
| Household Size | Owner-occupied | Renter-occupied |
| 1-Person Household | 271 (100.0%) | 0 (0.0%) |
| 2-Person Household | 162 (100.0%) | 0 (0.0%) |
| 3-Person Household | 0 (0.0%) | 0 (0.0%) |
| 4+ Person Household | 0 (0.0%) | 67 (100.0%) |
| Total Housing Units | 433 (86.6%) | 67 (13.4%) |
Occupancy by Educational Attainment in Lawtell
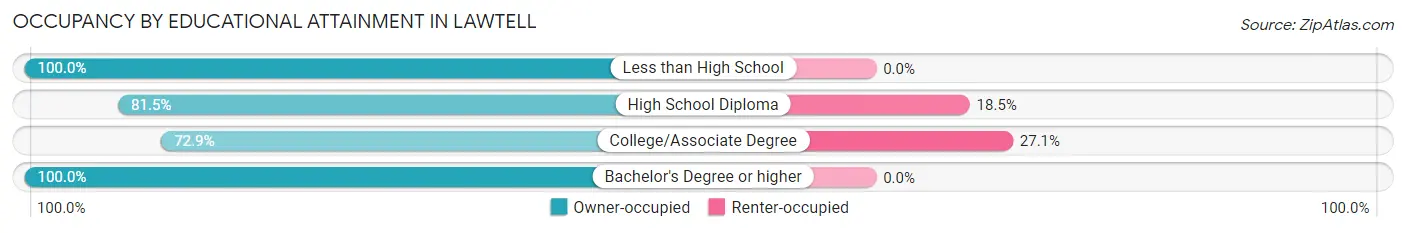
| Household Size | Owner-occupied | Renter-occupied |
| Less than High School | 150 (100.0%) | 0 (0.0%) |
| High School Diploma | 167 (81.5%) | 38 (18.5%) |
| College/Associate Degree | 78 (72.9%) | 29 (27.1%) |
| Bachelor's Degree or higher | 38 (100.0%) | 0 (0.0%) |
Occupancy by Age of Householder in Lawtell
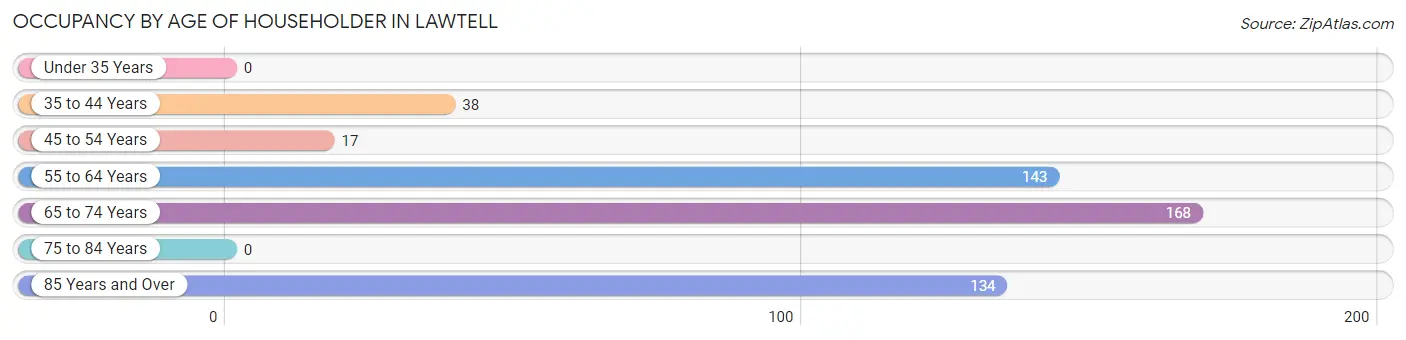
| Age Bracket | # Households | % Households |
| Under 35 Years | 0 | 0.0% |
| 35 to 44 Years | 38 | 7.6% |
| 45 to 54 Years | 17 | 3.4% |
| 55 to 64 Years | 143 | 28.6% |
| 65 to 74 Years | 168 | 33.6% |
| 75 to 84 Years | 0 | 0.0% |
| 85 Years and Over | 134 | 26.8% |
| Total | 500 | 100.0% |
Housing Finances in Lawtell
Median Income by Occupancy in Lawtell
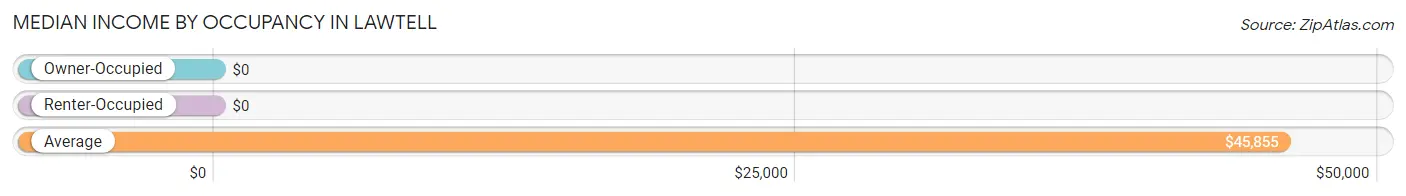
| Occupancy Type | # Households | Median Income |
| Owner-Occupied | 433 (86.6%) | $0 |
| Renter-Occupied | 67 (13.4%) | $0 |
| Average | 500 (100.0%) | $45,855 |
Occupancy by Householder Income Bracket in Lawtell
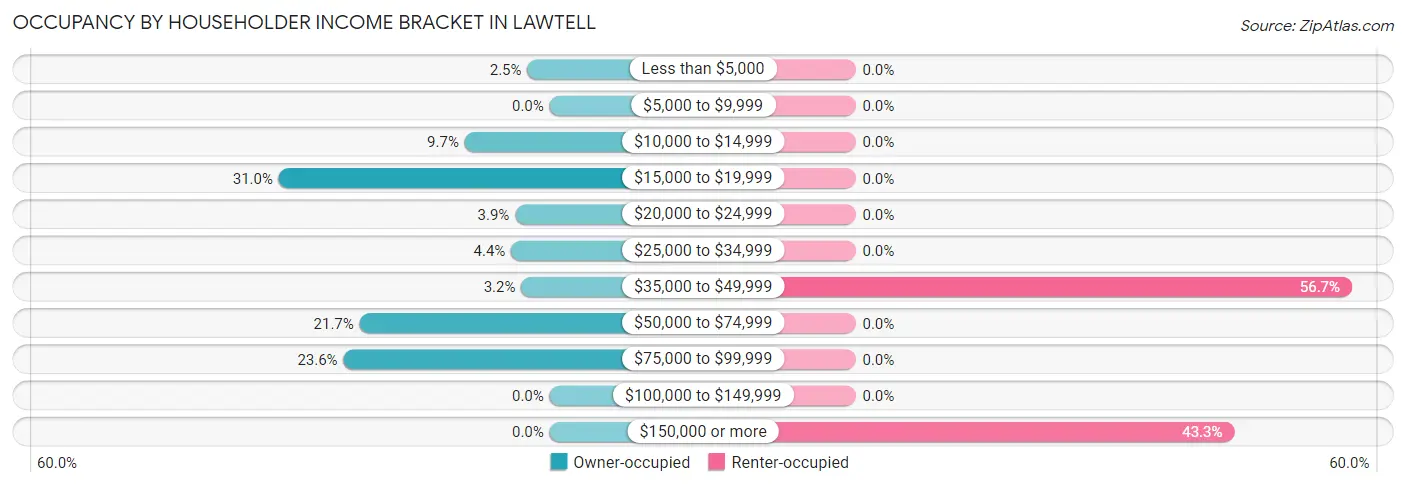
| Income Bracket | Owner-occupied | Renter-occupied |
| Less than $5,000 | 11 (2.5%) | 0 (0.0%) |
| $5,000 to $9,999 | 0 (0.0%) | 0 (0.0%) |
| $10,000 to $14,999 | 42 (9.7%) | 0 (0.0%) |
| $15,000 to $19,999 | 134 (30.9%) | 0 (0.0%) |
| $20,000 to $24,999 | 17 (3.9%) | 0 (0.0%) |
| $25,000 to $34,999 | 19 (4.4%) | 0 (0.0%) |
| $35,000 to $49,999 | 14 (3.2%) | 38 (56.7%) |
| $50,000 to $74,999 | 94 (21.7%) | 0 (0.0%) |
| $75,000 to $99,999 | 102 (23.6%) | 0 (0.0%) |
| $100,000 to $149,999 | 0 (0.0%) | 0 (0.0%) |
| $150,000 or more | 0 (0.0%) | 29 (43.3%) |
| Total | 433 (100.0%) | 67 (100.0%) |
Monthly Housing Cost Tiers in Lawtell
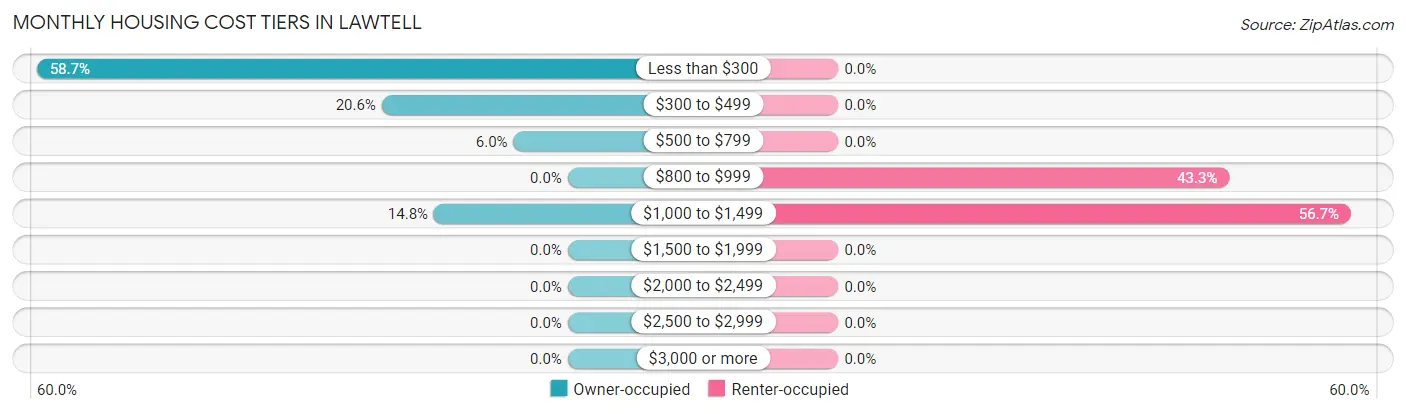
| Monthly Cost | Owner-occupied | Renter-occupied |
| Less than $300 | 254 (58.7%) | 0 (0.0%) |
| $300 to $499 | 89 (20.5%) | 0 (0.0%) |
| $500 to $799 | 26 (6.0%) | 0 (0.0%) |
| $800 to $999 | 0 (0.0%) | 29 (43.3%) |
| $1,000 to $1,499 | 64 (14.8%) | 38 (56.7%) |
| $1,500 to $1,999 | 0 (0.0%) | 0 (0.0%) |
| $2,000 to $2,499 | 0 (0.0%) | 0 (0.0%) |
| $2,500 to $2,999 | 0 (0.0%) | 0 (0.0%) |
| $3,000 or more | 0 (0.0%) | 0 (0.0%) |
| Total | 433 (100.0%) | 67 (100.0%) |
Physical Housing Characteristics in Lawtell
Housing Structures in Lawtell
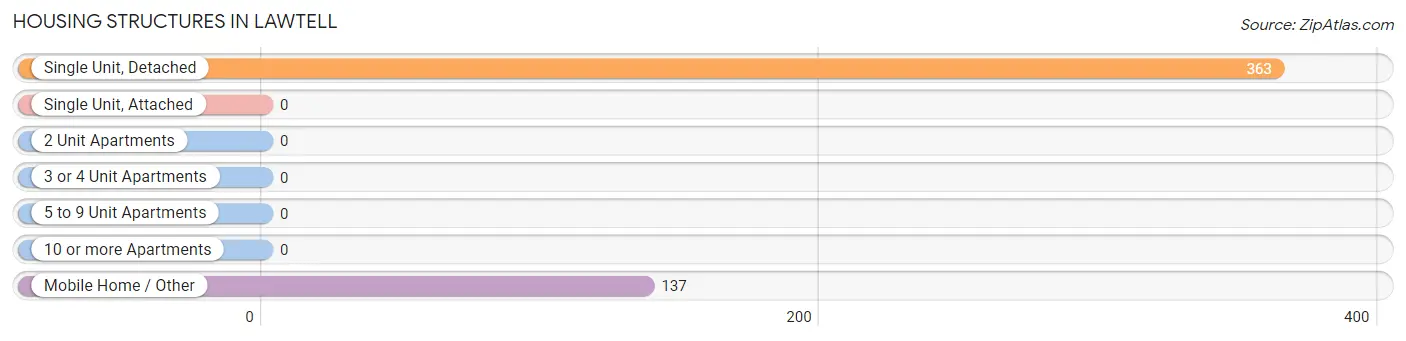
| Structure Type | # Housing Units | % Housing Units |
| Single Unit, Detached | 363 | 72.6% |
| Single Unit, Attached | 0 | 0.0% |
| 2 Unit Apartments | 0 | 0.0% |
| 3 or 4 Unit Apartments | 0 | 0.0% |
| 5 to 9 Unit Apartments | 0 | 0.0% |
| 10 or more Apartments | 0 | 0.0% |
| Mobile Home / Other | 137 | 27.4% |
| Total | 500 | 100.0% |
Housing Structures by Occupancy in Lawtell
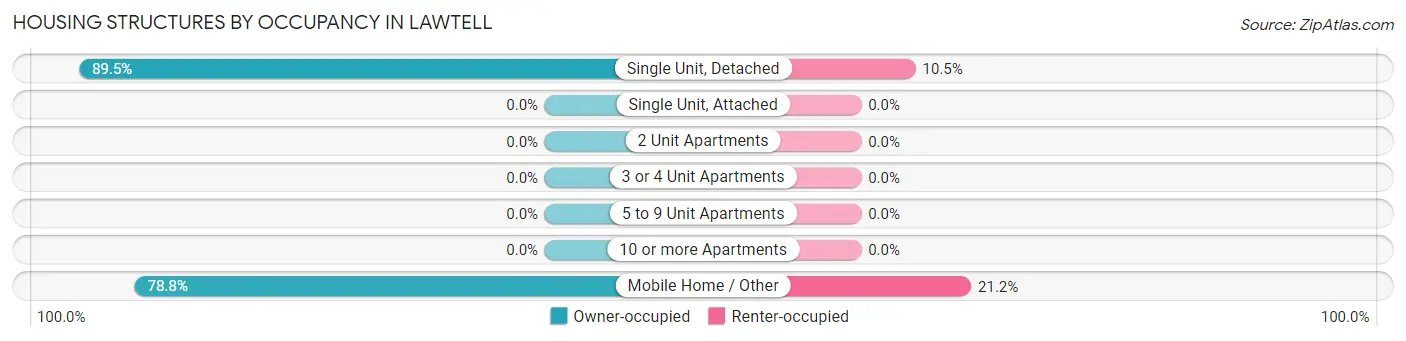
| Structure Type | Owner-occupied | Renter-occupied |
| Single Unit, Detached | 325 (89.5%) | 38 (10.5%) |
| Single Unit, Attached | 0 (0.0%) | 0 (0.0%) |
| 2 Unit Apartments | 0 (0.0%) | 0 (0.0%) |
| 3 or 4 Unit Apartments | 0 (0.0%) | 0 (0.0%) |
| 5 to 9 Unit Apartments | 0 (0.0%) | 0 (0.0%) |
| 10 or more Apartments | 0 (0.0%) | 0 (0.0%) |
| Mobile Home / Other | 108 (78.8%) | 29 (21.2%) |
| Total | 433 (86.6%) | 67 (13.4%) |
Housing Structures by Number of Rooms in Lawtell
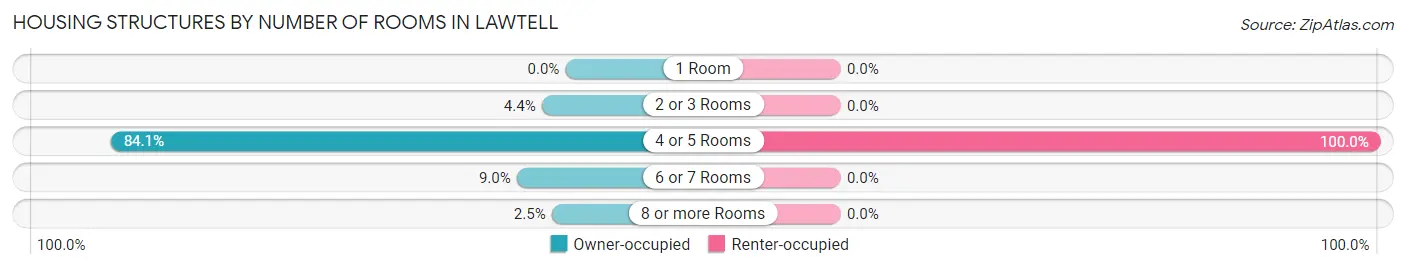
| Number of Rooms | Owner-occupied | Renter-occupied |
| 1 Room | 0 (0.0%) | 0 (0.0%) |
| 2 or 3 Rooms | 19 (4.4%) | 0 (0.0%) |
| 4 or 5 Rooms | 364 (84.1%) | 67 (100.0%) |
| 6 or 7 Rooms | 39 (9.0%) | 0 (0.0%) |
| 8 or more Rooms | 11 (2.5%) | 0 (0.0%) |
| Total | 433 (100.0%) | 67 (100.0%) |
Housing Structure by Heating Type in Lawtell
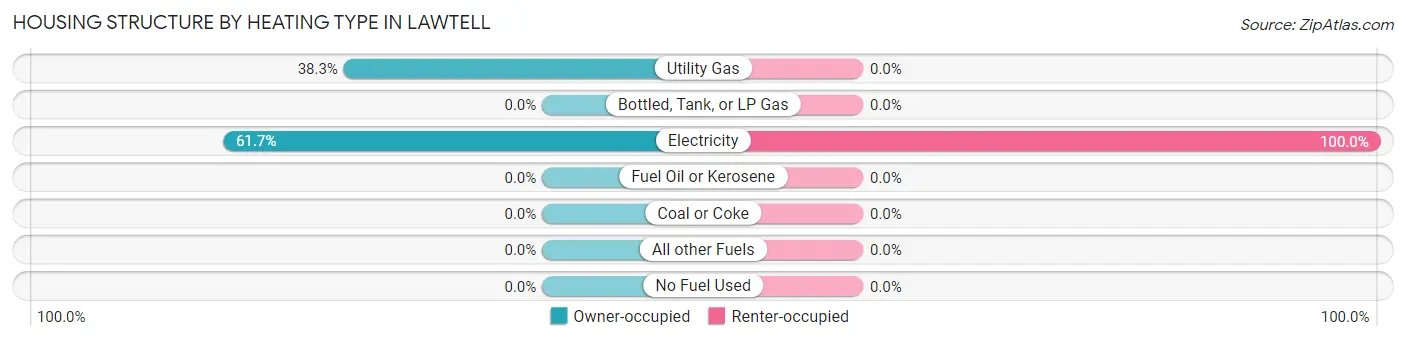
| Heating Type | Owner-occupied | Renter-occupied |
| Utility Gas | 166 (38.3%) | 0 (0.0%) |
| Bottled, Tank, or LP Gas | 0 (0.0%) | 0 (0.0%) |
| Electricity | 267 (61.7%) | 67 (100.0%) |
| Fuel Oil or Kerosene | 0 (0.0%) | 0 (0.0%) |
| Coal or Coke | 0 (0.0%) | 0 (0.0%) |
| All other Fuels | 0 (0.0%) | 0 (0.0%) |
| No Fuel Used | 0 (0.0%) | 0 (0.0%) |
| Total | 433 (100.0%) | 67 (100.0%) |
Household Vehicle Usage in Lawtell
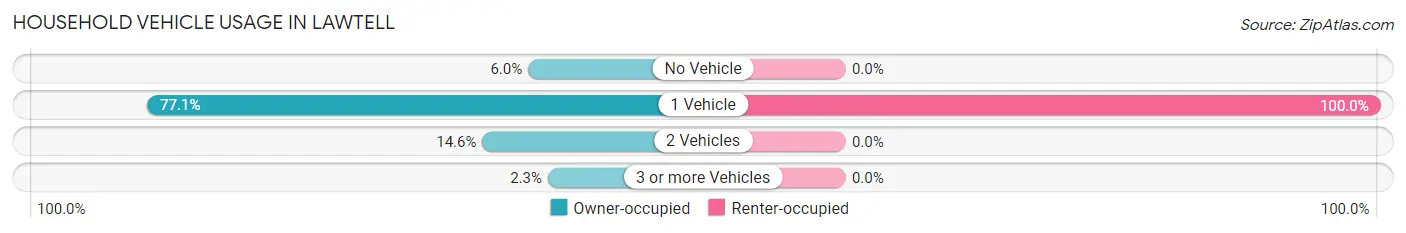
| Vehicles per Household | Owner-occupied | Renter-occupied |
| No Vehicle | 26 (6.0%) | 0 (0.0%) |
| 1 Vehicle | 334 (77.1%) | 67 (100.0%) |
| 2 Vehicles | 63 (14.5%) | 0 (0.0%) |
| 3 or more Vehicles | 10 (2.3%) | 0 (0.0%) |
| Total | 433 (100.0%) | 67 (100.0%) |
Real Estate & Mortgages in Lawtell
Real Estate and Mortgage Overview in Lawtell
| Characteristic | Without Mortgage | With Mortgage |
| Housing Units | 369 | 64 |
| Median Property Value | $23,200 | $0 |
| Median Household Income | - | - |
| Monthly Housing Costs | $188 | $0 |
| Real Estate Taxes | $199 | $64 |
Property Value by Mortgage Status in Lawtell
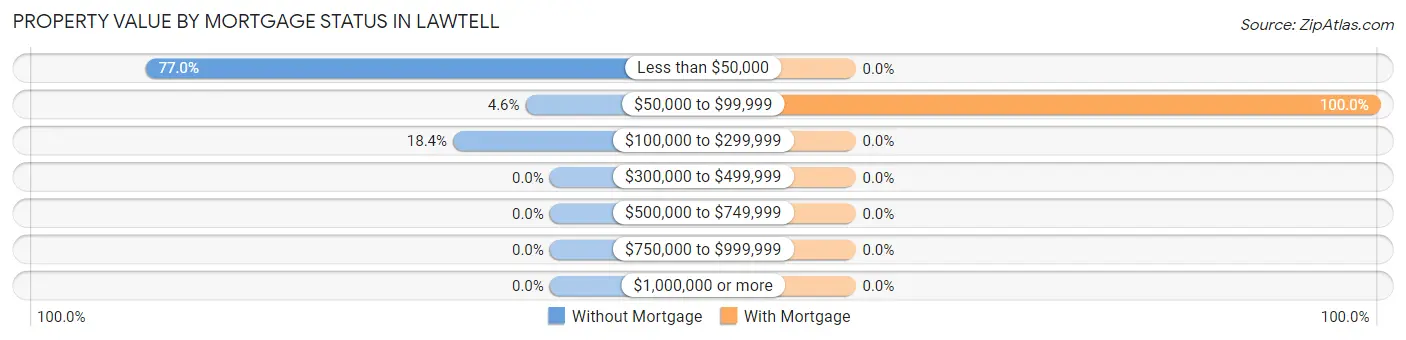
| Property Value | Without Mortgage | With Mortgage |
| Less than $50,000 | 284 (77.0%) | 0 (0.0%) |
| $50,000 to $99,999 | 17 (4.6%) | 64 (100.0%) |
| $100,000 to $299,999 | 68 (18.4%) | 0 (0.0%) |
| $300,000 to $499,999 | 0 (0.0%) | 0 (0.0%) |
| $500,000 to $749,999 | 0 (0.0%) | 0 (0.0%) |
| $750,000 to $999,999 | 0 (0.0%) | 0 (0.0%) |
| $1,000,000 or more | 0 (0.0%) | 0 (0.0%) |
| Total | 369 (100.0%) | 64 (100.0%) |
Household Income by Mortgage Status in Lawtell
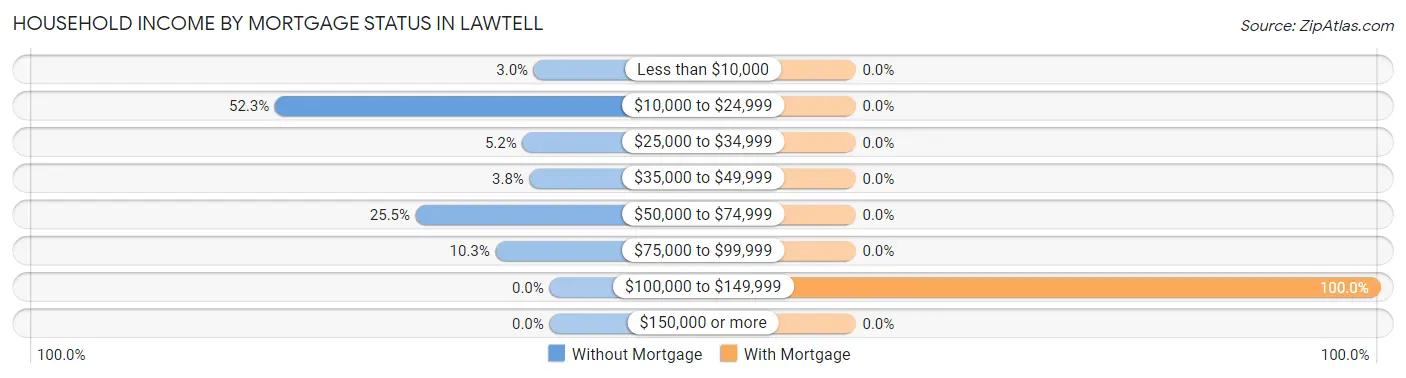
| Household Income | Without Mortgage | With Mortgage |
| Less than $10,000 | 11 (3.0%) | 0 (0.0%) |
| $10,000 to $24,999 | 193 (52.3%) | 0 (0.0%) |
| $25,000 to $34,999 | 19 (5.1%) | 0 (0.0%) |
| $35,000 to $49,999 | 14 (3.8%) | 0 (0.0%) |
| $50,000 to $74,999 | 94 (25.5%) | 0 (0.0%) |
| $75,000 to $99,999 | 38 (10.3%) | 0 (0.0%) |
| $100,000 to $149,999 | 0 (0.0%) | 64 (100.0%) |
| $150,000 or more | 0 (0.0%) | 0 (0.0%) |
| Total | 369 (100.0%) | 64 (100.0%) |
Property Value to Household Income Ratio in Lawtell
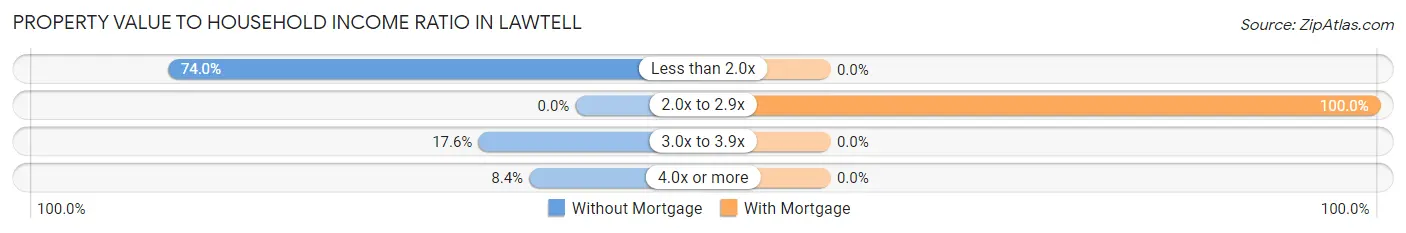
| Value-to-Income Ratio | Without Mortgage | With Mortgage |
| Less than 2.0x | 273 (74.0%) | 0 (0.0%) |
| 2.0x to 2.9x | 0 (0.0%) | 64 (100.0%) |
| 3.0x to 3.9x | 65 (17.6%) | 0 (0.0%) |
| 4.0x or more | 31 (8.4%) | 0 (0.0%) |
| Total | 369 (100.0%) | 64 (100.0%) |
Real Estate Taxes by Mortgage Status in Lawtell
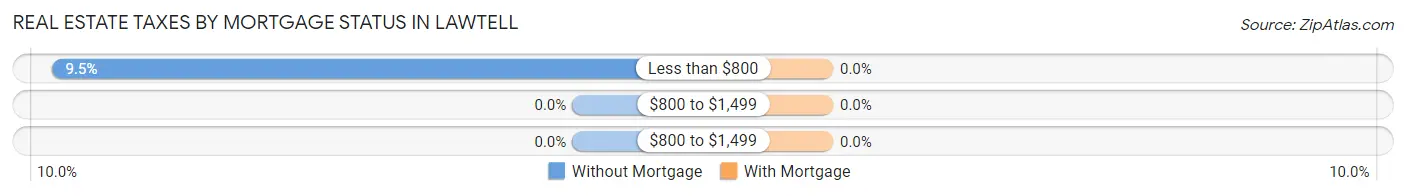
| Property Taxes | Without Mortgage | With Mortgage |
| Less than $800 | 35 (9.5%) | 0 (0.0%) |
| $800 to $1,499 | 0 (0.0%) | 0 (0.0%) |
| $800 to $1,499 | 0 (0.0%) | 0 (0.0%) |
| Total | 369 (100.0%) | 64 (100.0%) |
Health & Disability in Lawtell
Health Insurance Coverage by Age in Lawtell
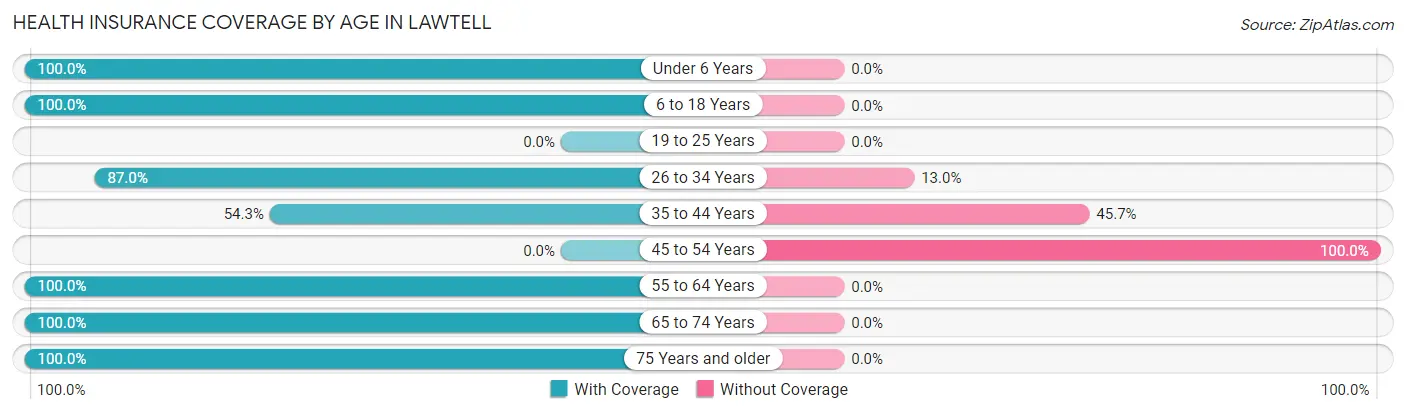
| Age Bracket | With Coverage | Without Coverage |
| Under 6 Years | 35 (100.0%) | 0 (0.0%) |
| 6 to 18 Years | 77 (100.0%) | 0 (0.0%) |
| 19 to 25 Years | 0 (0.0%) | 0 (0.0%) |
| 26 to 34 Years | 180 (87.0%) | 27 (13.0%) |
| 35 to 44 Years | 38 (54.3%) | 32 (45.7%) |
| 45 to 54 Years | 0 (0.0%) | 17 (100.0%) |
| 55 to 64 Years | 183 (100.0%) | 0 (0.0%) |
| 65 to 74 Years | 274 (100.0%) | 0 (0.0%) |
| 75 Years and older | 134 (100.0%) | 0 (0.0%) |
| Total | 921 (92.4%) | 76 (7.6%) |
Health Insurance Coverage by Citizenship Status in Lawtell
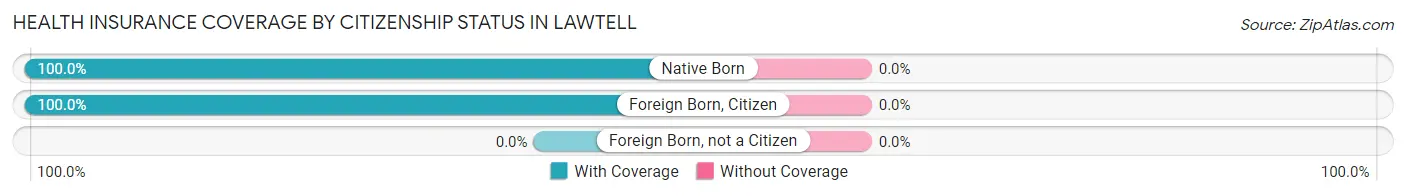
| Citizenship Status | With Coverage | Without Coverage |
| Native Born | 35 (100.0%) | 0 (0.0%) |
| Foreign Born, Citizen | 77 (100.0%) | 0 (0.0%) |
| Foreign Born, not a Citizen | 0 (0.0%) | 0 (0.0%) |
Health Insurance Coverage by Household Income in Lawtell
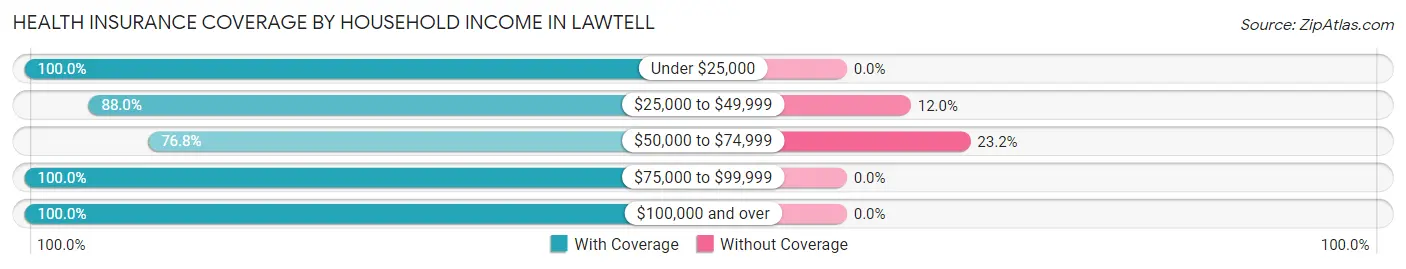
| Household Income | With Coverage | Without Coverage |
| Under $25,000 | 204 (100.0%) | 0 (0.0%) |
| $25,000 to $49,999 | 235 (88.0%) | 32 (12.0%) |
| $50,000 to $74,999 | 146 (76.8%) | 44 (23.2%) |
| $75,000 to $99,999 | 156 (100.0%) | 0 (0.0%) |
| $100,000 and over | 180 (100.0%) | 0 (0.0%) |
Public vs Private Health Insurance Coverage by Age in Lawtell
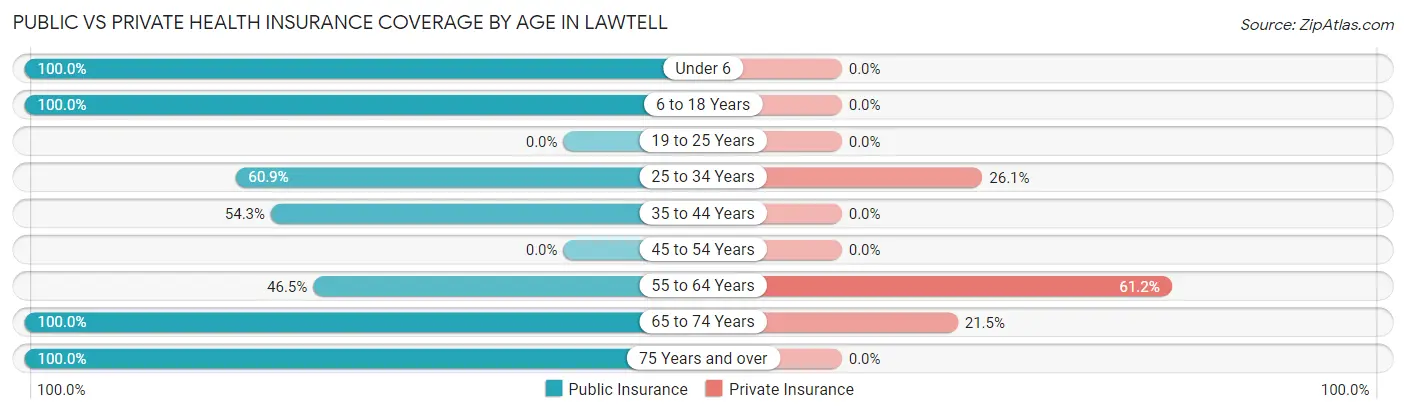
| Age Bracket | Public Insurance | Private Insurance |
| Under 6 | 35 (100.0%) | 0 (0.0%) |
| 6 to 18 Years | 77 (100.0%) | 0 (0.0%) |
| 19 to 25 Years | 0 (0.0%) | 0 (0.0%) |
| 25 to 34 Years | 126 (60.9%) | 54 (26.1%) |
| 35 to 44 Years | 38 (54.3%) | 0 (0.0%) |
| 45 to 54 Years | 0 (0.0%) | 0 (0.0%) |
| 55 to 64 Years | 85 (46.5%) | 112 (61.2%) |
| 65 to 74 Years | 274 (100.0%) | 59 (21.5%) |
| 75 Years and over | 134 (100.0%) | 0 (0.0%) |
| Total | 769 (77.1%) | 225 (22.6%) |
Disability Status by Sex by Age in Lawtell
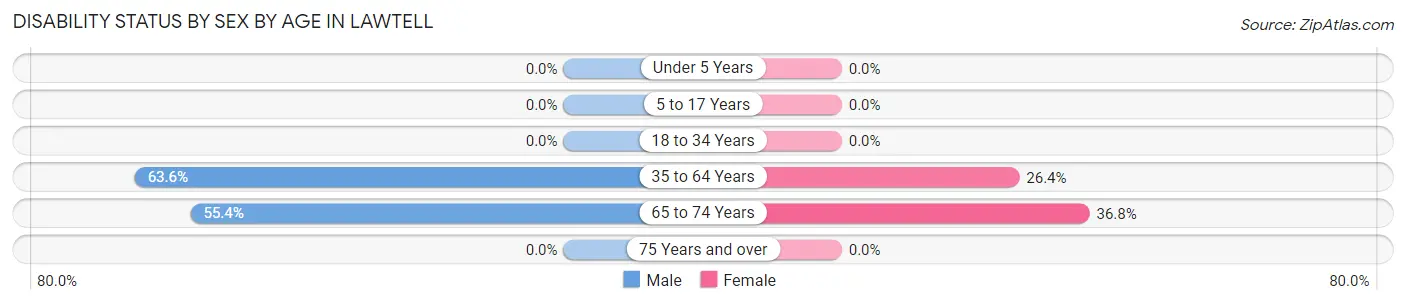
| Age Bracket | Male | Female |
| Under 5 Years | 0 (0.0%) | 0 (0.0%) |
| 5 to 17 Years | 0 (0.0%) | 0 (0.0%) |
| 18 to 34 Years | 0 (0.0%) | 0 (0.0%) |
| 35 to 64 Years | 56 (63.6%) | 48 (26.4%) |
| 65 to 74 Years | 93 (55.4%) | 39 (36.8%) |
| 75 Years and over | 0 (0.0%) | 0 (0.0%) |
Disability Class by Sex by Age in Lawtell
Disability Class: Hearing Difficulty
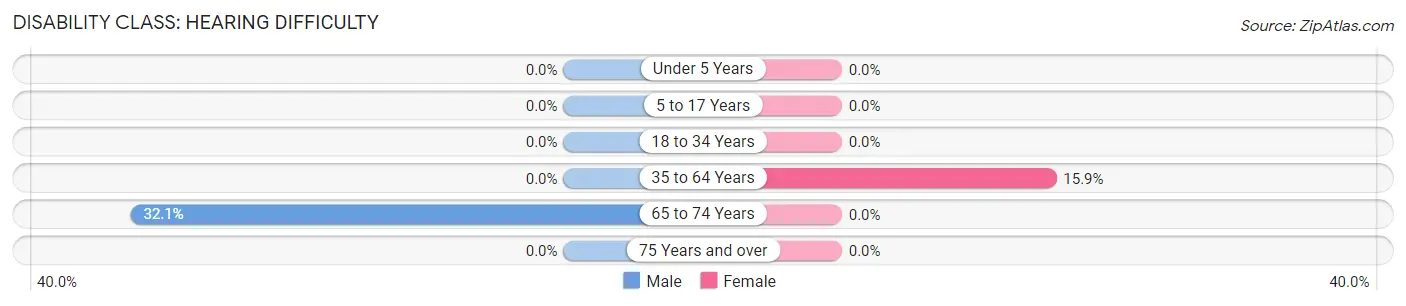
| Age Bracket | Male | Female |
| Under 5 Years | 0 (0.0%) | 0 (0.0%) |
| 5 to 17 Years | 0 (0.0%) | 0 (0.0%) |
| 18 to 34 Years | 0 (0.0%) | 0 (0.0%) |
| 35 to 64 Years | 0 (0.0%) | 29 (15.9%) |
| 65 to 74 Years | 54 (32.1%) | 0 (0.0%) |
| 75 Years and over | 0 (0.0%) | 0 (0.0%) |
Disability Class: Vision Difficulty
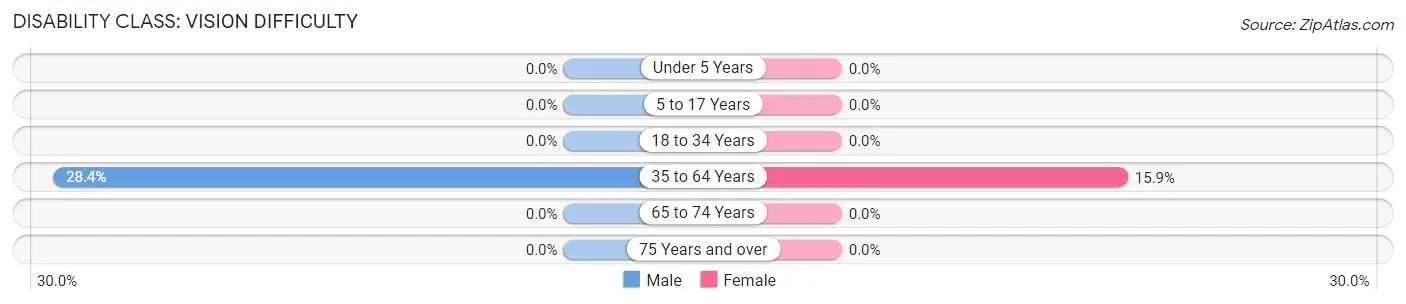
| Age Bracket | Male | Female |
| Under 5 Years | 0 (0.0%) | 0 (0.0%) |
| 5 to 17 Years | 0 (0.0%) | 0 (0.0%) |
| 18 to 34 Years | 0 (0.0%) | 0 (0.0%) |
| 35 to 64 Years | 25 (28.4%) | 29 (15.9%) |
| 65 to 74 Years | 0 (0.0%) | 0 (0.0%) |
| 75 Years and over | 0 (0.0%) | 0 (0.0%) |
Disability Class: Cognitive Difficulty
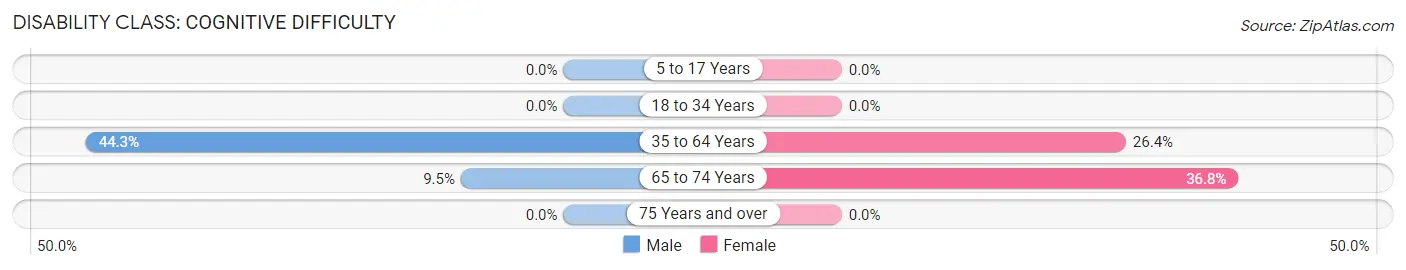
| Age Bracket | Male | Female |
| 5 to 17 Years | 0 (0.0%) | 0 (0.0%) |
| 18 to 34 Years | 0 (0.0%) | 0 (0.0%) |
| 35 to 64 Years | 39 (44.3%) | 48 (26.4%) |
| 65 to 74 Years | 16 (9.5%) | 39 (36.8%) |
| 75 Years and over | 0 (0.0%) | 0 (0.0%) |
Disability Class: Ambulatory Difficulty
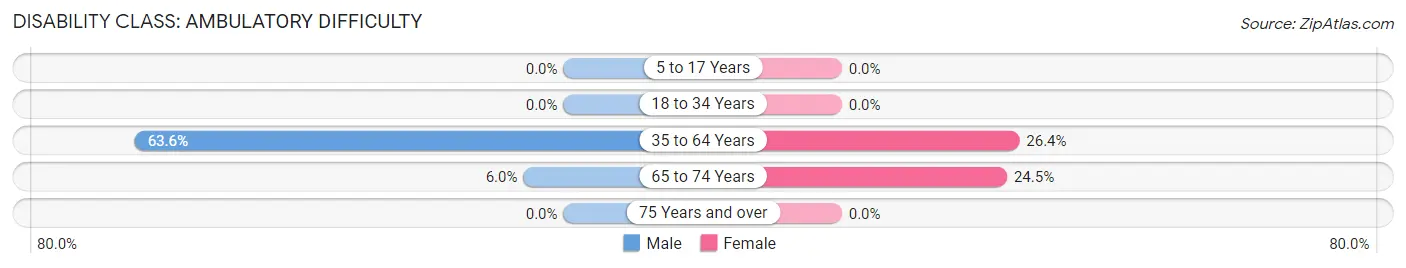
| Age Bracket | Male | Female |
| 5 to 17 Years | 0 (0.0%) | 0 (0.0%) |
| 18 to 34 Years | 0 (0.0%) | 0 (0.0%) |
| 35 to 64 Years | 56 (63.6%) | 48 (26.4%) |
| 65 to 74 Years | 10 (5.9%) | 26 (24.5%) |
| 75 Years and over | 0 (0.0%) | 0 (0.0%) |
Disability Class: Self-Care Difficulty
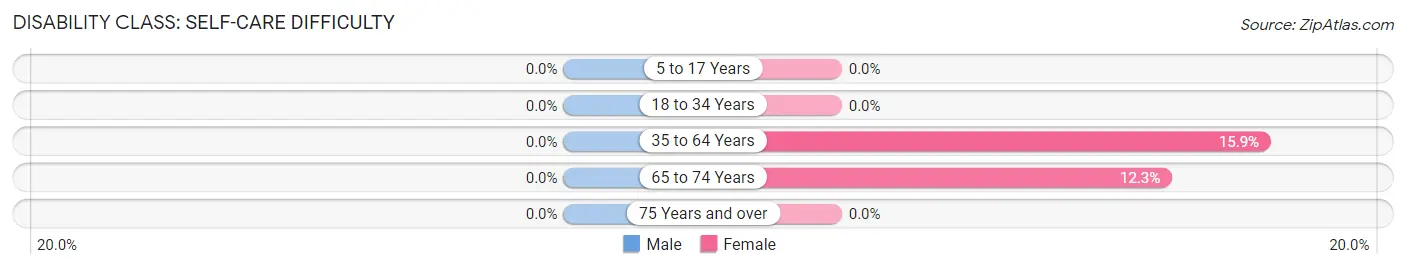
| Age Bracket | Male | Female |
| 5 to 17 Years | 0 (0.0%) | 0 (0.0%) |
| 18 to 34 Years | 0 (0.0%) | 0 (0.0%) |
| 35 to 64 Years | 0 (0.0%) | 29 (15.9%) |
| 65 to 74 Years | 0 (0.0%) | 13 (12.3%) |
| 75 Years and over | 0 (0.0%) | 0 (0.0%) |
Technology Access in Lawtell
Computing Device Access in Lawtell
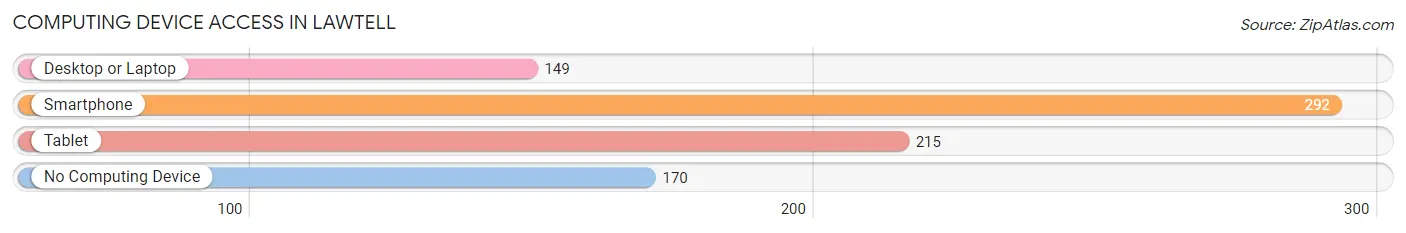
| Device Type | # Households | % Households |
| Desktop or Laptop | 149 | 29.8% |
| Smartphone | 292 | 58.4% |
| Tablet | 215 | 43.0% |
| No Computing Device | 170 | 34.0% |
| Total | 500 | 100.0% |
Internet Access in Lawtell
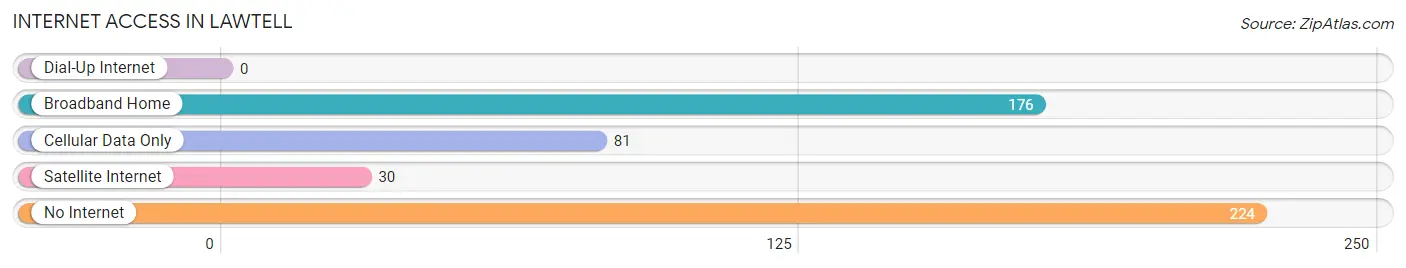
| Internet Type | # Households | % Households |
| Dial-Up Internet | 0 | 0.0% |
| Broadband Home | 176 | 35.2% |
| Cellular Data Only | 81 | 16.2% |
| Satellite Internet | 30 | 6.0% |
| No Internet | 224 | 44.8% |
| Total | 500 | 100.0% |
Lawtell Summary
History
The small town of Lawtell, Louisiana is located in the heart of St. Landry Parish. It is a rural community with a population of just over 1,000 people. The town was founded in the late 1800s by a group of French-speaking settlers who were looking for a place to call home. The town was named after a local Native American chief, Chief Lawtell.
The town was originally a farming community, with cotton and sugar cane being the main crops. The town also had a few small businesses, such as a general store, a blacksmith, and a sawmill.
In the early 1900s, the town began to grow and develop. The railroad came to town, bringing with it new opportunities for growth. The town also had a post office, a bank, and a few other businesses.
In the mid-1900s, the town began to decline. The railroad stopped running and the businesses began to close. The population began to dwindle and the town became a quiet, rural community.
In the late 1900s, the town began to experience a resurgence. The population began to grow again and new businesses began to open. The town also began to attract new residents, many of whom were looking for a quiet, rural lifestyle.
Today, Lawtell is a small, rural community with a population of just over 1,000 people. The town is still primarily a farming community, with cotton and sugar cane being the main crops. The town also has a few small businesses, such as a general store, a blacksmith, and a sawmill.
Geography
Lawtell is located in the heart of St. Landry Parish, in the southwestern part of Louisiana. The town is situated on the banks of the Bayou Teche, which is a tributary of the Atchafalaya River. The town is surrounded by rolling hills and lush green fields.
The climate in Lawtell is humid subtropical, with hot, humid summers and mild winters. The average temperature in the summer is around 90 degrees Fahrenheit, and the average temperature in the winter is around 50 degrees Fahrenheit.
Economy
The economy of Lawtell is primarily based on agriculture. The town is home to several large farms, which produce cotton, sugar cane, and other crops. The town also has a few small businesses, such as a general store, a blacksmith, and a sawmill.
The town also has a few manufacturing businesses, such as a furniture factory and a woodworking shop. The town also has a few restaurants and bars, as well as a few small shops.
Demographics
As of the 2010 census, the population of Lawtell was 1,072. The racial makeup of the town was 79.3% White, 17.7% African American, 0.3% Native American, 0.2% Asian, 0.1% Pacific Islander, and 2.4% from other races. The median household income was $30,938, and the median family income was $37,500.
The town is home to a large number of French-speaking residents, as well as a few Spanish-speaking residents. The town also has a few churches, including a Catholic church and a Baptist church.
Conclusion
Lawtell, Louisiana is a small, rural town located in the heart of St. Landry Parish. The town has a population of just over 1,000 people and is primarily a farming community. The town also has a few small businesses, such as a general store, a blacksmith, and a sawmill. The town is home to a large number of French-speaking residents, as well as a few Spanish-speaking residents. The town also has a few churches, including a Catholic church and a Baptist church. The town has experienced a resurgence in recent years, with new businesses opening and the population growing.
Common Questions
What is Per Capita Income in Lawtell?
Per Capita income in Lawtell is $31,607.
What is the Median Family Income in Lawtell?
Median Family Income in Lawtell is $59,135.
What is the Median Household income in Lawtell?
Median Household Income in Lawtell is $45,855.
What is Income or Wage Gap in Lawtell?
Income or Wage Gap in Lawtell is 29.3%.
Women in Lawtell earn 70.7 cents for every dollar earned by a man.
What is Inequality or Gini Index in Lawtell?
Inequality or Gini Index in Lawtell is 0.40.
What is the Total Population of Lawtell?
Total Population of Lawtell is 997.
What is the Total Male Population of Lawtell?
Total Male Population of Lawtell is 628.
What is the Total Female Population of Lawtell?
Total Female Population of Lawtell is 369.
What is the Ratio of Males per 100 Females in Lawtell?
There are 170.19 Males per 100 Females in Lawtell.
What is the Ratio of Females per 100 Males in Lawtell?
There are 58.76 Females per 100 Males in Lawtell.
What is the Median Population Age in Lawtell?
Median Population Age in Lawtell is 56.5 Years.
What is the Average Family Size in Lawtell
Average Family Size in Lawtell is 2.9 People.
What is the Average Household Size in Lawtell
Average Household Size in Lawtell is 2.0 People.
How Large is the Labor Force in Lawtell?
There are 390 People in the Labor Forcein in Lawtell.
What is the Percentage of People in the Labor Force in Lawtell?
44.1% of People are in the Labor Force in Lawtell.
What is the Unemployment Rate in Lawtell?
Unemployment Rate in Lawtell is 12.6%.